1. Introduction
The rapid development of autonomous driving has put forward higher requirements for safety verification and trustworthiness evaluation. The overall trustworthiness evaluation of the autonomous vehicle as a whole system aims to measure the trustworthiness of the autonomous vehicle according to its behavior in task execution. How to test and verify an autonomous driving system involving complex interaction edge scenarios more quickly and ensure the safe operation of the autonomous driving system in complex and changeable environments are still important challenges.
Traditional real vehicle testing is costly and time-consuming and has difficulty covering edge scenarios, and it is difficult to meet the trustworthiness testing needs of high-level autonomous driving systems [
1]. A study by the RAND Corporation [
2] based on accident fatality rates shows that traditional mileage-based testing methods can no longer meet the functional and safety testing needs of existing autonomous driving systems. Existing scene generation methods are mostly based on the direct expansion of Naturalistic Driving Data (NDD) or accident data [
3,
4,
5,
6,
7]; although the authenticity of the scene can be guaranteed, there are still shortcomings in the modeling of complex dynamic interaction behaviors and the efficient coverage of dangerous edge scenes. The high coupling degree of interaction parameters and the single risk judgment index lead to the limitation of scene generation efficiency and test coverage. Although the adversarial generation method based on reinforcement learning can improve the challenge of the scene, it faces the dual dilemma of high simulation complexity and low generation efficiency of the interaction process [
6,
7,
8].
The current research generally faces two technical bottlenecks. First, current models of dynamic interaction mechanisms are often rough, relying on preset rules or simplified kinematics, which fail to capture the continuity and diversity of real driving interactions [
9]. Second, there is a clear trade-off between generation efficiency and edge-case coverage—methods like Monte Carlo sampling or GANs lack targeted guidance toward collision-critical states [
10]. While some studies have explored flexible interaction adjustment and scene complexity analysis, they still struggle with rare events, parameter coupling, and dimensional explosion [
11,
12]. The scene hierarchy system defined by the ISO 34502 standard [
13] provides a scene layering framework, but there are still shortcomings in the expression of conflict logic timing and the reconstruction of risk probability.
In response to the problems above, this paper proposes an interactive scene generation method for autonomous driving based on interaction coding. Interaction coding aims to explicitly describe the behavioral logic and timing relationship between participants in a structured way, avoid the dependence of reinforcement learning on a large number of trial and error samples, and improve learning efficiency and safety by encoding prior interaction patterns; compared with GAN, it provides a clear risk critical state expression mechanism and enhances the controllability of edge scene generation. At the same time, it makes up for the blank of ISO 34502 in conflict logic and probability modeling and realizes more fine-grained scene semantic expression and risk reconstruction. This paper studies the following: (1) propose an interaction coding mechanism to decouple the space–time dependence of IOs, and construct a hierarchical parameter system of function–logic–specific scene; (2) introduce an improved TTC index, determine the critical state of interaction based on the time difference of arrival at interaction points, and realize risk reconstruction and marginality assessment; (3) and establish a standardized OpenSCENARIO scene description file generation process to support cross-platform dynamic testing. Finally, CARLA0.9.15 simulation verification shows that the method achieves a good balance between the rationality of the scene and the effectiveness of the test. It provides important methodological support for the key R&D project on which this study relies and promotes the construction of an efficient testing platform with national qualifications.
2. Related Work
Scenario-based testing of autonomous vehicles mainly includes two aspects: edge scenario generation and interactive scenario construction. Edge scenario generation methods mainly include two categories: data-driven generation methods and mechanism-based modeling generation methods. In addition, specific methods, such as critical state division, importance sampling, and adversarial testing, are also used to construct challenging test scenarios (
Table 1).
Existing studies have focused on natural environmental parameters to explore the impact on the perception and movement of autonomous driving systems. Chang et al. [
17] decomposed the test scenario into task elements and environmental elements, combined with combinatorial testing and optimization search algorithms, to generate parameterized test scenarios and conduct trustworthiness scoring. With the development of the trustworthiness evaluation system, effective interactive scenarios can better reveal the performance of autonomous driving systems in extreme and uncommon situations, which not only involves the complex relationship between vehicles and the environment but also covers the dynamic interaction between different traffic participants.
In terms of interactive modeling, Lawitzky et al. [
18] proposed an interactive scenario prediction framework, which improved the trustworthiness of vehicle motion prediction and traffic scenario safety assessment. The VistaScenario framework developed by Chang et al. [
19] effectively screens and extracts extreme interactive scenarios and boundary conditions. The research on the selection and evaluation of test scenario sets by Birkemeyer et al. [
20] shows that the sampling method based on interactive coverage can significantly reduce the test workload. In addition, TTC, MTTC, and other indicators are widely used as key bases for risk scenario identification [
21,
22], providing new directions and bases for the generation of edge scenarios. Ni Ying et al. [
23] also proposed to use the time to reach interaction points ΔT as an indicator to reflect the potential collision risk of vehicles when approaching interaction points. In terms of probabilistic scene generation, Wang et al. [
24] used a conditional diffusion model to achieve interactive and controllable traffic scene generation. Yan et al. [
25] proposed a closed-loop generation framework based on demand-based scene retrieval and importance sampling, which significantly improved the coverage of rare scenes.
In summary, scholars at home and abroad have achieved certain results in the field of automatic driving edge scene and interactive scene generation. However, there are still two shortcomings. The definition and entry angle of the edge scene are relatively limited, the uncertainty of the interaction position is high, and research on the edge scene based on probability and interaction mechanisms is insufficient; the focus is only on the edge scene with high difficulty, ignoring the connection with the low-difficulty scene, and as such the specific test cases of automatic driving trustworthiness evaluation are not comprehensive enough. Based on this, this paper proposes a scene generation strategy and edge scene determination method based on interaction coding. By decoupling the continuous process of interactive conflict, a coding-driven dynamic interaction model is constructed, the interactive state is divided from the key time period, and the extreme interactive scene is explored, so as to generate wider coverage and a representative automatic driving interactive scene.
3. Interaction Coding
3.1. Interaction Coding Definition
Interaction coding (IC) refers to an abstract rule system designed based on the physical laws of traffic flow and interaction logic. The core aim is to symbolically define the expected conflict types and their interaction constraints between the ego vehicle (EV) and the interaction object (IO) in the scene. Based on logical constraints, the system systematically injects expected interactions, focuses on the continuous interaction of the EV under coding, and efficiently evaluates the continuous decision making ability, safety, and robustness of ADS in complex interaction environments. The code’s design follows the following core rules:
Definition of interaction points: Clarify the relative positions and interaction sequence of the EV and IOs at interaction points (such as interaction points and intersection points);
Right-of-way judgment: Strictly define the judgment standard of “waiting” and “rushing” behaviors;
Interaction intensity: Determine the number of potential IOs at each interaction point.
The essence of interaction coding is the abstract constraint at the functional scenario level. Its advantage lies in the fact that it does not rely on the real data of specific trajectories and only needs to conform to the basic laws of traffic flow (such as the inevitability of path intersection between the EV and the oncoming straight vehicle in the unprotected left turn scenario) to derive and generate the scenario. This makes IC a scalable test case template, the validity of which stems from logical rationality, and it guides the generation of test scenarios as an abstract rule.
3.2. Interaction Coding Parameter Space Modeling
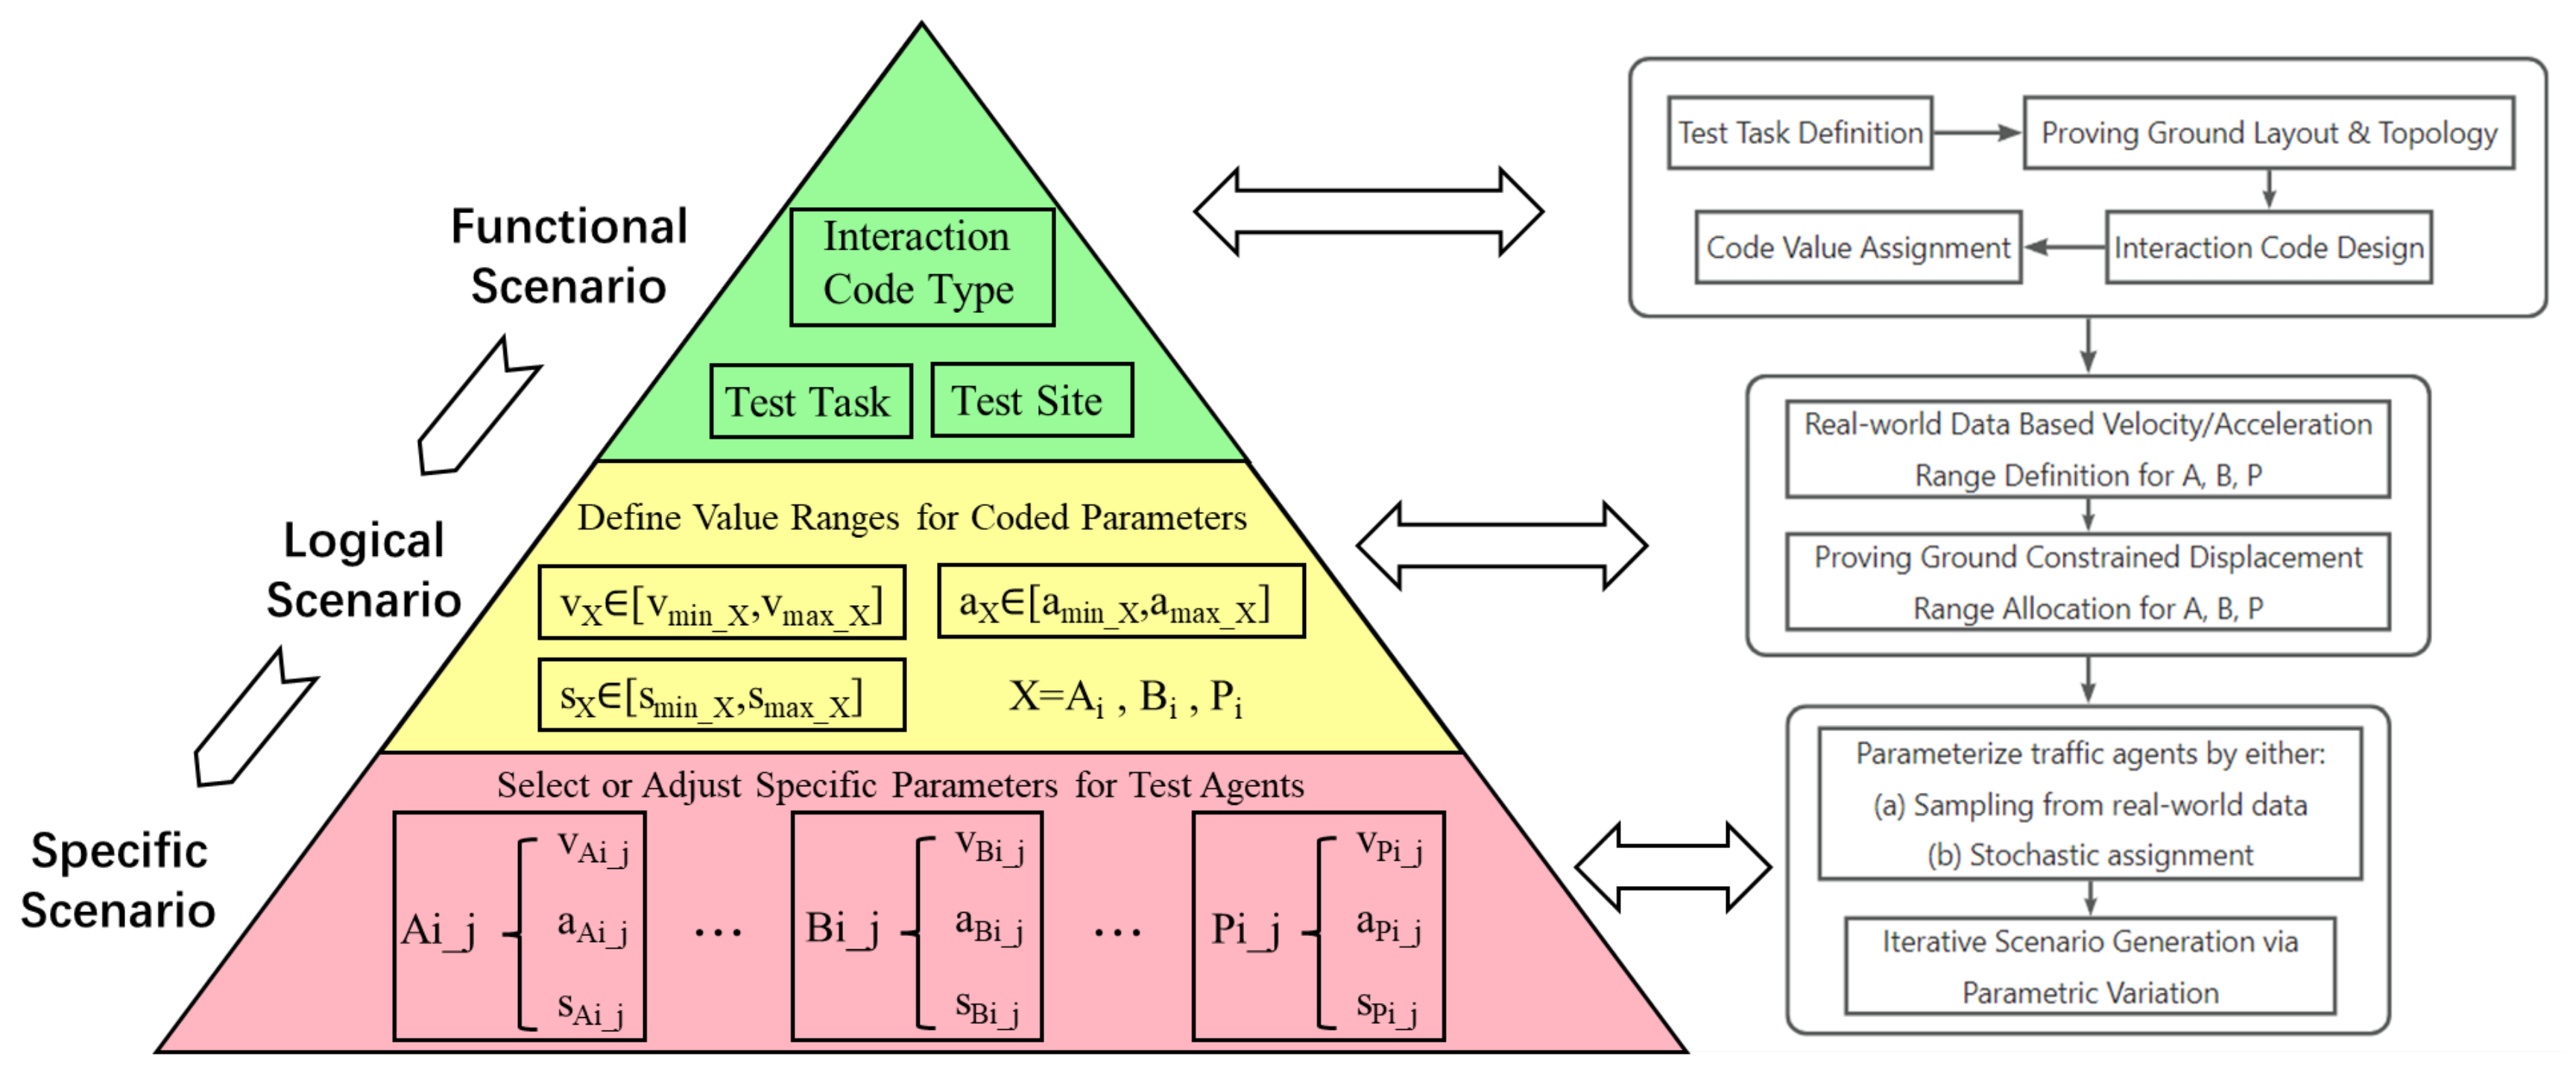
Combined with the abstraction level of the automatic driving test scenario, functional scenario → logical scenario → specific scenario [
26], the specific explanation of the abstraction level of the test scenario based on IC is shown in
Figure 1:
3.3. Functional Scenario Design Based on Unprotected Left Turn Interaction Coding
The left turn behavior of vehicles at intersections without a dedicated left turn phase is one of the most challenging driving tasks, so this paper selects the unprotected left turn scenario as a research case. Based on the proposed core rules, the unprotected left turn behavior of the standard two-way, four-lane cross intersection is designed (
Figure 2):
The driving trajectory and interaction points (interaction points) of the EV can be obtained based on the position mapping of the natural driving data statistics of this type of intersection. The trajectory and interaction points in the actual simulation test will be subject to certain random changes in the vehicle’s driving algorithm and interaction;
Definition of interaction points (the interaction points between the left-turning EV and the trajectory of the target straight-going objects in this example): According to the left turn trajectory, it is expected to interact with the opposite straight-through motor vehicle and pedestrians;
Right-of-way judgment: Follows the rule of “left-turn to straight-through”;
Conflict intensity: The number of conflicts for each code can be randomly generated using real data statistics or derivation.
Figure 2.
Typical urban road intersection unprotected left turn scene interaction coding structure. (Note: The four interaction points shown in the figure are A1 (straight-through vehicle on the inside), A2 (straight-through vehicle on the outside), B1 (straight-through non-motor vehicle), and P1 (straight-through pedestrian). In
Figure 2, the red one is EV, the blue ones are left-turning vehicles, the black ones are straight-going vehicles, and the green ones are right-turning vehicles).
4. Interaction Determination and Critical Analysis
This paper studies the overall trustworthiness test evaluation based on autonomous driving. The overall vehicle trustworthiness evaluation score can effectively determine the difficulty level and convergence degree of the scene and whether the scene fully explores the boundary capability of the vehicle. However, in the scenario setting based on interaction coding, relying solely on the trustworthiness score cannot determine whether the parameter configuration of the scenario has reached the expected interaction, nor can it clarify the direction of optimization and iteration of the scenario.
Therefore, the scene interaction determination and parameter optimization conditions based on TTC_diff (Time-to-Collision Difference) are proposed. TTC_diff refers to the difference between the time required for the EV and IOs to reach interaction points at the current moment, reflecting whether the EV intends to pass the interaction point before the IO and whether the EV can safely avoid the collision after giving up this intention and choosing to avoid it. The smaller the TTC_diff, the later the EV may give up the intention to pass in advance, the later the avoidance time, the more urgent the avoidance behavior, and the higher the marginality of the scene. If the EV passes the interaction point earlier than the IO, it is considered safe passage; if the TTC_diff between the EV and the IO when they arrive at interaction points is less than a certain threshold (the “fuzzy yield” state), the target boundary scenario is triggered. The calculation formula of TTC_diff is as follows:
: the time required for the EV to reach interaction points at the current moment;
: the time required for IOs to reach interaction points at the current moment;
: the remaining distance from the EV (IOs) to interaction points at the current moment;
: the speed of the EV (IOs) at the current moment.
4.1. Priori Experiment
Because the interaction time between the EV and each IO is different, it is difficult to judge the time of conflict with each IO based on the time series state of the EV. Therefore, the connection between the EV and each IO in the continuous interaction process is decoupled, the motion state of the EV and each IO in the key time segment (KTS) is analyzed, and the time when each IO reaches interaction points is selected as the end time of the KTS. Existing studies [
27] take 2~3 s before the evasive action takes effect in the traffic conflict of signal-controlled intersections as the key time period to calculate the conflict time and take 2.5 s before the evasive action takes effect.
However, it is not enough to take only 2.5 s before the IO reaches the interaction point as the KTS. If the EV interacts with the IO, the EV must be in the risk avoidance state when the IO reaches the interaction point. Therefore, 1 s is extended on this basis; that is, 1 s before the IO reaches the interaction point is taken as the evade activation moment (EAM) of the EV, and a total of 3.5 s is determined as the KTS. The US standard defines conflicts with TTC < 1 s at signalized intersections as serious conflicts [
28]. Therefore, the minimum absolute value TTC_diff < 1 s in the KTS is used as the basis for determining the convergence of the scene. At this time, the EV and the IO have a critical interaction.
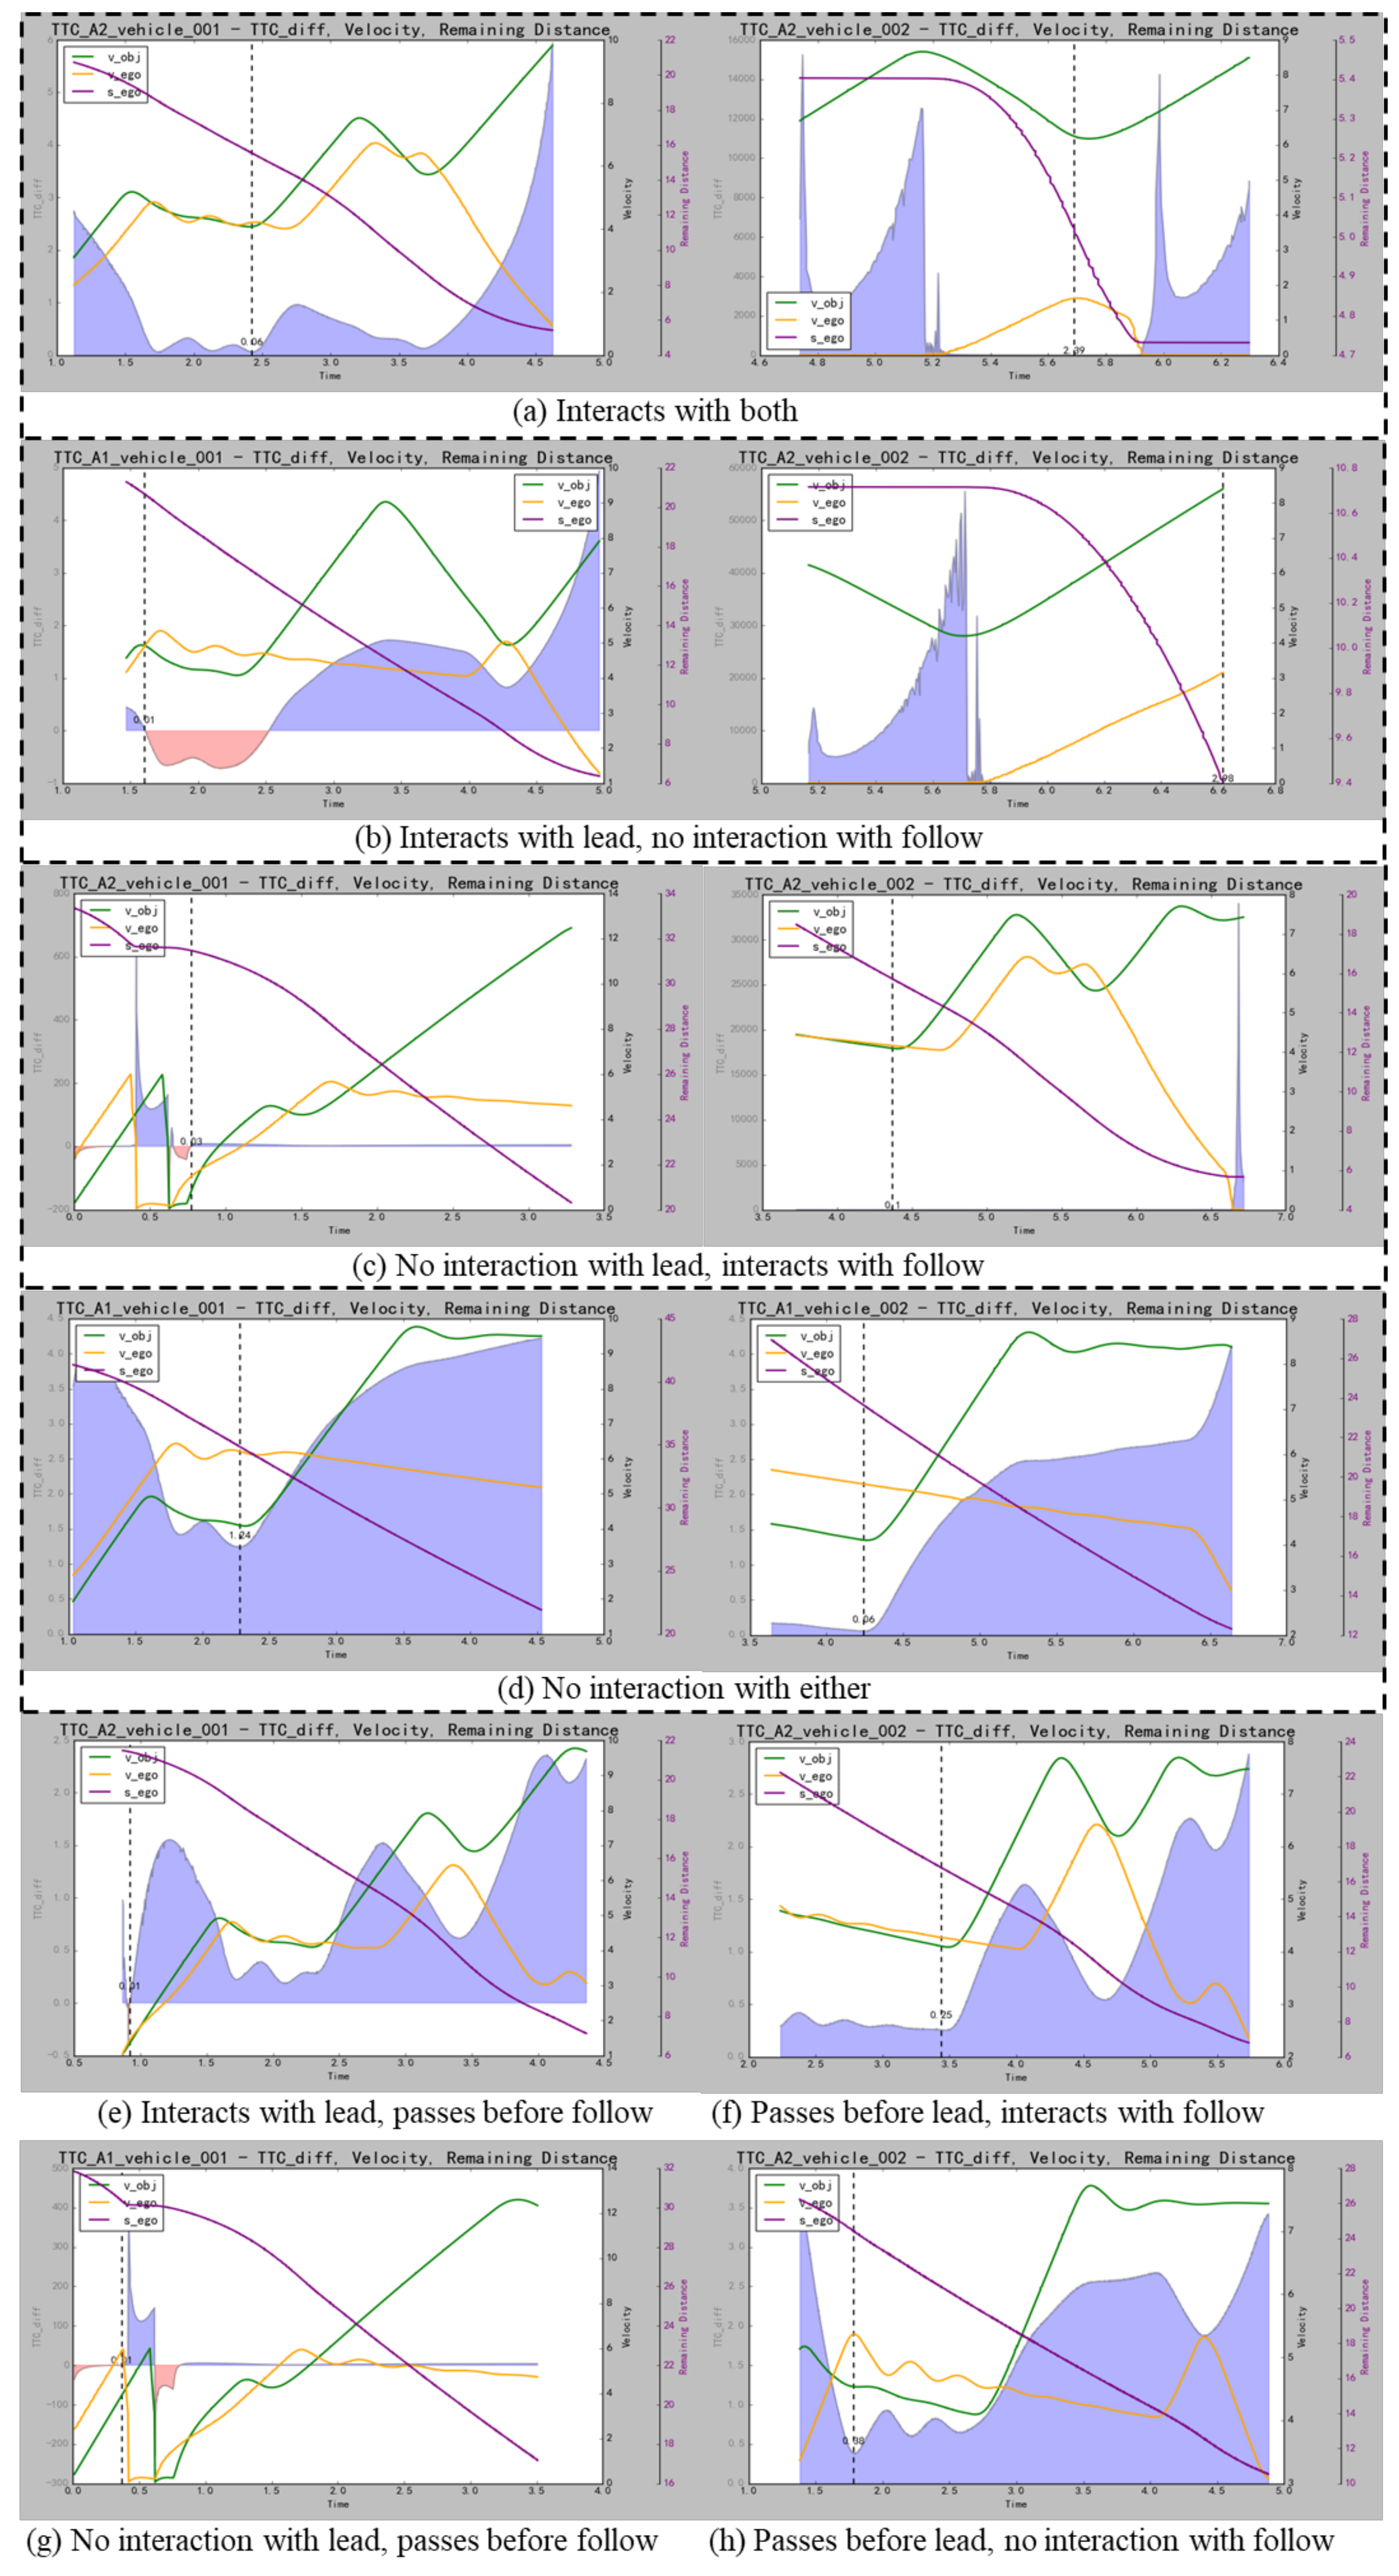
In this study on interaction coding, there are three interaction states between the EV and the IO: interaction (critical interaction is the boundary state of interaction); the IO passes too early (no interaction); and the EV passes earlier than the IO (no interaction). Based on the existence of simple double interaction, the following 9 interaction scenarios were intentionally set and tested through CARLA visual simulation. According to the running data, the change curves of TTC_diff (the blue shadow),
(the yellow line),
(the green line), and
(the purple line) in the key time period were drawn to explore the dynamic interaction law of the test scenarios (
Figure 3).
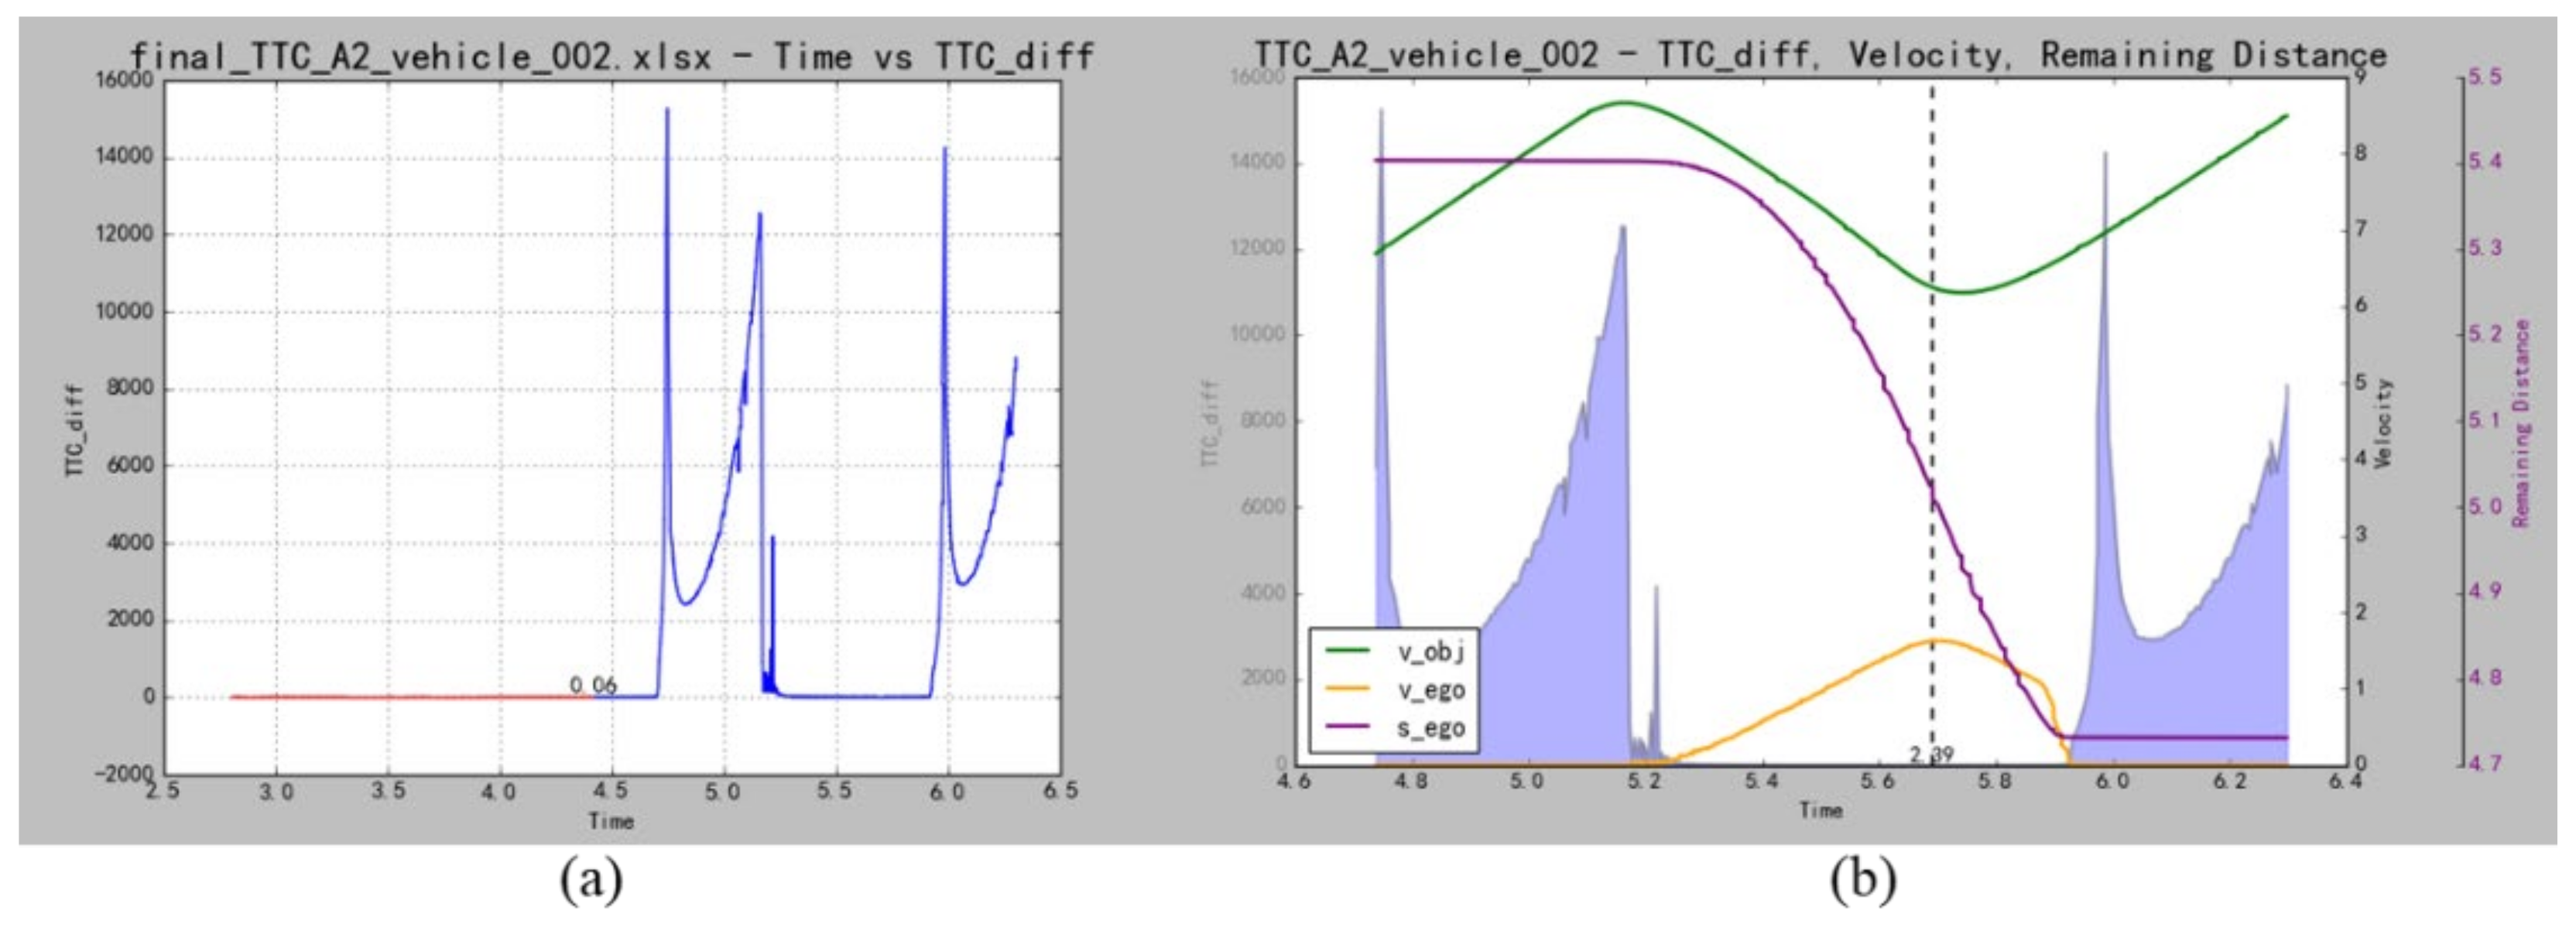
In the 3.5 s KTS of the subsequent interaction, there will still be key sections of the previous interaction. Therefore, the data before avoiding the previous object must be screened out to avoid the interaction data of the previous object affecting the interaction judgment of the subsequent object (as shown in
Figure 4a). The data between the two peaks are retained as the KTS of the current interaction, with the two TTC_diff peaks as the boundary (
Figure 4b).
Here, we focus on the section before the EV performs the avoidance behavior. The EV does not avoid the interaction that is about to occur. At this time, the smaller the time difference between the two vehicles reaching interaction point, the more extreme the scene when avoiding the collision. When the EV avoids the collision, the speed decreases significantly, and the TTC_diff increases significantly. The scene becomes “safe” and is no longer the focus of research.
4.2. Scene Interaction Judgment and Iteration Direction
The minimum absolute value TTC_diff < 1 s in the KTS is taken as the judgment basis for the convergence of scene interaction, but the premise is that interaction must occur, so the interaction judgment must be performed before the convergence judgment. According to the parameter curve obtained from the prior experiment, the interaction judgment basis is summarized as follows:
Start time window:
where
represents the start time of the KST.
The interaction determination formula is
θ = 5000 s;
represents the current judgment object, and it is judged whether the EV interacts with the previous object
.
- (2)
The last IO uses the TTC_diff time window
at the end of the interaction to determine whether the interaction has occurred. Because there is no influence of subsequent interactions, the KTS of the tail-end IO in the continuous interaction scenario can record the TTC_diff avoidance peak of the interaction. If the TTC_diff curve has a peak in
, it indicates that the EV has decelerated to avoid the collision, and the interaction has occurred.
Start time window:
where
represents the final moment of the KST.
The interaction determination formula is
θ = 5000 s;
represents the last IO in the interaction sequence, and it is determined whether the EV interacts with
.
- 2.
An EV and a single IO. Without subsequent IO data for reference, the remaining distance from the EV to the interaction point when the IO reaches interaction point at the last moment of the KTS is taken as the basis for interaction.
The interaction determination formula is
Based on the above situations, the judgment formula of interactive criticality is obtained as follows:
0—no interaction, 1—critical, and 2—non-critical.
The pseudo code of the overall interaction and critical judgment data flow algorithm is shown in the following Algorithm 1.
| Algorithm 1 Interaction and Criticality Determination Data Flow Algorithm |
| Input: For each traffic participant i: Time_i = [t1, t2, ..., tn], Velocity_i = [v1, v2, ..., vn] and Position_i = [(x1, y1), ..., (xn, yn)] |
| Output: For each IO i: Interaction_Status_i ∈ {No interaction, Critical, Non-critical} and min_TTC_diff_i |
| 1. For EV: |
| Compute cumulative distance D_ego(t) ← ∑ v_avg × Δt |
| Estimate Remaining_Distance_ego(t) ← D_total—D_ego(t) |
| 2. For each IO i: |
| Estimate Remaining_Distance_i(t) ← f(x_i, y_i) |
| Compute TTC_i(t) ← Remaining_Distance_i(t)/Velocity_i(t) |
| 3. Align TTC_i(t) with TTC_ego(t): TTC_diff_i(t) ← TTC_ego(t)—TTC_i(t) |
| 4. Valid interaction filtering: |
| For each object: |
| If ∃ TTC_diff ≥ 0: valid_objects.append() |
| Else: |
| status_records[i] ← (“ego passes early”, NaN) |
| 5. Sort valid IOs by last timestamp (descending): |
| sorted_objects ← sort (valid_objects, key = last_time, reverse = True) |
| 6. If only one valid interaction: |
| Evaluate status based on: |
| —Min TTC_diff within valid range |
| —Remaining_Distance at
|
| Record status_records[i] ← (status, min_TTC_diff) |
| 7. Else (multiple valid interactions): |
| For each object i in sorted_objects: |
| If i = 0: Evaluate status based on: |
| —Min TTC_diff within valid range |
| —Presence of large TTC_diff values in
|
| Record status_records[i] ← (status, min_TTC_diff) |
| Else: Evaluate status based on: |
| —Presence of large TTC_diff values in
|
| —Min TTC_diff within valid range |
| —Remaining_Distance at
|
| Record status_records[i] ← (status, min_TTC_diff) |
| Return: status_records ← {Interaction_Status_i, min_TTC_diff_i} |
After obtaining the interaction state, it is easy to adjust the parameters of the corresponding traffic objects to generate different specific scenarios. The optimization direction of various scene states is shown in
Figure 5. The scene is mainly optimized by adjusting the speed of the EV and IOs and the distance to interaction points. When the scenario reaches the non-critical state of interaction, more precise parameter adjustment is required to approach the critical scenario, so the change in the acceleration of the EV is introduced.
5. Iterative Scene Generation Based on Interaction Coding
5.1. Data Collection and Coding
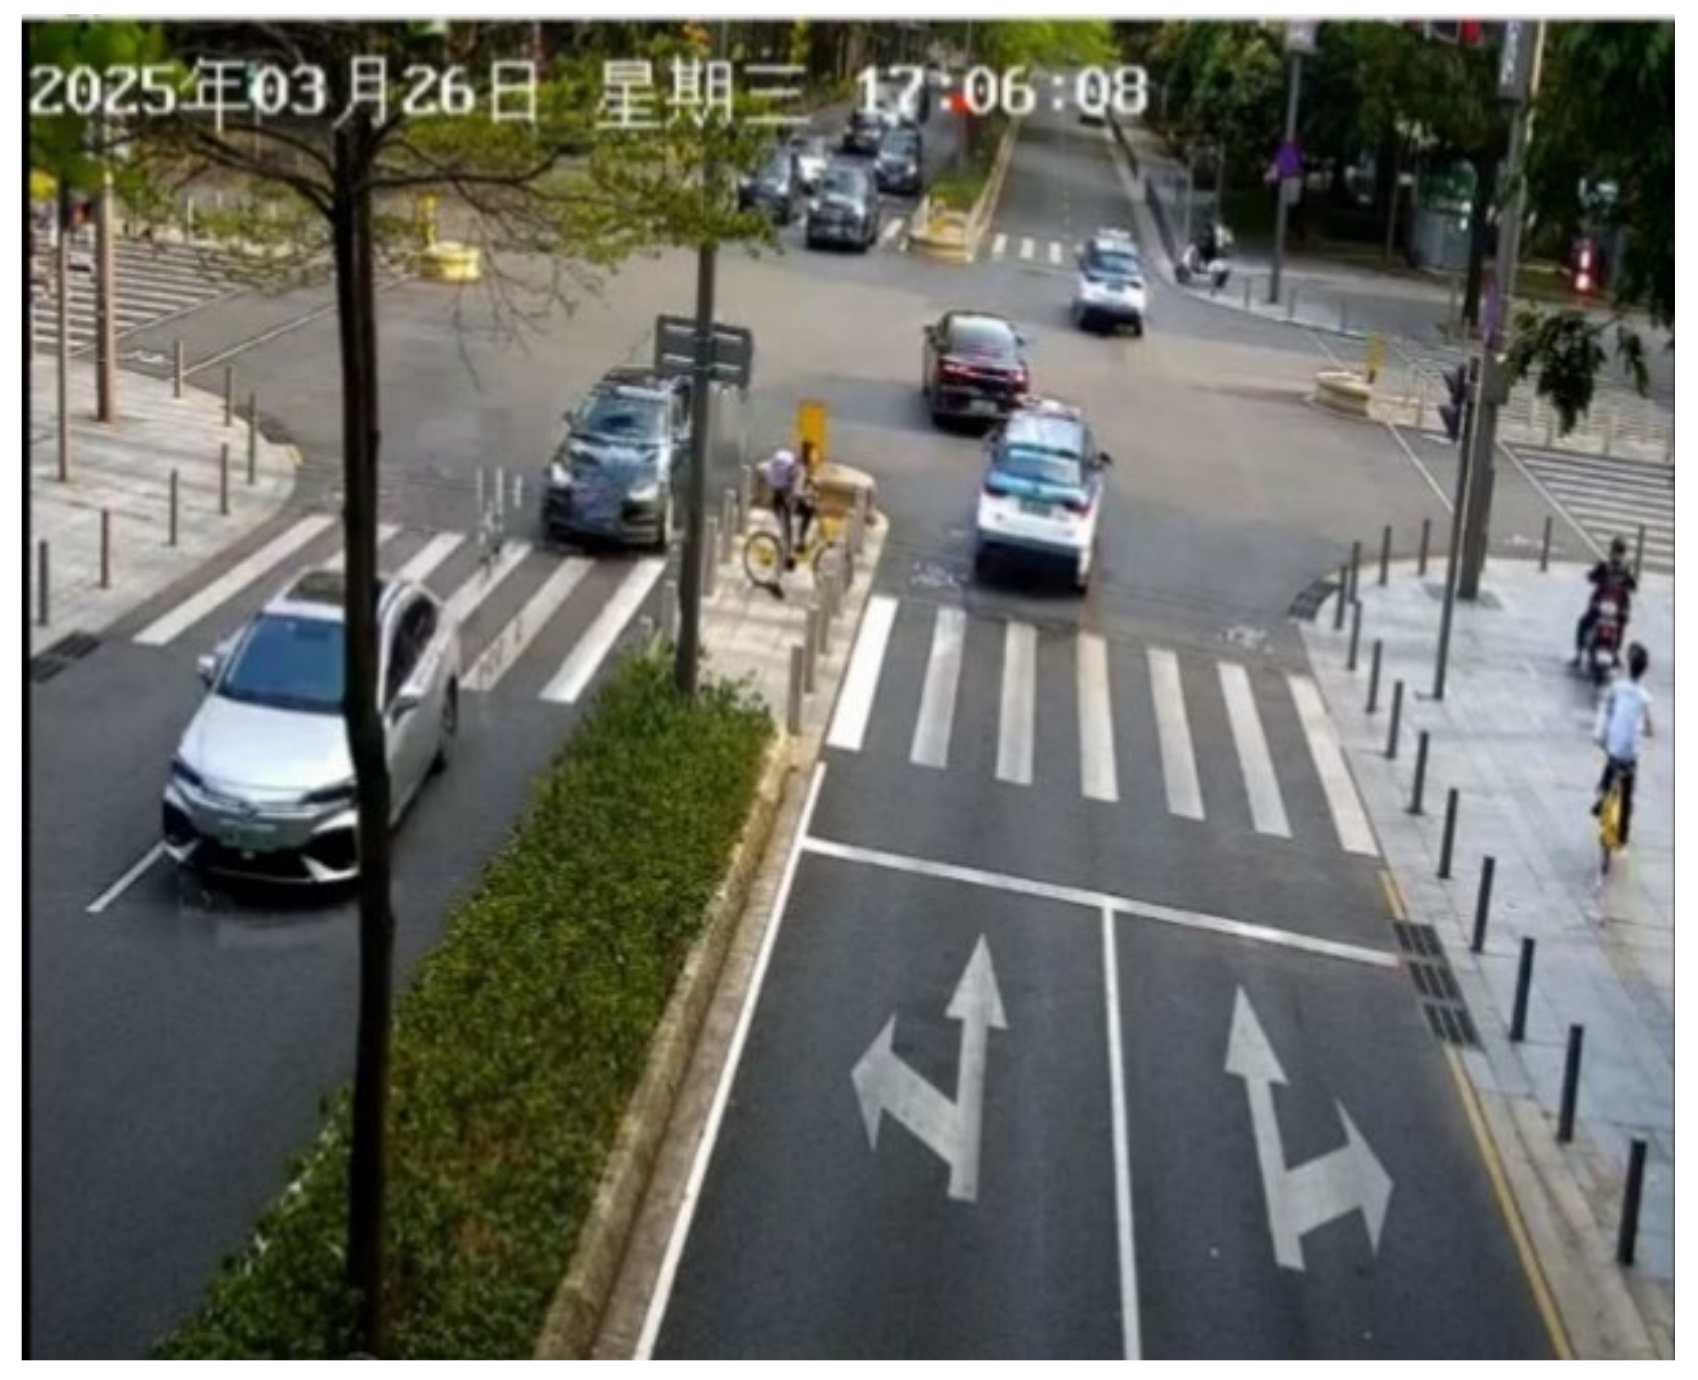
By collecting the traffic video data of the intersection of Fuzhong Road and Haitian Road in Futian District, Shenzhen, on 26 March 2025 (
Figure 6), the basic rules of real traffic lane selection are found, and the interaction coding of the unprotected left turn is designed accordingly.
When the same code value reaches 3, the lane is prone to forming a following fleet, and the head spacing has difficulty attaining a traversable gap. After the EV interacts with the first IO, it will directly stop and wait for the subsequent IOs. At this time, it is difficult to attain a critical interaction. Although the target number of interactions is high, the scene becomes safer because the vehicle is determined to slow down or stop to wait. Combined with video observation and actual measurement cases (
Figure 7), except for the first IO, the TTC_diff of the subsequent two IOs will be very large, and it is nearly impossible to optimize to the critical interaction state.
Because there is no non-motor vehicle lane in CARLA maps, this argument does not involve non-motor vehicles. Considering the real traffic and the quality and efficiency of scene generation, it is found that the probability of straight motor vehicles choosing the inner lane is significantly greater than that of choosing the outer lane, so the interaction coding combination is designed (
Table 2).
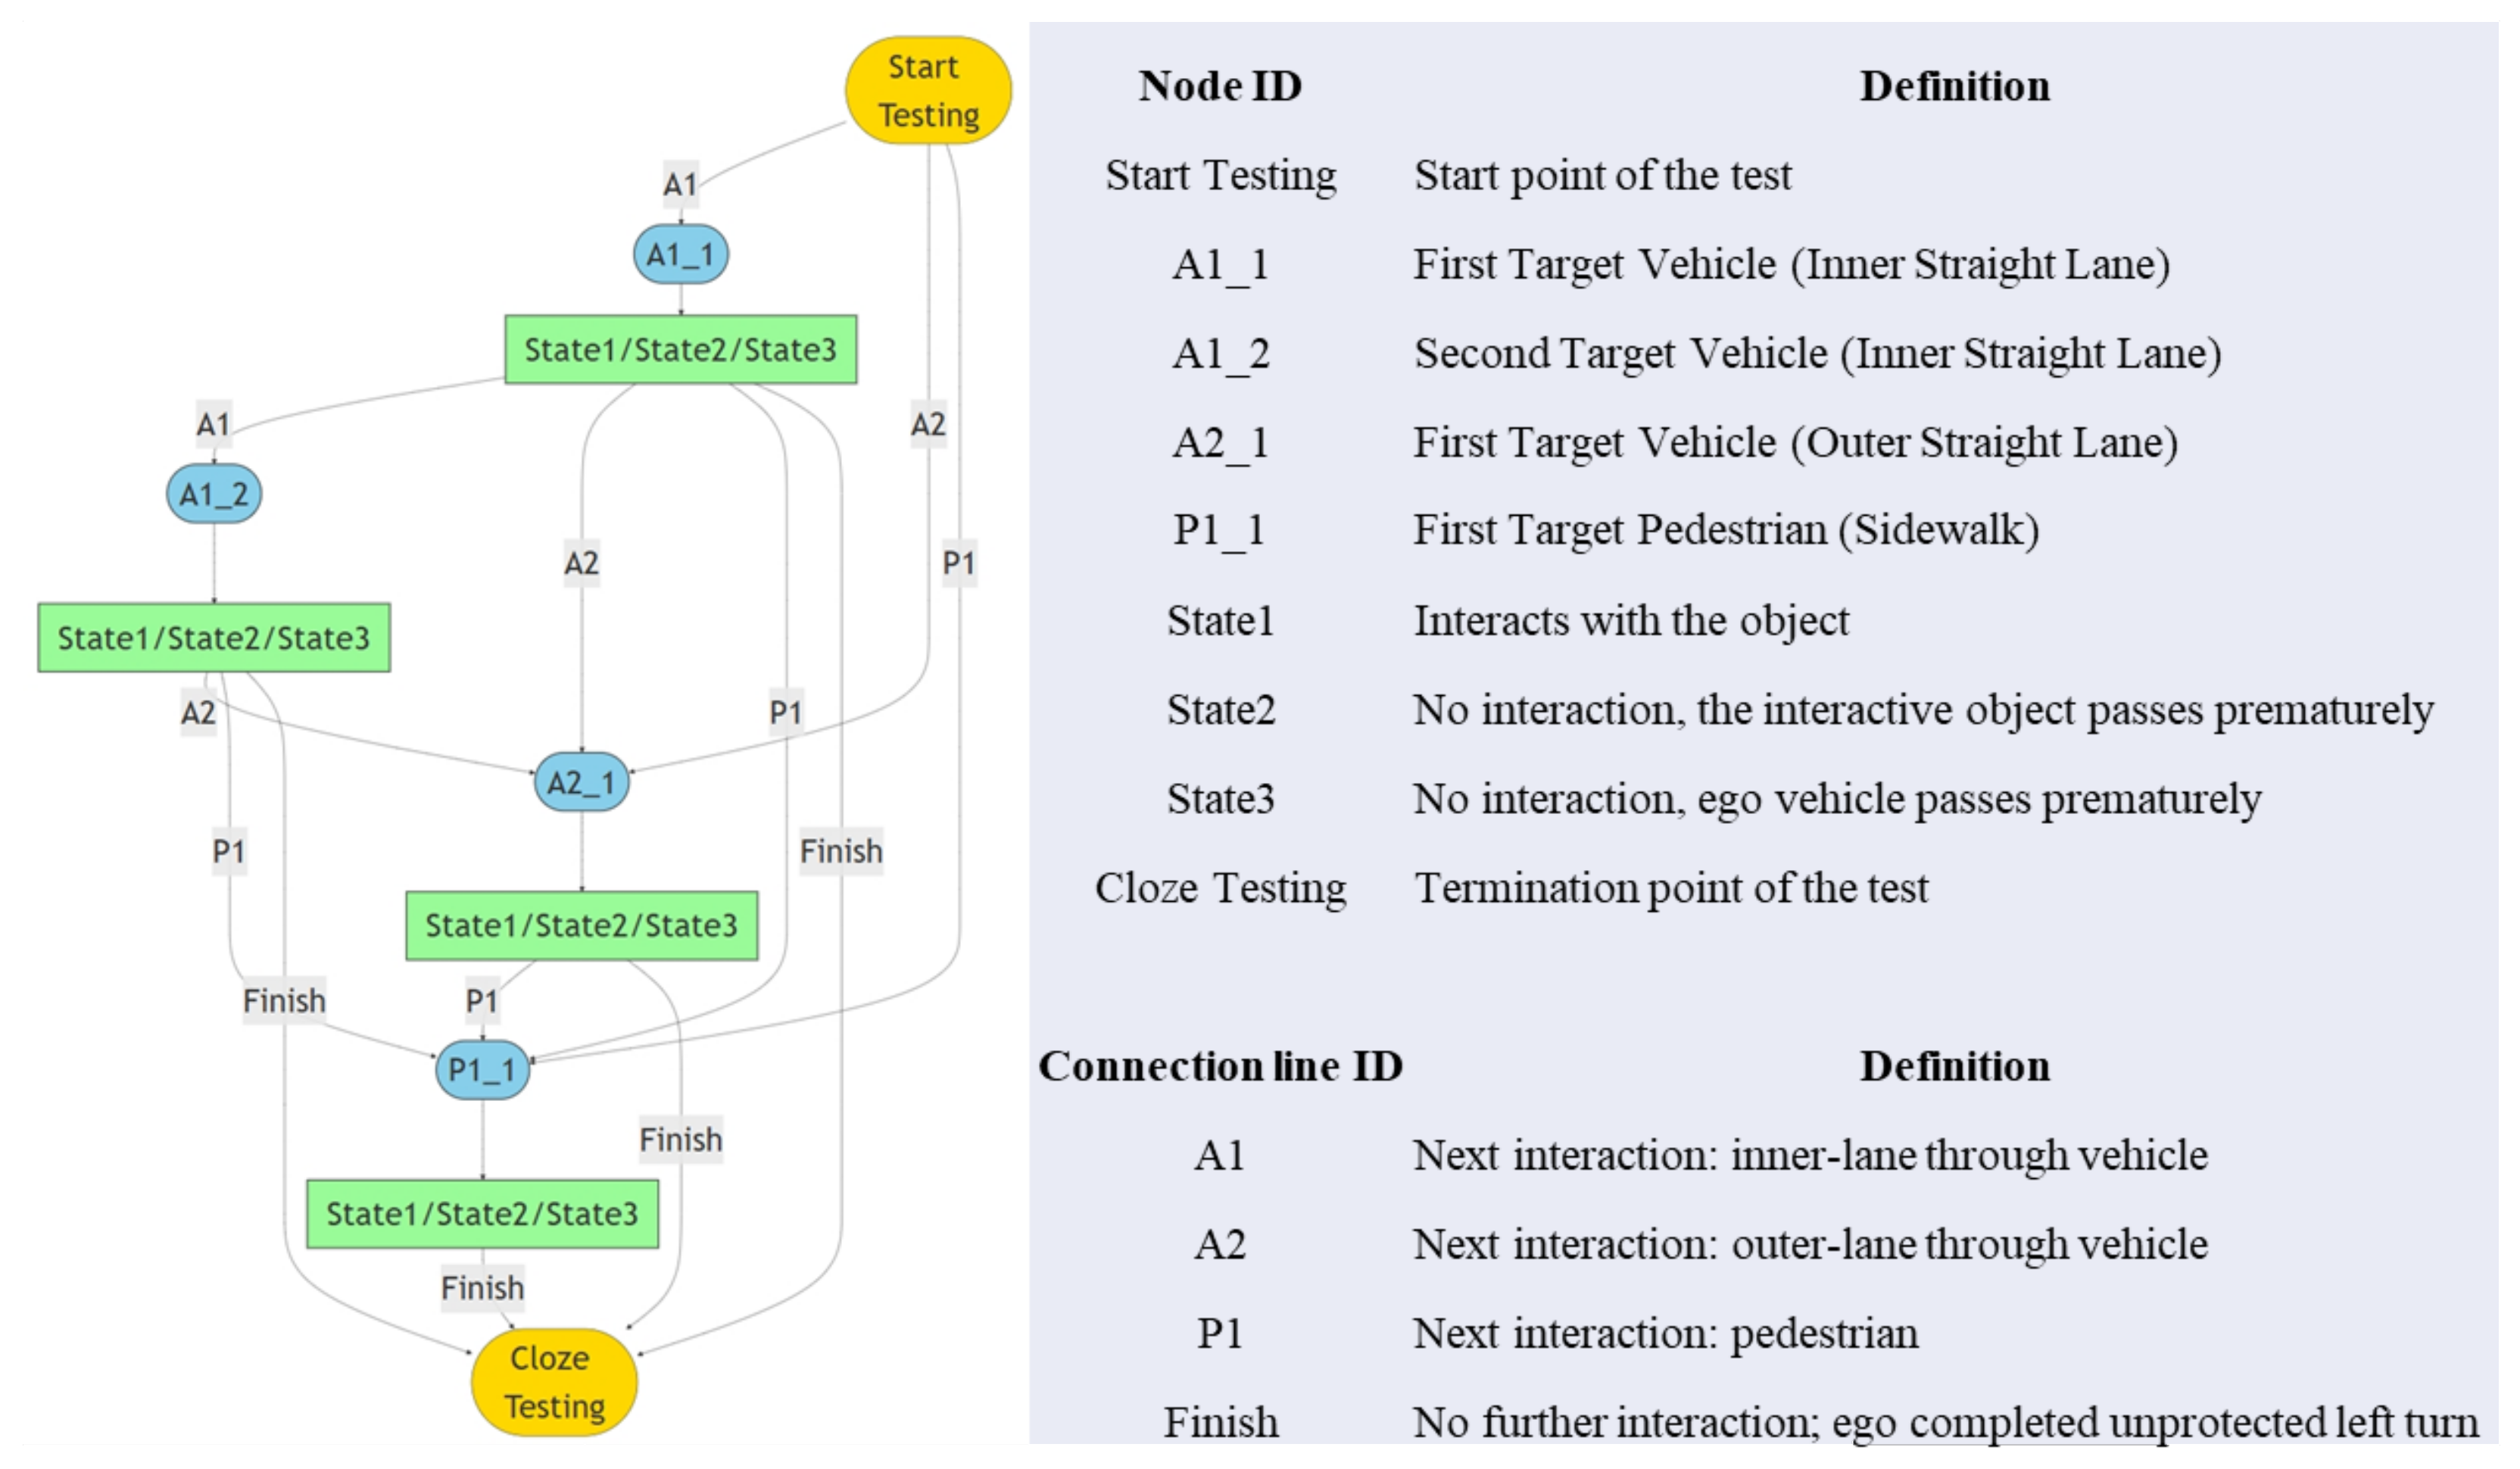
According to the above codes’ design, the Petri interaction chain diagram generated by all potential scenarios is obtained (
Figure 8).
5.2. Initial Scene Setup
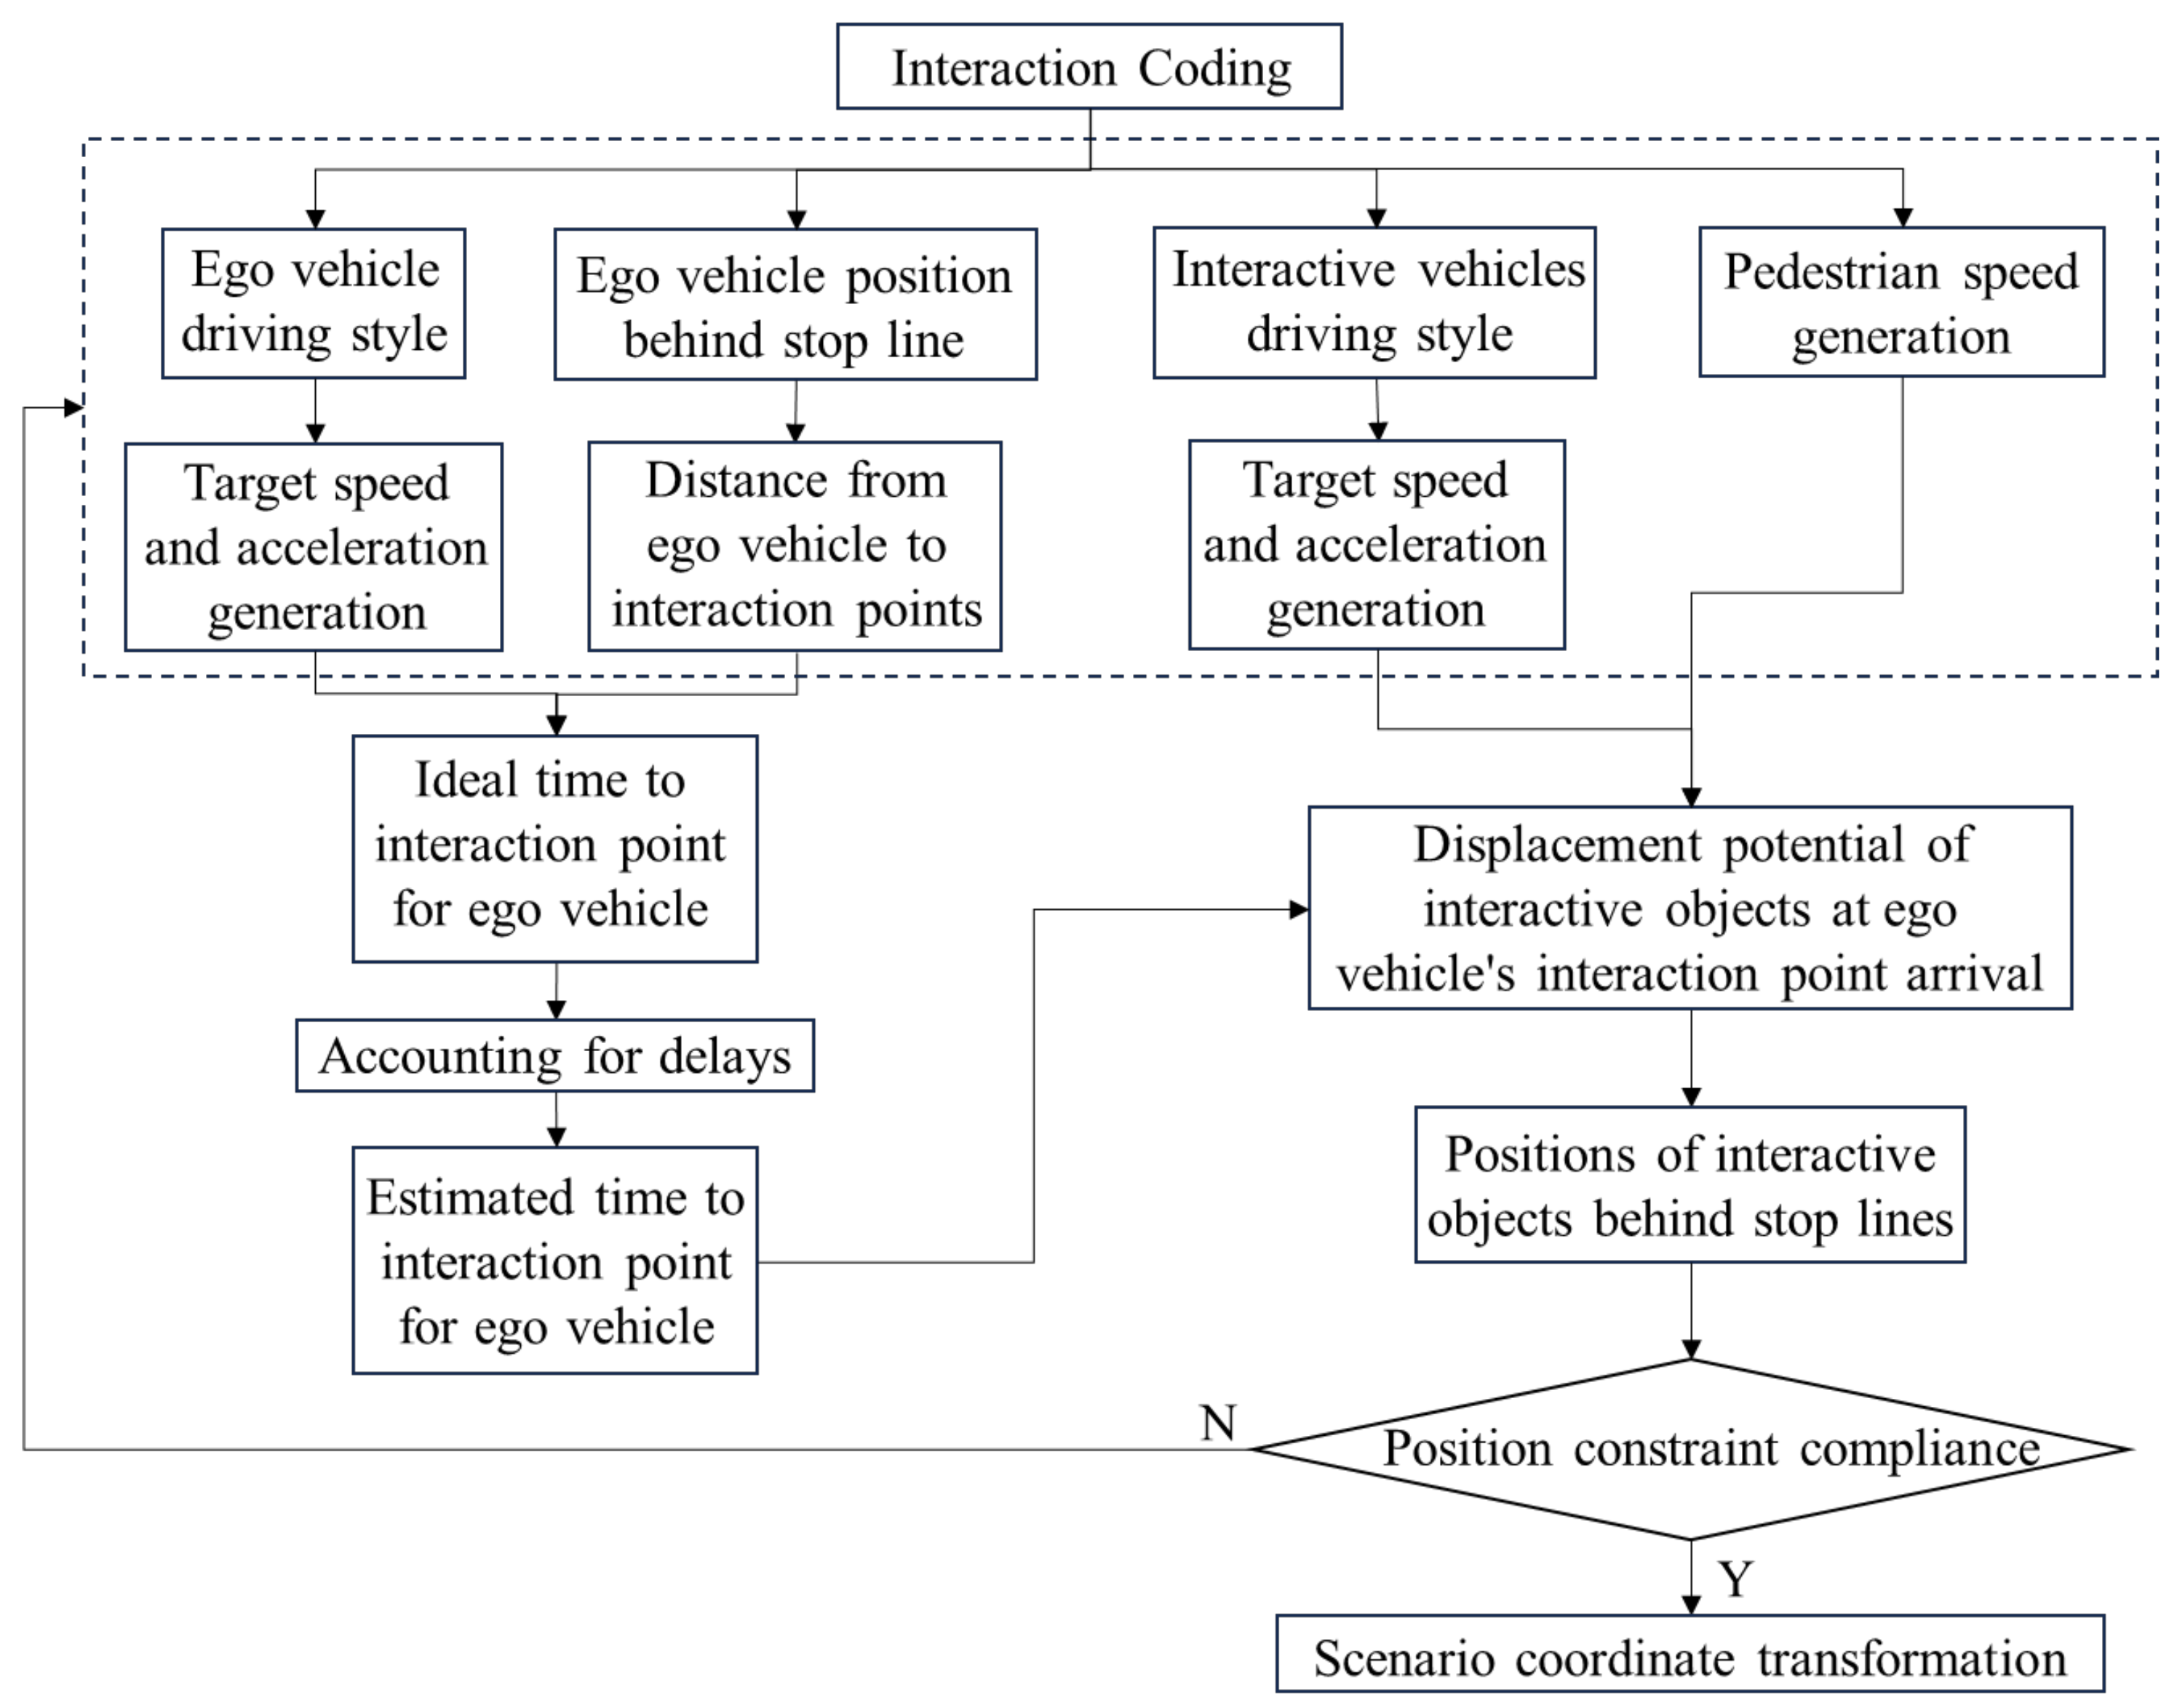
After the functional scene is set based on interaction coding, a constrained initial scene generation framework is proposed; the traffic object parameters are generated in a controllable random manner under the preset geometric boundary and traffic constraints. The framework retains the necessary randomness and does not produce overly complex or simple initial scenes, providing a reasonable starting point for subsequent iterations and avoiding invalid iterations. The overall logic of the scene’s setting is shown in
Figure 9.
Then, the value range of parameters in the logical scenario is determined. Some studies use the K-means clustering algorithm to perform cluster analysis and divide the driving styles of autonomous vehicles into aggressive, moderate, and traditional [
29]. According to a summary [
30], the target speed and acceleration range of each driving style of the autonomous vehicle accelerating from 0 on urban roads are shown in
Table 3. Based on the interval division and the SinD data set of the real intersection, the selection probability analysis of the driving style of the motor vehicle is carried out, and the probability is normalized (
Table 3). The internal parameters of driving style are randomly selected.
Pedestrians in CARLA do not have acceleration parameters. Considering the lower limit of speed through the intersection, the data of < 0.5 m/s are screened out from the SinD data set, and the minimum interval of pedestrian speed covering 90% probability density is [0.6784, 1.5850] m/s. Randomly select a speed within the interval.
5.3. Scene Construction and Simulation Iteration
After the scene parameters are configured, the scene is built in CARLA. The main scene generation and testing framework of the method in this paper is shown in
Figure 10.
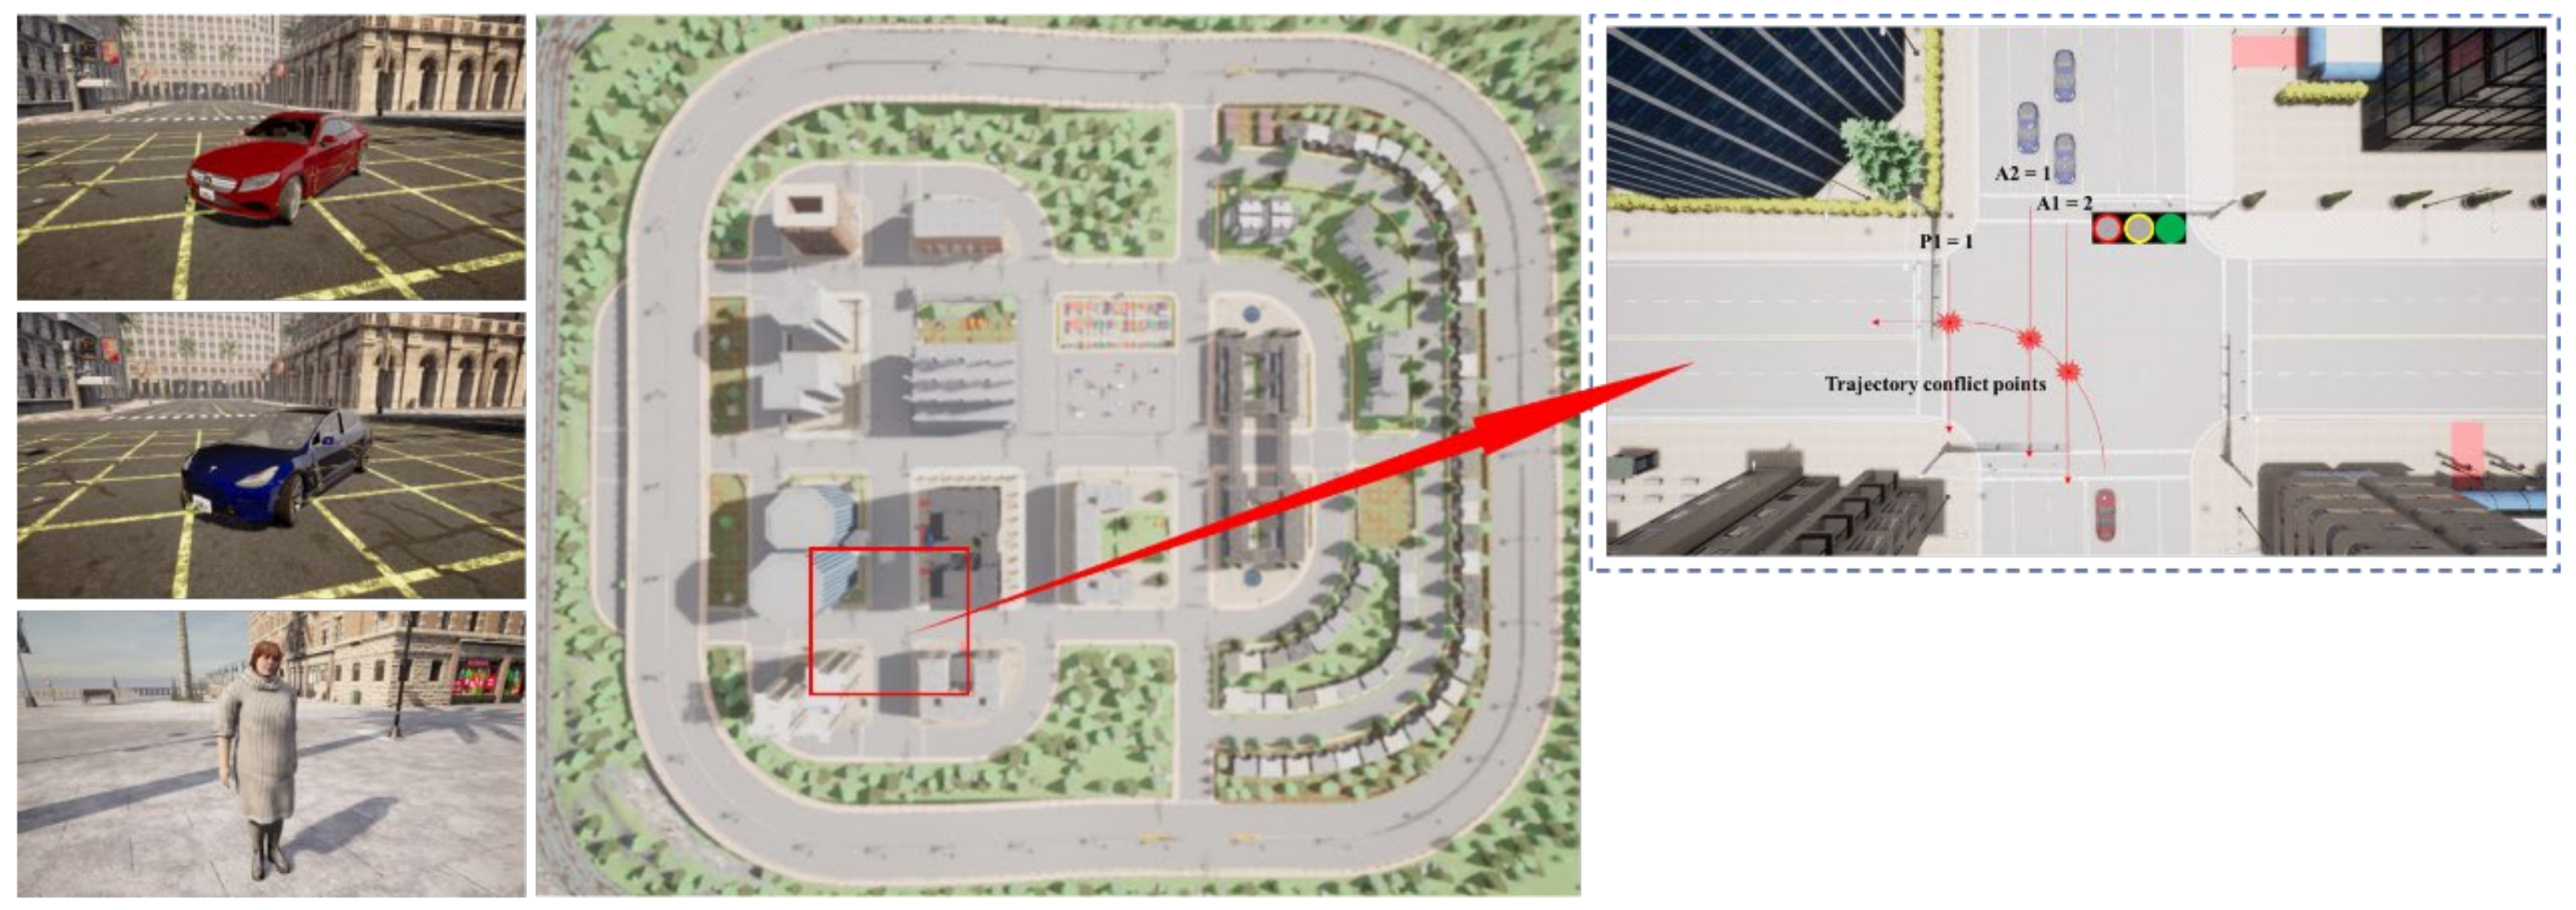
The test site is selected as the pre-built map Town05 in CARLA0.9.15. The test model selected the EV as a Mercedes Coupe 2020, the interactive motor vehicle as a Tesla Model 3, and the pedestrian as an adult female (Pedestrian.0037). The standard two-way, four-lane cross intersection in the selected map is used to build the scene according to the set interaction coding (
Figure 11).
The interaction state of the specific scene is judged before iterating the next scene. When all of the IOs reach the critical interaction state, the iteration is stopped, and the generated scene sequence is obtained (
Table 4), where 0—no interaction, 1—critical, 2—non-critical, and 3—ego passes early.
5.4. Trustworthiness Assessment Verification
According to the autonomous driving trustworthiness measurement system, the overall vehicle trustworthiness evaluation method gives priority to the driving safety of the vehicle, including two parts: safety control and autonomous efficiency. It also describes the indicators involved in the trustworthiness evaluation and their corresponding weights. The specific evaluation system is shown in
Figure 12.
The weights of the secondary and tertiary indicators were selected according to Chang et al. [
31]. Based on the test data, the entropy weight method (EWM) was used to calculate the weights of the fourth-level indicators (
Table 5).
The formula for calculating the final trustworthiness score of a single scenario is
: the weight of the i-th secondary indicator;
: the weight of the j-th tertiary indicator under the i-th secondary indicator;
: the weight of the k-th quaternary indicator under the i-th secondary indicator and the j-th tertiary indicator;
: the scores of the k-th quaternary indicator under the i-th secondary indicator and the j-th tertiary indicator. [0, 100].
According to the calculation method of the evaluation index, sensors (
Table 6) are arranged for each traffic participant in CARLA to obtain data. All sensors share the same timestamp, and the trustworthiness index score is obtained after secondary processing.
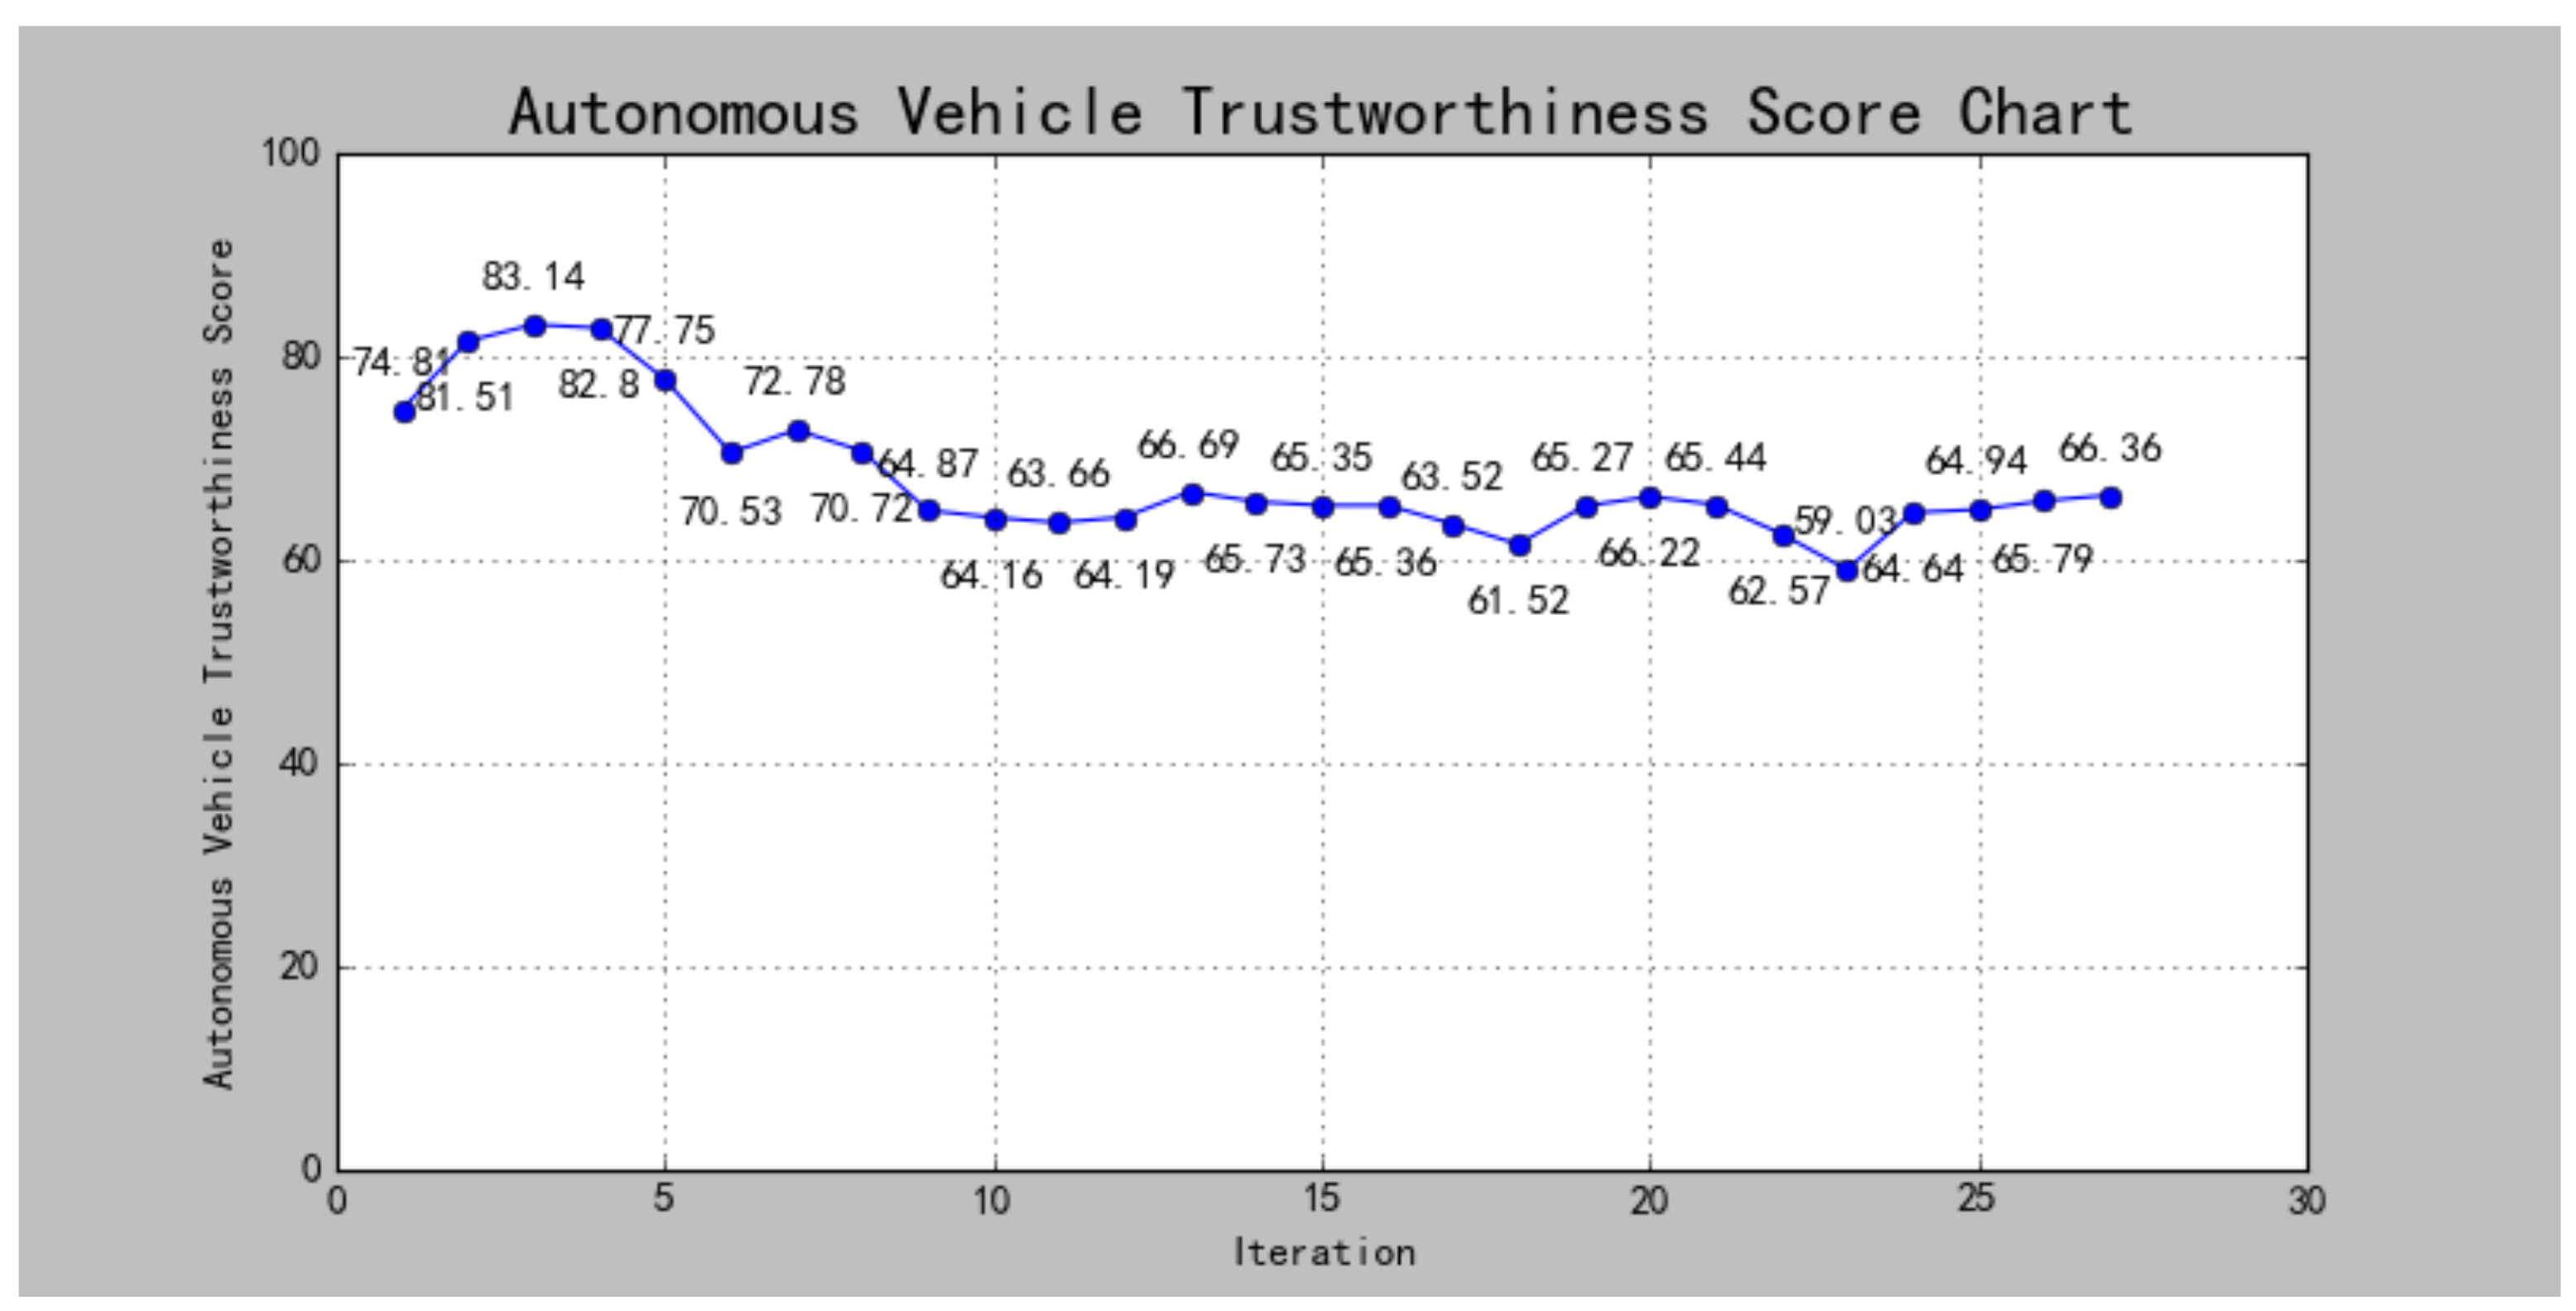
Based on the index system and simulation data, the overall vehicle trustworthiness score of the EV running in each scene is calculated to obtain the score curve (
Figure 13).
In addition, in order to verify the applicability of the proposed scene iterative generation method, an overtaking scene, as shown in
Figure 14, was designed in the urban road scene. Because this paper mainly focuses on the coding design and verification experiment of unprotected left turn scenarios, for overtaking scenarios, only the relatively simple double interaction scenarios are used for applicability verification. A1 indicates that the overtaking vehicle starts to change lanes and interacts with the straight-line vehicle in the left lane; A2 indicates that the overtaking ends and interacts with the straight-line vehicle in the original lane.
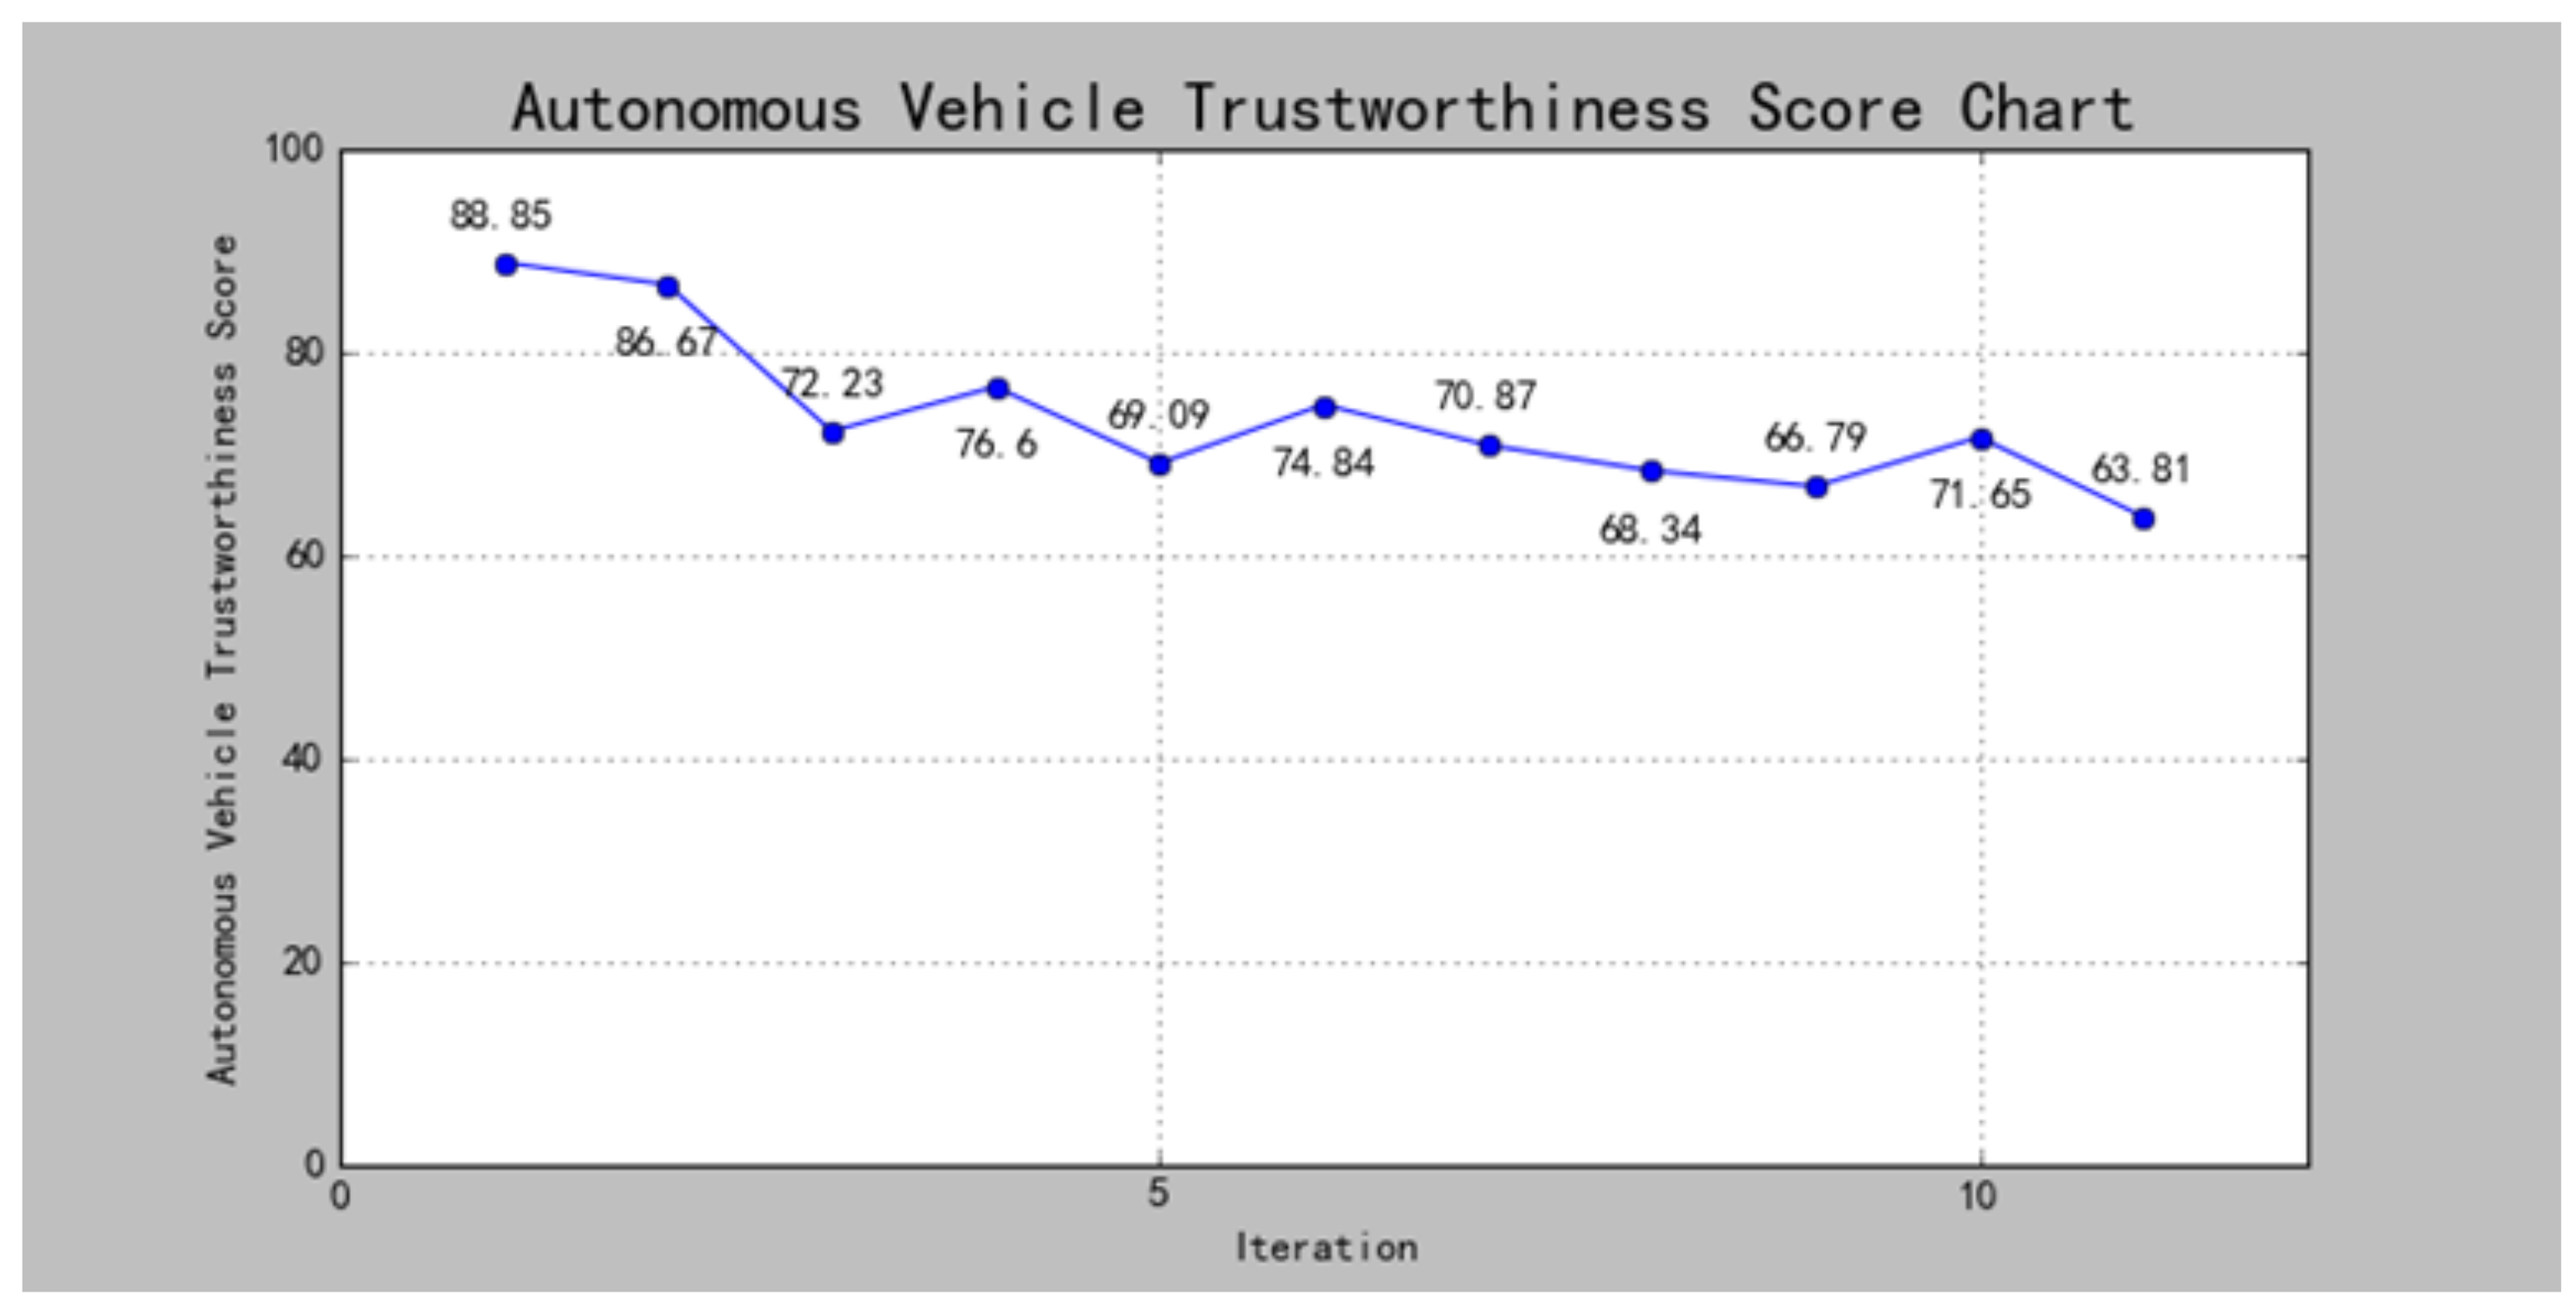
The overtaking scenario is simulated iteratively to obtain the scene sequence score, as shown in
Figure 15. In the score sequence of the unprotected left turn scenario, the score rises rapidly in the initial iteration and then shows a downward trend and tends to be stable, reflecting the sensitivity and convergence of the method to the scenario risk. As a supplementary experiment, the score sequence of the overtaking scenario also showed similar iterative response characteristics; the initial score was high, and then it dropped rapidly and stabilized in a reasonable range in the middle and late stages. This trend is highly consistent with the main experiment, and the overall complexity of the overtaking scene with double interaction is the unprotected left turn scene with four interactions, so the convergence score is higher than the unprotected left turn scene experiment, which is roughly maintained between 67 and 72 points. The score fluctuation range matches the scene’s interaction complexity, and there is no structural deviation or abnormal fluctuation.
The results show that the method in this paper can generate a sequence of trust scores with convergence, discrimination, and stability in scenarios with different interaction complexities and different task types, and it has good generalization ability and applicability. The experimental results of the overtaking scenario are used as evidence to further support the effectiveness and robustness of the method in complex scenarios.
5.5. Result Analysis
5.5.1. The Relationship Between Interaction State and Score
The overall vehicle trustworthiness score is used to determine the difficulty of the generated scenario for the EV, and it can also help discover the functional weaknesses of the EV. The interaction state is divided into critical > non-critical > no interaction ≈ ego passes early according to the risk intensity. Taking the interaction state as the independent variable, the ability of the vehicle operation trustworthiness score to reflect the scene’s interaction and criticality is investigated. Quantify the interaction state:
Set α ∈ [0.5, 0.7]; take α = 0.6.
The concept of the interaction intensity index (III) is proposed, and, for each iteration (
t), the total IO set
is calculated as
.
= 0 means all “no interaction/early pass”;
=
n means all critical.
A linear model is used to evaluate the relationship between the trustworthiness score and the interaction strength:
We expect
< 0. This indicates that the larger
, the lower the trustworthiness score, and the higher the scene’s difficulty. Regression analysis parameter estimation:
= 81.766,
= −5.004. The regression analysis diagram (
Figure 16) is shown.
Pearson correlation analysis was used for verification. The correlation coefficient between the two is −0.815, and the p value is 0.000, which is at the 1% significance level, indicating that there is a strong negative correlation. Through the analysis of the confidence interval, the 95% confidence interval is [−6.47, −3.54], which is completely located in the negative value interval, indicating that the negative relationship is statistically significant and stable; that is, the higher the interaction intensity index, the lower the overall vehicle trustworthiness score, and the greater the difficulty of the scene.
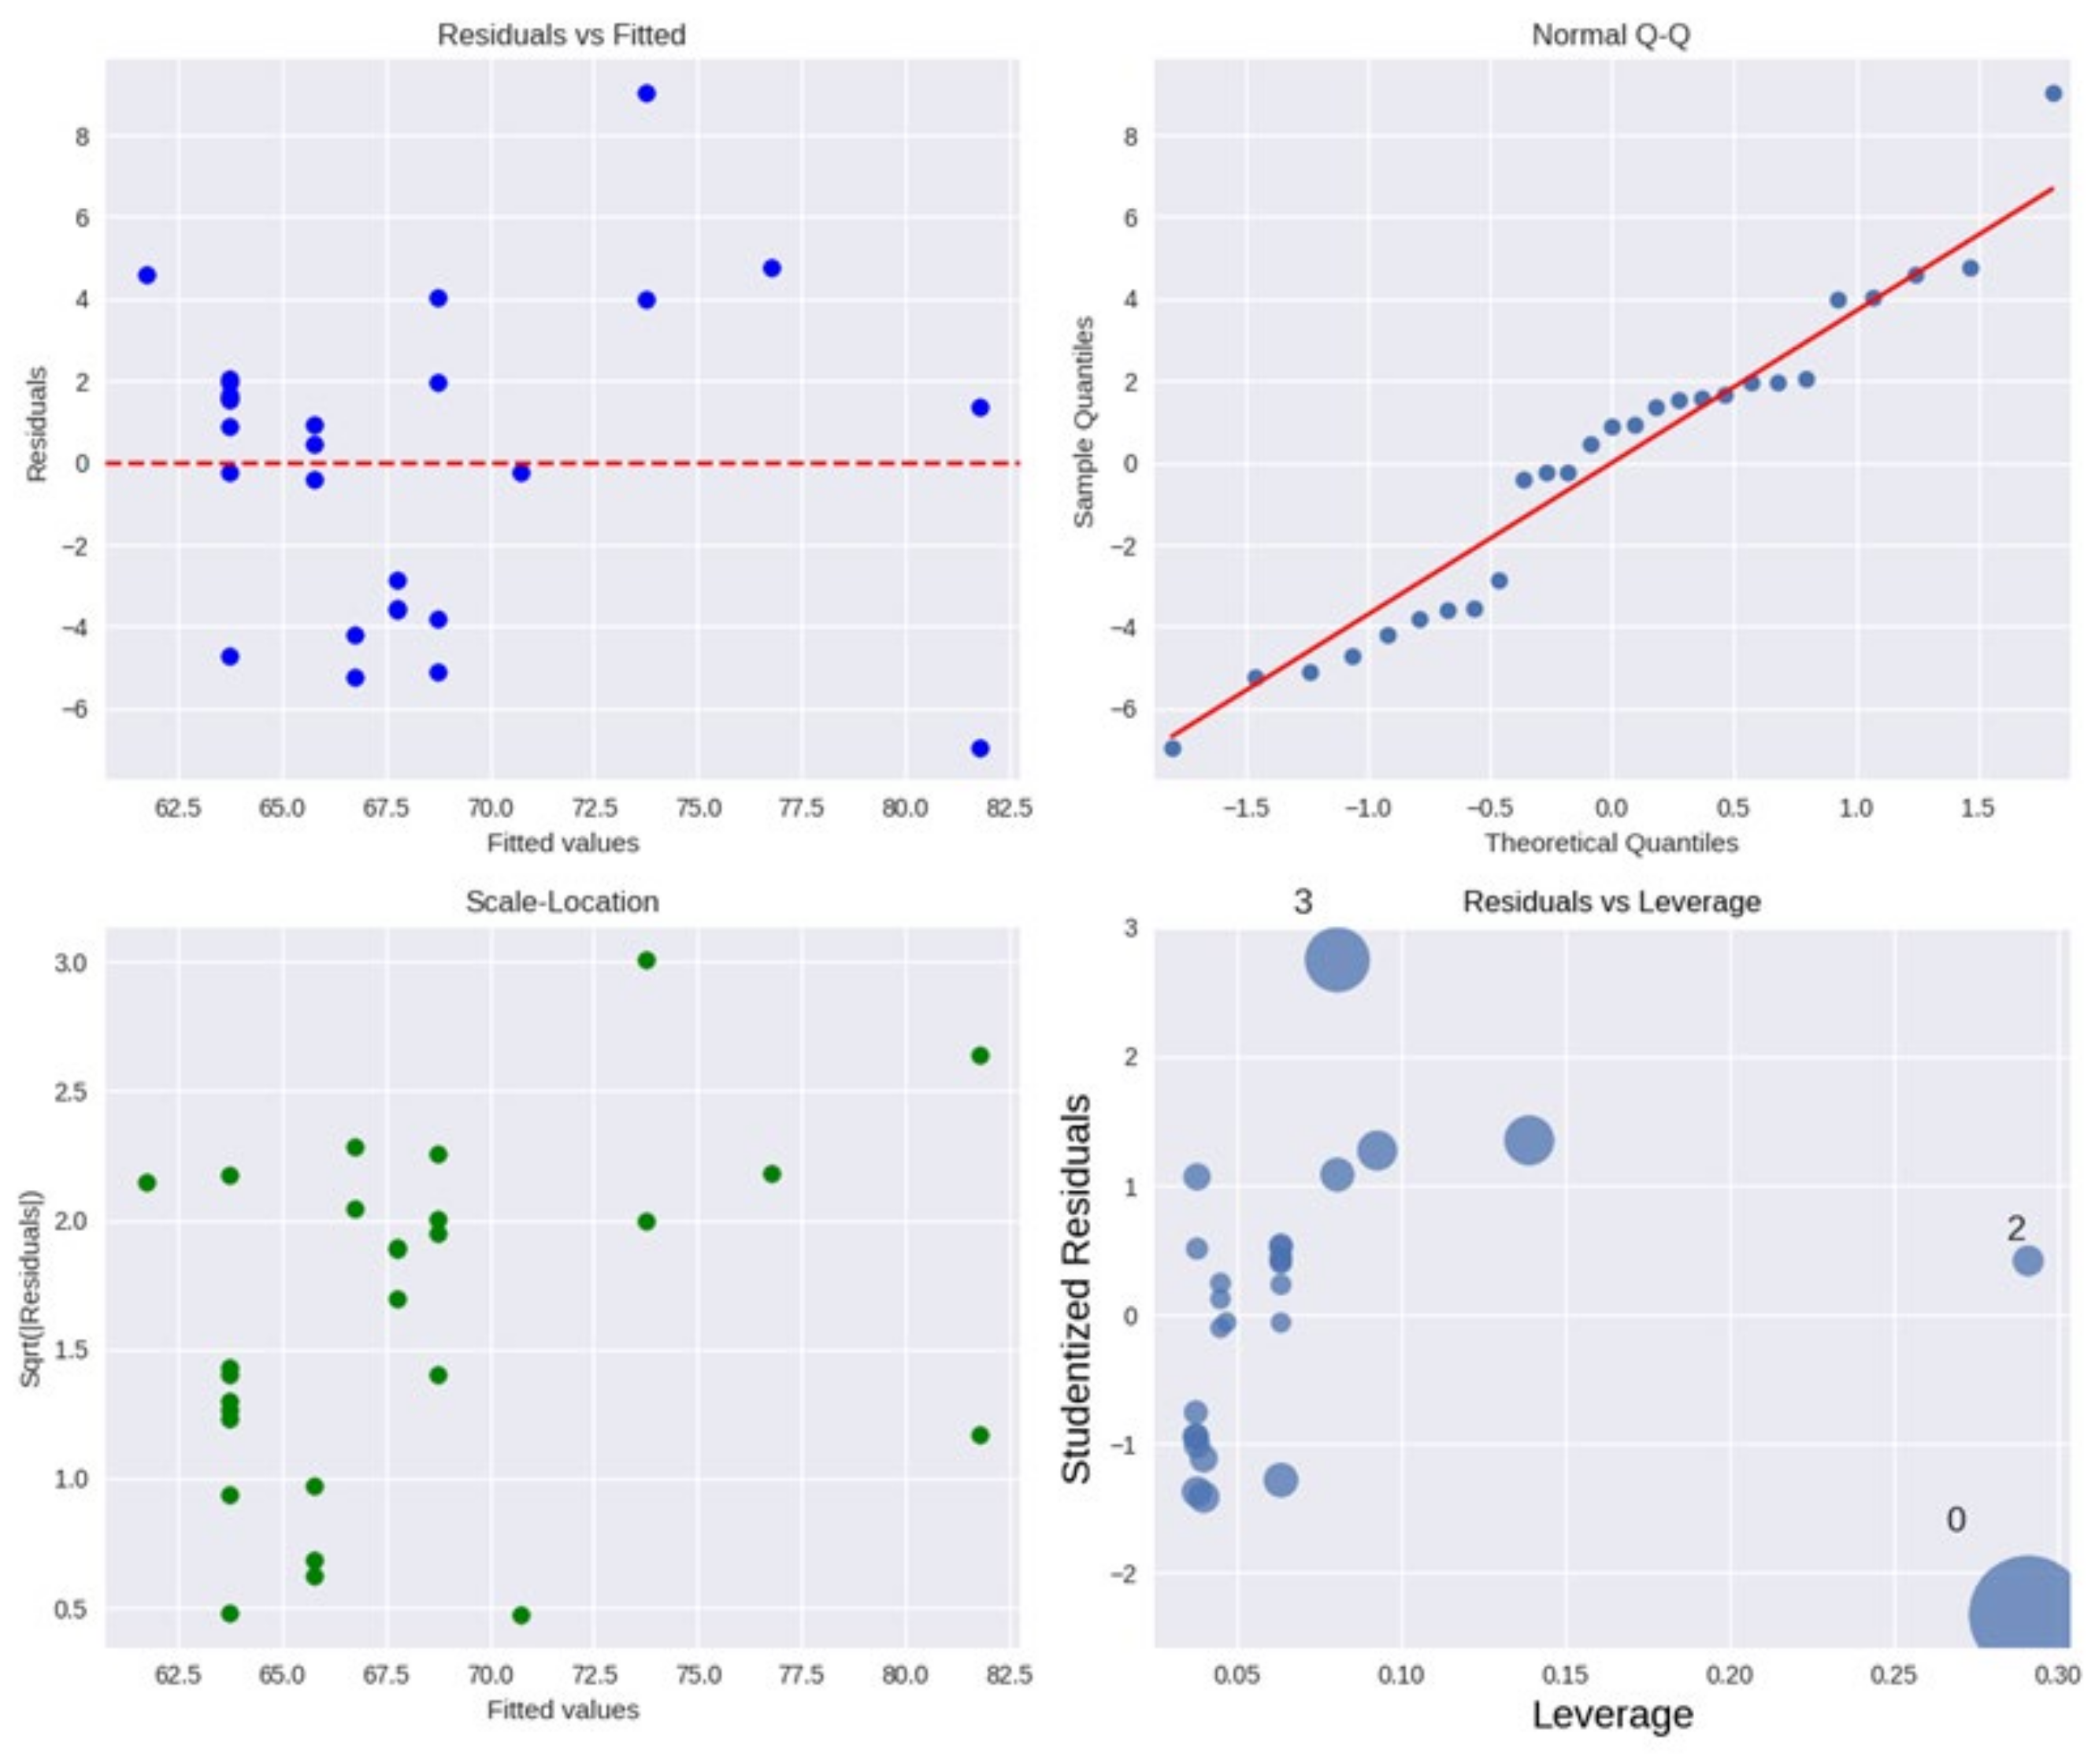
In addition, the regression diagnostic analysis was performed through the four standard graphs in
Figure 17, which further indicated that the model met the basic assumptions of linear regression from the four aspects of linearity, normality, homogeneity of variance, and robustness. The results are as follows:
- (1)
Residuals and Fitted: The residual distribution has no obvious pattern and no systematic deviation, indicating that the linear hypothesis is established and model fitting is reasonable.
- (2)
Normal Q-Q: The residual points are distributed approximately along the diagonal, indicating that the residuals are approximately normally distributed and meet the normality assumption of linear regression.
- (3)
Homoscedasticity Test (Scale–Location plot): The square root of the residual is evenly distributed within the range of the fitted value, and there is no obvious funnel shape, indicating that the error variance is basically the same, and no heteroscedasticity problem is found.
- (4)
Residuals and Leverage: No extremely high leverage points or abnormal influence points were found; the model was robust, and it was not dominated by a single data point.
Figure 17.
Regression diagnostic plots.
Figure 17.
Regression diagnostic plots.
5.5.2. Score Convergence and Scene Coverage Analysis
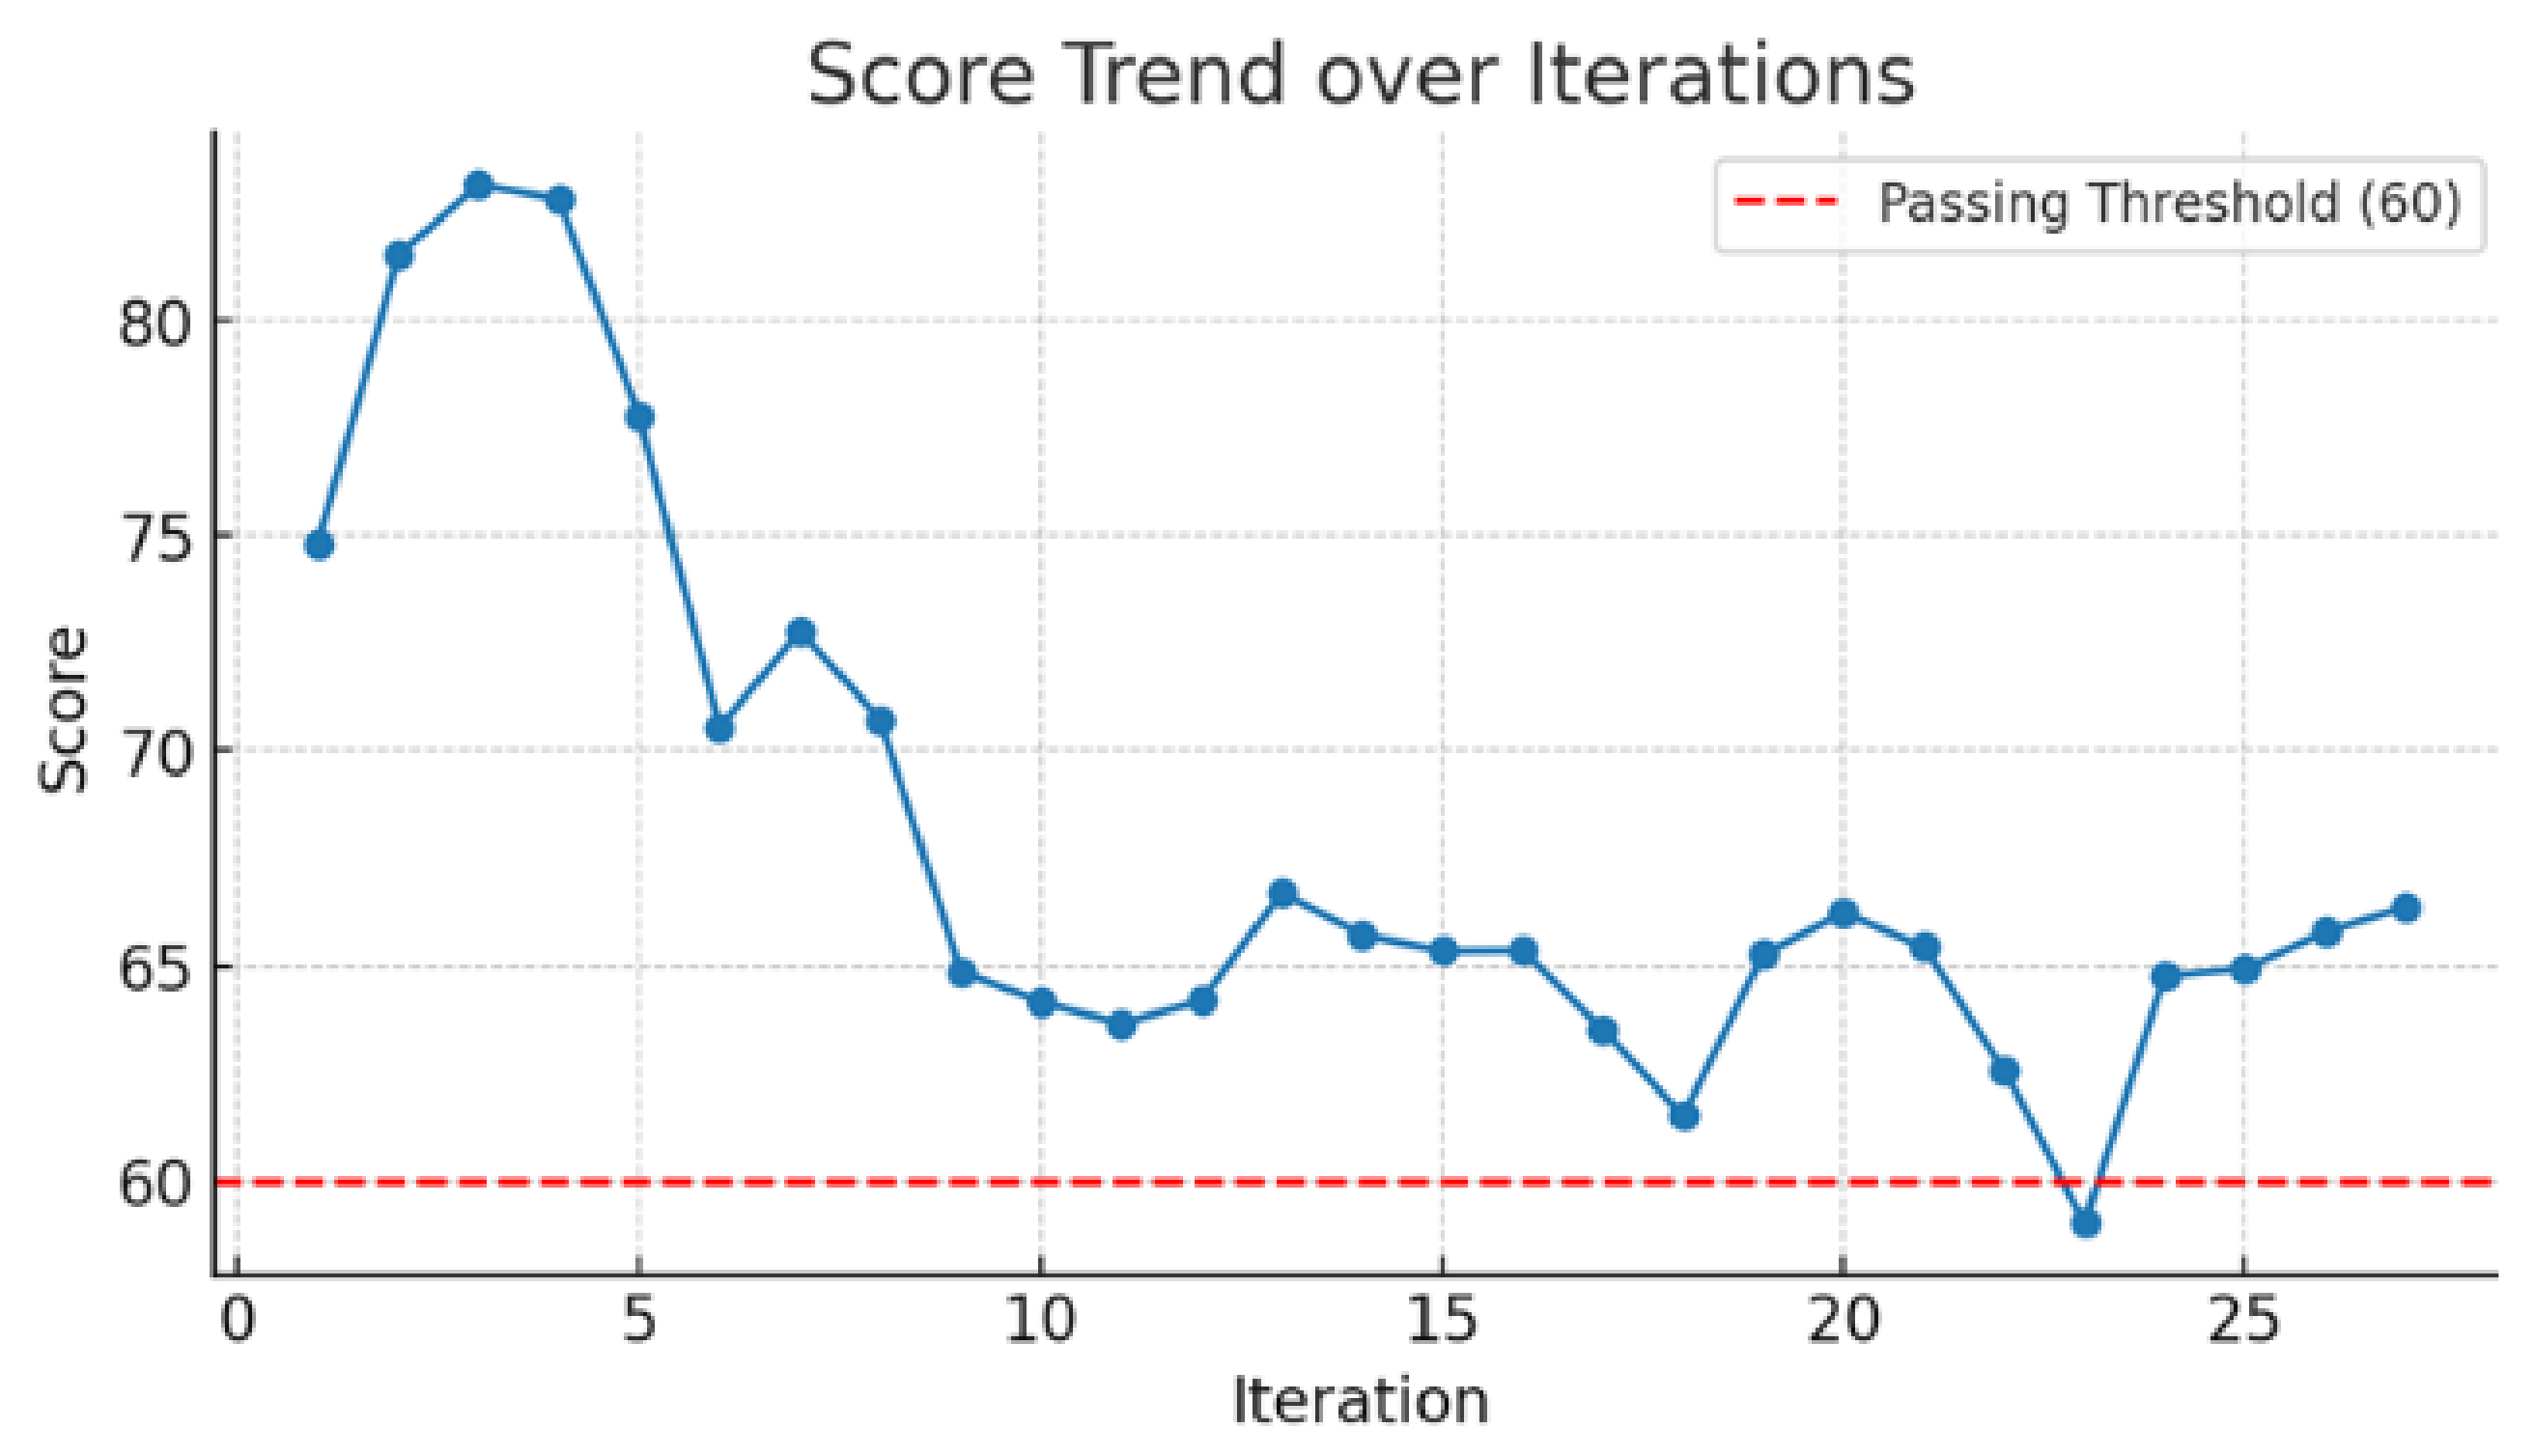
As seen in
Figure 18, when there is no critical interaction in the scene, the score is in the high range, and the scene’s difficulty is low; as the interaction intensity increases, the trustworthiness score gradually decreases and converges to the critical score platform for passing the test. In addition, there are scenarios with scores below 60 (No. 23), indicating that the generated scenario sequence can cover some scenarios where EVs have difficulty passing the test. The pass rate of the scenario test is 96.3%, indicating that the generated scenario can fully explore and excavate the edge scenarios of the vehicle’s extreme capabilities based on the premise of ensuring the basic safety and stability of the vehicle’s operation and also realize the serial transition from simple scenarios to edge scenarios. For the failed scenario of No. 23, it was found that in the nearby scenarios where task completion efficiency was also poor, its longitudinal comfort was at a very low level (CF2 = 1.80), resulting in a very low level of the autonomy and efficiency score. This indicates that the vehicle experienced violent fluctuations during the acceleration and deceleration process of the interaction, and there may be sudden acceleration, sudden braking, or frequent shaking.
In addition, the score of the scenario sequence covers 83 points to less than 60 points (unqualified operation). Considering the characteristics of the calculation of the trustworthiness score, even for the simplest scenario of 0 interactions, all of the underlying indicators may not be able to reach 100 points, so the coverage of the generated scenario to the scoring results can reach at least 83%.
The figure also shows that although the overall test score decreases as the scene’s difficulty score increases, it does not change monotonically, indicating that there is a complex nonlinear coupling relationship between the scene parameters. It is necessary and effective to use the iterative search method to achieve a certain coverage of the search space for discovering key scenes.
5.5.3. Interactive Judgment Method Demonstration
This paper adopts a conservative interaction determination strategy for high-risk scenarios of autonomous driving; that is, the test in which the actual interaction occurs may be misjudged as no interaction, which has the characteristics of high precision and low recall rate. In a total of 108 interaction tests, 98 real interactions (or early passes) were accurately judged, and no misjudgment occurred, with an accuracy rate of 100%. Ten times, it was judged as no interaction; there may be missed interaction, and the recall rate is at least 90.7%. The precision–recall curve (
Figure 19) shows that the strategy achieved a performance of 100% precision and more than 90.7% recall, verifying the stability and trustworthiness under high-precision requirements.
In addition, there is a very large TTC_diff (1047.0541) in No. 9, which causes the P1 state to be non-critical, but because vehicle_001 is critical, the trustworthiness score is 64.87, indicating that the judgment method relies more on the state type than the single TTC_diff value and has good robustness to unconventional TTC_diff.
5.5.4. Method Comparison Analysis
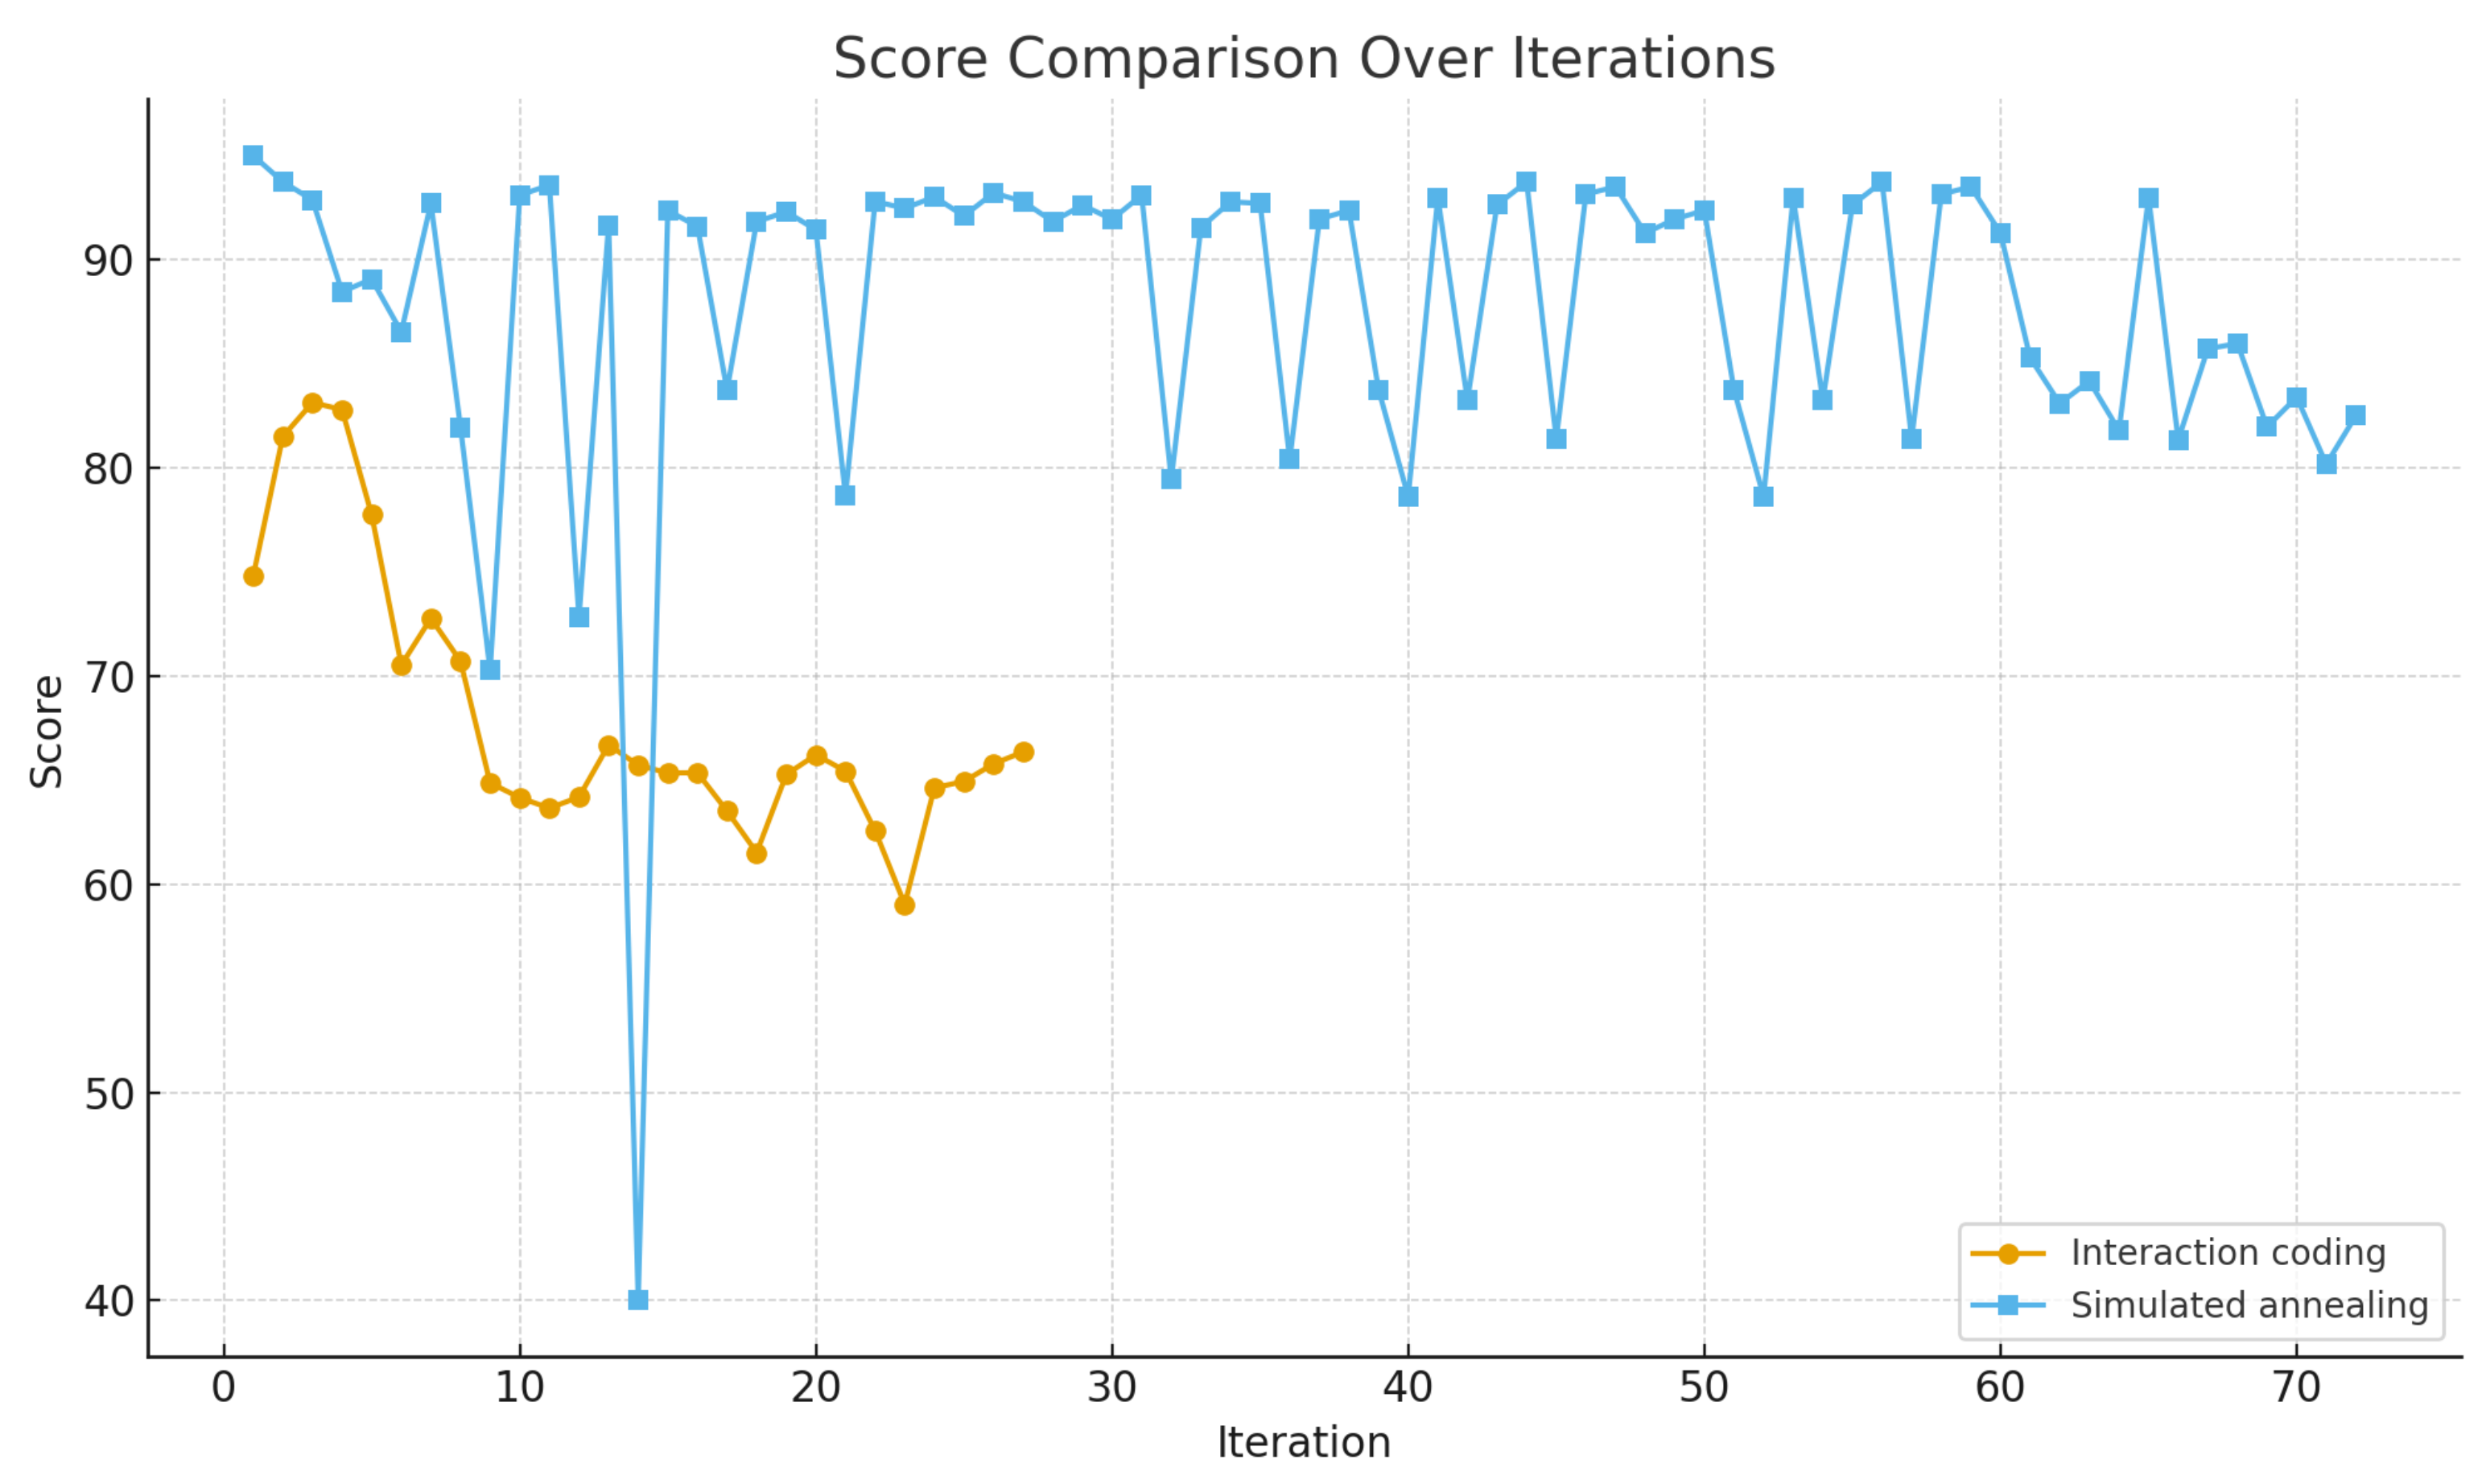
In order to verify the effectiveness of the proposed scene generation method based on interaction coding, it is compared with the simulated annealing algorithm and the scene orchestration method based on environmental parameters adopted in previous research. The score convergence sequences of the two methods are shown in
Figure 20.
As shown in
Table 7, The score of the scene sequence generated by the simulated annealing algorithm is distributed between 80 and 95, and the score mainly converges to 80, indicating that the generated scene has limited challenge; the simulated annealing algorithm adopts random disturbance and temperature attenuation mechanisms in the parameter space, and the iterative scene reaches a stable state after more than 70 rounds. There are scenes with large fluctuations in the iterative process, and the scene generation mechanism is difficult to explain.
In contrast, the score of the scene sequence generated by the interaction coding method can be obviously converged in 27 iterations, and the convergence score is close to the set pass threshold (60 points), indicating that the method can effectively mine high-interaction-risk scenes and improve the test challenge. At the same time, the method in this paper basically converges to a narrow interval (60–70) after 10 iterations, with small fluctuations, and finds the linear relationship between the scene score and the interaction state. The scene’s iteration optimization is more directional, and the scene’s difficulty control is more accurate.
6. Conclusions
In view of the uncertainty of the generation of interactive test scenarios for autonomous driving, this paper proposes a scene generation method based on interaction coding. Firstly, the concept of interaction coding is proposed, and scene iteration is guided by establishing the interactive state judgment method. The effectiveness of the method is verified in the unprotected left turn scene by combining CARLA simulation and overall vehicle trustworthiness evaluation. This method improves the probability of generating edge scenes and takes into account the correlation between them and simple scenes so as to realize the iterative generation and series transition from simple scenes to edge scenes. It integrates the optimization iteration of interactive scenes into the trustworthiness evaluation.
At present, there are problems, such as single verification scenes, limited data samples, and empirical iteration methods. The conservative interaction determination strategy using the TTC_diff index relies on the instantaneous calculation of speed and distance and is vulnerable to sensor errors and dynamic changes. There is a risk of ambiguous determination and missed determination in multi-vehicle complex interaction. In addition, the interaction coding design is mainly aimed at the background vehicles that can clearly interact with the EV, and the scalability in the multi-agent and mixed traffic environment is still limited; the method’s verification has not been migrated or verified in other simulation platforms or real road data, and there may be certain promotion obstacles. The sensitivity of scene iteration to parameter initialization has not been analyzed.
In the future, multi-task verification will be expanded, importance sampling will be combined to optimize unknown code type verification, and an intelligent scene iteration algorithm will be developed to improve optimization efficiency and trustworthiness evaluation efficiency. At the same time, this paper relies on key research and development projects, faces the key challenges of deployment and standardization verification in the real world, promotes the construction of an efficient testing platform and a general trustworthiness evaluation computing platform with national qualifications, and realizes the engineering implementation and standardized application of the method.
Author Contributions
Conceptualization, Y.C.; Methodology, Y.C.; Software, C.X.; Validation, C.X.; Investigation, Z.L.; Data curation, C.X. and Z.L.; Writing—original draft, C.X.; Writing—review & editing, Y.C. All authors have read and agreed to the published version of the manuscript.
Funding
This research was funded by the National Key R&D Program of China—Key Special Project of National Quality Infrastructure System (NQI)—Research on Key Technologies and Standards for Trustworthiness Evaluation of Human-Vehicle-Road Cooperative Unmanned Driving of National Key Research and Development Program (Project Number: 2022YFF0604900).
Institutional Review Board Statement
This research does not involve ethical approval.
Informed Consent Statement
Not applicable.
Data Availability Statement
The data is derived from the effectiveness of the CARLA simulation software. If necessary, you can contact the authors to obtain specific scene file data and simulation experiment data.
Conflicts of Interest
The authors declare no conflicts of interest.
Abbreviations
The following abbreviations are used in this manuscript:
| IC | Interaction coding |
| EV | Ego vehicle |
| IO | Interaction object |
| TTC_diff | Time-to-Collision Difference |
| KTS | Key time segment |
| EAM | Evade activation moment |
References
- Li, J.; Deng, W.; Ren, B.; Wang, W.; Ding, J. Automatic Driving Edge Scene Generation Method Based on Scene Dynamics and Reinforcement Learning. Automot. Eng. 2022, 44, 976–986. [Google Scholar]
- Kalra, N.; Paddock, S.M. Driving to safety: How many miles of driving would it take to demonstrate autonomous vehicle reliability? Transp. Res. Part A Policy Pract. 2016, 94, 182–193. [Google Scholar] [CrossRef]
- Wei, P.; Yuan, M. Construction of Car Following Critical Scenarios based on Natural Driving Data. China Auto 2023, 39–44. [Google Scholar]
- Rao, C.; Zhao, J.; Liu, C.; Sun, N.Y. Method of automatic driving testing case generation for AES scene. Mod. Electron. Tech. 2024, 47, 130–136. [Google Scholar]
- Chen, X.; Zhao, J.; Shi, Q.; Yang, Q. Test Cases Extraction for Autonomous Driving Autonomous Emergency Braking System Critical Scenarios. Sci. Technol. Eng. 2023, 23, 14660–14667. [Google Scholar]
- Feng, S.; Yan, X.; Sun, H.; Feng, Y.; Liu, H.X. Intelligent driving intelligence test for autonomous vehicles with naturalistic and adversarial environment. Nat. Commun. 2021, 12, 748. [Google Scholar] [CrossRef] [PubMed]
- Feng, S.; Sun, H.; Yan, X.; Zhu, H.; Zou, Z.; Shen, S.; Liu, H.X. Dense reinforcement learning for safety validation of autonomous vehicles. Nature 2023, 615, 620–627. [Google Scholar] [CrossRef] [PubMed]
- Karunakaran, D.; Berrio Perez, J.S.; Worrall, S. Generating Edge Cases for Testing Autonomous Vehicles Using Real-World Data. Sensors 2023, 24, 108. [Google Scholar] [CrossRef] [PubMed]
- Dong, Q.J. Fusion of Virtual and Real Simulation Research on Vehicle Dynamic Interaction in Cut-in Scenarios; Jilin University: Jilin, China, 2024. [Google Scholar]
- Krajewski, R.; Moers, T.; Nerger, D.; Eckstein, L. Data-Driven Maneuver Modeling using Generative Adversarial Networks and Variational Autoencoders for Safety Validation of Highly Automated Vehicles. In Proceedings of the 2018 21st International Conference on Intelligent Transportation Systems (ITSC), Maui, HI, USA, 4–7 November 2018; pp. 2383–2390. [Google Scholar]
- Wei, Z.; Huang, H.; Zhang, G.; Zhou, R.; Luo, X.; Li, S. Interactive Critical Scenario Generation for Autonomous Vehicles Testing Based on In-depth Crash Data Using Reinforcement Learning. IEEE Trans. Intell. Veh. 2024, 10, 1471–1482. [Google Scholar] [CrossRef]
- Hao, K.; Liu, L.; Cui, W.; Zhang, J.; Yan, S.; Pan, Y.; Yang, Z. Bridging data-driven and knowledge-driven approaches for safety-critical scenario generation in Automated Vehicle Validation. arXiv 2024, arXiv:2311.10937. [Google Scholar] [CrossRef]
- ISO/DIS 34502; Road Vehicles-Scenario-Based Safety Evaluation Framework for Automated Driving Systems. ISO: Geneva, Switzerland, 2021.
- Song, Q.; Tan, K.; Runeson, P.; Persson, S. Critical scenario identification for realistic testing of autonomous driving systems. Softw. Qual. J. 2023, 31, 441–469. [Google Scholar] [CrossRef]
- Althoff, M. Generating Critical Test Scenarios for Automated Vehicles with Evolutionary Algorithms. In Proceedings of the 2019 IEEE Intelligent Vehicles Symposium (IV), Paris, France, 9–12 June 2019; pp. 2352–2358. [Google Scholar]
- Wang, J.; Pun, A.; Tu, J.; Manivasagam, S.; Sadat, A.; Casas, S.; Ren, M.; Urtasun, R. AdvSim: Generating Safety-Critical Scenarios for Self-Driving Vehicles. In Proceedings of the IEEE/CVF Conference on Computer Vision and Pattern Recognition, Nashville, TN, USA, 20–25 June 2021; pp. 9909–9918. [Google Scholar]
- Chang, Y.; Zhou, S.; Xi, C. Scenario generation strategies for trustworthiness testing of autonomous vehicles. In Proceedings of the Transportation Research Board Annual Meeting (TRB), Washington, DC, USA, 5–9 January 2025. [Google Scholar]
- Lawitzky, A.; Althoff, D.; Passenberg, C.F.; Tanzmeister, G.; Wollherr, D.; Buss, M. Interactive scene prediction for automotive applications. In Proceedings of the 2013 IEEE Intelligent Vehicles Symposium (IV), Gold Coast, QLD, Australia, 23–26 June 2013; pp. 1028–1033. [Google Scholar]
- Chang, C.; Zhang, J.; Ge, J.; Zhang, Z.; Wei, J.; Li, L. Vista Scenario: Interaction Scenario Engineering for Vehicles with Intelligent Systems for Transport Automation. IEEE Trans. Intell. Veh. 2024, 1–17. [Google Scholar] [CrossRef]
- Birkemeyer, L.; Pett, T.; Vogelsang, A.; Seidl, C.; Schaefer, I. Feature-Interaction Sampling for Scenario-based Testing of Advanced Driver Assistance Systems. In Proceedings of the 16th International Working Conference on Variability Modelling of Software-Intensive Systems, Florence, Italy, 23–25 February 2022; Association for Computing Machinery: New York, NY, USA; pp. 1–10. [Google Scholar]
- Essa, M.; Sayed, T. Full Bayesian conflict-based models for real-time safety evaluation of signalized intersections. Accid. Anal. Prev. 2019, 129, 367–381. [Google Scholar] [CrossRef] [PubMed]
- Zheng, L.; Sayed, T. Comparison of Traffic Conflict Indicators for Crash Estimation using Peak Over Threshold Approach. Transp. Res. Rec. 2019, 2673, 493–502. [Google Scholar] [CrossRef]
- Ni, Y.; Qi, X.; Hang, P.; Zhou, D.; Sun, J. Analysis of Autonomous Vehicles Interaction Strategy in Unprotected Turn Scenarios. China J. Highw. Transp. 2023, 36, 271–287. [Google Scholar]
- Wang, S.; Sun, G.; Ma, F.; Hu, T.; Qin, Q.; Song, Y.; Zhu, L.; Liang, J. DragTraffic: Interactive and Controllable Traffic Scene Generation for Autonomous Driving. In Proceedings of the 2024 IEEE/RSJ International Conference on Intelligent Robots and Systems (IROS), Abu Dhabi, United Arab Emirates, 14–18 October 2024; pp. 14241–14247. [Google Scholar]
- Yan, S.; Zhang, X.; Hao, K.; Xin, H.; Luo, Y.; Yang, J.; Fan, M.; Yang, C.; Sun, J.; Yang, Z. On-Demand Scenario Generation for Testing Automated Driving Systems. arXiv 2025, arXiv:2505.14053. [Google Scholar] [CrossRef]
- Zhang, X.; Tao, J.; Tan, K.; Törngren, M.; Gaspar Sánchez, J.M.; Ramli, M.R.; Tao, X.; Gyllenhammar, M.; Wotawa, F.; Mohan, N.; et al. Finding Critical Scenarios for Automated Driving Systems: A Systematic Mapping Study. IEEE Trans. Softw. Eng. 2023, 49, 991–1026. [Google Scholar] [CrossRef]
- Wang, X.; Luo, L. Traffic Conflict Characteristics and Influential Factors at Signalized Intersections. Trans. Res. Record 2016, 14, 60–66. [Google Scholar] [CrossRef]
- Tarek, S.; Sany, Z. Traffic Conflict Models and Standards for Signalized and Unsignalized Intersections. In Proceedings of the Canadian Society for Civil Engineering Annual Conference, Halifax, NS, Canada, 10–13 June 1998; pp. 303–313. [Google Scholar]
- Dixit, A.; Jain, M. Trajectory Data Driven Driving Style Recognition for Autonomous Vehicles Using Unsupervised Clustering. Commun. Appl. Nonlinear Anal. 2024, 31, 715–723. [Google Scholar] [CrossRef]
- Norzam, M.N.; Karjanto, J.; Yusof, N.M.; Hasan, M.Z.; Zulkifli, A.F.; Sulaiman, S.; Ab Rashid, A.A. A Review on Driving Styles and Non-Driving Related Tasks in Automated Vehicle. J. Soc. Automot. Eng. Malays. 2022, 6, 152–165. [Google Scholar]
- Chang, Y.T.; Zhang, B.H.; Zhou, S.Q. Research on scenario-based trustworthiness evaluation method of autonomous vehicles. In Proceedings of the Ninth International Conference on Electromechanical Control Technology and Transportation (ICECTT 2024), Guilin, China, 24–26 May 2024. [Google Scholar]
Figure 1.
Scene abstraction hierarchy based on interaction coding.
Figure 1.
Scene abstraction hierarchy based on interaction coding.
Figure 3.
Dynamic change curves of TTC_diff between the EV and IOs in 9 interaction states. (Note: If the EV passes interaction points earlier than IOs, there will be no KTS and no data output).
Figure 3.
Dynamic change curves of TTC_diff between the EV and IOs in 9 interaction states. (Note: If the EV passes interaction points earlier than IOs, there will be no KTS and no data output).
Figure 4.
Schematic diagram of the elimination of the influence of the previous interaction in KTS. (a) KTS with previous interaction; (b) KTS without previous interaction.
Figure 4.
Schematic diagram of the elimination of the influence of the previous interaction in KTS. (a) KTS with previous interaction; (b) KTS without previous interaction.
Figure 5.
Interactive-state-driven scene parameter optimization direction.
Figure 5.
Interactive-state-driven scene parameter optimization direction.
Figure 6.
Real-time traffic video stream data. (Note: The information in the picture is: Wednesday, 26 March 2025).
Figure 6.
Real-time traffic video stream data. (Note: The information in the picture is: Wednesday, 26 March 2025).
Figure 7.
Three-link code actual measurement case diagram. (a–c): Three- link vehicles code; (d–f): Three- link pedestrians code.
Figure 7.
Three-link code actual measurement case diagram. (a–c): Three- link vehicles code; (d–f): Three- link pedestrians code.
Figure 8.
Petri net structure diagram of scene generation based on interaction coding.
Figure 8.
Petri net structure diagram of scene generation based on interaction coding.
Figure 9.
Initial scene setting logic diagram.
Figure 9.
Initial scene setting logic diagram.
Figure 10.
Scene generation and testing framework.
Figure 10.
Scene generation and testing framework.
Figure 11.
Network of town05 scene building and the primary model.
Figure 11.
Network of town05 scene building and the primary model.
Figure 12.
Trustworthiness evaluation index system of autonomous vehicles.
Figure 12.
Trustworthiness evaluation index system of autonomous vehicles.
Figure 13.
Scene sequence trustworthiness score line.
Figure 13.
Scene sequence trustworthiness score line.
Figure 14.
Schematic diagram of overtaking scene. (Note: The red line is the overtaking trajectory of EV, and the blue line is the driving trajectory of IOs).
Figure 14.
Schematic diagram of overtaking scene. (Note: The red line is the overtaking trajectory of EV, and the blue line is the driving trajectory of IOs).
Figure 15.
Overtaking scene trustworthiness score sequence diagram.
Figure 15.
Overtaking scene trustworthiness score sequence diagram.
Figure 16.
Linear regression relationship between III and ATV score.
Figure 16.
Linear regression relationship between III and ATV score.
Figure 18.
Trustworthiness score trend line.
Figure 18.
Trustworthiness score trend line.
Figure 19.
Interactive judgment precision–recall performance curve.
Figure 19.
Interactive judgment precision–recall performance curve.
Figure 20.
Score convergence sequence diagram of two methods.
Figure 20.
Score convergence sequence diagram of two methods.
Table 1.
Comparison of mainstream generation methods for autonomous driving edge scenarios.
Table 1.
Comparison of mainstream generation methods for autonomous driving edge scenarios.
| Representative Methods | Main Idea | Computational Cost | Adaptability to New
Environments |
|---|
| Data-driven method [8] | Extract driving behavior and environmental parameters from real data, learn motion characteristics, such as vehicle trajectory, and generate high-risk test scenarios. | Medium: Requires a large amount of data cleaning and labeling | Weak: Requires re-collection and training for new scenarios |
| Mechanism modeling method [14] | Generate edge test scenarios through optimized search or reinforcement learning. Identify and generate potential dangerous scenarios by combining specific driving strategies. | High: High model complexity and high simulation cost | Medium: Requires redefinition of interaction logic |
| Critical state division [15] | Model and divide the dangerous boundaries of the scene to accelerate the automatic driving scene test. | Low: Simple calculation, suitable for rapid screening | Weak: Difficult to adapt to complex interaction changes |
| Importance sampling [4] | Focus on scenarios that are at the tail of the probability distribution and have a significant impact on the safety and trustworthiness assessment of the system. | Medium: High sampling efficiency but requires post-processing | Weak: Requires redefinition of distribution and sampling strategy |
| Adversarial testing [16] | Simulate extreme environments and driving behaviors to test the robustness of vehicles in complex and uncertain situations. | Extremely high: Unstable training and high resource consumption | Strong: Has certain generalization ability |
Table 2.
Interaction coding combination table.
Table 2.
Interaction coding combination table.
Table 3.
Probability of driving style selection for motor vehicles.
Table 3.
Probability of driving style selection for motor vehicles.
| Driving Style | Velocity (m/s) | Probability | Acceleration (m/s2) | Probability |
|---|
| Aggressive | [11.31, 21.37] | 0.069 | [0.85, 1] | 0.274 |
| Moderate | [8.7, 16.63] | 0.455 | [0.65, 0.8] | 0.312 |
| Traditional | [8.61, 15.27] | 0.476 | [0.45, 0.65] | 0.415 |
Table 4.
Scene sequence interaction state table.
Table 4.
Scene sequence interaction state table.
| IO | A1_vehicle_001 | A1_vehicle_002 | A2_vehicle_003 | P1_pedestrian_001 |
|---|
| Iteration | TTC_diff | Status | TTC_diff | Status |
|---|
| 1 | 0.5204 | 0 | 1.7927 | 0 |
| 2 | 0.0277 | 1 | 3.9187 | 0 |
| 3 | 0.1974 | 0 | 1.1857 | 0 |
| 4 | 0.1696 | 1 | 6.5893 | 2 |
| 5 | 0.2922 | 1 | 6.6224 | 2 |
| 6 | 0.111 | 1 | 3.177 | 2 |
| 7 | 0.0822 | 1 | 13.3183 | 2 |
| 8 | 0.0418 | 1 | 5.3033 | 2 |
| 9 | 0.0119 | 1 | 20.5335 | 2 |
| 10 | 1.176 | 2 | 8.0078 | 2 |
| 11 | 0.0396 | 1 | 5.2096 | 2 |
| 12 | 1.0939 | 2 | 2.4202 | 2 |
| 13 | 0.0954 | 1 | 2.2911 | 2 |
| 14 | 0.2679 | 1 | 5.701 | 2 |
| 15 | 0.0392 | 1 | 5.039 | 2 |
| 16 | 0.9148 | 1 | 1.2712 | 2 |
| 17 | 0.0953 | 1 | 3.4439 | 2 |
| 18 | 0.0742 | 0 | 0.9151 | 1 |
| 19 | 0.7142 | 1 | 3.2649 | 2 |
| 20 | 0.0518 | 1 | 1.2999 | 2 |
| 21 | 0.6455 | 1 | 2.2342 | 2 |
| 22 | 0.0364 | 1 | 0.3496 | 1 |
| 23 | 0.4766 | 1 | 4.6047 | 2 |
| 24 | 0.5085 | 1 | 2.7609 | 2 |
| 25 | 0.3635 | 1 | 0.7808 | 1 |
| 26 | 0.7081 | 1 | 1.6162 | 2 |
| 27 | 0.1794 | 1 | 0.8708 | 1 |
Table 5.
Weight of indicators at all levels.
Table 5.
Weight of indicators at all levels.
Secondary
Indicator | Secondary Weight | Tertiary
Indicator | Tertiary Weight | Quaternary Indicator | Quaternary Weight |
|---|
| Safety and Controllability | 0.64 | Safety | 0.74 | S1 | Circuit breaker |
| S2 | 0.49 |
| S3 | 0.51 |
| Reliability | 0.26 | R | 1 |
| Autonomy and Efficiency | 0.36 | Efficiency | 0.67 | EF | 1 |
| Comfort | 0.33 | CF1 | 0.54 |
| CF2 | 0.32 |
| CF3 | 0.14 |
Table 6.
Sensors and data types.
Table 6.
Sensors and data types.
| Sensor | Output Data | Remarks |
|---|
| IMU | timestamp | Simulation world time |
| accelerometer | 3D linear acceleration |
| gyroscope | 3D angular velocity |
| Collision | other_actor_id | Collision participant number |
| Obstacle | distance | Distance to the object in front |
| other_actor_id | Number of the object in front |
| Velocity | velocity | Driving speed |
| Location | location | 3D coordinates of the object in the simulation world |
Table 7.
Comparison of scene generation methods of simulated annealing and interaction coding.
Table 7.
Comparison of scene generation methods of simulated annealing and interaction coding.
| Index | Environmental Parameters + Simulated Annealing | Interaction Coding + TTC_diff |
|---|
| Iteration efficiency | 70 + sequence convergence | Converged in 30 iterations |
| Convergence score | High score (80–90), insufficient challenge | Boundary score (60–70), closer to the critical point |
| Volatility | Individual extreme points; the volatility is large | The convergence interval is narrow; the volatility is ≤5 points |
| Disclaimer/Publisher’s Note: The statements, opinions and data contained in all publications are solely those of the individual author(s) and contributor(s) and not of MDPI and/or the editor(s). MDPI and/or the editor(s) disclaim responsibility for any injury to people or property resulting from any ideas, methods, instructions or products referred to in the content. |
© 2025 by the authors. Licensee MDPI, Basel, Switzerland. This article is an open access article distributed under the terms and conditions of the Creative Commons Attribution (CC BY) license (https://creativecommons.org/licenses/by/4.0/).

