Article

Channel Optimization of Sandwich Double-Sided Cold Plates for Electric Vehicle Battery Cooling

1
School of Mechatronics Engineering, Korea University of Technology and Education, Cheonan 31253, Republic of Korea
2
Department of Mechanical Design Engineering, Korea University of Technology and Education, Cheonan 31253, Republic of Korea
*
Author to whom correspondence should be addressed.
Appl. Sci. 2025, 15(19), 10653; https://doi.org/10.3390/app151910653
Submission received: 9 September 2025 / Revised: 27 September 2025 / Accepted: 30 September 2025 / Published: 1 October 2025

Abstract

Electric vehicle (EV) battery thermal management systems have gradually improved owing to the increasing power demand of EVs. This study aims to optimize the channel geometry of sandwich double-sided cold plates for EV battery cooling under 100% state of charge and 2C-rate charging conditions. For precise and accurate optimization, the conventional one-dimensional analysis model of the sandwich double-sided cold plate was converted into a three-dimensional computational fluid dynamics (CFD) model. Non-dimensional parameters were selected as the main variables of the channel geometry, and nine additional channel shapes were derived based on them. Battery modules with the derived channel shapes were subjected to CFD analysis in the Reynolds number range of 500 to 20,000. The goodness factor was calculated from these correlations, and optimization was performed using the Taguchi method. The results revealed that the wetted area of the channel had a greater impact on battery cooling than the number of channels. This study proposed more generalized design guidelines by employing non-dimensionalized parameters across a wide range of Reynolds numbers. The rectangular channel-based correlations developed in this study showed improved prediction accuracy compared to conventional annular pipe-based correlations and are expected to be applicable to various battery thermal management system designs in the future.

1. Introduction

This study aims to improve energy utilization in electric vehicles (EVs), which are considered to be one of the alternatives to address environmental problems caused by greenhouse gas (GHG) emissions from internal combustion engine vehicles [1].
The EV industry plays a key role in achieving the targets outlined in the Nationally Determined Contribution. Countries that produce EVs have made efforts to tackle global environmental issues by setting GHG reduction goals and reporting progress toward those goals. As a result, the EV industry has grown rapidly worldwide through their increased adoption as an alternative to internal combustion engine vehicles [2].
To ensure sufficient mileage for EV operation, several research areas have been explored, including reducing charging time [3], increasing energy density relative to battery volume [4], improving motor efficiency [4], and advancing human-centered design technologies. Among these, human-centered design has emerged as a factor that increases power consumption in EV batteries [1]. According to a study by Evtimov et al. [2], auxiliary systems for user comfort account for up to 30–35% of total EV battery power consumption.
This highlights the importance of human-centered design in EV battery system development. Accordingly, there is a growing need for the development of air-conditioning systems and high-speed charging technologies that enhance user safety, convenience, and comfort.
In particular, research on charging is essential, as it is closely related to critical issues such as battery explosions, reduced energy efficiency, and shortened battery life. Therefore, this study utilized 2C-rate charging conditions at 100% state of charge, where the potential for thermal runaway and fire is high [5,6].
Previous research has investigated commercialized EV battery thermal management systems (BTMSs) at the cell, module, and pack levels, as precise identification and efficient control of thermal behavior at each level along the heat transfer path, from cells to modules and packs, are essential.

1.1. Background

The EV battery pack consists of cells, which form the lowest hierarchical level. Cells are grouped to form modules, and modules are assembled to produce a pack, as shown in Figure 1 [7]. In existing research on thermal analysis at the cell level, the analysis of physical properties and electrochemical changes inside battery cells is an important focus.
Pack-level analysis corresponds to a system-level model that involves many computational nodes owing to complex components and large volumes. Therefore, some studies have been limited to module-level analysis because of restricted computational resources [8]. Therefore, most models have been simplified using one-dimensional (1D) simulations, which leads to limitations in the accuracy of analysis. In this study, however, sufficient computational resources were secured, enabling the construction and analysis of medium- and large-scale three-dimensional (3D) computational fluid dynamics (CFD) models at both the module and pack levels.
Hettesheimer et al. [9] classified EV battery cooling systems into four representative methods (Figure 2).

1.2. Research Cases

The air-cooling method was primarily used in early battery systems. Although it offered advantages such as a simple structure and low cost, it is now rarely employed owing to its low heat transfer performance.
The indirect liquid-cooling method has been the most actively commercialized. It dissipates heat generated by battery cells by circulating coolant through cold plates located at the bottom or on both sides of the cells. This method can be subdivided into single-sided and double-sided cooling, depending on the placement of the cold plates.
Several studies recommend the double-sided cooling structure for its ability to reduce average cell temperature and effectively control temperature distribution across cells [5,10,11,12,13,14].
The phase change material (PCM) cooling method absorbs heat generated from batteries through the phase transition of PCMs. However, as PCMs cannot dissipate the absorbed heat externally, an auxiliary indirect liquid-cooling system is required. Even in such configurations, the double-sided cooling structure is preferred for its efficiency in discharging heat from the PCM to the surroundings. In fact, several PCM-related studies have applied the double-sided cooling structure as an indirect cooling method [11,12,13].
The immersion cooling method cools battery cells by directly immersing them in insulating coolant oil. Although this method provides excellent cooling performance, its commercial use remains limited owing to the system’s large volume and weight, along with insufficient long-term stability data.
Previous research efforts related to channel optimization are summarized below.
At the battery cell level, several studies have underscored key considerations and limitations. Zhang et al. [15] emphasized the significance of internal heating in cells through an electrochemical equivalent circuit model. Liu et al. [16] incorporated entropy correction using experimental data and enabled thermal analysis by assuming a constant convective heat transfer coefficient when temperature variation was below 5 °C. However, this assumption may lead to inaccuracies. Aruna et al. [17] summarized existing EV battery cell-level models and emphasized the need for pack-level battery management systems.
Given that research at the cell level does not account for integrated heat exchangers such as cold plates, such results have limited applicability to real-world thermal management. Effective EV thermal management requires comprehensive heat control at the module level, where cells are placed between cold plates containing coolant channels. Recent studies have demonstrated that double-sided sandwich cold plates offer the most effective thermal control. Consequently, battery packs in commercial EVs are typically built from modules employing double-sided cold plates.
Saw et al. [18] simplified and modeled an air-cooled EV battery cell without a separate heat exchanger. For the simplified single battery cell model, thermo-electro-mechanical coupling analysis was conducted at the EV battery cell level. Based on the results, CFD analysis was conducted at the EV battery module level, at a higher level, and the results were analyzed.
Bamrah et al. [19] analyzed the effects of the inflow temperature and speed change on cooling performance under the discharge conditions of 1C to 3C rate for the air-cooling method. They compared cooling performance under various conditions and evaluated thermal behavior according to the speed and temperature of the coolant.
Ma et al. [8] utilized a 3D CFD simulation for the A123 Hymotion™ L5 pack, which is an EV battery pack. The EV battery pack level is the largest scale in the EV battery system. They analyzed the temperature distribution under charge and discharge conditions. However, owing to the limited analysis resources, only the cell and module levels were analyzed except for the pack level. Three-dimensional CFD simulation at the EV pack level requires substantial analysis resources. Therefore, previous studies performed 1D simulations by simplifying models by introducing various assumptions.
Shang et al. [20] applied the indirect liquid cooling method and optimized the cold plate width, flow rate, and coolant temperature through the design of experiment (DOE). They reported volume expansion and difficulty in encapsulation as the drawbacks of PCMs and also indicated their limitations in terms of practical application. Commercialized EV battery thermal management systems primarily adopt the indirect liquid-cooling method. The type of indirect liquid cooling method varies depending on the location and number of cold plates based on the battery module or pack.
Yi et al. [10] compared bottom and double-sided cooling structures in PCM-based systems, reporting better cooling and heating performance for the double-sided configuration. Cai et al. [11] evaluated the double-sided liquid cooling structure and found that it provided good thermal uniformity, with a maximum internal cell temperature of 39.75 °C and temperature difference of 4.91 °C. Madaoui et al. [12] found that double-sided cooling reduced average temperature by 6 °C and cooling time by 44%, compared to bottom cooling. In their study, bottom cooling (i.e., single-sided cooling) was defined as a configuration with a cold plate located beneath the battery module. By contrast, the double-sided structure incorporates multiple cold plates with internal channels surrounding the module.
Li and Zhang [13] compared natural convection, single-sided, and double-sided cooling. They reported that double-sided cooling maintained a maximum temperature of 41.7 °C, while the others exceeded 50 °C under a 5 W heating condition. Zhao et al. [14] also reported high temperature uniformity and superior cooling for the double-sided design under discharge conditions. Chung and Kim [5] conducted pack-level analysis using 1D simulation and assessed the impact of fin arrangements on cooling performance.
Recently, diverse cooling structures have been proposed to expand the effective heat transfer area. The double-sided cooling structure, in particular, has been adopted in high-end and next-generation EVs [21,22,23]. In addition to superior thermal performance, the sandwich structure supports the battery mechanically, allowing for higher battery density [23]. Future developments in EV BTMSs are expected to favor structures with larger wetted areas and independent cold plates for individual module and cell temperature control. In this context, the double-sided sandwich structure, which can also function as a battery frame, offers advantages over conventional bottom cooling systems and warrants further investigation.
Based on the aforementioned discussion, this study focuses on optimizing the cold plate channel geometry in the double-sided structure of the indirect liquid cooling method, the most commercialized configuration to date [10,11,12,13,14,15,16,17,18,19,20,21,22,23]. One area of recent research in electric vehicle batteries is optimization of cold plate channel geometry for battery cooling. The following papers illustrate this trend. Gao et al. [24] optimized the channel height within a range of 1 to 3 mm, maintaining a constant battery heat generation. The average height was 2 mm, with a minimum height of half (0.5 times) and a maximum height of 1.5 times. Mokhtari and Jalalvand [25] compared the performance changes by increasing the channel cross-sectional area up to 1.4 times. Zhang et al. [26] optimized the ratio of cold plate top thickness to channel height within a range of 0.16 to 21.
As such, previous studies have generally demonstrated superior performance of sandwich (double-sided) cold plates. Recently, a growing number of studies have attempted direct optimization by considering geometric factors such as the channel width, height, spacing, and top plate thickness as design variables. However, there are still shortcomings.
First, there are a few general design guidelines applicable across a wide Reynolds number range.
Second, nondimensionalized variables have not been widely used in optimization to apply research results to general, rather than specific, geometries.
Third, few optimization cases have utilized comprehensive metrics, such as the goodness factor, that consider both thermal performance and power.
Therefore, this study aims to fill this gap by presenting a module-level optimal design and correlations for rectangular channel cold plates using a dimensionless design space and comprehensive performance metrics. To address this deficiency, this study performed detailed CFD analysis and optimization of channel geometry at the module level using high computational resources. Based on the results, a second-stage analysis was conducted at the pack level to evaluate cooling performance in both single-sided and double-sided sandwich structures.

2. Methodology

This study aims to determine the optimized channel geometry that achieves the highest cooling efficiency for a battery pack. It is based on the results of research by Chung and Kim [5] on an EV battery pack 1D model using the CFD method. Chung and Kim’s [5] cell fin and cold plate structure was implemented as a 3D model to optimize the channel geometry using CFD, and non-dimensionalized parameters ( p , w / w m a x , and h/t) were selected as key variables. A DOE was prepared using these parameters, and Nusselt number and Fanning friction factor (f-factor) correlations were developed.
The Nusselt number reflects only the heat dissipation characteristics of the cold plate, while the f-factor reflects only the dynamic characteristics. Therefore, a goodness factor that considers both thermal dissipation and flow resistance was calculated to derive the optimized channel geometry.
The channel geometry optimization process is shown in Figure 3. Two key processes are involved: conversion to a 3D model (validation) and channel optimization.
The 3D model conversion (validation) involves generating a 3D CFD model of the EV battery with a sandwich cooling structure. First, the 1D simulation model developed by Chung and Kim [5] was constructed using 3D meshing.
After selecting the average temperature and total pressure drop from the 1D simulation as target parameters, a grid dependency analysis was conducted, and a 3D model was finalized. More details on the grid dependency analysis are provided in Section 4.1. The subcomponents modeled in 3D, material properties, and governing equations are summarized in Section 3.5.
Channel optimization was performed by applying DOE to the modules of the validated 3D CFD pack model. Among various DOE approaches, the Taguchi method was selected to minimize the number of simulations required. For channel optimization, the h value inside the channel was calculated, and both thermal and hydraulic correlations were derived. The goodness factor for each channel design was calculated based on these correlations, and statistical techniques were applied to determine the optimal geometry.
The boundary conditions for channel optimization are described in Section 3.2, and the Taguchi DOE model is described in Section 3.4.

3. Numerical Method

In this study, correlations based on double-sided cold plate geometry parameters were developed for geometry optimization, and the boundary conditions for cold plate optimization were derived. Additionally, the CFD model was defined, and the geometry corresponding to each parameter level was efficiently generated using the Taguchi method.
To develop the correlations, a modular unit model was created to calculate the heat dissipation and dynamic characteristics of double-sided cold plates. A pack unit model was also constructed to validate the CFD model and optimize the fin geometry inside the channel.
This section describes the developed 3D CFD model and defines the governing equations for the cooling fluid flow inside double-sided cold plates.
Previous studies, as well as this study, confirm the need for further research on double-sided cold plate structures for battery cooling. Trends in the EV industry and results from patent surveys indicate that research on BTMS configurations has progressed toward integrating cooling and support structures and increasing the heat transfer area in sandwich-type double-sided cold plates [23,27].

3.1. Pack-Level Boundary Conditions

For geometry configuration and analysis, the following conditions were applied.
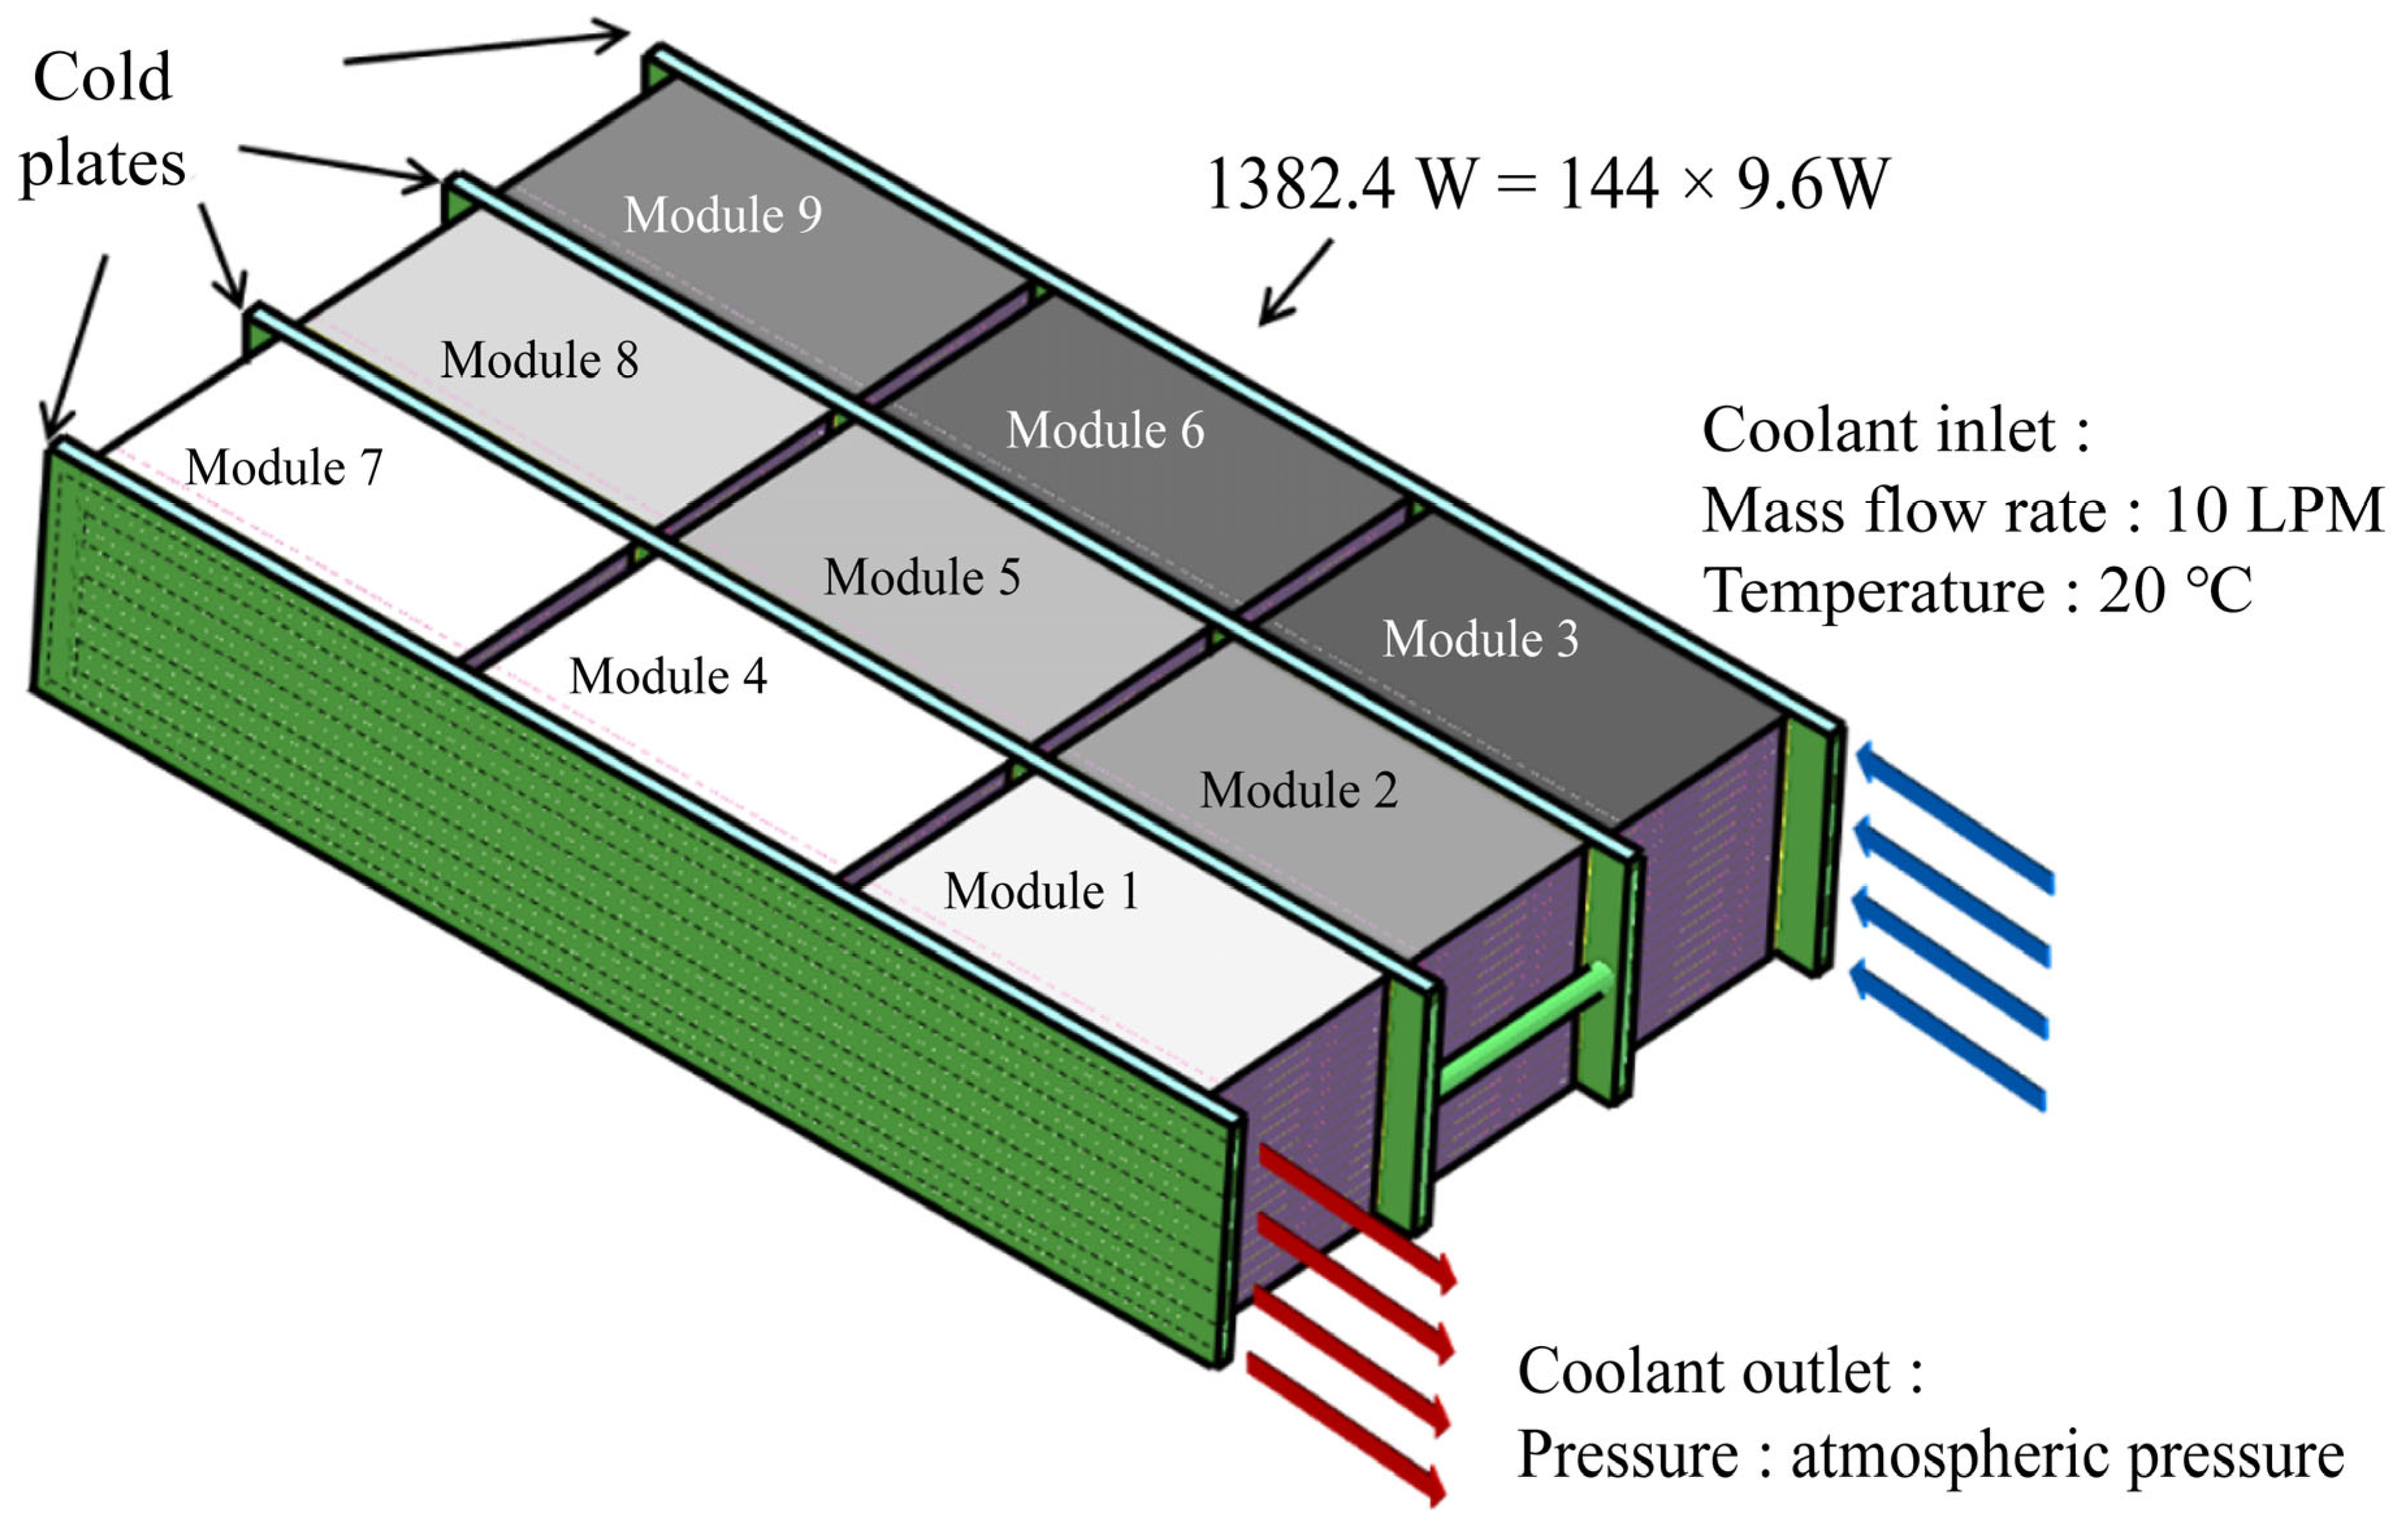
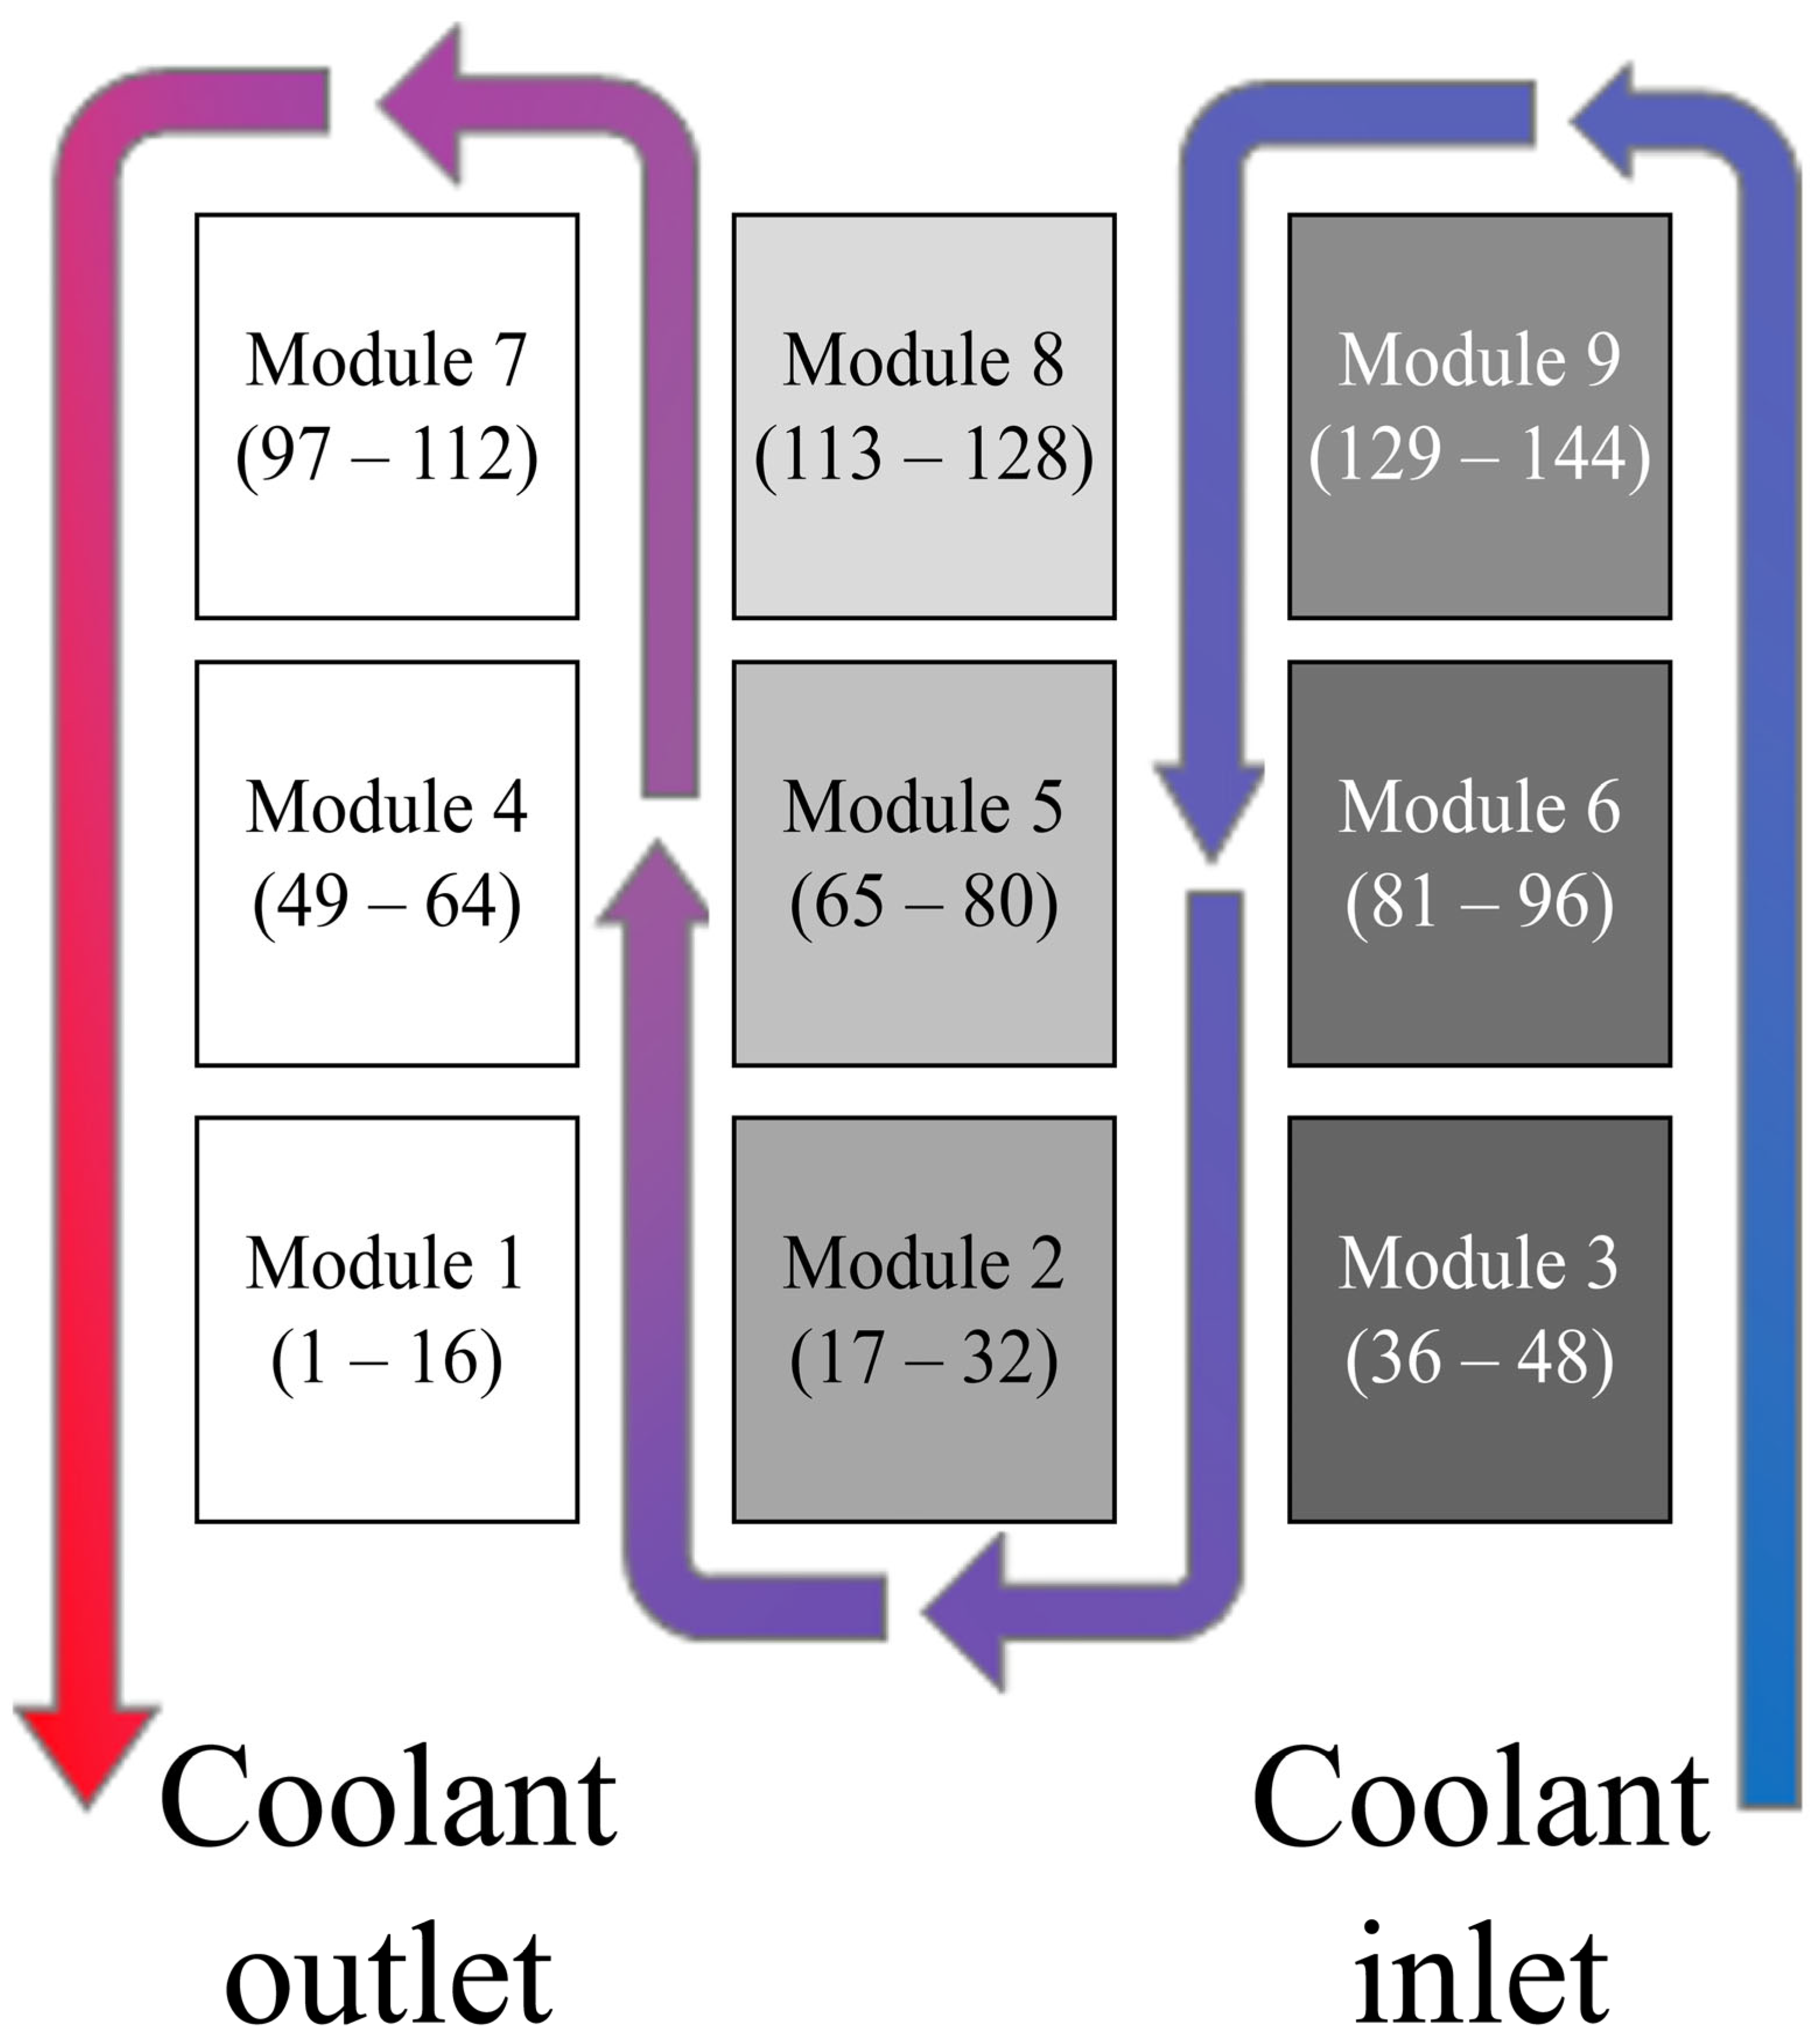
The pack unit model consists of four cold plates and nine battery modules, with three modules placed between each cold plate. Thus, one pack comprises a total of nine modules. The pack includes 144 cells in total, and a heating load of 1382.4 W was applied at 2C-rate charging. The cold plate, module arrangement, and cooling channel structure were implemented in the 3D CFD model based on the 1D model by Chung and Kim [5], as shown in Figure 4 and Figure 5 [5].
The mass flow rate was specified as the inlet condition, with a flow rate of 10 LPM [5]. The coolant temperature was set to 20 °C, and a pressure outlet at atmospheric pressure was applied as the outlet condition.

3.2. Module-Level Boundary Conditions

The 3D CFD model requires more computational resources than the 1D model but offers improved accuracy. To balance accuracy and computational efficiency, symmetric boundary conditions were applied using the horizontal and vertical symmetry of the battery module in the double-sided cooling method.
Each module contains 16 battery cells. As each battery cell generates 9.6 W of heat under 2C-rate charging [5], the total heating value per module is 153.6 W. Given the symmetry shown in Figure 6, boundary conditions were applied to a 1/4 model, and accordingly, a quarter of the total heating value (38.4 W) was applied.
Channel flow was divided by the number of channels and introduced into the cold plate using the same inlet geometry as the channel dimensions. The flow paths merged into one outlet after passing through the module. The inlet length was set to ensure fully developed flow, both thermally and hydraulically.
Eight inlet conditions (Reynolds number (Re) = 500, 1000, 2500, 5000, 7500, 10,000, 15,000, and 20,000) were applied using the mass flow rate method. The coolant temperature was set to 20 °C, and the outlet boundary condition was set to atmospheric pressure.

3.3. Fincell Arrangements

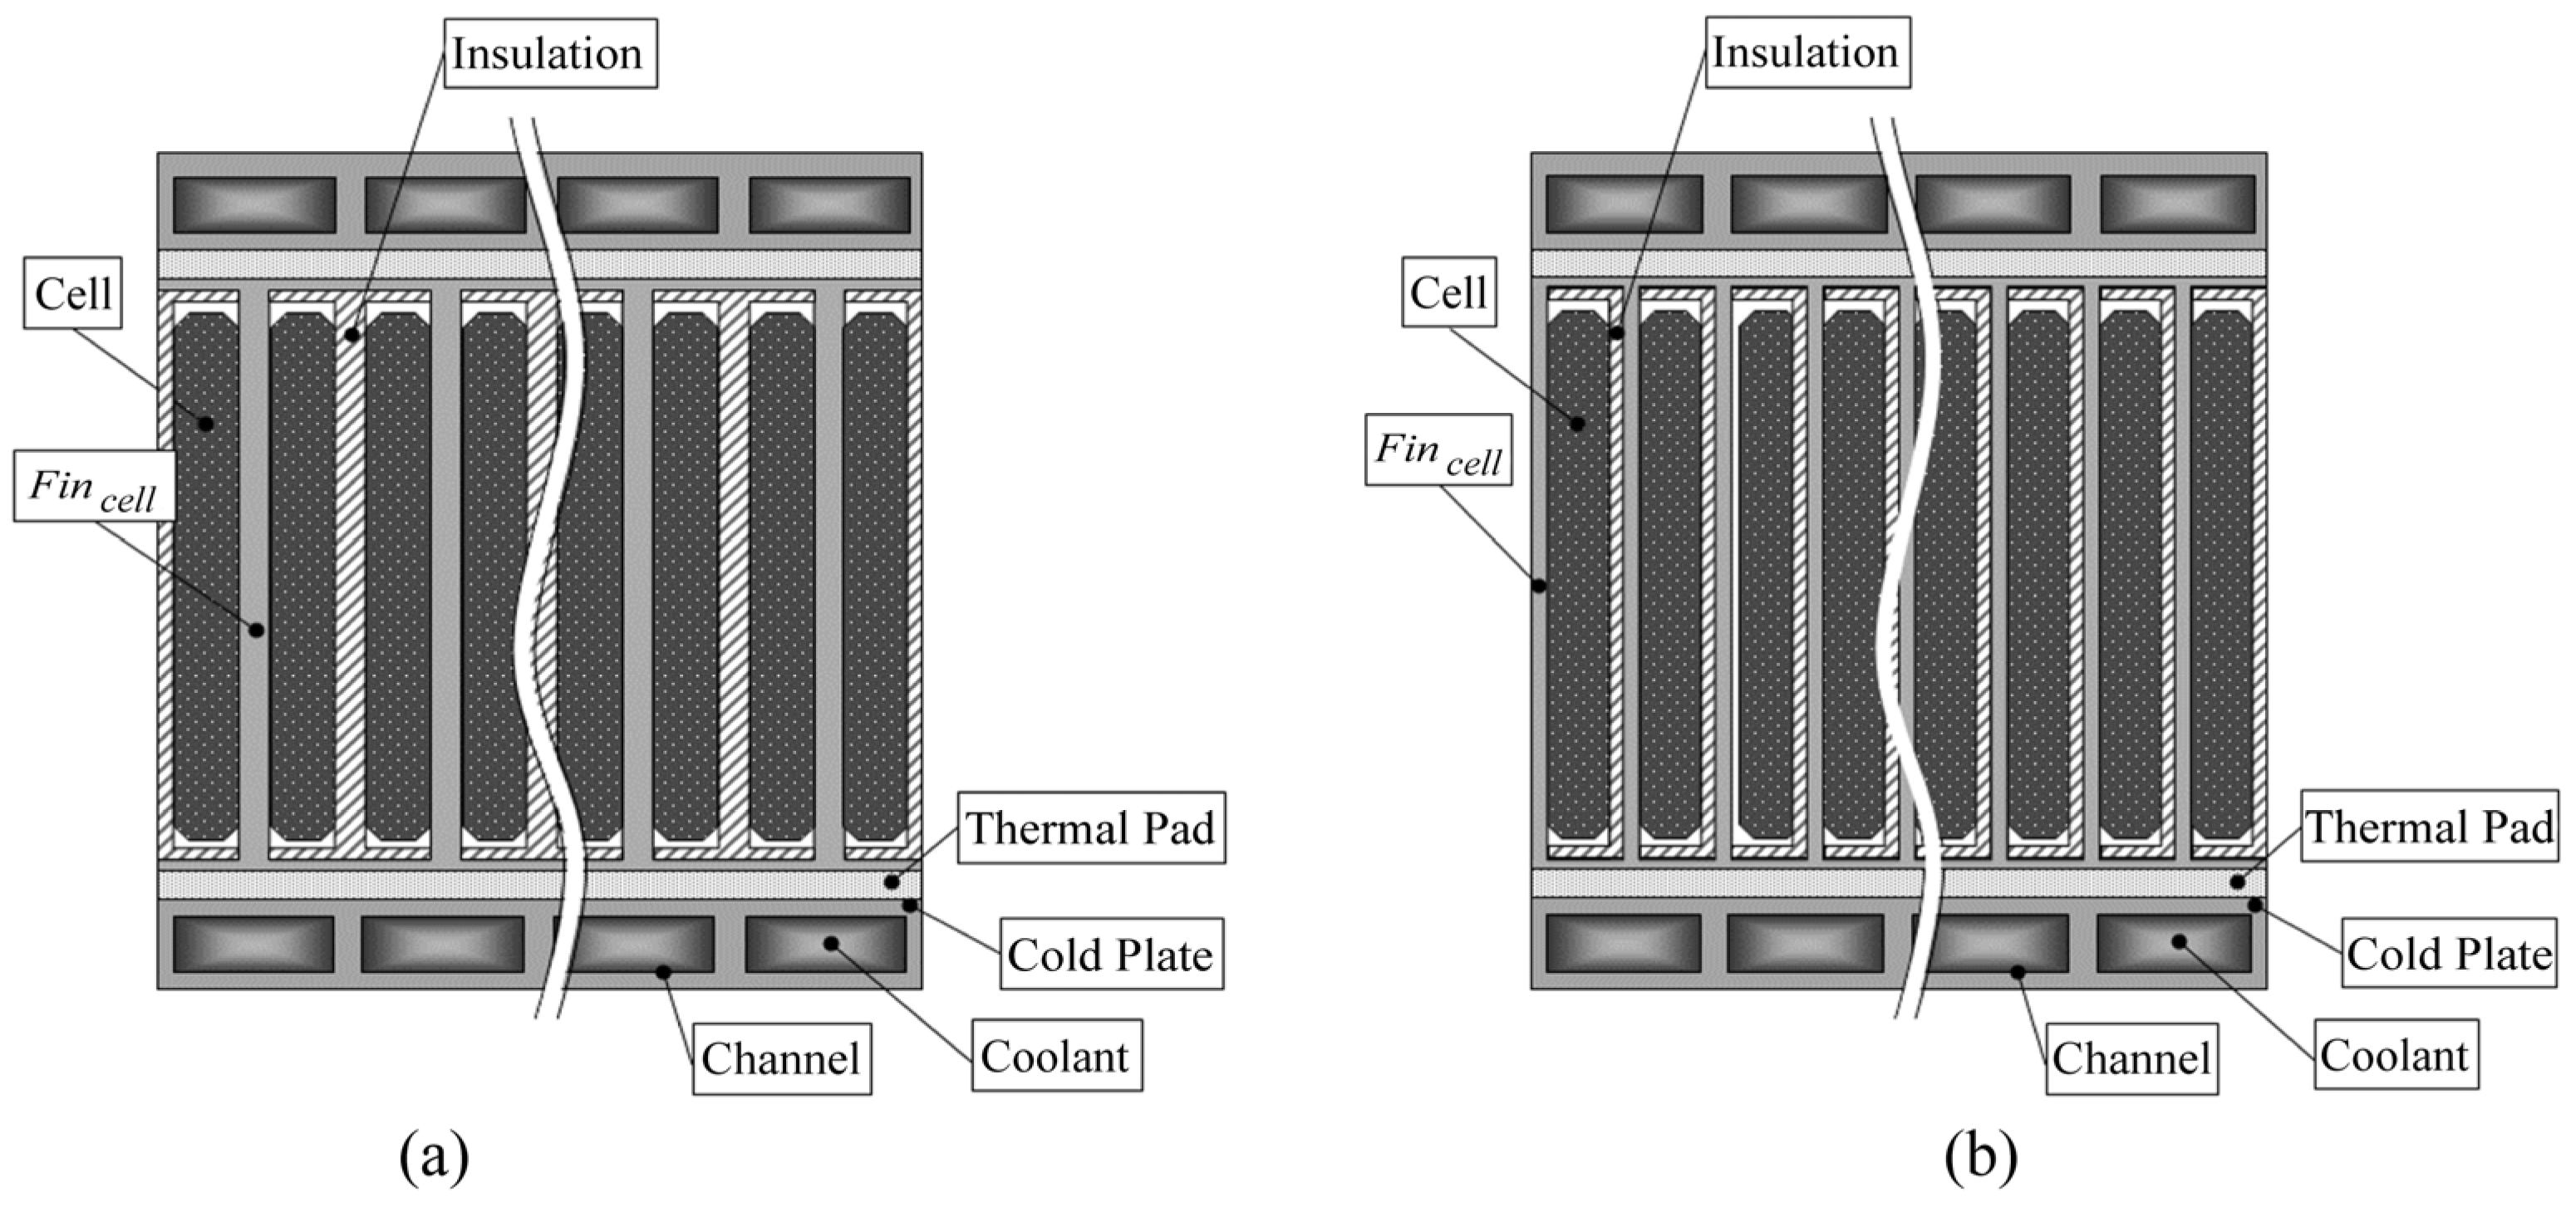
The F i n c e l l applied to the cells in each module was categorized into symmetry and asymmetry F i n c e l l arrangements, depending on their structural configuration. The asymmetry F i n c e l l arrangement causes significant temperature differences between cells and, therefore, is not suitable for commercialization. For this reason, both arrangements were used during the grid dependency stage, but only the symmetry F i n c e l l arrangement was used for channel optimization (Figure 7).
In the channel optimization process, the asymmetry F i n c e l l configuration was included based on the results of Chung and Kim [5], to improve the accuracy of geometry validation. Additionally, validation was conducted in terms of pressure drop through comparison with previous research results. In this process, grid suitability and cell average temperature were used as validation indicators.

3.4. Orthogonal Array for Channel

To determine the hydraulic diameter and number of channels, we investigated additional prior studies. (Table 1.) The average of the hydraulic diameter (Dh) values presented in prior studies, 0.093 m, was selected as the representative value. By multiplying the representative value by 0.5 and 1.5, the hydraulic diameter range of 0.005–0.014 m was obtained. Based on prior studies, the number of channels was selected as 2–6. Since this study uses a rectangular channel, as shown in Figure 8, Dh was decomposed into w, h, and t components. Based on previous studies, the parameters W , N, w , h, and t were selected as the primary geometric factors for the cold plate in the thermal management system of the EV battery pack. The research results were non-dimensionalized so that they can be used generally regardless of scale. These parameters were non-dimensionalized as p , w / w m a x , and h/t. Each parameter is shown in Figure 8.
W is the total width of the cold plate. N is the number of channels in the cold plate. P is the pitch, which was obtained by dividing W by N.
w m a x is the maximum width for each channel. It varies depending on W and N as follows.
w m a x = W/N 2 * (1 mm)
H is the total height of the cold plate, h is the height of the channel in which coolant flows, and t is the height from the top of the cold plate to the top of the channel. As the channels are symmetrical in both vertical and horizontal directions, the equation h = H – 2 * t holds. The minimum thickness of t was set to 1 mm to satisfy manufacturing feasibility and structural integrity.
The cooling channels currently mounted in EVs are made using the aluminum extrusion method, and they correspond to system-level models with many nodes to be calculated owing to complex components and the large volume. A minimum thickness of 1 mm was chosen based on the following reasons. First, a wall thickness less than 1 mm may not provide sufficient energy absorption in the event of a crash [33]. Second, in aluminum extrusion processes, the minimum extrudable thickness is typically between 0.8 and 1.2 mm, with most manufacturing guidelines recommending at least 1 mm [34]. Third, a thickness of 1 mm or more helps prevent issues such as thermal deformation, thereby improving dimensional stability and manufacturing precision [35].
Table 2 summarizes p , w / w m a x , and h/t using the Taguchi method. Here, “name” indicates the name of each model. The 222 model of No. 10 was constructed as a 3D model based on the channel geometry of the reference 1D model. An analysis was conducted by increasing the inlet Re from 500 to 20,000 as an independent variable, as presented in Table 2.

3.5. Material Properties and Governing Equations

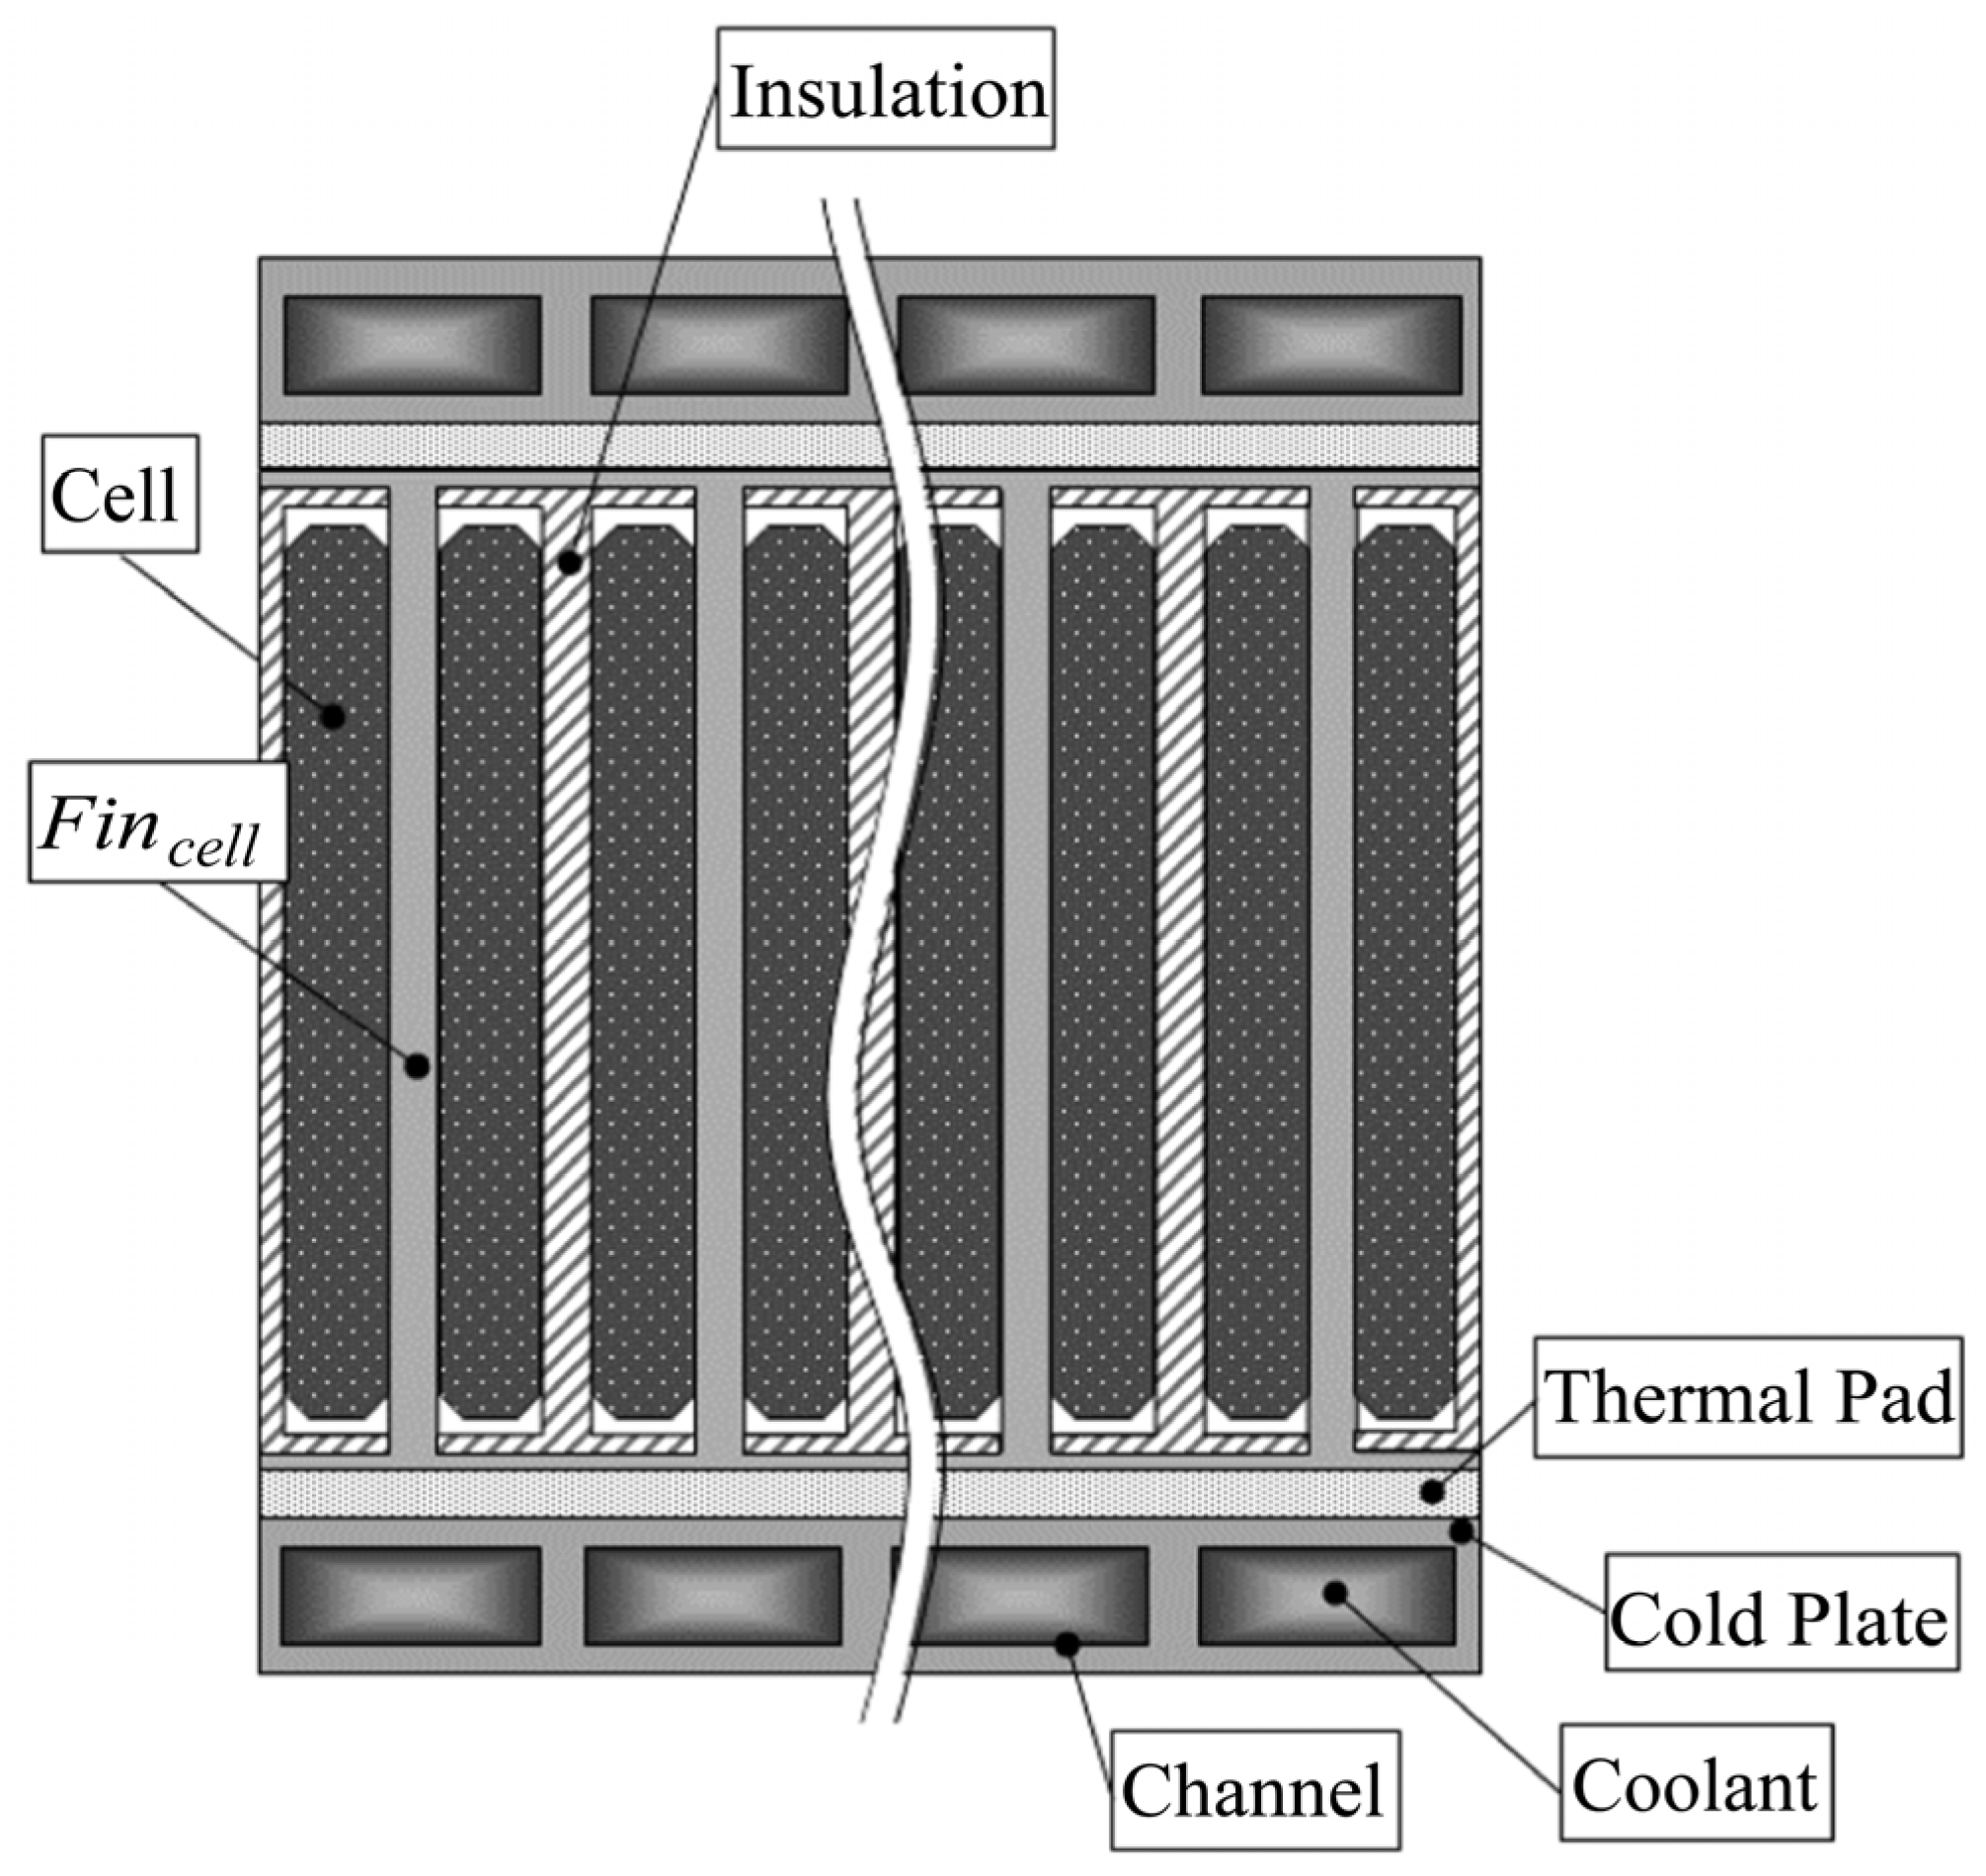
Figure 9 shows the cross-section of the battery module. The cells are surrounded by F i n c e l l and insulation and exhibit anisotropic heat conduction characteristics. The thermal conductivity in the plane direction is 30 W m 1   K 1 , whereas the thermal conductivity in the direction perpendicular to the plane is 0.5   W m 1   K 1 . Each cell exhibits a heating value of 9.6 W under 2C-rate charging.
Table 3 lists the thermal properties of the components of the battery module. F i n c e l l is the component that releases the heat generated from the cells to the cold plate. Made of aluminum, it has a density of 2700   k g   m 3 , specific heat of 893   J   k g 1   K 1 , and heat transfer coefficient of 170 W m 1   K 1 [5]. The structure of F i n c e l l consists of multiple plates that vertically cross the two plates located at the top and bottom of the battery cells.
Insulation is used to protect and insulate the main body of pouch cells, which covers all parts except for the surface in contact with each fin. The insulation has a density of 2300 k g   m 3 , specific heat of 1430 J   k g 1   K 1 , and heat transfer coefficient of 1.5 W m 1   K 1   [5].
A thermal pad is positioned on the contact surface between the cold plate and the fin. It contacts the fin at the top and the cold plate at the bottom. The pad reduces contact resistance by evenly adjusting the wetted area and also serves as electrical insulation. It has a density of 3100 k g   m 3 , specific heat of 939 J   k g 1   K 1 , and thermal conductivity of 5 W m 1   K 1   [5].
The cold plate discharges the heat generated from battery cells through the coolant flowing inside the channels and also serves as a frame for fixing the components of the battery module. The parts inside the cold plate where coolant flows are defined as channels. The cold plate is made of aluminum. The dimensions and material properties shown in Table 2 and Table 3, respectively, were utilized to construct a 3D CFD model based on Chung and Kim’s [5] 1D simulation model.
The material of coolant is water and was obtained from the basic property library of Star CCM+. It has density of 997.6 kg m−3, specific heat of 4181.7 J kg−1 K−1, and heat transfer coefficient of 0.6 Wm−1 K−1.
In this study, a 3D CFD numerical analysis model was constructed to evaluate the heat transfer and flow resistance characteristics inside the cold plate channels. STAR-CCM+ 11.06.011-R8, a commercial CFD software, was used for analysis at the battery module, pack, and cold plate. The turbulence model was defined as follows.
Owing to the high computational cost of direct numerical simulation, the Reynolds-averaged Navier–Stokes (RANS) equations were employed for turbulence modeling. These equations are time-averaged and assume steady-state, incompressible conditions. The RANS formulation includes continuity, momentum, and energy equations, expressed as:
Reynolds-averaged Navier–Stokes equations (RANS)
Continuity equation (Incompressible flow)
U i x i = 0 .
Momentum equation
ρ U i U j x i = P x j + x i μ U i x j + U j x i ρ u i u j ¯ ,
Energy equation
ρ c p U i T x i = x i k T x i ρ u i T ¯ .
Analysis at the pack level is a relatively large-scale model, and it is interpreted in a wide range from laminar flow to turbulent flow, including the transition zone. Therefore, the standard k-epsilon turbulence model with high computational efficiency was adopted as a turbulence model in this study. The governing equations for the kinetic energy k and dissipation rate ε are given as:
Standard k-epsilon turbulence model (steady state)
k -turbulent kinetic energy
ρ U i k x i = x i μ + μ t σ k k x i + μ t U i x j + U j x i U i x j ρ ε .
ε -turbulent dissipation rate
ρ U i ε x i = x i μ + μ t σ ε ε x i + C ε 1 ε k G k ρ C ε 2 ε 2 k .

4. Results and Discussion

This section presents the results of the previously defined CFD numerical analysis and their interpretation. Nusselt number and f-factor correlations were derived as functions of the Re and geometric parameters. Based on these correlations, the goodness factor was calculated. The calculated goodness factor and Taguchi method were then used to optimize the number of channels and the dimensions of the cold plate. The optimized results were validated using response surface methodology (RSM).

4.1. Grid Dependency

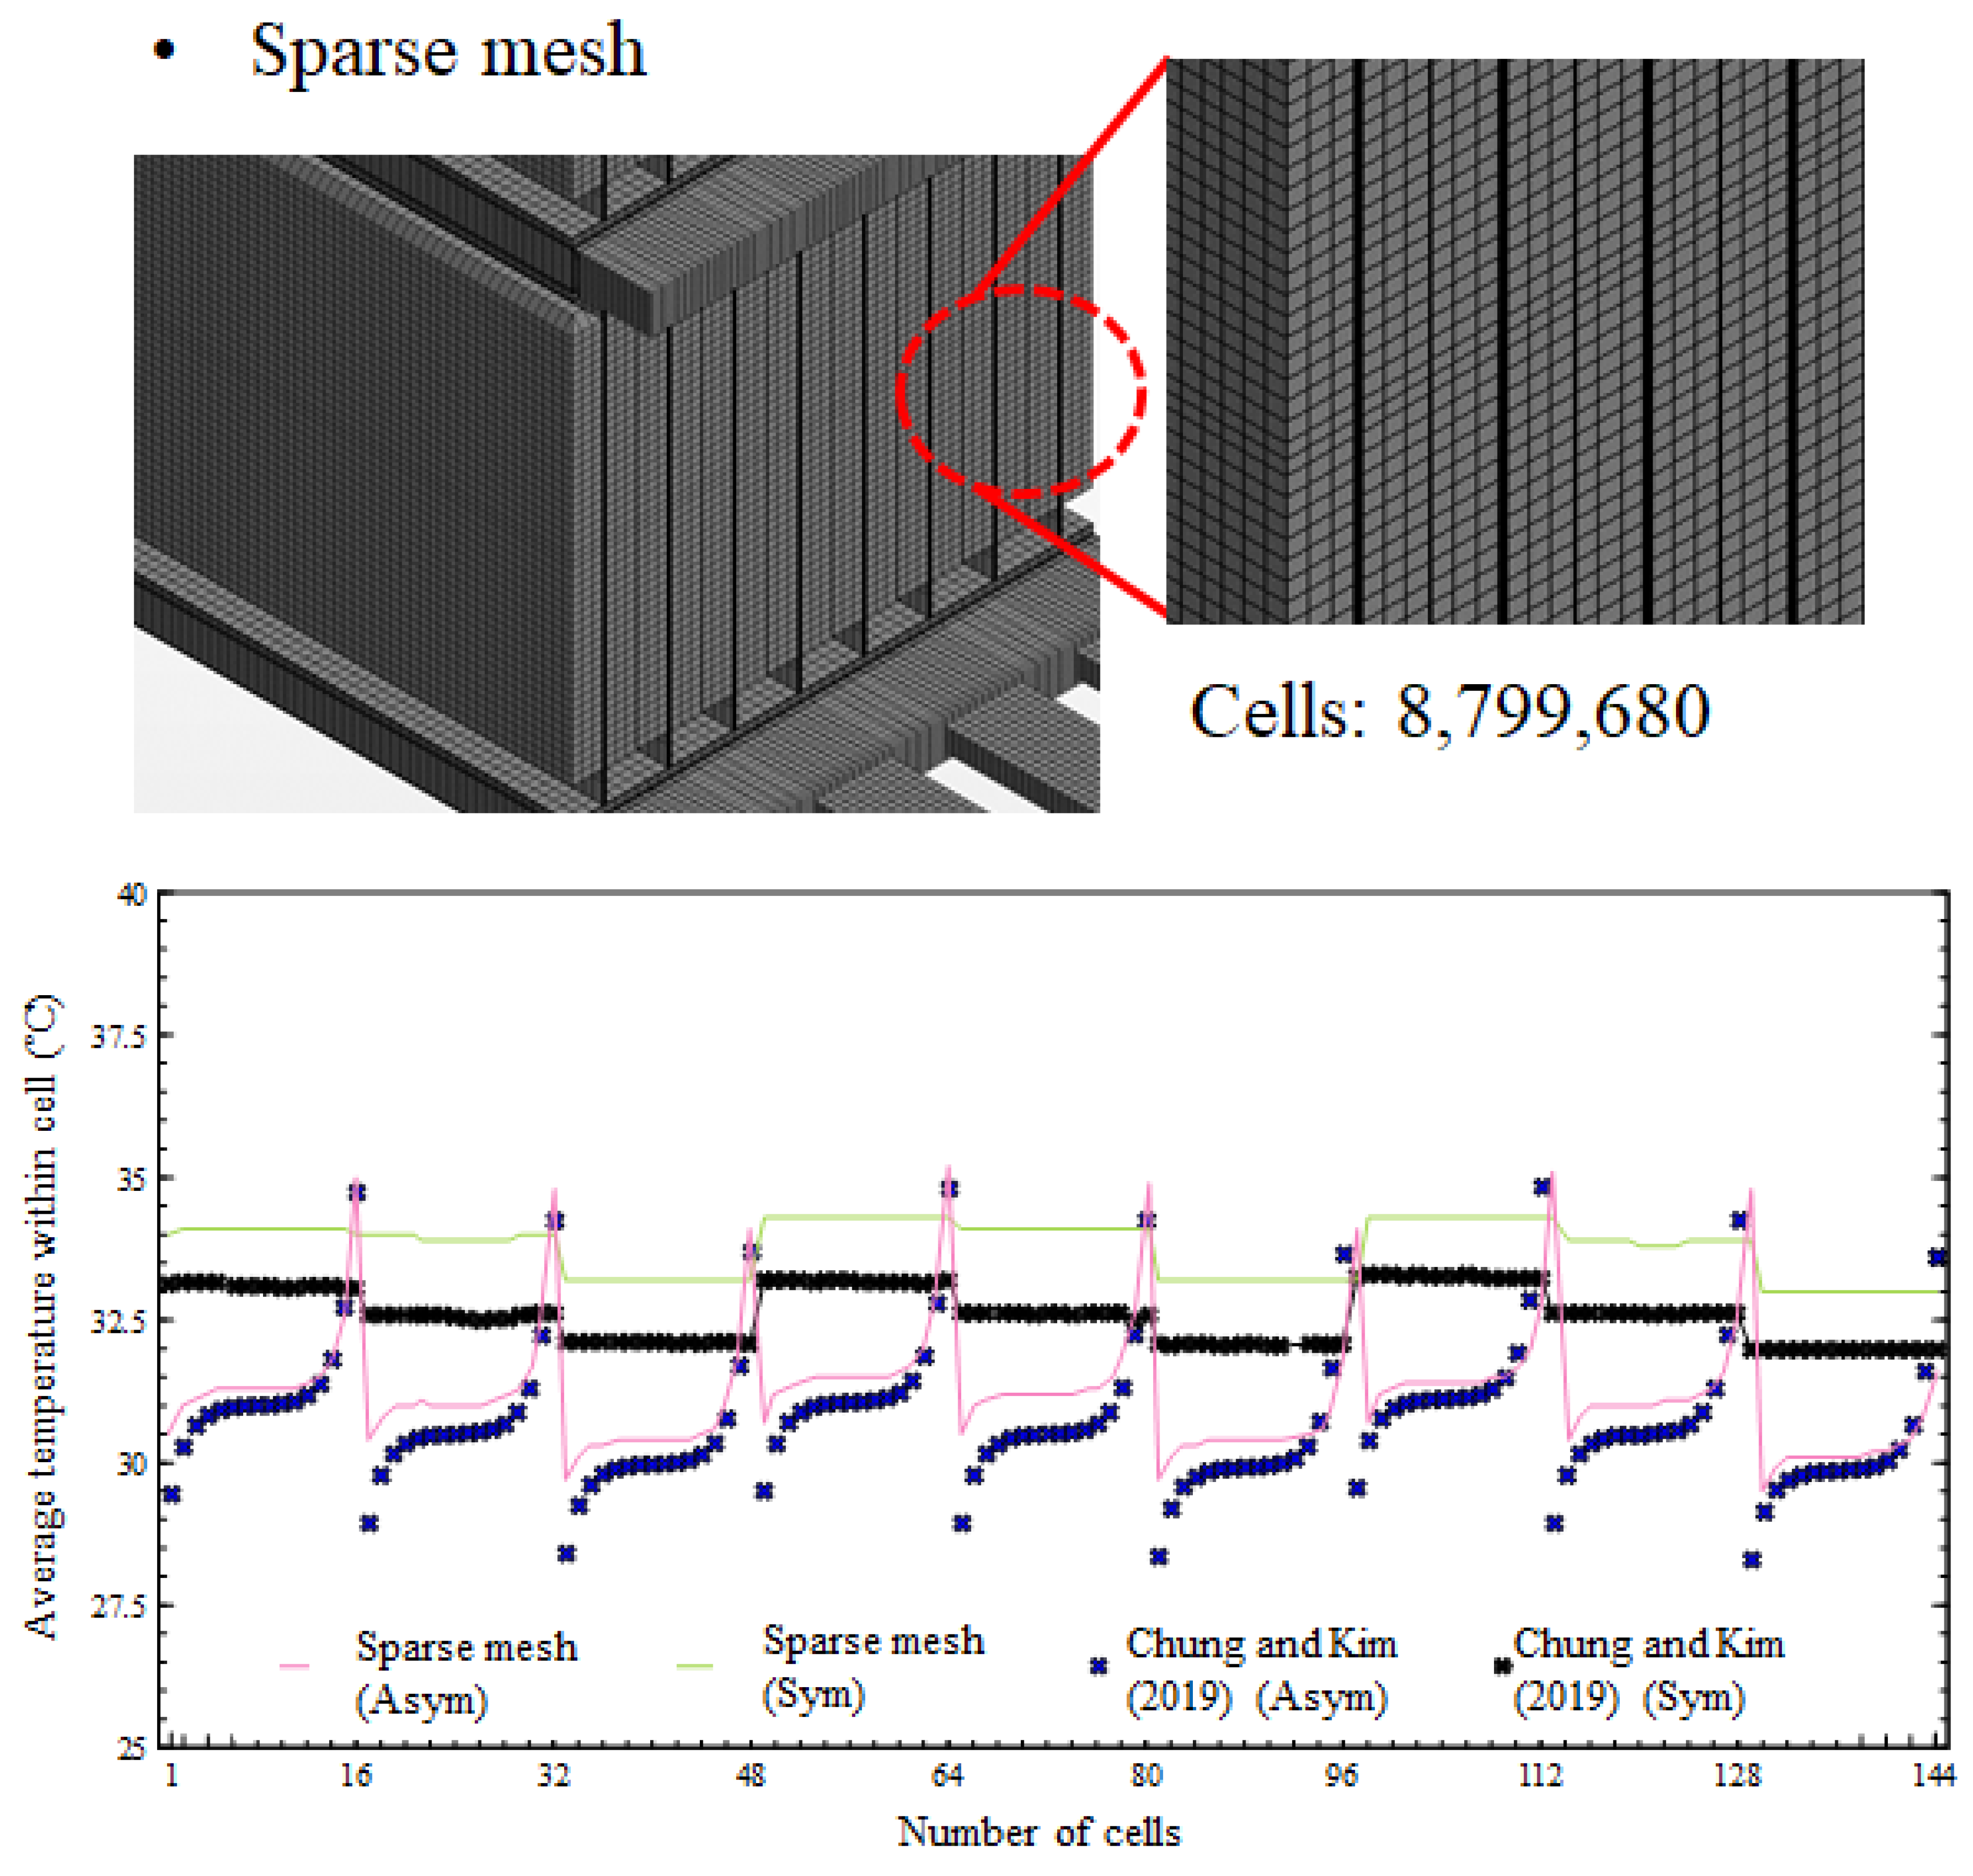
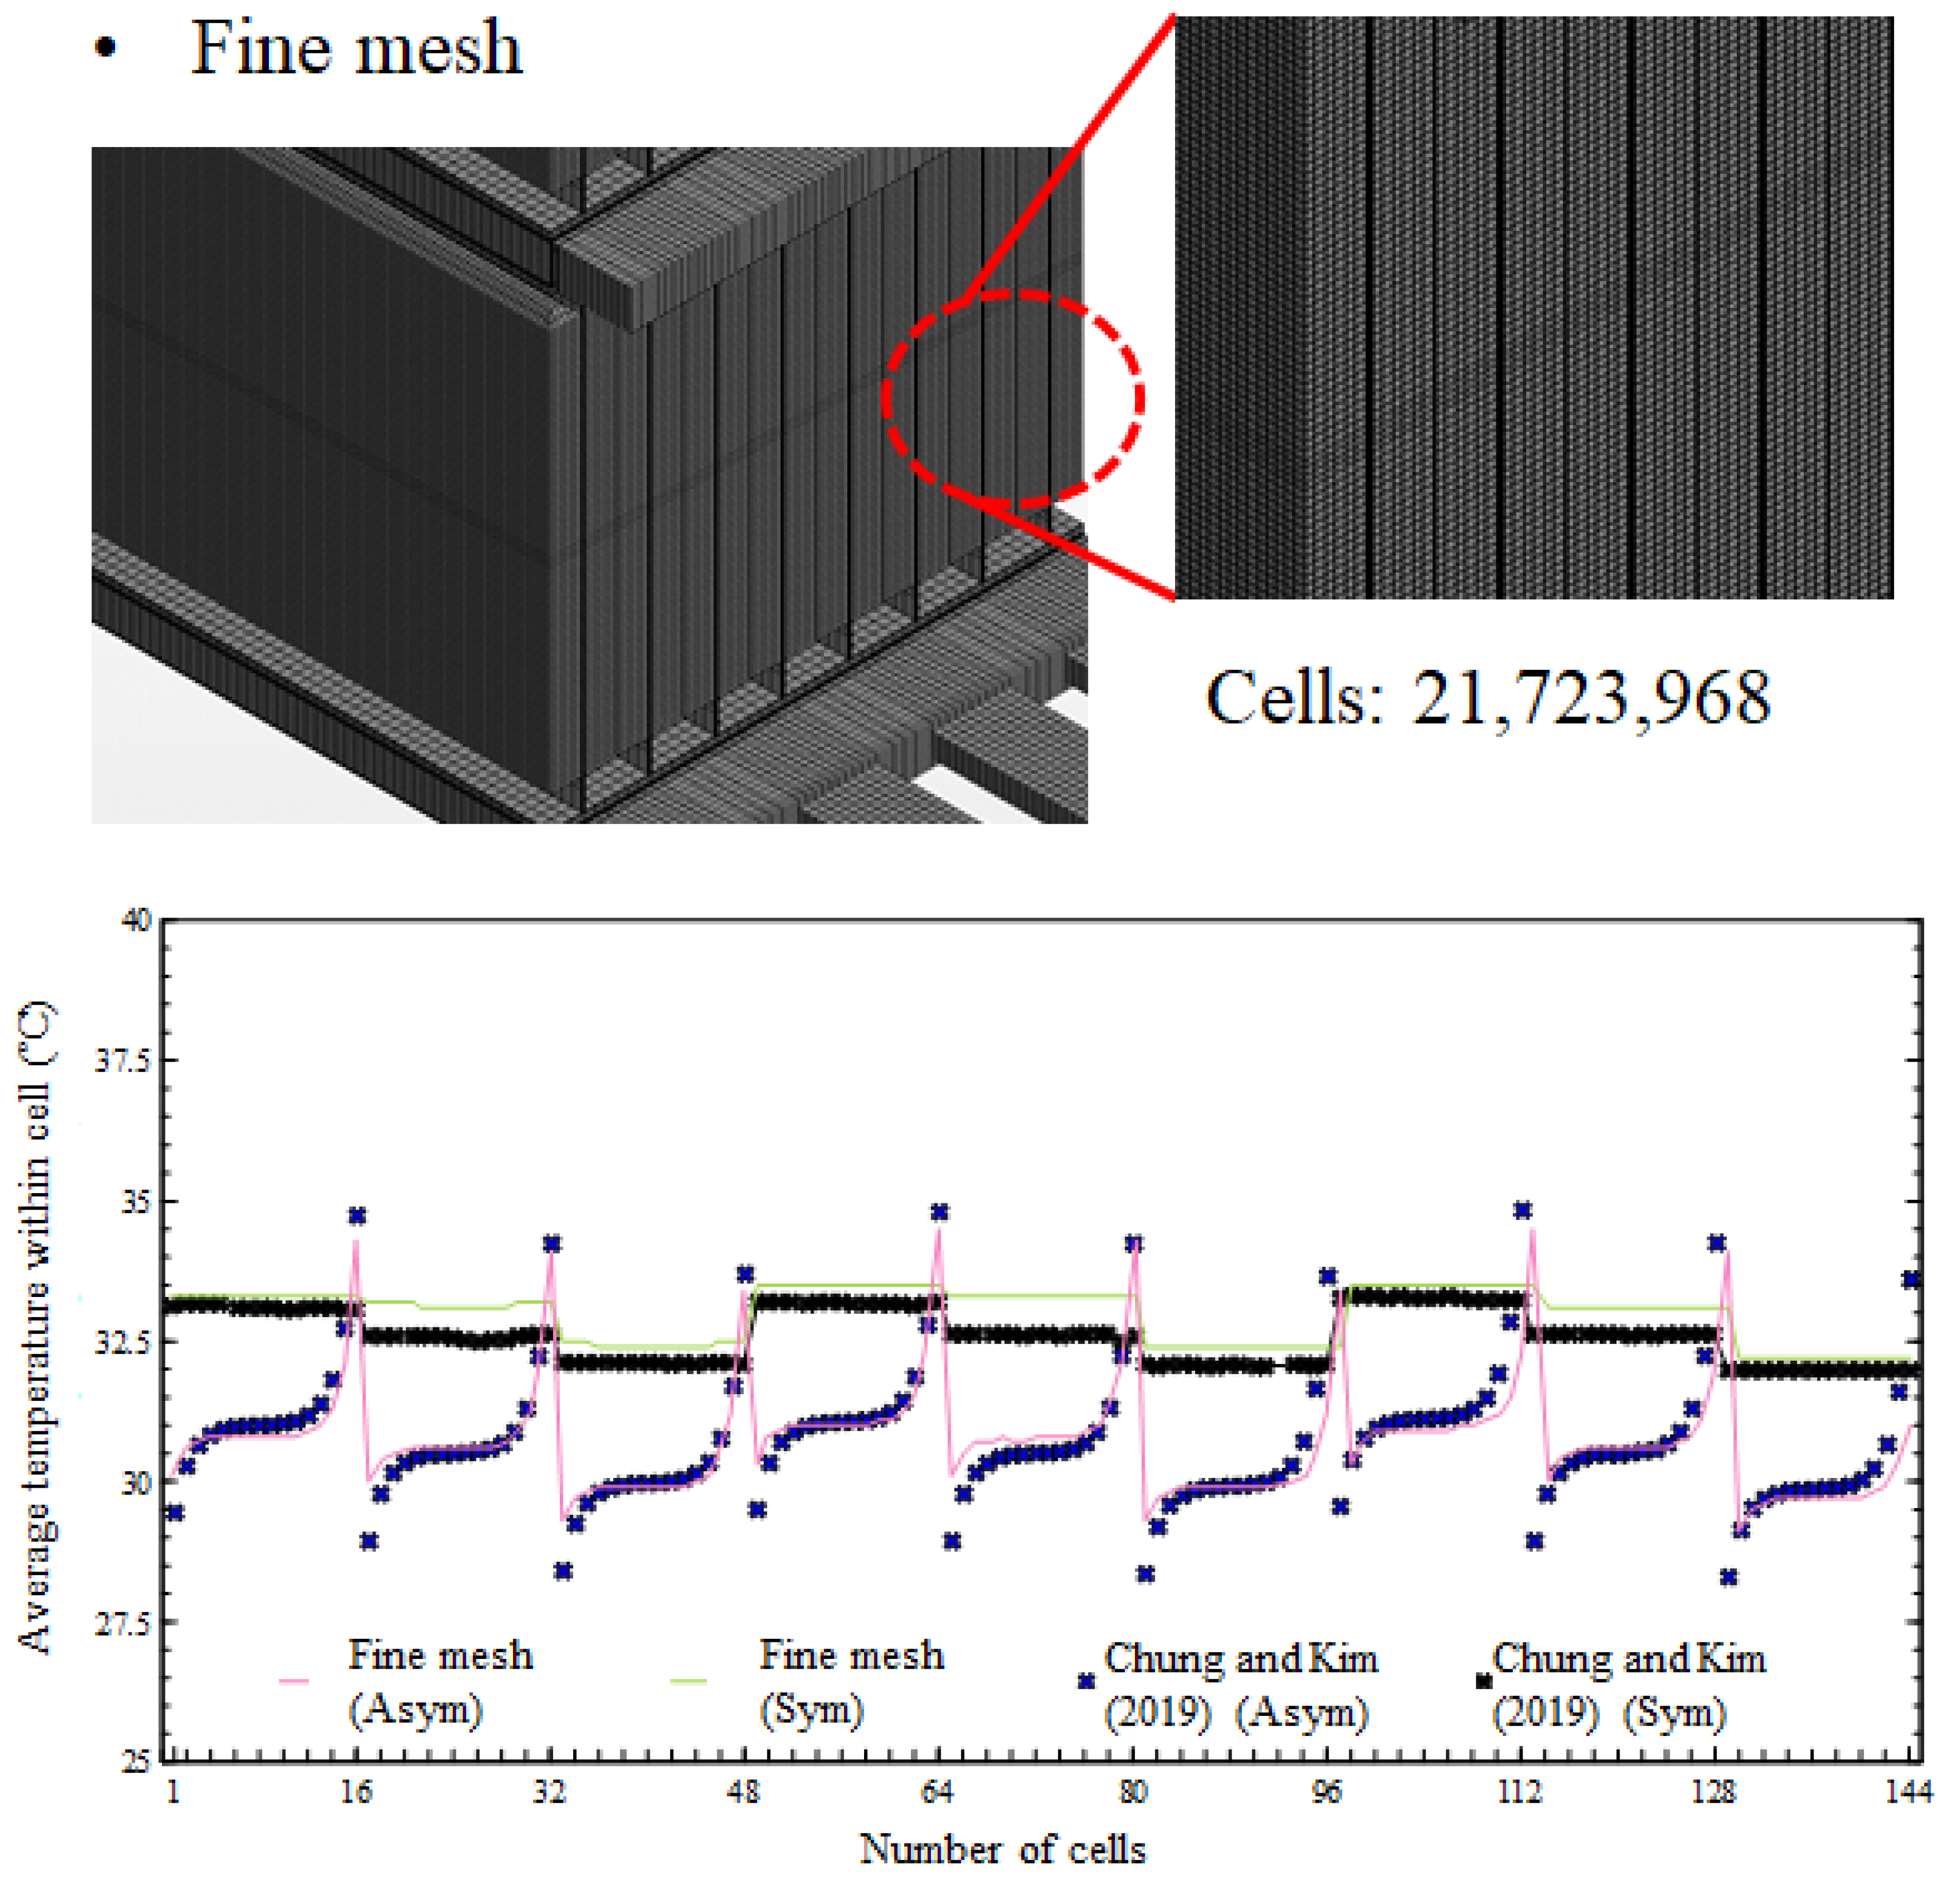
A grid dependency test (Figure 10 and Figure 11) was conducted by increasing the number of cells by approximately 2.5 times, from 8,799,680 to 21,723,968. The test was performed using the average temperatures of 144 cells for both the symmetric and asymmetric fin arrangements. It was confirmed that the average temperatures converged with the results of the previous 1D simulation model in both arrangements.
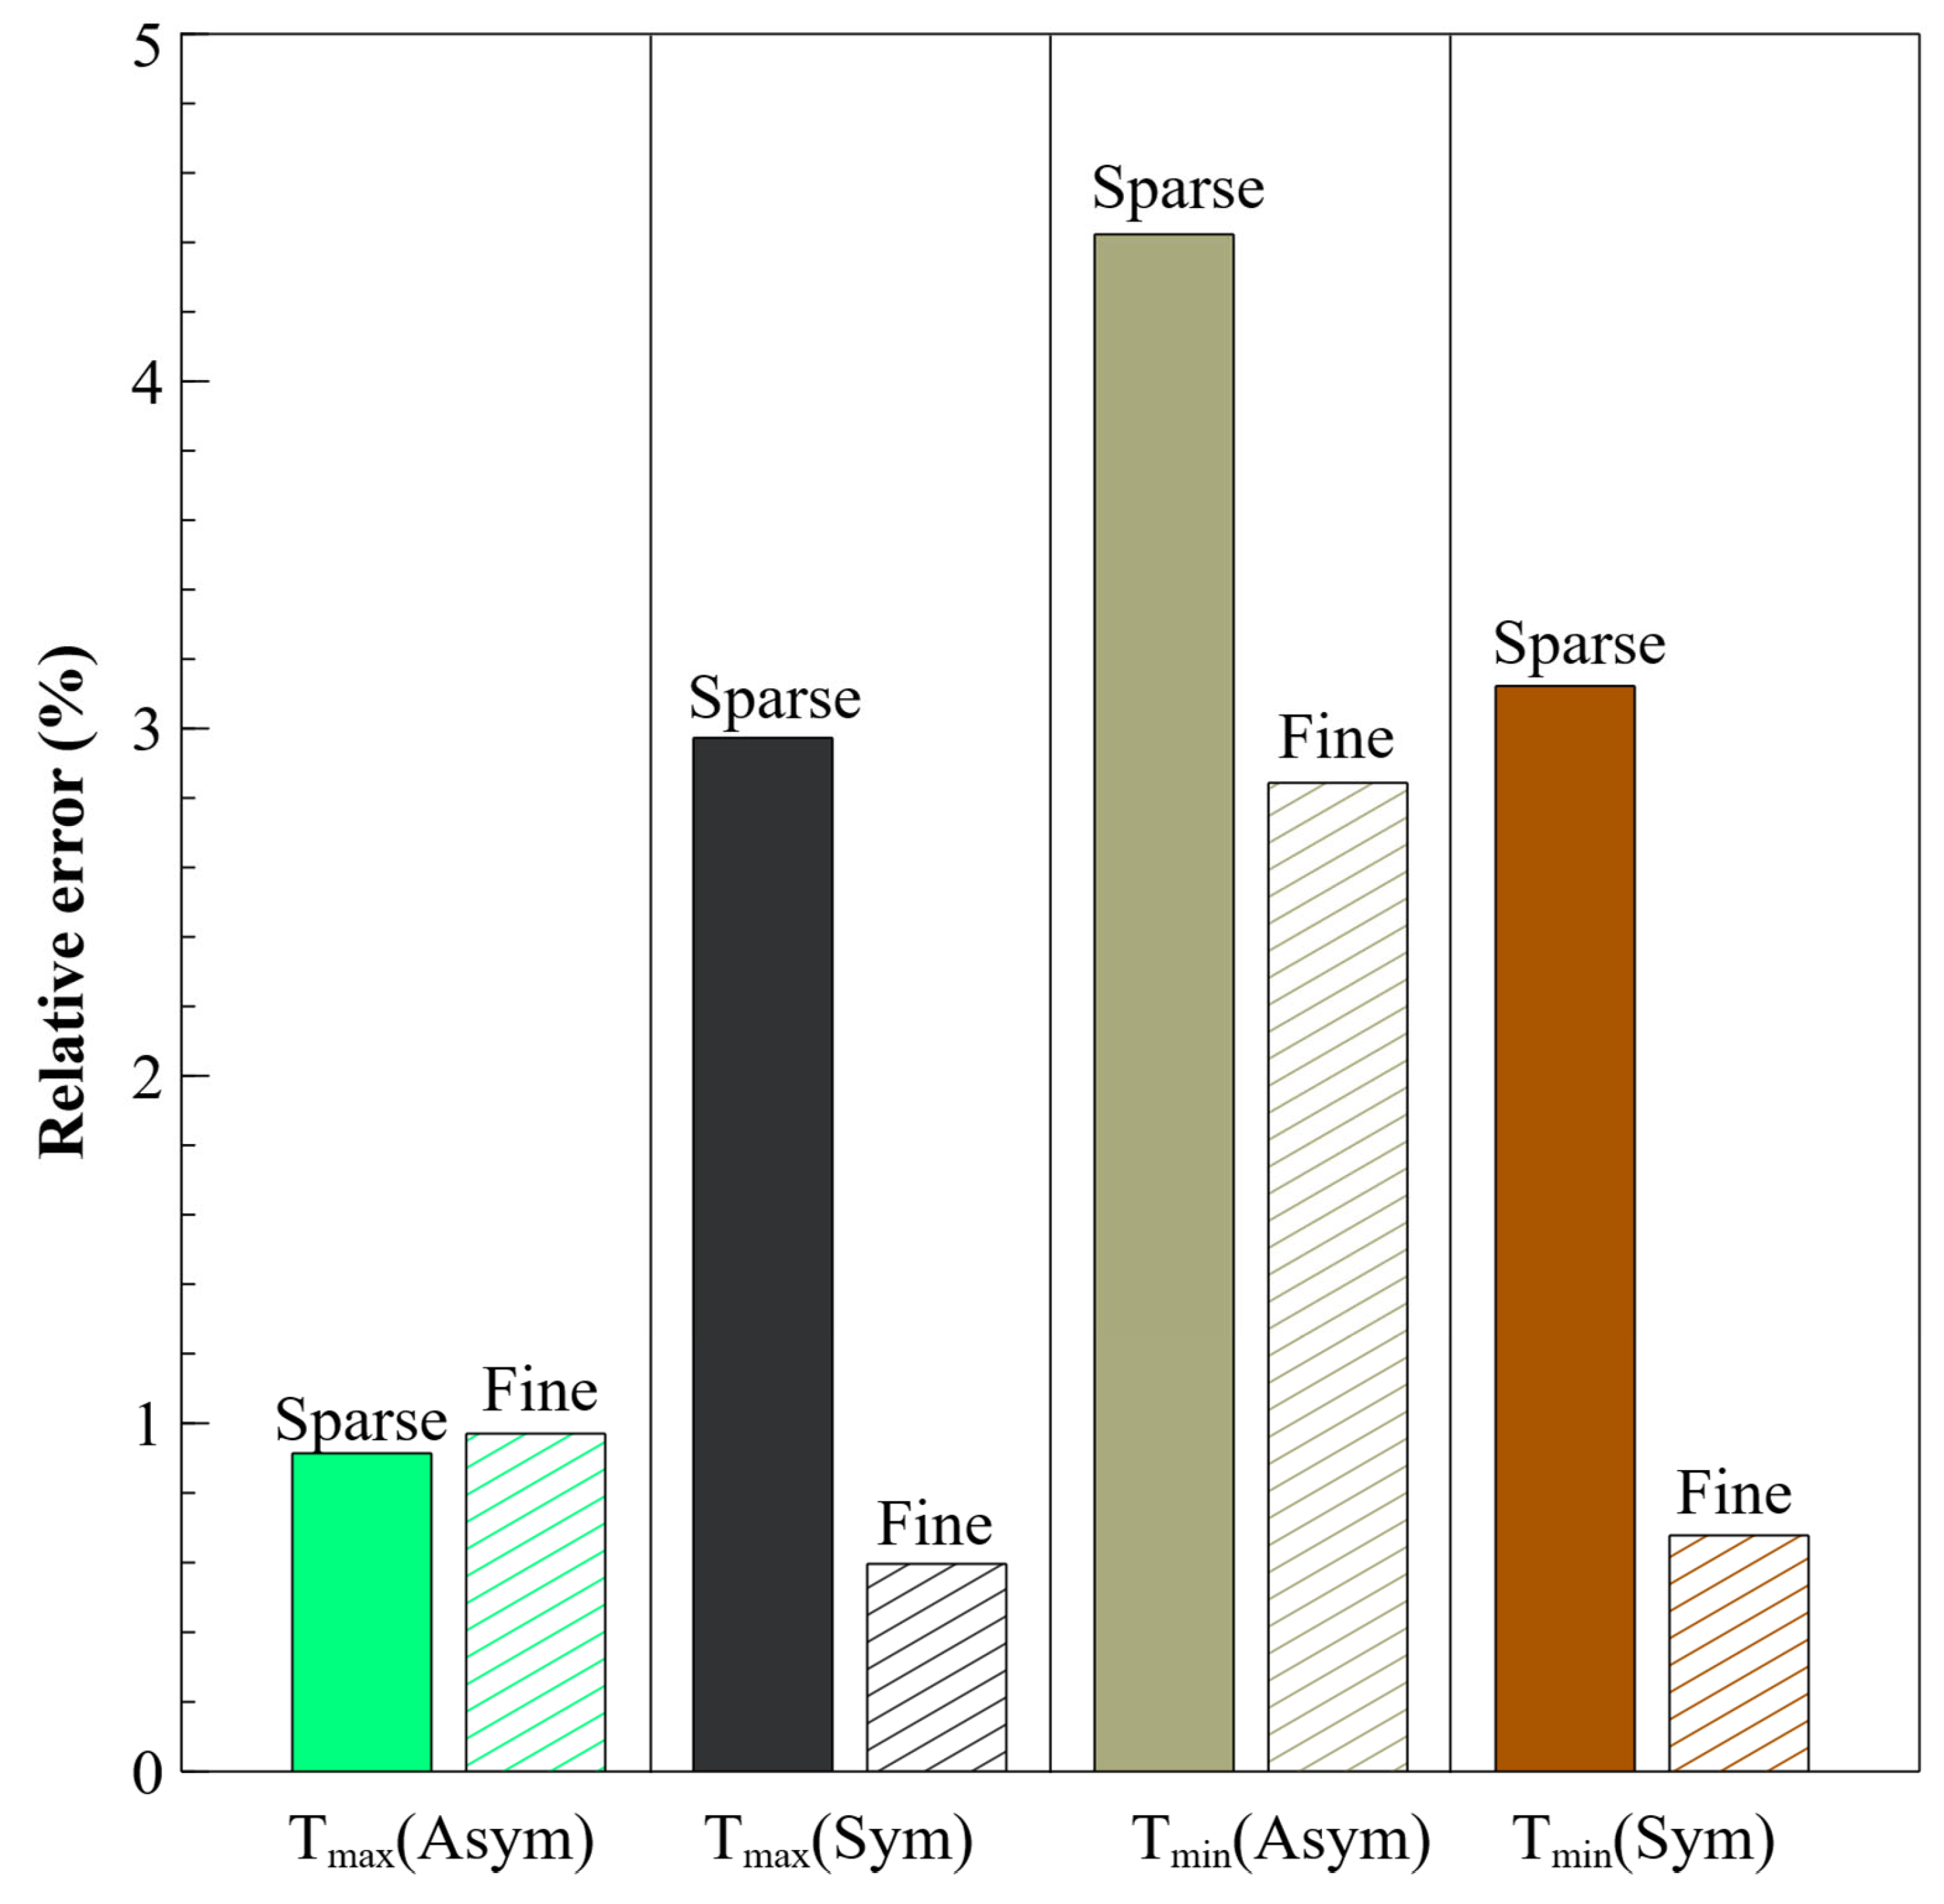
Figure 12 shows the relative errors for maximum and minimum cell temperatures for the Sparse and Fine meshes. Only in the maximum cell temperature of the Asymmetry model is the relative error for the Sparse mesh smaller. Conversely, the other values show a decrease in relative error, converging to within 3%.
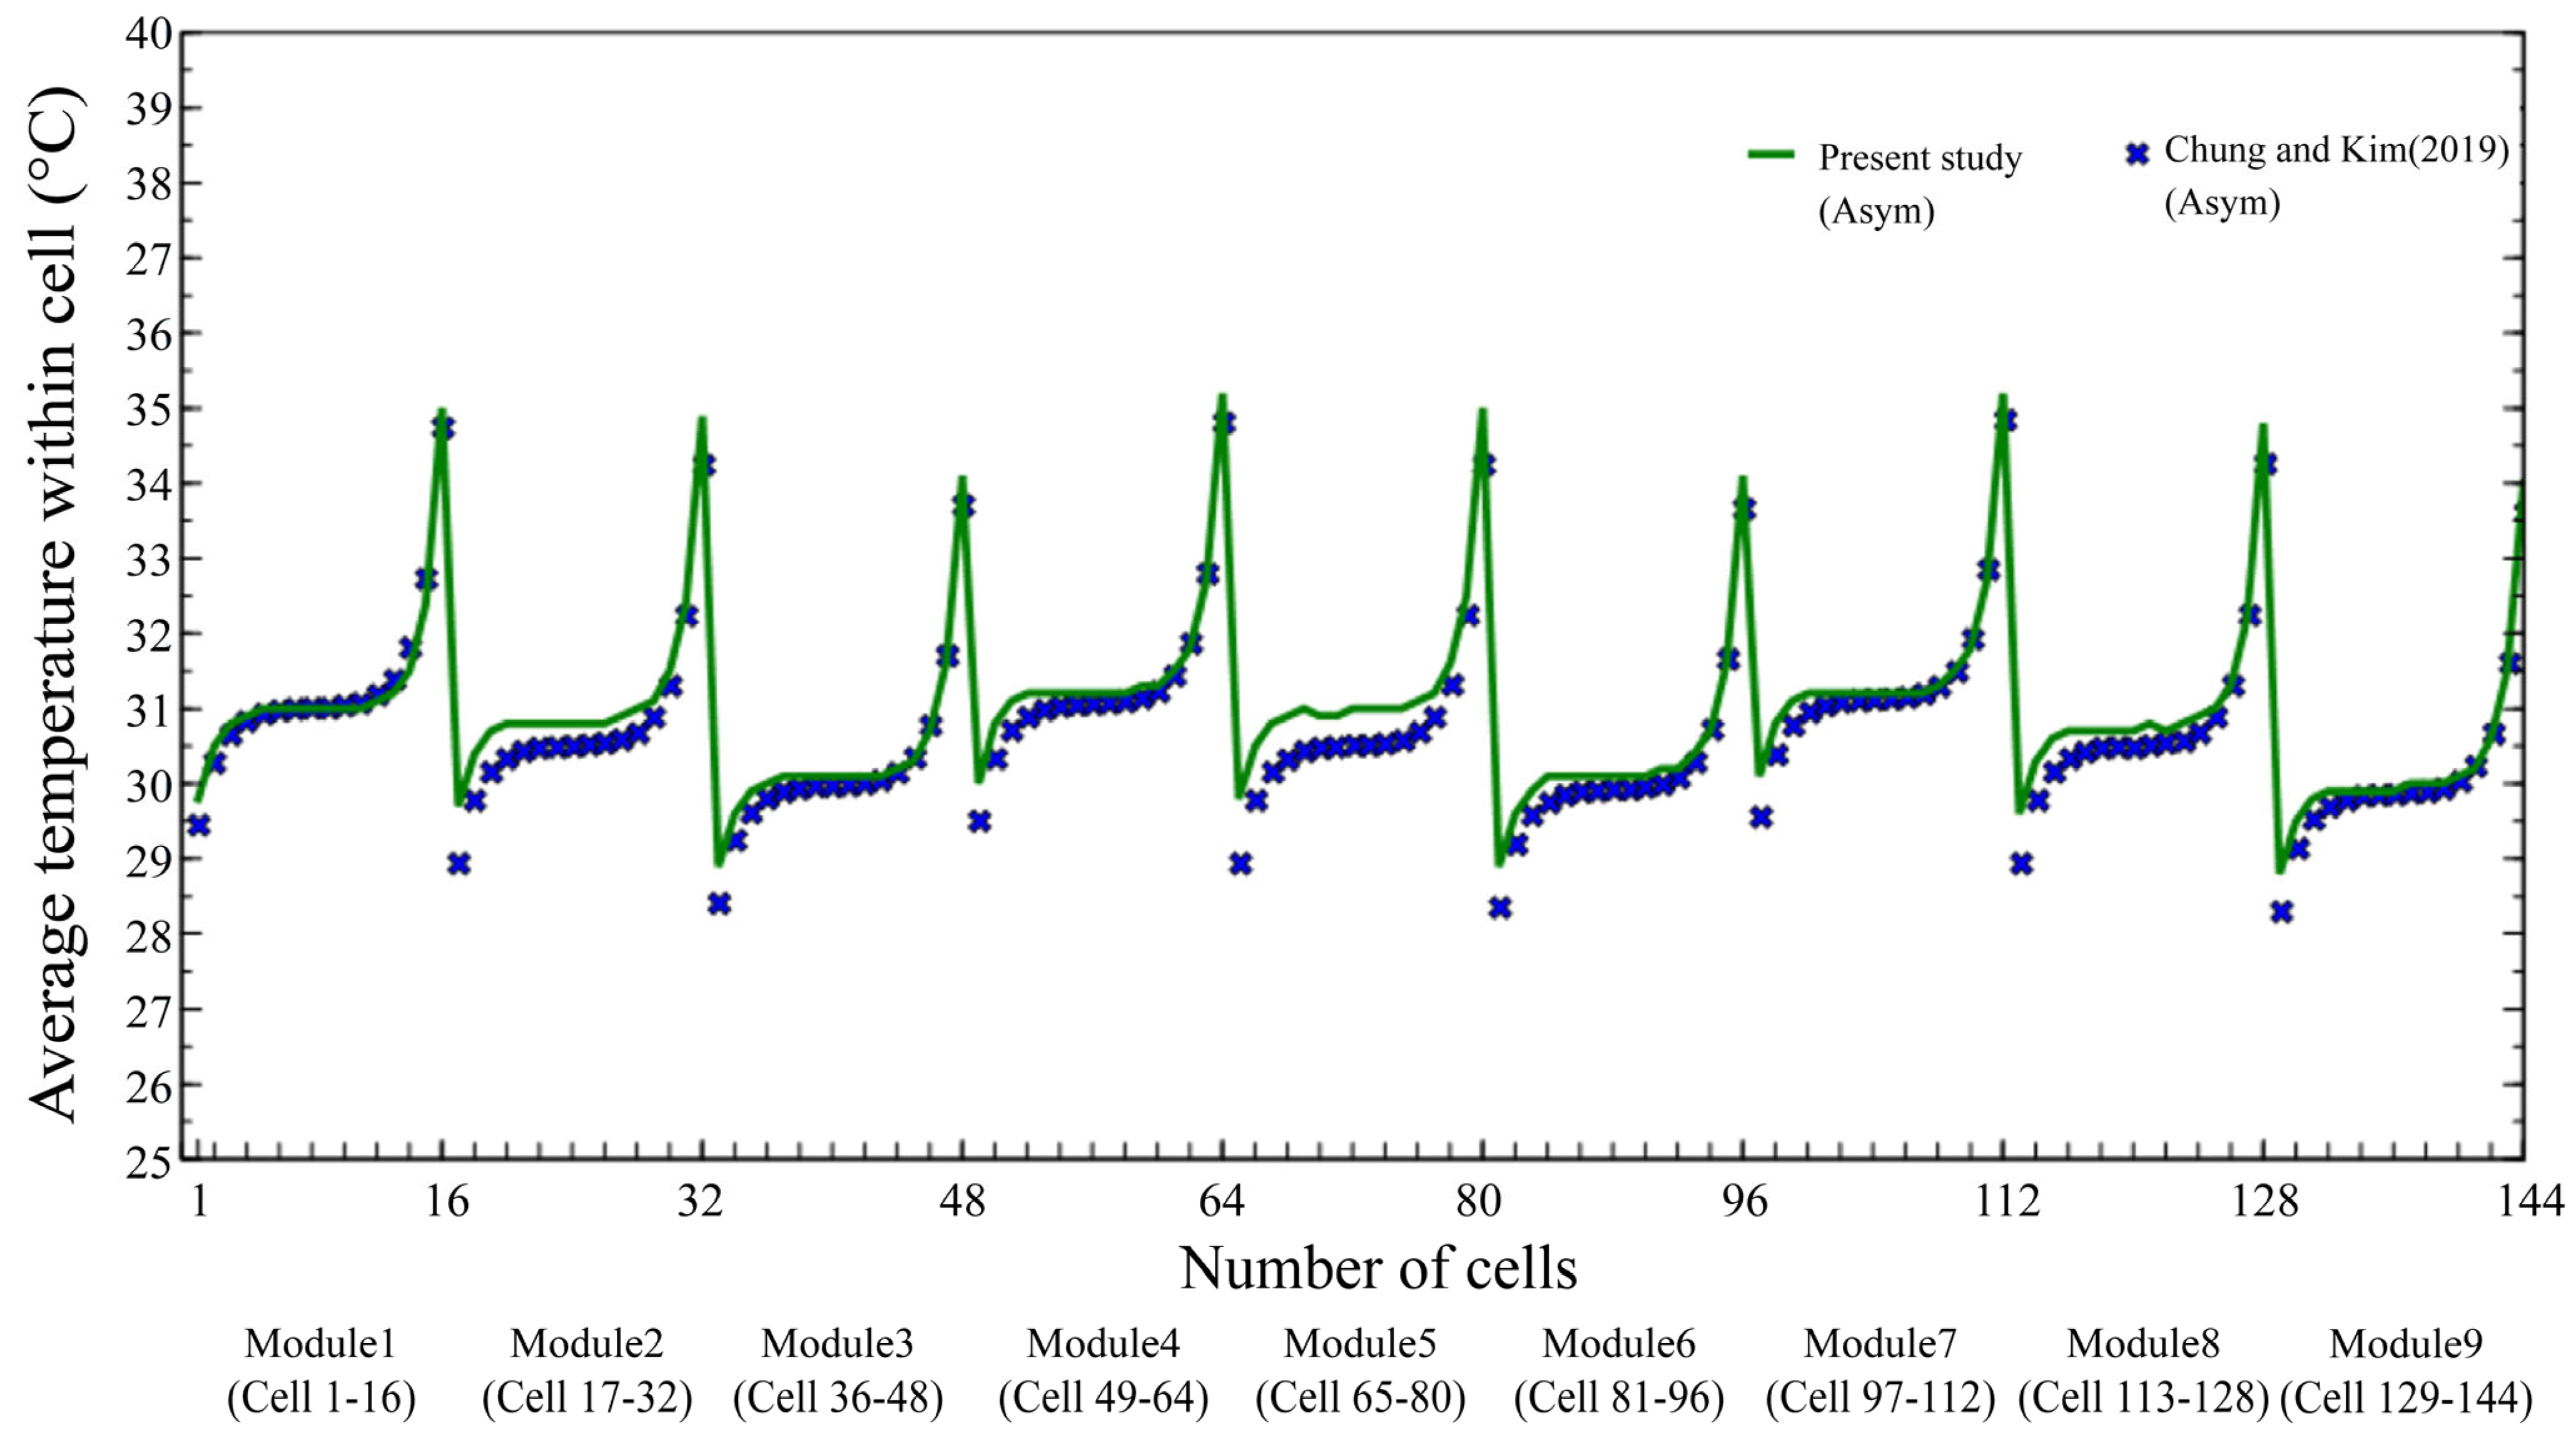
Figure 13 and Figure 14 compare the average temperature values of 144 cells. The validation results showed a relative error of 0.01% between the results of this study and those of Chung and Kim [5] for the asymmetric arrangement. For the symmetric arrangement, the relative error was found to be larger, at 1.1%. This difference is attributed to the smaller temperature variation among cells in the asymmetric arrangement compared to the symmetric one. Therefore, even a small deviation in temperature was reflected more sensitively in the average value.
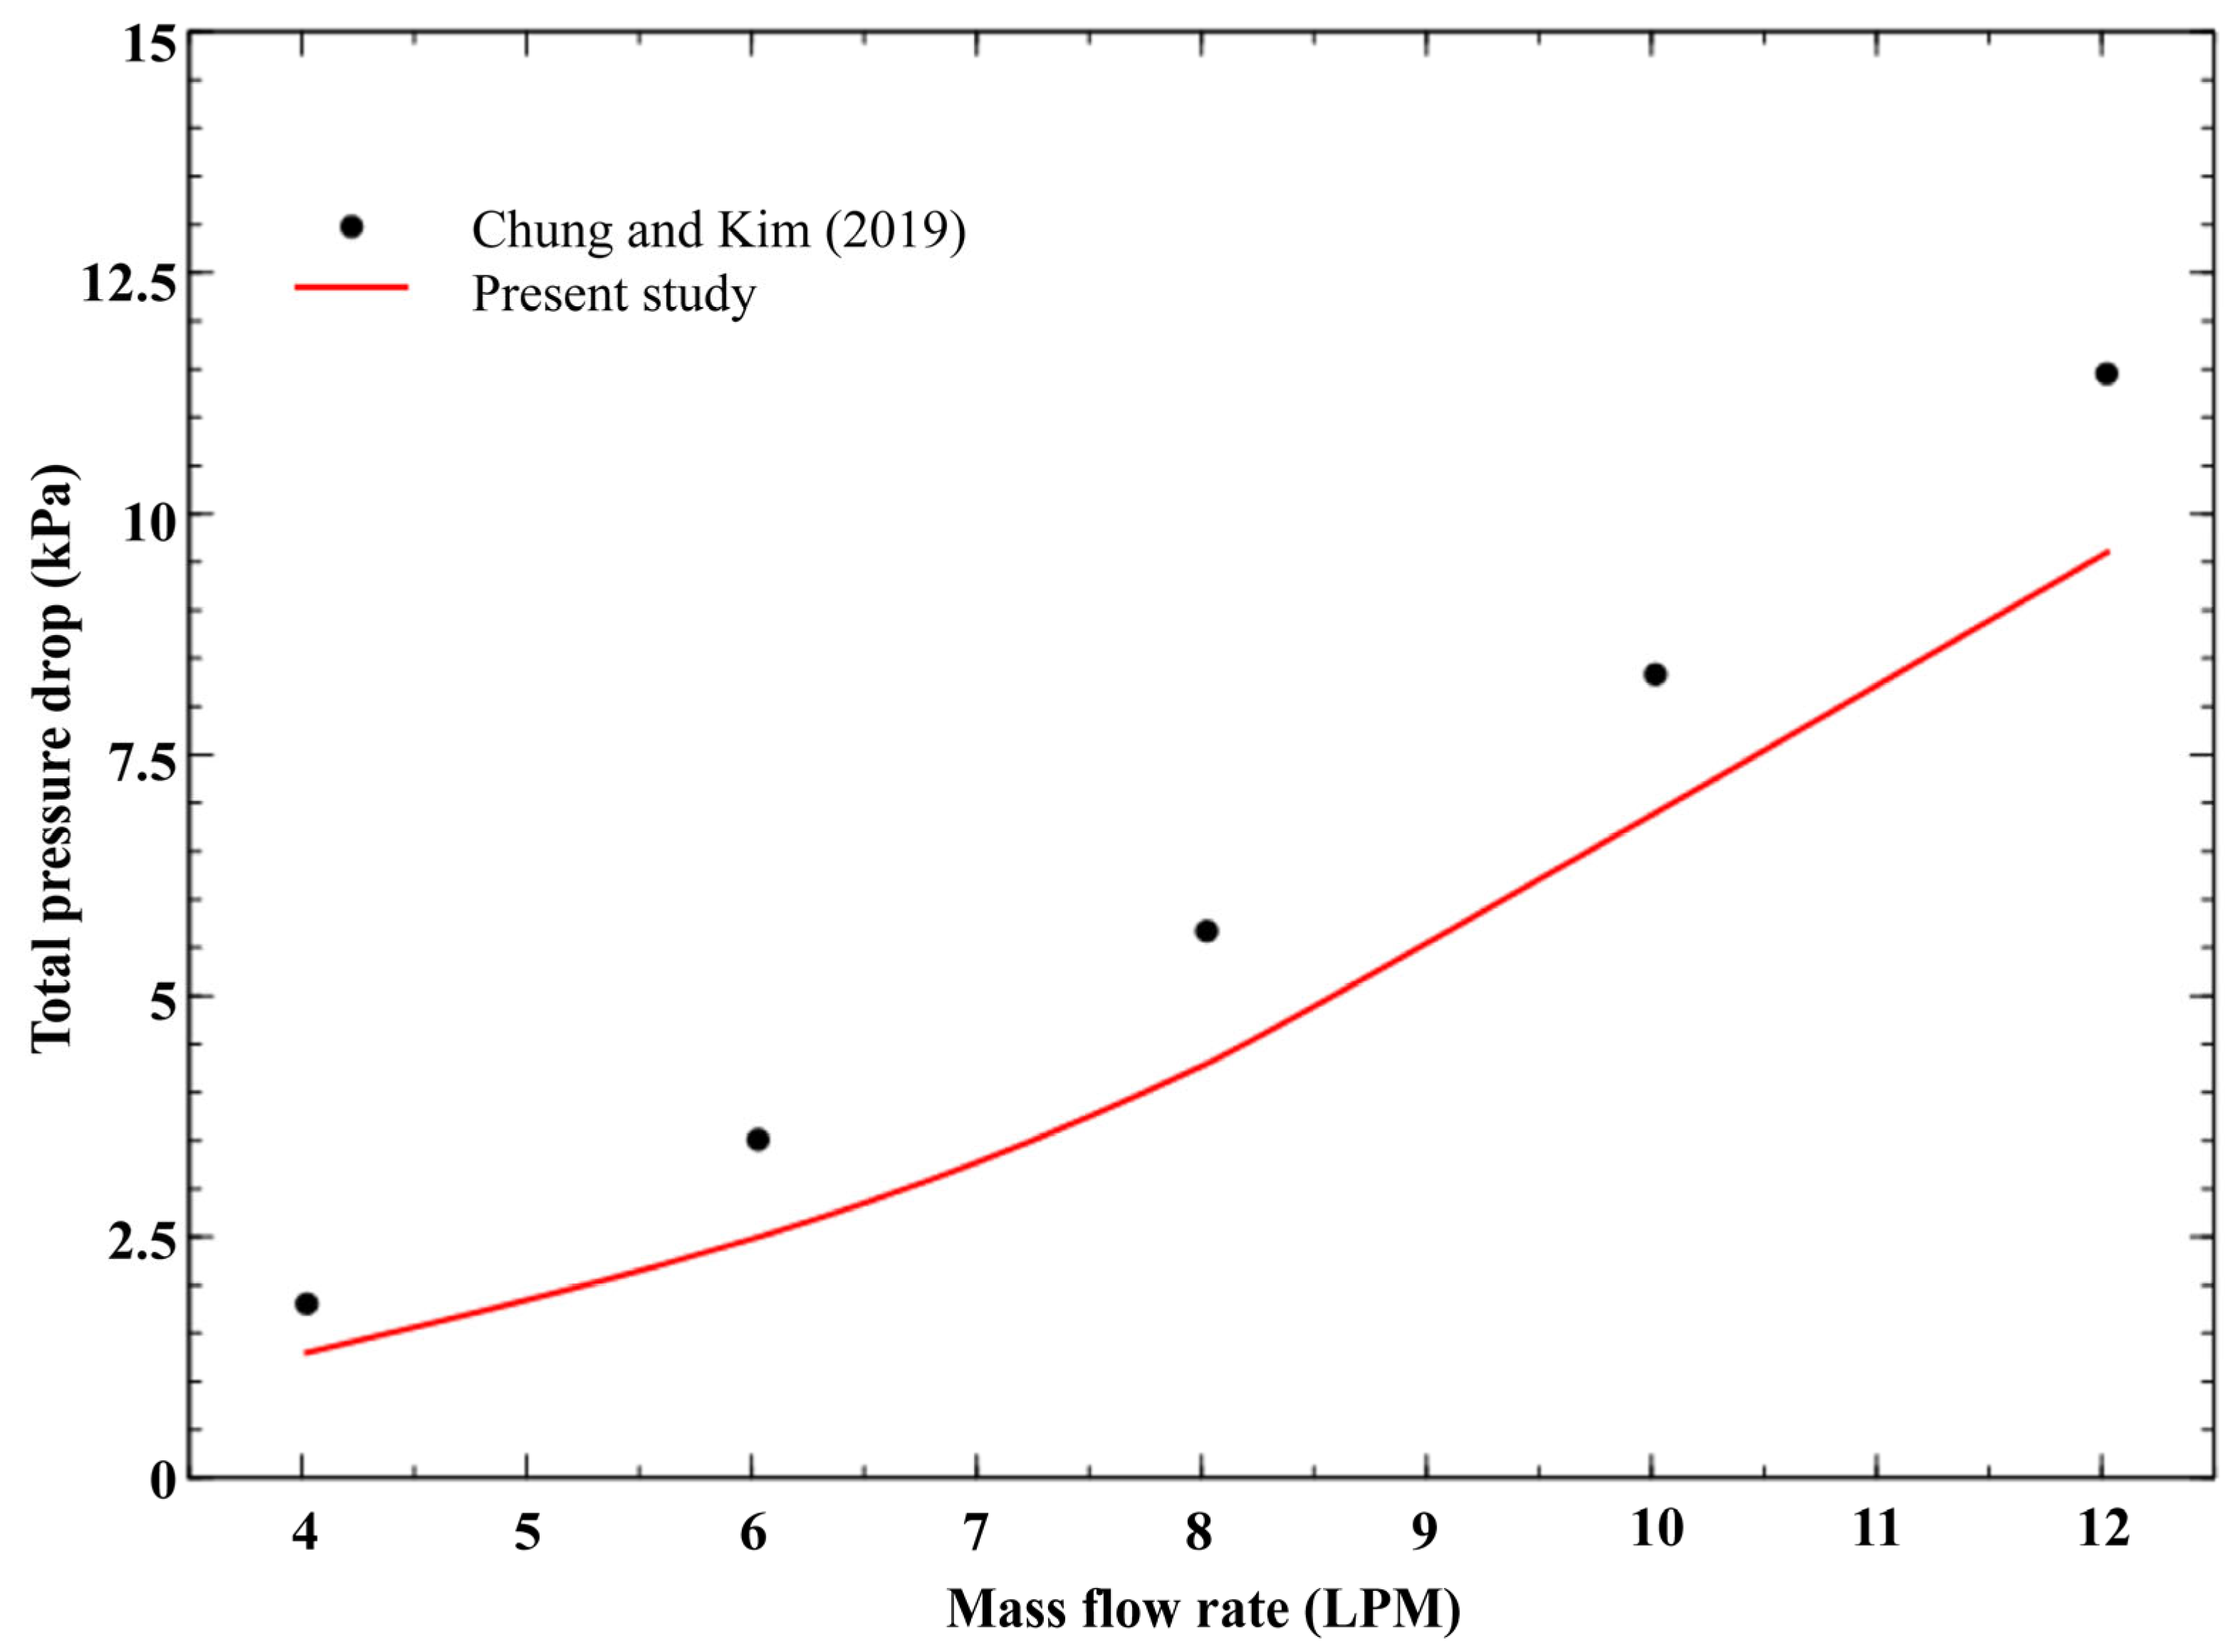
Figure 15 shows the validation results for total pressure drop over the range of 4 to 12 LPM. A comparison with the results of Chung and Kim [5] showed that the overall trend was consistent. However, an error of approximately 17.2% was observed at 10 LPM. In [5], correlations were used to calculate the pressure drop. It was assumed that the velocity distribution between the parallel channels was uniform, although this is not actually the case. Pressure drops for each 1D element were calculated using correlations for circular pipes, and correction factors were applied for non-circular geometries. The total pressure drop was then obtained by summing the individual values. By contrast, in this study, the total pressure drop was directly calculated using CFD without relying on correlations or correction factors.

4.2. Section of Temperature Distributions

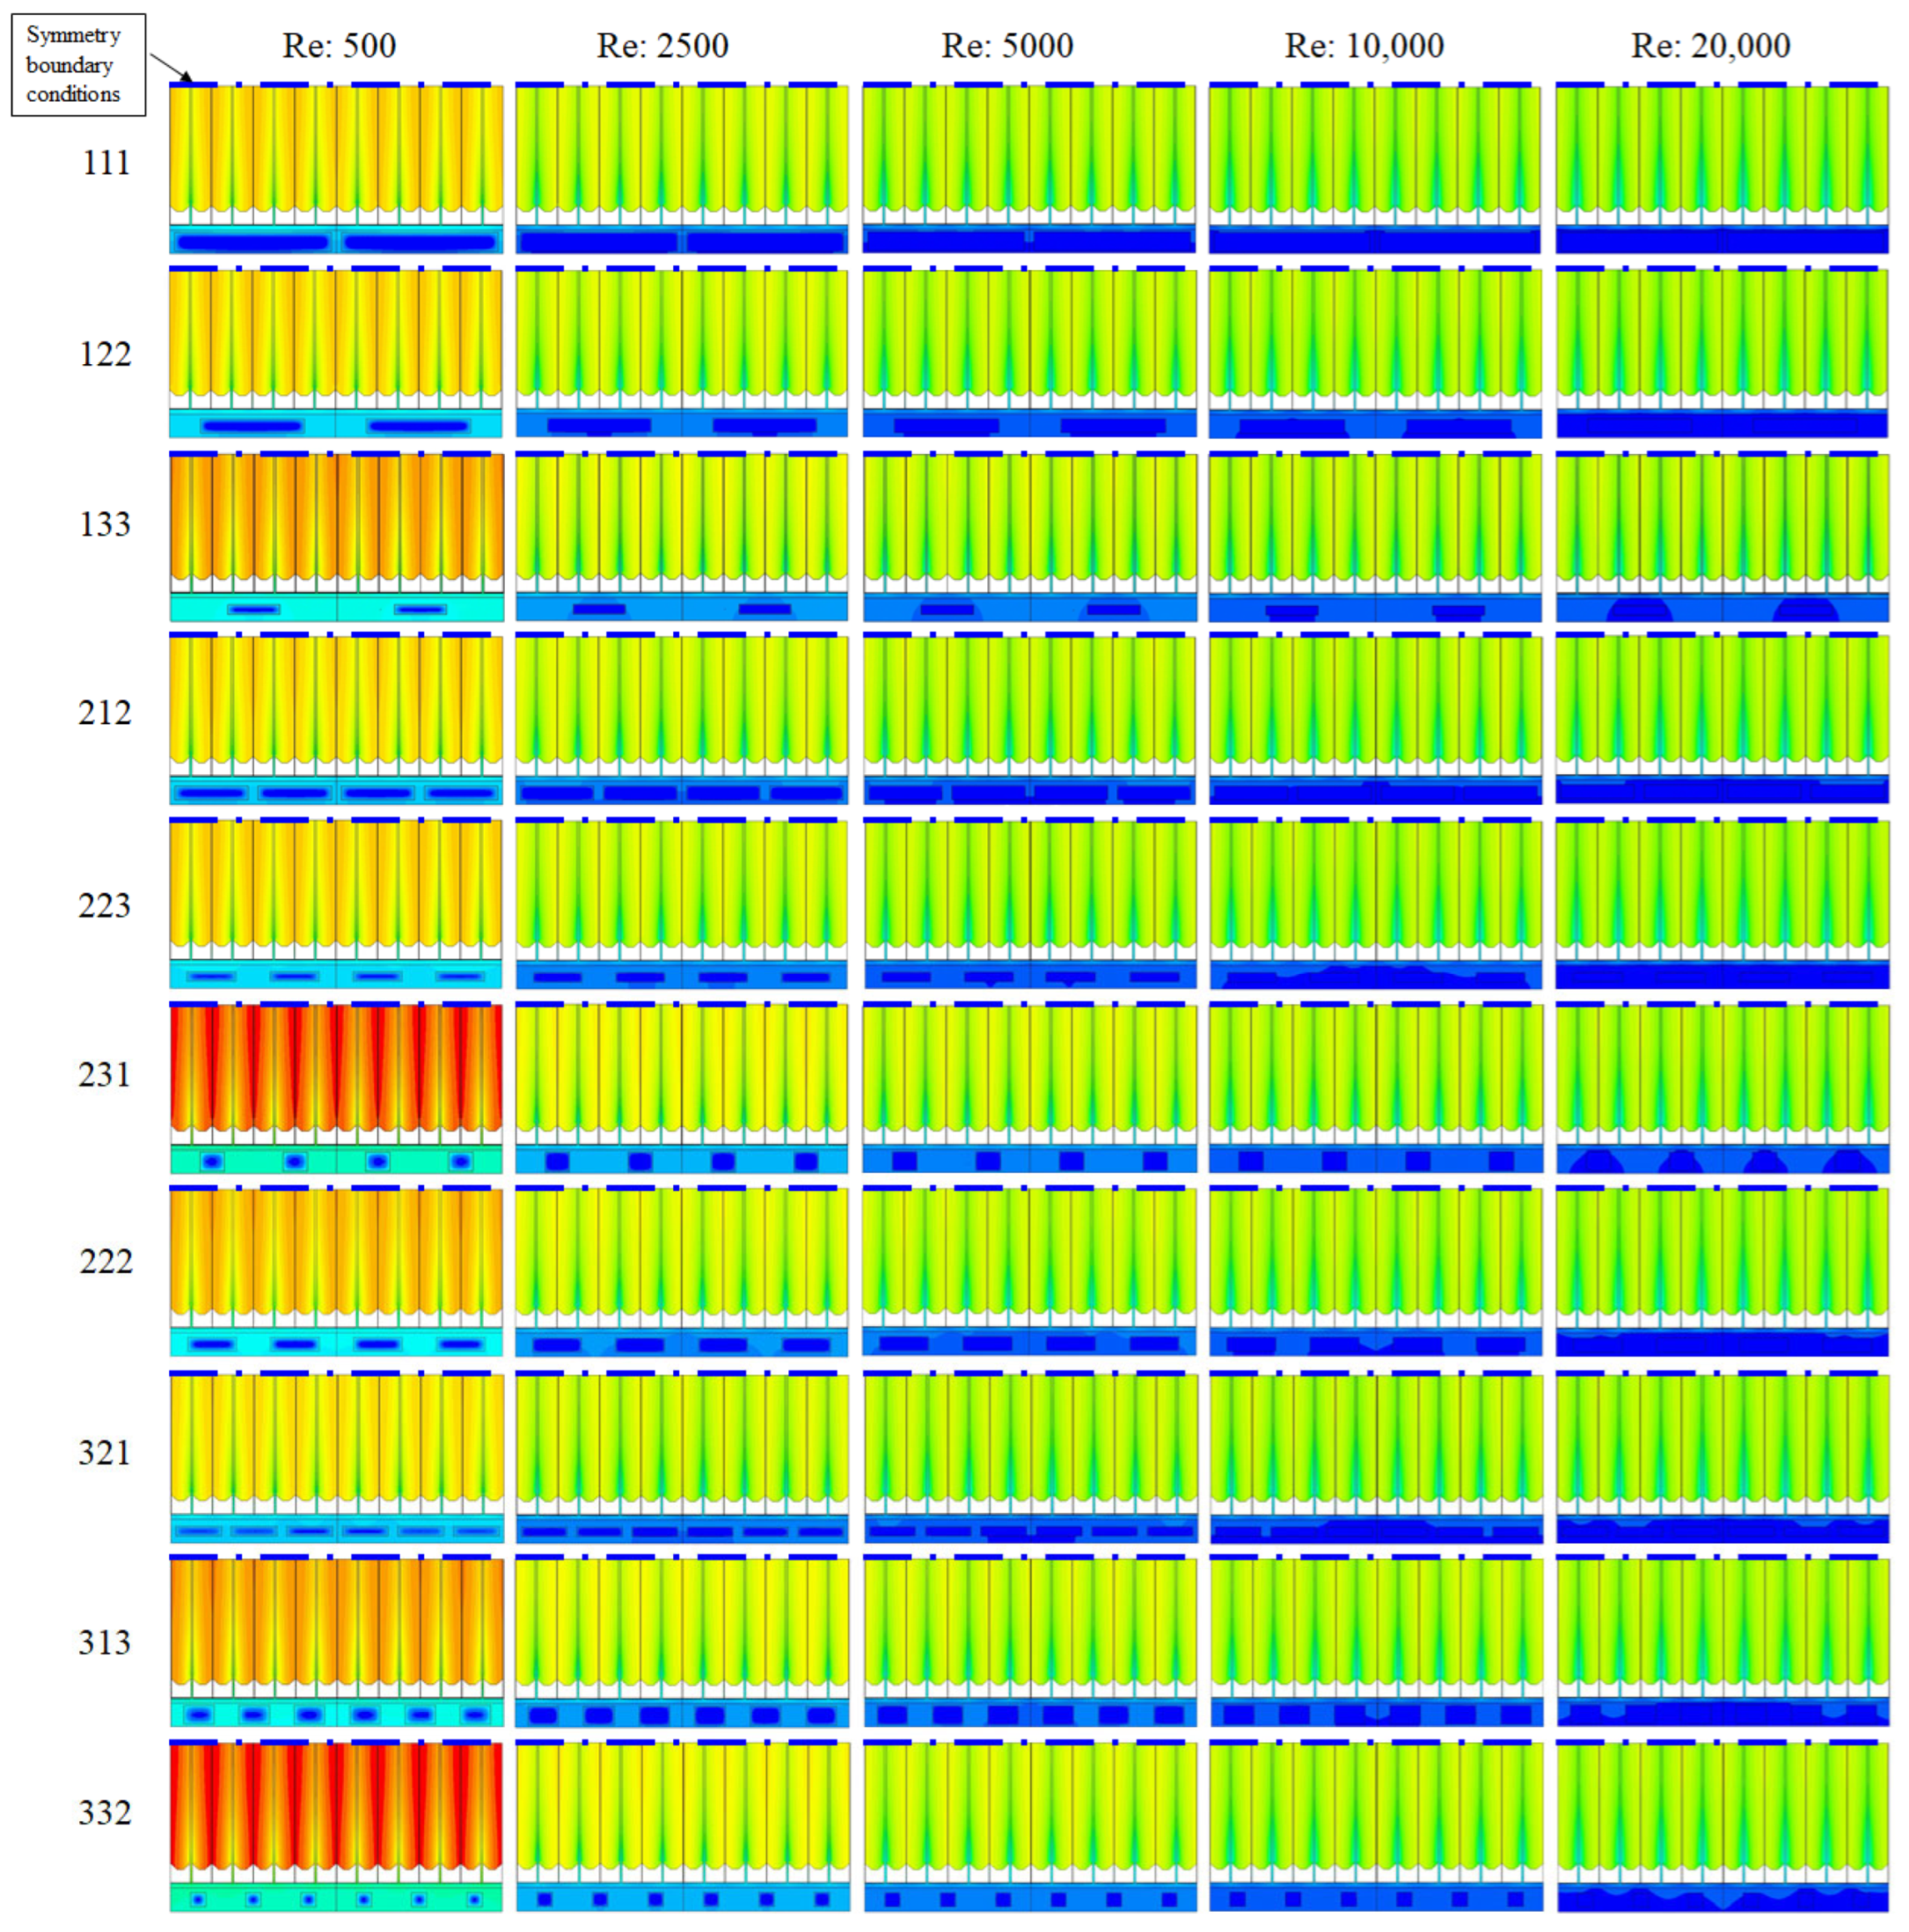
Figure 16 shows a comparison and analysis of sectional temperature distributions for each module unit according to the Re. In the figure, 111, 122, and 133 represent cases with two channels; 212, 223, 231, and 222 represent cases with four channels; and 321, 313, and 332 represent cases with six channels. Each case illustrates the temperature distribution according to the Re. The detailed dimensions of the channels are listed in Table 2. Regardless of the number of channels, the overall temperature decreased as the wetted area between the cold plate channel and cells increased. It was also found that cell temperature became more uniform with increasing Re. Under low Re conditions, the cell temperature decreased as the wetted area increased, while the number of channels had a relatively minor effect. Thus, it was confirmed that optimizing the wetted area is more critical than merely increasing the number of channels. Under high Re conditions, the temperature differences caused by geometric variation were less significant compared to those for low Re conditions.

4.3. Calculation of h and Nusselt Number

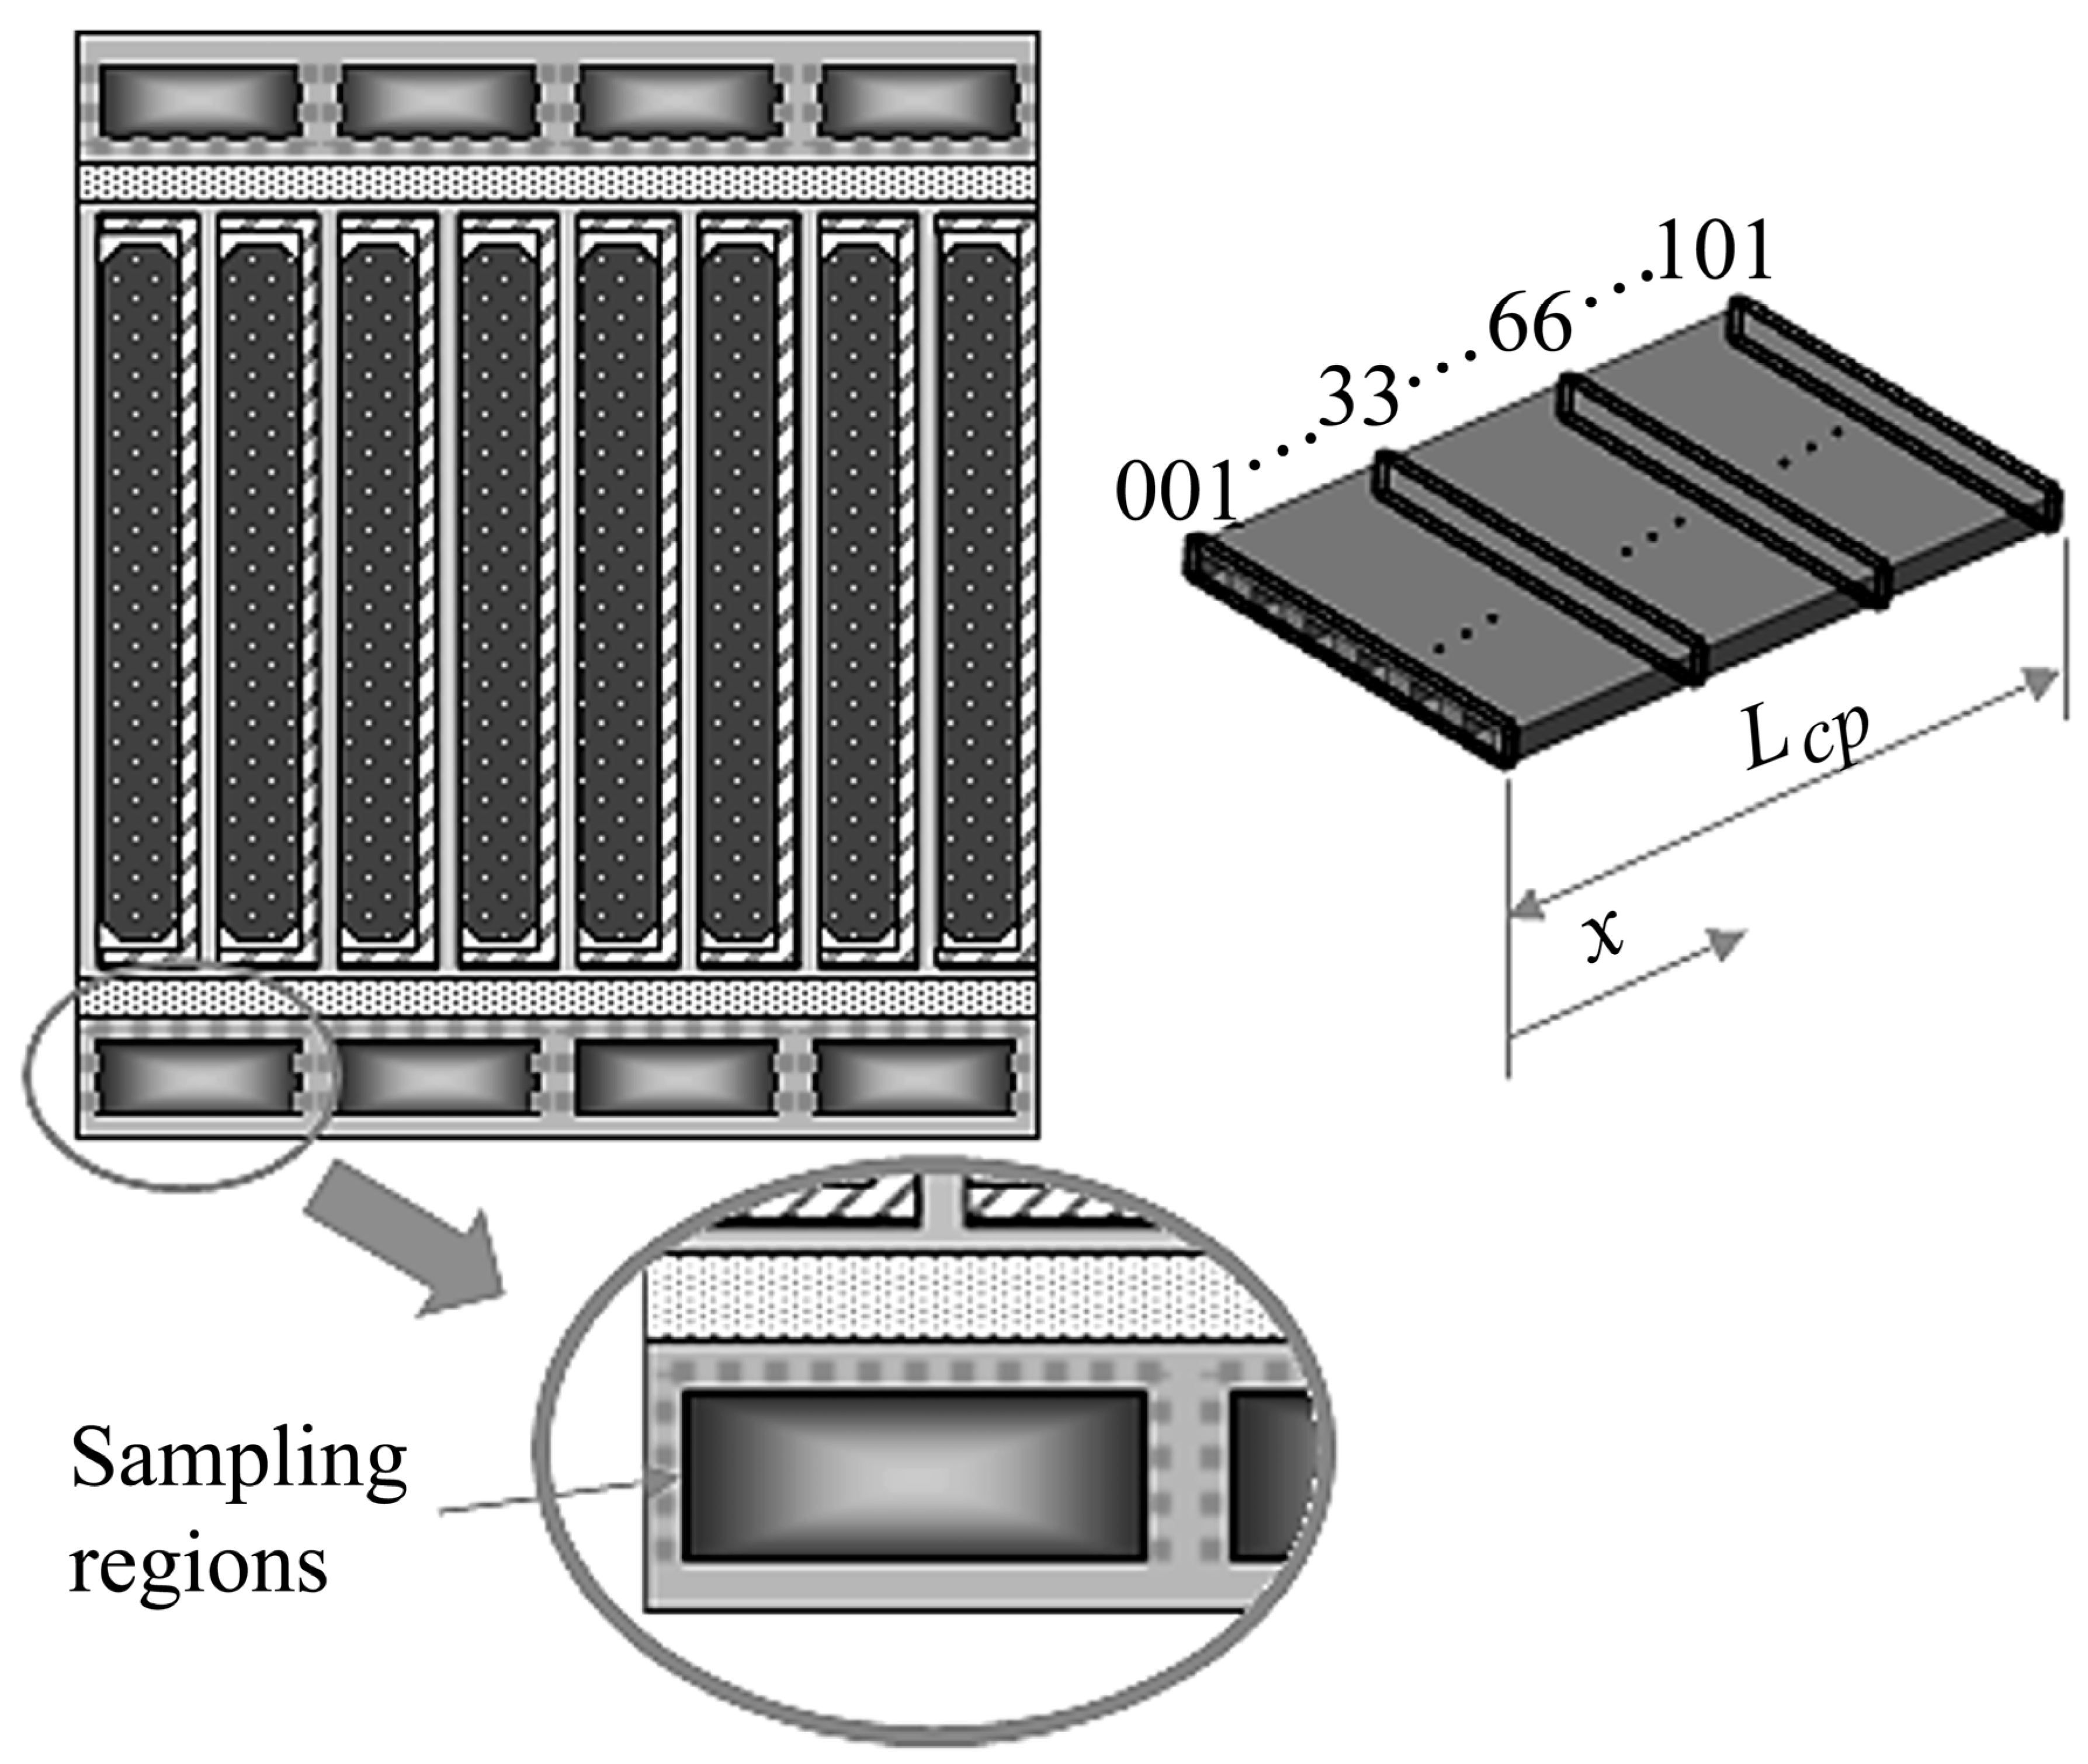
In this study, the local Nusselt number along the length of each channel geometry was calculated using MATLAB R2024a based on results analyzed with the STAR-CCM+ solver. Figure 17 shows the sampling regions for local Nusselt number calculation. The side closest to the heat source and the two adjacent sides were selected as sampling regions, based on ORTEGA’s 2022 study on rectangular micro-channels [36]. A total of 101 points were evenly spaced from the inlet to the outlet along the lengthwise direction of the cold plate, and samples were collected at these points.
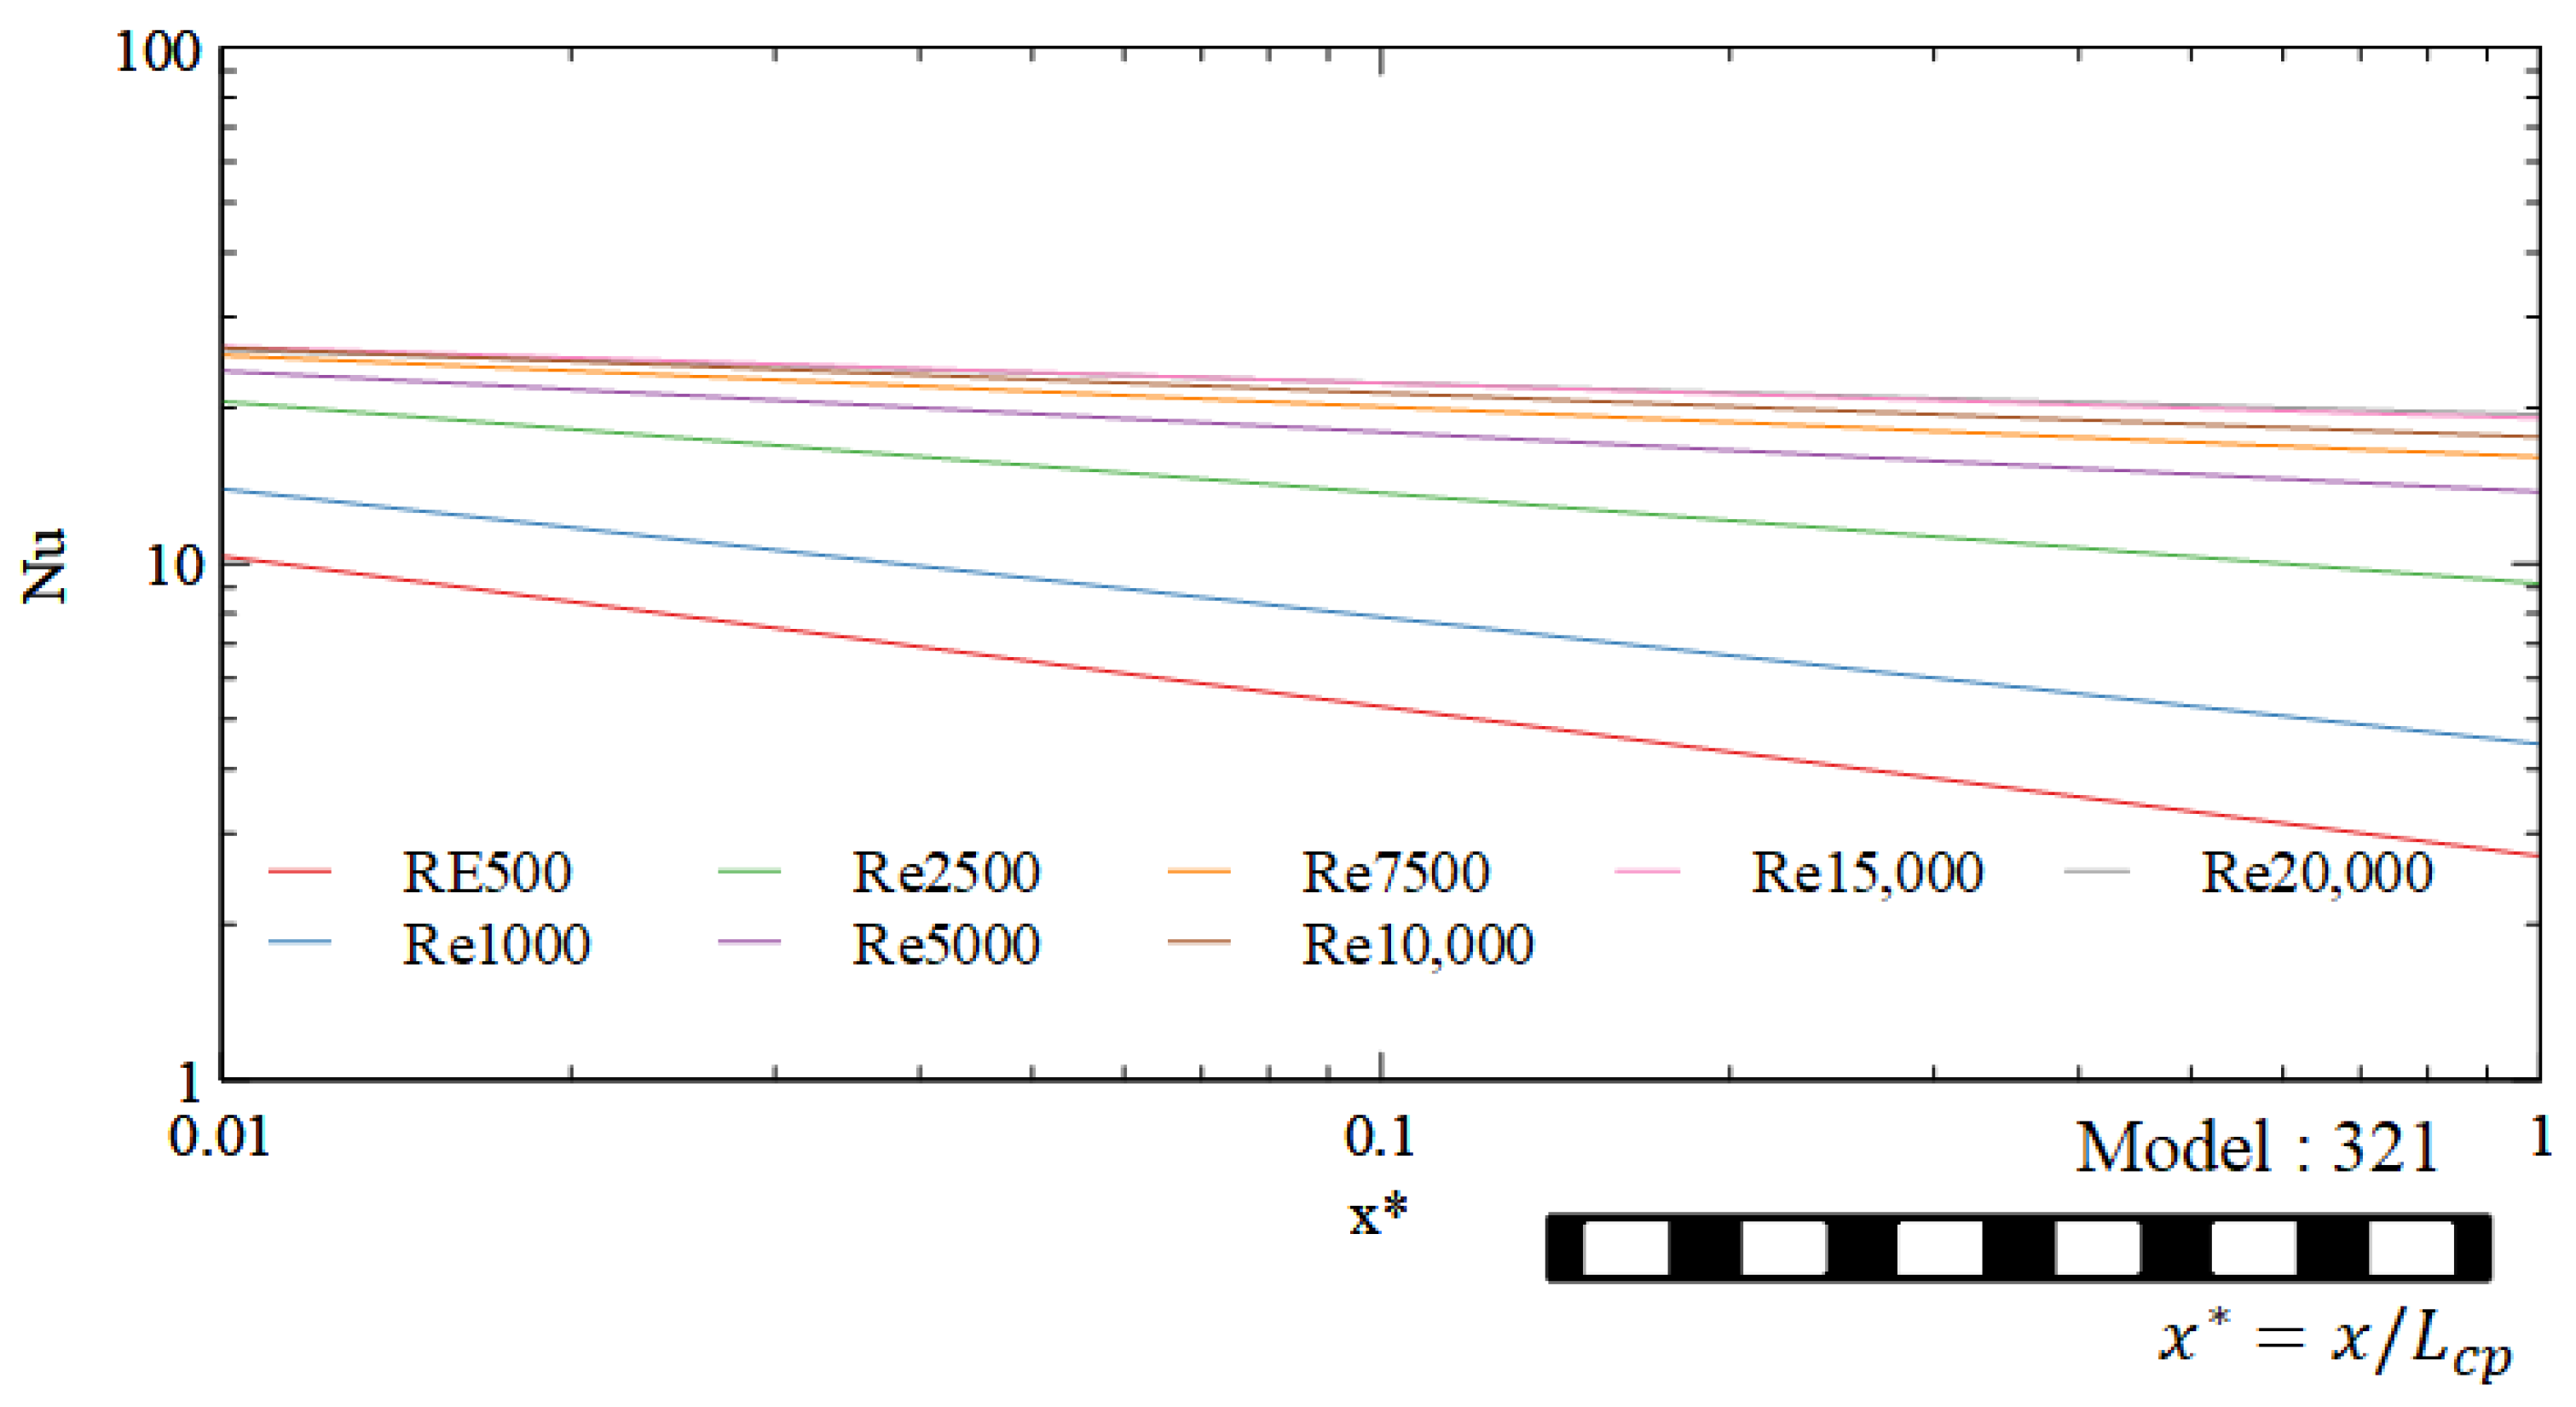
Figure 18 shows the local Nusselt number according to the non-dimensionalized distance x * in the cold plate length direction of the 321 model defined above. As the Re increased from 500 to 20,000, the change in the Nusselt number gradually decreased.
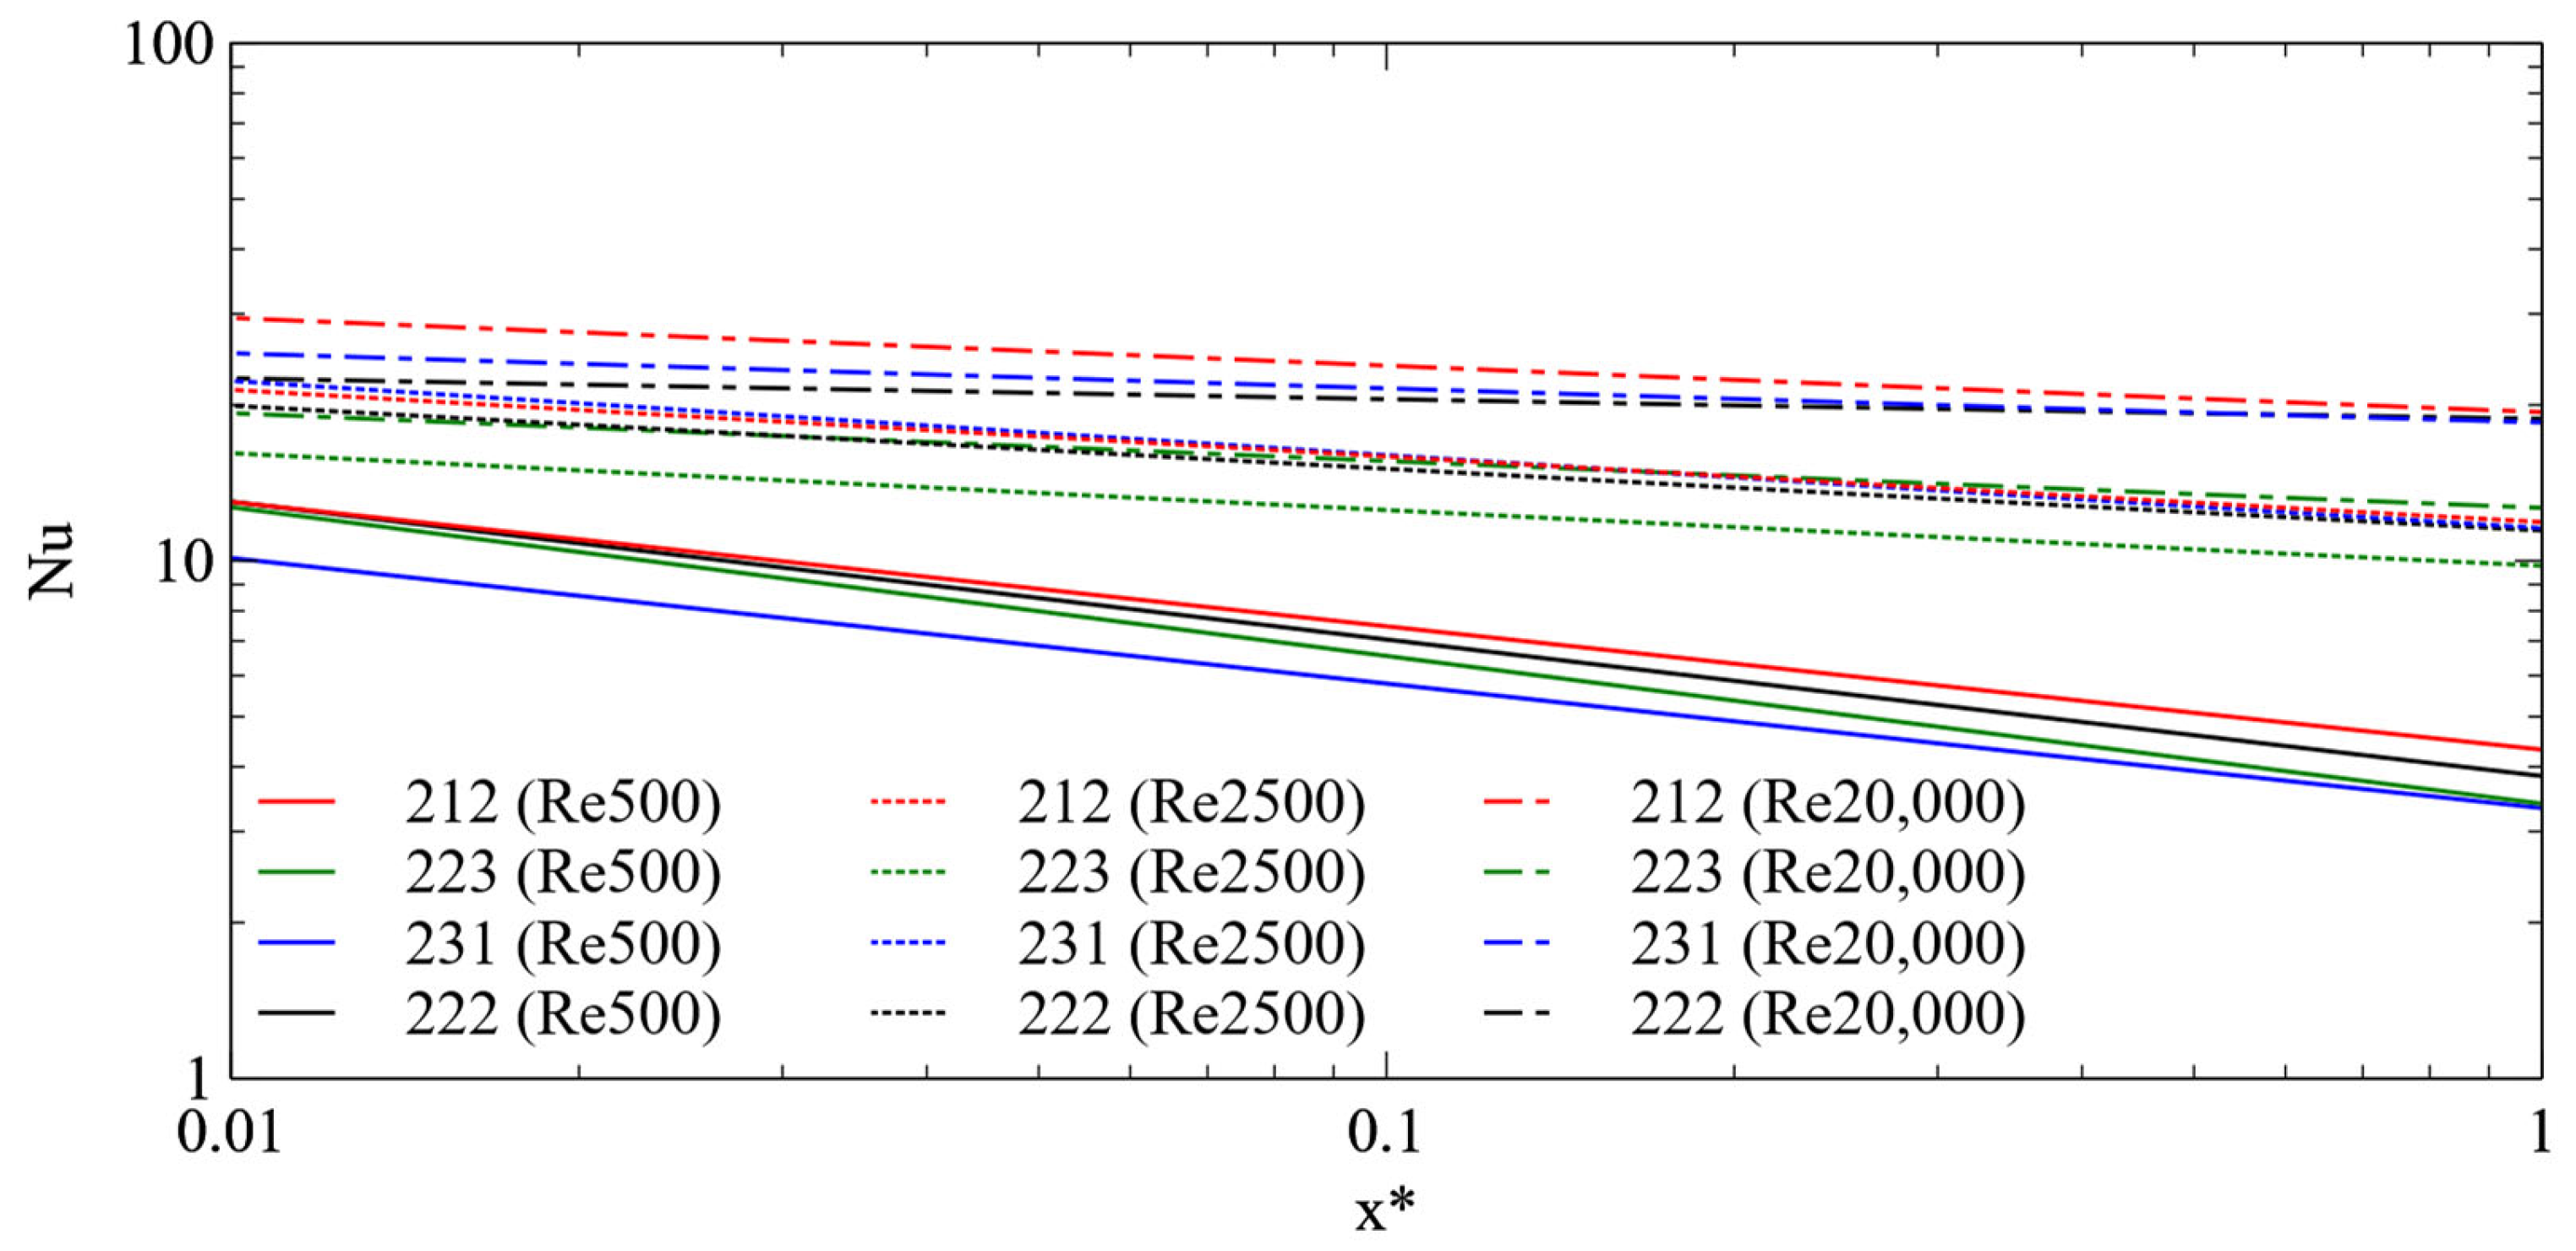
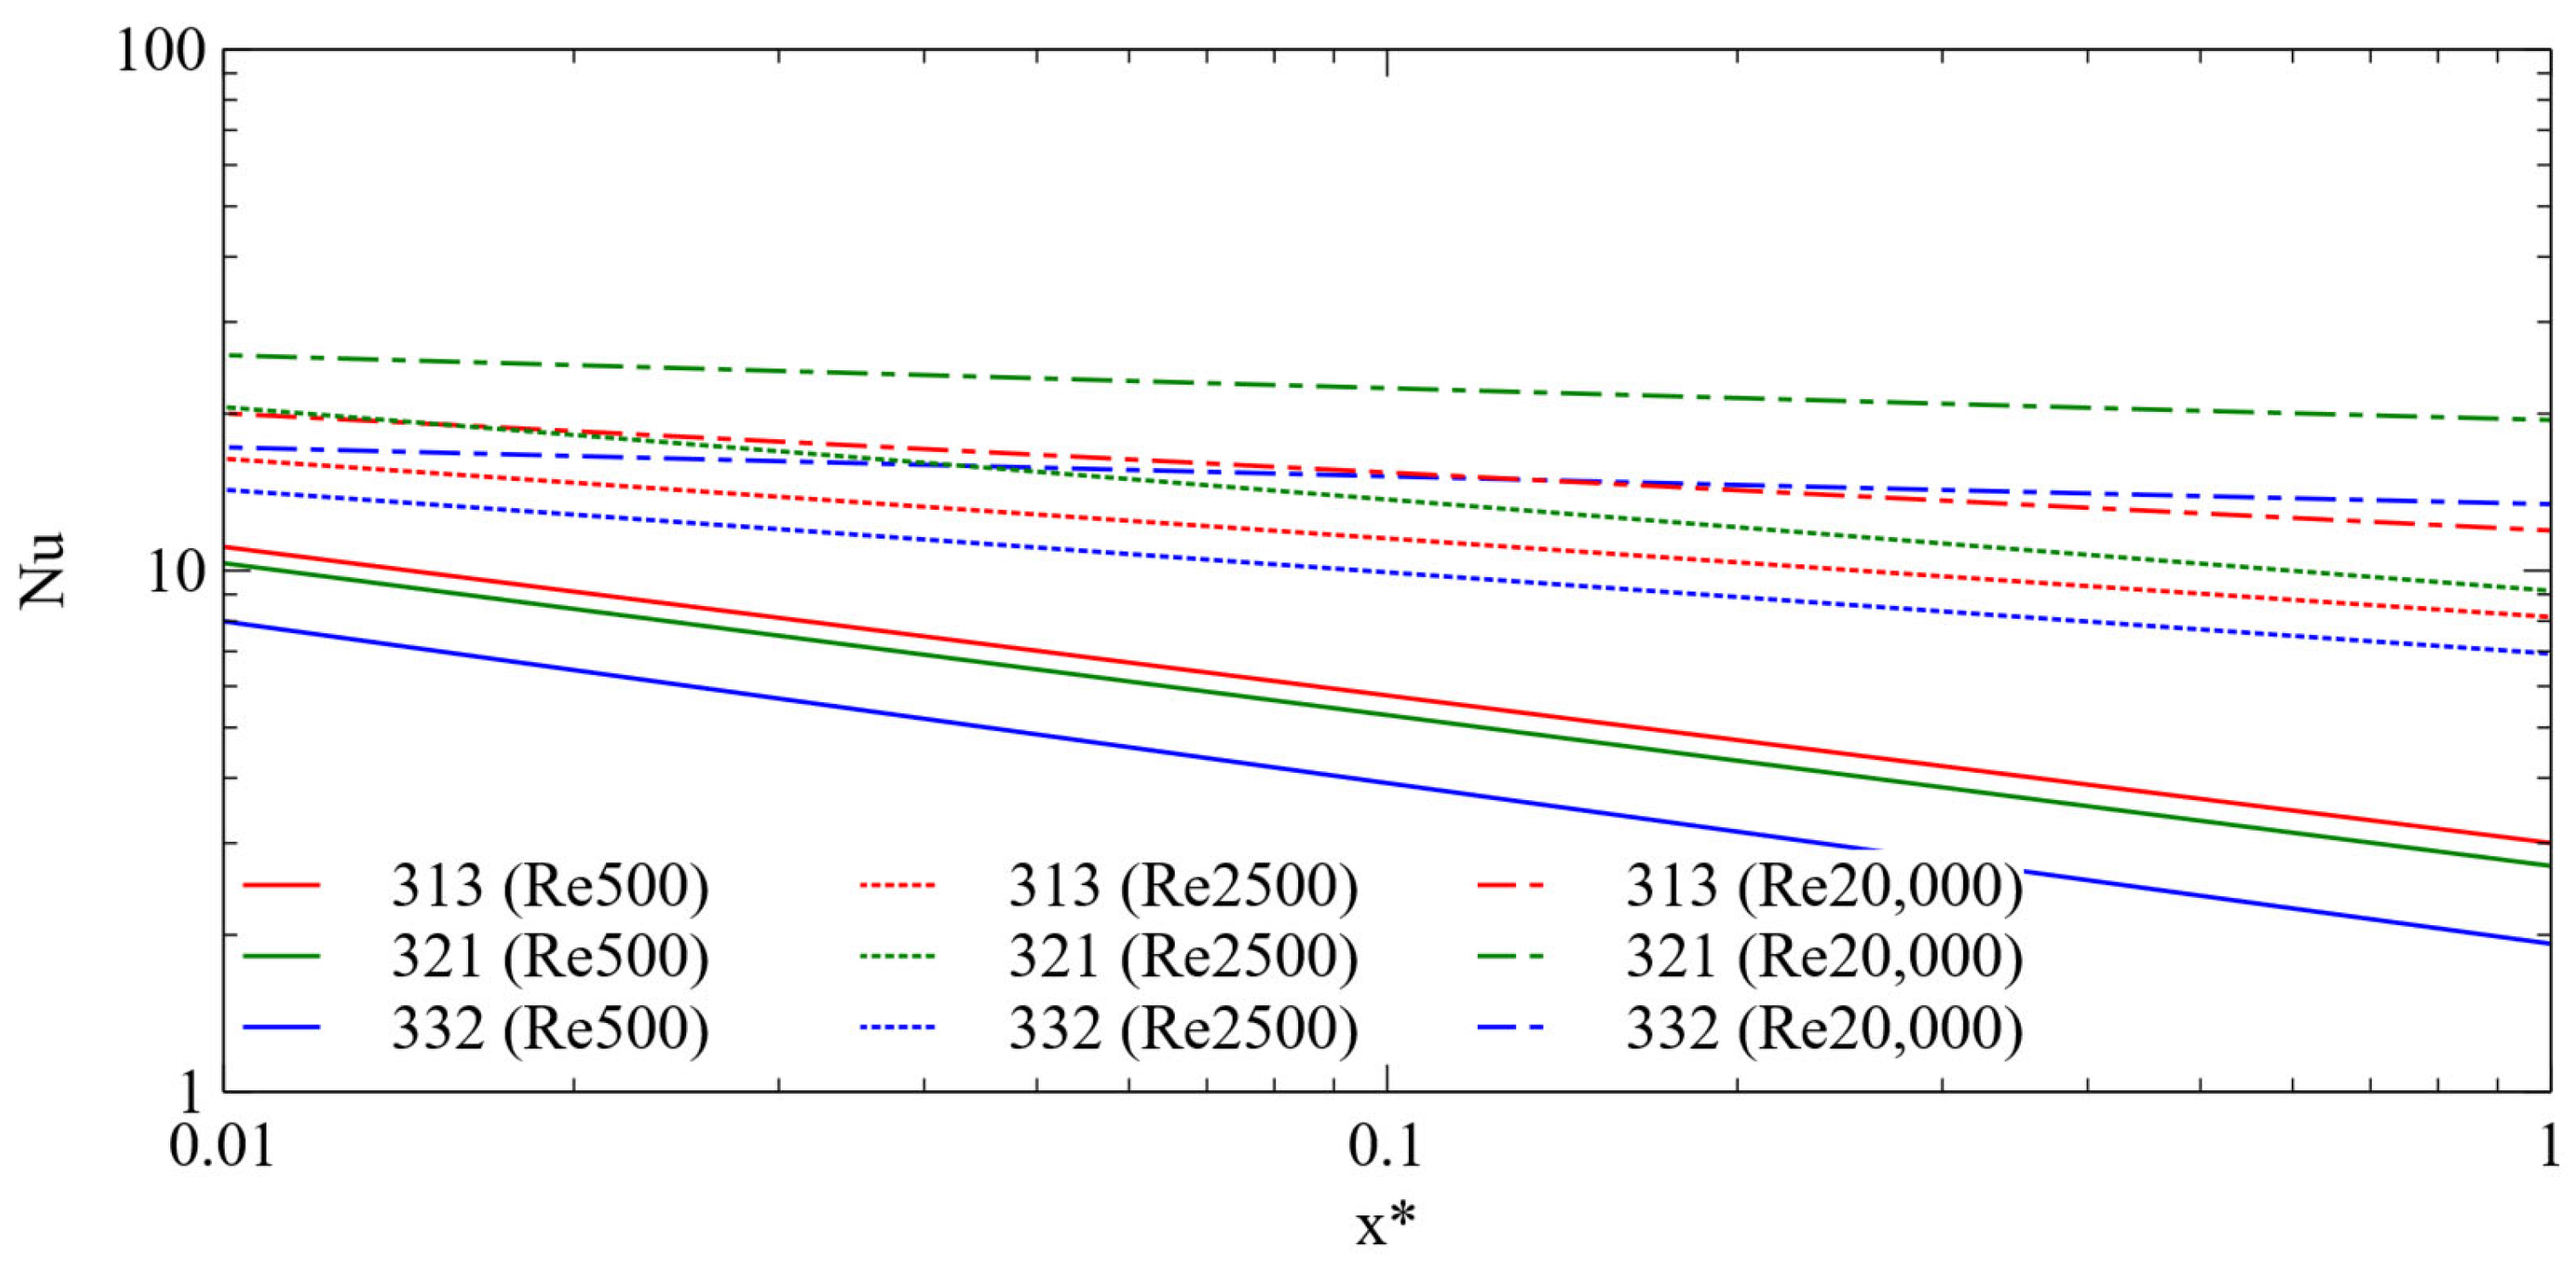
Figure 19, Figure 20 and Figure 21 show the local Nusselt number as a function of the non-dimensionalized distance x * for the two-, four-, and six-channel models, respectively. It was observed that the Nusselt number increased in proportion to the wetted area. Additionally, the reduction in Nusselt number along x * decreased with increasing Re. In the low Re range, the decrease in the local Nusselt number from inlet to outlet became more pronounced as the number of channels increased. This is likely due to the division of flow among the channels, resulting in lower average flow velocity in each channel. In conclusion, it was confirmed that maintaining a high Re is essential for uniform heat dissipation throughout the cold plate, regardless of the number of channels.

4.4. Development of Nusselt Number Correlations

To develop Nusselt number correlations for double-sided cold plates used in EV battery cooling, a literature review on existing correlations was conducted. It was found that correlations had already been developed for both laminar and turbulent flow regimes. Therefore, in this study, correlation development was separately conducted for laminar and turbulent regions. For the laminar region, correlations proposed by Stephan [37,38], Mortean and Mantelli [39], and Churchill and Usagi [40] were utilized, whereas for the turbulent region, correlations by Dittus-Boelter [41], Gnielinski [41], and Sparrow [37] were considered. These were compared with the correlations developed in this study.
The existing correlations were primarily developed for annular pipe geometries. Therefore, transformation functions were applied based on a study by Ortega et al. [36]. Equation (8) was applied to Churchill and Usagi’s [40] correlation, and Equation (7) to the remaining correlations.
G = 1 2.04 α + 3.08 α 2 - 2.47 α 3 + 1.05 α 4 0.18 α 5 .
where α = h w .
G = ( w h 2 + 1 ) / w h + 1 2 .
In this study, Nusselt number correlations for double-sided cold plates were developed using multiple linear regression based on the CFD analysis results. Equations (9) and (10) were developed for the laminar and turbulent regions, respectively. In the laminar region, the average error was 6.2% and the maximum error was 22.7%. In the turbulent region, the average and maximum errors were 5.02% and 19.3%, respectively. Cases with differences greater than 10% accounted for 13.8% of all cases. Figure 22 shows the results for the 111 model condition, with previous correlations also presented for comparison.
N u l a m = 0.0485572   R e 0.534635 w / p 0.210538 t / p 0.613617 t / h 0.264192 ,
N u t u r b = 2.76355 R e 0.096742 w / p 0.307845 t / p 0.369252 t / h - 0.052744 .

4.5. Development of Fanning f-factor Correlations

Fanning f-factor correlations were developed separately for the laminar and turbulent flow regions (Figure 23). For comparison, the three equations for laminar, transition, and turbulent regions proposed in [42] were used. However, these existing correlations were developed for annular pipes. Therefore, a transformation function was applied based on [43], converting the original equations for use in rectangular channels. The transformation function is given in Equation (11).
* w h ~ 2 3 + 11 24 ( h w ) ( 2 h W ) .
As with the Nusselt number, the Fanning f-factor correlations Equations (12) and (13) for the double-sided cold plates used in EV batteries were developed using multiple regression analysis based on the CFD results. Two separate equations were derived for the laminar and turbulent regions. In the laminar region, the average error was 5.8%, and the maximum error was 16.0%. In the turbulent region, the average and maximum errors were 2.8% and 10.0%, respectively. Cases with a difference of 10% or more accounted for approximately 7.5% of the 80 cases listed in Table 2. For comparison, existing correlations from previous studies are also shown.
f l a m = 5.74386   R e - 0.696374 w / p 0.157709 t / p 0.323306 t / h 0.246162 ,
f t u r b = 0.491773 R e - 0.457341 w / p 0.124249 t / p 0.541217 t / h 0.358301 .

4.6. Correlation Between Fanning f-factor and Colburn j-factor

The h value corresponding to each Re was calculated using the Nusselt number correlations Equations (9) and (10) developed earlier, along with the relationship between the Nusselt number and h shown in Equation (14). The Colburn j-factor was then calculated by substituting the calculated h value into Equation (15).
In addition, the goodness factor was calculated using Equation (16). Figure 24 illustrates the goodness factor as a function of Re for each model.
N u = h D h k f ,
j = h P r 2 / 3 ρ u c c p = N u   k f   D h P r 2 / 3 ρ u c c p ,
G o o d n e s s ° f a c t o r = j f .
The goodness factor was derived using the developed Nusselt number and Fanning f-factor correlations. As shown in Figure 22, contrary to earlier results that emphasized the influence of wetted area over the number of channels, the 321 model, with six channels, exhibited the best performance. Despite having a relatively lower heat transfer index than the other models, it showed superior dynamic performance. Moreover, among the models with the same number of channels, those with larger wetted areas achieved higher goodness factor values.

4.7. Channel Optimization

Figure 25 shows the mean signal-to-noise ratio for the goodness factor as a function of each parameter: ( p , w / w m a x , and h/t). As discussed in earlier sections, the study confirmed that cell temperature control is influenced by complex interactions among multiple parameters, rather than by any single factor. Therefore, the goodness factor was used for optimization, as it integrates both the non-dimensionalized heat dissipation index and the dynamic performance index. Channel geometry optimization was performed using the Taguchi method based on the goodness factor. Among the parameters analyzed, p was found to have the greatest influence on the goodness factor, followed by h/t and w / w m a x .
Based on the temperature distribution and average cell temperatures shown in Figure 14, it might be expected that w / w m a x , which is more directly related to wetted area, would have a greater impact than p, which is related to the number of channels. However, this expectation does not fully account for dynamic effects. Specifically, a reduction in wetted area can increase cell temperature, which in turn raises the temperature difference between the cold plate and coolant. This increase can slightly enhance the convective heat transfer coefficient in the channel, which directly affects the Nusselt number and Colburn j-factor, both of which are functions of h. Despite these interactions, higher performance was ultimately observed as w / w m a x increased, i.e., as the wetted area increased.
Furthermore, Figure 26 shows the results of channel optimization using RSM. These results were consistent with those obtained through the Taguchi method, thereby validating the effectiveness of the Taguchi-based optimization process. The geometry corresponding to the optimized result was identified as the 311 condition, as illustrated in Figure 27.

5. Conclusions

This study was conducted to address the need for a high-performance BTMS, driven by the increasing power demands of EV battery systems and the growing need for high-speed charging. Building on previous research on the recently commercialized sandwich double-sided cooling method, which enhances the heat transfer area through integrated cooling and support structures, this study optimized the cold plate’s channel geometry. Both heat dissipation and dynamic performance were considered in the optimization process. It was confirmed that structural optimization of all channel configurations contributed not only to improved heat transfer performance but also to enhanced system-level energy efficiency, such as reduced pressure drop.
Channel optimization was performed using the Taguchi method and RSM. Among the tested configurations, the 311 model—with six channels, the maximum manufacturable channel width ( w = 18.7 mm), and the highest h/t ratio (8 mm/1 mm)—exhibited the best combined performance for heat dissipation and fluid dynamics.
In this study, the local Nusselt numbers for each channel shape were compared and analyzed for double-sided cold plates with two to six rectangular channels for EVs, according to the Re. Based on this, the following characteristics could be confirmed.
-
For a fixed number of channels, the Nusselt number increases with wetted area.
-
As the Re increases, the decrease in Nusselt number along the non-dimensionalized distance x* decreases.
-
Maintaining a high Re helps minimize inlet effects and ensures uniform heat dissipation.
Furthermore, Nusselt number and Fanning f-factor correlations were developed using CFD and multiple linear regression analysis. Unlike prior correlations, which were typically derived under assumptions of constant wall temperature and heat flux in annular geometries, this study produced accurate correlations tailored to double-sided cooling systems for EV batteries. These correlations are expected to serve as practical design tools across various geometric configurations and Re ranges.

Author Contributions

Conceptualization: T.K.K. and H.-I.C.; Methodology: T.K.K., T.S.C. and J.-K.K.; Software: T.K.K. and H.-I.C.; Validation: T.K.K. and H.-I.C.; Data curation: J.-K.K., T.S.C. and H.-I.C.; Writing—original draft preparation: H.-I.C.; Writing—review and editing: T.K.K., T.S.C. and J.-K.K.; Visualization: J.-K.K., T.S.C. and H.-I.C.; Supervision: T.K.K.; Project administration: T.K.K. All authors have read and agreed to the published version of the manuscript.

Funding

This paper was supported by the Sabbatical Year Research Program of KOREATECH in 2024.

Institutional Review Board Statement

Not applicable.

Informed Consent Statement

Not applicable.

Data Availability Statement

The raw data supporting the conclusions of this article will be made available by the authors on request.

Conflicts of Interest

The authors declare no conflicts of interest.

Nomenclature

The following notations and Greek symbols are used in this manuscript:
C p Specific heat capacity [J/kg·K]
C-rateRate of charge
fFanning f-factor
F i n c e l l Fin on the cell
GFGoodnesss factor
G k Production of turbulent kinetic energy
HHeight of cold plate [mm]
hHeight of channel [mm]
jColburn j-factor
kThermal conductivity [W/m·K]
LchLength of channel [mm]
NNumber of channels
N e r r o r 10 % Number of cases with above 10% error
NuNusselt number
N t o t a l Number of total cases
PPressure [Pa]
P Pressure drop [Pa]
p Pitch of channel
R e Reynolds number
tThickness between top surface of the cold plate and channel [mm]
T Temperature [K]
T ¯ Average temperature of cell
T Temperature difference of cell
T m a x Maximum temperature of cell
T m i n Minimum temperature of cell
U Time-averaged velocity [m/s]
u i u j ¯ Reynolds stress tensor [m2/s2]
u i T ¯ Turbulent heat flux component [K·m/s]
V C o o l a n t Volume of coolant region
W Width of cold plate [mm]
w Width of channel [mm]
w m a x Maximum width of channel [mm]
x i ,   x j Spatial   coordinate   in   i ,   j directions [m]
ε Dissipation rate of turbulent kinetic energy
μ Viscosity
μ t Turbulent eddy viscosity
ρ density

References

  1. König, A.; Mayer, S.; Nicoletti, L.; Tumphart, S.; Lienkamp, M. The impact of HVAC on the development of autonomous and electric vehicle concepts. Energies 2022, 15, 441. [Google Scholar] [CrossRef]
  2. Evtimov, I.; Ivanov, R.; Sapundjiev, M. Energy consumption of auxiliary systems of electric cars. MATEC Web Conf. EDP Sci. 2017, 133, 06002. [Google Scholar] [CrossRef]
  3. Cavalcante, I.; Rodrigues da Silva, A.; Zajc, M.; Mendek, I.; Calearo, L.; Malkova, A.; Ziras, C.; Pediaditis, P.; Michos, K.; Mateus, J.; et al. Dataset on electric road mobility: Historical and evolution scenarios until 2050. Sci. Data 2024, 11, 1019. [Google Scholar] [CrossRef] [PubMed]
  4. Oech, A.K.; Mwandila, G.; Mulolani, F. A review of improvements on electric vehicle battery. Heliyon 2024, 10, e34806. [Google Scholar] [CrossRef] [PubMed]
  5. Chung, Y.; Kim, M.S. Thermal analysis and pack level design of battery thermal management system with liquid cooling for electric vehicles. Energy Convers. Manag. 2019, 196, 105–116. [Google Scholar] [CrossRef]
  6. Guo, Q.; Liu, S.; Zhang, J.; Huang, Z.; Han, D. Effects of charging rates on heat and gas generation in lithium-ion battery thermal runaway triggered by high temperature coupled with overcharge. J. Power Sources 2024, 600, 234237. [Google Scholar] [CrossRef]
  7. Kampker, A.; Heimes, H.H.; Offermanns, C.; Vienenkötter, J.; Robben, T. Framework and classification of battery system architectures. World Electr. Veh. J. 2023, 14, 88. [Google Scholar] [CrossRef]
  8. Ma, Y.; Teng, H.; Thelliez, M. Electro-thermal modeling of a lithium-ion battery system. SAE Int. J. Engines 2010, 3, 306–317. [Google Scholar] [CrossRef]
  9. Hettesheimer, T.; Neef, C.; Rosellón Inclán, I.; Link, S.; Schmaltz, T.; Schuckert, F.; Stephan, A.; Stephan, M.; Thielmann, A.; Weymann, L.; et al. Lithium-Ion Battery Roadmap-Industrialization Perspectives Toward 2030; Fraunhofer: Munich, Germany, 2023. [Google Scholar] [CrossRef]
  10. Yi, Z.; Wei, P.; Zhang, H.; Sun, H.; Zeng, S.; Yu, H. Wide range temperature thermal performance of power battery module with double-sided thermoelectric device system with high energy efficiency. Appl. Therm. Eng. 2023, 227, 120375. [Google Scholar] [CrossRef]
  11. Cai, Y.; Sun, Q.; Gu, X.; Li, Y.; Luo, W.; Zhang, Y.; Zhang, B.; Huang, G.; Dong, K. Multi-objective optimization of battery thermal management system based on a novel embedded hybrid cooling plate considering time-based early shutdown strategy. Energy 2024, 312, 133419. [Google Scholar] [CrossRef]
  12. Madaoui, S.; Guzowski, B.; Gozdur, R.; Dimitrova, Z.; Audiot, N.; Sabatier, J.; Vinassa, J.M.; Guillemard, F. Evaluation of dual side cooling system for prismatic batteries for vehicle applications. In Proceedings of the 36th International Conference on Efficiency, Cost, Optimization, Simulation and Environmental Impact on Energy Systems (ECOS 2023), Las Palmas de Gran Canaria, Spain, 25–30 June 2023; pp. 2218–2228. [Google Scholar] [CrossRef]
  13. Li, J.; Zhang, H. Thermal characteristics of power battery module with composite phase change material and external liquid cooling. Int. J. Heat Mass Transf. 2020, 156, 119820. [Google Scholar] [CrossRef]
  14. Zhao, J.; Rao, Z.; Li, Y. Thermal performance of mini-channel liquid cooled cylinder based battery thermal management for cylindrical lithium-ion power battery. Energy Convers. Manag. 2015, 103, 157–165. [Google Scholar] [CrossRef]
  15. Zhang, C.; Li, K.; Mcloone, S.; Yang, Z. Battery modelling methods for electric vehicles–A review. In Proceedings of the European Control Conference (ECC 2014), Strasbourg, France, 24–27 June 2014; pp. 2673–2678. [Google Scholar] [CrossRef]
  16. Liu, G.; Ouyang, M.; Lu, L.; Li, J.; Han, X. Analysis of the heat generation of lithium-ion battery during charging and discharging considering different influencing factors. J. Therm. Anal. Calorim. 2014, 116, 1001–1010. [Google Scholar] [CrossRef]
  17. Aruna, P.; Vasan Prabhu, V.; Krishnakumar, V.; Velmurugan, P. Review on lithium-ion battery modeling techniques for electric vehicle applications. In Lecture Notes in Electrical Engineering; Dhar, S., Do, D.T., Sur, S.N., Liu, C.M., Eds.; Springer: Singapore, 2022; Volume 1037, pp. 551–565. ISBN 978-981-99-1983-3. [Google Scholar] [CrossRef]
  18. Saw, L.H.; Ye, Y.; Tay, A.A.O. Electro-thermal characterization of lithium iron phosphate cell with equivalent circuit modeling. Energy Convers. Manag. 2014, 87, 367–377. [Google Scholar] [CrossRef]
  19. Bamrah, P.; Kumar Chauhan, M.; Singh Sikarwar, B. CFD analysis of battery thermal management system. J. Phys. Conf. S. 2022, 2178, 012035. [Google Scholar] [CrossRef]
  20. Shang, Z.; Qi, H.; Liu, X.; Ouyang, C.; Wang, Y. Structural optimization of lithium-ion battery for improving thermal performance based on a liquid cooling system. Int. J. Heat Mass Transf. 2019, 130, 33–41. [Google Scholar] [CrossRef]
  21. Nigel. 2020 Rimac Nevera. 2023. Available online: https://www.batterydesign.net/2020-rimac-nevera/#:-:text=Liquid%20Cooling%20%C2%B7%20Flow%20rate,4 (accessed on 3 August 2025).
  22. Gotion. Multi-National Academicians Discussed the Development of New Energy in Hefei, Gotion Astroinno Batteries Will Be in Mass Production Next Year. 2023. Available online: https://en.gotion.com.cn/news/company-news-260.html (accessed on 3 August 2025).
  23. Contemporary Amperex Technology Co., Limited; Song, F.T. Water Cooling Plate Assembly, Cooling System, Battery and Enclosure, and Electrical Device. Patent CN114497826A, 18 April 2022. [Google Scholar]
  24. Gao, H.; Hou, X.; Ma, W.; Ma, Y. Design and Thermal Performance Analysis of a Liquid Cooling Plate Based on Gradually Varied Circular Notched Fins for Lithium-Ion Batteries. Processes 2025, 13, 924. [Google Scholar] [CrossRef]
  25. Mokhtari, A.; Jalalvand, M. Effect of flow pattern and channel cross section on thermal management of cylindrical batteries with solid blocks containing liquid channels: A Mokhtari and M Jalalvand. Indian J. Phys. 2025, 99, 4223–4238. [Google Scholar] [CrossRef]
  26. Zhang, H.; Ganesan, P.; Sharma, R.; Zubir, M.N.B.M.; Badruddin, I.A.; Chong, W.T. A novel overflow channel design of manifold cold plate for lithium-ion battery: A CFD study. Process Saf. Environ. Prot. 2024, 189, 648–663. [Google Scholar] [CrossRef]
  27. Alvarez, S. Tesla 4680 Cells Compared with BYD Blade and CATL Qilin Structural Batteries. 2022. Available online: https://www.teslarati.com/tesla-4680-vs-byd-blade-vs-catl-qilin-structural-batteries-video/ (accessed on 3 August 2025).
  28. Ye, Y.; Saw, L.H.; Shi, Y.; Tay, A.A. Numerical analyses on optimizing a heat pipe thermal management system for lithium-ion batteries during fast charging. Appl. Therm. Eng. 2015, 86, 281–291. [Google Scholar] [CrossRef]
  29. Zuo, W.; Zhang, Y.; E, J.; Huang, Y.; Li, Q.; Zhou, K.; Zhang, G. Effects of multi-factors on performance of an improved multi-channel cold plate for thermal management of a prismatic LiFePO4 battery. Energy 2022, 261, 125384. [Google Scholar] [CrossRef]
  30. Hosseinzadeh, E.; Barai, A.; Marco, J.; Jennings, P.A. A comparative study on different cooling strategies for lithium-ion battery cells. In Proceedings of the European Battery, Hybrid and Fuel Cell Electric Vehicle Congress (EEVC 2017) Proceedings, Geneva, Switzerland, 14–16 March 2017; pp. 1–9. [Google Scholar]
  31. Alzwayi, A.; Paul, M.C. Heat transfer enhancement of a lithium-ion battery cell using vertical and spiral cooling fins. Therm. Sci. Eng. Prog. 2024, 47, 102304. [Google Scholar] [CrossRef]
  32. Choi, H.; Lee, H.; Han, U.; Jung, J.; Lee, H. Comparative Evaluation of Liquid Cooling-Based Battery Thermal Management Systems: Fin Cooling, PCM Cooling, and Intercell Cooling. Int. J. Energy Res. 2024, 2024, 5395508. [Google Scholar] [CrossRef]
  33. Kuznetcov, A.; Telichev, I.; Wu, C.Q. Effect of thin-walled tube geometry on its crashworthiness performance. In Proceedings of the International LS-DYNA Users Conference, Dearborn, MI, USA, 12–14 June 2016; pp. 1–12. [Google Scholar]
  34. GW. Understanding the Minimum Wall Thickness for Aluminum Extrusion. 2025. Available online: https://hplmachining.com/blog/the-minimum-thickness-for-aluminum-extrusion/#:~:text=match%20at%20L316%20minimum%20wall,Meeting%20international%20requirements%20like%20ISO (accessed on 3 August 2025).
  35. Schadegg, J. Common Design Mistakes to Avoid in Extruded Parts. 2022. Available online: https://www.xometry.com/resources/extrusion/extrusion-design-tips/#:~:text=Wall%20thickness%20and%20balance%20play,help%20avoid%20costly%20secondary%20operations (accessed on 3 August 2025).
  36. Ortega, A.; Caceres, C.; Uras, U.; Kisitu, D.; Chowdhury, U.; Radmard, V.; Heydari, A. Determination of the thermal performance limits for single phase liquid cooling using an improved effectiveness-NTU cold plate model. In Proceedings of the International Electronic Packaging Technical Conference and Exhibition, Garden Grove, CA, USA, 25–27 October 2022; p. V001T01A008. [Google Scholar] [CrossRef]
  37. Dudchenko, A.V.; Hardikar, M.; Anand, A.; Xin, R.; Wang, R.; Gopu, C.; Mauter, M.S. Guidance on Nusselt number correlation selection in membrane distillation. ACS EST Eng. 2022, 2, 1425–1434. [Google Scholar] [CrossRef]
  38. Stephan, K. Wärmeübergang und Druckabfall bei nicht ausgebildeter Laminarströmung in Rohren und in ebenen Spalten: Wärmeübergang und Druckabfall bei nicht ausgebildeter Laminarströmung in Rohren und in ebenen Spalten. Chem. Ing. Tech. 1959, 31, 773–778. [Google Scholar] [CrossRef]
  39. Mortean, M.V.V.; Mantelli, M.B.H. Nusselt number correlation for compact heat exchangers in transition regimes. Appl. Therm. Eng. 2019, 151, 514–522. [Google Scholar] [CrossRef]
  40. Churchill, S.W.; Usagi, R. A general expression for the correlation of rates of transfer and other phenomena. AIChE J. 1972, 18, 1121–1128. [Google Scholar] [CrossRef]
  41. Incropera, F.P.; DeWitt, D.P.; Bergman, T.L.; Lavine, A.S. Principles of Heat and Mass Transfer, 7th ed.; John Wiley & Sons: Singapore, 2013; pp. 484–485. ISBN 978-04-7064-615-1. [Google Scholar]
  42. Vijayan, P.K.; Nayak, A.K.; Kumar, N. Single-Phase, Two-Phase and Supercritical Natural Circulation Systems; Elsevier: Duxford, UK, 2019; pp. 69–118. ISBN 978-00-8102-487-4. [Google Scholar]
  43. Jones, O.C. An improvement in the calculation of turbulent friction in rectangular ducts. J. Fluids Eng. 1976, 98, 173–180. [Google Scholar] [CrossRef]
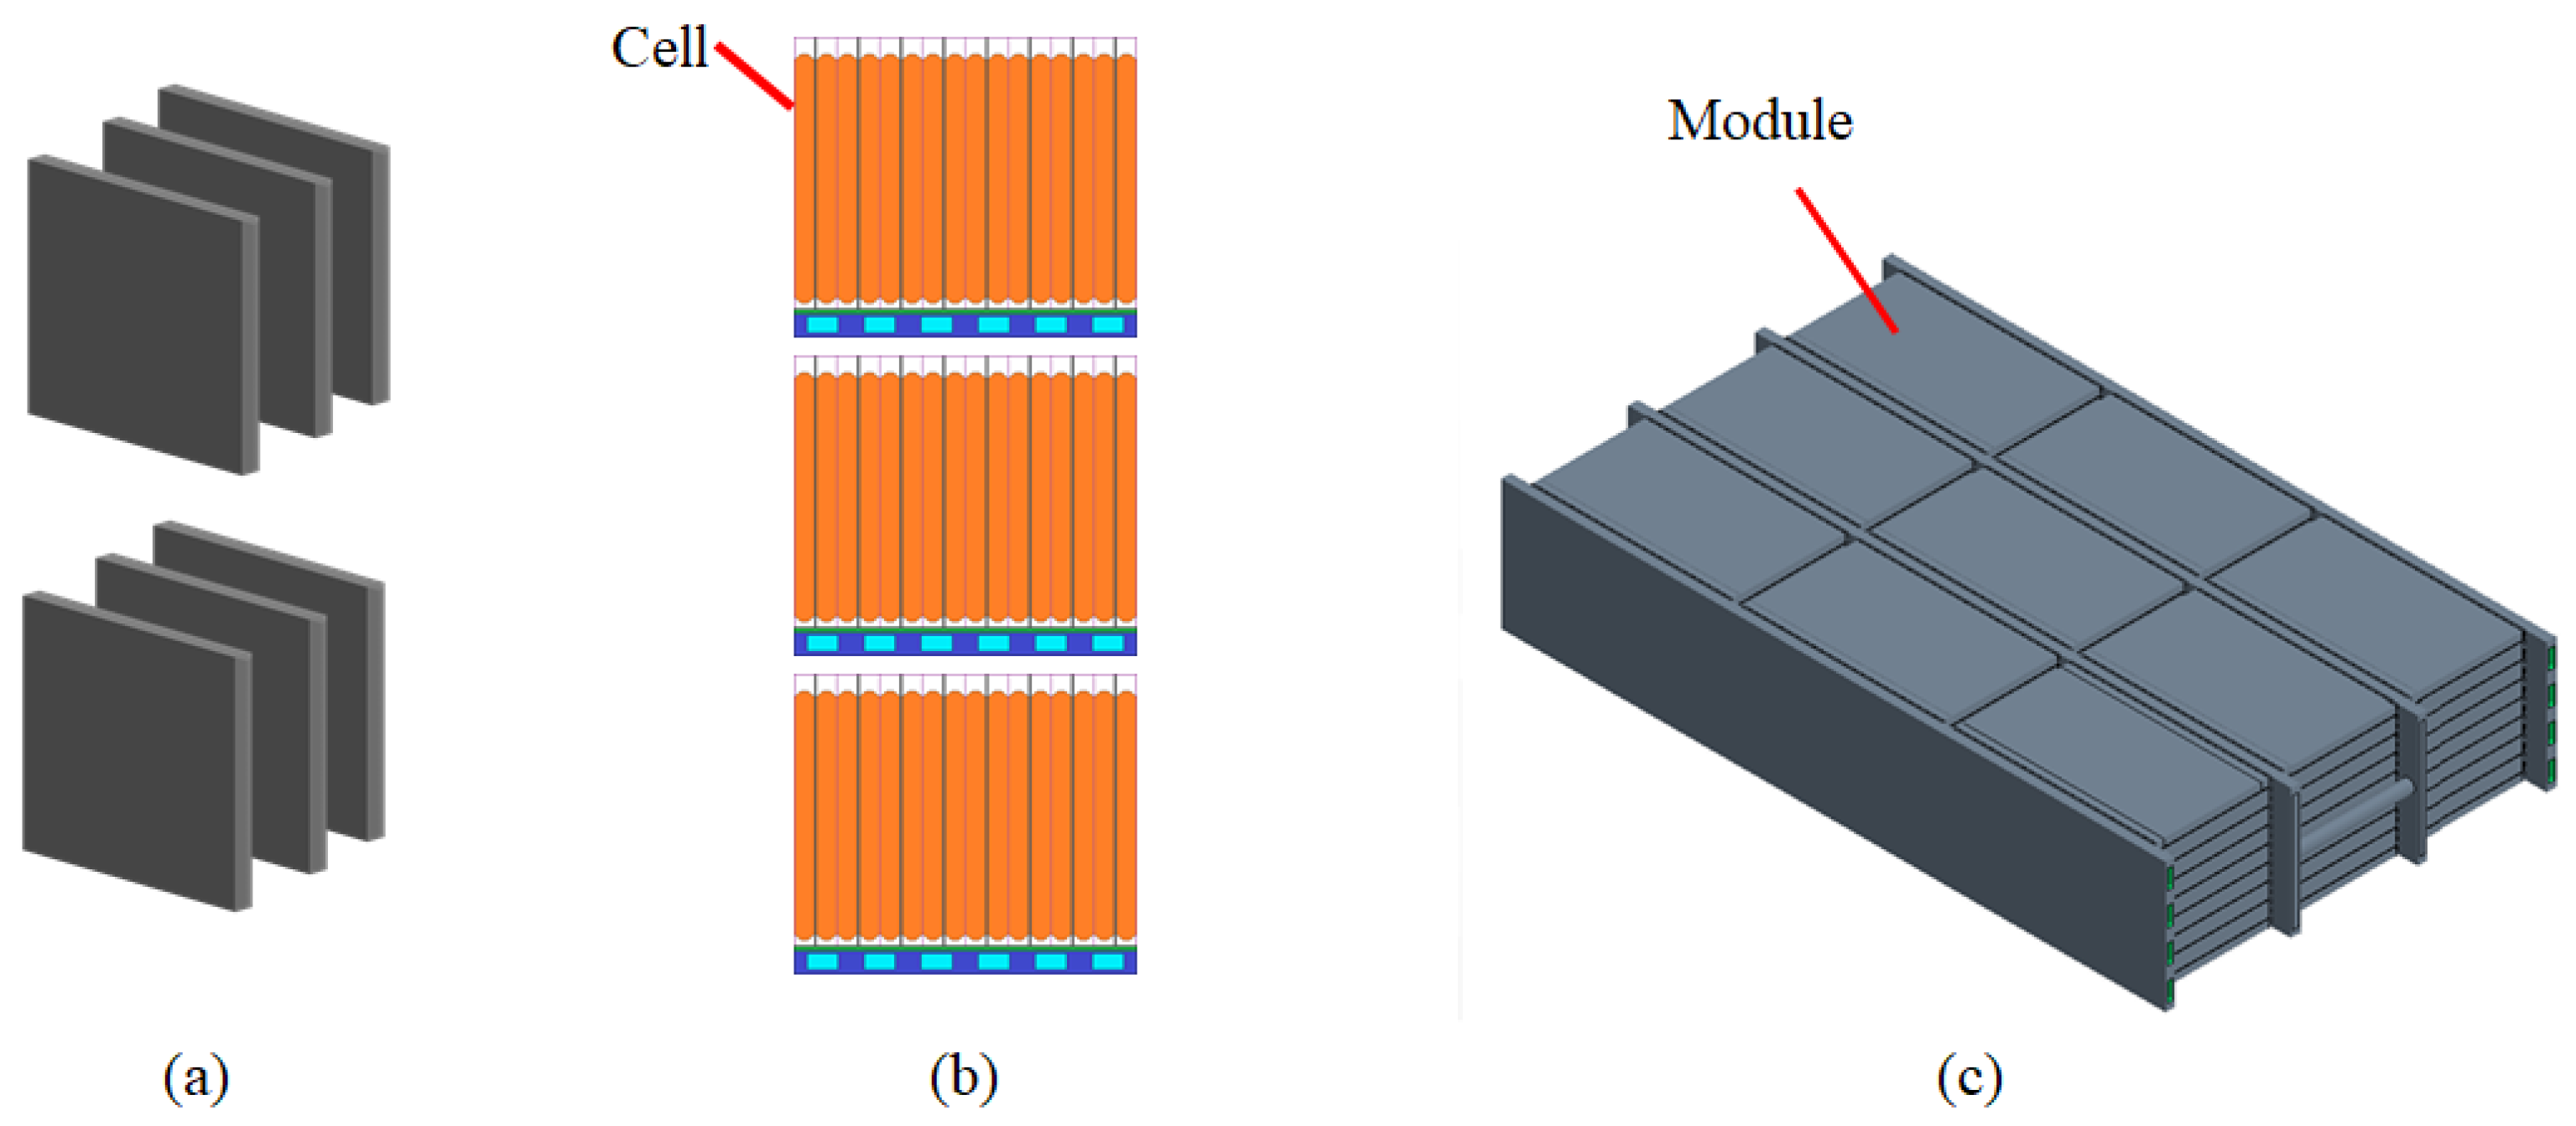
Figure 1. Battery systems: (a) Battery cell; (b) Battery module; (c) Battery pack [7].
Applsci 15 10653 g001
Figure 2. Types of battery cooling systems [9].
Applsci 15 10653 g002
Figure 3. Optimization and evaluation process for double-sided cold plate.
Applsci 15 10653 g003
Figure 4. CFD model for sandwich double-sided cooling battery pack.
Applsci 15 10653 g004
Figure 5. Battery pack cooling circuit.
Applsci 15 10653 g005
Figure 6. CFD model for double-sided cooling battery module.
Applsci 15 10653 g006
Figure 7. Fin arrangements for validation (symmetry and asymmetry). (a) Symmetry Fincell arrangement; (b) Asymmetry Fincell arrangement.
Applsci 15 10653 g007
Figure 8. Dimensional parameters of the cold plate.
Applsci 15 10653 g008
Figure 9. Section of EV battery module.
Applsci 15 10653 g009
Figure 10. Grid dependency study for average temperature within cells (Sparse mesh) [5].
Applsci 15 10653 g010
Figure 11. Grid dependency study for average temperature within cells (Fine mesh) [5].
Applsci 15 10653 g011
Figure 12. Relative error for maximum and minimum temperature within cells.
Applsci 15 10653 g012
Figure 13. Validation: Average temperature of cell (Asymmetry) [5].
Applsci 15 10653 g013
Figure 14. Validation: Average temperature of cell (Symmetry) [5].
Applsci 15 10653 g014
Figure 15. Validation of total pressure drop [5].
Applsci 15 10653 g015
Figure 16. Module section of temperature distributions.
Applsci 15 10653 g016
Figure 17. Sampling regions for Nusselt number calculation inside cold plate.
Applsci 15 10653 g017
Figure 18. Local Nusselt number (Reynolds number, Re: 500–20,000, Model: 321).
Applsci 15 10653 g018
Figure 19. Local Nusselt number for the two-channel model.
Applsci 15 10653 g019
Figure 20. Local Nusselt number for the four-channel model.
Applsci 15 10653 g020
Figure 21. Local Nusselt number for the six-channel model.
Applsci 15 10653 g021
Figure 22. Correlation of Nusselt number (model 111) [37,38,39,40,41].
Applsci 15 10653 g022
Figure 23. Correlation of Fanning f-factor (model 111).
Applsci 15 10653 g023
Figure 24. Goodness factor of the channel models.
Applsci 15 10653 g024
Figure 25. Main effect analysis for channel.
Applsci 15 10653 g025
Figure 26. Response surface methodology analysis for channel.
Applsci 15 10653 g026
Figure 27. Optimized model for channel.
Applsci 15 10653 g027
Table 1. Number of channels and Dh in previous studies.
Number of ChannelsDh (m)Reference
3–50.008[28]
3–60.001[29]
40.011[5]
30.001[30]
10.03[31]
10.005[32]
Table 2. Orthogonal array for channel (parameters).
No.Name p w / w m a x h/tReynolds number (Re) V C o o l a n t
1111 68 1/18/1500, 1000, 2500, 5000, 7500, 10,000, 15,000, 20,000214.2
2122 68 2/36/2500, 1000, 2500, 5000, 7500, 10,000, 15,000, 20,000107.1
3133 68 1/34/3500, 1000, 2500, 5000, 7500, 10,000, 15,000, 20,00035.7
4212 34 1/16/2500, 1000, 2500, 5000, 7500, 10,000, 15,000, 20,000150.6
5223 34 2/34/3500, 1000, 2500, 5000, 7500, 10,000, 15,000, 20,00066.9
6231 34 1/38/1500, 1000, 2500, 5000, 7500, 10,000, 15,000, 20,00066.9
7313 22.66 1/14/3500, 1000, 2500, 5000, 7500, 10,000, 15,000, 20,00093.7
8321 22.66 2/38/1500, 1000, 2500, 5000, 7500, 10,000, 15,000, 20,000124.9
9332 22.66 1/36/2500, 1000, 2500, 5000, 7500, 10,000, 15,000, 20,00046.8
10 [5]222342/36/2500, 1000, 2500, 5000, 7500, 10,000, 15,000, 20,000100.4
Table 3. Thermal properties of battery module components.
Part ρ [ k g   m 3 ]Cp
[ J   k g 1   K 1 ]
k [ W   m 1   K 1 ]
Cold plate and Fincell2700893170
Thermal pad31009305
Insulation230014301.5
Battery cell1780100030/0.5
(in/cross-plane)
Coolant997.64181.70.6
Disclaimer/Publisher’s Note: The statements, opinions and data contained in all publications are solely those of the individual author(s) and contributor(s) and not of MDPI and/or the editor(s). MDPI and/or the editor(s) disclaim responsibility for any injury to people or property resulting from any ideas, methods, instructions or products referred to in the content.