1. Introduction
The rapid proliferation of Internet of Things (IoT) devices, driven by artificial intelligence and machine learning, is taking place in a wide range of applications from industrial solutions to personal assistants, revolutionizing many industries [
1]. One of these sectors is the robotics industry. Today, robots are widely used in various industries such as manufacturing, healthcare, agriculture, and space exploration. Their purpose is to provide information services for detection, sensing, and tracking and to create motion and interaction behavior [
2]. In this way, robotic technologies provide ways to improve the performance and capabilities of the user, product, or process. However, the integration of IoT into everyday environments through robots raises significant concerns about data security. As robots from industrial devices collect, transmit, and process sensitive information collected through IoT, protecting these data has become crucial to prevent unauthorized access and ensure user privacy. Therefore, encryption methods are used to enhance data security, data integrity, and confidentiality.
Data security has long been a fundamental aspect of digital communication, prompting the advancement of various encryption and decryption methods over the years. Encryption transforms data into an encrypted structure and makes them unintelligible without the corresponding decryption key. In the literature, methods such as Data Encryption Standard (DES) [
3], the RSA method [
4], Advanced Encryption Standard (AES) [
5,
6], SNOW-V [
7,
8], and S-box [
9] can be found. In order to increase the data security of the algorithms used in encryption, chaotic systems are often utilized, which have the characteristics of randomness, ergodicity, unpredictability, deterministicness, and extreme sensitivity to initial conditions [
10,
11,
12,
13,
14,
15]. Arab et al. performed an encryption study by applying random numbers from the Arnold chaotic system to the modified AES method. They showed that small changes in the initial values lead to significant differences in the encrypted image [
16]. Inam et al. used the random values obtained from chaotic maps to encrypt images in the AES algorithm. This integration strengthens the security by increasing the randomness and complexity of the encryption process, thereby significantly reducing the likelihood of successful cryptographic attacks [
17]. Tang et al. proposed a chaotic cryptographic algorithm based on the Lorenz system by combining the Lorenz system with Arnold mapping and DNA coding. The performance analysis included histogram analysis, correlation coefficient analysis, information entropy analysis, noise attack testing, clipping attack testing, key space analysis, and key sensitivity analysis. The experimental results show that the proposed algorithm has good security performance and is suitable for cloud platform robots with high information security requirements [
18]. Wang et al. proposed an image encryption method utilizing S-boxes constructed from chaotic time series generated by their novel system, enhancing both unpredictability and security in the encryption process [
19]. The proposed Permuted Cellular Automata (pCA) S-box was evaluated against graph-based, chaos-based, and linear transformation-based alternatives. It demonstrated strong resistance to linear and correlation attacks, all while maintaining resource efficiency [
20]. Gafsi et al. developed an FPGA-based chaos-based encryption system specifically designed for image encryption and decryption. In this system, the authors generated pseudo-random numbers using the Lorenz chaotic system and performed encryption and decryption using the XOR operation with the keys obtained from these values with images [
21]. As efforts have increasingly focused on reducing the computational overhead, lightweight encryption techniques have gained attention. In this context, Gilmolk et al. proposed a novel lightweight chaotic encryption approach specifically designed for securing light images in IoT environments. The effectiveness of the proposed scheme was validated through comprehensive analyses such as histogram distribution, pixel correlation, and mean square error evaluation, revealing notable improvements in image quality metrics—including homogeneity, energy, and contrast—while also demonstrating high robustness against various cryptographic attacks [
22]. Similarly, Mohammed et al. proposed a chaos-based lightweight image encryption and decryption scheme for IoT applications, utilizing data generated from a five-dimensional chaotic system to construct an S-box. The newly designed S-box exhibits strong cryptographic properties, including high nonlinearity and resilience against statistical and differential attacks. These strengths are validated through performance metrics such as peak signal-to-noise ratio (PSNR), low correlation coefficients, and high NPCR and UACI values, confirming its suitability for secure image transmission over public communication channels [
23]. Abbood et al. proposed a novel and efficient cryptographic system that combines stream-cipher principles with chaotic encryption and is specifically designed to address the challenges of securing data on resource-limited IoT devices. The system’s performance was validated using various evaluation metrics, including histogram and correlation analyses, NPCR, UACI, PSNR, and entropy. The results confirm that the proposed method ensures robust security, operational efficiency, and adaptability, making it a viable solution for protecting sensitive information in IoT-based environments [
24]. Similarly, Aqeel et al. developed an image-encryption scheme tailored for IoT systems by utilizing a five-dimensional hyperchaotic map. The robustness and effectiveness of this method were thoroughly assessed using a range of security metrics, including information entropy, correlation analysis, histogram uniformity, and resistance to differential attacks, confirming a high level of security and suitability for IoT-based applications [
25]. Nazish and Banday explored the application of lightweight one-dimensional chaotic maps, including Logistic, Sine, Tent, and Chebyshev maps, for image encryption. Their evaluation involved multiple performance and security metrics, such as PSNR, MSE, NPCR, UACI, entropy, and execution time, demonstrating the methods’ effectiveness and efficiency [
26].
Traditional encryption techniques often lead to increased computational load and higher power consumption, creating challenges in protecting against evolving cyber threats. This issue is especially critical in IoT and embedded systems, where limited processing power and energy efficiency are paramount. To meet these needs, the Ascon algorithm is adopted as a lightweight and secure encryption method. Recognized for its effectiveness, Ascon was officially chosen by the National Institute of Standards and Technology (NIST) in 2023 as the Lightweight Cryptography Standard, underscoring its importance for safeguarding resource-constrained devices [
27]. Ascon not only employs authenticated encryption with associated data (AEAD) and hashing operations but also provides robust resistance to attacks such as differential and linear cryptanalysis. Moreover, Ascon delivers enhanced security while maintaining minimal computational and communication overhead [
28]. NIST identified Ascon as a leading candidate in its competition to establish a new lightweight encryption standard tailored for IoT devices; it was selected over other finalists primarily due to its strong resistance to side-channel attacks [
29]. Wurity and Sumalatha analyzed the Ascon-128, Ascon-128a, and Ascon-80pq variants. Key performance indicators—including encryption and decryption times, memory consumption, and throughput—were evaluated across different data sizes [
30]. Athanasiou et al. presented a coprocessor designed to implement the Ascon lightweight-cryptography algorithm, addressing security issues in IoT environments. The design incorporates features such as AEAD, hashing, and MAC, enhancing Ascon’s performance for devices with limited resources [
31]. Koppuravuri et al. proposed an FPGA architecture for Ascon that delivers up to a 31.77% increase in throughput, enhancing its suitability for secure edge computing in IoT applications [
32]. Rahul et al. adapted IoT communication for smart agriculture applications. Ascon encryption enabled data authentication and secure data transmission [
33]. Nooruddin and Valles used a LoRa-based IoT framework and Ascon encryption for secure data transmission, integrating an ESP32 and environmental sensors with a Raspberry Pi Pico [
34]. El-Hajj and Gebremariam applied the Ascon method to improve the security of resource-constrained IoT devices. In particular, they emphasized that the digital twin framework increases resilience against cyber threats in Industry 4.0. They also verified the effectiveness of Ascon compared with AES-GCM in terms of security [
35]. Khan, Lee, and Hwang evaluated the performance of Ascon on various FPGA platforms for resource-constrained IoT platforms and implemented a recursive strategy to reduce area consumption [
36]. Raj and Bodapati transmitted medical images over IoT networks using FPGA and employed the Ascon-128 version for data hiding [
37]. Nguyen and Chen applied Ascon encryption for an automotive industry application on FPGA hardware. In this way, they demonstrated that the speed increased by a factor of 100 [
38].
In recent years, the Internet of Robotic Things (IoRT) has advanced through the integration of IoT systems and robots. The IoRT combines various technologies, including cloud computing, robotics, the IoT, artificial intelligence (AI), and machine learning (ML). The IoRT plays an important role in manufacturing, healthcare, agriculture, space exploration, security, and transportation. Kanthimathi et al. stated in their study that the system integration of robots with IoT and AI has transformed industrial production. Efficiency gains and predictive maintenance have saved money and increased sustainability, making it an economically viable and environmentally friendly alternative [
39]. Today, robots can be grouped into categories such as autonomous robots, humanoid robots, service robots, and pre-programmed robots. In particular, robots such as inspection robots have become essential tools in harsh environments such as remote-control decontamination, welding operations, leak inspections, radiation discovery and assessment, radiation-aware navigation, and characterization and inspection operations on land, in air, and in water [
40]. The IoRT can be deployed in many different places, allowing robots to transmit and receive data to and from other devices and users. However, studies have highlighted weaknesses in ROS-based systems for self-driving cars, surgical robots, and eldercare robots, including unauthorized publishing, unauthorized data access, and denial-of-service (DoS) cyberattacks on these robots [
41]. Here, IoRT security relies heavily on encryption. As IoRT systems connect to multiple devices and share sensitive data, encryption needs to provide a critical layer of defense against unauthorized access and data breaches [
42]. Furthermore, beyond confidentiality, encryption and decryption algorithms also verify the authenticity and integrity of data to ensure that data remain unchanged during transmission [
43]. Kamilarlis and Botteghi presented a secure communication protocol for the IoRT that uses encryption to protect data transmitted between devices. They tested the system in a simulated environment and demonstrated its effectiveness in securing the IoRT [
44]. Chang et al. designed a data security robot for the IoRT using Raspberry Pi hardware for the healthcare sector. While performing this process, they used the AES algorithm and the EEC algorithms in encryption and compared their performance [
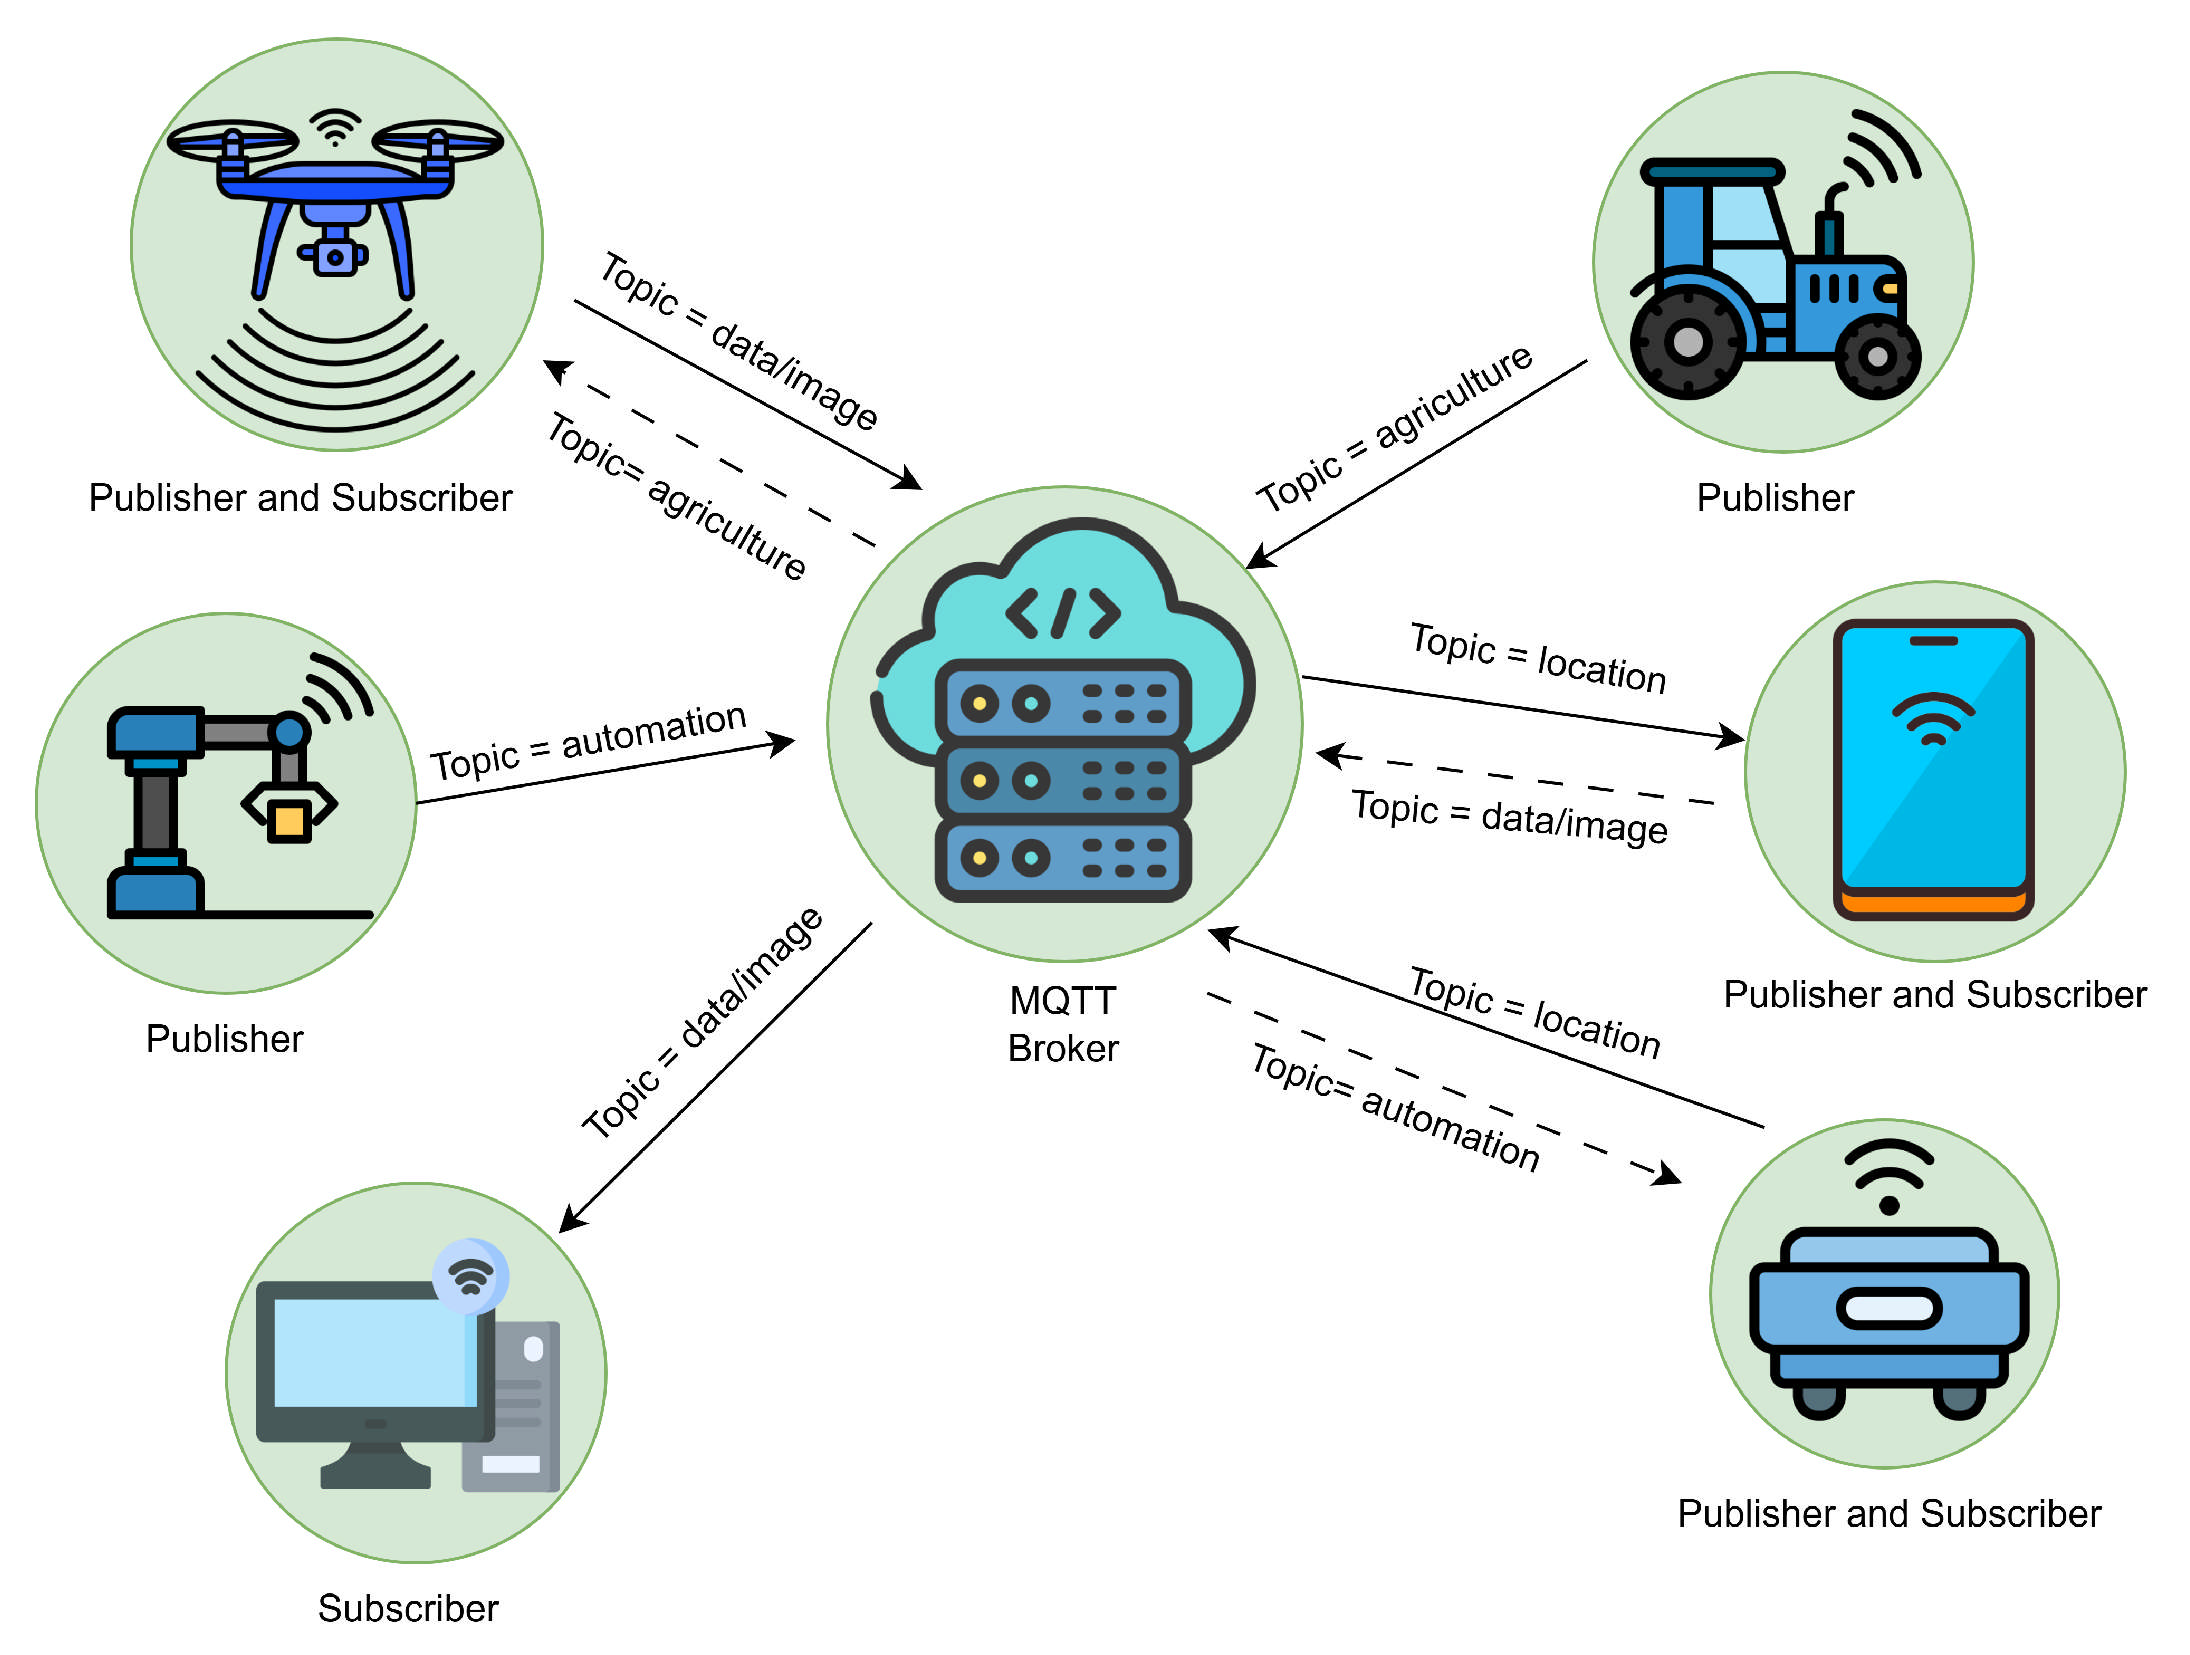
45]. Additionally, MQTT (Message Queuing Telemetry Transport) is a lightweight publish-subscribe messaging protocol specifically designed for machine-to-machine (M2M) communication in IoT. Initially developed for telemetry in oil pipelines, MQTT enables efficient data exchange between devices, especially in scenarios with constrained bandwidth or high latency. Cameron utilized MQTT for communication between ESP32 microcontrollers operating on separate Wi-Fi networks [
46]. Although MQTT serves as a lightweight messaging protocol for IoT devices, Buccafurri and Lazzaro have identified and proposed solutions to address its vulnerabilities related to weak authentication, security, and privacy [
47]. Lightweight cryptography is a rapidly growing area dedicated to creating cryptographic methods optimized for resource-limited devices, such as those used in IoT and embedded systems. These methods aim to minimize the power consumption, processing time, and memory requirements, while ensuring strong security. In this context, Abubakar et al. enhanced the previously proposed PRESENT algorithm by modifying it to improve both its security and efficiency [
48]. Similarly, Al-Azzawi et al. developed a novel lightweight encryption method by proposing a lightweight block cipher based on Type-2 Generalized Feistel Networks, aiming to improve the security while reducing the resource consumption [
49].
The originality of this work is that it aims to study the application of the Ascon algorithm in encrypting images and data in IoT robots, specifically its integration with chaotic systems to strengthen security measures. By reviewing the existing literature on Ascon and chaotic systems and analyzing their combined effectiveness in IoT environments, this research aims to contribute to the ongoing discourse on improving data security in the rapidly evolving IoT robotics landscape. From a general perspective, the contributions of this study to the literature are as follows:
A new lightweight encryption mechanism is proposed for IoRT-based robots by taking advantage of the lightweight structure of the Ascon-AEAD128 algorithm and the unique properties of a chaotic map.
A pseudorandom number generator was implemented, and statistical tests were conducted to evaluate its properties.
The developed algorithm was applied to color and grayscale images as well as text data; comprehensive security analyses were performed.
An application enabling encrypted and secure data exchange over the MQTT protocol was implemented between ROS 2 Humble robots and Raspberry Pi 3 Model B IoT devices (İstanbul, Turkey).
The remainder of this study is organized as follows. In
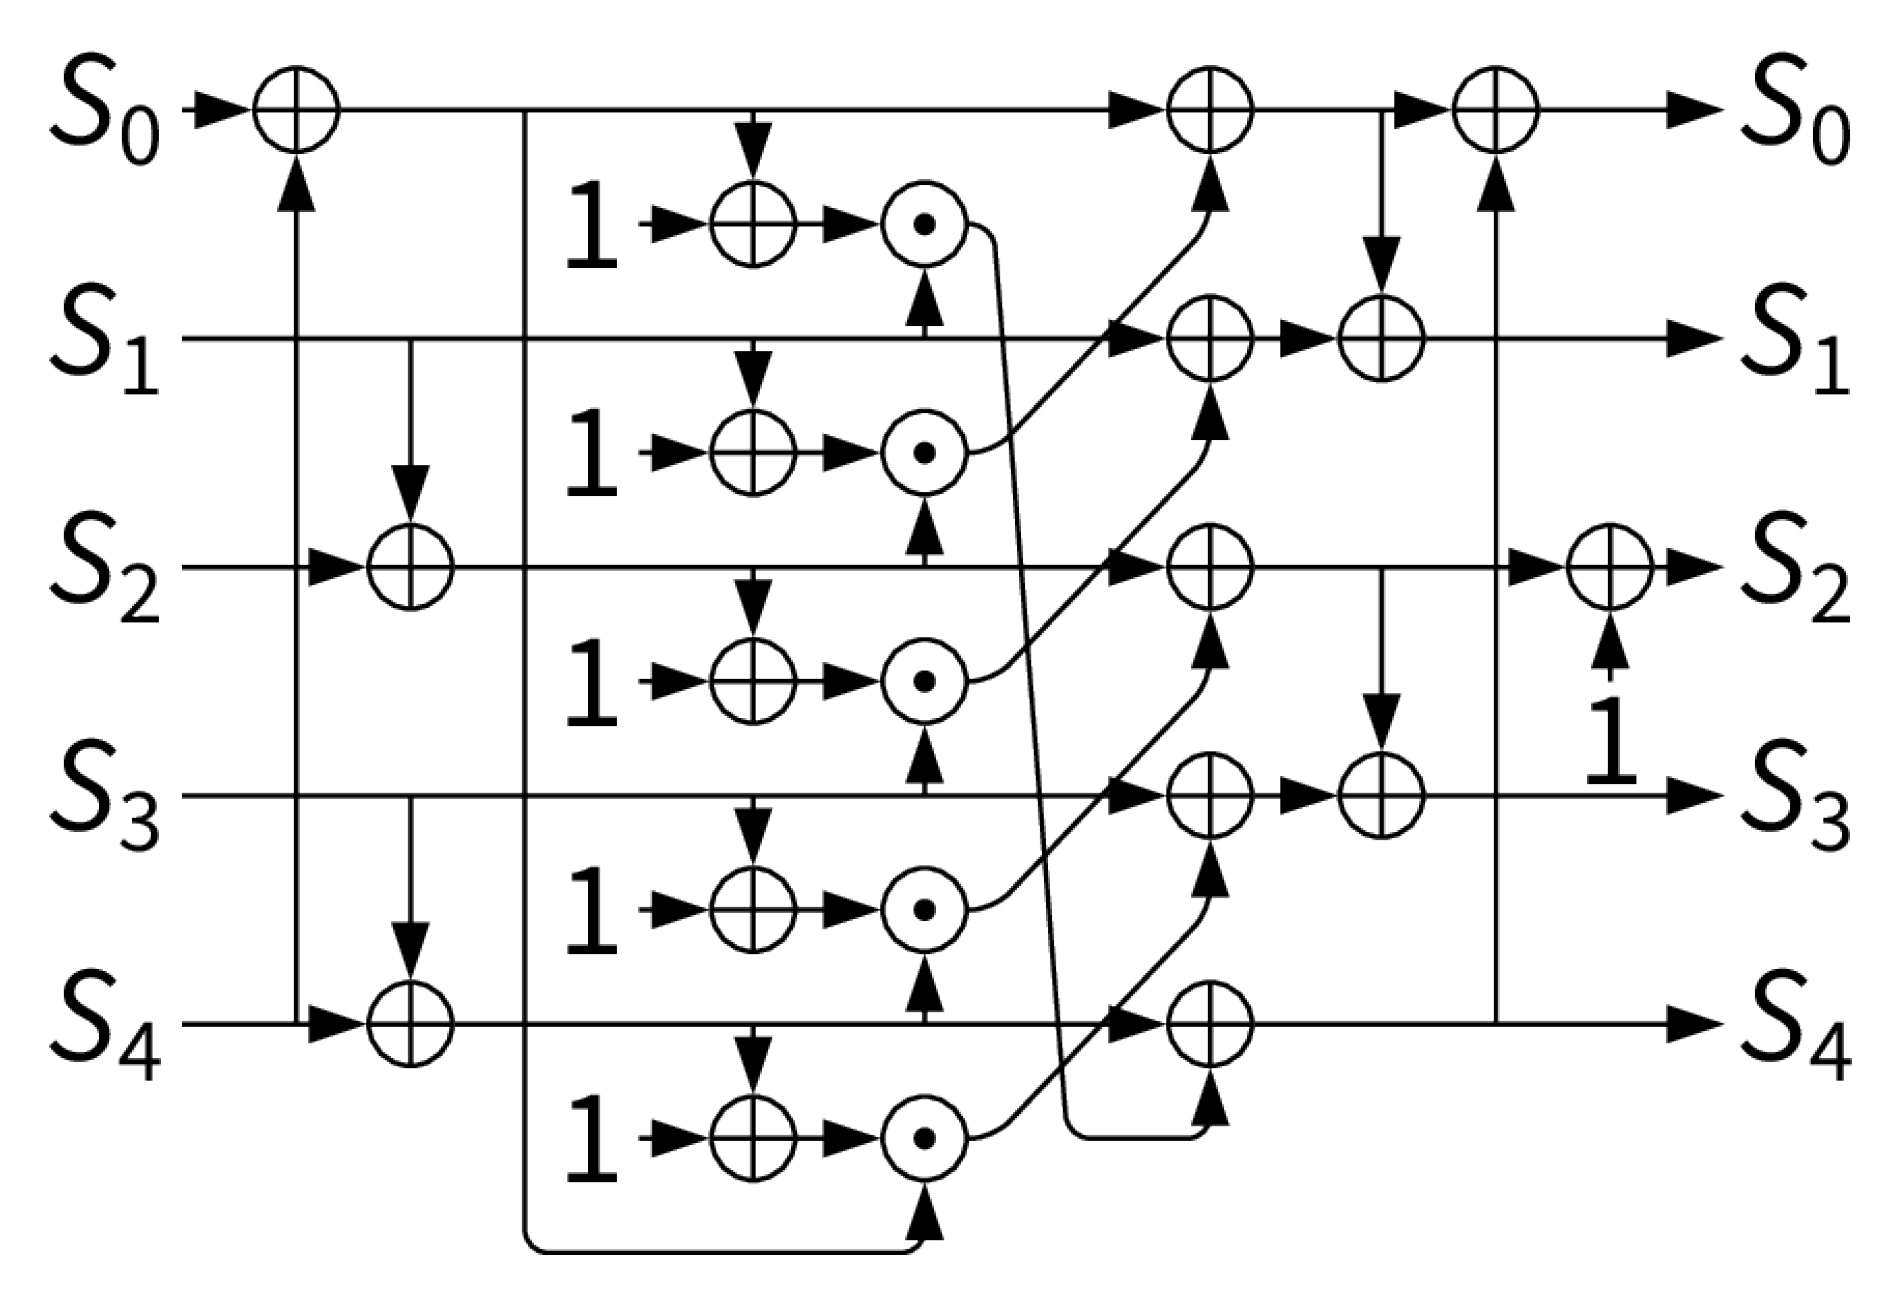
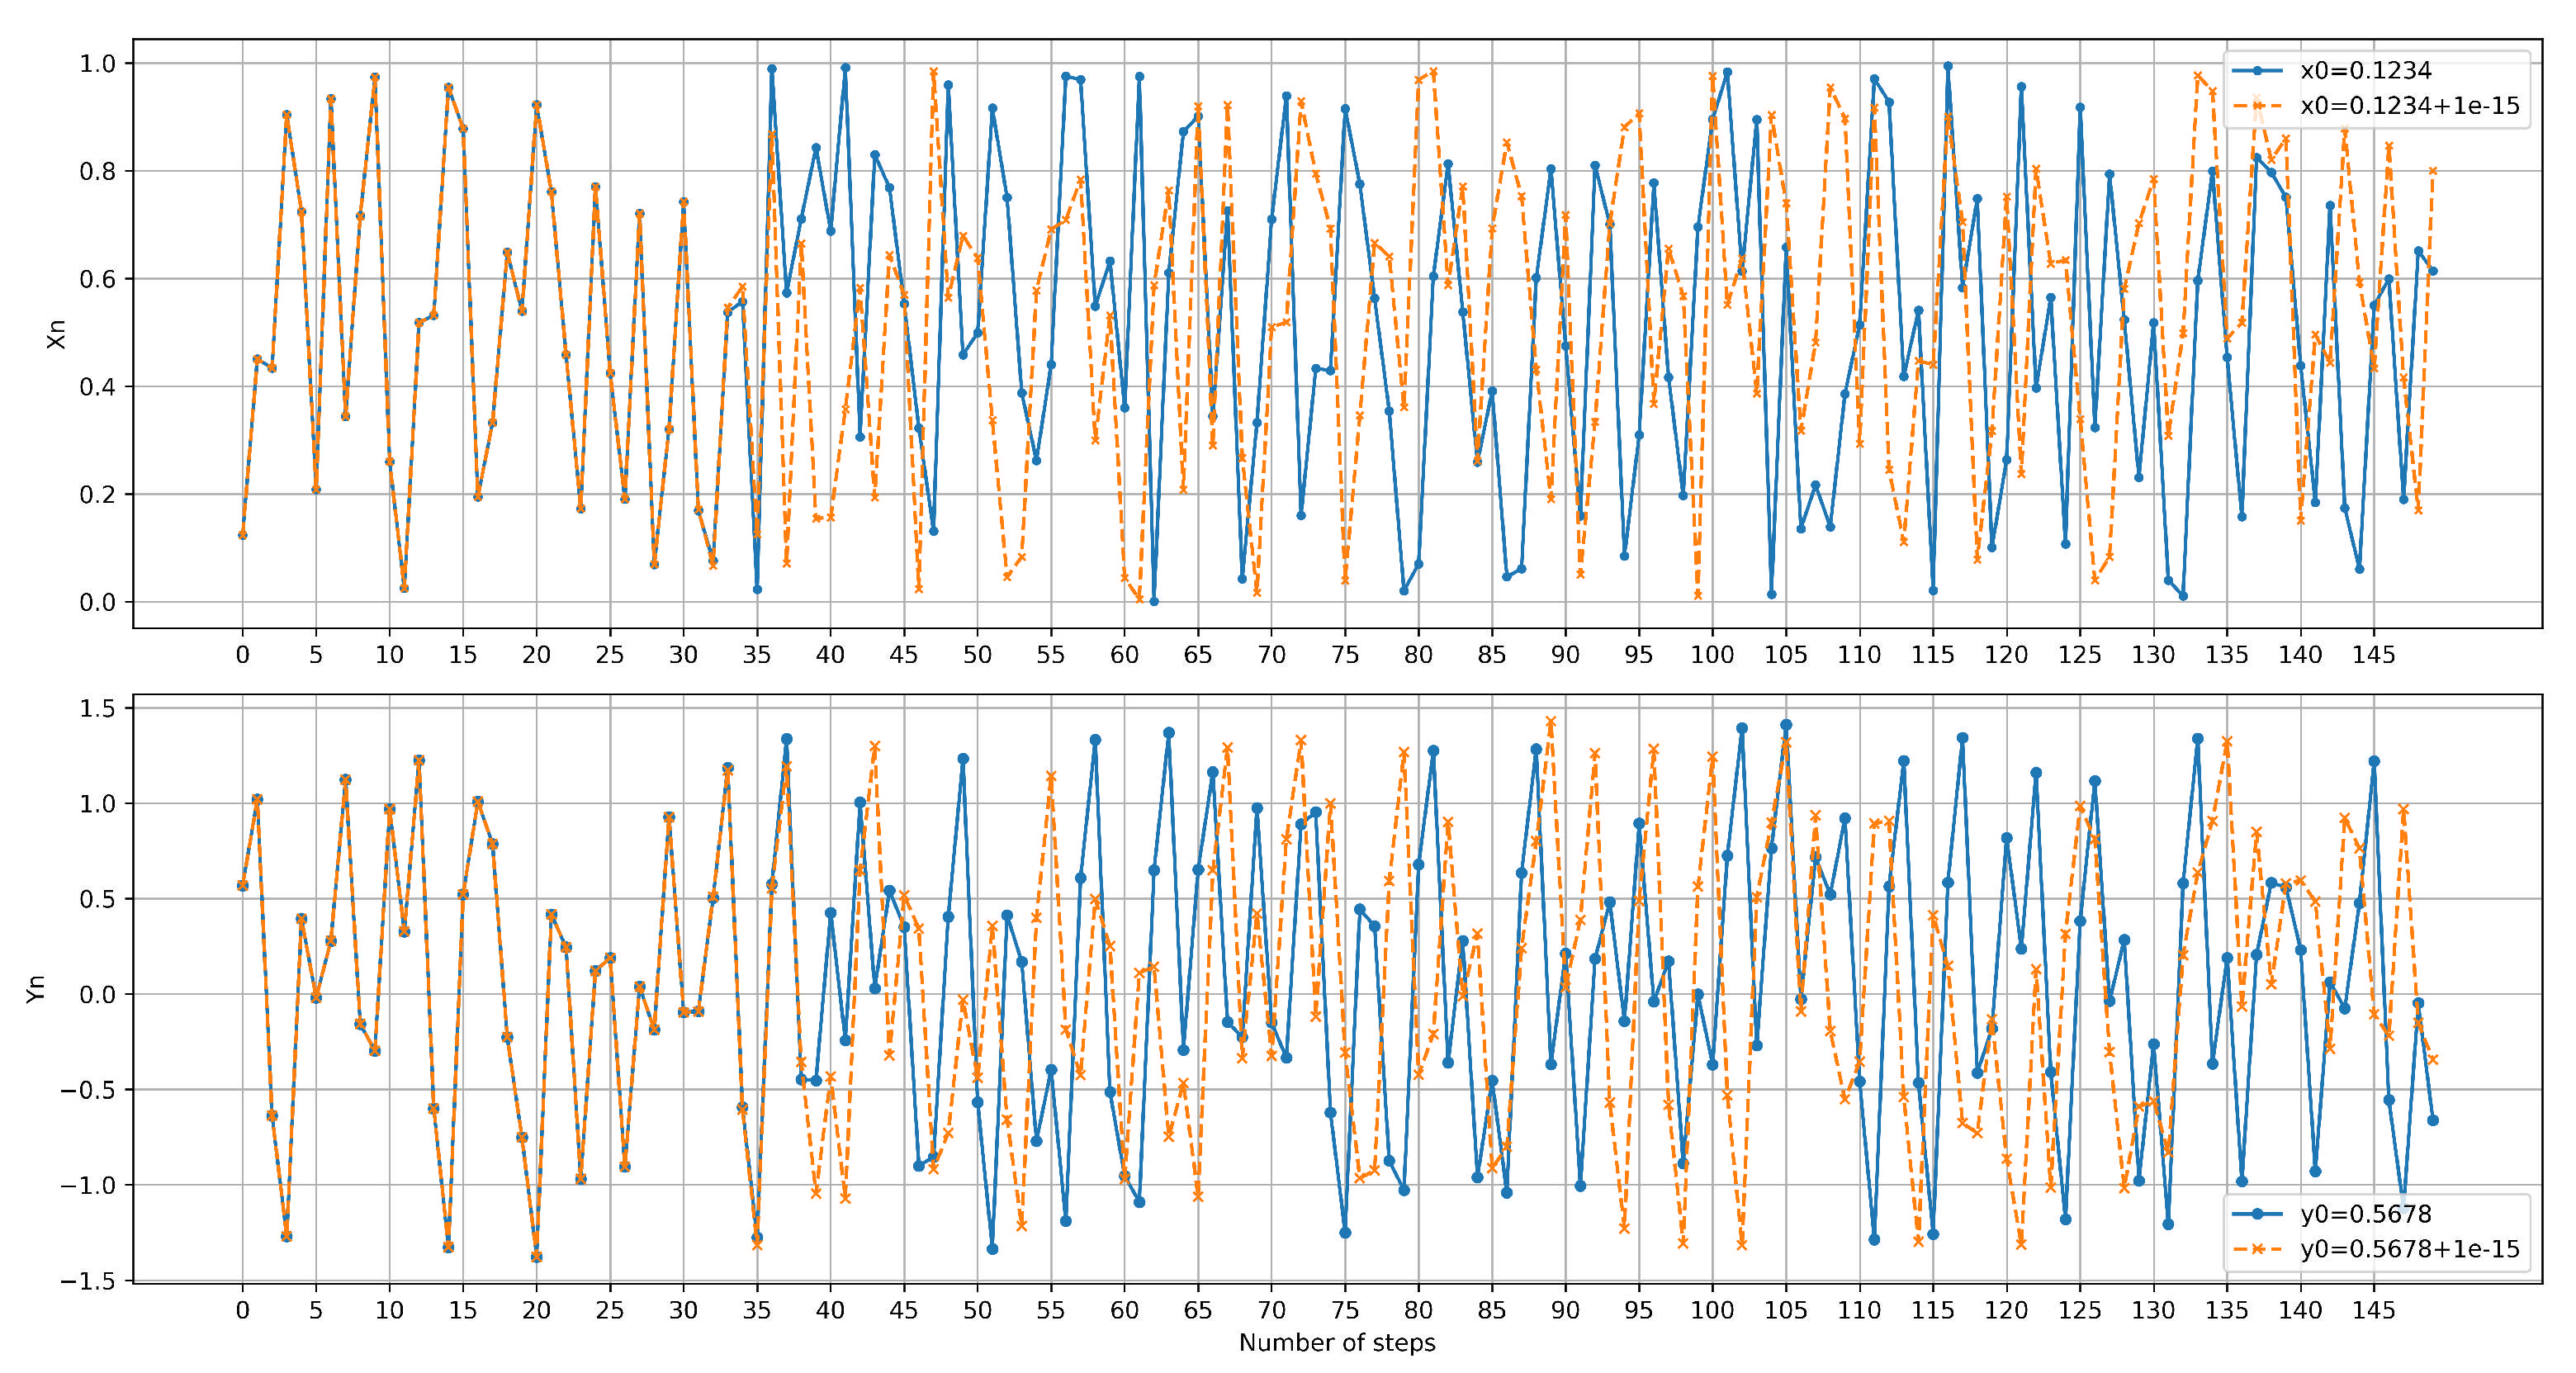
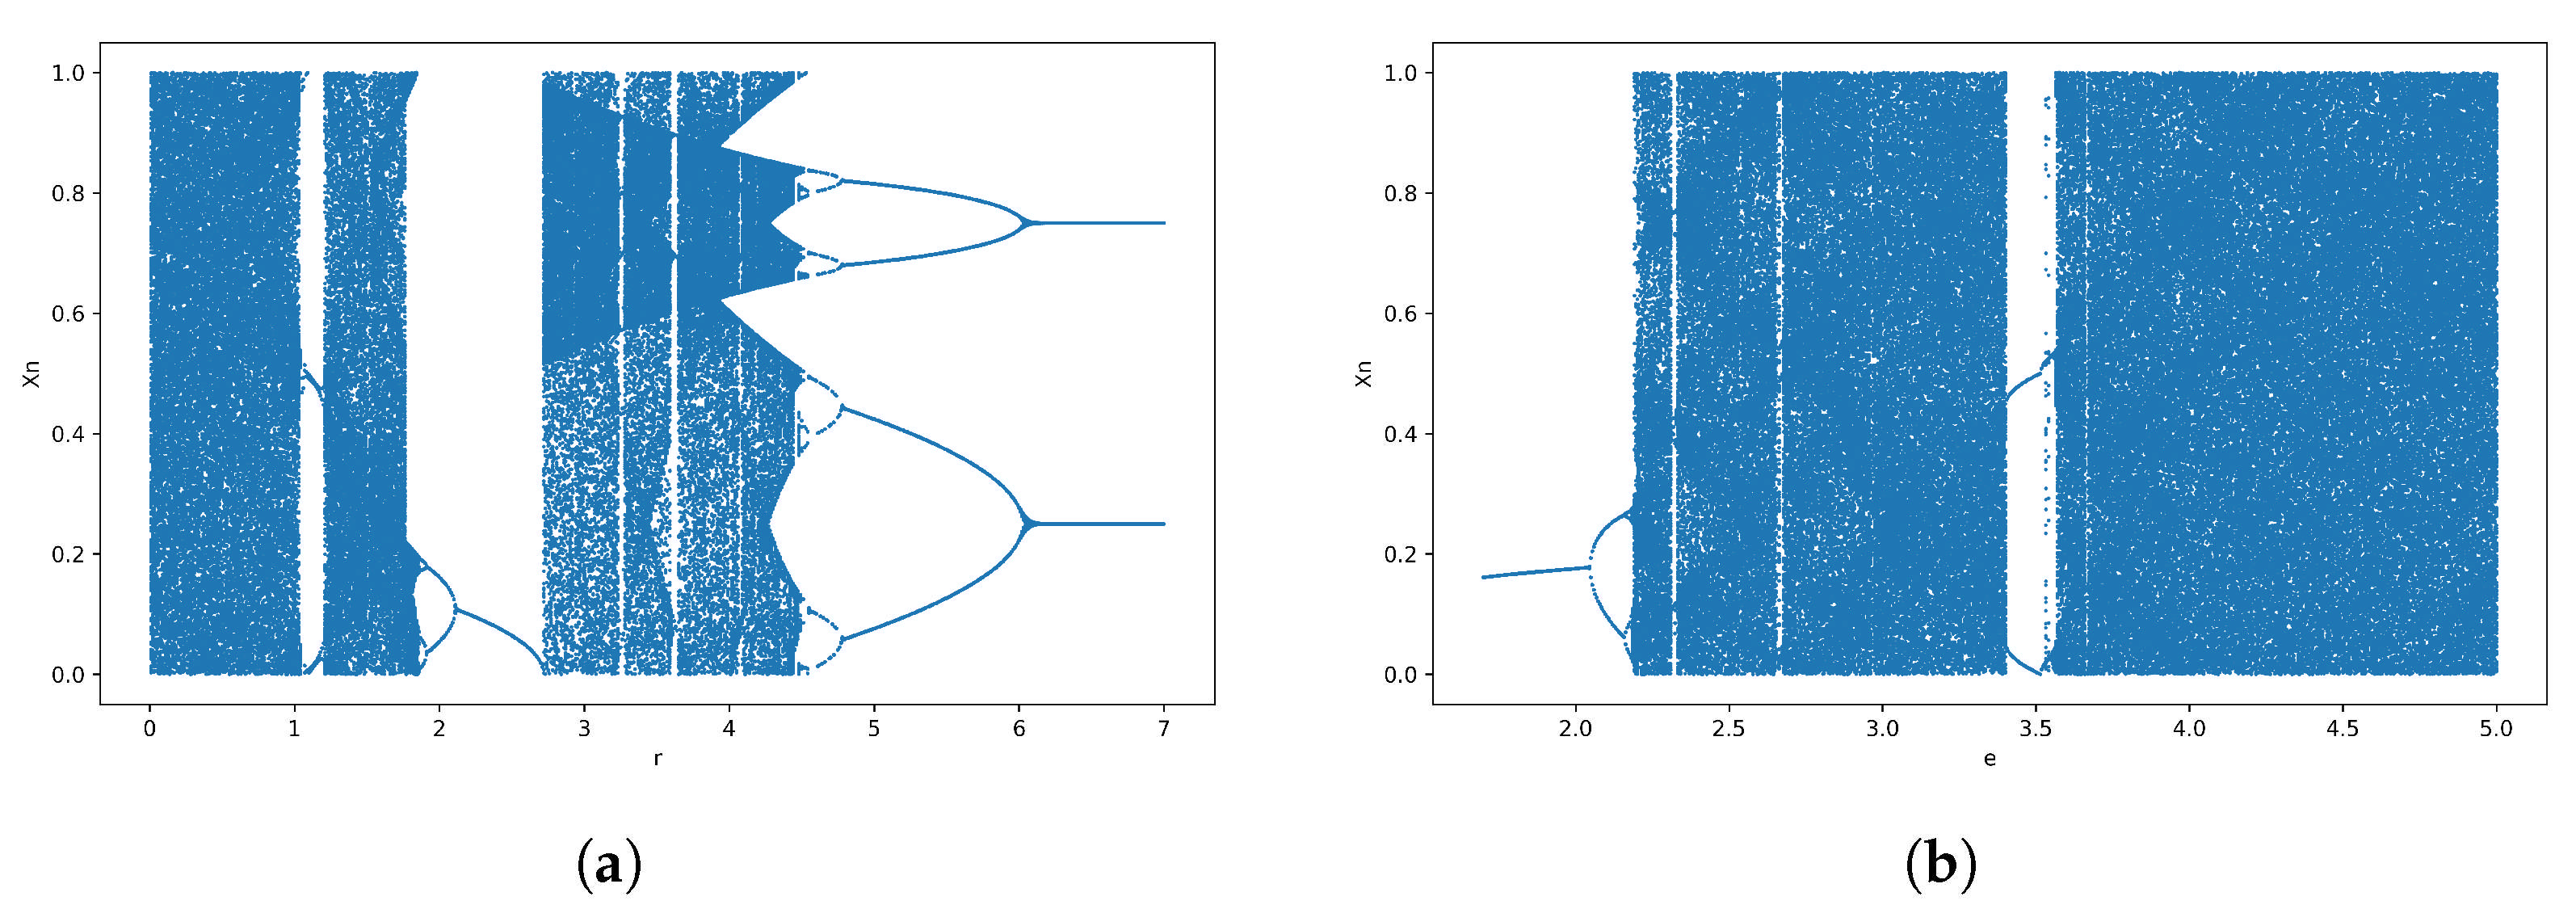
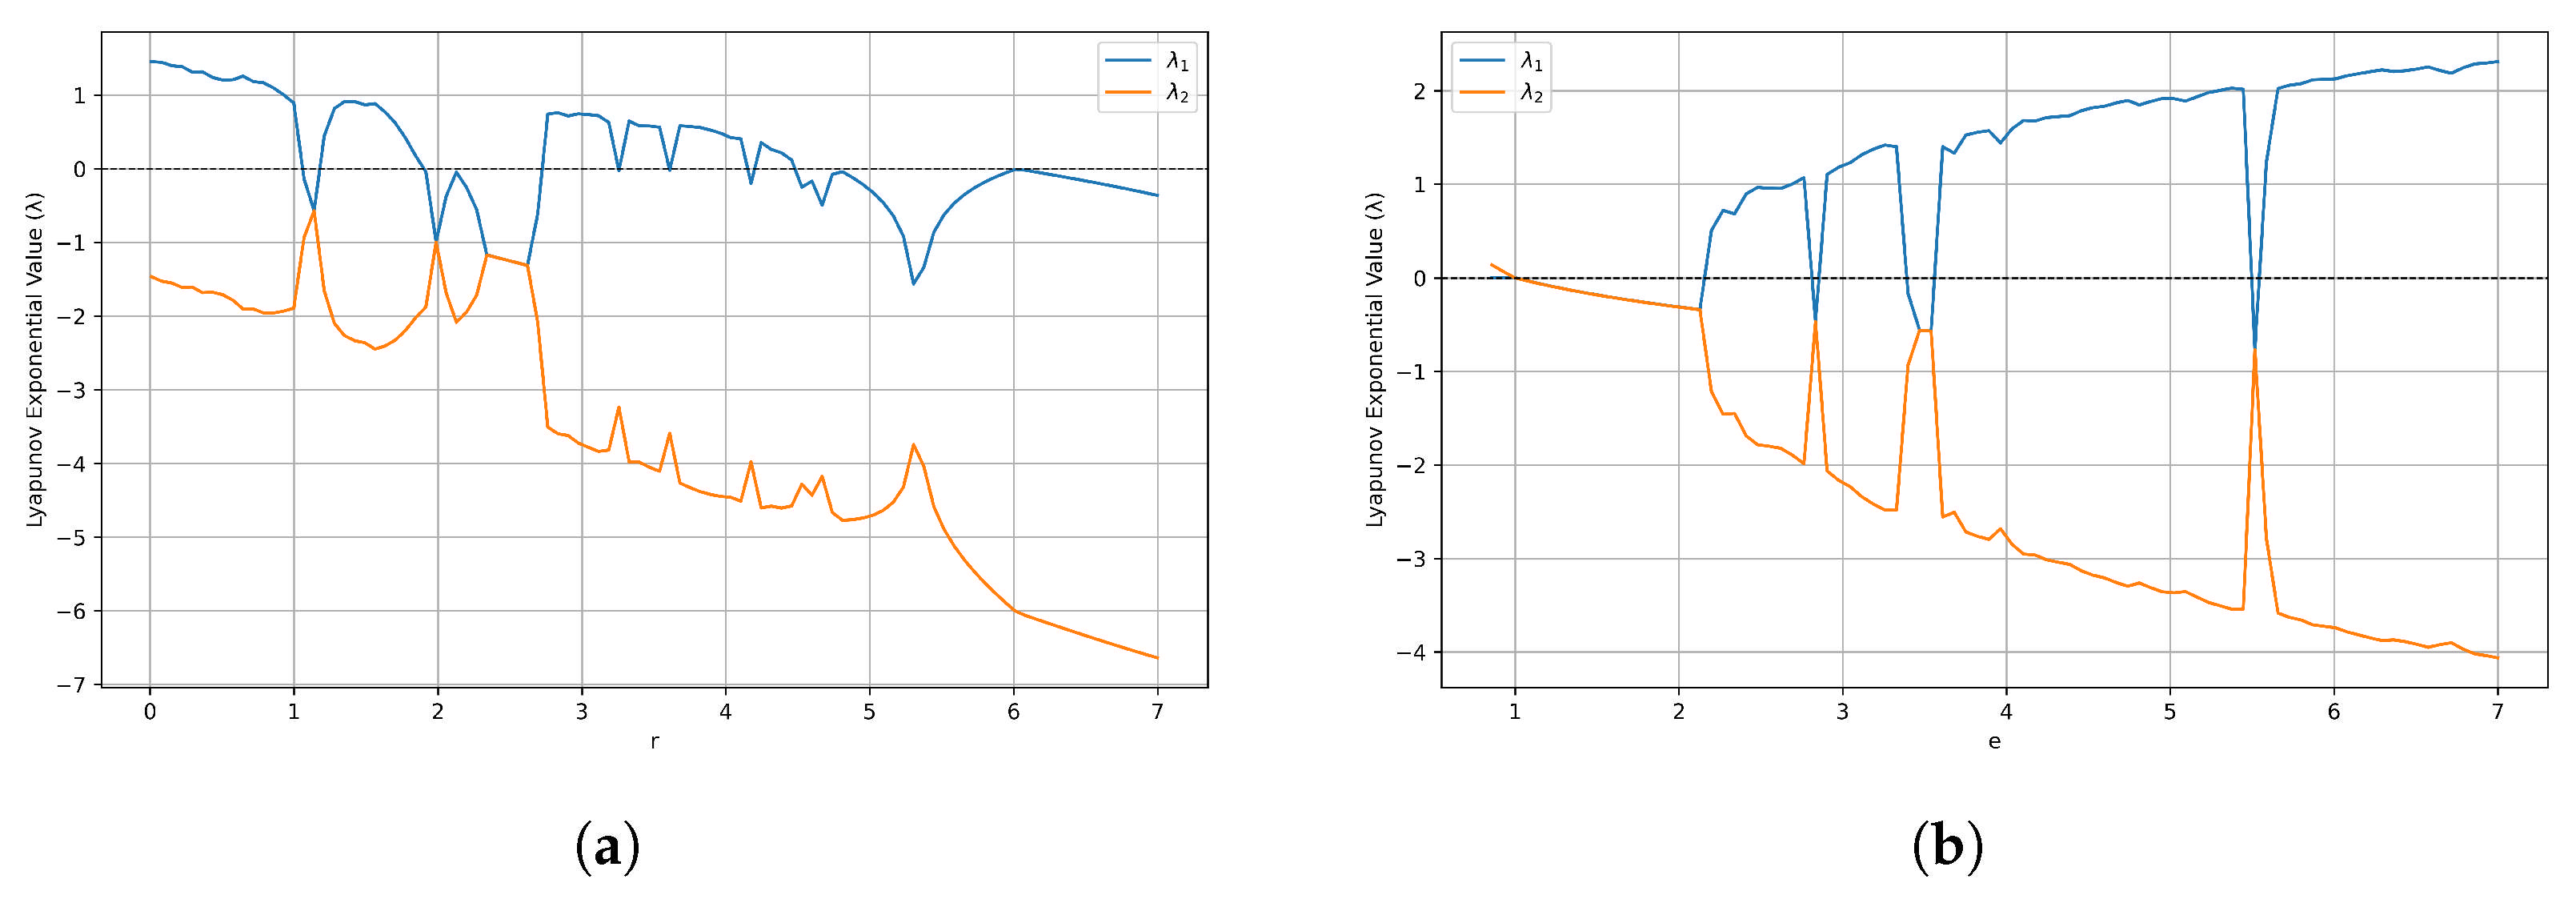
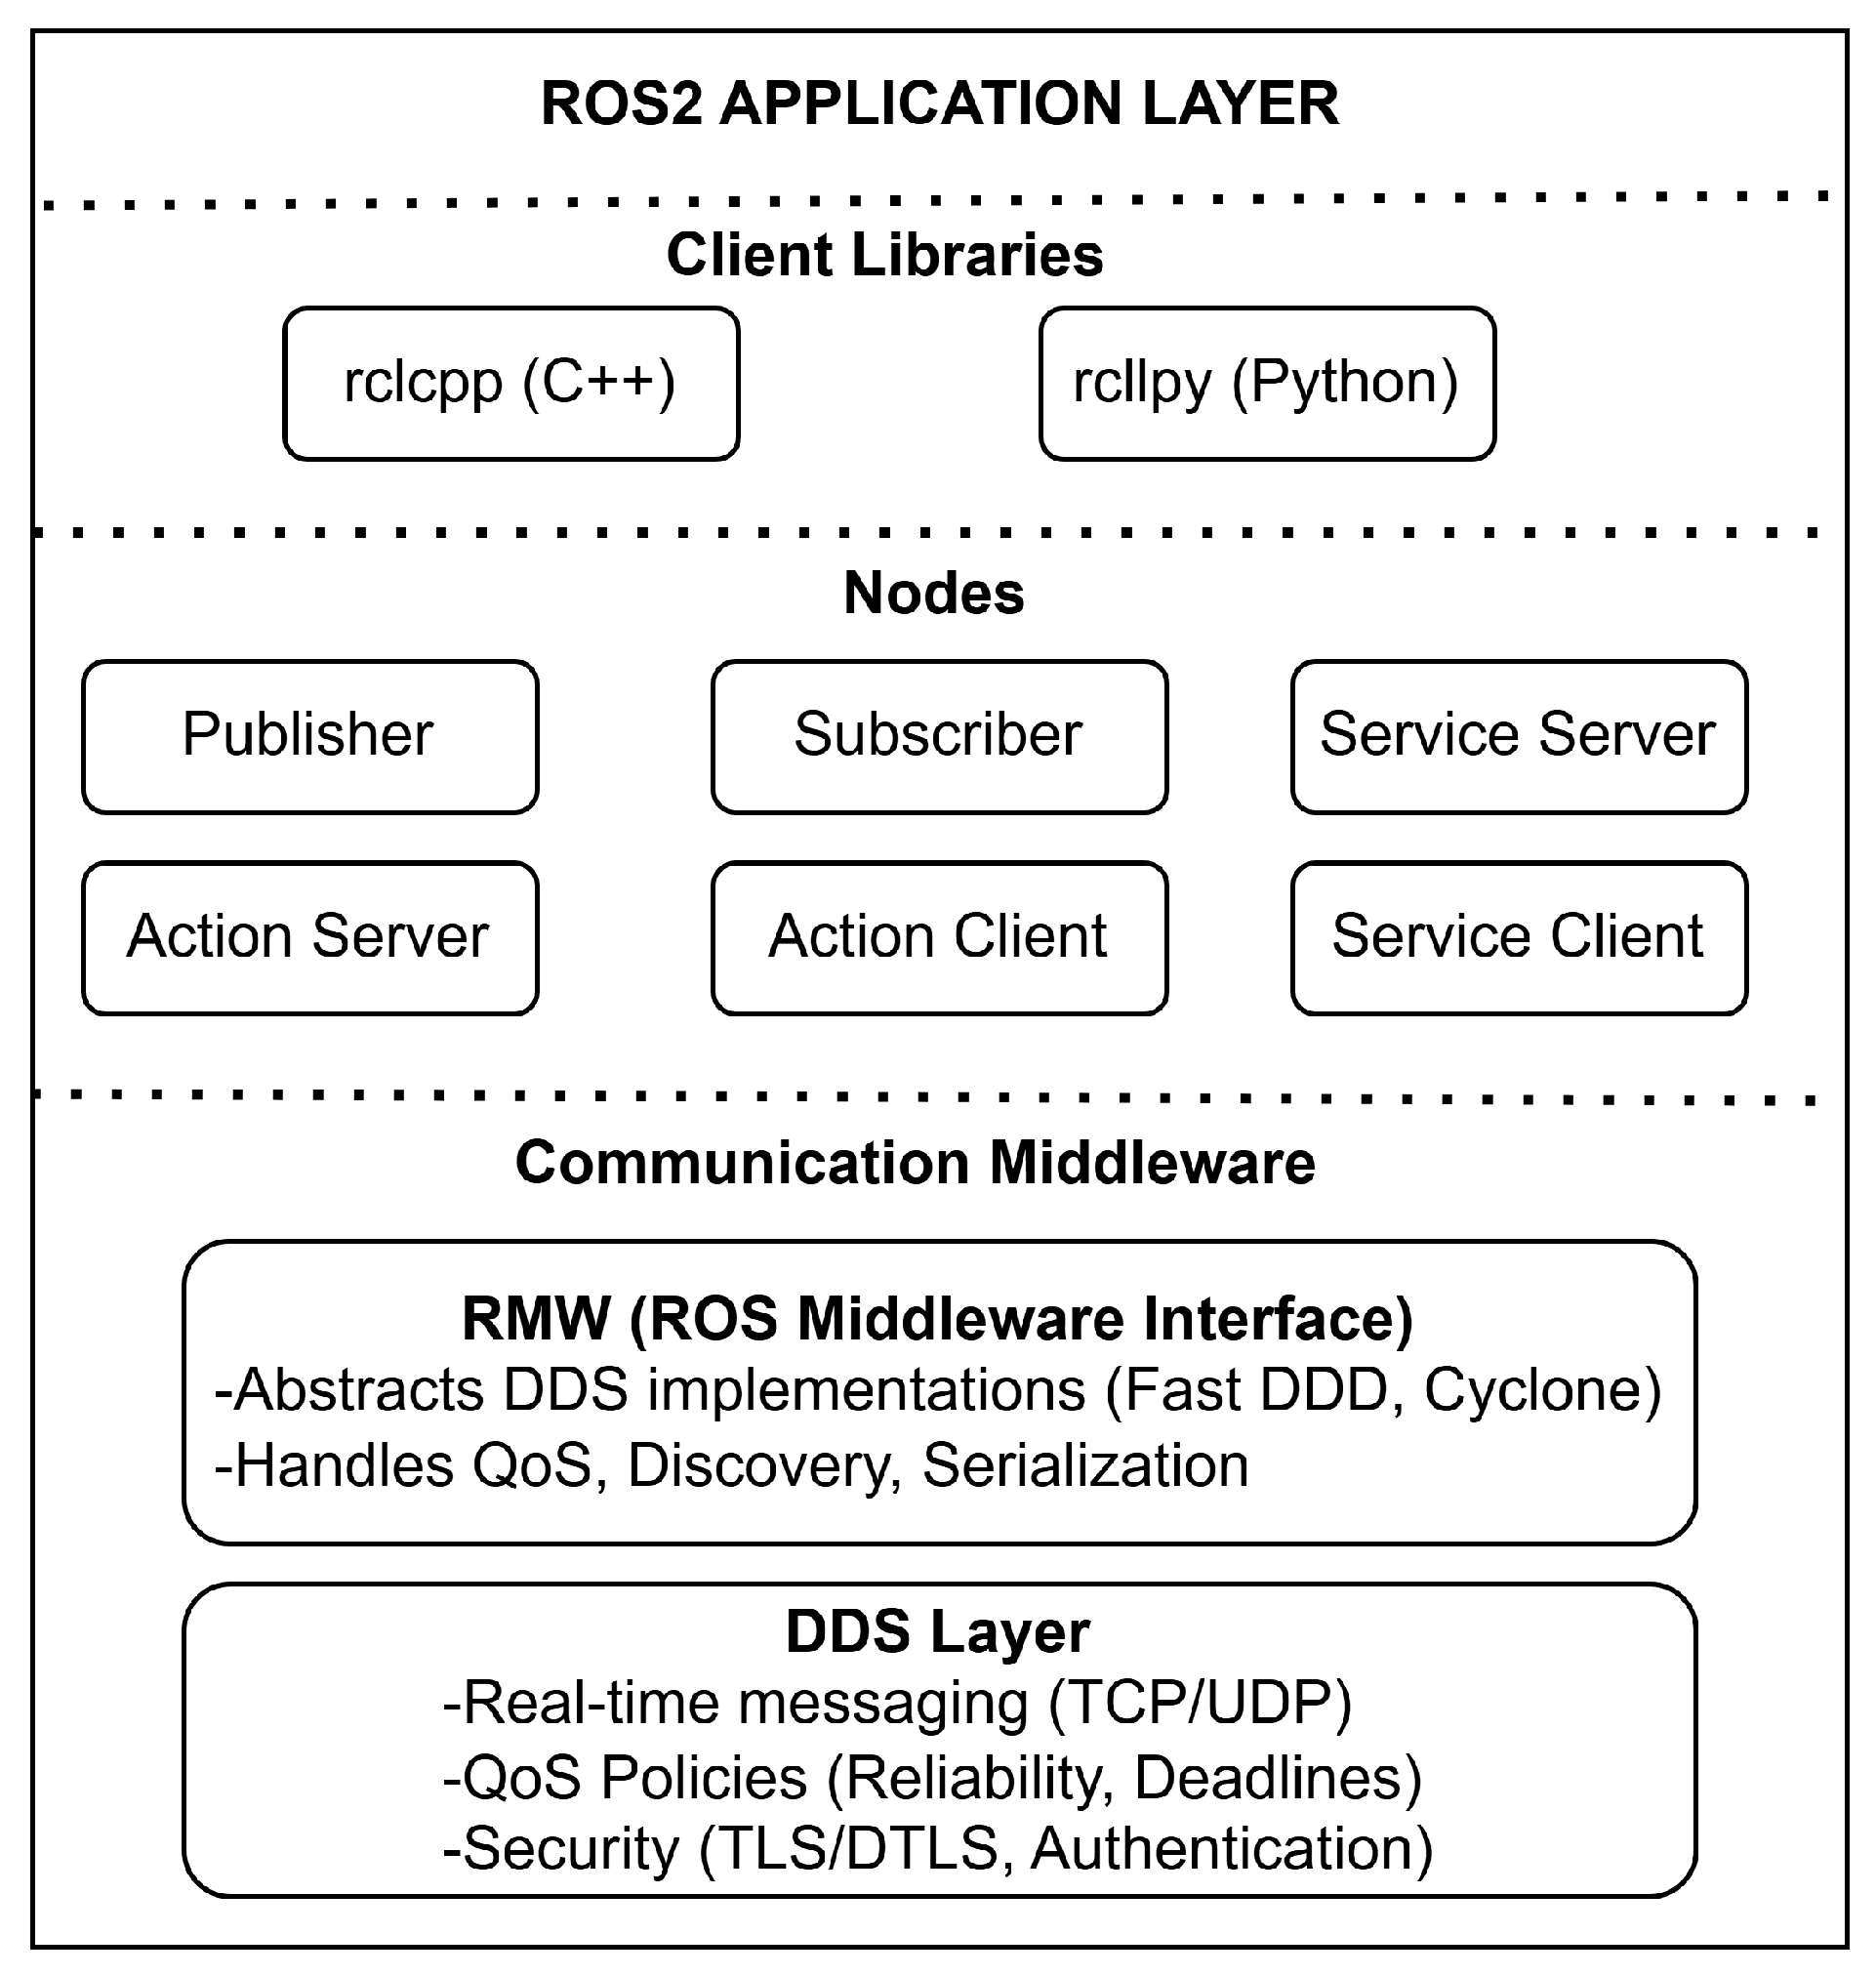
Section 2, we present the basic structure of the Ascon-AEAD128 lightweight authenticated-encryption algorithm, the properties of the Zaslavsky map used to provide pseudorandom number generation for integration into Ascon, the MQTT protocol enabling lightweight communication between robots and IoT devices, and the overall architecture of the ROS 2 middleware (İstanbul, Turkey).
Section 3 specifies the threat model and security objectives for the proposed chaos-based encryption variants.
Section 4 details the design and integration of the proposed chaos-based Ascon variants C1–C4.
Section 5 presents the experimental setup and the main evaluation results, reporting comprehensive analyses across image and text experiments as well as performance measurements. Finally,
Section 6 concludes with an interpretation of the results.
5. Experimental Setup and Analysis
All experiments were conducted on an ROS 2 robot running Ubuntu 22.04.5 LTS with 7.1 of GiB RAM and an AMD Ryzen 5 4600G CPU (6 physical cores, 12 threads). The CPU uses dynamic frequency scaling, operating in the range 400 MHz–4.3 GHz, with an 8 MB L3 cache. The robot runs the ROS 2 Humble distribution. The software stack consisted of ROS 2 Humble, Python 3.10.12, and the following libraries: NumPy 1.21.5, OpenCV 4.5.4, and Paho-MQTT 2.0.0. The proposed standard-compliant baseline (C1) and the exploratory variants (C2–C4) were used to secure communication between ROS 2–based robots and other IoT devices. As the IoT endpoint, we used a Raspberry Pi 3 Model B running 64-bit Debian 12 as a lightweight device. We employed the MQTT protocol to bridge the Raspberry Pi and ROS 2–based robots, using the Paho-MQTT client library and Mosquitto as the broker. Text and image encryption, decryption, and analyses were performed in Python. ROS 2–based robot clients and IoT clients exchanged image and text data via the image and data topics, respectively.
The standard-compliant baseline (C1) and the exploratory variants (C2–C4) were instantiated using two Zaslavsky-derived pseudorandom byte streams, PRN1 and PRN2. Each configuration was evaluated over 100 consecutive runs. For every experimental condition, we performed distributional and statistical analyses (histograms,
, correlation, Shannon entropy, NIST SP 800-22), assessed the encryption quality via MSE, MAE, and PSNR, examined the differential behavior using the avalanche effect, NPCR, and UACI, and measured the performance in terms of the key space size, key sensitivity, and processing time. In each iteration, the reference Ascon-AEAD128 ran side by side with the standard-compliant baseline (C1). In all experiments, the associated data
A were constructed per message as
device_id∥
session_id∥
counter∥
“ImageEncryption”, where the string literal “ImageEncryption” is constant, while
device_id,
session_id, and
counter vary across devices, sessions, and messages. The same analyses were applied to the exploratory variants C2–C4, and the corresponding tables are presented in
Appendix A. The experiments employed grayscale and color images at resolutions
,
, and
, sourced from the USC–SIPI Image Database and spanning a variety of styles [
52].
5.1. Statistical Analysis
Shannon entropy, histogram, correlation coefficients, and the NIST SP 800-22 test suite were used as complementary diagnostics to characterize the output-distribution uniformity and randomness.
5.1.1. Histogram Analysis
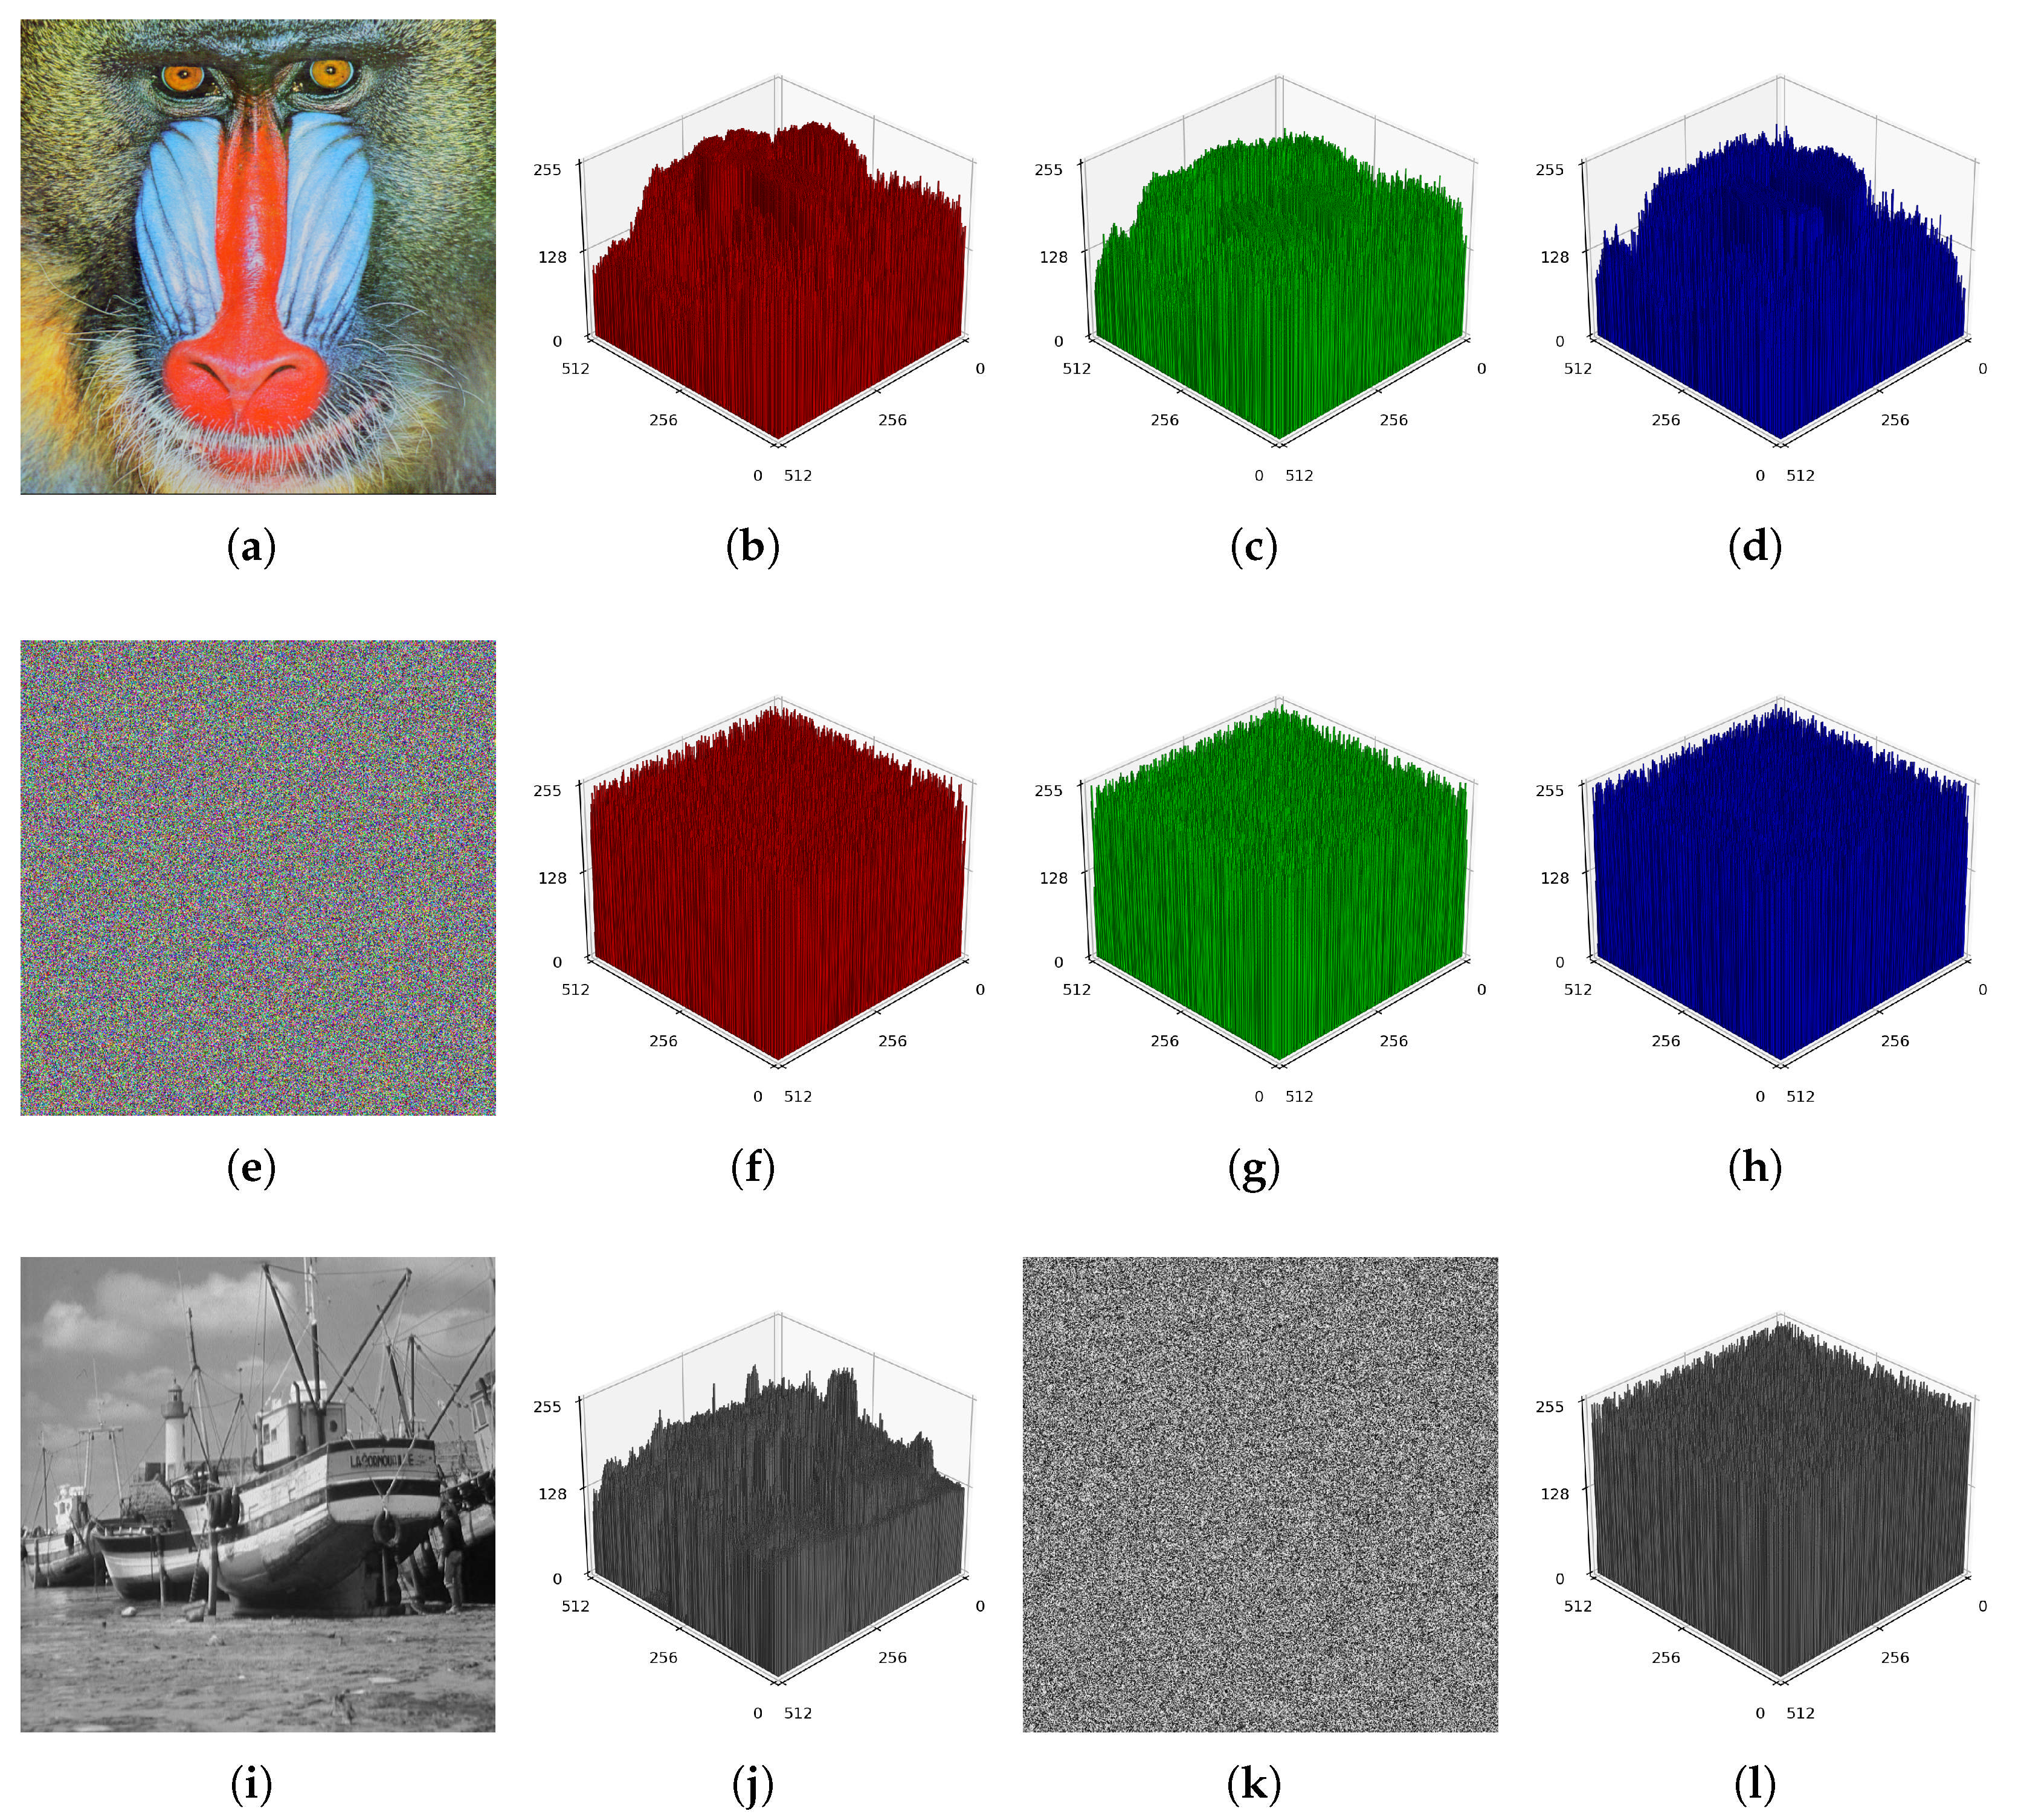
The distribution of pixel values in the encrypted image or the character/bit distribution in the ciphertext is determined by histogram analysis. The histogram (pixel-density distribution) of the image obtained from a quality encryption algorithm should be uniform. Thus, attackers are hindered from extracting useful information from the encrypted image and recovering the original image.
Figure 9 presents the histogram analysis results for the grayscale and color images. The results indicate that the ciphertexts effectively conceal visible structure in the plaintext images, exhibiting high uniformity and low residual correlation.
5.1.2. Chi-Square () Test
The
test assesses whether the pixel distributions in the encrypted images and the character/bit distributions in the ciphertext deviate from uniformity. A large
value indicates that the distribution is concentrated at certain levels and the encryption is poor, whereas a small
value indicates that the distribution is close to uniform and the encryption quality is good. The
statistic is computed as in Equation (
7).
where
denotes the observed frequency, i.e., the number of times the pixel value i occurs in the image, and E represents the expected frequency of each value under the assumption of a uniform distribution.
We conducted 100 independent encryption runs for each image with C1 and with the standard Ascon-AEAD128.
Table 4 reports the chi-square results as run-averaged values expressed as the mean ± standard deviation, the minimum
achieved by C1 together with the Ascon
from the same run index, and the number of runs whose
exceeds
for each method.
A lower
indicates a histogram closer to uniformity and, therefore, stronger diffusion. We adopted
as the 5% critical value; results above this threshold lead to rejection of the null hypothesis of uniformity and indicate that the ciphertext histogram is not consistent with randomness.
Table 4 shows that, when averaged over 100 runs, C1 attains a lower
in 11 of the 12 images, and in every row, the number of runs exceeding
is smaller under C1. Taken together, these findings indicate a consistent advantage of C1 in histogram uniformity and diffusion.
Equation (
8) is used to calculate the
statistic of the ciphertext. Here,
calculates the observed frequency, i.e., the number of times each byte value occurs in the ciphertext. The expected frequency, E, is the total data length (N) divided by 256. As with image data, a small
value for text data indicates that the bytes are close in frequency, and therefore, the distribution is uniform. Randomly generated plaintexts with different data lengths were encrypted, and the calculated
metric values are given in Table 19.
Table 5 demonstrates that, with respect to the
metric, C1 consistently outperforms the related methods across all evaluated images, yielding ciphertext histograms that are closest to uniform.
5.1.3. Correlation Analysis
Images are composed of pixels, and the relationship between two adjacent pixels is quantified by the Pearson correlation coefficient (). In the original images, adjacent pixels are usually close in color; so, their correlation is high. In the encrypted images, this relationship should be disrupted to achieve randomness, driving the correlation toward zero. is in the range [−1,1], with values of about 1 or −1 indicating a strong correlation, with values of about 0 indicating a very weak correlation.
The correlation coefficient between adjacent pixel values within a given image is given by Equation (
9).
Here, X and Y denote the datasets formed by pairs of adjacent pixel values (e.g., a pixel and its horizontal neighbor) in the image, and N is the number of adjacent pairs. and represent the means of X and Y, respectively, and and represent the standard deviations.
In the context of text encryption, Equation (
9) is used to measure whether there exists any linear relationship between the bytes of the plaintext and ciphertext located at the same position/index. In text encryption, the correlation within bit sequences or between characters is ideally close to zero, indicating that the texts do not exhibit any linear relationship, effectively hiding any pattern in the plaintext. Randomly generated plaintexts of varying lengths were encrypted, and the calculated correlation coefficients are presented in Table 19.
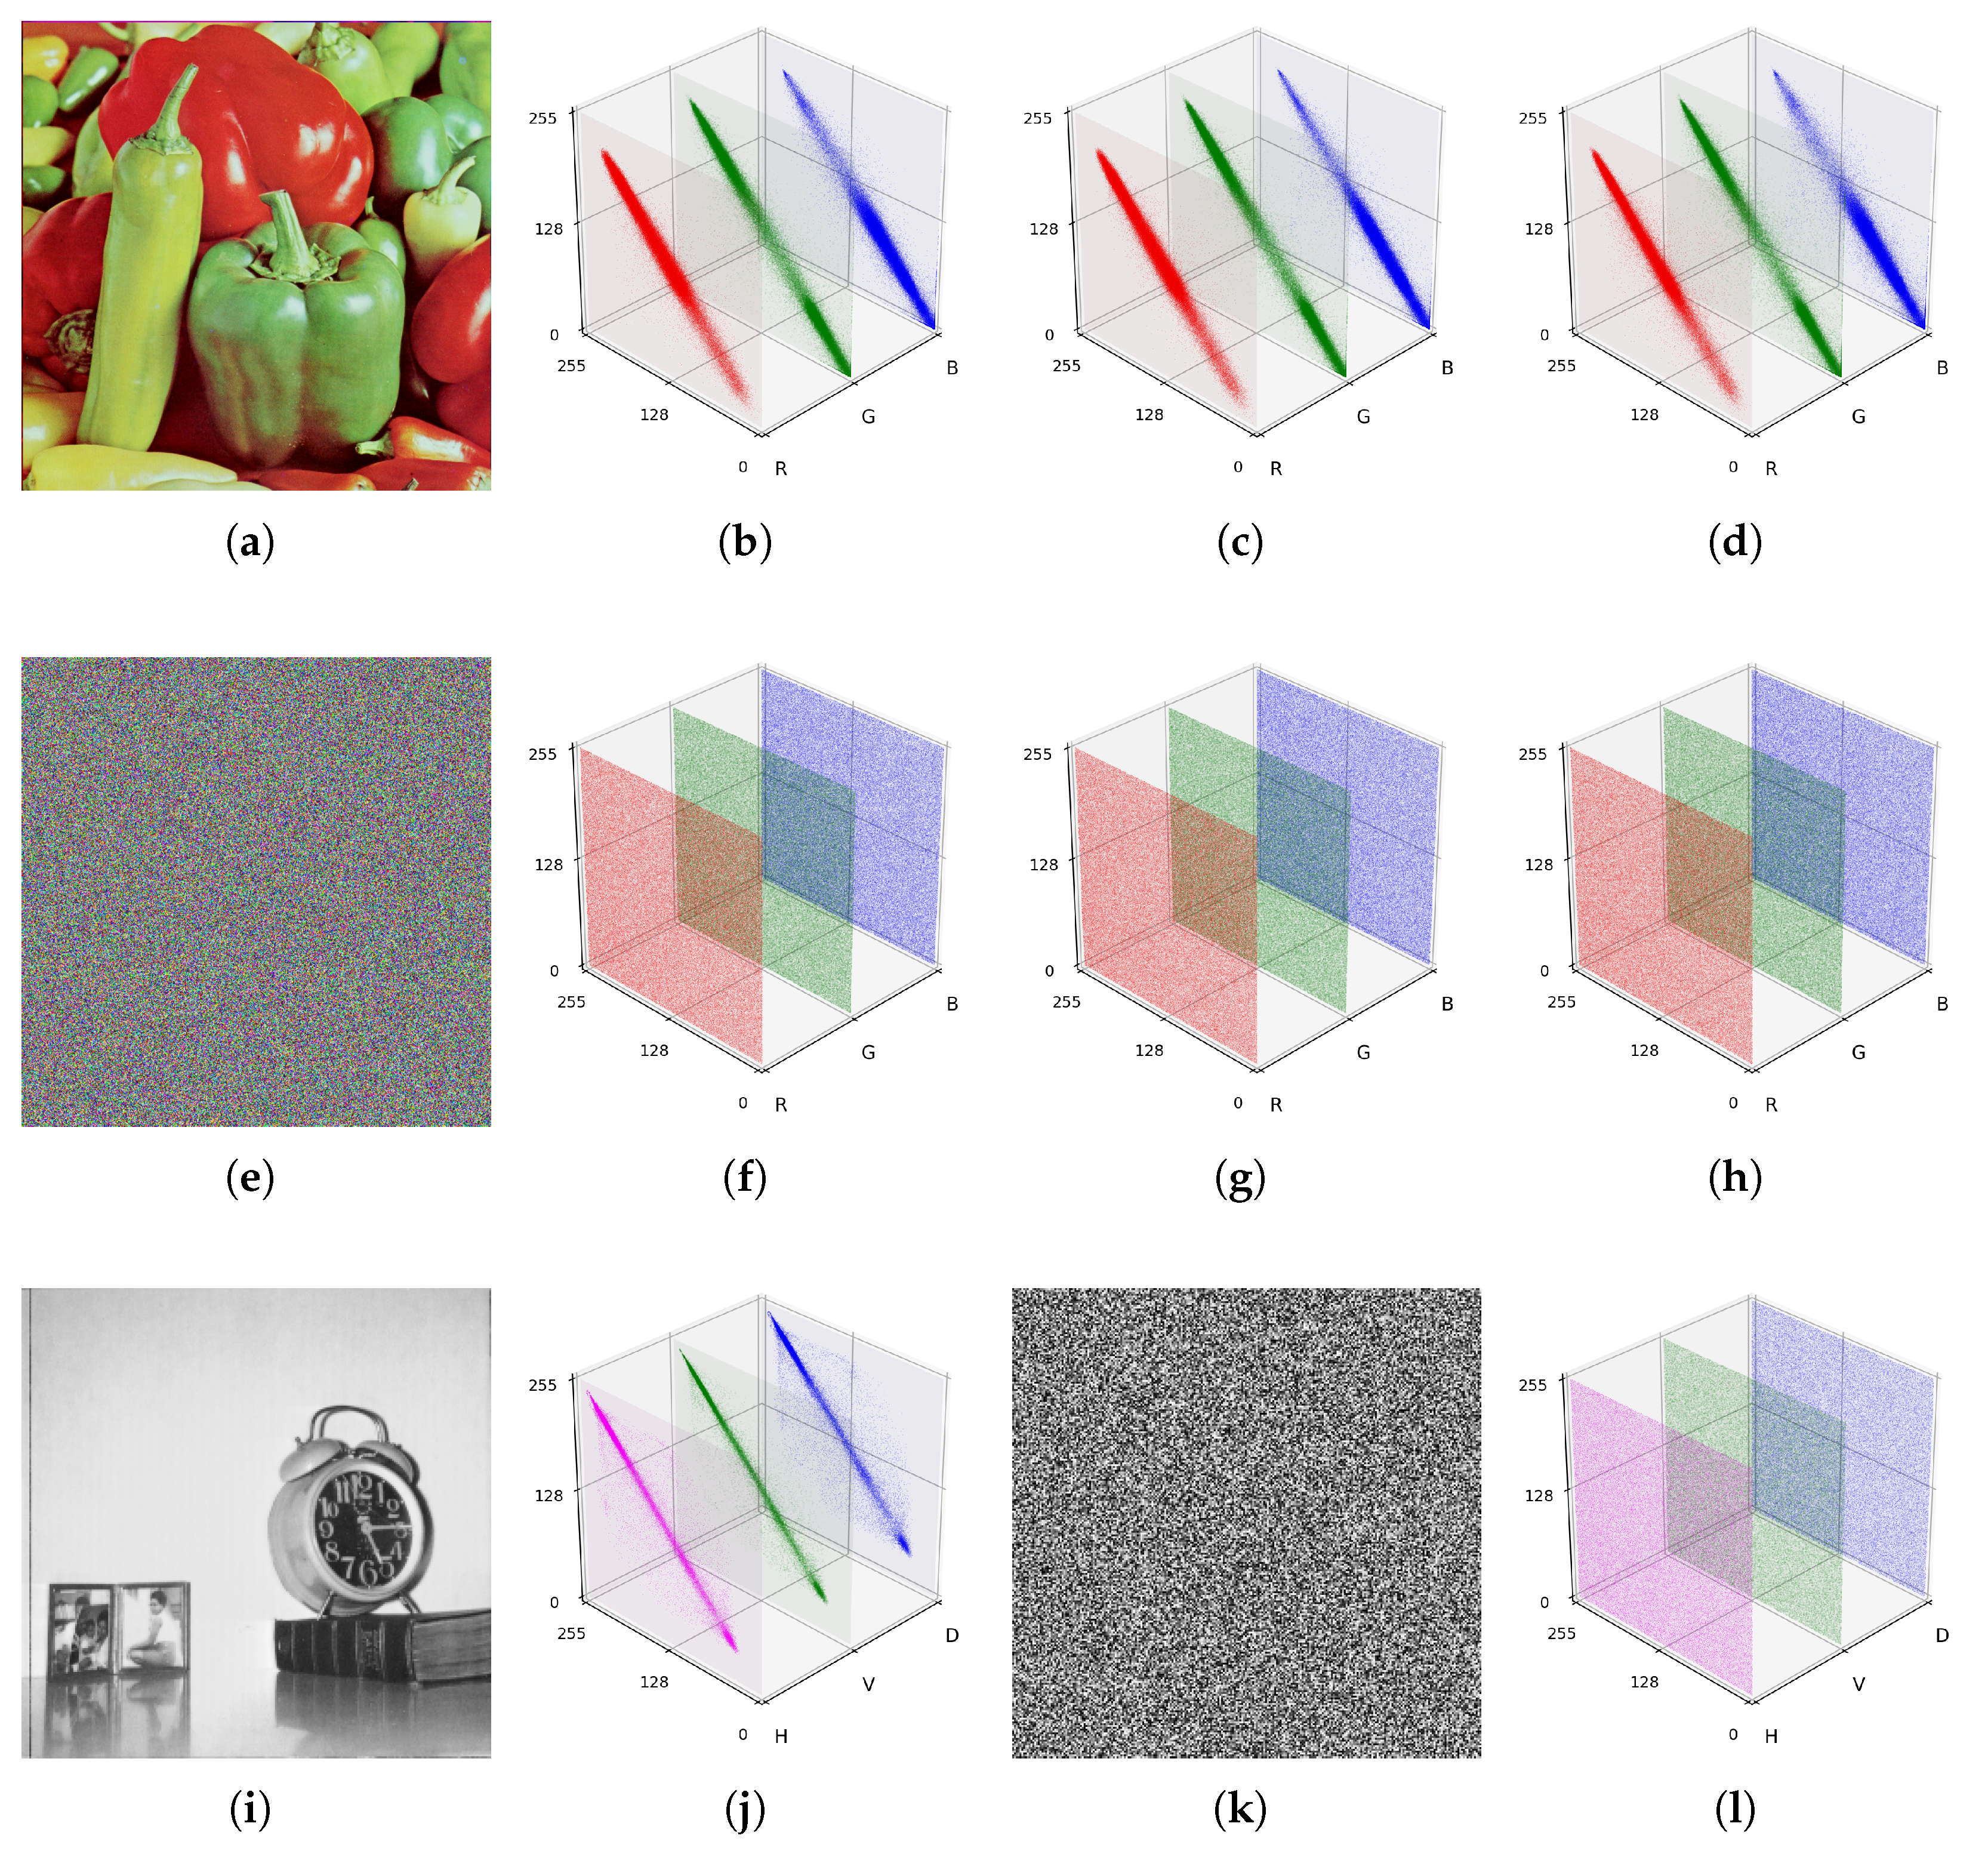
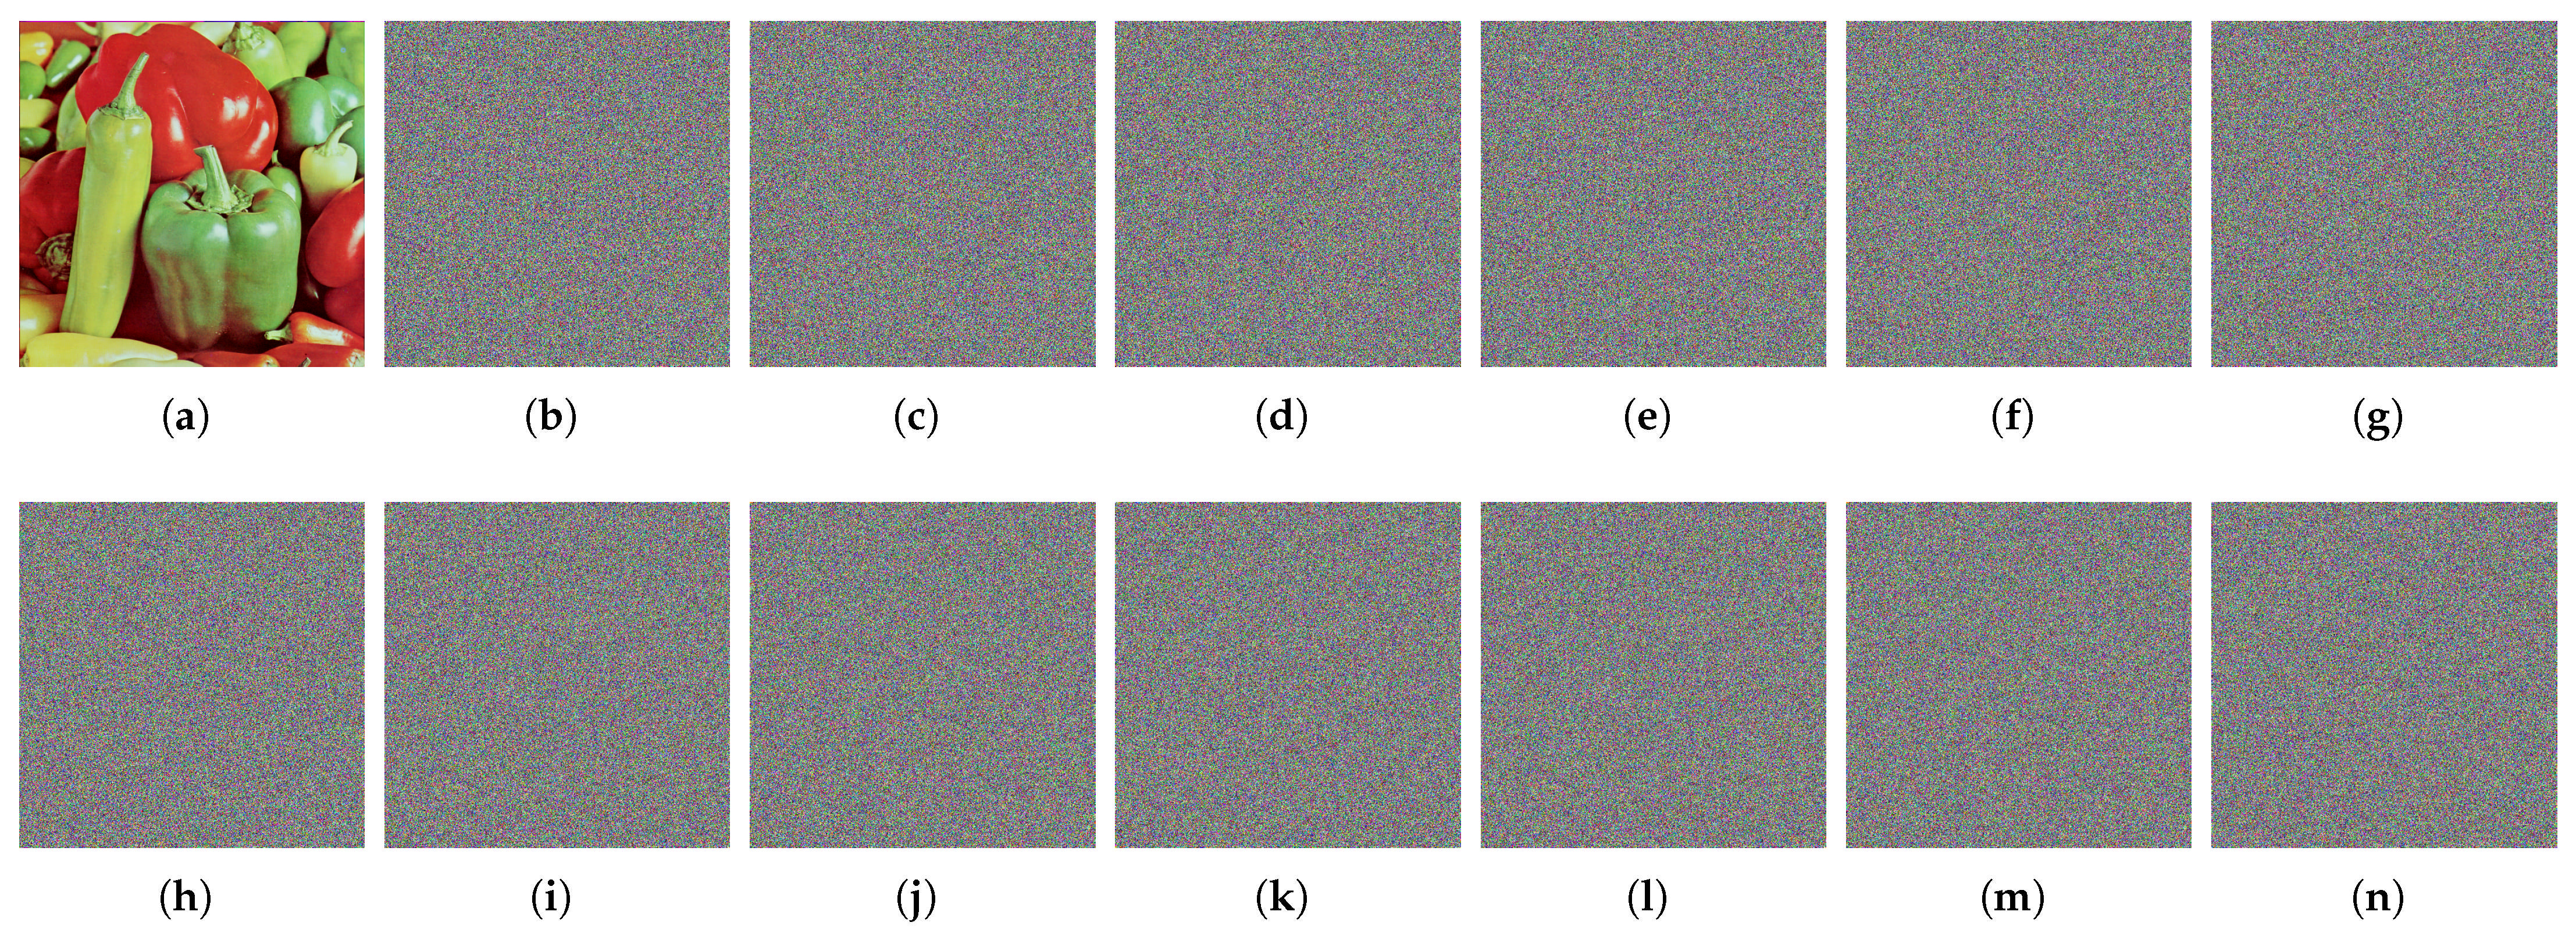
Figure 10 illustrates the horizontal, vertical, and diagonal correlations for the R, G, and B channels of the color image 4.2.07 and its encrypted counterpart; it also shows the corresponding correlations for grayscale image 5.1.12 and its encrypted counterpart.
Using C1 (with keys and nonces derived from the chaotic map) and standard Ascon-AEAD128, we performed 100 encryption runs per image. In each run, we computed the horizontal, vertical, and diagonal adjacent-pixel correlation coefficients for both ciphers. Because these coefficients can take on negative as well as positive values, simple averaging across runs is uninformative. Accordingly,
Table 6 reports, for each direction, the correlation coefficient of C1 that is closest to zero among the 100 runs, together with the corresponding Ascon coefficient evaluated at the same run index.
The reported magnitudes in
Table 6 are on the order of
–
, effectively indistinguishable from zero at image scale. Such near-zero coefficients indicate that local linear dependencies between neighboring pixels are strongly suppressed. This behavior is consistent with strong diffusion, whereby small changes in local structure do not survive encryption as measurable linear correlations. In practical terms, the correlation plots and coefficients suggest that C1 ciphertexts leave no exploitable linear spatial signature, reducing the risk of correlation-based statistical analysis on the encrypted images. Comparing the correlation values in
Table 6 with the corresponding results from prior studies in
Table 7 shows that the proposed approach more effectively disrupts inter-pixel relationships.
5.1.4. Entropy Analysis
Information entropy measures the uncertainty within a dataset. It is commonly used to assess whether the pixels in encrypted images or the bytes (characters) in text data are randomly distributed. Shannon entropy
H, calculated as in Equation (
10), is derived from the probability distribution of the pixel values in an image.
where the pixel probability
is computed as the ratio of the number of pixels with value
i to the total number of pixels in the image. Here,
denotes the count of value
i (i.e., the histogram frequency), and
H,
W, and
C denote the image height, width, and number of channels, respectively.
The calculation of
, which denotes the probability of the
ith byte value in the text data, is given by Equation (
11).
represents the observed frequency of the
ith byte, and
N represents the total number of bytes. Randomly generated plaintexts of varying lengths were encrypted, and the resulting entropy values are reported in Table 19.
If an image has a completely random and uniform distribution of pixels, the entropy value is 8, which is the maximum value for an 8-bit image. In text data, the maximum entropy value for 256 different symbols (bytes) is likewise 8. The entropy in the range of 7.9-8 for image and text data generally indicates good randomness. A low entropy value indicates that encryption may fail, and information leakage may occur.
Table 8 reports the entropy values for images encrypted with C1 and with the standard Ascon. The third column gives the maximum entropy observed over 100 runs for C1 (keys and nonces derived from the chaotic map). The fourth column provides the corresponding entropy value of the standard Ascon, taken from the same run index at which C1 attains its maximum. The next two columns summarize all 100 runs by reporting the mean and standard deviation of the entropy values for C1 and for the standard Ascon, respectively.
Table 8 shows that, for an 8-bit source, both schemes approach the theoretical maximum entropy of H = 8 bits. A more detailed comparison indicates that, in all 12 image-resolution pairs, the run-averaged entropy of C1 is higher than that of the standard Ascon. These findings suggest that integrating the chaotic map provides a consistent advantage in entropy across all cases, improving closeness to statistical uniformity without degrading security.
Table 9 further shows that C1’s entropy values for encrypted images are very close to the theoretical upper bound and competitive with the prior work.
5.1.5. NIST Statistical Test Suite
The NIST SP 800-22 test suite consists of 15 tests that focus on the different possible types of randomness of a sequence. Some of these tests may also consist of subtests [
50]. Each test generates a
p-value, and p takes values in the range [0,1]. If the
p-value generated from a test is 1, it means that the sequence given to the test is completely random, while 0 means that the sequence is not random. In general, a test
p-value greater than 0.01 indicates that the sequence is random and passes that test. Moreover, to claim randomness with respect to the suite, a sequence should pass all 15 tests.
Table 10 reports the NIST SP 800-22 test results for ciphertext bitstreams obtained by encrypting images with keys and nonces derived from the Zaslavsky map. Because the suite requires at least 1,000,000 bits per sequence, the tests were conducted on images of size
and
.
Across all tested sequences, the resulting p-values exceeded 0.01, including for the more stringent families (Frequency/Block Frequency, Runs/Longest-Run, DFT, Serial-1/2, Linear Complexity, and Random Excursions). The NIST SP 800-22 outcomes indicate no statistically significant irregularities in the ciphertext bitstreams and support the conclusion that C1 produces outputs with consistently strong indicators of statistical randomness.
5.2. Encryption Quality Analysis
Tests on the mean square error (MSE), mean absolute error (MAE), and peak signal-to-noise ratio (PSNR) were performed on the original images and their encrypted versions to calculate the efficiency and quality of an image encryption method. A secure image cipher is expected to produce large differences between the input and output (i.e., high MSE/MAE and low PSNR relative to the plaintext), indicating effective concealment of the visual structure.
5.2.1. Mean Square Error (MSE)
The MSE, which measures the mean squared difference between the pixel values of the plaintext and ciphertext images, is computed as in Equation (
12):
Here,
H and
W denote the height and width of the image, respectively.
is the pixel value of the plaintext image, and
is the pixel value of the ciphertext image at location
. The MSE increases as the ciphertext image deviates further from the plaintext image; a high MSE therefore indicates good encryption quality.
Table 11 reports the MSE values for images encrypted with C1 and the standard Ascon. The third column gives the maximum MSE value observed over 100 runs for C1 (with keys and nonces derived from the chaotic map). The fourth column provides the corresponding MSE value of the standard Ascon, taken from the same run index at which C1 attains its maximum. The next two columns summarize all 100 runs by reporting the mean and standard deviation of the MSE values for C1 and for the standard Ascon, respectively.
Across all test images in
Table 11, C1 attains higher MSE values than the standard Ascon, both at the single-run maximum (matched at the same run index) and in the run-averaged metric (mean ± std over 100 runs). This consistent increase in MSE indicates enhanced image-domain obfuscation, i.e., stronger suppression of residual plaintext structure in the ciphertext.
5.2.2. Mean Absolute Error (MAE)
The MAE quantifies the average absolute difference between the pixel values of the plaintext and ciphertext images, as given by Equation (
13). Larger MAE values indicate greater pixel-wise deviation between the plaintext and ciphertext images, which is desirable for image-domain obfuscation.
Here,
and
denote the pixel values of the plaintext and ciphertext images at location
;
H and
W denote the image height and width, respectively.
Table 12 reports the MAE values for images encrypted with C1 and the standard Ascon. The third column gives the maximum MAE value observed over 100 runs for C1 (with keys and nonces derived from the chaotic map). The fourth column provides the corresponding MAE of the standard Ascon, taken from the same run index at which C1 attains its maximum. The next two columns summarize all 100 runs by reporting the mean and standard deviation of the MAE values for C1 and for the unmodified Ascon, respectively.
Table 12 summarizes the image-domain distortion via the MAE. The run-averaged MAE (mean ± std over 100 runs) is consistently higher for C1. The absolute mean differences are small (on the order of
to
MAE units), with standard deviations of similar magnitude for both methods, indicating that the increase is achieved without sacrificing run-to-run consistency. Overall, the table shows a consistent but modest advantage for C1 in MAE—i.e., stronger image-domain obfuscation—across the evaluated images.
Table 13 reports the MAE values for images encrypted with C1, alongside comparable results from the literature.
Table 13 assesses the separation between the ciphertext and the original images using MSE and MAE; for these metrics, larger values indicate stronger concealment. C1 achieves values on par with those reported in prior work and slightly higher in many cases, indicating robust distortion and concealment.
5.2.3. Peak Signal-to-Noise Ratio (PSNR)
The PSNR quantifies the peak signal-to-noise ratio between the plaintext image and the ciphertext image and is computed as in Equation (
14).
Here,
denotes the maximum possible pixel value. For 8-bit images
equals 255. MSE is defined in Equation (
12). In this context, a higher PSNR indicates lower pixel-wise distortion, whereas a lower PSNR indicates stronger image-domain obfuscation.
Table 14 reports the PSNR (dB) for images encrypted with C1 and the standard Ascon. The third column gives the minimum PSNR observed across 100 runs for C1. The fourth column lists the matched PSNR of the standard Ascon, evaluated at the same run index at which C1 attains its minimum. The last two columns report the run-averaged PSNR values (mean ± std over 100 runs) for C1 and the standard Ascon, respectively.
Using PSNR, which in the context of image encryption means that lower values reflect the stronger concealment of the visible structure, we find that the C1 and standard Ascon perform comparably. Across all test images, both schemes achieve a consistently low PSNR, approximately 6 to 9 dB. The differences between the methods are marginal. These results suggest that the C1 modification preserves Ascon’s image-level concealment performance without degrading PSNR-based distortion characteristics.
Table 15 reports the PSNR values for images encrypted with C1, alongside comparable results reported in the literature.
5.3. Differential Analysis
Cryptanalysts conduct differential attacks by introducing slight modifications to the original plaintext or image and encrypting it with the same key, in an attempt to identify relationships between the original and the resulting encrypted output (e.g., ciphertext for text, encrypted image for images). Therefore, an encryption algorithm must exhibit strong diffusion, such that a small change—for example, altering a single byte or pixel in the input—produces a significantly different output. To evaluate an algorithm’s resistance to such attacks, the avalanche effect test is employed for text data, while the NPCR and UACI metrics, image-domain analogs of the avalanche effect, are used for encrypted images. In this study, we introduced a slight modification by increasing the first pixel value of the red channel by 1 for color images, and the first pixel value by 1 for grayscale images.
5.3.1. Avalanche Effect
The avalanche effect is the phenomenon whereby a very small change in the encryption key or plaintext results in a significant change in the corresponding ciphertext. In encryption algorithms, a small change, such as inverting a single bit or increasing or decreasing a single pixel by 1, is intended to produce a large and widespread difference in the output. In plaintext data, the avalanche effect is calculated as in Equation (
15).
where
denotes the
byte of the ciphertext obtained by encrypting the original plaintext, and
denotes the
byte of the ciphertext obtained by encrypting the plaintext in which one bit of the original was flipped. The function bitcount calculates the number of different bits in the
byte.
L is the total number of bytes in the ciphertext.
For an encryption algorithm to be considered highly sensitive to input changes and to provide strong security, approximately 50% of the bits should change when a single input bit is flipped. The avalanche-effect results for randomly generated plaintexts of varying lengths are reported in Table 19. The avalanche effect for encrypted images is assessed using the NPCR and UACI metrics.
5.3.2. Number of Pixels Change Rate (NPCR)
The NPCR metric measures the percentage of pixels that differ between two encrypted images: one obtained by encrypting the original image and the other obtained by encrypting the image after randomly modifying a single pixel value. The NPCR is computed as in Equation (
16).
Here,
denotes the ciphertext obtained by encrypting the original image, and
denotes the ciphertext obtained after modifying a single pixel in the original image. For each pixel location
,
if the corresponding pixels in
and
are equal, and
otherwise.
H and
W denote the image height and width, respectively. NPCR measures the proportion of pixels that change between
and
; values approaching its theoretical ideal indicate stronger sensitivity to plaintext changes and better diffusion. For 8-bit images under ideal diffusion, the theoretical NPCR is
[
63].
For each run, we computed the absolute difference between the measured NPCR and the theoretical ideal. The mean absolute deviation (
) was then calculated by averaging these differences over 100 runs, as given in Equation (
17). Smaller values of
and
indicate closer proximity to the theoretical ideal.
where
is the measured NPCR (in %) at run
i for method
A, and
.
Table 16 presents, for both C1 and the standard Ascon, the mean ± standard deviation of the NPCR over 100 runs, together with the mean absolute deviation (
) from the ideal value.
Across all twelve image–resolution pairs, the C1 exhibits consistently better diffusion than the standard Ascon. The run-averaged NPCR values of both schemes lie close to the theoretical ideal of
, yet C1 is systematically closer to the ideal. In every row of
Table 16, the mean absolute deviation from the ideal (
) is smaller than that of the standard Ascon (
). Taken together, this evidence indicates that C1 achieves marginal yet consistent gains in plaintext-change sensitivity as measured by the NPCR. Table 18 compares the NPCR (%) of images encrypted with C1 to values reported in the literature and shows that integrating chaotic parameters from the Zaslavsky map into Ascon-AEAD128 effectively propagates a single-bit change in the original image across the encrypted image.
5.3.3. Unified Average Changing Intensity (UACI)
UACI, another metric used in differential analysis, measures the average change in pixel intensity between two encrypted images. The first image is obtained by encrypting the original image. The second is obtained by modifying exactly one pixel in the original image and then encrypting it. The modification may consist of increasing or decreasing the intensity of a randomly selected pixel by 1 or setting it to 0 or 255. The UACI is computed as in Equation (
18).
Here,
denotes the encrypted image obtained by encrypting the original image, and
denotes the encrypted image obtained by first modifying one pixel of the original image and then encrypting it. In a secure image-encryption scheme, small changes in the plaintext should induce large changes in the ciphertext; accordingly, the term
captures this per-pixel sensitivity and underlies the UACI metric. For 8-bit images under ideal diffusion, the theoretical UACI is
[
63]. For each run, we computed the absolute difference between the measured UACI and the theoretical ideal. The mean absolute deviation (
) was then calculated by averaging these differences over 100 runs as given in Equation (
17).
Table 17 presents, for both C1 and standard Ascon, the mean ± standard deviation of the UACI together with
(deviation from the ideal) after 100 runs.
Table 17 provides a UACI-based assessment of the differential resistance for C1 and the standard Ascon. For all the tested images, the empirical mean UACI values of both schemes are close to the theoretical ideal of
, indicating strong diffusion. A finer comparison based on the mean absolute deviation from the ideal (
) shows a consistent advantage for C1: in all twelve image–resolution pairs,
is lower than
, meaning C1’s UACI values are systematically closer to the ideal over 100 runs. Moreover, C1 exhibits lower run-to-run variability, with smaller standard deviations in every case. Overall, these findings indicate a small but uniform improvement in diffusion for C1.
Table 18 compares the UACI (%) of images encrypted with C1 to the values reported in the literature.
Table 18.
NPCR and UACI (%) values for images encrypted with C1 and the related work.
Table 18.
NPCR and UACI (%) values for images encrypted with C1 and the related work.
| Size | Filename | Reference | NPCR (%) | UACI (%) |
|---|
| 256 × 256 | 4.1.05 | Proposed | 99.609375 | 33.463831 |
| [60] | 99.6028 | 33.4018 |
| [59] | 99.6217 | 33.4176 |
| [53] | 99.5941 | 33.4498 |
| 4.1.06 | Proposed | 99.609375 | 33.463480 |
| [60] | 99.5956 | 33.5235 |
| [59] | 99.6101 | 33.5062 |
| [53] | 99.6246 | 33.4227 |
| 5.1.10 | Proposed | 99.609375 | 33.463763 |
| [58] | 99.6094 | 33.4801 |
| [12] | 99.6124 | 33.4835 |
| [64] | 99.6017 | 33.5032 |
| [65] | 99.6155 | 33.5115 |
| 5.1.11 | Proposed | 99.609375 | 33.463368 |
| [58] | 99.6189 | 33.5077 |
| [12] | 99.5956 | 33.3793 |
| [64] | 99.6139 | 33.4719 |
| [65] | 99.6094 | 33.5174 |
| 5.1.12 | Proposed | 99.609375 | 33.464008 |
| [58] | 99.6178 | 33.4835 |
| [12] | 99.6108 | 33.4883 |
| [64] | 99.6185 | 33.4541 |
| [65] | 99.5758 | 33.4202 |
| 512 × 512 | 4.2.03 | Proposed | 99.609375 | 33.463457 |
| [55] | 99.61548 | 33.44075 |
| [50] | 99.6249 | 33.5860 |
| [54] | 99.6222 | 33.4901 |
| 4.2.05 | Proposed | 99.609375 | 33.463546 |
| [60] | 99.6231 | 33.4475 |
| 4.2.07 | Proposed | 99.609375 | 33.463537 |
| [55] | 99.60327 | 33.47308 |
| [25] | 99.6128 | 33.4915 |
| 5.2.09 | Proposed | 99.609375 | 33.463648 |
| [58] | 99.585 | 33.4687 |
| [12] | 99.617 | 33.4727 |
| [64] | 99.5971 | 33.4757 |
| [65] | 99.6094 | 33.4528 |
| Boat.512 | Proposed | 99.609375 | 33.463631 |
| [58] | 99.6178 | 33.4590 |
| [12] | 99.6140 | 33.4814 |
| [64] | 99.6284 | 33.4568 |
| [65] | 99.5998 | 33.4519 |
| 1024 × 1024 | 5.3.01 | Proposed | 99.609375 | 33.463550 |
| [58] | 99.6082 | 33.4611 |
| [64] | 99.6134 | 33.4943 |
| [65] | 99.6035 | 33.4741 |
| 7.2.01 | Proposed | 99.609375 | 33.463597 |
| [58] | 99.6128 | 33.4289 |
| [64] | 99.6072 | 33.4746 |
| [65] | 99.6013 | 33.4548 |
The NPCR and UACI values closest to the ideal from the 100 encryption runs are listed in
Table 18, alongside the results reported in the literature.
Table 18 demonstrates the clear superiority of C1 on the differential metrics. For every image–size pair, C1 attains the theoretical ideal NPCR of 99.609375%, whereas the related works report lower values. For the UACI, C1 reaches or is closest to the ideal 33.4635% in most cases, yielding the best value in the corresponding entries. These findings indicate that C1 achieves stronger diffusion and differential resistance than the previously reported methods.
5.4. Key Space Analysis
In an encryption algorithm, the key space denotes the total number of all theoretically possible key combinations. The key space must be sufficiently large to make brute-force attacks computationally infeasible. Keys with a minimum of 128 bits should be used, making brute-force key scanning practically impossible [
55,
66].
In the case of Ascon-AEAD128, the secret key has a fixed size of 128 bits. The 128-bit nonce must be unique under the same key and can be public; therefore, it is not considered part of the secret key space. Hence, the brute-force security of the Ascon is strictly determined by the 128-bit secret key, yielding an effective key space of .
In the proposed structure, the secret key is generated using parameters obtained from the Zaslavsky map. Each parameter is represented in IEEE-754 double-precision format, which provides 53 bits of significant precision. Since the chaotic map involves two state variables and three control parameters, the theoretical upper bound of the parameter space is states. Nevertheless, regardless of the size of this parameter space, the derived key is compressed into a 128-bit Ascon-AEAD128 key, and thus the overall brute-force security level of the system remains bounded by .
5.5. Key Sensitivity Test
According to Shannon’s confusion principle, a secure image encryption algorithm must exhibit very high sensitivity to its secret key. In practice, even the slightest modification of the key or of the parameters used to generate the key should produce a completely different ciphertext image.
In our experiments, a secret key
K was first derived from the Zaslavsky map parameters (
= 0.1234,
= 0.5678,
r = 0.9,
v = 0.5,
e = 2.718281828459045). Each parameter was then minimally perturbed, and the modified values were used to generate new keys for encrypting the same test image. The differences between each encrypted images and the original encrypted image were computed and are shown in
Figure 11. Throughout the key-sensitivity experiments, the nonce, associated data
A, counter, and session-ID values were kept constant to isolate the impact of the key variations. Furthermore, to examine the sensitivity of the final 128-bit Ascon key, a one-bit flip was applied, and the modified key was used to re-encrypt the same image. The results clearly show that both a minimal change in any chaotic parameter and a single-bit change in the final key produce entirely different ciphertext images. These findings confirm that the proposed scheme satisfies Shannon’s confusion requirement.
Equation (
19) is used to measure the sensitivity of the ciphertext to changes in the key. Each bit of the
N-bit key is inverted one at a time, and the avalanche effect is measured after each inversion. Using Equation (
15), the avalanche effect for each modified key bit is computed from the difference between the ciphertext produced with the original key and the ciphertext produced after flipping that bit. The final key-sensitivity score is then obtained by averaging these per-bit avalanche values over all
N key bits, as given in Equation (
19). Thus, on average, the number of output bits changed as a result of a single-bit modification is determined. When any bit of the key is changed, the average number of altered output bits should be approximately equal to half the number of plaintext bits. In this study,
N = 128.
5.6. Text Data Analysis
Randomly generated plaintexts of varying lengths were encrypted with C1 and with Ascon-AEAD128. The resulting ciphertexts were evaluated using entropy, correlation, chi-square, avalanche (bit level), key sensitivity, MSE, and MAE. The Zaslavsky map was initialized with
,
,
,
, and
. At each iteration, the updated
served as the initial conditions for the next step, and the resulting chaotic sequences were used to derive the key and nonce. For both C1 and Ascon, after 100 runs,
Table 19 reports the run-averaged results for the entropy, chi-square, avalanche, key sensitivity, MSE, and MAE, together with the minimum observed correlation.
Table 19.
Evaluation across message lengths using matched random plaintexts with C1 and with the standard Ascon.
Table 19.
Evaluation across message lengths using matched random plaintexts with C1 and with the standard Ascon.
| Metric | Length [B] = 256 | Length [B] = 512 | Length [B] = 1024 | Length [B] = 10,240 |
|---|
| C1 | Ascon | C1 | Ascon | C1 | Ascon | C1 | Ascon |
|---|
| Entropy | 7.1782 | 7.1647 | 7.5955 | 7.5891 | 7.8102 | 7.8064 | 7.9821 | 7.9817 |
| Correlation | −0.0001 | −0.0001 | −0.0001 | 0.0001 | −0.0001 | 0.0001 | 0.0001 | 0.0001 |
| Chi-square | 254.58 | 257.38 | 256.87 | 259.90 | 254.96 | 257.75 | 255.17 | 258.23 |
| Avalanche (%) | 50.07 | 49.81 | 50.17 | 49.86 | 50.04 | 49.99 | 50.00 | 49.96 |
| Key Sensitivity | 1024.13 | 1023.77 | 2048.34 | 2047.51 | 4096.88 | 4095.63 | 40,959.41 | 40,956.30 |
| MSE | 11,060.08 | 10,916.95 | 11,017.74 | 10,891.42 | 10,892.27 | 10,865.43 | 10,938.00 | 10,904.01 |
| MAE | 85.98 | 85.19 | 85.71 | 85.18 | 85.20 | 85.04 | 85.41 | 85.24 |
Table 19 reports the run-averaged text-encryption metrics for C1 and standard Ascon-AEAD128 at plaintext lengths of 256, 512, 1024, and 10,240 bytes. For each message length, 100 independently generated random plaintexts were encrypted with C1 and with standard Ascon, using keys and nonces freshly derived from the chaotic map for each run. Across lengths, the ciphertext statistics exhibit the expected convergence: entropy approaches the 8-bit ideal, chi-square values remain comfortably below the critical threshold, correlation scores stay close to zero, and diffusion-oriented metrics concentrate around their nominal targets. Taken together, these results show no systematic irregularity and indicate that, under the tested conditions, C1 matches, and in several lengths marginally improves upon, the standard Ascon in terms of histogram uniformity and diffusion.
5.7. Performance Analysis
We analyze how Ascon-AEAD128, the standard-compliant C1 scheme, and the C4 variant (which dynamically generates
IV,
RC, and
LC) affect the encryption and decryption times.
Table 20 reports the parameter-generation times (in milliseconds) used by the ciphers.
In the baseline Ascon, obtaining the key and nonce from the CPU RNG takes 0.003 ms. In C1, both parameters are derived from chaotic-map random numbers: the key is generated directly from chaotic outputs, while the nonce is constructed by concatenating chaotic outputs with a counter and a session identifier; this process takes 0.020 ms. C4 generates the key and nonce via the CPU and produces chaotic random numbers to construct RC and LC, requiring 1.449 ms. The dominant cost arises from enforcing bijectivity in the LC.
Table 21 reports the encryption and decryption times for 12 images, in seconds. The parameter-generation overhead is excluded from these measurements. The results indicate that encryption and decryption exhibit comparable runtimes.
6. Conclusions and Future Work
In this study, we develop a chaos-based lightweight encryption approach by integrating pseudorandom numbers generated by the Zaslavsky map into Ascon-AEAD128 for key and nonce derivation (C1). In baseline Ascon-AEAD128, keys and nonces are generated per run, while the permutation, IV, round constants, and linear constants remain standard; the same core remains unchanged in C1. We implement MQTT-based communication between ROS 2 Humble robots and Raspberry Pi 3B devices and encrypt grayscale and color images of sizes 256 × 256, 512 × 512, and 1024 × 1024, as well as text of varying lengths. We conduct 100 runs per setting and evaluate the entropy, , adjacent-pixel correlation, NPCR, UACI, PSNR, MSE, and MAE. For completeness, we also report exploratory variants (C2–C4) that modify internal constants as ablations. For C2–C4, analyses are limited to statistical and differential tests to examine chaos-induced improvements in randomness and diffusion.
Across the 100-run experiments, C1 produces ciphertexts whose statistical and differential indicators are consistently close to their theoretical ideals. Shannon entropy remains near 8 bits; averages are lower in most image–size pairs, with fewer exceedances of the 293.25 threshold; adjacent-pixel correlations are very close to zero across all images and directions; the NPCR and UACI reach near-ideal levels; the PSNR values are low, indicating strong concealment; and the MSE/MAE are comparable, often slightly higher than the baseline. Taken together, these results demonstrate a consistent and repeatable advantage of C1 in histogram uniformity and decorrelation over standard Ascon-AEAD128.
The appendices present exploratory results for C2–C4. Across the tested image–size pairs, these variants show clear instances of improvement in distributional and differential indicators relative to the corresponding standard Ascon runs, most notably lower averages or fewer exceedances of 293.25 in multiple cases, and correlation coefficients closer to zero for selected images and directions. The NPCR and UACI remain close to their theoretical ideals, with several cases exhibiting tighter proximity, while the PSNR and MSE/MAE are consistently comparable to the baselines. Although the gains are moderate and not uniform across all settings, the evidence indicates that chaos-driven parameterization delivers measurable benefits and is a promising direction for enhancing diffusion-oriented behavior. Consistent with the threat model, these findings are diagnostic and exploratory and do not extend AEAD security claims beyond those of the standard Ascon.
Future work will broaden the chaotic design space beyond the Zaslavsky map by exploring piecewise-linear maps and four- and five-dimensional hyperchaotic systems to enlarge the effective key space. We will also pursue dynamic parameter optimization and AI-based control mechanisms, with a C++ implementation targeting efficiency. In addition, we will investigate FPGA/ASIC implementations of the chaos-based Ascon design to evaluate resource utilization and power consumption at the hardware level.


