Article

Total Fuel Cost, Power Loss, and Voltage Deviation Reduction for Power Systems with Optimal Placement and Operation of FACTS and Renewable Power Sources

by
Tuan Anh Nguyen
1,
Le Chi Kien
1,
Minh Quan Duong
2,
Tan Minh Phan
3,* and
Thang Trung Nguyen
3
1
Faculty of Electrical and Electronics Engineering, Ho Chi Minh City University of Technology and Education, Ho Chi Minh City, Vietnam
2
Department of Electrical Engineering, The University of Da Nang—University of Science and Technology, Da Nang City, Vietnam
3
Power System Optimization Research Group, Faculty of Electrical and Electronics Engineering, Ton Duc Thang University, Ho Chi Minh City, Vietnam
*
Author to whom correspondence should be addressed.
Appl. Sci. 2025, 15(19), 10596; https://doi.org/10.3390/app151910596
Submission received: 30 August 2025 / Revised: 24 September 2025 / Accepted: 26 September 2025 / Published: 30 September 2025
(This article belongs to the Section Green Sustainable Science and Technology)

Abstract

The paper finds optimal power flows and optimal placement of wind power plants (WPPs), static var compensators (SVCs), and thyristor-controlled series capacitors (TCSCs) in the IEEE 30-bus transmission power network by applying three high-performance algorithms, such as the equilibrium optimizer (EO), the Coot optimization algorithm (COOT), and the marine predators algorithm (MPSA). The three algorithms are run for the system without any added electric components and with three single objectives, including active power losses, total fuel cost, and total voltage deviation, for comparison with other previous algorithms. The three algorithms can reach better results than many algorithms and suffer worse results than a few algorithms. EO is more effective than MPSA and COOT in all cases. For simulation cases with SVCs, TCSCs, and WPPs, the losses are significantly reduced compared to the base case. The power loss of the base case is 3.066 MW, and the best loss is 2.869 MW for two cases with two SVCs and one TCSC. When applying the obtained solution and optimizing the placement of one, two, and three WPPs, the power loss is, respectively, 2.053, 1.512, and 1.112 MW. By optimizing two SVCs, one TCSC, and WPPs simultaneously, the power loss is, respectively, 2.041, 1.508, and 1.093 MW for one, two, and three WPPs. So, the optimal placement of TCSCs, SVCs, and WPPs can result in high benefits for power systems.

1. Introduction

Nowadays, placing renewable power plants (RPPs) in transmission and distribution power networks, or at loads, is popular, and it can lead to lower power loss, lower cost, shorter time for building or changing lines, and reduced voltage drop. However, the problem of optimal power flow (OPF) is complicated by the difficulty derived from the uncertainty of renewable power sources. In the study, voltage and power loss of transmission power networks are further investigated by using the Flexible Alternating Current Transmission System (FACTS) and RPPs. Two types of FACTS, including thyristor-controlled series compensator (TCSC) [1] and static var compensator (SVC) [2], are combined to control transmission lines’ parameters and loads’ reactive power. The RPPs can be placed at generator buses to augment the capacity of the existing power plants. The RPPs can even be placed on load buses to inject power into the loads. The application can reduce the current value of transmission power lines, and voltage drops and power loss are reduced as a result.
In solving the classical OPF problems, authors mainly focused on the economic, technical, and environmental objectives, such as fossil fuel costs (FFCs) of thermal power plants (TPPs) [3], power loss [4], voltage drop [5], and polluted emission [6]. After renewable energies became a potential solution to compensate for power, especially during sunny seasons when hydropower plants lack water and power systems decrease supply, RPPs are supposed to be a major power source for the OPF problems [6]. The TPPs were replaced with the RPPs, and power flows were recomputed to minimize the FFCs and power loss [7]. Many meta-heuristic algorithms have been developed and widely used for dealing with OPF problems with large search spaces of solutions and high complexity. Three improved versions of the genetic algorithm (GA) were proposed, including decoupled quadratic load flow technique-based GA (EGA-DQLF) [8], incremental power flow technique-based GA (IGA) [9], and boundary method-based IGA (BIGA) [10]. Among the three improved GAs, EGA-DQLF could reach the same total cost and suffer a smaller power loss than the others. Five modified versions of particle swarm optimization (PSO) were, respectively, proposed for the OPF problem, such as weight factor-based particle swarm optimization (WF-PSO) [11], chaos queues-based particle swarm optimization (CQS-PSO) [12], ant direction-based particle swarm optimization (AD-PSO) [13], velocity direction and constriction factor-based PSO (VC-PSO) [14], and graphical processing units-based PSO (GPUS-PSO) [15]. AD-PSO was better than WF-PSO and GPUS-PSO for the IEEE 30-bus system with nine capacitor banks. VC-PSO was better for a two-capacitor bank-based IEEE 30-bus system than the other remaining algorithms. Two conventional differential evolution (DE) algorithms were implemented by using different settings of mutation factors, population size, and iteration numbers, called CDE1 [16] and CDE2 [17]. When set to different control parameters, the two DE algorithms reached different total cost values. In addition to the very conventional algorithms, other metaheuristic algorithms were also employed for the OPF problem, such as original biogeography-based optimization (BBO) [18], adaptive biogeography-based optimization (ABBO) [19], teaching–learning-based optimization algorithm (TLBO) [20], group search optimization algorithm (GSO) and adaptive GSO (AGSO) [21], honeybees mating-inspired firefly algorithm (HBMFA) [22], mathematical programming (MP) [23], gravitational search algorithm (GSA) [24], artificial bee colony algorithm (ABCA) [25], improved imperialist competitive algorithm (IICA) [26], modified electromagnetism-like mechanism algorithm (MEMLMA) [27], improved colliding bodies optimization algorithm (ICBOA) [28], gray wolf optimizer (GWO) [29], moth swarm algorithm (MSA) [30], original social spider optimization algorithm (OSSOA) [31] and modified version of SSOA (MSSOA) [31], original RAO algorithms [32], improved RAO-II algorithm [32], Levy distribution and fitness balance-based artificial hummingbird algorithm (LD-FB-AHA) [33], original artificial hummingbird algorithm (OAHA) [33], fitness balance-based stochastic fractal search optimization algorithm (FB-SFSOA) [33], antlion optimizer (ALO) [33], whale optimization algorithm (WOA) [33], sine-cosine function algorithm (SCFA) [33], and fitness balance and learning-based artificial bee colony optimization algorithm (FBL-ABCOA) [33]. These algorithms were applied separately in each study, so the settings of the control parameters were not the same, leading to different results. ABBO was proven to be more effective than its original in the same study [19]; however, it found a higher cost and loss than the original BBO in [18]. MEMLMA [27] and ICBOA [28] were indicated to be more effective than other popular algorithms, but they were not compared to their original algorithms. MSSOA was proven to be more effective than its original algorithm, OSSOA, and three other improved versions in [31]. The improved RAO-II algorithm was proven to be more effective than three other RAO algorithms. Among the seven algorithms in the study [33], LD-FB-AHA was the most effective algorithm, and the conclusion was stated that the combination of the Levy distribution and fitness function balance was very effective.
One practical solution to these challenges is utilizing the FACTS devices in the power system, especially in the transmission power network. The presence of these FACTS devices in transmission networks has brought many benefits, such as improving the power transfer capability [34], enhancing the system stability overall [35], partly reducing power losses [36], improving the voltage profile at buses [37], and also substantially increasing reliability [38]. There are five members of the FACTS device family, including SVC [39,40], the static compensator (STATCOM) [41], the static synchronous series compensator (SSSC) [42], the unified power flow controller (UPFC) [43], and TCSC [44].
Recently, renewable energies have also been integrated into the power systems where the FACTS devices were working. RPPs and SVC were combined to reach economic and technical indicators such as power loss, energy costs, and voltage profiles of distribution power networks [45] and transmission power grids [46]. STATCOM and renewable energies were applied for distribution power grids [47] and transmission power grids [48]. Transmission power grids were equipped with the RPPs and TCSC [49], RPPs and SSSC [50], and RPPs and UPFC [51]. In general, all of the mentioned studies have tried the combination of FACTS devices and renewable energies to control power flows on transmission or distribution branches and inject active power into grids. The results indicated that fuel costs from conventional power plants, power losses on the branches, and voltage profiles were significantly improved.
In the paper, TCSCs, SVCs, and RPPs are installed in a transmission power network with 30 nodes. Eight study cases are implemented to investigate their impacts on active power loss and voltage improvement. The Coot optimization algorithm (COOT) [52], the equilibrium optimizer (EO) [53], and the marine predators algorithm (MPSA) [54], with the support from the Matpower optimization tool [55], are applied to find the location and size of TCSCs, SVCs, and RPPs, and other parameters of the transmission power network. The study’s novelties are as follows:
  • Implement seven simulation cases with different assumptions regarding the existence of FACTS devices and RPPs: the separate and simultaneous use of SVC, TCSC, and RPPs is tried in seven cases.
  • Propose different combinations of FACTS and wind power plants: three cases, including one, two, and three wind power plants, are integrated with different types of FACTS.
After running the algorithms for the study cases, the major contributions are summarized as follows:
  • Provide solutions with the same or better total fuel costs, power loss, and voltage deviation than previous studies.
  • Find the best study case with the smallest total power loss. The best study case indicates the best plan for transmission power networks, which is the simultaneous installation of TCSC, FACTS, and renewable power plants.
  • Indicate the best solution for selecting the most suitable buses and the rated parameters of TCSC, SVC, and wind power plants.
  • The highest active power loss reduction and the most stable voltage profile are obtained when installing the simultaneous TCSC, SVC, and wind power plants. In addition, the rated power of the SVC and wind power plants is minimal.

2. Problem Description

2.1. Objective Function

The active power losses and fuel costs of TPPs are significant in transmission power grids because they have many long transmission lines with high operating currents and loads with high active power demands. As a result, reducing the total power losses and the total fuel cost is very necessary for transmission power grids. In addition, the voltage quality enhancement is an important target when operating the power systems stably and effectively. Three objective functions are considered, including (1) reducing the total active power losses, (2) reducing the total fuel cost of TPPs, and (3) enhancing the voltage profile via minimizing the total voltage deviation. The objective functions are expressed as follows:
  • Reduction in power losses: Transmission lines connecting each pair of buses have active power losses due to their own parameters. So, the total losses are minimized as follows [8]:
P = x = 1   N b u s y = 1 ;   y x N b u s G x y . U x 2 + U y 2 2 . U x . U y . c o s φ x y
where P is the total loss; G x y is the line xy’s conductance; φ x y is the phase angle deviation between buses x and y; U x and U y are the voltage of buses x and y; and N b u s is the number of buses.
2.
Reduction in total fuel costs: TPPs working on buses in power systems are using fossil fuels, which cost a lot of money. So, reducing the total cost is very important. The study considers three fuel cost types, including the following: Case (1) using single fuel and neglecting valve point effects (VPES) of TPPs [9]; Case (2) using single fuel and considering VPES of TPPs [28]; and Case (3) using three fuels and neglecting VPES of TPPs [31]. In early 2025, multiple fuel-based thermal generation units were reapplied [56]. In practice, the Siemens SGT6-5000F gas turbine can use many types of fuels, such as natural gas, ethane, syngas, propane, distillates, crude oils, biodiesel, kerosene, alcohols, and so on [57].
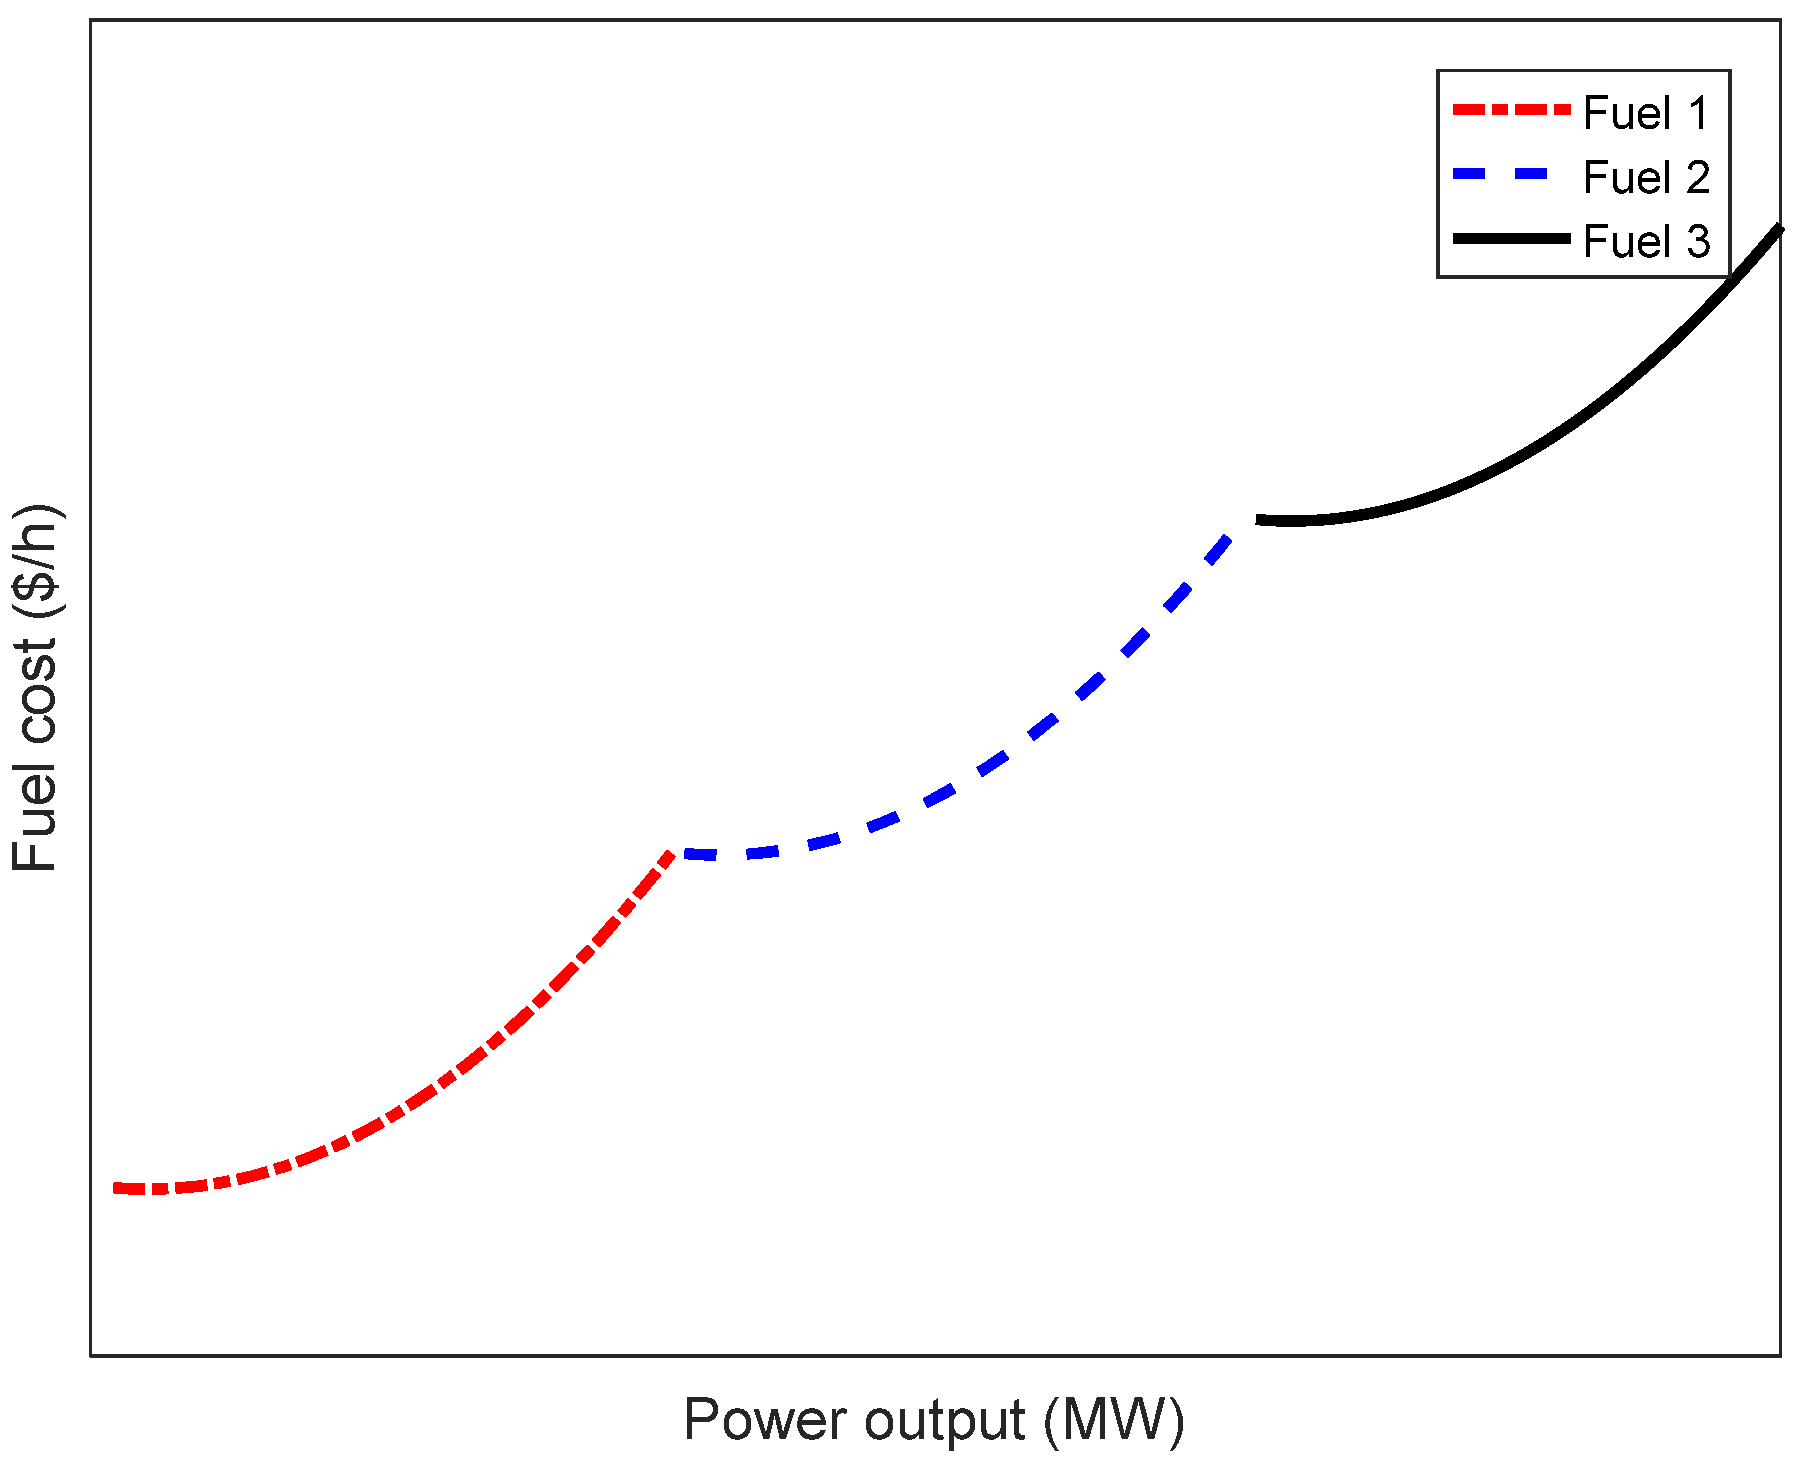
The cost functions of single fuel are plotted in Figure 1, and those of multiple fuels are shown in Figure 2. In mathematics, the fuel costs for the three cases are expressed as follows:
C o s t F u e l = y = 1 N o G α y 1 . P G y 2 + α y 2 . P G y + α y 0 ,       F o r   C a s e   1 y = 1 N o G α y 1 . P G y 2 + α y 2 . P G y + α y 3 . s i n ( α y 4 . ( P G y L o w P G y ) ,     F o r   C a s e   2 y = 1 N o G α y 1 , k . P G y 2 + α y 2 , k . P G y + α y 0 , k ,       F o r   C a s e   3
C o s t F u e l and C o s t E L o s s are the fuel cost of ThPs and energy loss cost of power grids; C o s t F A C T S   and C o s t W P P are the total cost of added FACTS and WPs; N o G is the number of ThPs; P G y and P G y L o w are the working and minimum active powers of the yth ThP; α y 4 ,     α y 3 ,     α y 2 ,     α y 1 , and α y 0 are coefficients in fuel function of the yth ThP; α y 2 , k ,     α y 1 , k , and α y 0 , k are coefficients in the fuel function of the yth ThP when using the kth fossil fuels; and E L o s s and P r i c e l o s s are the energy loss in MWh and the price of energy loss in $/MWh.
3.
Reduction in total voltage deviation: The voltage standard value, or the expected voltage, is assumed to be 1 Pu in power systems. The deviation of working voltage values and the expected value is called the voltage fluctuation. When the deviation is reduced at most, the voltage of the power systems can be stable. The target is mathematically expressed as follows:
V = x = 1   N b u s 1 U x

2.2. The Model of TCSC and SVC

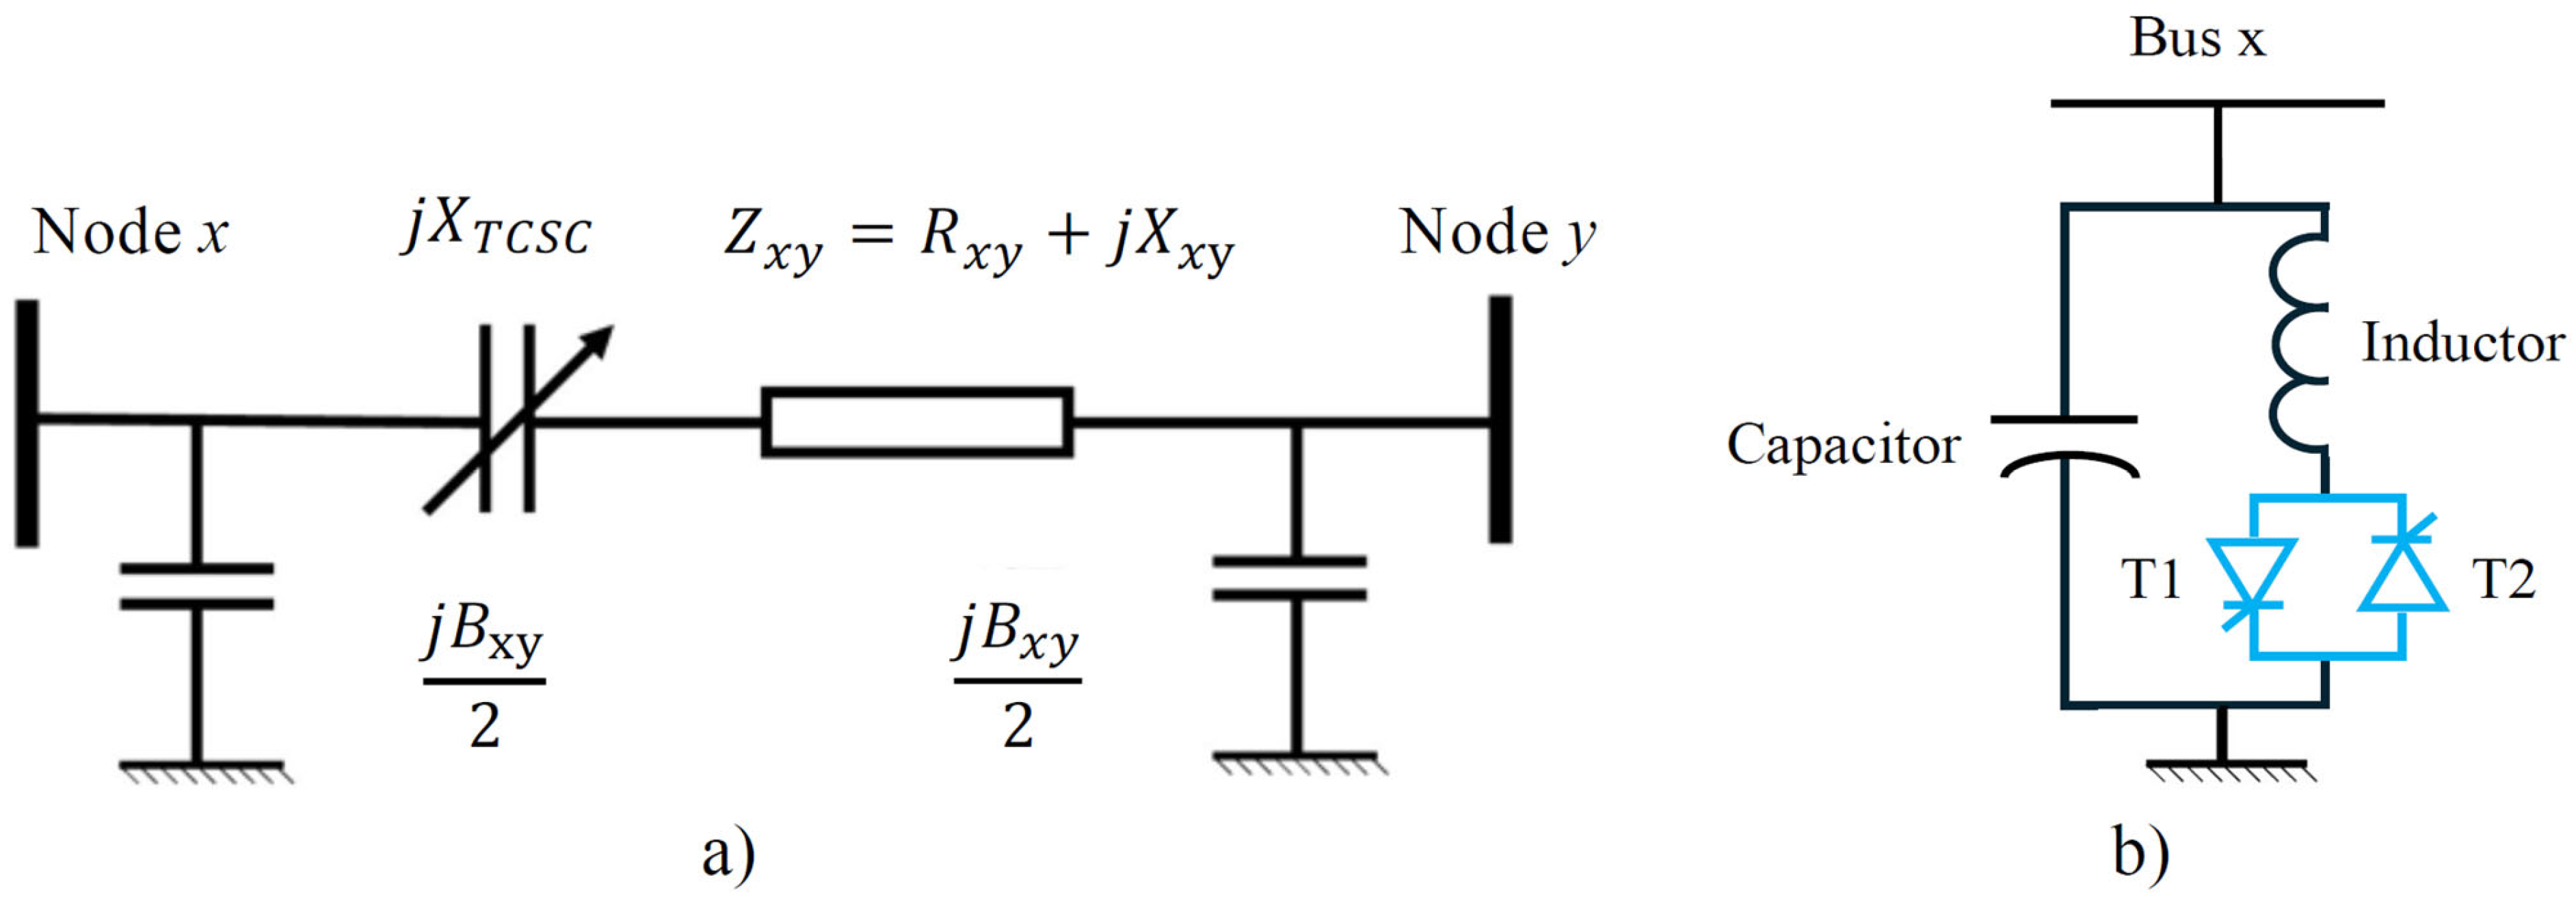
TCSC and SVC installed on a transmission branch and at a node are plotted in Figure 3. TCSC’s reactance is given in Equation (4) [58], and the reactive power of SVC is determined by using Equation (5) [2]:
X x y T C S C = X x y X T C S C
Q S V C x = B S V C x . U x 2
where X T C S C , X x y , and X x y T C S C are the reactance of TCSC and the reactance of the line xy before and after installing TCSC; T S x y and R x y are the line xy’s susceptance and resistance; Q S V C x   is the reactive power of the SVC at bus x; and B S V C x is the SVC susceptance at bus x.

2.3. Power Balance Constraint

The constraint is applied for both active and reactive power, as presented in the two following expressions [59]:
P s x + P w x   P L o a d x   =   U x y = 1 N b u s U y . G x y T C S C . c o s φ x y   +   B x y T C S C . s i n φ x y  
  Q s x   +   Q w x   + Q S V C x   Q L o a d x = U x y = 1 N N o U y . G x y T C S C . c o s φ x y B x y T C S C . s i n φ x y  
where P s x and Q s x are the active and reactive powers of the TPP at node x;   P w x   and   Q w x   are the active and reactive powers of the RPP at node x; G x y T C S C and B x y T C S C are the line xy conductance and susceptance after installing TCSC [60]; and P L o a d x and Q L o a d x are the active and reactive power demands of the load at node x.

2.4. Inequality Constraints

Generation limits: The generation of TPPs, RPPs, and SVCs is constrained as shown in the following models [58]:
P s x L B   P s x   P s x U B
Q s x L B   Q s x   Q s x U B
P w x L B   P w x   P w x U B
Q w x L B   Q w x   Q w x U B
Q S V C L B   Q S V C x   Q S V C U B
where P s x L B and P s x U B are the lower and upper active power bounds of the ith TPP; Q s x L B and Q s x U B are the lower and upper reactive power bounds of the ith TPP; P w x L B and P w x U B are the lower and upper active power bounds of the wind turbine at the bus x; and Q w x L B and Q w x U B are the lower and upper reactive power bounds of the wind turbine at the bus x; and Q S V C L B and Q S V C U B are the lower and upper reactive power bounds of the SVC connected at the bus x.
Voltage limits: To ensure the normal operation of thermal generators as well as other electrical equipment connected to the grid, the voltage magnitudes of generators and other components at the xth bus must vary in the allowed ranges as follows [61]:
U x L B U x   U x U B ;   x = 1 , ,   N b u s
where U x L B   and   U x U B are the lower and upper voltage bounds at the bus x.
Tap changer limits: Tap settings are also one of the important parameters that must be set properly to ensure that the voltage and the secondary winding of the transformers reach legal values. However, the tap settings are varied in the preset values as follows [62]:
T a p L B   T a p p     T a p U B   ;   p = 1 , ,   N T r f
where   T a p p   is the tap changer of the pth transformer; T a p L B and   T a p U B are the lower and upper tap changer bounds; and N T r f is the number of transformers.
Transmission branch capacity limits: The apparent power through each branch must satisfy the inequality below [31]:
  S x y     S x y M a x   ;   x ,   y = 1 , ,   N b u s   a n d   x y
where   S x y   and   S x y M a x are calculated and are the maximum apparent powers through the xy transmission line.
TCSC reactance limits: The reactance of TCSC devices connected in the transmission line must be within their allowable boundaries [63]:
X T C S C L B   X T C S C   X T C S C U B   ;   f = 1 ,   ,   N F a c t
where X T C S C L B and X T C S C U B are the lower and upper reactance bounds of TCSC.

3. The Application of EO for the Placement of SVC, TCSC, and RPPs

The section presents the implementation of EO to the problem. Two major stages are expressed in detail, including initialization of the population and the updated solutions. The difference between implementing EO, COOT, and MPSA is the stage of implementing new and updated solutions. So, the implementation of COOT and MPSA to the problem is similar to that of EO.

3.1. Population Initialization

A solution comprises control variables and dependent variables that can be included in the objective functions and constraints of a problem. EO is applied to produce control variables. The problem of optimizing the placement of WPPs, SVCs, and TCSCs is that their location and parameters are control variables. In addition, in the conventional OPF problem, its control variables are the active power output of power plants excluding the slack power plant, the voltage of all power plants, and the tap value of transformers. The control variables are included in each solution S l j of the algorithms as follows:
S l j = [   P s x ,     U s x ,     P w x ,     Q w x ,     T a p p ,   Q S V C x ,   X T C S C ,     L w x ,   L S V C x ,   L T C S C   ] ; j = 1 ,   ,   P S
where L S V C x and L w x are the xth bus with the installation of SVC and wind power plant; L T C S C is the line with TCSC; and P S is the population dimension.
The control variables are substituted into the OPF program [32] to determine the following dependent variables:
D V j = [   P s s l a c k ,     Q s x ,   U x ,     S x y   ] ;   j = 1 ,   ,   P S
where D V j is the dependent variable of the jth solution; and P s s l a c k   is the active power output of the slack thermal power plant.
In the initial step, S l j is randomly produced as shown in the following mathematical function:
S l j = S l m i n + v r d . S l m a x S l m i n ;           j = 1 ,   , P S
where v r d is a random vector with terms within values 0 and 1; and S l m i n and S l m a x are the minimum and maximum control variables set.
The jth solution’s fitness function is expressed by Fitj and obtained by the following [37]:
F i t j = P j + F . x = 1 N b u s U x 2 + F . x = 1 N b u s y = 1 , y x N b u s S x y 2 + F . i = 1 N T G s Q s i 2 + F . P s s l a c k 2
where F is the penalty coefficient, which is set to 105 by experiment; choosing a high penalty factor can reach a sufficient difference between the fitness function and the objective function, aiming to help the violation of the dependent variables be clearly recognized. Optimal solutions with high values for penalty terms will be recognized and eliminated, and only solutions that do not violate the constraint will be accepted and improved for better quality. Furthermore, a high penalty factor will ensure that the mismatch between the operating parameters and their allowable limits is very low. When choosing a penalty coefficient of 105, assuming the penalty component has a value of 0.1, the mismatch between the operating values and their limits is 10−6. At this time, the power violation will be less than 10−6 MW, or the voltage violation will be less than 10−6 Pu. These violations are very small and ensure high accuracy in power and voltage. U x is the voltage violation interval at node x; S x y is the apparent power violation interval on the line connecting nodes x and y; Q s i is the reactive power violation interval of the ith thermal power plant; and P s s l a c k is the active power violation interval of the slack thermal power plants. All the violation intervals are calculated by referring to the ref. [31].

3.2. EO’s Solution-Updating Process

EO uses five candidate solutions and one old solution in the current population to update new solutions. The five candidate solutions are the first four best solutions and the mean of the first four best solutions. The first four best solutions are determined based on the fitness function, and they are, respectively, mathematically expressed by Sl1, Sl2, Sl3, and Sl4. Their mean is represented as S l m e a n and obtained by the following:
S l m e a n = ( S l 1 + S l 2 + S l 3 + S l 4 ) 4
The five candidate solutions S l 1 ,   S l 2 ,   S l 3 ,     S l 4 ,   S l m e a n are grouped in S l 5 c a n , and then EO searches new candidate solutions based on the following model:
S l j n e w = S l + F 1 . S l j S l + ( 1 F 1 ) F 1 . F 2 r d
where S l is one randomly picked solution from the five candidate solutions in S l 5 c a n ; F 1 and F 2 are increased steps obtained by the following:
F 1 = K 1 . ( e 0.05 . F 3 1 )
F 2 = K 2 . ( S l r d . S l j )
where K 1 is randomly selected as either −1 or 1, and K 2 is randomly produced within 0 and 0.5. F 3 is obtained by the following:
F 3   =   1   I t e r p r e I t e r m a x I t e r p r e I t e r m a x

3.3. Computation Process Summary

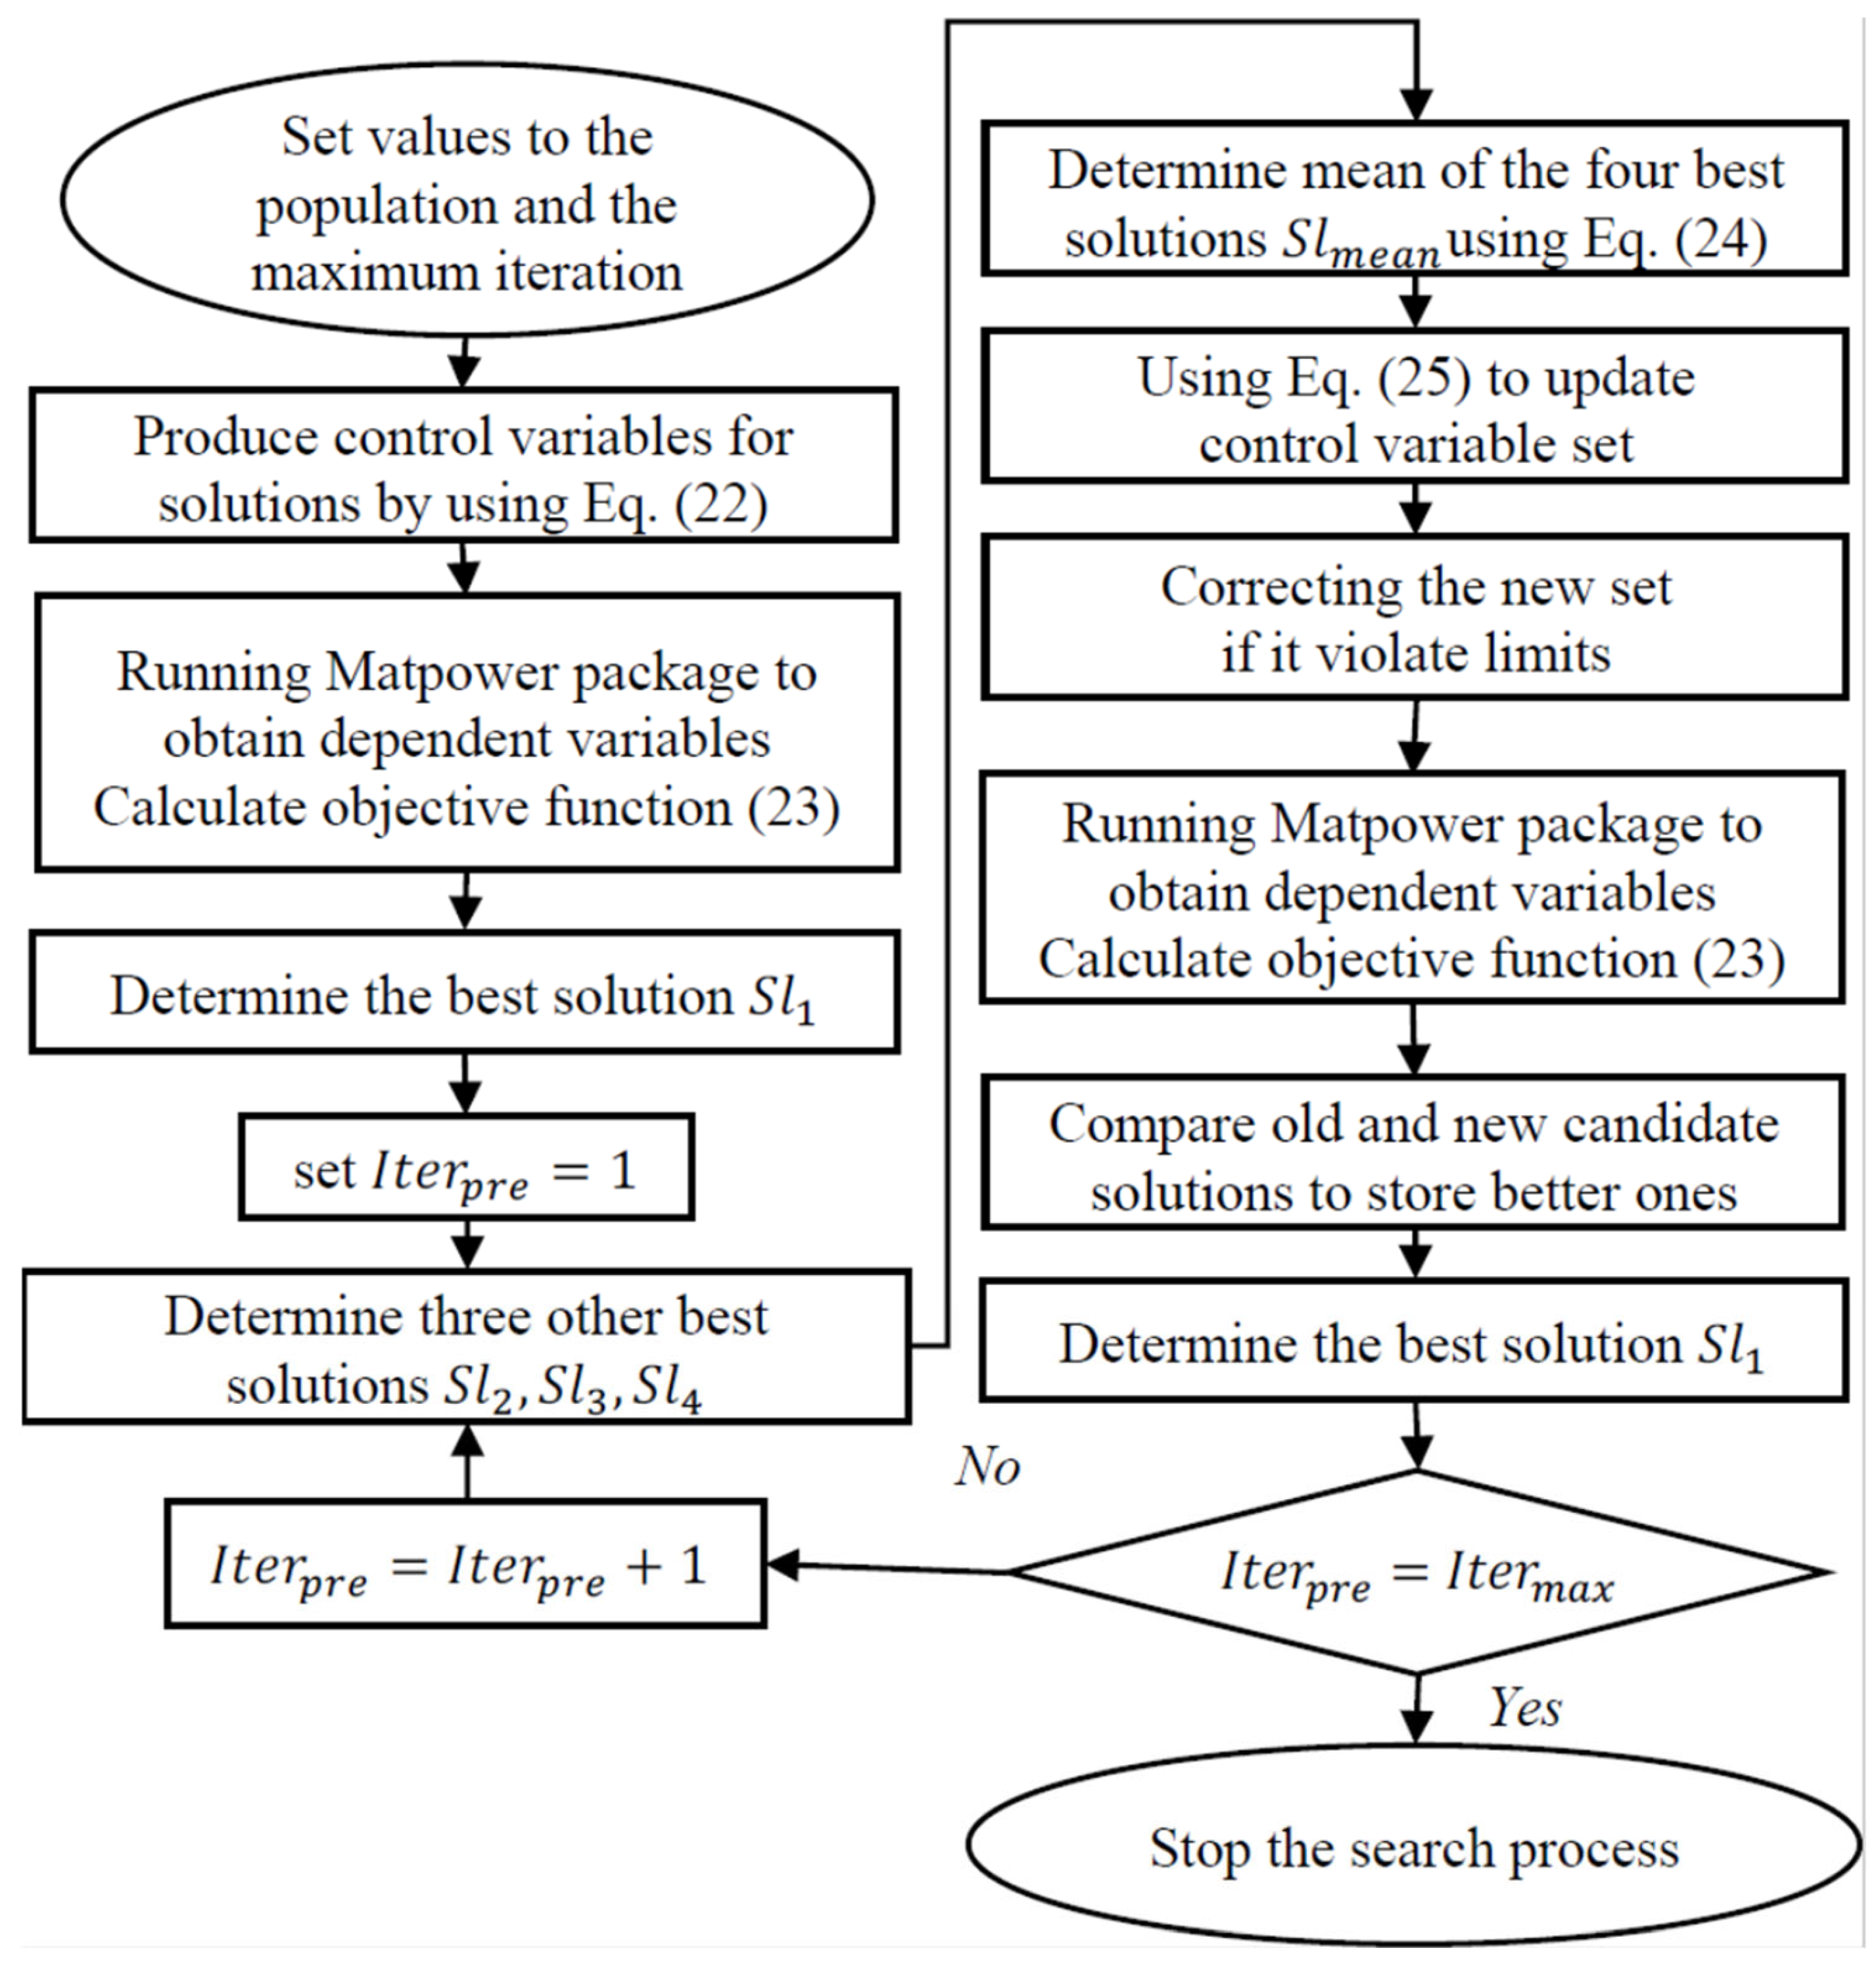
The flowchart of using EO for the problem is given in Figure 4.

4. Results and Discussions

In this section, simulation cases on the IEEE 30-node transmission power grid with and without the optimal placement of FACTS devices and wind power plants are simulated. Figure 5 shows the base system. All system data are taken from [55]. The executed algorithms are coded in the MATLAB programming language and run on a computer with a 2.5 GHz processor and 8 GB of RAM. MATLAB R2022a corresponds to version 9.12 (Simulink 10.5). In addition, the MATPOWER program was employed to find power flows on transmission lines and determine dependent variables of the transmission power grids. The MATPOWER program is written in MATLAB and is known as an open-source MATLAB-based toolbox designed for steady-state power system simulations. The search process of executed metaheuristic algorithms and the power flow program of MATPOWER were combined and coded in the same m-file of the MATLAB programming language.

4.1. Result Comparisons for Study Cases Without FACTS and Renewable Power Sources

In this section, MPSA, COOT, and EO are run on the IEEE 30-bus system considering nine shunt capacitor banks and three single-objective functions, including power losses, fuel cost, and total voltage deviation. The nine shunt capacitors are located on fixed buses, including 10, 12, 15, 17, 20, 21, 23, 24, and 29. The rated power of the capacitors is MVar. For the objective of cost reduction, single fuel and multiple fuels are considered, and valve point effects are considered for the single-fuel option. The three algorithms are run by setting 30 and 100 to the population size and the iteration number.
Table 1 shows the cost comparisons between the three applied algorithms and others. COOT, MPSA, and EO can reach the cost of USD 798.957, USD 799.123, and USD 798.912 for the single fuel without VPES; meanwhile, the best cost and worst cost of others are USD 798.675143 and USD 815.0065, obtained by GSA [24] and SCFA [33]. The three algorithms have a slightly higher cost than GSA [24]. Both COOT and EO have a better cost than the other remaining algorithms, and only MPSA has a higher cost than BBO [18], ICBOA [28], and MSSOA [31]. For the single-fuel cost with VPES, the three algorithms have a better cost than other algorithms, excluding ICBOA [28] and MSSOA [31]. For the multiple fuels, EO can reach a better cost than the other algorithms, excluding only ICBOA [28], whereas COOT and MPSA achieve a better cost than many algorithms and a worse cost than some of the algorithms, such as ICBOA [28] and MSSOA [31] for MPSA and COOT, and WF-PSO [11], BBO [18], and MSA [30] for COOT.
Table 2 compares the power loss and total voltage deviation. COOT, MPSA, and EO have better power loss than all compared algorithms, except for the comparison between COOT and MSSOA [31], which have the same power loss. EO has better total voltage deviation than others, excluding the comparison with ABBO [19], GSA [24], and MSSOA [31]. MPSA and COOT also have an effective total voltage deviation, but they are worse than the three ABBO [19], GSA [24], MSSOA [31], and others, such as BBO [18] and IICA [26].
The comparisons of total cost, power losses, and total voltage deviation indicate that the three algorithms can find better solutions than many algorithms and worse solutions than a few algorithms. EO has better performance than COOT and MPSA, and it suffers from some worse cases than a few algorithms, such as GSA [24] and MSSOA [31]. So, the three applied algorithms have a good enough performance for the study with FACTS, and the renewable and EO algorithms are more suitable than MPSA and COOT.
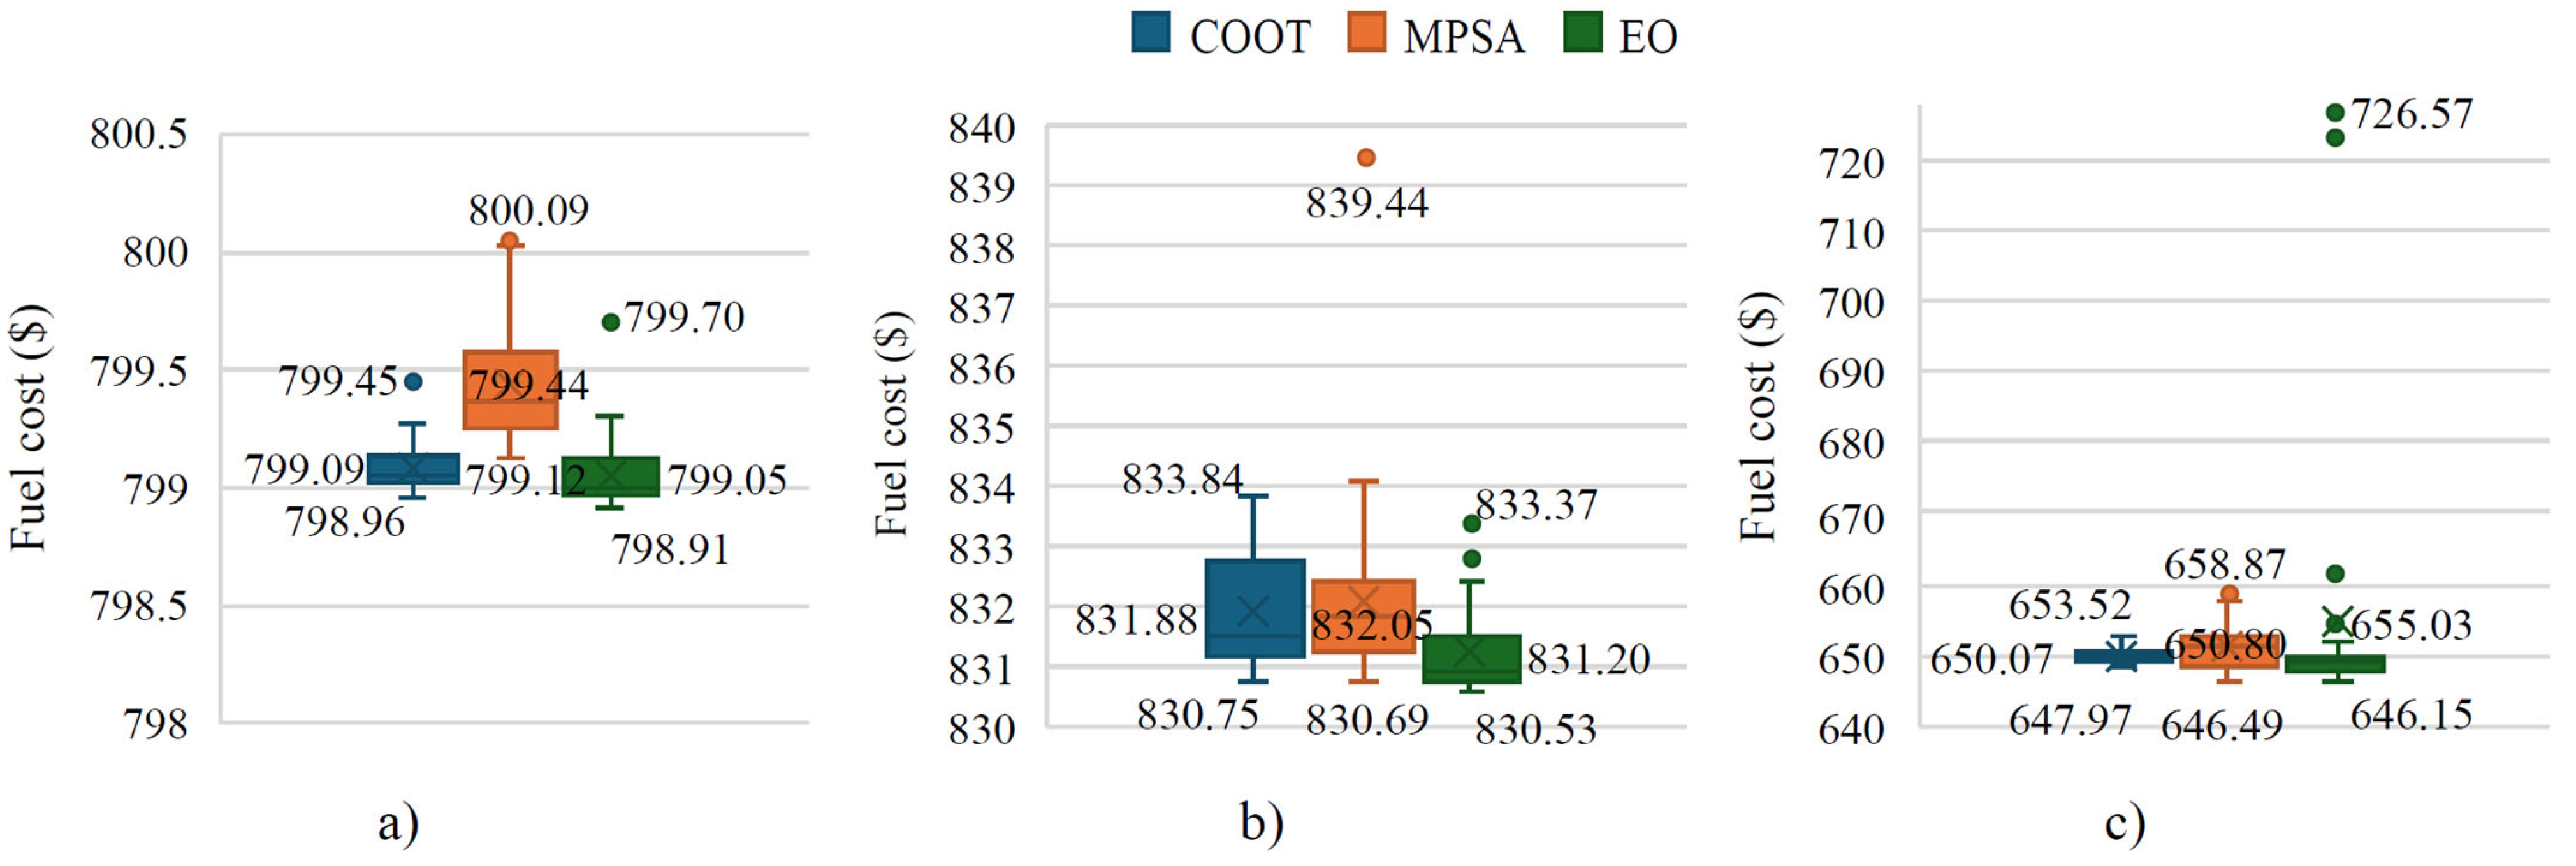
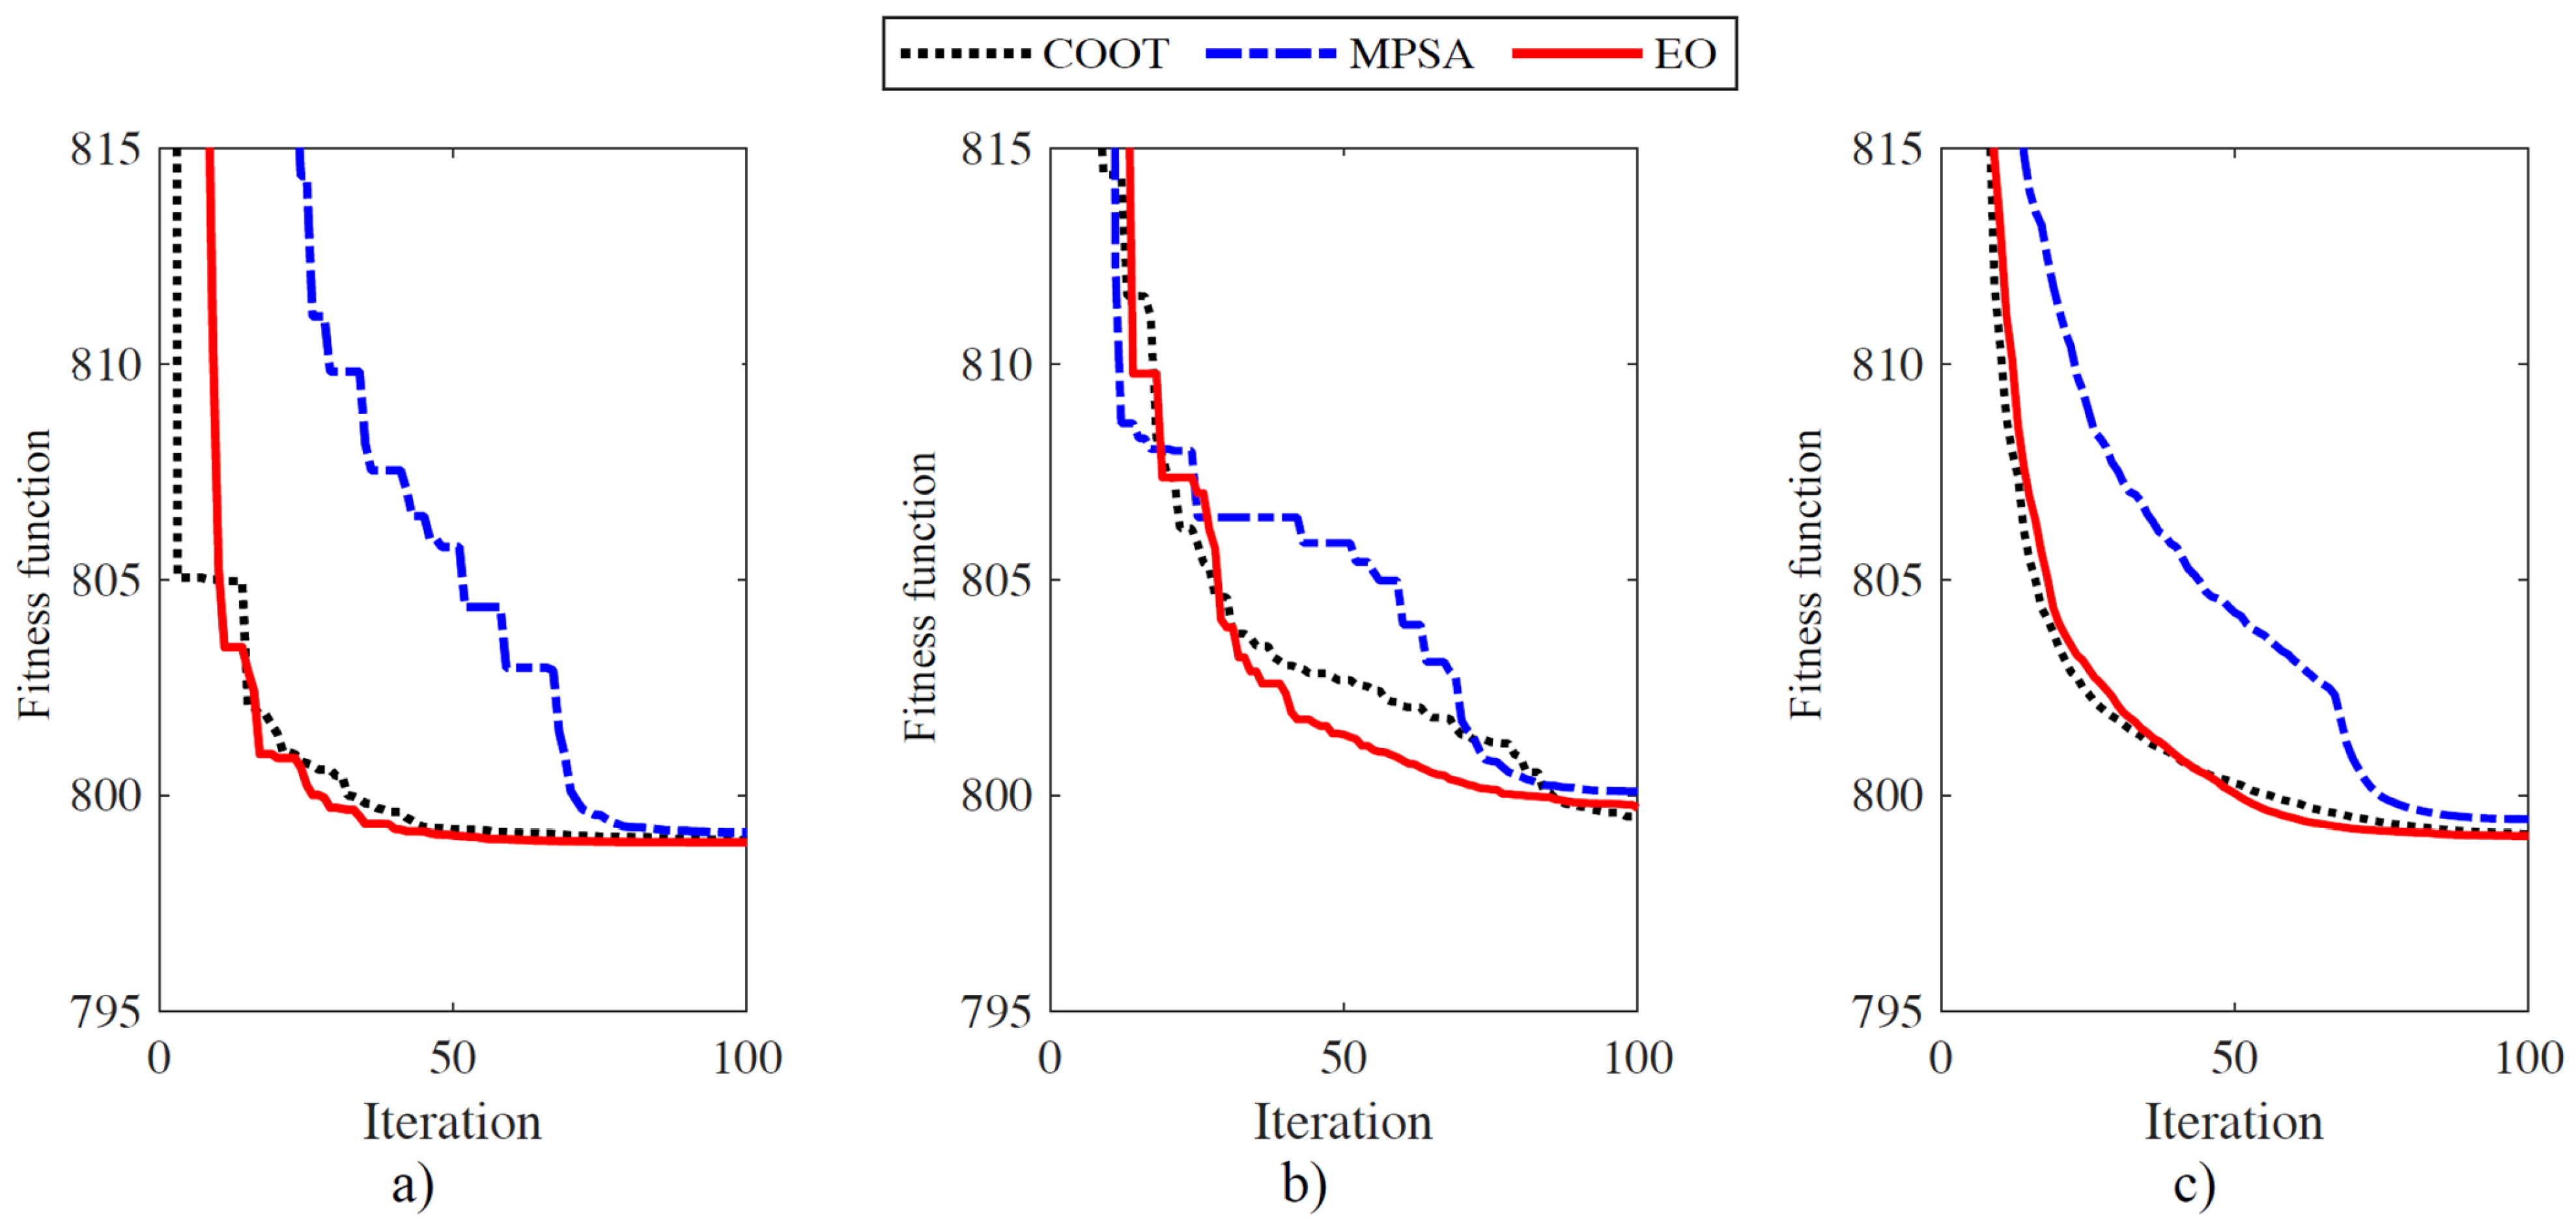
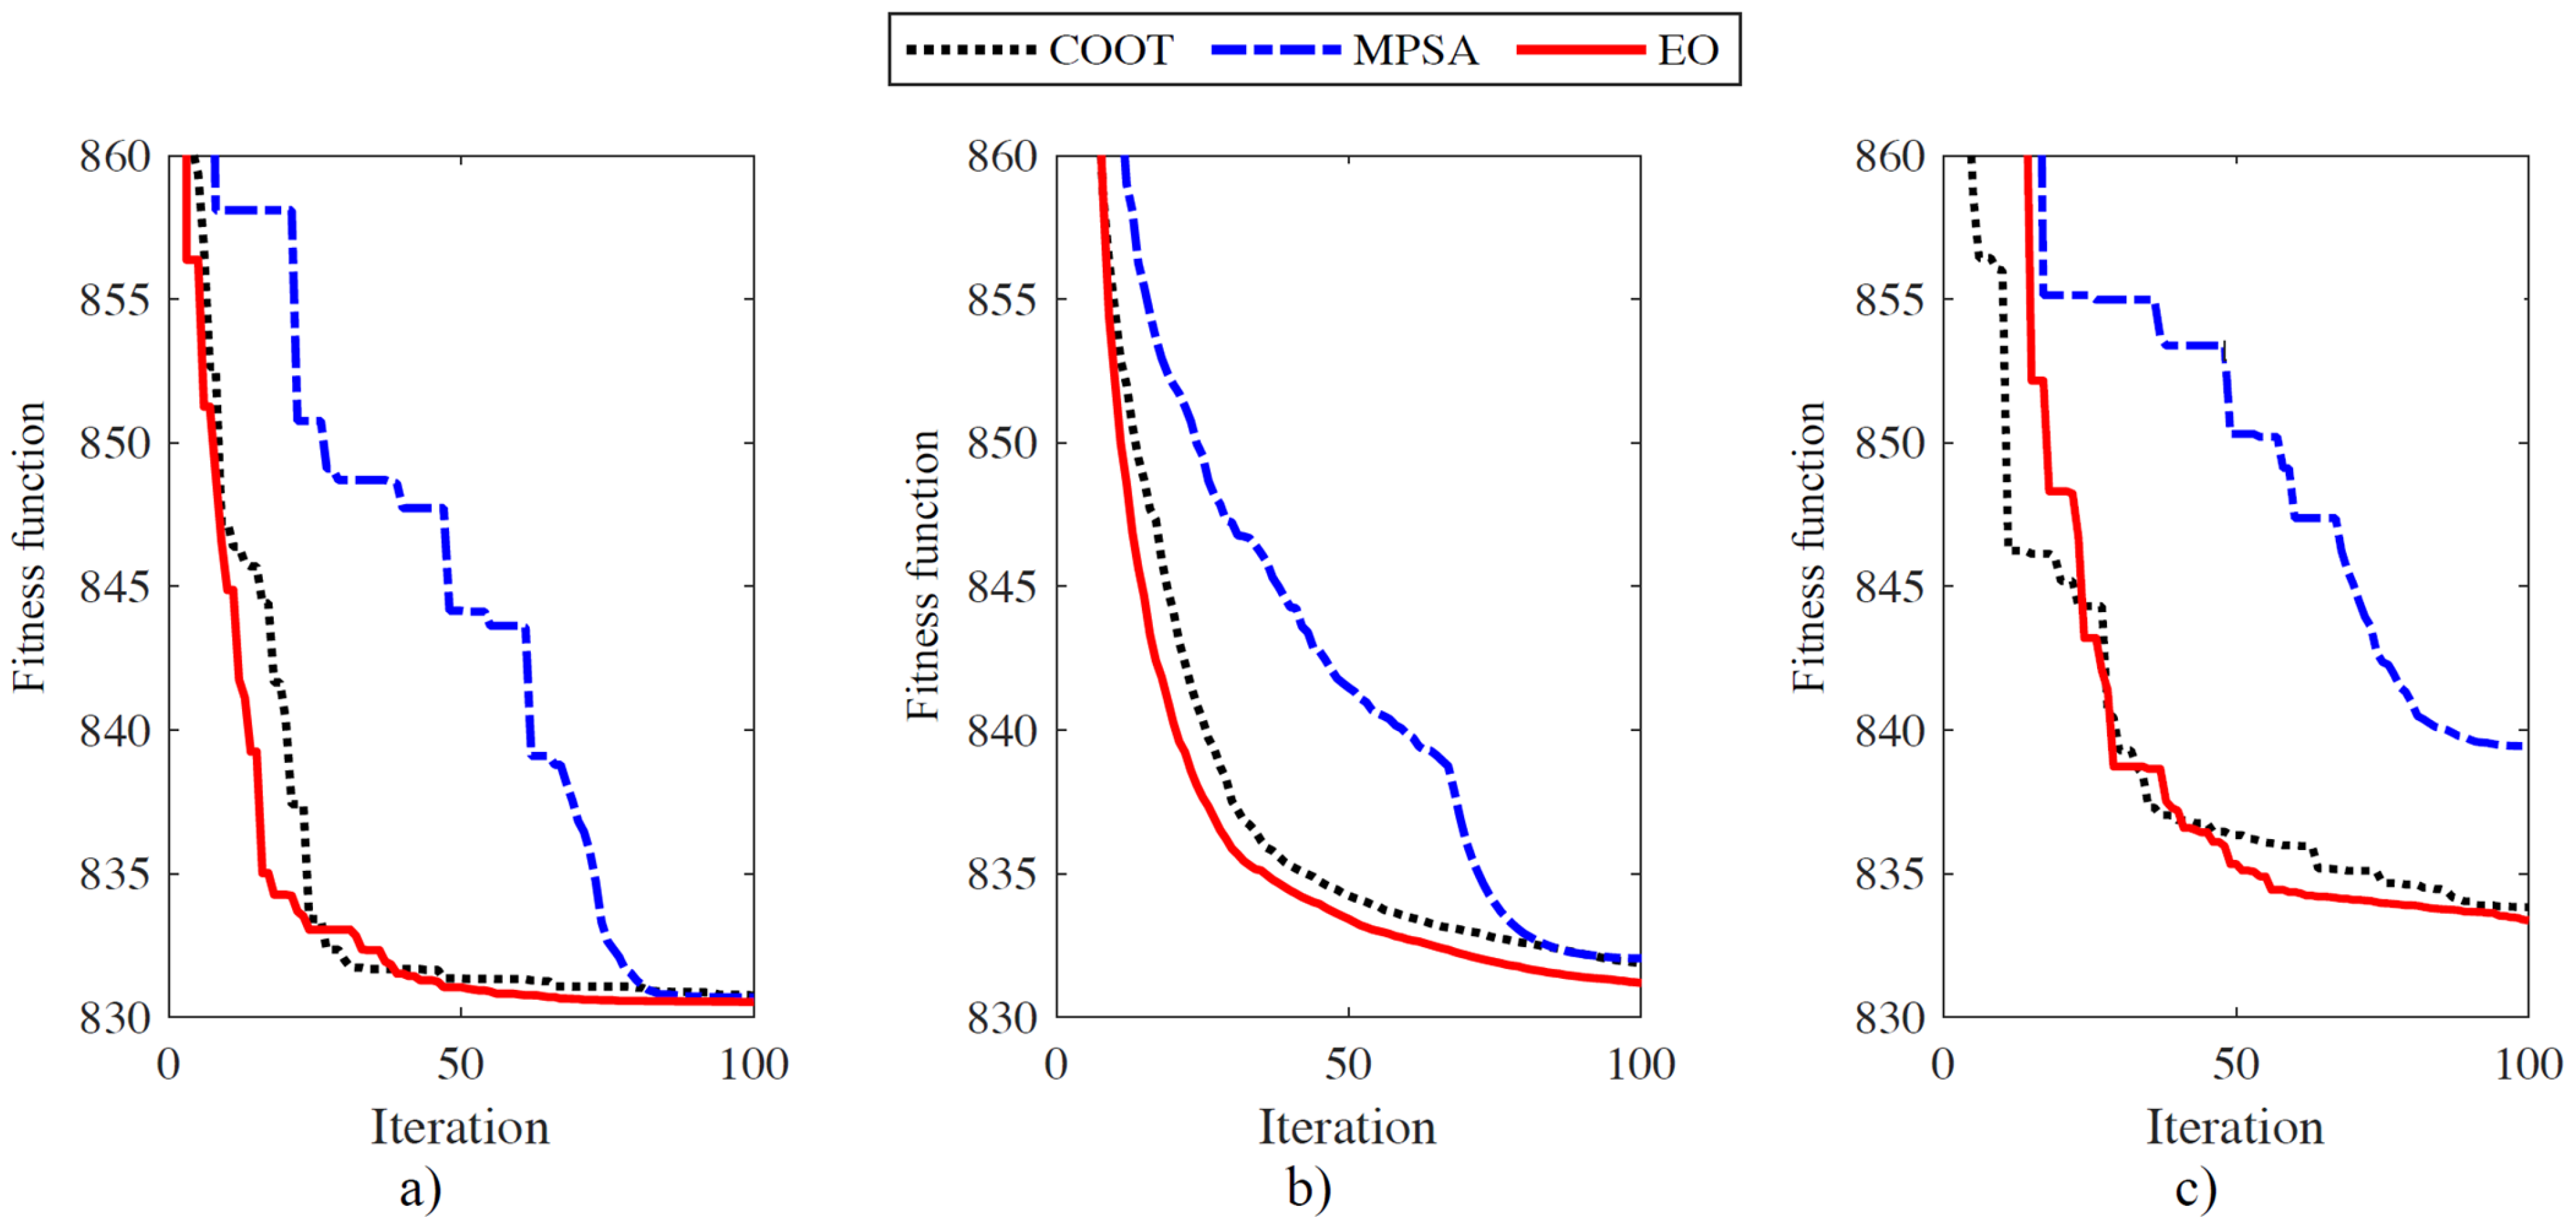
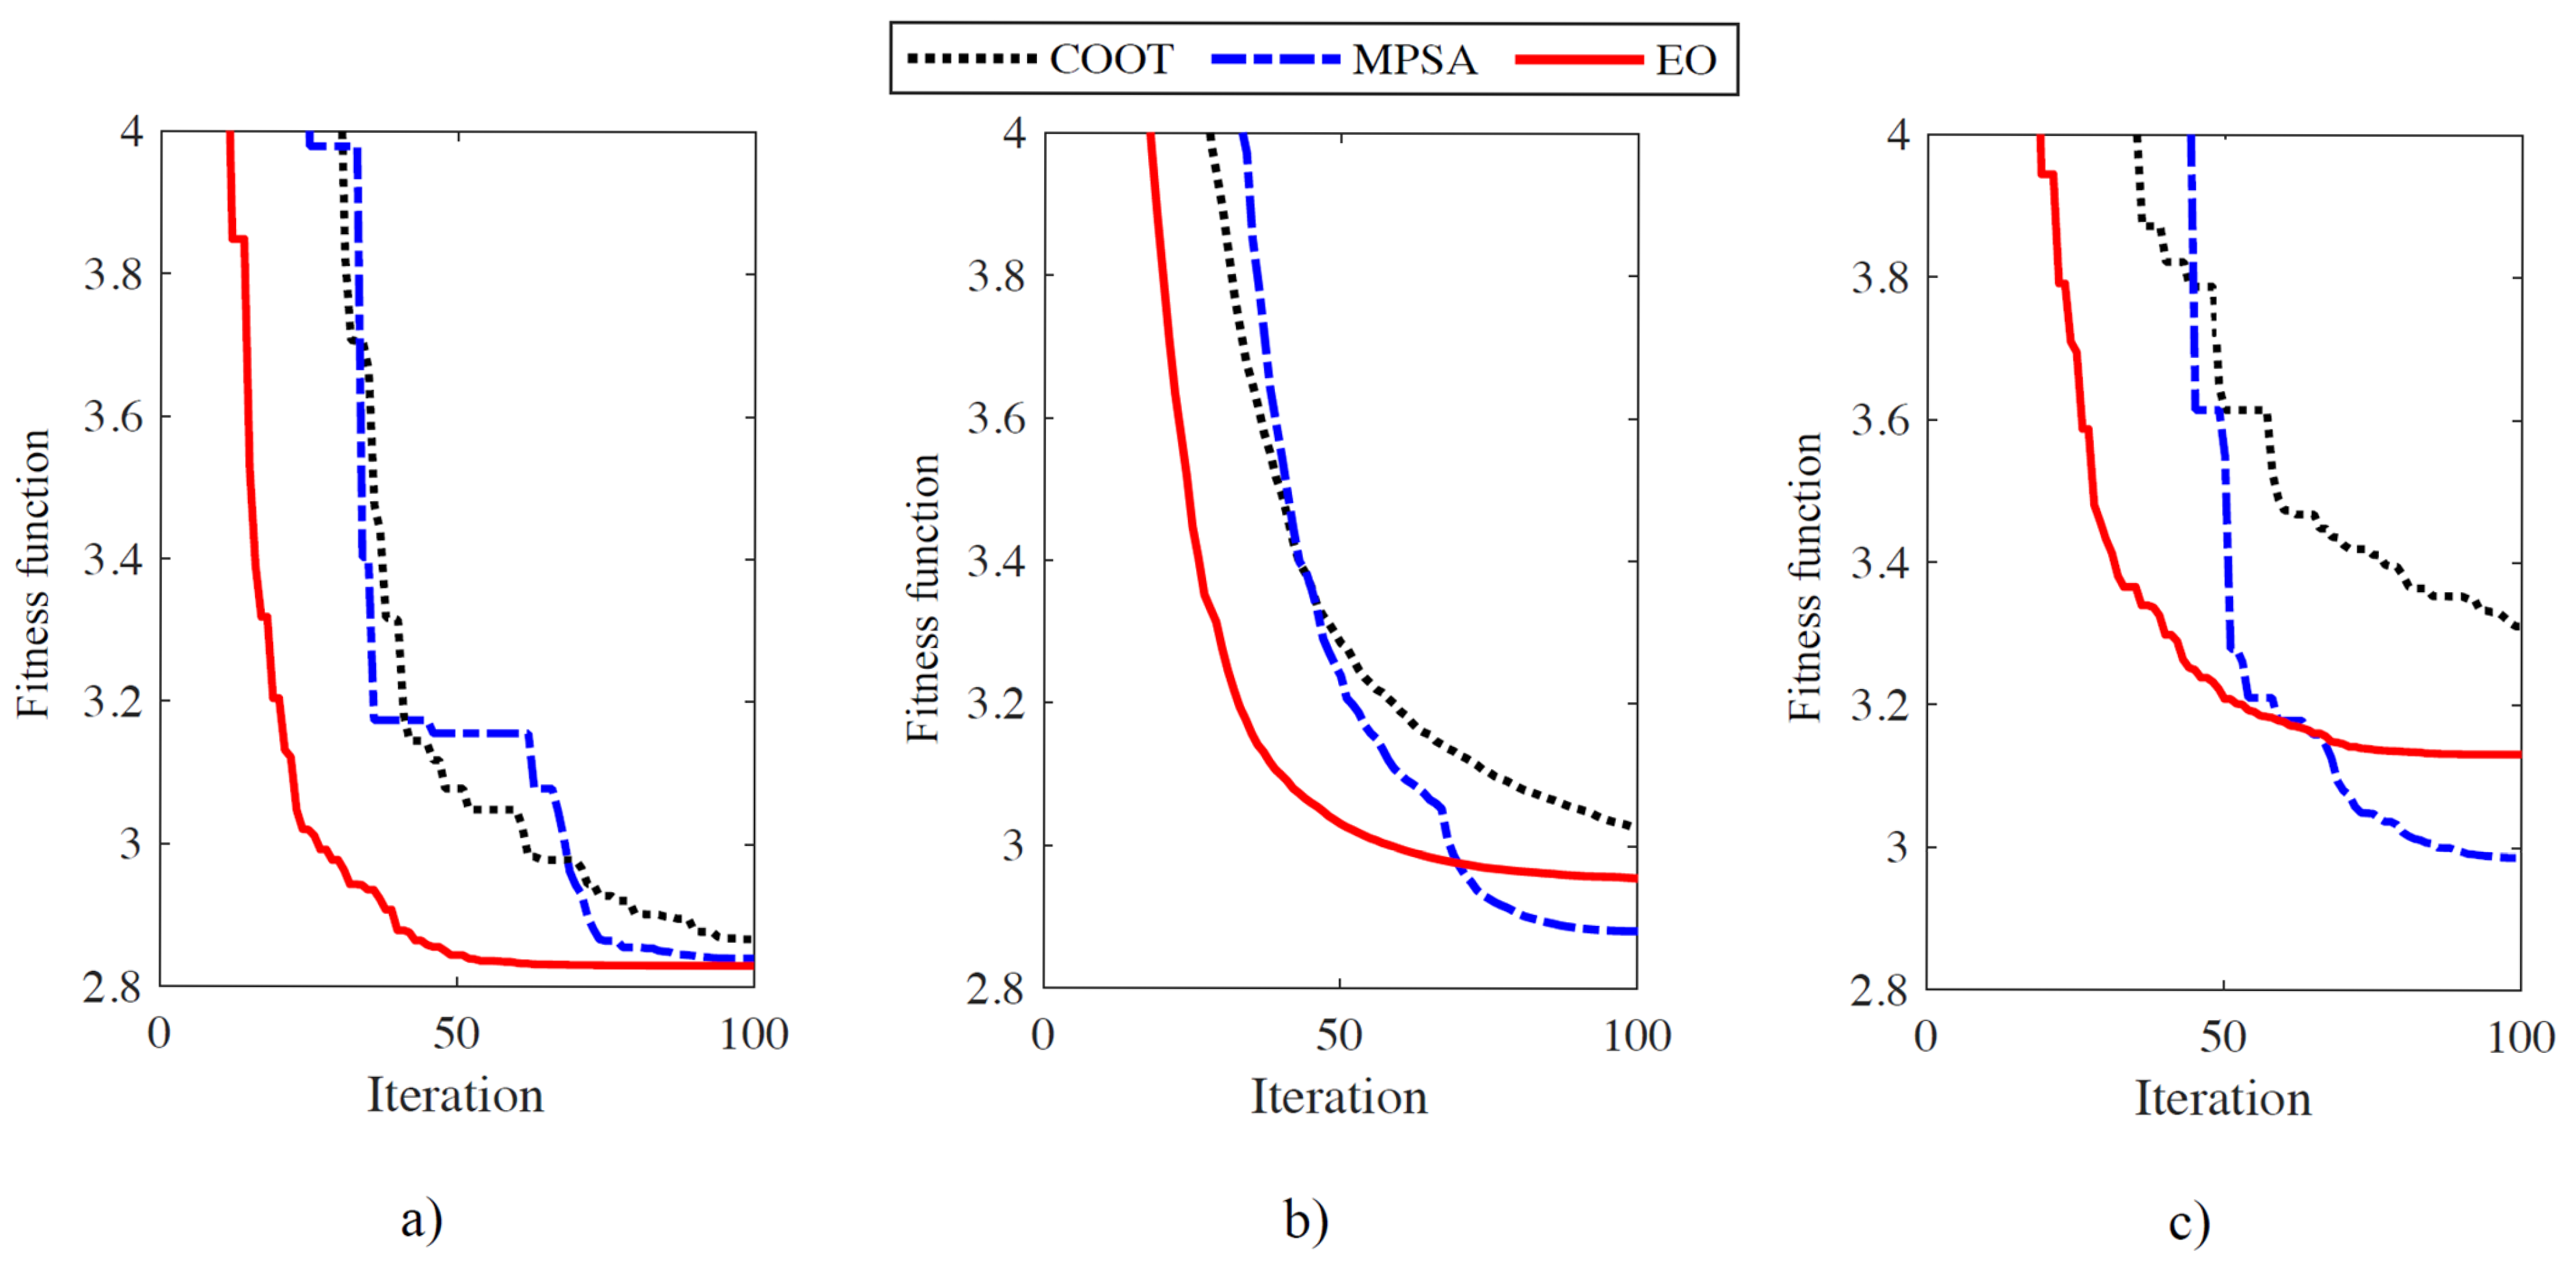
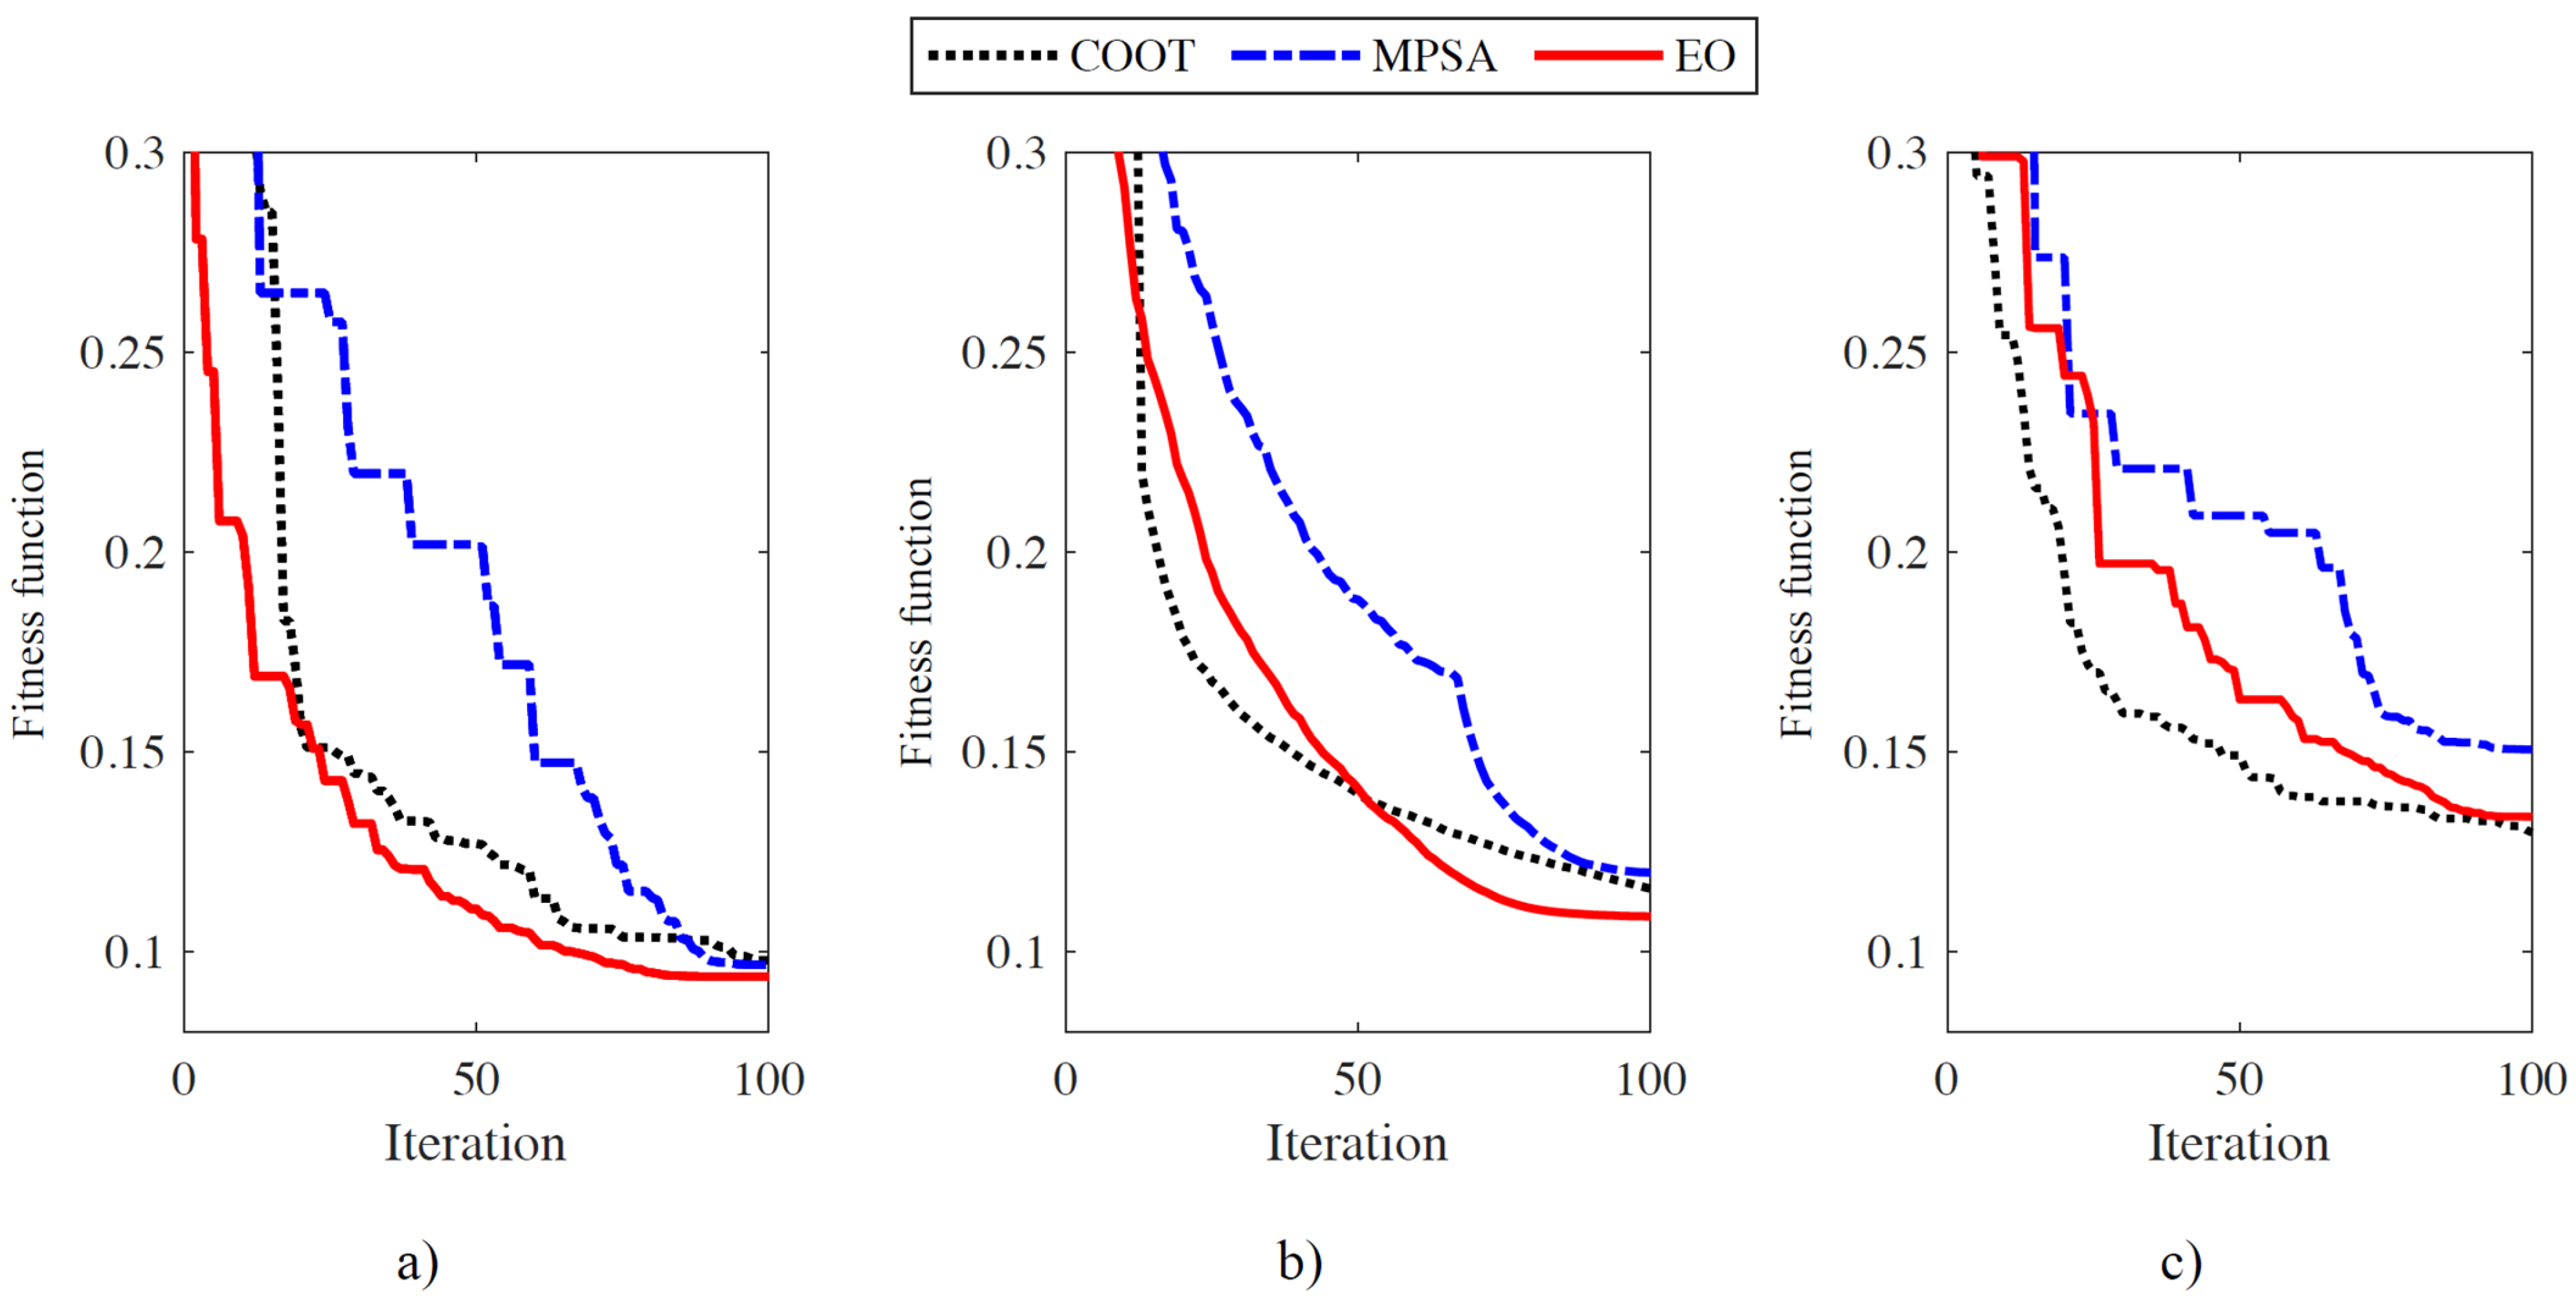
The resulting comparisons between COOT, MPSA, and EO are reported in Figure 6 and Figure 7, including the details of 50 runs for each case, and in Figure 8, Figure 9, Figure 10, Figure 11 and Figure 12, the best, mean, and worst run convergence curves are detailed. EO has the lowest value for the bottom points, indicating that EO reached the best solution among the three algorithms. Figure 6a,b show that EO is more stable than MPSA and COOT, but EO is less stable than the two algorithms in Figure 6c. According to Figure 8 and Figure 9, EO has a better mean curve than MPSA and COOT. On the contrary, EO has a worse mean curve than the algorithms in Figure 10. EO is less stable than COOT and MPSA in Figure 7, so it has worse mean curves in Figure 11 and Figure 12.
In summary, EO could reach a better solution for the best run for all the cases and a faster convergence than MPSA and COOT. However, for the mean and maximum cases of convergence curves, EO is worse and less stable than MPSA and COOT. In conclusion, EO is still the most suitable among the three applied algorithms for the simulation cases in the study.
Optimal solutions for study cases implemented in the section are given in Table A1 in Appendix A.

4.2. Study Cases with FACTS and Renewable Power Sources

In Section 4.1, three objective functions, including the power loss reduction, the fuel cost reduction, and the voltage improvement for the case of neglecting FACTS and wind energy, were used to compare COOT, MPSA, and EO with other previous algorithms. This section runs the three applied MPSA, COOT, and EO algorithms for study cases with and without FACTS and wind energy in the base IEEE 30-bus system without predetermined shunt capacitor banks. The objective was selected to be the total active power losses on all transmission lines. We considered the assumption that when the power loss is reduced, the generation of thermal power plants will be reduced, leading to a reduction in the total cost. In addition, considering the voltage constraints (13), the voltage profile satisfied the voltage standard of the power system. The details of the study cases and the parameter settings of the algorithms are presented in Table 3.
Table 4 summarizes the minimum and mean power losses from the fifty trial runs obtained by the three applied algorithms. The best values of minimum power loss and the mean power loss are highlighted in bold. The minimum loss is used to determine the effectiveness, while the mean loss is used to evaluate the stabilization of algorithms. For the base case, all three algorithms have found the same minimum power loss of 3.0664 MW. Similarly, all three algorithms found the same minimum power loss of 2.898 MW for Case 1, 2.999 MW for Case 2, and 2.869 MW for Case 3 and Case 5. For Case 4, MPSA found the best minimum power loss of 2.8797 MW, while that of COOT and EO is 2.880 and 2.881 MW. For Case 6.1, MPSA and EO can reach the best minimum loss of 2.053 MW. For Cases 6.2 and 6.3, only EO reaches the best minimum loss of 1.512 and 1.112 MW. For Case 7.1, COOT and EO can reach the best minimum loss of 2.041 MW. For Cases 7.2 and 7.3, EO reaches the best minimum loss of 1.508 and 1.093 MW. Regarding the stable search ability, MPSA can reach the best mean loss from base case to Case 5, and from Case 6.1 to Case 6.3. EO can reach the best mean loss for Cases 7.1–7.3.
To summarize the performance of algorithms for the simulation cases, the best minimum loss is replaced with the best solution, and the best mean loss and standard deviation are replaced with the best search stabilization. The evaluation is given in Table 5. For twelve specific simulation cases, EO can reach the best solutions for eleven cases and the best stabilization for three cases. Similarly, MPSA can reach the best solutions and the best stabilization for the cases, while COOT can reach the best solutions for six cases and the best stabilization for one case. Clearly, COOT is not as effective as EO and MPSA were in the tests. The performance evaluation for EO and MPSA needs careful consideration. EO reaches four more cases with the best solution than MPSA, but MPSA reaches six more cases with the best stabilization than EO. However, only EO can reach the best solutions for large study cases, including Cases 6.2–6.3 and Cases 7.1–7.3. These study cases consider all electric devices, including wind power plants, TCSC, and SVC. For simple cases, from base case to Case 5, MPSA is more stable than EO. Based on the results, MPSA is more suitable than EO and COOT for simple cases, and EO is more suitable than COOT and MPSA for complicated cases.
For the base case, all three algorithms found the same minimum power loss of 3.0664 MW. Similarly, all three algorithms found the same minimum power loss of 2.8976 MW for Case 1, 2.9989 MW for Case 2, and 2.8692 MW for Case 3 and Case 5. MPSA found the best minimum power loss of 2.8797 MW for Case 4. For Cases 6 and 7, EO shows its best performance once its minimum power losses are smaller than or equal to those of COOT and MPSA. However, the deviation of minimum power losses between EO and COOT is very tiny, approximately zero. EO reaches a smaller power loss than MPSA by 0.0011 MW for Case 6.2, 0.0053 MW for Case 6.3, 0.0002 MW for Case 7.1, 0.0027 MW for Case 7.2, and 0.0153 MW for Case 7.3. COOT reaches the highest minimum power loss among the three algorithms.
Regarding the stability of the solution search, MPSA shows more advantages than others since its mean power loss is smaller than that of COOT and EO for most cases. The simulation results from the algorithms indicate that the obtained solutions are valid and of high quality. These algorithms are outstanding performance optimization tools among many metaheuristic algorithms.

4.3. The Impact of FACTS and RPPs on the Power Loss

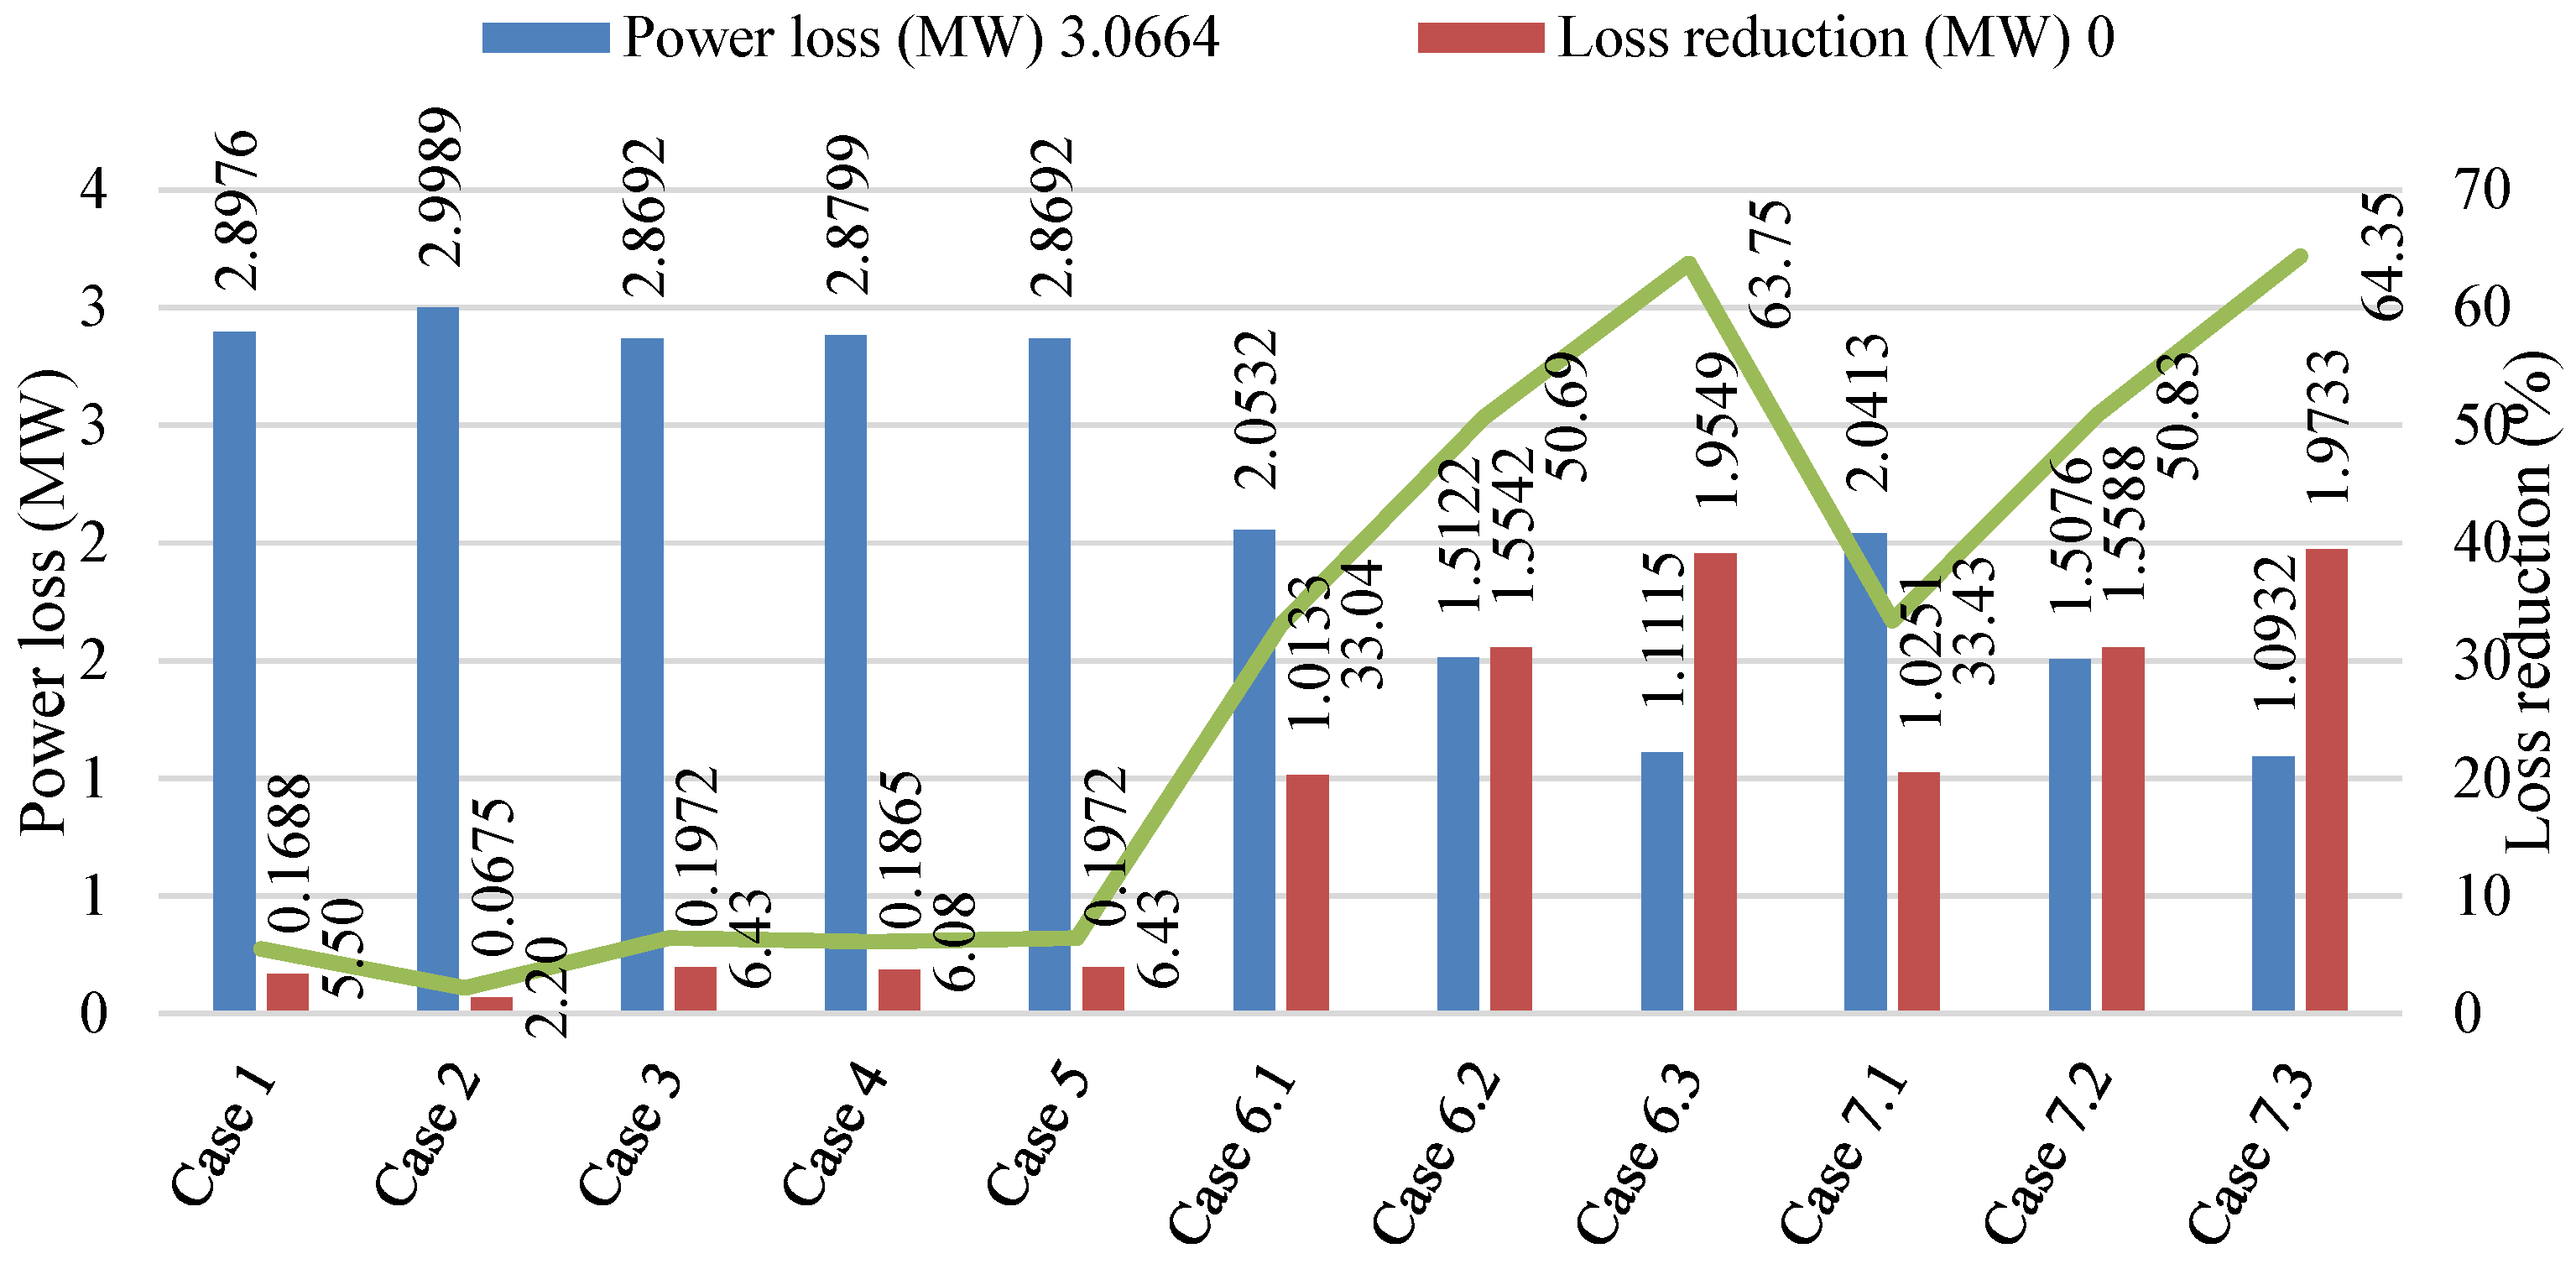
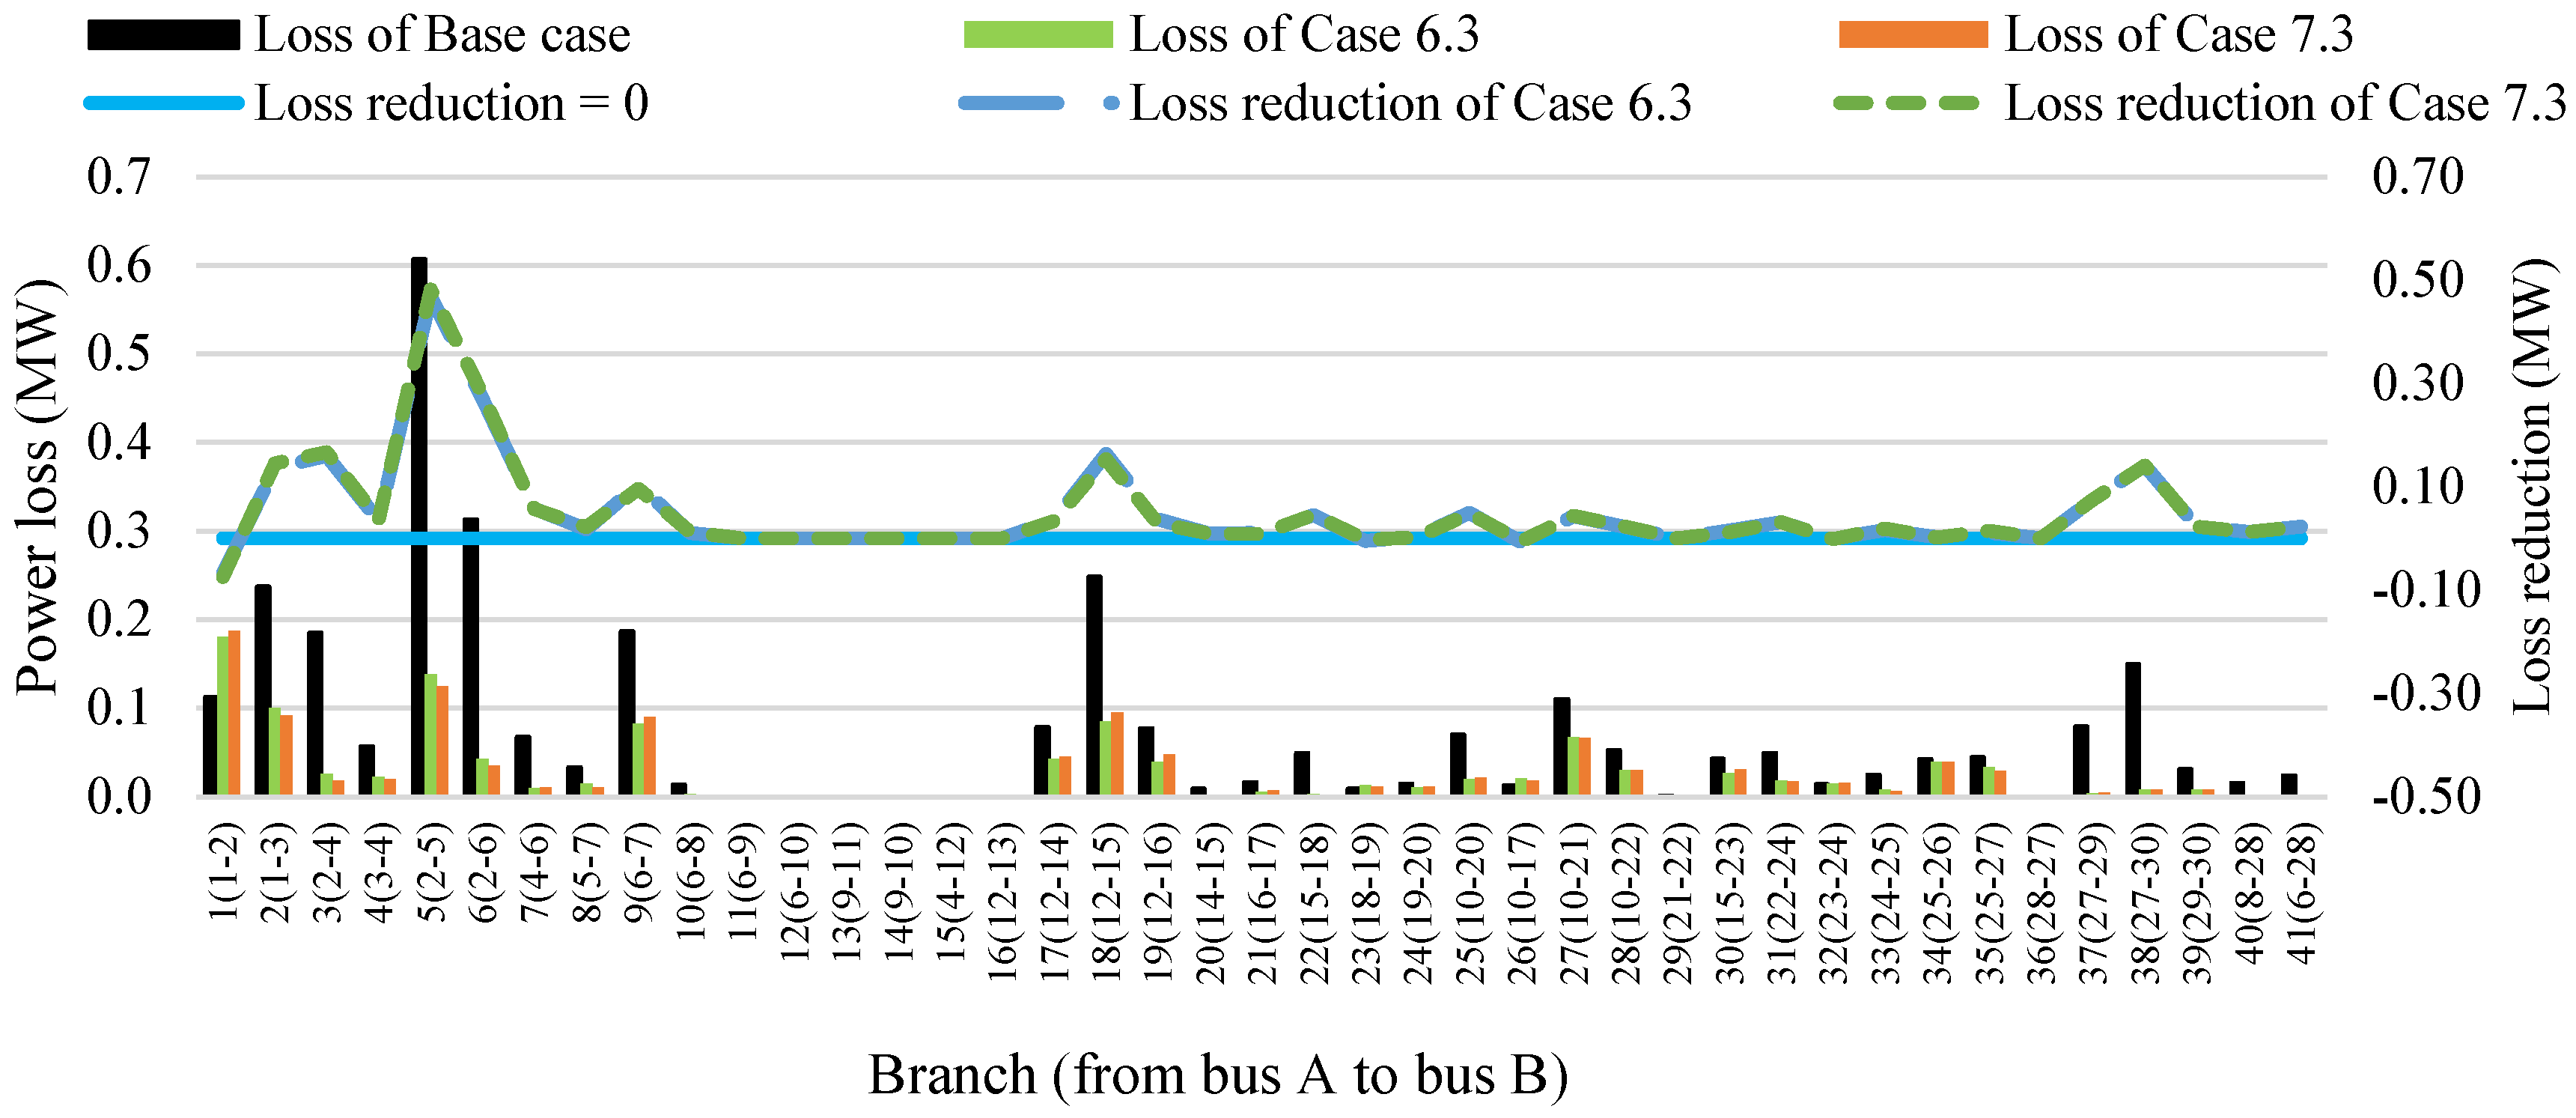
The best power losses obtained for the seven implemented cases are summarized in Figure 13. The smaller power loss of cases compared to the base case is calculated and reported in MW and %. Other cases reach more minor power losses than the base case, from 0.0675 MW to 1.9733 MW, corresponding to 2.2% to 64.35%.
The optimal solutions of the first seven cases are reported in Table 6. Case 1 selected buses 21 and 24 for placing SVCs, while Case 3 reused the solutions of Case 1 to optimize the placement of one TCSC at branch 5 with the reactance of 0.0541 pu. Case 2 selected branch 13 to place one TCSC with a reactance of 0.21 pu. Clearly, when using both SVCs and TCSC, the reactance of TCSC is smaller by (0.21 − 0.0541) = 0.1559 pu, which is about 74.2% of 0.21. However, Case 4, with two SVCs and one TCSC, has a smaller capacity of SVCs than Case 1, with only two SVCs. The total capacity of Case 1 and Case 4 is (12.7030 + 8.8750) = 21.578 MVAr and (5.207 + 9.548) = 14.755 MVAr. Clearly, Case 4 used a smaller capacity by (21.578 − 14.755) = 6.823 MVAr, which is about 31.6% of 21.578 MVAr. The deviation of TCSC between Case 3 and Case 4 and the deviation of SVCs between Case 3 and Case 4 are similar. Case 3 used one TCSC with a smaller reactance by 74.2% than Case 4, but Case 4 used two SVCs with a smaller capacity by 31.6%. However, Case 3 reaches a smaller power loss than Case 4 by (2.8799 − 2.8692) = 0.0107 MVAr, about 0.371%.
The solutions of Cases 6.1 and 7.1 have some similarities and differences. Case 6.1 used the SVCs with (12.6822 + 8.8682) = 21.5504 MVAr, and Case 7.1 used the SVCs with (12.447 + 8.832) = 21.279 MVAr. Case 6.1 located the TCSC with 0.0541 pu at branch 5, and Case 7.1 located the TCSC with 0.051 pu at branch 7. So, Case 7.1 used a smaller total power of SVCs by (21.5504 − 21.279) = 0. 2714 MVAr (about 1.3%) and a smaller reactance of TCSC by (0.0541 − 0.051) = 0.0031 Pu (about 5.7%). Clearly, simultaneous placement of all components can be more effective in terms of smaller power loss (0.0118 MW, about 0.59%), smaller total power of SVCs, and smaller reactance of TCSC. Similarly, Case 7.2 used a smaller amount than Case 6.2 by 6 MW for WPPs and 1.1434 MVAr for SVCs, respectively, but a greater TCSC than Case 6.2 by 0.0018 pu, corresponding to 3.3%. Case 7.3 used the same wind power, a smaller TCSC by 0.0096 pu (17.7%), and smaller SVCs by 1.828 MVAr (8.483%) than Case 6.3. In summary, the simultaneous placement of all components is more effective, and the results obtained are as follows:
(1)
Case 7.1 used smaller SVCs and TCSCs but the same WPP as Case 6.1.
(2)
Case 7.2 used a smaller power of SVCs and wind power plants but a little greater TCSC than Case 6.2.
(3)
Case 7.3 used the same wind power, a smaller TCSC, and smaller SVCs than Case 6.3.
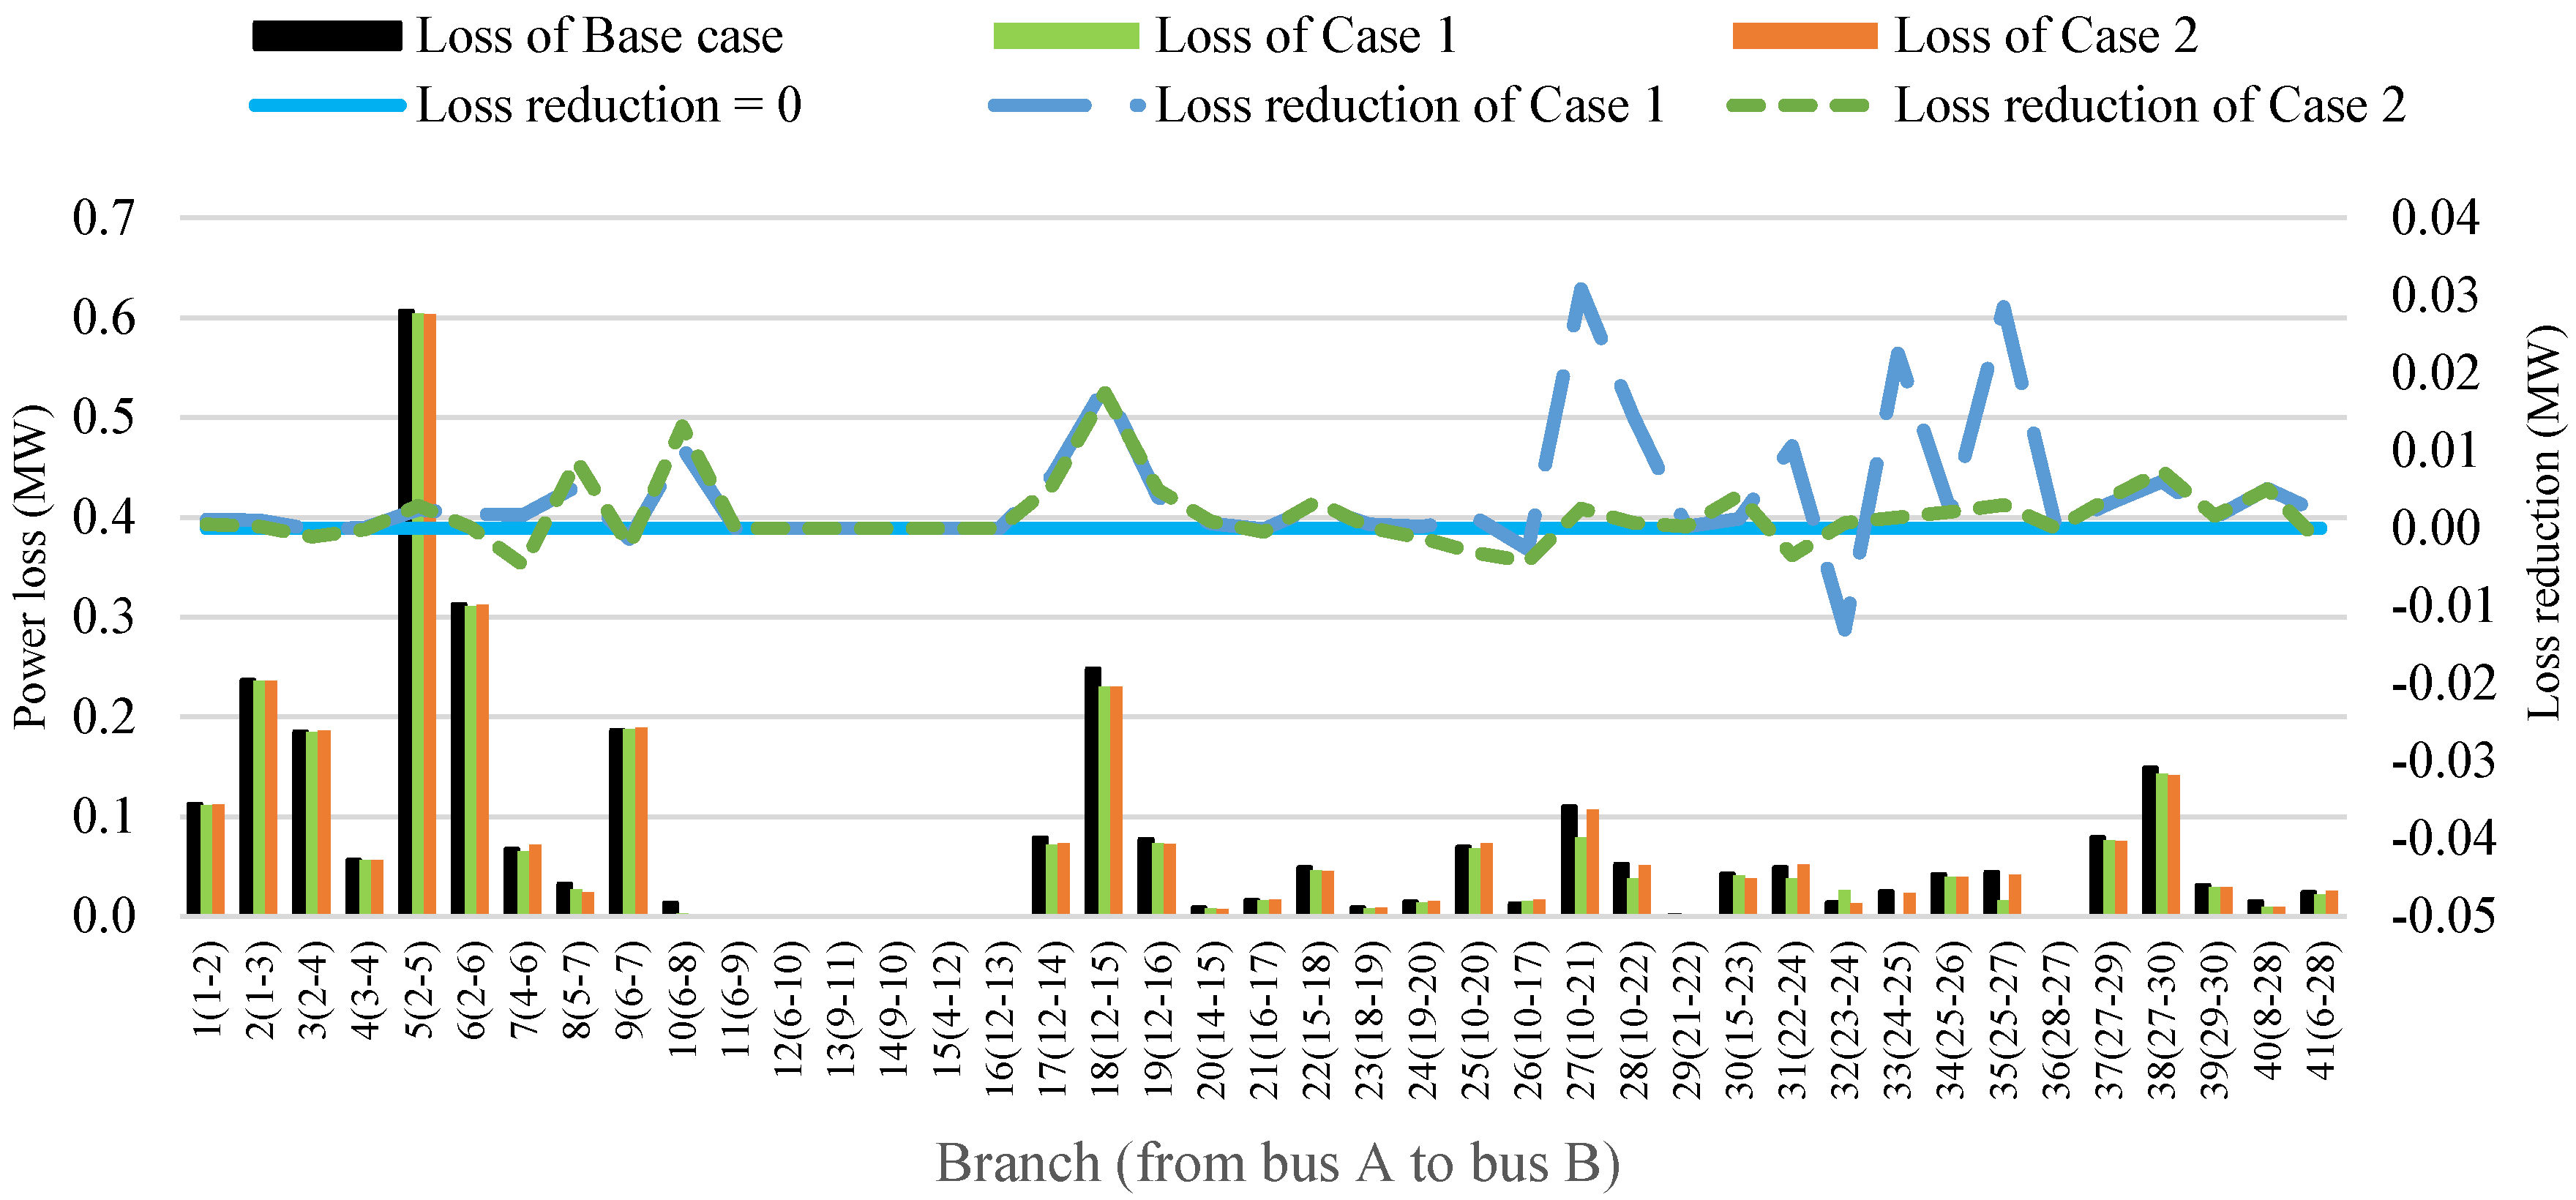
Figure 14 presents the loss of transmission branches in the base case without FACTS, Case 1 with two SVCs, and Case 2 with one TCSC. In addition, the loss reduction in Case 1 compared to the base case and the loss reduction in Case 2 compared to the base case are also calculated and drawn in the figure. The loss reduction in the two cases compared to the base case is greater than 0 MW, excluding the loss on Branch 7 in Case 2, Branch 9 in Case 1 and Case 2, Branch 26 in Case 1 and Case 2, Branch 31 in Case 2, and Branch 32 in Case 1. The loss reduction is especially significant on Branch 27 (from node 10 to node 21) and Branch 33 (from node 24 to node 25) in Case 1. Recall the solution of Case 1: one SVC with 12.7030 MVAr at node 21 and one SVC with 8.8750 MVAr at node 24 are installed. So, the branches connecting the nodes with the SVC can reduce power flows, leading to a significant loss reduction. In Case 2, one TCSC with the reactance of 0.208 pu located on Branch 13 (from node 9 to node 11) has no impact on power flows on this branch. On the other hand, Branches 11, 12, and 15 are transformers with a resistance of 0 ohms, so the loss on the branches is 0 MW. Branches 13 and 14, with resistance of 0 ohms, also have a power loss of 0 MW. Branch 13, with the reactance of 0.208 pu, is added by the TCSC with 0.208 Pu. The branch’s parameter changes, leading to a change in power flow on other branches. Finally, Case 2 reaches power loss reduction compared to the base case.
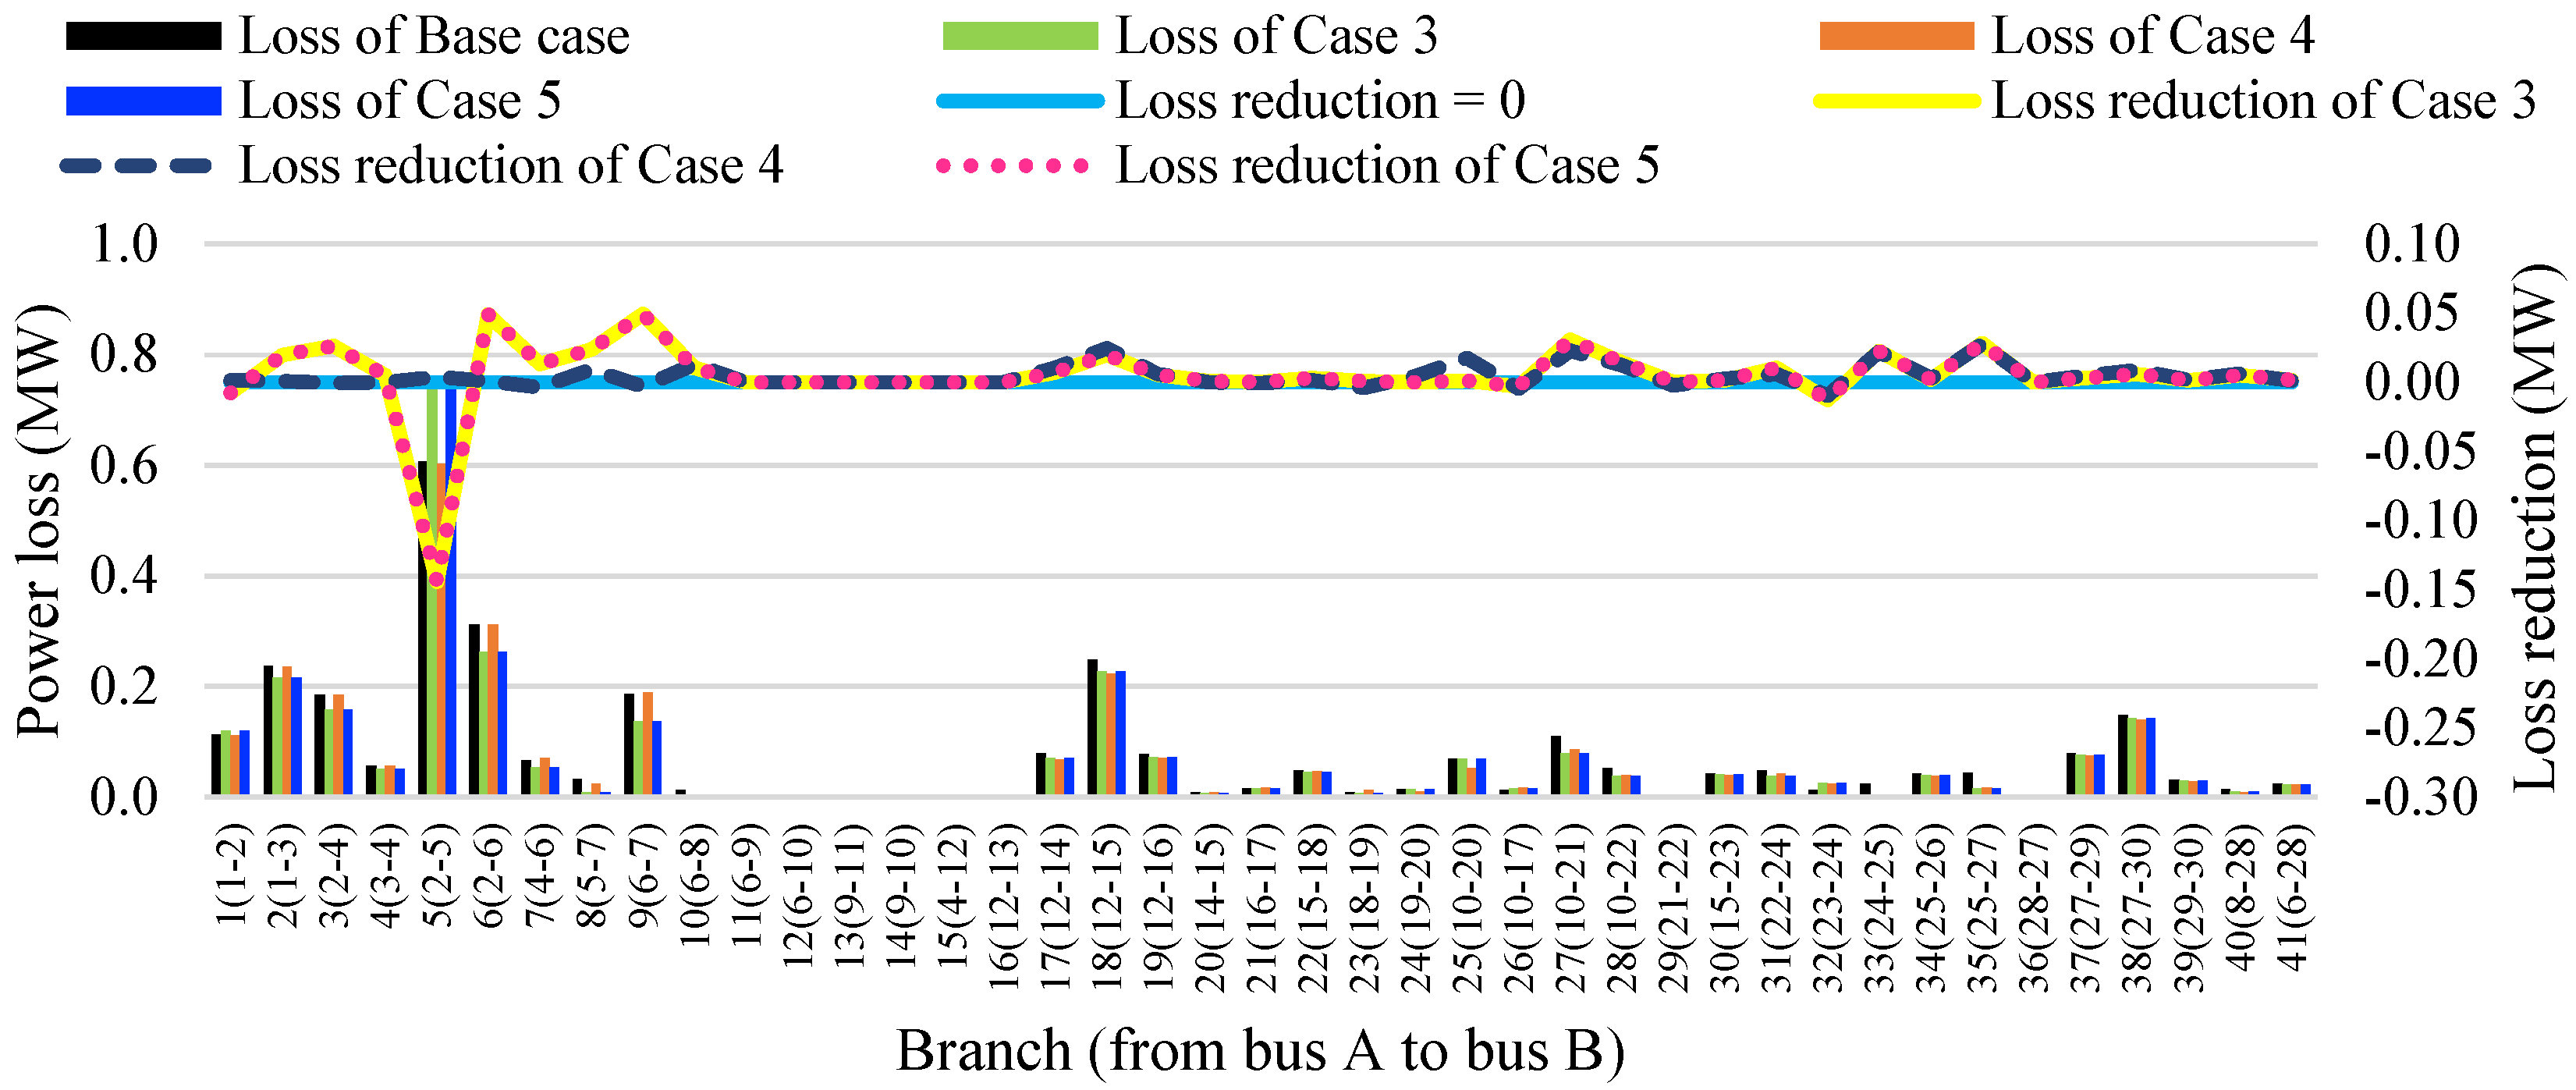
Figure 15 compares the loss between Cases 3–5 and the base case. Approximately, the base case has a higher loss than the other cases for all branches, excluding Branch 5 and Branch 24.
Figure 16 presents the power losses of Cases 6.1 and 7.1 compared to the base case. It is highlighted that Case 6.1 and Case 7.1 have a greater loss reduction compared to the base case on Branch 5 (from node 2 to node 5). Case 6.1 places one TCSC on the branch, but the loss on the branch is reduced. This manner is very different from Case 3 and Case 5 in Figure 15. At node 5, one wind power plant with 30 MW is installed, while the operation power of the load and generator at Node 5 is 94 MW and 50 MW, respectively. So, the load requires a power equaling (94 − 50 − 30) = 14 MW from Node 2. In a base case without the wind power plant, a greater power flow from node 2 to node 5 increases the power loss on branch 5. Case 7.1, with one TCSC at Branch 7, has a smaller power loss on Branch 5 thanks to the placement of one 30-MW wind power plant at node 5. The two cases with two SVCs at nodes 21 and 24 lead to a lower loss than the base case on Branch 27 (from node 10 to node 21) and Branch 33 (from node 24 to node 25).
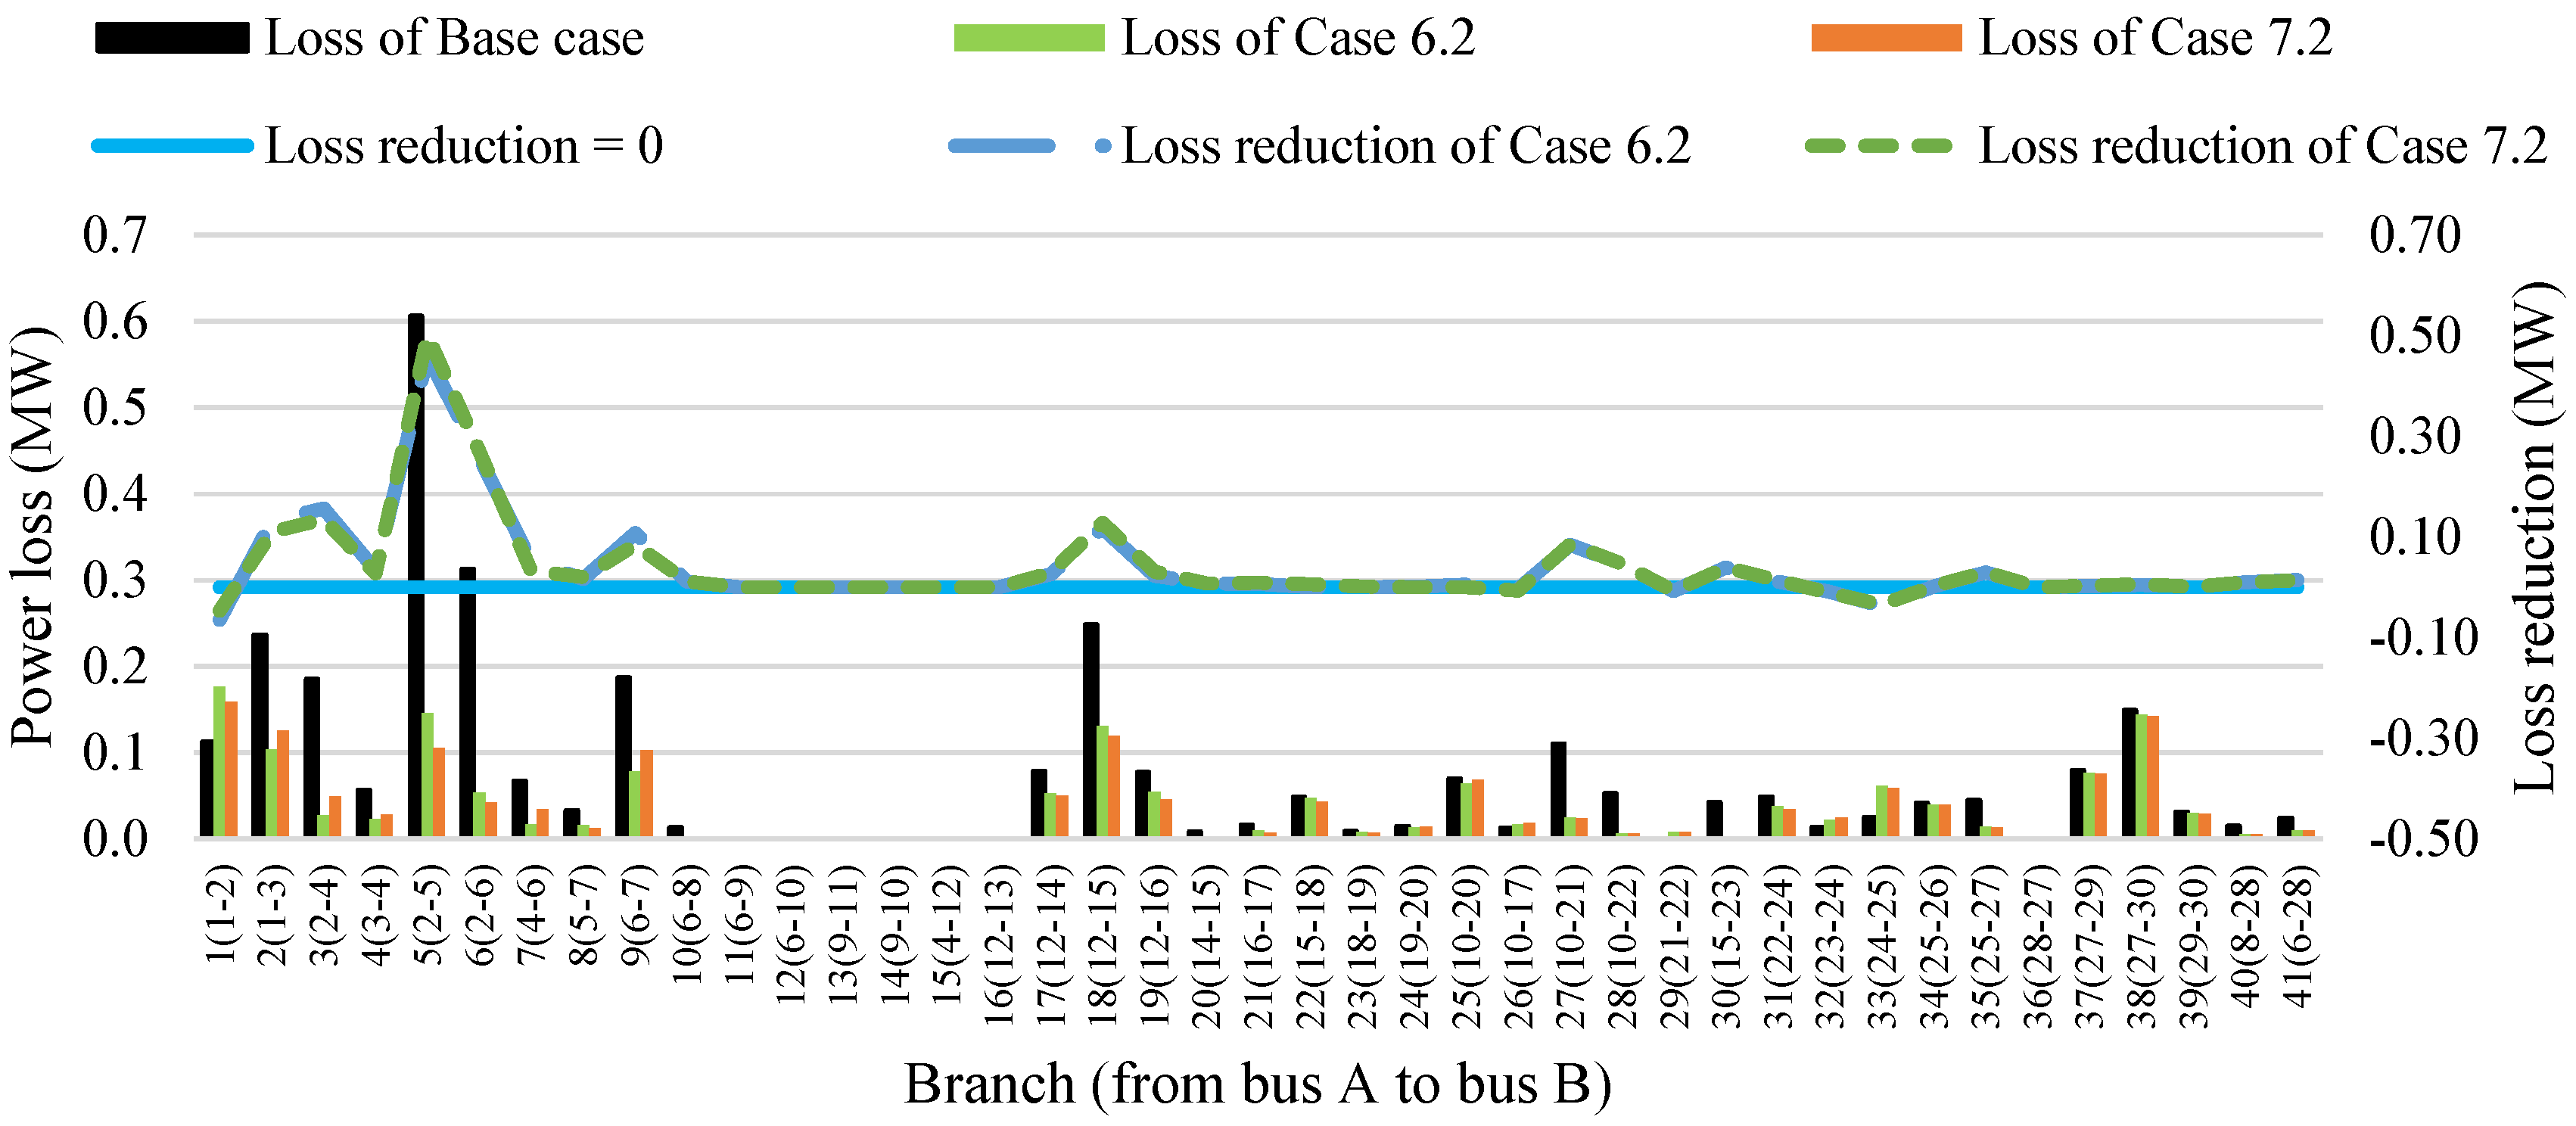
Figure 17 presents the power losses of Cases 6.2 and 7.2 compared to the base case. The case has the same loss shape as Case 6.1 and Case 7.1. Case 6.2 has the same solutions for two SVCs, one TCSC, and one wind power plant as Case 6.1. Similarly, Case 7.2 is similar to Case 7.1. One more wind power plant in Case 6.2 and Case 7.2 is put at the same node 24. The load at node 24 is 8.7 MW; meanwhile, the wind power plant is 27 MW in Case 6.2 and 24 MW in Case 7.2. So, the surplus power transmitted to nodes 23 and 25 leads to a greater loss on Branches 32 and 33 in the two cases compared to the base case.
Figure 18 presents the power losses of Cases 6.2 and 7.2 compared to the base case. The case has the same loss shape as Case 6.1 and Case 7.1. Case 6.2 has the same solutions for two SVCs, one TCSC, and one wind power plant as Case 6.1. Similarly, Case 7.2 is similar to Case 7.1. One more wind power plant in Case 6.2 and Case 7.2 is put at the same node 24. The load at node 24 is 8.7 MW; meanwhile, the wind power plant is 27 MW in Case 6.2 and 24 MW in Case 7.2. So, the surplus power transmitted to nodes 23 and 25 leads to a greater loss on Branches 32 and 33 in the two cases compared to the base case.
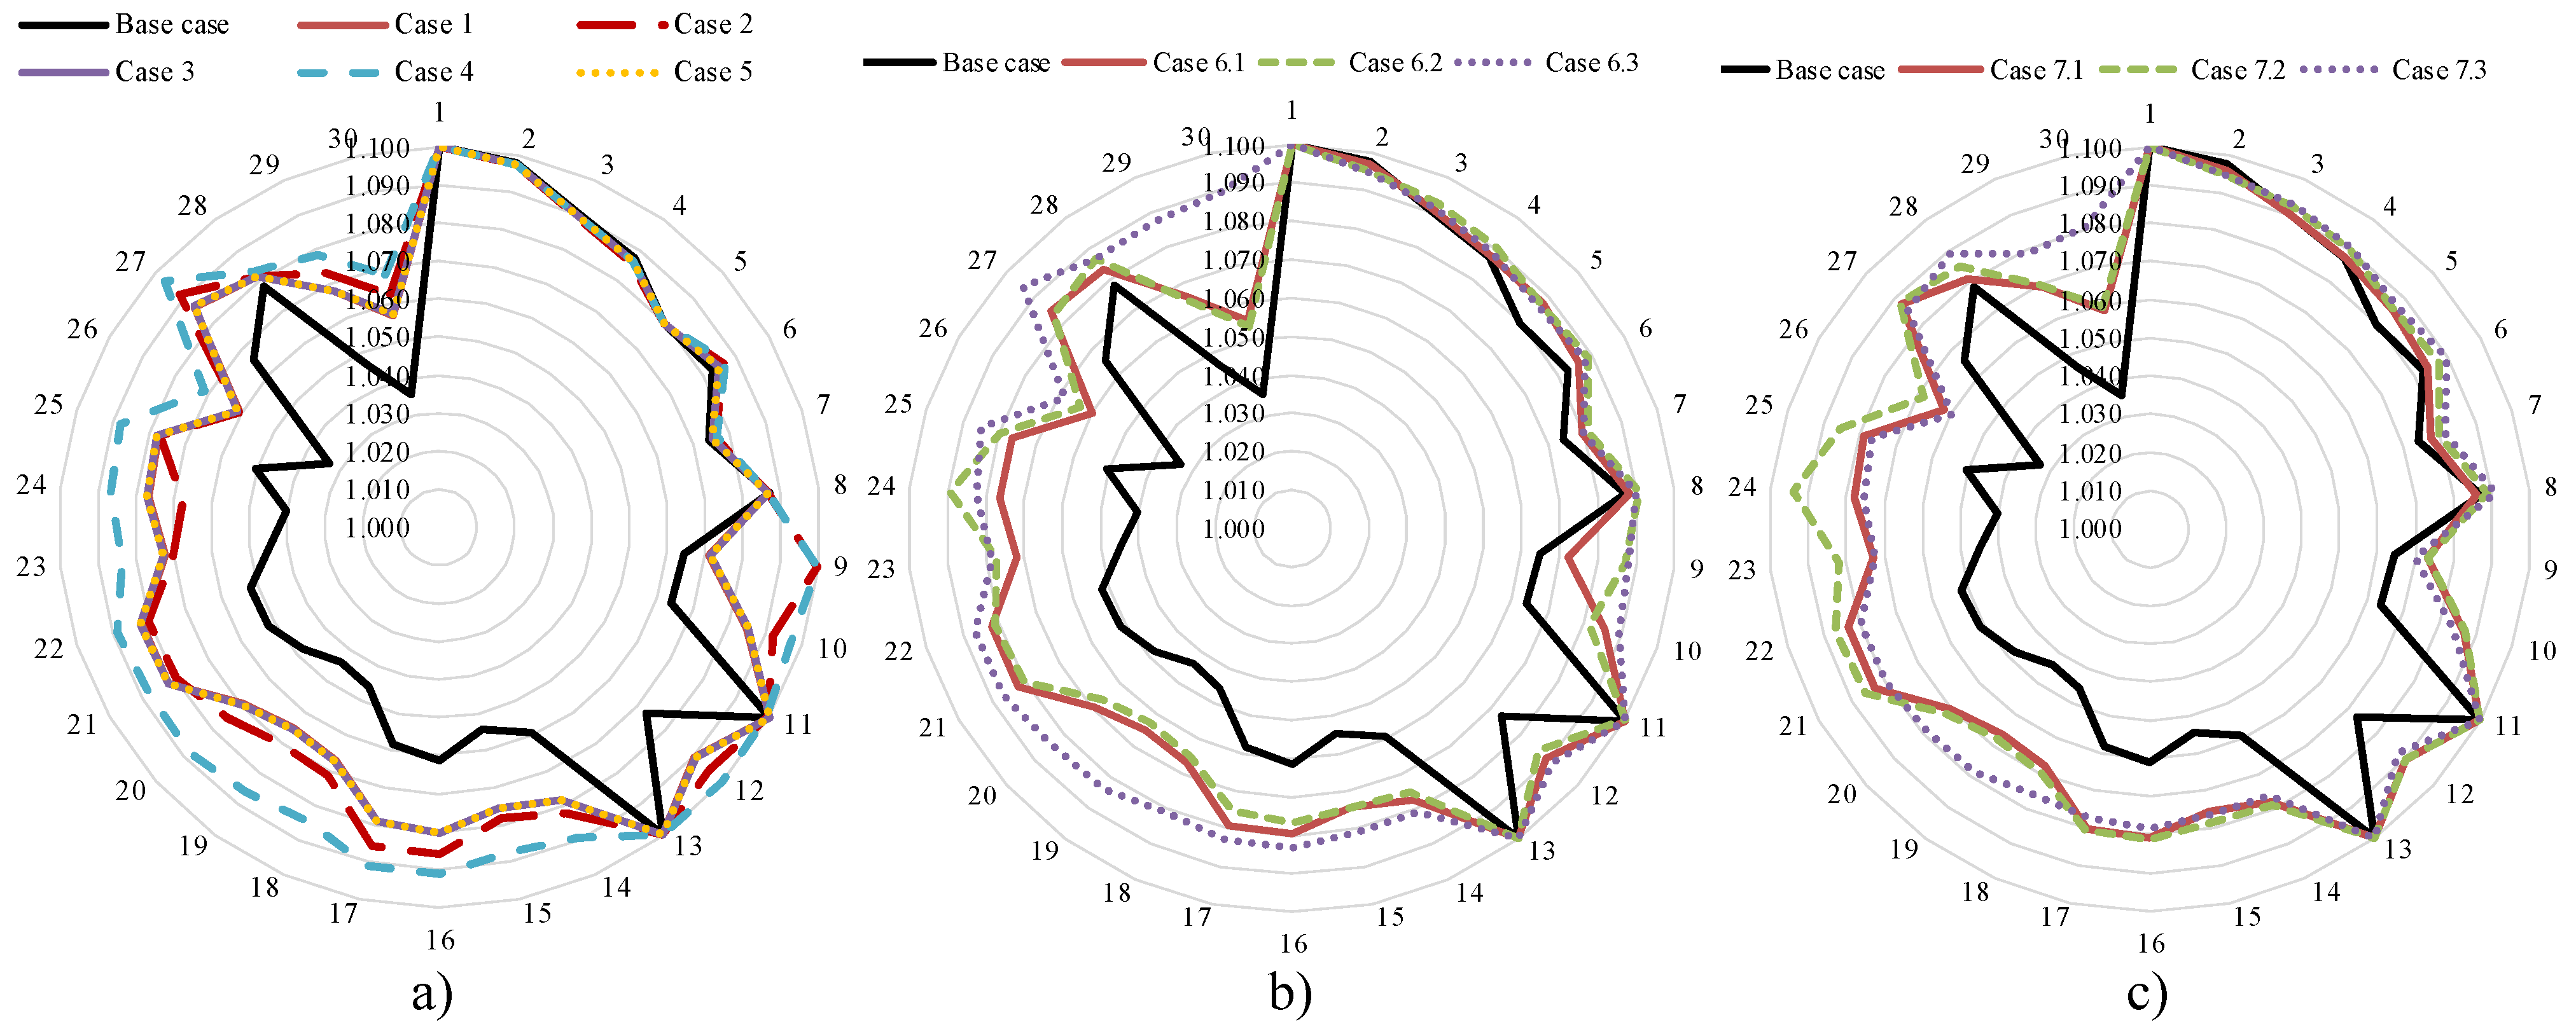
The voltage profile of the study cases is presented in Figure 19. The base case has the smallest voltage among the study cases in the three subfigures. Case 4 has a greater voltage than the others for approximately all nodes in Figure 19a. The optimal placement of one TCSC in the first stage and two SVCs in the second stage can lead to a greater voltage profile than the opposite case. In Figure 19b, Case 6.3 has a better voltage than Case 6.1 and Case 6.2 for approximately all nodes. Differently, Case 7.3 can only reach some nodes, with a better voltage than Case 7.1 and Case 7.2 in Figure 19c.
Optimal solutions for cases are given in Table A2 and Table A3 in Appendix A.

5. Conclusions

The study applied EO, COOT, and MPSA to find optimal power flows of the IEEE 30-bus system without FACTS and wind power plants to minimize the total cost, power loss, and total voltage deviation. After running fifty runs for each case, the three algorithms were compared with each other and with others in previous studies. EO was more effective than COOT and MPSA in finding the best solution for all cases and in having more stable performances for the two cases of the single fuel option. For the remaining cases, EO had more fluctuations than COOT and MPSA. Compared to other algorithms, EO achieved better costs, power losses, and total voltage deviation than many algorithms and worse results than a few algorithms. COOT and MPSA also achieved better results than many algorithms, but suffered worse results than some algorithms. So, the three algorithms were suitable for the study, and EO was the most effective.
The three algorithms were then run to optimize the placement of wind power plants, TCSC, and SVC devices on the IEEE 30-node transmission power network. The objective was to minimize the total active power loss on all transmission lines while satisfying all constraints of the transmission power networks and other added electric components, such as wind power plants, TCSC, and SVC. The study tried simulation cases to find the best solution to the reduction in total active power loss. The simulation cases, results, and contributions can be summarized as follows:
  • The power loss of the base case is 3.066 MW, and the best loss is 2.869 MW for Cases 3 and 5 with two SVCs and one TCSC, in which Case 3 optimizes two SVCs in the first stage and one TCSC in the second stage, and Case 5 optimizes two SVCs and one TCSC simultaneously. When applying the obtained solution of Case 5 and optimizing the placement of one, two, and three WPPs, the power loss is, respectively, 2.053, 1.512, and 1.112 MW. When optimizing two SVCs, one TCSC, and WPPs simultaneously, the power loss is, respectively, 2.041, 1.508, and 1.093 MW for one, two, and three WPPs. When combining two SVCs, one TCSC, and wind power plants, the power loss is 2.041, 1.508, and 1.093 MW for one, two, and three WPPs. So, the installation of FACTS can reduce loss from 3.066 to 2.869 MW, and this loss can be reduced from 2.869 MW to 2.041 MW for one WPP, 1.508 MW for two WPPs, and 1.093 MW for three WPPs. The installation of more WPPs can reduce losses more significantly.
  • Cases 7.1, 7.2, and 7.3 reach smaller losses than Cases 6.1, 6.2, and 6.3 by 0.0118 MW, about 0.59%, 0.0046 MW, about 0.3%, and 0.0004 MW, about 0.04%, respectively. Thus, the simultaneous placement of two SVCs, one TCSC, and wind power plants is more robust than the separated placement for every period.
The results and findings of the simulation cases can clarify the significant contributions to the loss reduction and voltage improvement when considering the placement of renewable power plants and FACTS devices in the IEEE 30-bus transmission power network. The loss reduction is different for different applications of FACTS devices and placement plans. The best solution to loss reduction is to install all FACTS devices and renewable power plants simultaneously. The loss reduction has also been reached for other cases. However, the study also copes with shortcomings, such as neglecting the investment, operation, and maintenance costs of TCSCs, SVCs, and WPPs, and transmission line overloading reduction. The study has not shown the impacts of SVCs and TCSCs on transmission-line capacity and transmission efficiency. In fact, the current load demand is not high enough to cause overloading effects on the transmission line, and the contributions of the devices to the overload have not been proved in the study. Future work will change the load demand and the penetration of renewable power plants; then, the penetration of TCSCs and SVCs will be tested to eliminate the fault.

Author Contributions

Conceptualization, software, and writing—original draft preparation: T.A.N.; methodology, visualization, software, formal analysis, and validation: L.C.K., T.M.P. and M.Q.D.; supervision, and writing—review and editing: T.T.N.; project administration and funding acquisition: L.C.K. All authors have read and agreed to the published version of the manuscript.

Funding

This research is funded by the Ministry of Education and Training, Vietnam, under grant number B2024-SPK-08.

Data Availability Statement

The data that support the findings of this study are available from the corresponding author upon reasonable request.

Acknowledgments

The authors thank Ho Chi Minh City University of Technology and Education for the support.

Conflicts of Interest

No conflicts of interest found.

Appendix A

Table A1. Solution obtained by EO for the objective of cost reduction with a single fuel.
ParametersSingle Fuel-Without VPESSingle Fuel-With VPESMultiple FuelsPower LossVD
Ps2 (Bus 2) MW48.89044.15355.00080.00043.339
Ps3 (Bus 5) MW21.34818.56623.51250.00031.385
Ps4 (Bus 8) MW21.01010.00134.15835.00030.055
Ps5 (Bus 11) MW11.90010.00017.76729.98129.978
Ps6 (Bus 13) MW12.00012.00619.59939.86813.109
Vs1 (Bus 1) pu1.1001.1001.1001.1001.025
Vs2 (Bus 2) pu1.0871.0791.0861.0971.017
Vs3 (Bus 5) pu1.0621.0511.0581.0821.017
Vs4 (Bus 8) pu1.0701.0601.0691.0901.000
Vs5 (Bus 11) pu1.0981.0881.0531.0971.059
Vs6 (Bus 13) pu1.1001.1001.0981.1000.999
Tap1 (Bus 6–9)%4.7594.0234.3024.7444.746
Tap2 (Bus 6–10)%4.8524.6394.6072.3670.078
Tap3 (Bus 4–12)%4.0864.6354.0424.4294.951
Tap4 (Bus 27–28)%4.9414.9700.7054.8780.038
Qc1 (Bus 10) MVar4.9514.7190.5604.3384.969
Qc2 (Bus 12) MVar4.9763.8150.1035.0004.697
Qc3 (Bus 15) MVar3.3364.6824.6373.2794.974
Qc4 (Bus 17) MVar4.9204.7820.0024.9974.985
Qc5 (Bus 20) MVar2.2444.2240.3222.7552.303
Qc6 (Bus 21) MVar1.0481.0771.0981.0121.079
Qc7 (Bus 23) MVar0.9010.9000.9360.9510.904
Qc8 (Bus 24) MVar0.9831.0201.0690.9840.955
Qc9 (Bus 29) MVar0.9640.9920.9880.9790.964
Table A2. Optimal solutions of Cases 1–5.
ParametersCase BaseCase 1Case 2Case 3Case 4Case 5
Ps2 (Bus 2) MW80.000080.000079.999980.000079.999680.0000
Ps3 (Bus 5) MW50.000050.000050.000050.000050.000050.0000
Ps4 (Bus 8) MW35.000035.000035.000035.000035.000035.0000
Ps5 (Bus 11) MW30.000030.000030.000030.000030.000030.0000
Ps6 (Bus 13) MW40.000040.000040.000040.000040.000040.0000
Vs1 (Bus 1) pu1.10001.10001.10001.10001.10001.1000
Vs2 (Bus 2) pu1.09761.09761.09761.09751.09761.0975
Vs3 (Bus 5) pu1.07961.07971.07991.07981.07991.0798
Vs4 (Bus 8) pu1.08721.08691.08681.08681.08681.0868
Vs5 (Bus 11) pu1.10001.10001.09951.10001.09931.1000
Vs6 (Bus 13) pu1.10001.10001.10001.10001.10001.1000
Tap1 (Bus 6–9)%1.04721.06491.06361.06371.04821.0637
Tap2 (Bus 6–10)%0.90000.90000.90000.90000.91650.9000
Tap3 (Bus 4–12)%1.01900.98440.96830.98370.96640.9837
Tap4 (Bus 27–28)%0.97850.97330.95920.97290.96510.9729
SVC1 (Location; size)-21; 12.7030-21; 12.703019; 5.20721; 12.6822
SVC2 (Location; size)-24; 8.8750-24; 8.875024; 9.54824; 8.8682
TCSC (Branch; reactance)--13; 0.2085; 0.054113; 0.2085; 0.0541
Table A3. Optimal solutions of Cases 6–7.
ParametersCase 6.1Case 6.2Case 6.3Case 7.1Case 7.2Case 7.3
Ps2 (Bus 2) MW50.465925.921723.43850.441325.907620.0030
Ps3 (Bus 5) MW50505050.000050.000050.0000
Ps4 (Bus 8) MW35353535.000035.000035.0000
Ps5 (Bus 11) MW303029.989730.000030.000030.0000
Ps6 (Bus 13) MW39.98574033.090440.000040.000036.5081
Vs1 (Bus 1) pu1.11.11.11.10001.10001.1000
Vs2 (Bus 2) pu1.09681.09521.09471.09611.09481.0947
Vs3 (Bus 5) pu1.08771.08721.08641.08561.08591.0871
Vs4 (Bus 8) pu1.08821.09071.091.08631.08921.0911
Vs5 (Bus 11) pu1.11.09981.11.10001.10001.1000
Vs6 (Bus 13) pu1.11.11.11.10001.10001.1000
Tap1 (Bus 6–9)%1.06341.00121.01251.05841.06411.0728
Tap2 (Bus 6–10)%0.90.99490.94950.90000.90000.9000
Tap3 (Bus 4–12)%0.98950.99690.9830.98530.98760.9930
Tap4 (Bus 27–28)%0.9770.98190.97810.97190.97600.9876
SVC1 (Location; size)21; 12.682221; 12.682221; 12.682221; 12.44721; 11.83224; 8.581
SVC2 (Location; size)24; 8.868224; 8.868224; 8.868224; 8.83224; 8.57521; 11.141
TCSC (Branch; reactance)5; 0.05415; 0.05415; 0.05417; 0.05087; 0.05595; 0.0445
WPP1 (bus; power MW)5; 305; 305; 305; 305; 305; 30
WPP2 (bus; power MW)-24; 2419; 20-24; 2419; 20
WPP3 (bus; power MW)--30; 14--30; 14

References

  1. Venkatesan, R.; Kumar, C.; Balamurugan, C.R. FOPIR Controller for TCSC Based Gate Turn-off Switches to Control Power Quality in Transmission Line. Electr. Eng. 2024, 106, 4603–4616. [Google Scholar] [CrossRef]
  2. Rana, A.S.; Bajaj, M.; Gairola, S. Optimal Power Flow Solution in Smart Grid Environment Using SVC and TCSC; IntechOpen: London, UK, 2019; ISBN 1789841062. [Google Scholar]
  3. Farhat, M.; Kamel, S.; Atallah, A.M.; Hassan, M.H.; Agwa, A.M. ESMA-OPF: Enhanced Slime Mould Algorithm for Solving Optimal Power Flow Problem. Sustainability 2022, 14, 2305. [Google Scholar] [CrossRef]
  4. Nguyen, T.T.; Vo, D.N.; Van Tran, H.; Van Dai, L. Optimal Dispatch of Reactive Power Using Modified Stochastic Fractal Search Algorithm. Complexity 2019, 2019, 4670820. [Google Scholar] [CrossRef]
  5. Devarapalli, R.; Venkateswara Rao, B.; Dey, B.; Vinod Kumar, K.; Malik, H.; García Márquez, F.P. An Approach to Solve OPF Problems Using a Novel Hybrid Whale and Sine Cosine Optimization Algorithm. J. Intell. Fuzzy Syst. 2022, 42, 957–967. [Google Scholar] [CrossRef]
  6. Shaheen, A.M.; El-Sehiemy, R.A.; Hasanien, H.M.; Ginidi, A.R. An Improved Heap Optimization Algorithm for Efficient Energy Management Based Optimal Power Flow Model. Energy 2022, 250, 123795. [Google Scholar] [CrossRef]
  7. Su, H.; Wei, H.; Wei, X.; Wang, G.; Zhang, Y.; Wang, R. Long-Term Optimal Operation of the Cascade Hydro-Wind-Photovoltaic Hybrid System Considering Transmission Section Constraints. Math. Probl. Eng. 2023, 2023, 8484804. [Google Scholar] [CrossRef]
  8. Kumari, M.S.; Maheswarapu, S. Enhanced Genetic Algorithm Based Computation Technique for Multi-Objective Optimal Power Flow Solution. Int. J. Electr. Power Energy Syst. 2010, 32, 736–742. [Google Scholar] [CrossRef]
  9. Surender Reddy, S.; Bijwe, P.R.; Abhyankar, A.R. Faster Evolutionary Algorithm Based Optimal Power Flow Using Incremental Variables. Int. J. Electr. Power Energy Syst. 2014, 54, 198–210. [Google Scholar] [CrossRef]
  10. Reddy, S.S.; Bijwe, P.R. Efficiency Improvements in Meta-Heuristic Algorithms to Solve the Optimal Power Flow Problem. Int. J. Emerg. Electr. Power Syst. 2016, 17, 631–647. [Google Scholar] [CrossRef]
  11. Abido, M.A. Optimal Power Flow Using Particle Swarm Optimization. Int. J. Electr. Power Energy Syst. 2002, 24, 563–571. [Google Scholar] [CrossRef]
  12. Niknam, T.; Narimani, M.R.; Aghaei, J.; Azizipanah-Abarghooee, R. Improved Particle Swarm Optimisation for Multi-Objective Optimal Power Flow Considering the Cost, Loss, Emission and Voltage Stability Index. IET Gener. Transm. Distrib. 2012, 6, 515–527. [Google Scholar] [CrossRef]
  13. Vaisakh, K.; Srinivas, L.R.; Meah, K. Genetic Evolving Ant Direction Particle Swarm Optimization Algorithm for Optimal Power Flow with Non-Smooth Cost Functions and Statistical Analysis. Appl. Soft Comput. 2013, 13, 4579–4593. [Google Scholar] [CrossRef]
  14. Vo, D.N.; Schegner, P. An Improved Particle Swarm Optimization for Optimal Power Flow. In Meta-Heuristics Optimization Algorithms in Engineering, Business, Economics, and Finance; IGI Global: New York, NY, USA, 2013; pp. 1–40. [Google Scholar]
  15. Roberge, V.; Tarbouchi, M.; Okou, F. Optimal Power Flow Based on Parallel Metaheuristics for Graphics Processing Units. Electr. Power Syst. Res. 2016, 140, 344–353. [Google Scholar] [CrossRef]
  16. El-Fergany, A.A.; Hasanien, H.M. Single and Multi-Objective Optimal Power Flow Using Grey Wolf Optimizer and Differential Evolution Algorithms. Electr. Power Compon. Syst. 2015, 43, 1548–1559. [Google Scholar] [CrossRef]
  17. Abou El Ela, A.A.; Abido, M.A.; Spea, S.R. Optimal Power Flow Using Differential Evolution Algorithm. Electr. Power Syst. Res. 2010, 80, 878–885. [Google Scholar] [CrossRef]
  18. Bhattacharya, A.; Chattopadhyay, P.K. Application of Biogeography-Based Optimisation to Solve Different Optimal Power Flow Problems. IET Gener. Transm. Distrib. 2011, 5, 70–80. [Google Scholar] [CrossRef]
  19. Ramesh Kumar, A.; Premalatha, L. Optimal Power Flow for a Deregulated Power System Using Adaptive Real Coded Biogeography-Based Optimization. Int. J. Electr. Power Energy Syst. 2015, 73, 393–399. [Google Scholar] [CrossRef]
  20. Nayak, M.R.; Nayak, C.K.; Rout, P.K. Application of Multi-Objective Teaching Learning Based Optimization Algorithm to Optimal Power Flow Problem. Procedia Technol. 2012, 6, 255–264. [Google Scholar] [CrossRef]
  21. Daryani, N.; Hagh, M.T.; Teimourzadeh, S. Adaptive Group Search Optimization Algorithm for Multi-Objective Optimal Power Flow Problem. Appl. Soft Comput. 2016, 38, 1012–1024. [Google Scholar] [CrossRef]
  22. Younis, A.; Belabbes, F.; Cotfas, P.A.; Cotfas, D.T. Utilizing the Honeybees Mating-Inspired Firefly Algorithm to Extract Parameters of the Wind Speed Weibull Model. Forecasting 2024, 6, 357–377. [Google Scholar] [CrossRef]
  23. Lashkar Ara, A.; Kazemi, A.; Gahramani, S.; Behshad, M. Optimal Reactive Power Flow Using Multi-Objective Mathematical Programming. Sci. Iran. 2012, 19, 1829–1836. [Google Scholar] [CrossRef]
  24. Duman, S.; Güvenç, U.; Sönmez, Y.; Yörükeren, N. Optimal Power Flow Using Gravitational Search Algorithm. Energy Convers. Manag. 2012, 59, 86–95. [Google Scholar] [CrossRef]
  25. Rezaei Adaryani, M.; Karami, A. Artificial Bee Colony Algorithm for Solving Multi-Objective Optimal Power Flow Problem. Int. J. Electr. Power Energy Syst. 2013, 53, 219–230. [Google Scholar] [CrossRef]
  26. Ghasemi, M.; Ghavidel, S.; Ghanbarian, M.M.; Gharibzadeh, M.; Azizi Vahed, A. Multi-Objective Optimal Power Flow Considering the Cost, Emission, Voltage Deviation and Power Losses Using Multi-Objective Modified Imperialist Competitive Algorithm. Energy 2014, 78, 276–289. [Google Scholar] [CrossRef]
  27. El-Hana Bouchekara, H.R.; Abido, M.A.; Chaib, A.E. Optimal Power Flow Using an Improved Electromagnetism-like Mechanism Method. Electr. Power Compon. Syst. 2016, 44, 434–449. [Google Scholar] [CrossRef]
  28. Bouchekara, H.R.E.H.; Chaib, A.E.; Abido, M.A.; El-Sehiemy, R.A. Optimal Power Flow Using an Improved Colliding Bodies Optimization Algorithm. Appl. Soft Comput. 2016, 42, 119–131. [Google Scholar] [CrossRef]
  29. Ladumor, D.P.; Trivedi, I.N.; Bhesdadiya, R.H.; Jangir, P. A Grey Wolf Optimizer Algorithm for Voltage Stability Enhancement. In Proceedings of the 2017 Third International Conference on Advances in Electrical, Electronics, Information, Communication and Bio-Informatics (AEEICB), Chennai, India, 27–28 February 2017; pp. 278–282. [Google Scholar]
  30. Mohamed, A.-A.A.; Mohamed, Y.S.; El-Gaafary, A.A.M.; Hemeida, A.M. Optimal Power Flow Using Moth Swarm Algorithm. Electr. Power Syst. Res. 2017, 142, 190–206. [Google Scholar] [CrossRef]
  31. Nguyen, T.T. A High Performance Social Spider Optimization Algorithm for Optimal Power Flow Solution with Single Objective Optimization. Energy 2019, 171, 218–240. [Google Scholar] [CrossRef]
  32. Hassan, M.H.; Kamel, S.; Selim, A.; Khurshaid, T.; Domínguez-García, J.L. A Modified Rao-2 Algorithm for Optimal Power Flow Incorporating Renewable Energy Sources. Mathematics 2021, 9, 1532. [Google Scholar] [CrossRef]
  33. Ebeed, M.; Abdelmotaleb, M.A.; Khan, N.H.; Jamal, R.; Kamel, S.; Hussien, A.G.; Zawbaa, H.M.; Jurado, F.; Sayed, K. A Modified Artificial Hummingbird Algorithm for Solving Optimal Power Flow Problem in Power Systems. Energy Rep. 2024, 11, 982–1005. [Google Scholar] [CrossRef]
  34. Nkan, I.; Obi, P.; Natala, H.; Okoro, O. Investigation of the Transfer Capability of the Nigerian 330 KV, 58-Bus Power System Network Using FACTS Devices. Elektr. J. Electr. Eng. 2023, 22, 53–62. [Google Scholar] [CrossRef]
  35. Ibrahim, N.M.A.; El-said, E.A.; Attia, H.E.M.; Hemade, B.A. Enhancing Power System Stability: An Innovative Approach Using Coordination of FOPID Controller for PSS and SVC FACTS Device with MFO Algorithm. Electr. Eng. 2024, 106, 2265–2283. [Google Scholar] [CrossRef]
  36. Gupta, S.K.; Mallik, S.K. Enhancement in Voltage Stability Using FACTS Devices Under Contingency Conditions. J. Oper. Autom. Power Eng. 2024, 12, 365–378. [Google Scholar] [CrossRef]
  37. Daealhaq, H.M.; kfajey, Y.F.; Tukkee, A.S. Power Loss Reduction and Voltage Profile Improvement Using Optimal Placement of FACTS Devices. IOP Conf. Ser. Mater. Sci. Eng. 2021, 1067, 012128. [Google Scholar] [CrossRef]
  38. Marouani, I.; Guesmi, T.; Alshammari, B.M.; Alqunun, K.; Alshammari, A.S.; Albadran, S.; Hadj Abdallah, H.; Rahmani, S. Optimized FACTS Devices for Power System Enhancement: Applications and Solving Methods. Sustainability 2023, 15, 9348. [Google Scholar] [CrossRef]
  39. Ćalasan, M.; Konjić, T.; Kecojević, K.; Nikitović, L. Optimal Allocation of Static Var Compensators in Electric Power Systems. Energies 2020, 13, 3219. [Google Scholar] [CrossRef]
  40. Dandotia, A.; Gupta, M.K.; Banerjee, M.K.; Singh, S.K.; Đurin, B.; Dogančić, D.; Kranjčić, N. Optimal Placement and Size of SVC with Cost-Effective Function Using Genetic Algorithm for Voltage Profile Improvement in Renewable Integrated Power Systems. Energies 2023, 16, 2637. [Google Scholar] [CrossRef]
  41. Okelola, M.O.; Ayanlade, S.O.; Ogunwole, E.I. Particle Swarm Optimization for Optimal Allocation of STATCOM on Transmission Network. J. Phys. Conf. Ser. 2021, 1880, 012035. [Google Scholar] [CrossRef]
  42. Khan, N.H.; Wang, Y.; Tian, D.; Jamal, R.; Kamel, S.; Ebeed, M. Optimal Siting and Sizing of SSSC Using Modified Salp Swarm Algorithm Considering Optimal Reactive Power Dispatch Problem. IEEE Access 2021, 9, 49249–49266. [Google Scholar] [CrossRef]
  43. Mostafa, A.; Ebeed, M.; Kamel, S.; Abdel-Moamen, M.A. Optimal Power Flow Solution Using Levy Spiral Flight Equilibrium Optimizer with Incorporating CUPFC. IEEE Access 2021, 9, 69985–69998. [Google Scholar] [CrossRef]
  44. Nguyen, T.T.; Mohammadi, F. Optimal Placement of TCSC for Congestion Management and Power Loss Reduction Using Multi-Objective Genetic Algorithm. Sustainability 2020, 12, 2813. [Google Scholar] [CrossRef]
  45. Nguyen, A.T.; Le, C.K.; Phan, M.T.; Nguyen, T.T. COOT Bird Behavior-Based Optimization Algorithm for Optimal Placement of Thyristor Controlled Series Compensator Devices in Transmission Power Networks. Adv. Electr. Electron. Eng. 2023, 21, 171–183. [Google Scholar] [CrossRef]
  46. Rambabu, M.; Kumar, G.V.N.; Sobhan, P.V.S. Optimal Power Flow with Renewable Energy Resources Using Static VAR Compensator and Grey Wolf Optimisation. Int. J. Intell. Enterp. 2022, 9, 357. [Google Scholar] [CrossRef]
  47. Rezaeian-Marjani, S.; Galvani, S.; Talavat, V.; Farhadi-Kangarlu, M. Optimal Allocation of D-STATCOM in Distribution Networks Including Correlated Renewable Energy Sources. Int. J. Electr. Power Energy Syst. 2020, 122, 106178. [Google Scholar] [CrossRef]
  48. Yang, N.-C.; Chang, Z.-H. Optimal Capacity and Location for STATCOM with Seasonal Wind Power Prediction Using C-Vine Copula. Mathematics 2023, 11, 2815. [Google Scholar] [CrossRef]
  49. Basu, J.B.; Dawn, S.; Saha, P.K.; Chakraborty, M.R.; Alsaif, F.; Alsulamy, S.; Ustun, T.S. Risk Mitigation & Profit Improvement of a Wind-Fuel Cell Hybrid System with TCSC Placement. IEEE Access 2023, 11, 39431–39447. [Google Scholar] [CrossRef]
  50. Faramarzi, Z.; Abazari, S.; Hoghoughi, S.; Abjadi, N.R. Improved Power System Dynamic Stability by DFIG in the Presence of SSSC Using Adaptive Nonlinear Multi-Input Backstepping. J. Oper. Autom. Power Eng. 2024, 12, 107–120. [Google Scholar]
  51. Rezaeian-Marjani, S.; Jalalat, S.M.; Tousi, B.; Galvani, S.; Talavat, V. A Probabilistic Approach for Optimal Operation of Wind-integrated Power Systems Including UPFC. IET Renew. Power Gener. 2023, 17, 706–724. [Google Scholar] [CrossRef]
  52. Naruei, I.; Keynia, F. A New Optimization Method Based on COOT Bird Natural Life Model. Expert Syst. Appl. 2021, 183, 115352. [Google Scholar] [CrossRef]
  53. Faramarzi, A.; Heidarinejad, M.; Stephens, B.; Mirjalili, S. Equilibrium Optimizer: A Novel Optimization Algorithm. Knowl. Based Syst. 2020, 191, 105190. [Google Scholar] [CrossRef]
  54. Faramarzi, A.; Heidarinejad, M.; Mirjalili, S.; Gandomi, A.H. Marine Predators Algorithm: A Nature-Inspired Metaheuristic. Expert Syst. Appl. 2020, 152, 113377. [Google Scholar] [CrossRef]
  55. MATPOWER PGROGRAM. Available online: https://matpower.org/matpower-7-0-launch/ (accessed on 1 January 2025).
  56. Sharifzadeh, H. Handling Multiple-Fuel Options in Economic Dispatch of Thermal Power Plants Through a Tight Model Applying Indicator Variables. Int. Trans. Electr. Energy Syst. 2025, 2025, 1572487. [Google Scholar] [CrossRef]
  57. The Siemens SGT6-5000F Gas Turbine. Available online: https://www.siemens-energy.com/global/en/home/products-services/product/sgt6-5000f.html#/ (accessed on 20 September 2025).
  58. Shafik, M.B.; Chen, H.; Rashed, G.I.; El-Sehiemy, R.A. Adaptive Multi Objective Parallel Seeker Optimization Algorithm for Incorporating TCSC Devices into Optimal Power Flow Framework. IEEE Access 2019, 7, 36934–36947. [Google Scholar] [CrossRef]
  59. Le, L.D.; Vo, D.N.; Huynh, S.T.; Nguyen-Hoang, T.M.; Vasant, P. A Hybrid Differential Evolution and Harmony Search for Optimal Power Flow with FACTS Devices. Int. J. Oper. Res. Inf. Syst. 2020, 11, 39–65. [Google Scholar] [CrossRef]
  60. Mohamed, S.A.; Anwer, N.; Mahmoud, M.M. Solving Optimal Power Flow Problem for IEEE-30 Bus System Using a Developed Particle Swarm Optimization Method: Towards Fuel Cost Minimization. Int. J. Model. Simul. 2025, 45, 307–320. [Google Scholar] [CrossRef]
  61. Tran, V.H.; Truong, A.V.; Phan, T.M.; Nguyen, T.T. Minimize the One-Year Energy for Distribution Power Grids with Renewable Energies-Based Distributed Generators, Capacitors, and Soft Open Points. Int. J. Energy Res. 2025, 2025, 3457520. [Google Scholar] [CrossRef]
  62. Nagarajan, K.; Rajagopalan, A.; Bajaj, M.; Raju, V.; Blazek, V. Enhanced Wombat Optimization Algorithm for Multi-Objective Optimal Power Flow in Renewable Energy and Electric Vehicle Integrated Systems. Results Eng. 2025, 25, 103671. [Google Scholar] [CrossRef]
  63. Ali, I.I.; Al-kubragyi, S.S.A. Optimal Power Flow Solution Integrated with TCSC to Improved Voltage Profile and Losses Reduction in Power System Using Effective Intelligent Technique. Int. J. Intell. Eng. Syst. 2024, 17, 659–673. [Google Scholar] [CrossRef]
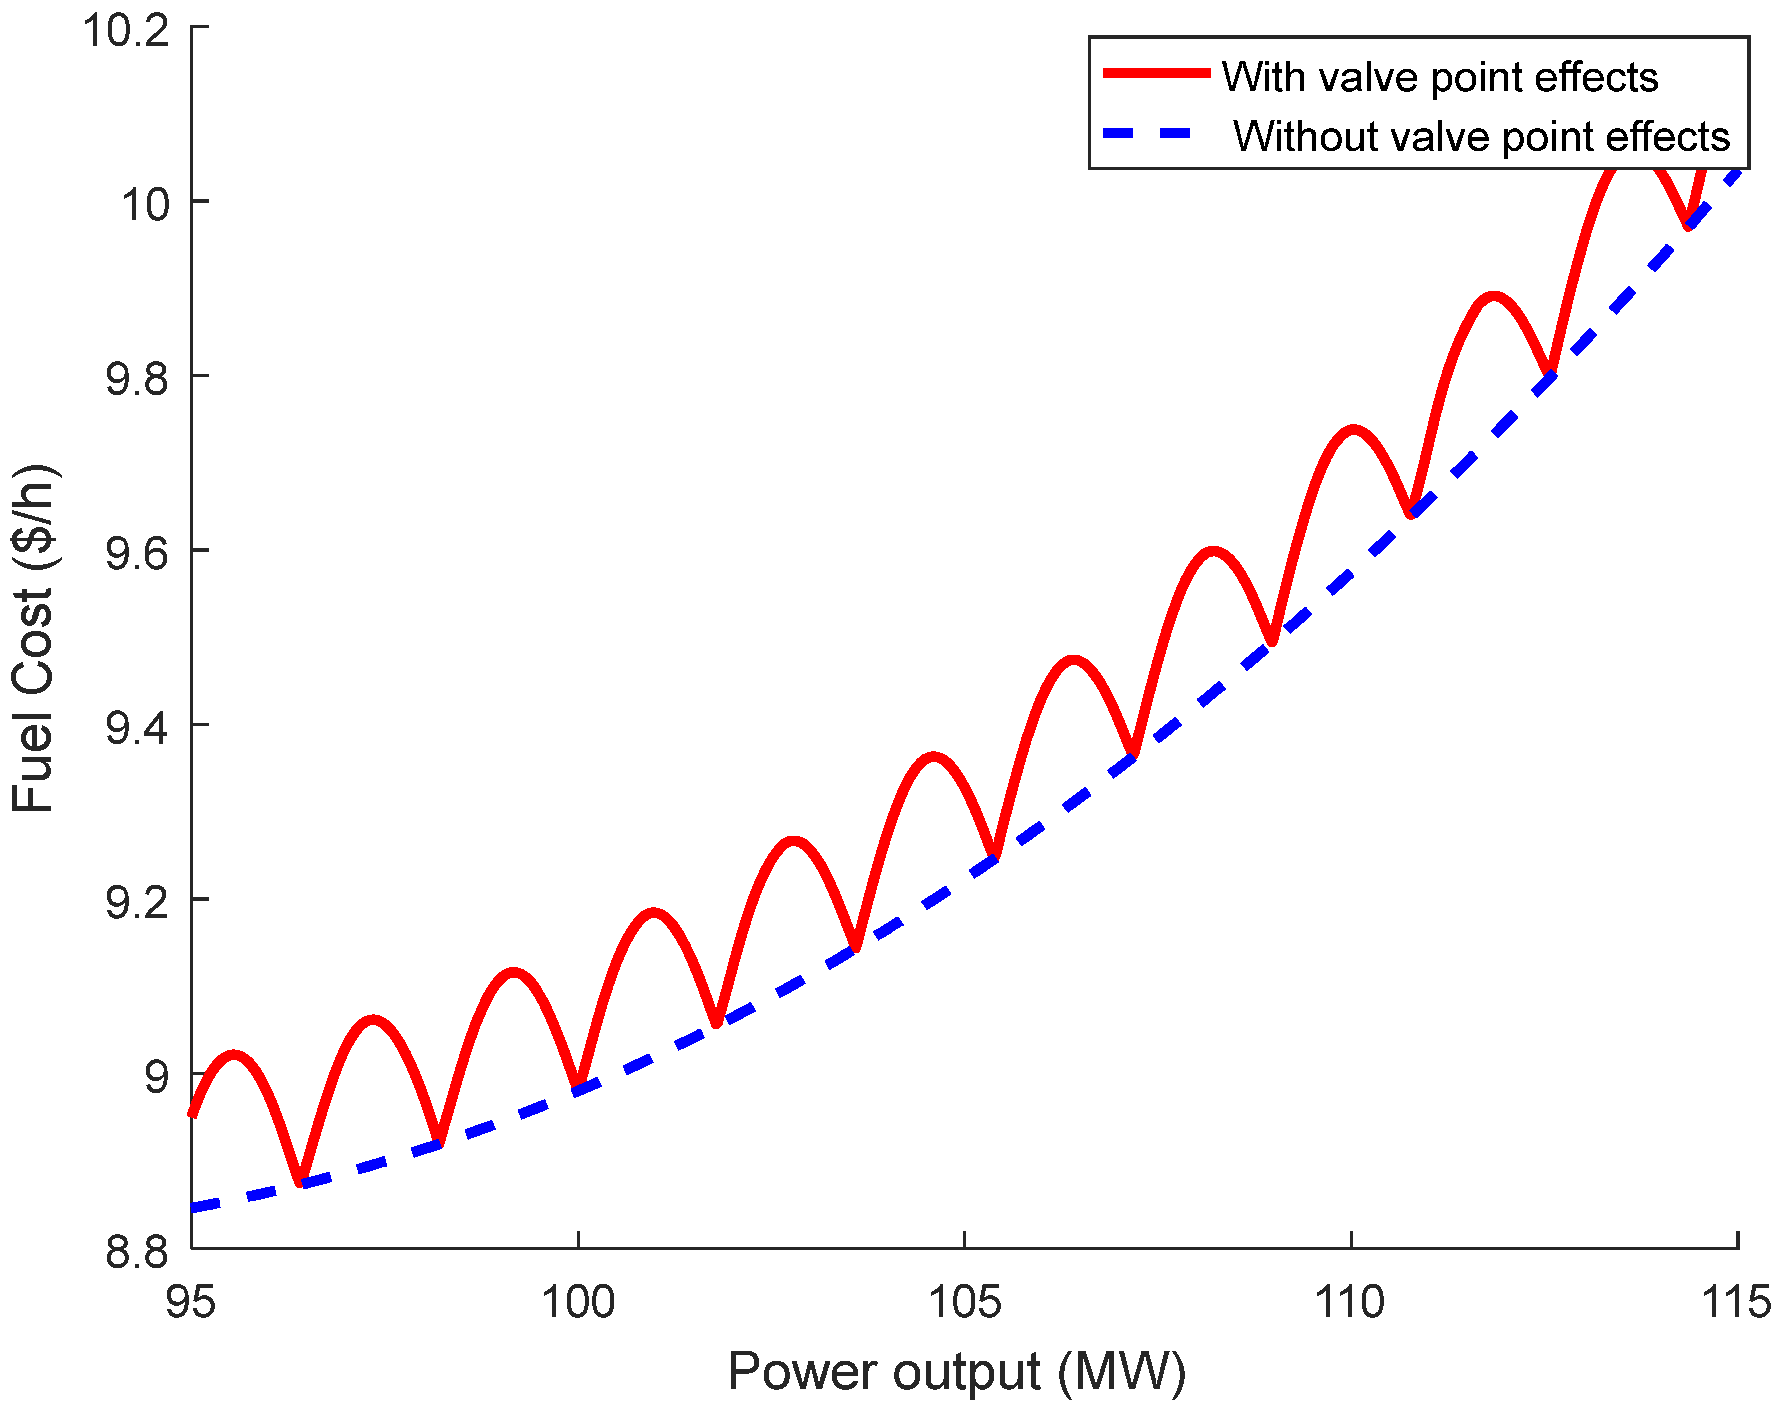
Figure 1. The typical shapes of single fuel for TPPs.
Applsci 15 10596 g001
Figure 2. The typical shapes of three fuels for TPPs.
Applsci 15 10596 g002
Figure 3. The connection of FACTS device: (a) TCSC on a branch and (b) SVC at a node.
Applsci 15 10596 g003
Figure 4. Flowchart of using EO to solve the problem being considered.
Applsci 15 10596 g004
Figure 5. The IEEE 30-node transmission power system.
Applsci 15 10596 g005
Figure 6. Summary of obtained costs from 50 trial runs: (a) Single fuel without VPES; (b) Single fuel with VPES; and (c) Multiple fuels.
Applsci 15 10596 g006
Figure 7. Summary of obtained power losses and voltage deviation from 50 trial runs: (a) Power losses; and (b) total voltage deviation.
Applsci 15 10596 g007
Figure 8. The convergence curves for single fuel without VPES: (a) the best run; (b) the mean run; and (c) the worst run.
Applsci 15 10596 g008
Figure 9. The convergence curves for single fuel with VPES: (a) the best run; (b) the mean run; and (c) the worst run.
Applsci 15 10596 g009
Figure 10. The convergence curves for multiple fuels: (a) the best run; (b) the mean run; and (c) the worst run.
Applsci 15 10596 g010
Figure 11. The convergence curves for power losses: (a) the best run; (b) the mean run; and (c) the worst run.
Applsci 15 10596 g011
Figure 12. The convergence curves for total voltage deviation: (a) the best run; (b) the mean run; and (c) the worst run.
Applsci 15 10596 g012
Figure 13. The impact of FACTS on the power loss.
Applsci 15 10596 g013
Figure 14. Power loss and loss reduction for Case 1 and Case 2.
Applsci 15 10596 g014
Figure 15. Power loss and loss reduction for Cases 3, 4, and 5.
Applsci 15 10596 g015
Figure 16. Power loss and loss reduction for Cases 6.1 and 7.1.
Applsci 15 10596 g016
Figure 17. Power loss and loss reduction for Cases 6.2 and 7.2.
Applsci 15 10596 g017
Figure 18. Power loss and loss reduction for Cases 6.3 and 7.3.
Applsci 15 10596 g018
Figure 19. The voltage profile comparisons: (a) Base case and Cases 1–5; (b) Base case and Case 6; and (c) Base case and Case 7.
Applsci 15 10596 g019
Table 1. Fuel cost comparison (in $/h) for the IEEE 30-bus system with nine shunt capacitors.
MethodSingle Fuel-Without VPESSingle Fuel-with VPESMultiple Fuels
EGA [8]799.56--
IGA [9]799.56--
BIGA [10]800.0435--
CDE1 [16]801.23--
CDE2 [17]799.2891-650.8224
WF-PSO [11]800.41-647.69
AD-PSO [13]800.2276-629.4692
GPUS-PSO [15]800.53--
BBO [18]799.1116-647.7437
ABBO [19]800.5159--
TLBO [20]800.7257--
GSO [21]802.188--
AGSO [21]801.75--
MP [23]801.757--
GSA [24]798.675143-646.848066
ABCA [25]800.6600-649.0855
GWO [29]799.5585--
MEMLMA [27]800.0781-649.6309
ICBOA [28]799.0353830.4531645.1668
MSA [30]800.5099-646.8364
OSSOA [31]802.2580840.5816657.1848
MSSOA [31]798.9936830.45646.1758
LD-FB-AHA [33]799.7633833.7215-
OAHA [33]800.3203835.7149-
FS-SFSOA [33]799.8328833.9494-
ALO [33]802.2177836.8568-
WOA [33]801.7535837.0127-
SCFA [33]815.0065869.8157-
FBL-ABCOA [33]799.7641833.8195-
COOT798.957830.746647.967
MPSA799.123830.695646.491
EO798.912830.532646.152
Table 2. Power loss and total voltage deviation comparison for the IEEE 30-bus system with nine shunt capacitors.
MethodPower Loss (MW)VD
EGA [8]3.2008-
HEGA [9]3.244-
DE [16]3.38-
DE [17]-0.1357
CQS-PSO [12]5.0732-
AD-PSO [13]-0.4952
BBO [18]-0.0951
ABBO [19]3.10090.092
TLBO [20]2.9501-
GSA [24]-0.093269
ABCA [25]3.1078
IICA [26]-0.0952
GWO [29]-0.118736
MEMLMA [27]-0.1063
MSA [30]3.1005-
OSSOA [31]3.82390.123551
MSSOA [31]2.86780.09071
COOT2.8670.098
MPSA2.8400.097
EO2.8300.094
Table 3. Description of study cases and parameter settings for three executed algorithms.
Study CaseDescription P S ;   I t e r m a x
BaseOptimal power flow for the IEEE 30-bus system without capacitors, FACTS, and renewable energies-
Case 1Optimal location and rated power of two SVCs60; 500
Case 2Optimal location and parameter of 1 TCSC in the base system60; 500
Case 3Using results from Case 1 and optimizing the location and parameter of 1 TCSC60; 500
Case 4Using results from Case 2 and optimizing the location and rated power of two SVCs60; 500
Case 5Simultaneously optimize two SVCs and one TCSC in the base system100; 1000
Case 6Use the best solution from Case 3, Case 4, and Case 5, and then optimize different numbers of wind power plants
Case 6.1Optimize the location and rated power of one wind power plant60; 500
Case 6.2Optimize the location and rated power of two wind power plants60; 500
Case 6.3Optimize the location and rated power of three wind power plants60; 500
Case 7Simultaneously optimize two SVCs, one TCSC, and wind power plants
Case 7.1One wind power plant100; 1000
Case 7.2Two wind power plants100; 1200
Case 7.3Three wind power plants100; 1500
Table 4. Minimum and mean power losses obtained by COOT, MPSA, and EO.
CaseMinimum Power LossMean Power Loss
COOTMPSAEOCOOTMPSAEO
Base3.0663.0663.0663.0663.0663.094
Case 12.8982.8982.8982.9242.9013.018
Case 22.9992.9992.9993.0553.0133.059
Case 32.8692.8692.8692.8902.8792.998
Case 42.8802.87972.8812.9182.8863.097
Case 52.8692.8692.8692.9052.8902.906
Case 6.12.0552.0532.0532.2452.0892.225
Case 6.21.5231.5131.5121.7041.5441.717
Case 6.31.1241.1171.1121.3321.1971.300
Case 7.12.0412.0422.0412.0532.0442.042
Case 7.21.5231.5101.5081.5231.5161.510
Case 7.31.1141.1081.0931.1221.1171.109
Table 5. Performance evaluation of the three executed algorithms.
CaseThe Best SolutionThe Best Stabilization
COOTMPSAEOCOOTMPSAEO
Basexxxxx-
Case 1xxx-x-
Case 2xxx-x-
Case 3xxx-x-
Case 4-x--x-
Case 5xxx-x-
Case 6.1-xx-x-
Case 6.2--x-x-
Case 6.3--x-x-
Case 7.1x-x--x
Case 7.2--x--x
Case 7.3--x--x
Table 6. Solutions of Cases 1–7.
CaseWind Power PlantSVCTCSC
BusSize (MW)BusSize (MVAr)LineSize (Pu)
1--21; 2412.7030; 8.8750--
2----130.208
3--21; 2412.7030; 8.875050.0541
4--19; 245.207; 9.548130.208
5--21; 2412.6822; 8.868250.0541
6.153021; 2412.6822; 8.868250.0541
6.25; 2430; 2421; 2412.6822; 8.868250.0541
6.35; 19; 3030; 20; 1421; 2412.6822; 8.868250.0541
7.153021; 2512.447; 8.83270.051
7.25; 2424; 2421; 2611.141; 8.58170.0559
7.35; 19; 3030; 20; 1421; 2710.785; 8.56970.0445
Disclaimer/Publisher’s Note: The statements, opinions and data contained in all publications are solely those of the individual author(s) and contributor(s) and not of MDPI and/or the editor(s). MDPI and/or the editor(s) disclaim responsibility for any injury to people or property resulting from any ideas, methods, instructions or products referred to in the content.