1. Introduction
Materials informatics initially was developed with numerical data such as electrical conductivity values and process temperatures, aiming to predict material property values (e.g., electrical conductivity) or to optimize conditions, such as chemical compositions or heating temperature, in processes. Numerical data, including simulated data, are now in practical use in many industrial settings. For textual data, patents were the first category to be utilized in data science due to their relatively well-defined literary format. The utilization of scientific papers and textbooks has lagged behind because of their unstructured format. Before the recent explosive development of generative large language models (generative LLMs), collecting and finding targeted reference documents from vast patent databases or scientific articles, and extracting numerical values from tables or texts in scientific articles to construct material databases have been the main uses of LLMs in materials science.
With the emergence of generative LLMs, entity extraction from scientific papers can now be performed without coding. Data analysis by generative LLMs [
1], prompt engineering for chemistry [
2], AI scientists [
3], and the development of AI agents [
4] all emerged. All these techniques are based on LLMs.
The above developments are mostly based on a question–answer type of response from generative LLMs. However, to grasp the overall picture or place an issue in context, other forms of visualization can be more powerful—one of which represents relationships among pieces of information using a knowledge graph. A knowledge graph is a type of information representation in which the connections between data are emphasized, rather than numerical values or the contents of text. It is explained in Wikipedia [
5] as, “A knowledge graph is a knowledge base that uses a graph-structured data model or topology to represent and operate on data. Knowledge graphs are often used to store interlinked descriptions of entities—objects, events, situations or abstract concepts—while also encoding the free-form semantics or relationships underlying these entities.” An example of a knowledge graph is shown in
Figure 1, where the relationships among leading global semiconductor companies are visualized. This was obtained by inputting the following prompt to ChatGPT-o4-mini: “Please generate an image of a knowledge graph showing the relationships among leading global semiconductor companies, including their suppliers.” Company names are categorized as Foundries (blue), Equipment Suppliers (orange), Wafer Material Suppliers (yellow), Chip Designers and Fabless Companies (green), and Memory Manufacturers (light green).
The output shown in
Figure 1 could be different for each input due to slightly different company names in the graph. However,
Figure 1 is only to show what a knowledge graph is, and the reproducibility is not an issue.
There are many articles on general aspects of knowledge graphs, such as general guides to knowledge graphs [
6], use cases [
7,
8], industrial applications [
9], and applications in data analytics [
10]. Following the emergence of generative language AI models, various types of knowledge graphs have been created in the field of materials science [
11,
12,
13,
14,
15], including those generated from correlations between numerical data and those constructed through entity extractions from scientific papers.
In addition to constructing knowledge graphs with LLMs, such graphs can also be used to adjust generative LLMs to specific domains. A well-known technique for domain adaptation is RAG (Retrieval-Augmented Generation) [
16,
17], in which a generative LLM references vectors derived from domain-specific texts. Here, similarity between texts is measured in a vector space. As an alternative, another technique has recently emerged that adapts LLMs using the connections among items in knowledge graphs, known as either KAG (Knowledge Augmented Generation) [
18] or graph RAG (Graph Retrieval-Augmented Generation) [
19].
While the applications of LLMs and knowledge graphs have advanced in general, practical use appears limited mainly to simple applications of LLMS in searching and extracting numerical information in materials science. Knowledge graphs are not familiar to materials scientists. For practical use of these techniques in materials science, the applicability of the techniques to users’ individual objects without coding skills would be key. In this article, we describe the usability of knowledge graphs, especially for material property relationships, and show an example of how to construct knowledge graphs on material property relationships of users’ interests with generative LLMs and without coding.
2. Knowledge Graph on Materials Property Relationships
Among knowledge graphs in materials science, we focused on a graph representing relationships between material properties that are derived from scientific principles, rather than from correlations between numerical data. Because these relationships are based on scientific principles rather than empirical data, they can be applied to materials that have not yet been reported.
Figure 2a shows a schematic example of a knowledge graph of material property relationships, where only relationships—not property values—are stored as information.
We proposed the utilization of a knowledge graph of material property relationships [
20] well before the release of ChatGPT, or even that of BERT [
21], which uses a transformer model with self-attention and was the state-of-the-art model prior to ChatGPT. Techniques for utilizing the knowledge graph were patented under NIMS [
22]. The construction of the knowledge graph on material property relationships using NLP, along with the development of a prototype search system, was carried out in collaboration with a company using several textbooks in materials science [
23]. Due to the technical limitations of natural language processing at the time, the prototype was built using older techniques such as morphological analysis and parsing. However, this approach brought one significant advantage—even in the current era of generative AI, such as ChatGPT—in that it allows citation of references for any relationship within the documents used to construct the graph, even when the source texts are not in HTML format. The method for extracting relationships from texts is schematically illustrated in
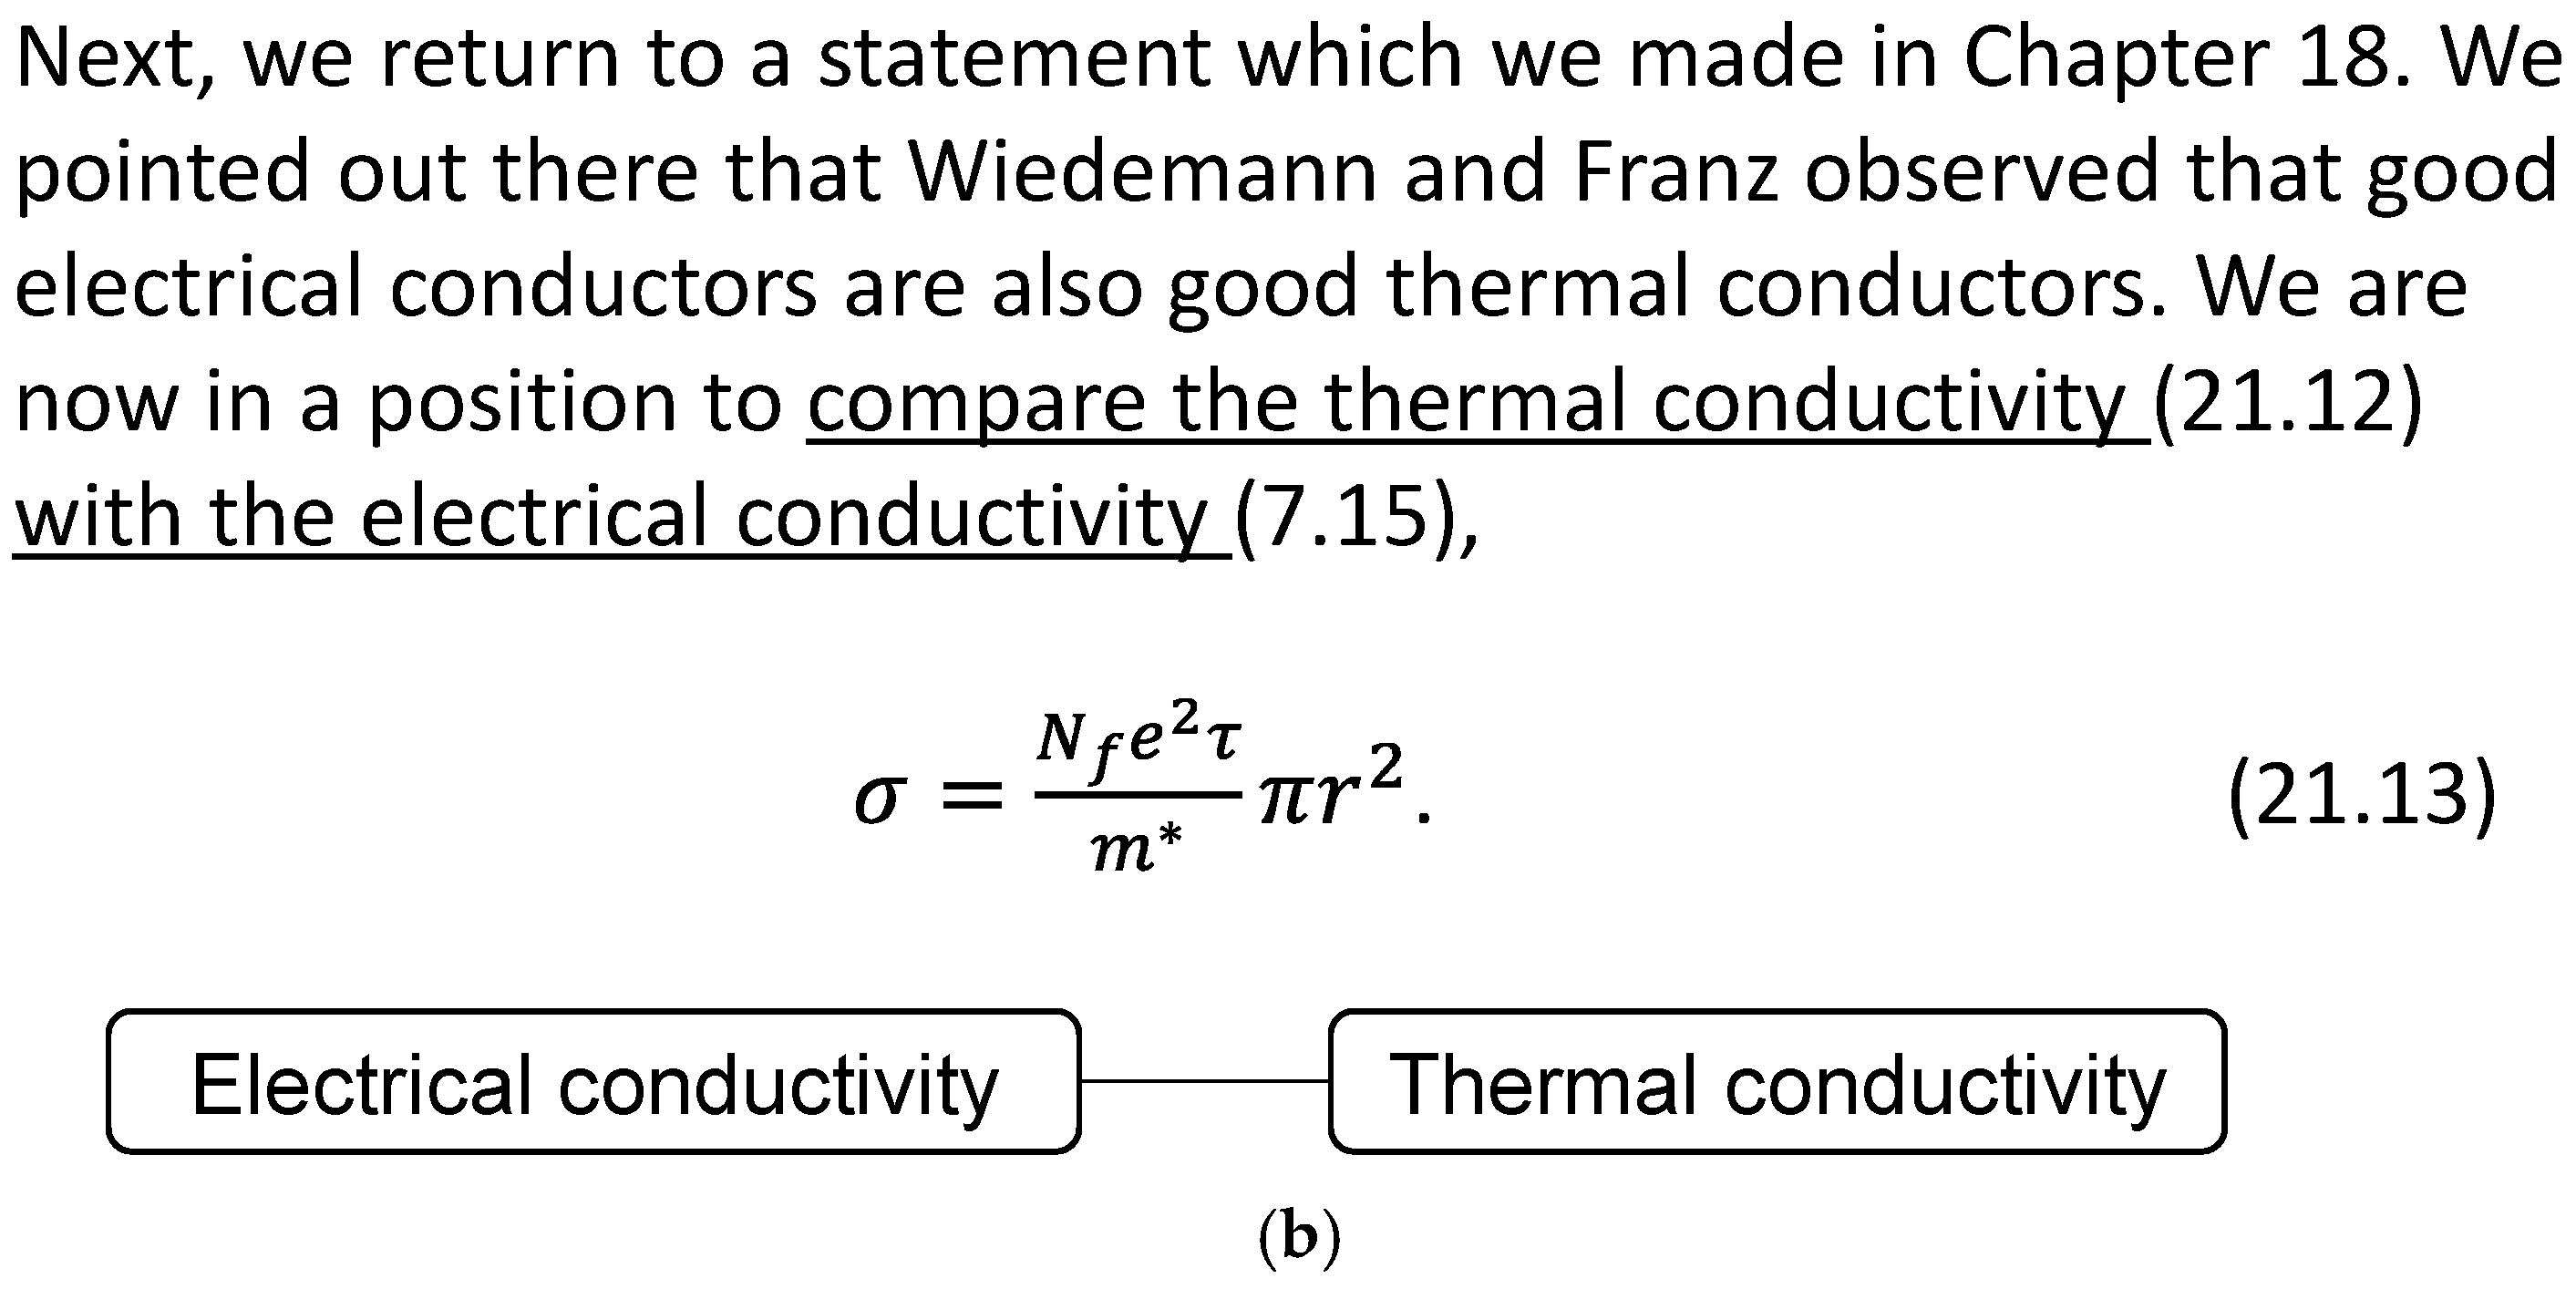
Figure 2b. For example, from the phase “compare the thermal conductivity (21.12) with the electrical conductivity”, the material properties “electrical conductivity” and “thermal conductivity” are identified as related. After preprocessing the documents (e.g., converting PDFs to text, removing unnecessary contents such as page numbers, and performing entity matching), phrases that connect two material property names (using a predefined dictionary of material property names, which serve as graph nodes) were automatically extracted by NLP techniques, and the two material properties were connected—creating an edge between the two nodes.
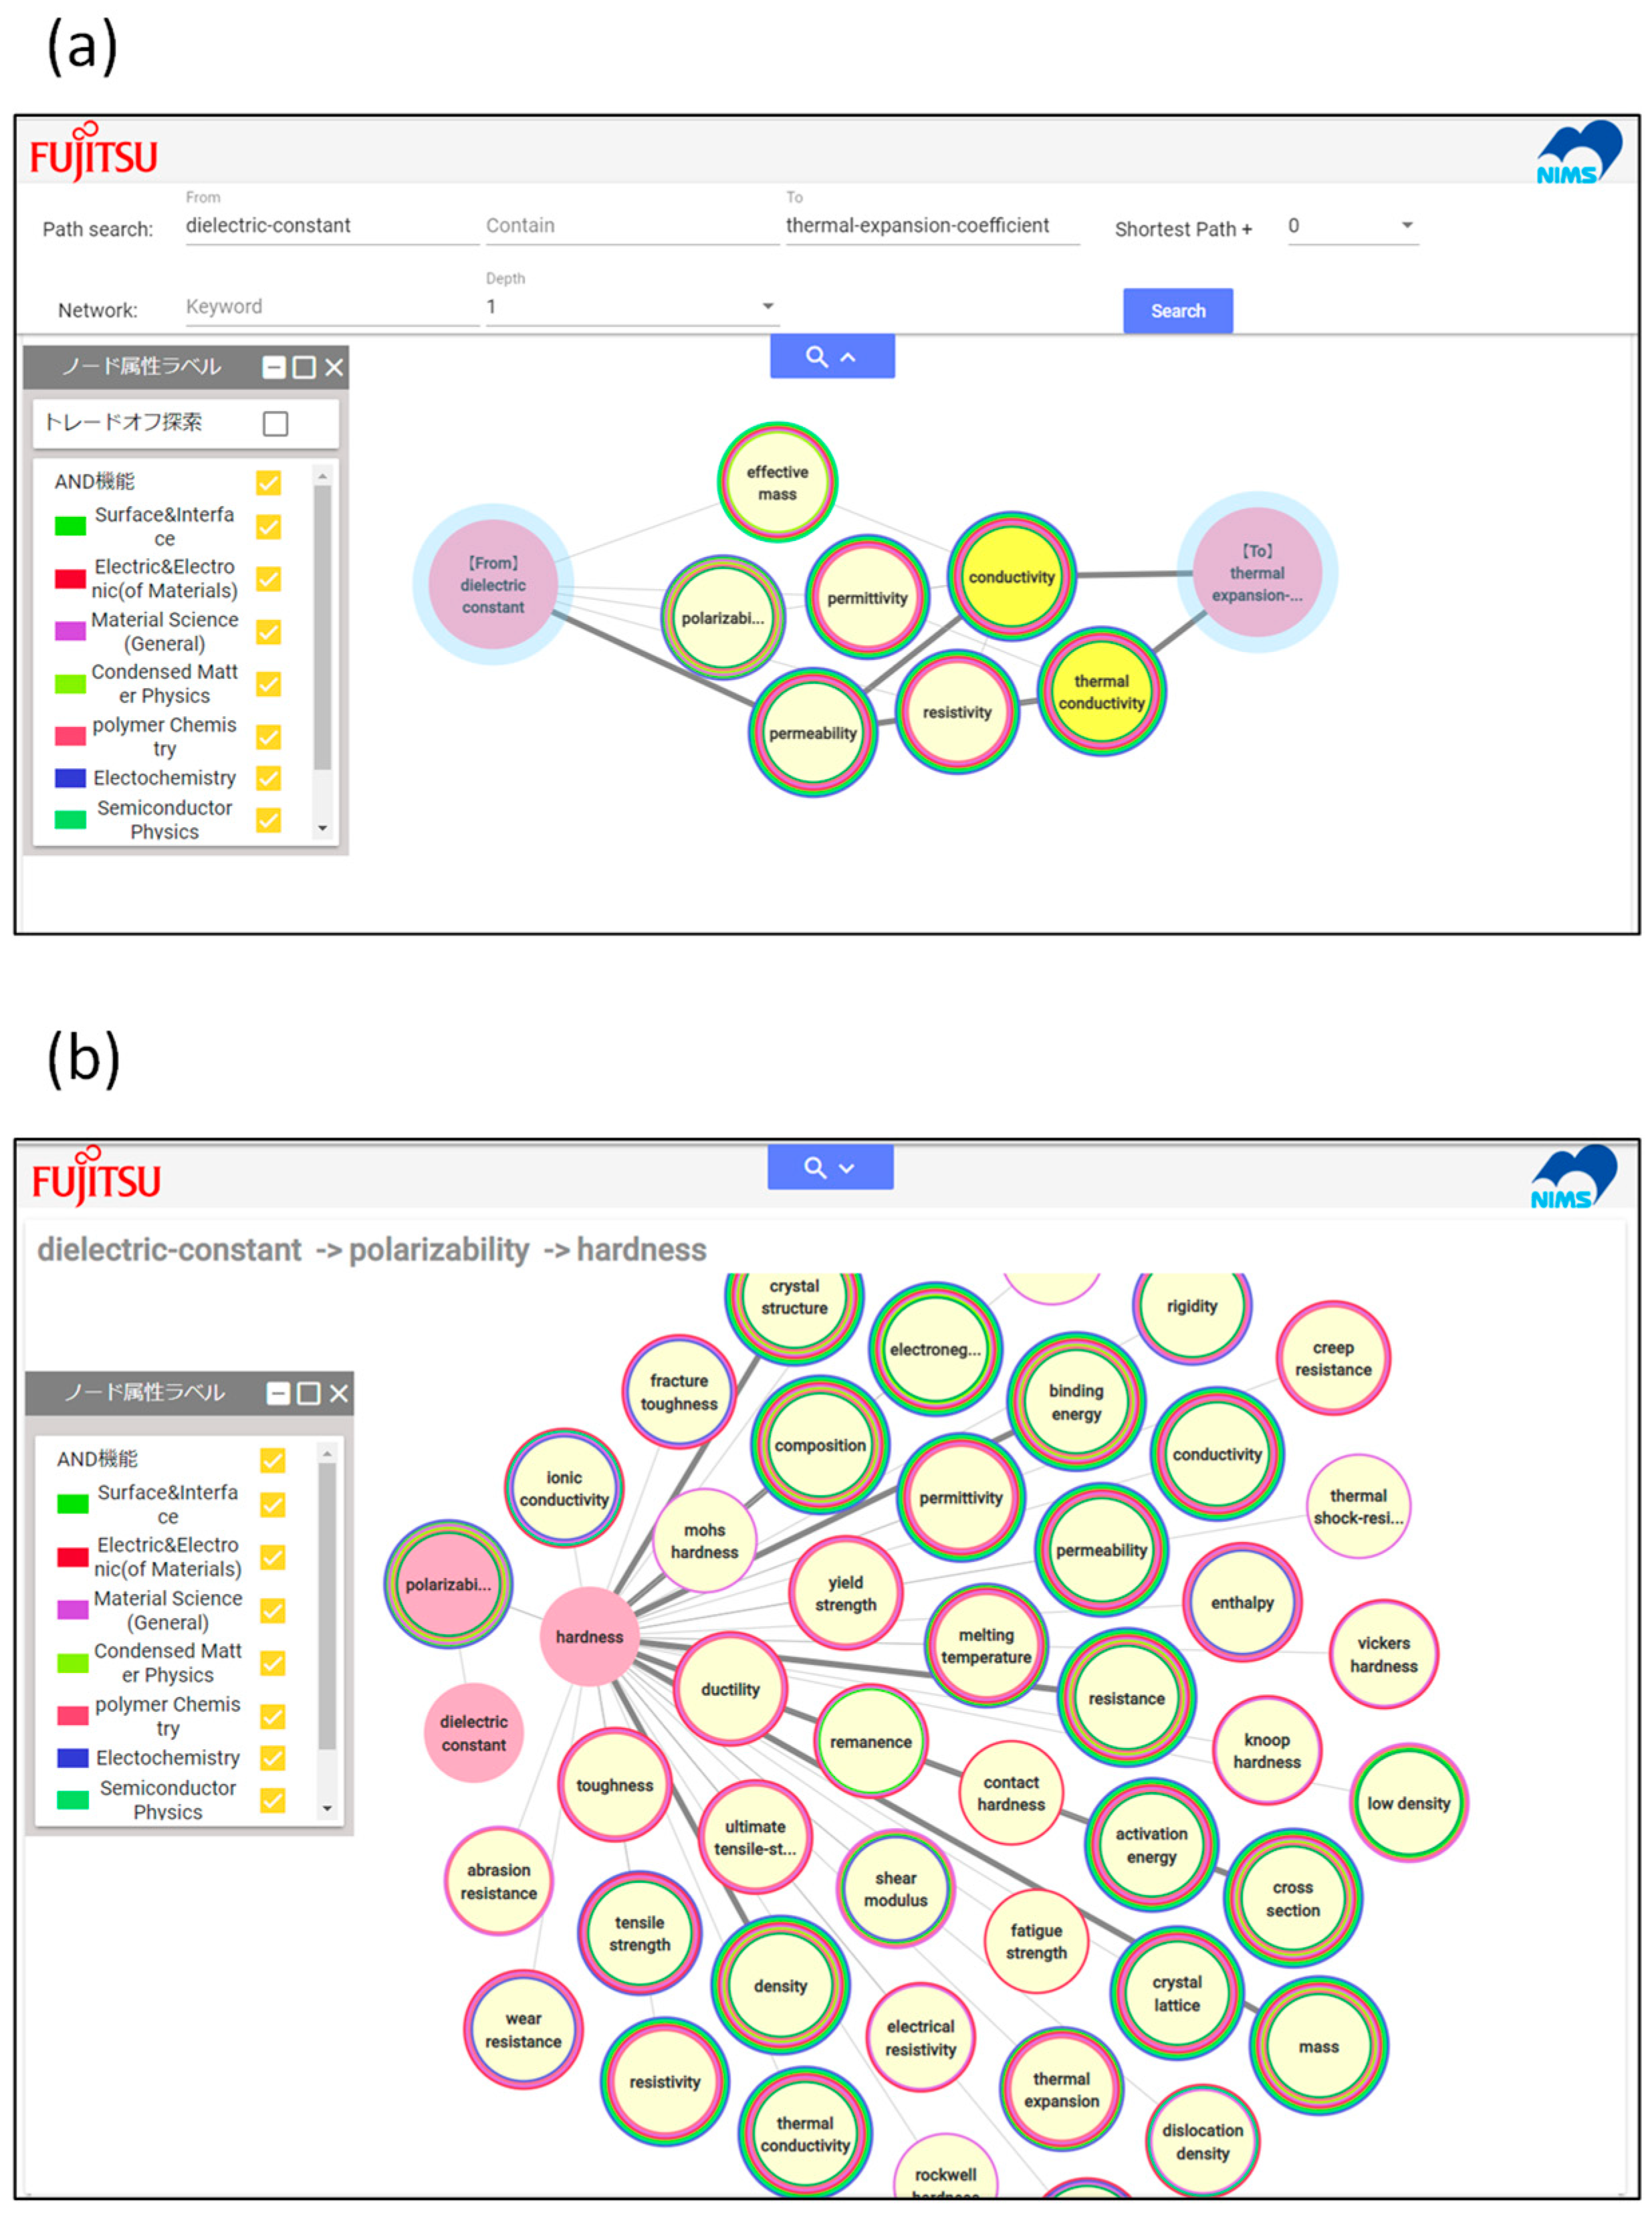
Examples of search results in the prototype system [
23] are shown in
Figure 3. In general, there are two types of searches in graph data: path-based and connectivity-based.
Figure 3a shows an example of a path search, where the shortest path between two material properties, “dielectric constant” and “thermal expansion coefficient”, is displayed. An example of a connection search is shown in
Figure 3b, where material properties connected to “dielectric constant” are sequentially retrieved (dielectric constant -> polarizability -> hardness -> many properties shown in pale yellow nodes). Path search is particularly useful when addressing trade-offs between two properties: identifying material properties that lie along the paths between the two can provide insights into why these two properties are in trade-offs, or how such trade-offs might be avoided. Connection search, on the other side, is useful for identifying material properties that can potentially substitute the original material properties—especially in cases where no numerical data are available.
It should be noted that textbooks, not scientific articles, are used to construct this knowledge graph. Textbooks describe material property relationships not based on numerical data but on scientific principles or scientific reasoning. These scientific principles, of course, were established with the help of experimental numerical data in the past, but textbooks give scientific reasons to explain relationships. Relationships with scientific reasoning provide great advantages: (1) the relationships can apply beyond materials with numerical data; (2) materials that cannot be applied to the relationships are clearly defined. Furthermore, the prototype knowledge graph shows a sentence that describes relationships in the textbooks by clicking the corresponding edge [
23], where users can see the reasoning of the relationships and the limitations of the relationship applications by reading the corresponding paragraphs in the textbooks.
3. Application of Materials Property Knowledge Graph to Data Science
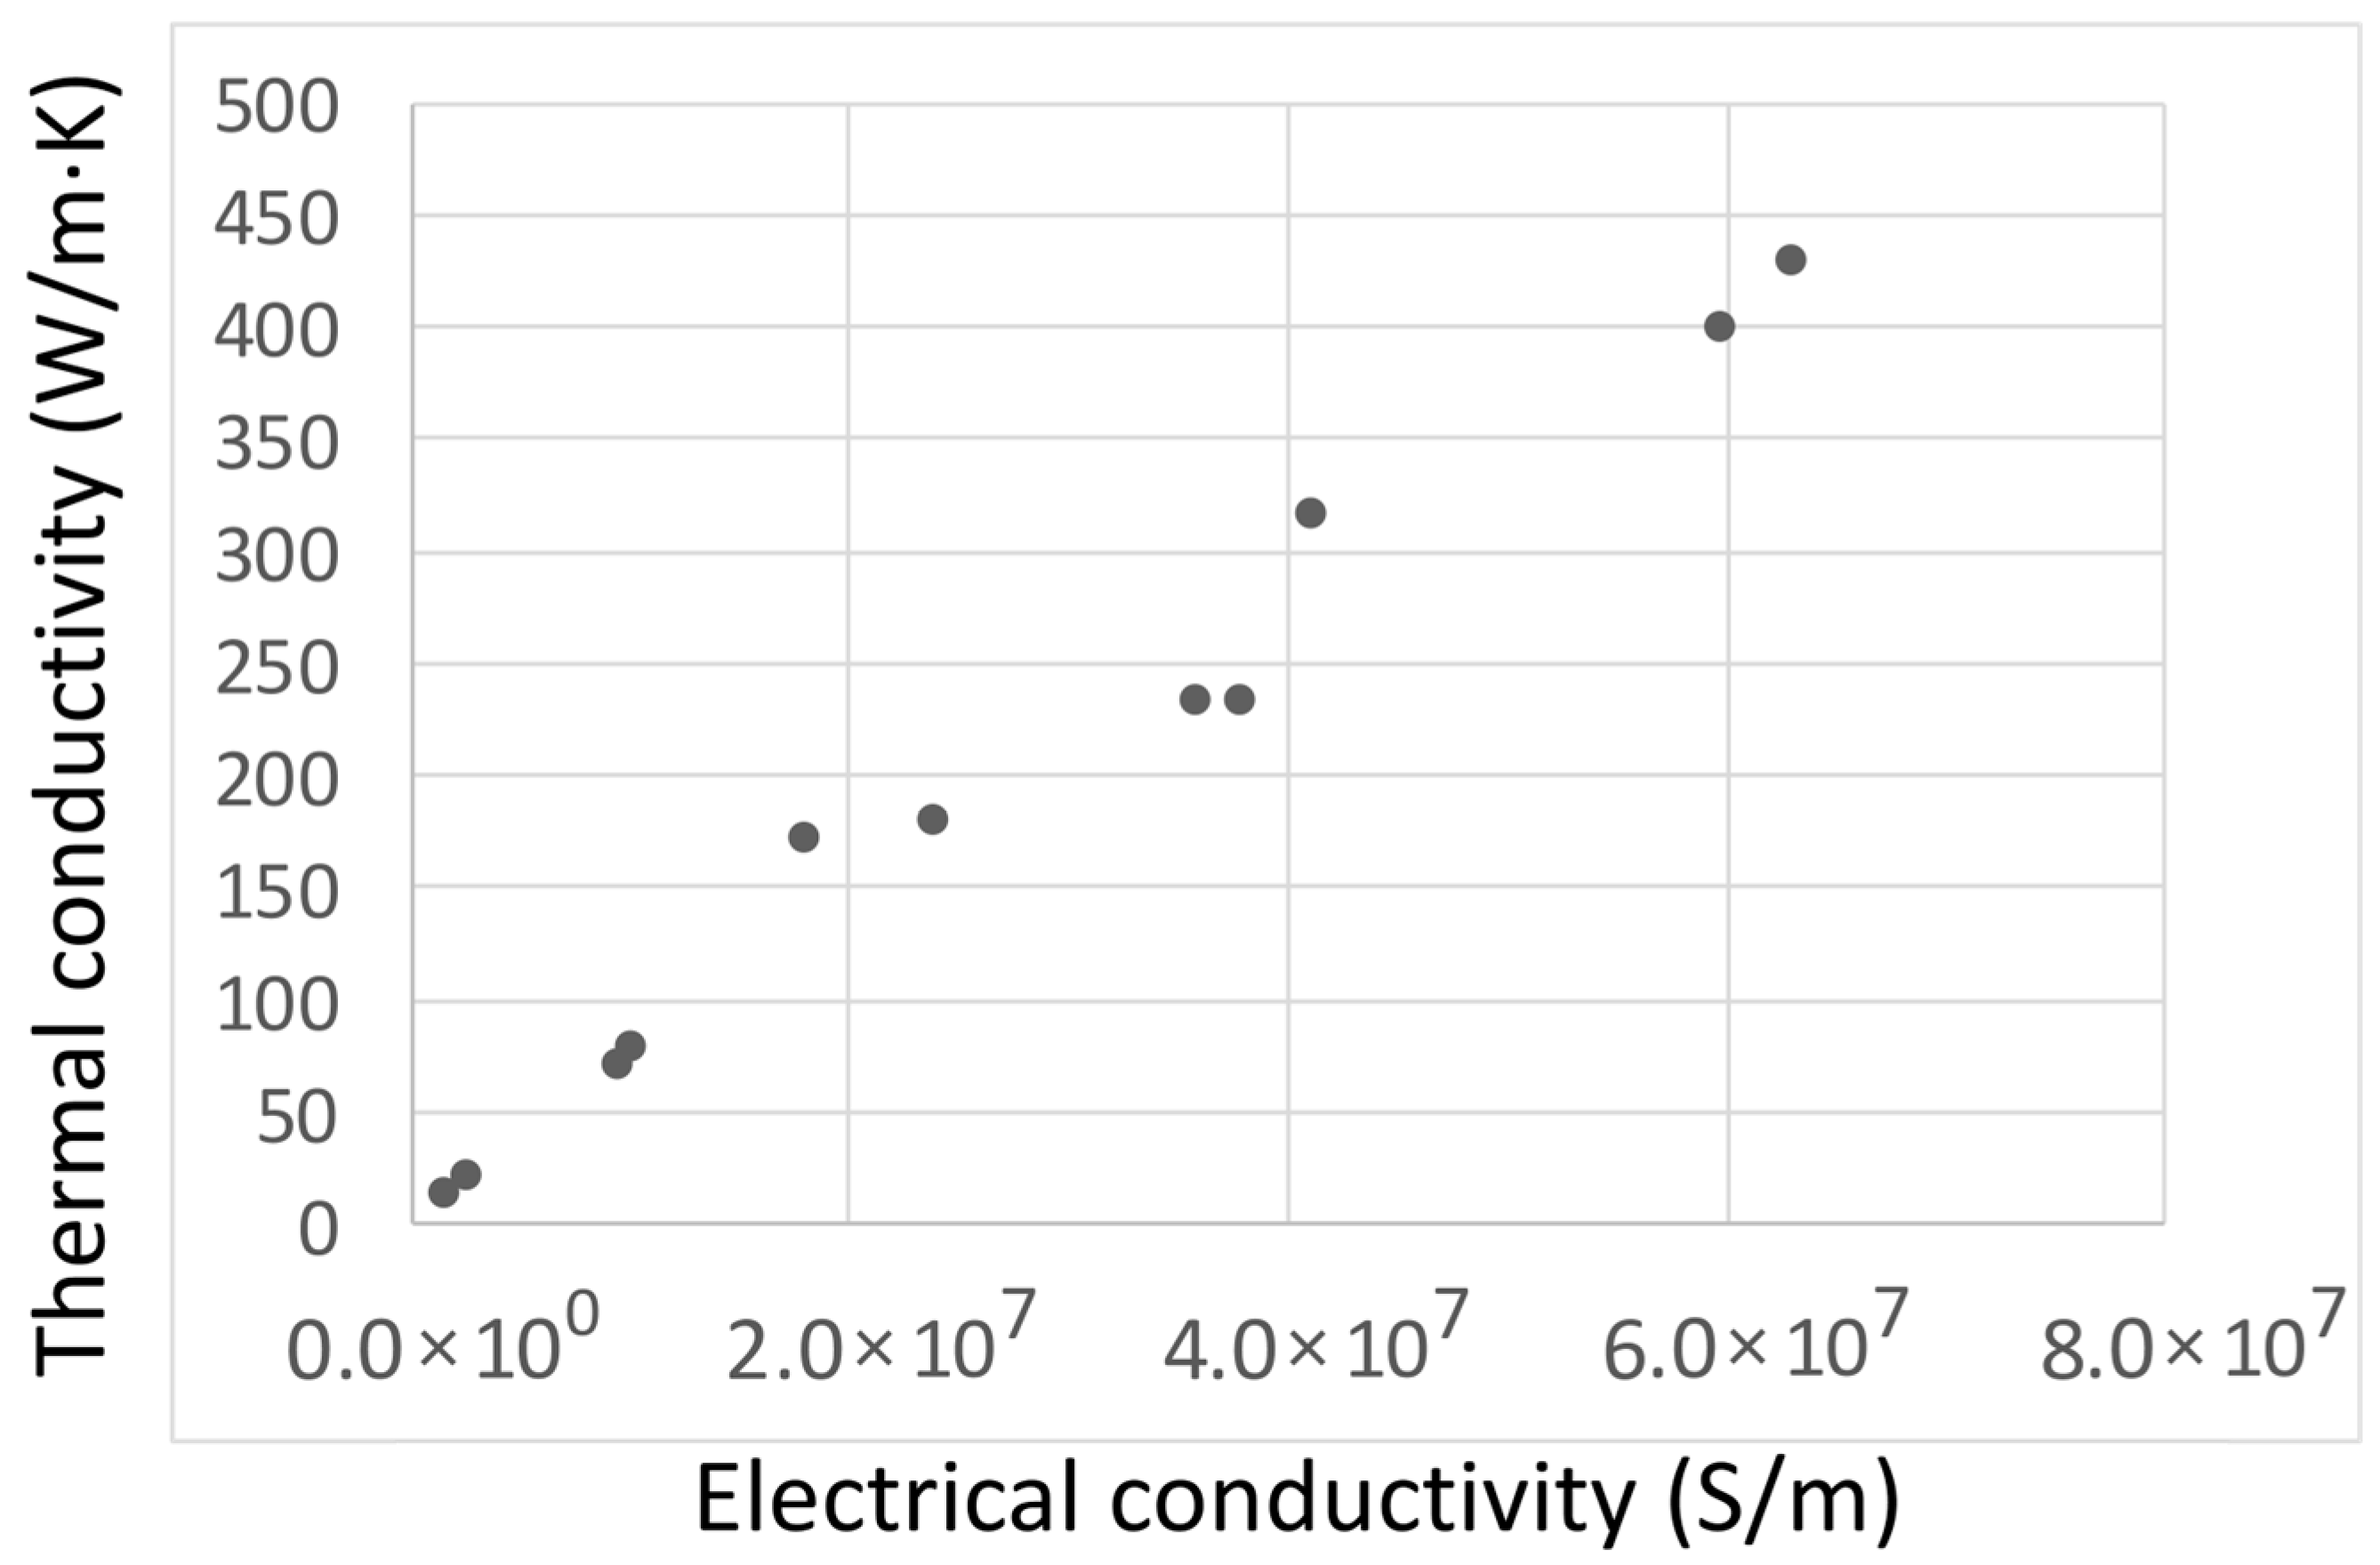
The simplest application of the materials property knowledge graph is probably the estimation of missing numerical data using known relationships. For example, there is a linear relationship between electrical conductivity and thermal conductivity in metallic materials—as electrons are the main heat carrier—as illustrated in
Figure 2b from a physical principles perspective. Indeed, a strong linear correlation is observed in the experimentally obtained numerical data for these two properties (data taken from [
25,
26,
27,
28,
29,
30,
31]), as shown in
Figure 4.
One of the biggest problems in materials informatics using numerical values is the lack of numerical data. For example, regarding thermal conductivity, alloying Cu with additive elements in a small amount to improve the strength of electric wire in thin film form is a common technique. Although the electric conductivity of the alloyed material is measured (to be used as an electric wire), there is no numerical data on thermal conductivity for such alloyed materials whose additives are in small amounts for each. This is because measuring thermal conductivity is far more difficult compared to electrical conductivity due to the difficulty of thermal isolation from the environment, resulting in a lack of experimental data for alloys containing many minor additive elements in general. However, thermal conductivity is important in electric wire because the heat generated by the electric current should be released through thermal conduction to avoid heat damage to surrounding devices. Therefore, it is advantageous to know the scientific relationship between electrical conductivity and thermal conductivity without numerical data in related materials, so that the thermal conductivity values of alloyed materials with small additives can be estimated. The biggest merit of using a material property relationship knowledge graph is that the relationship is extended to materials where there is little or no numerical data in similar or related materials.
This example demonstrates that the interpolation of numerical values is possible using the materials property knowledge graph, even when experimental data are nearly absent.
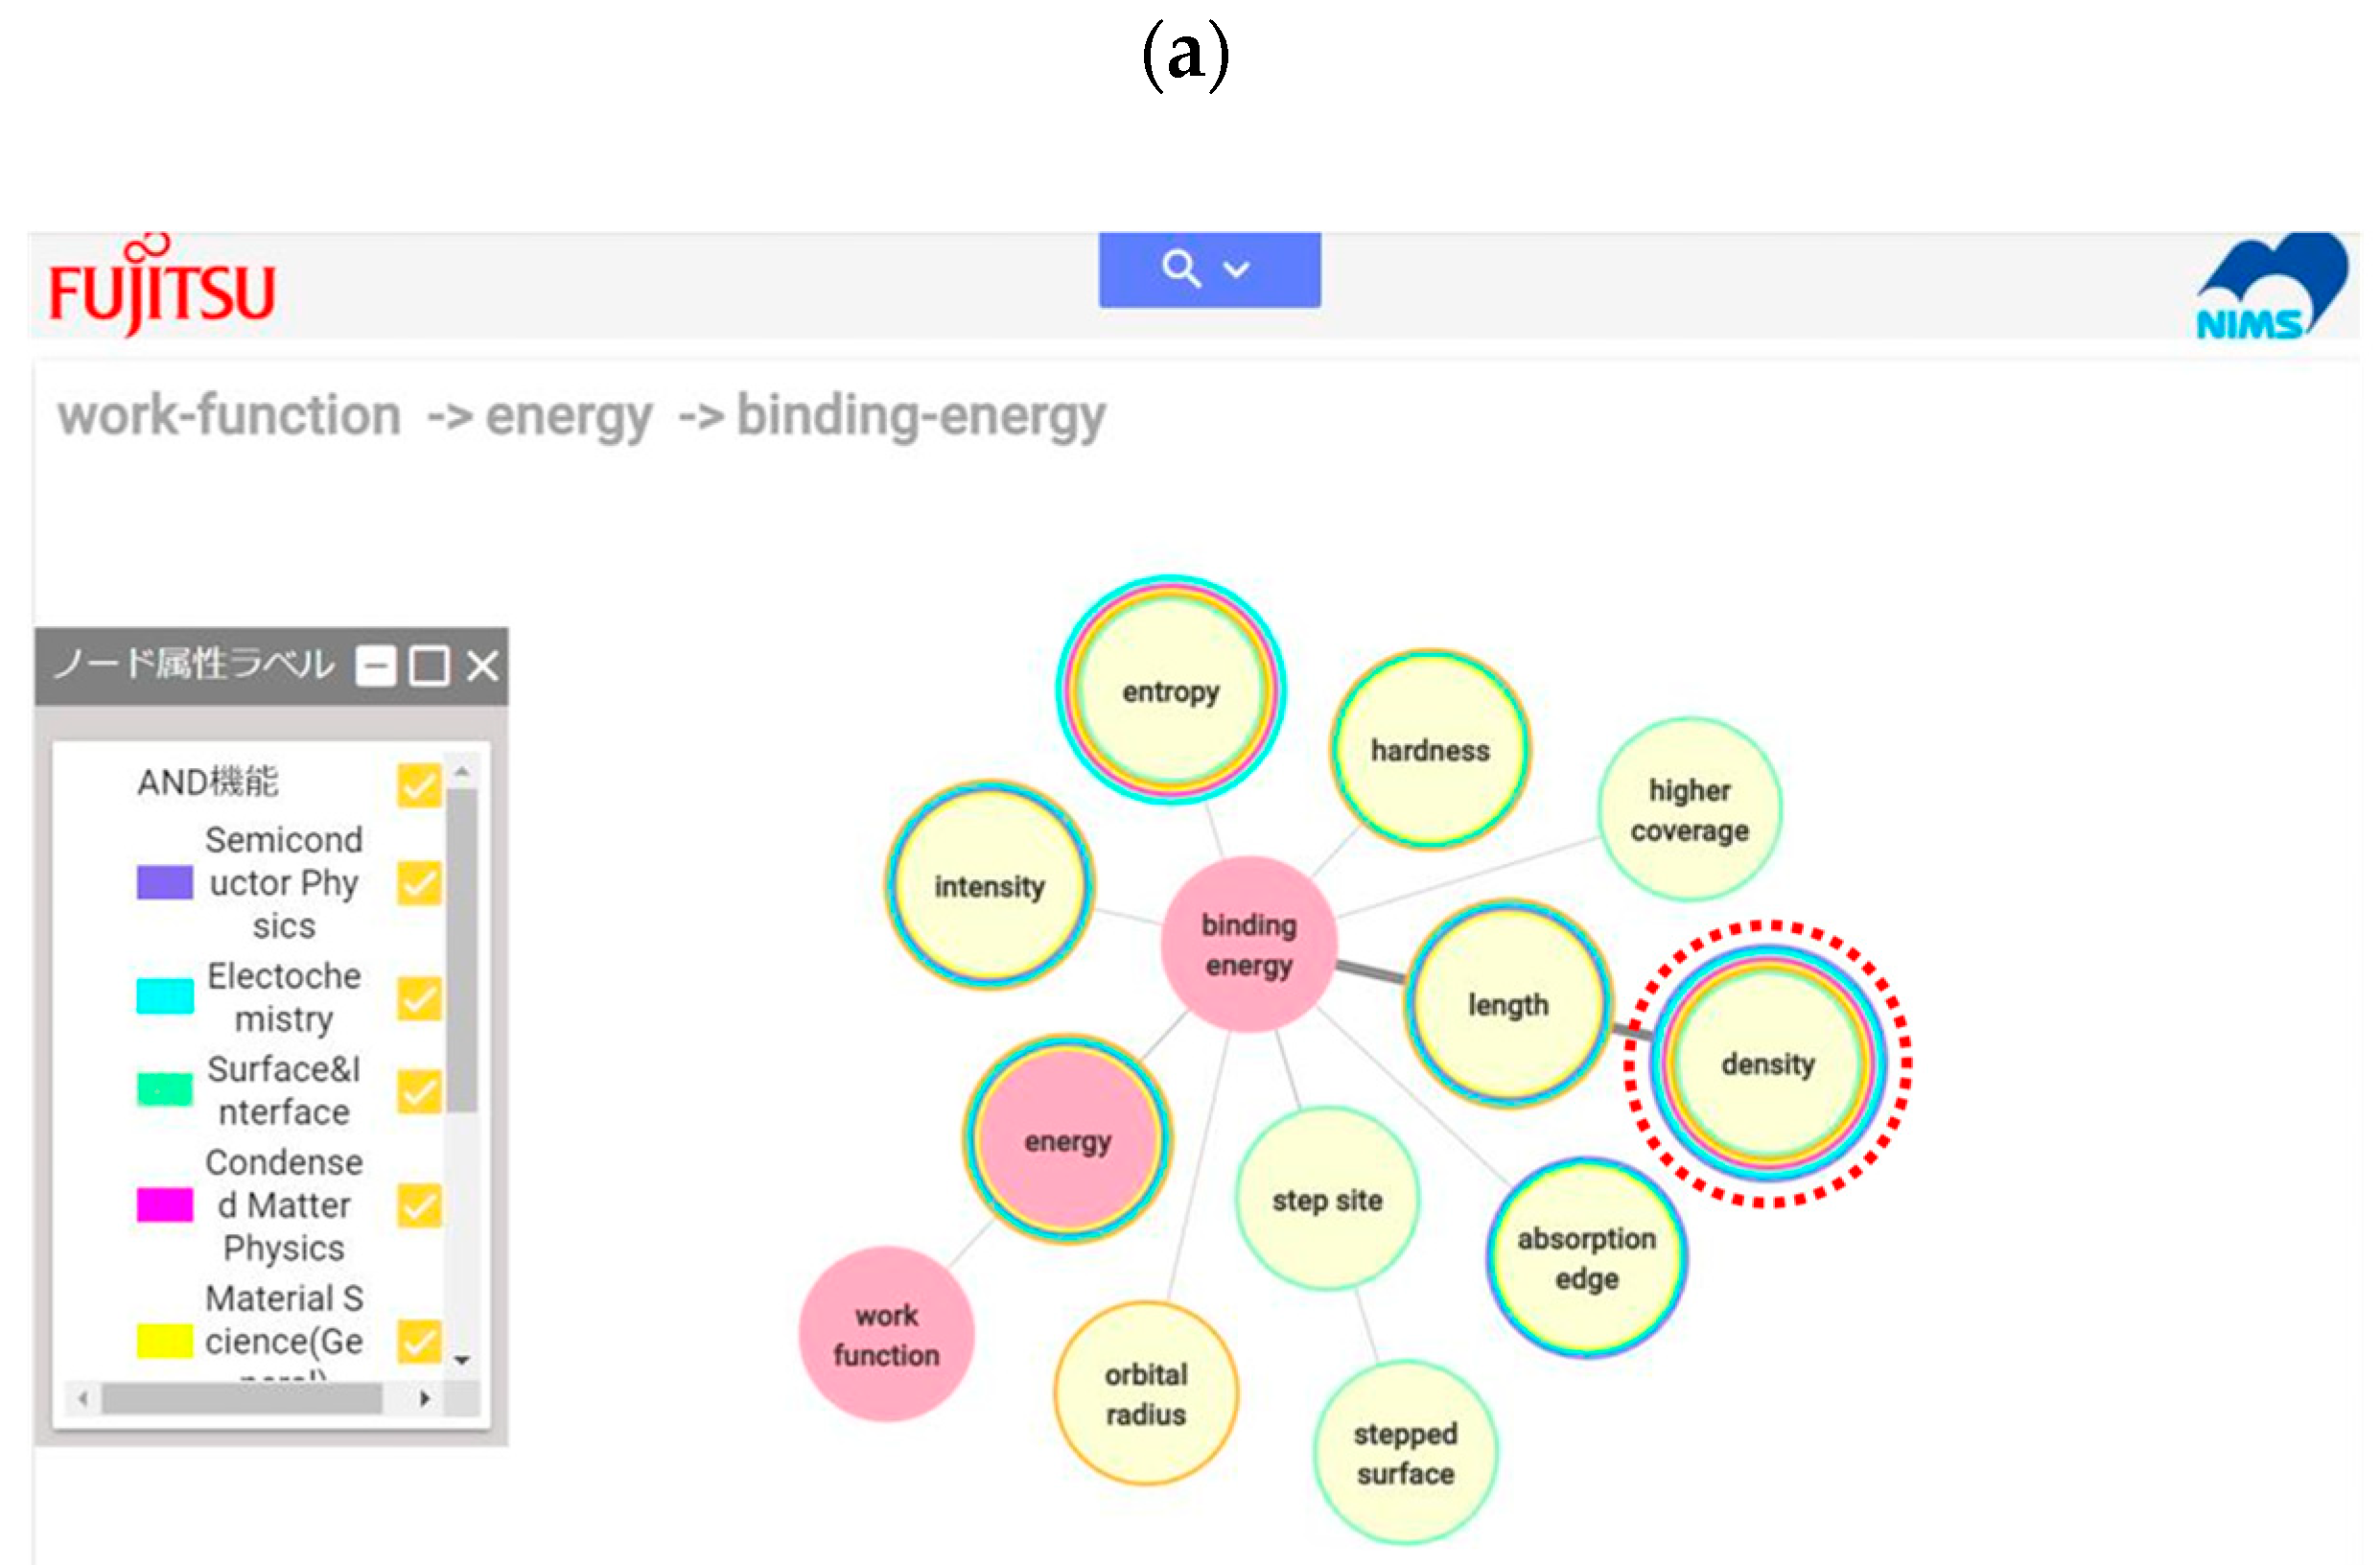
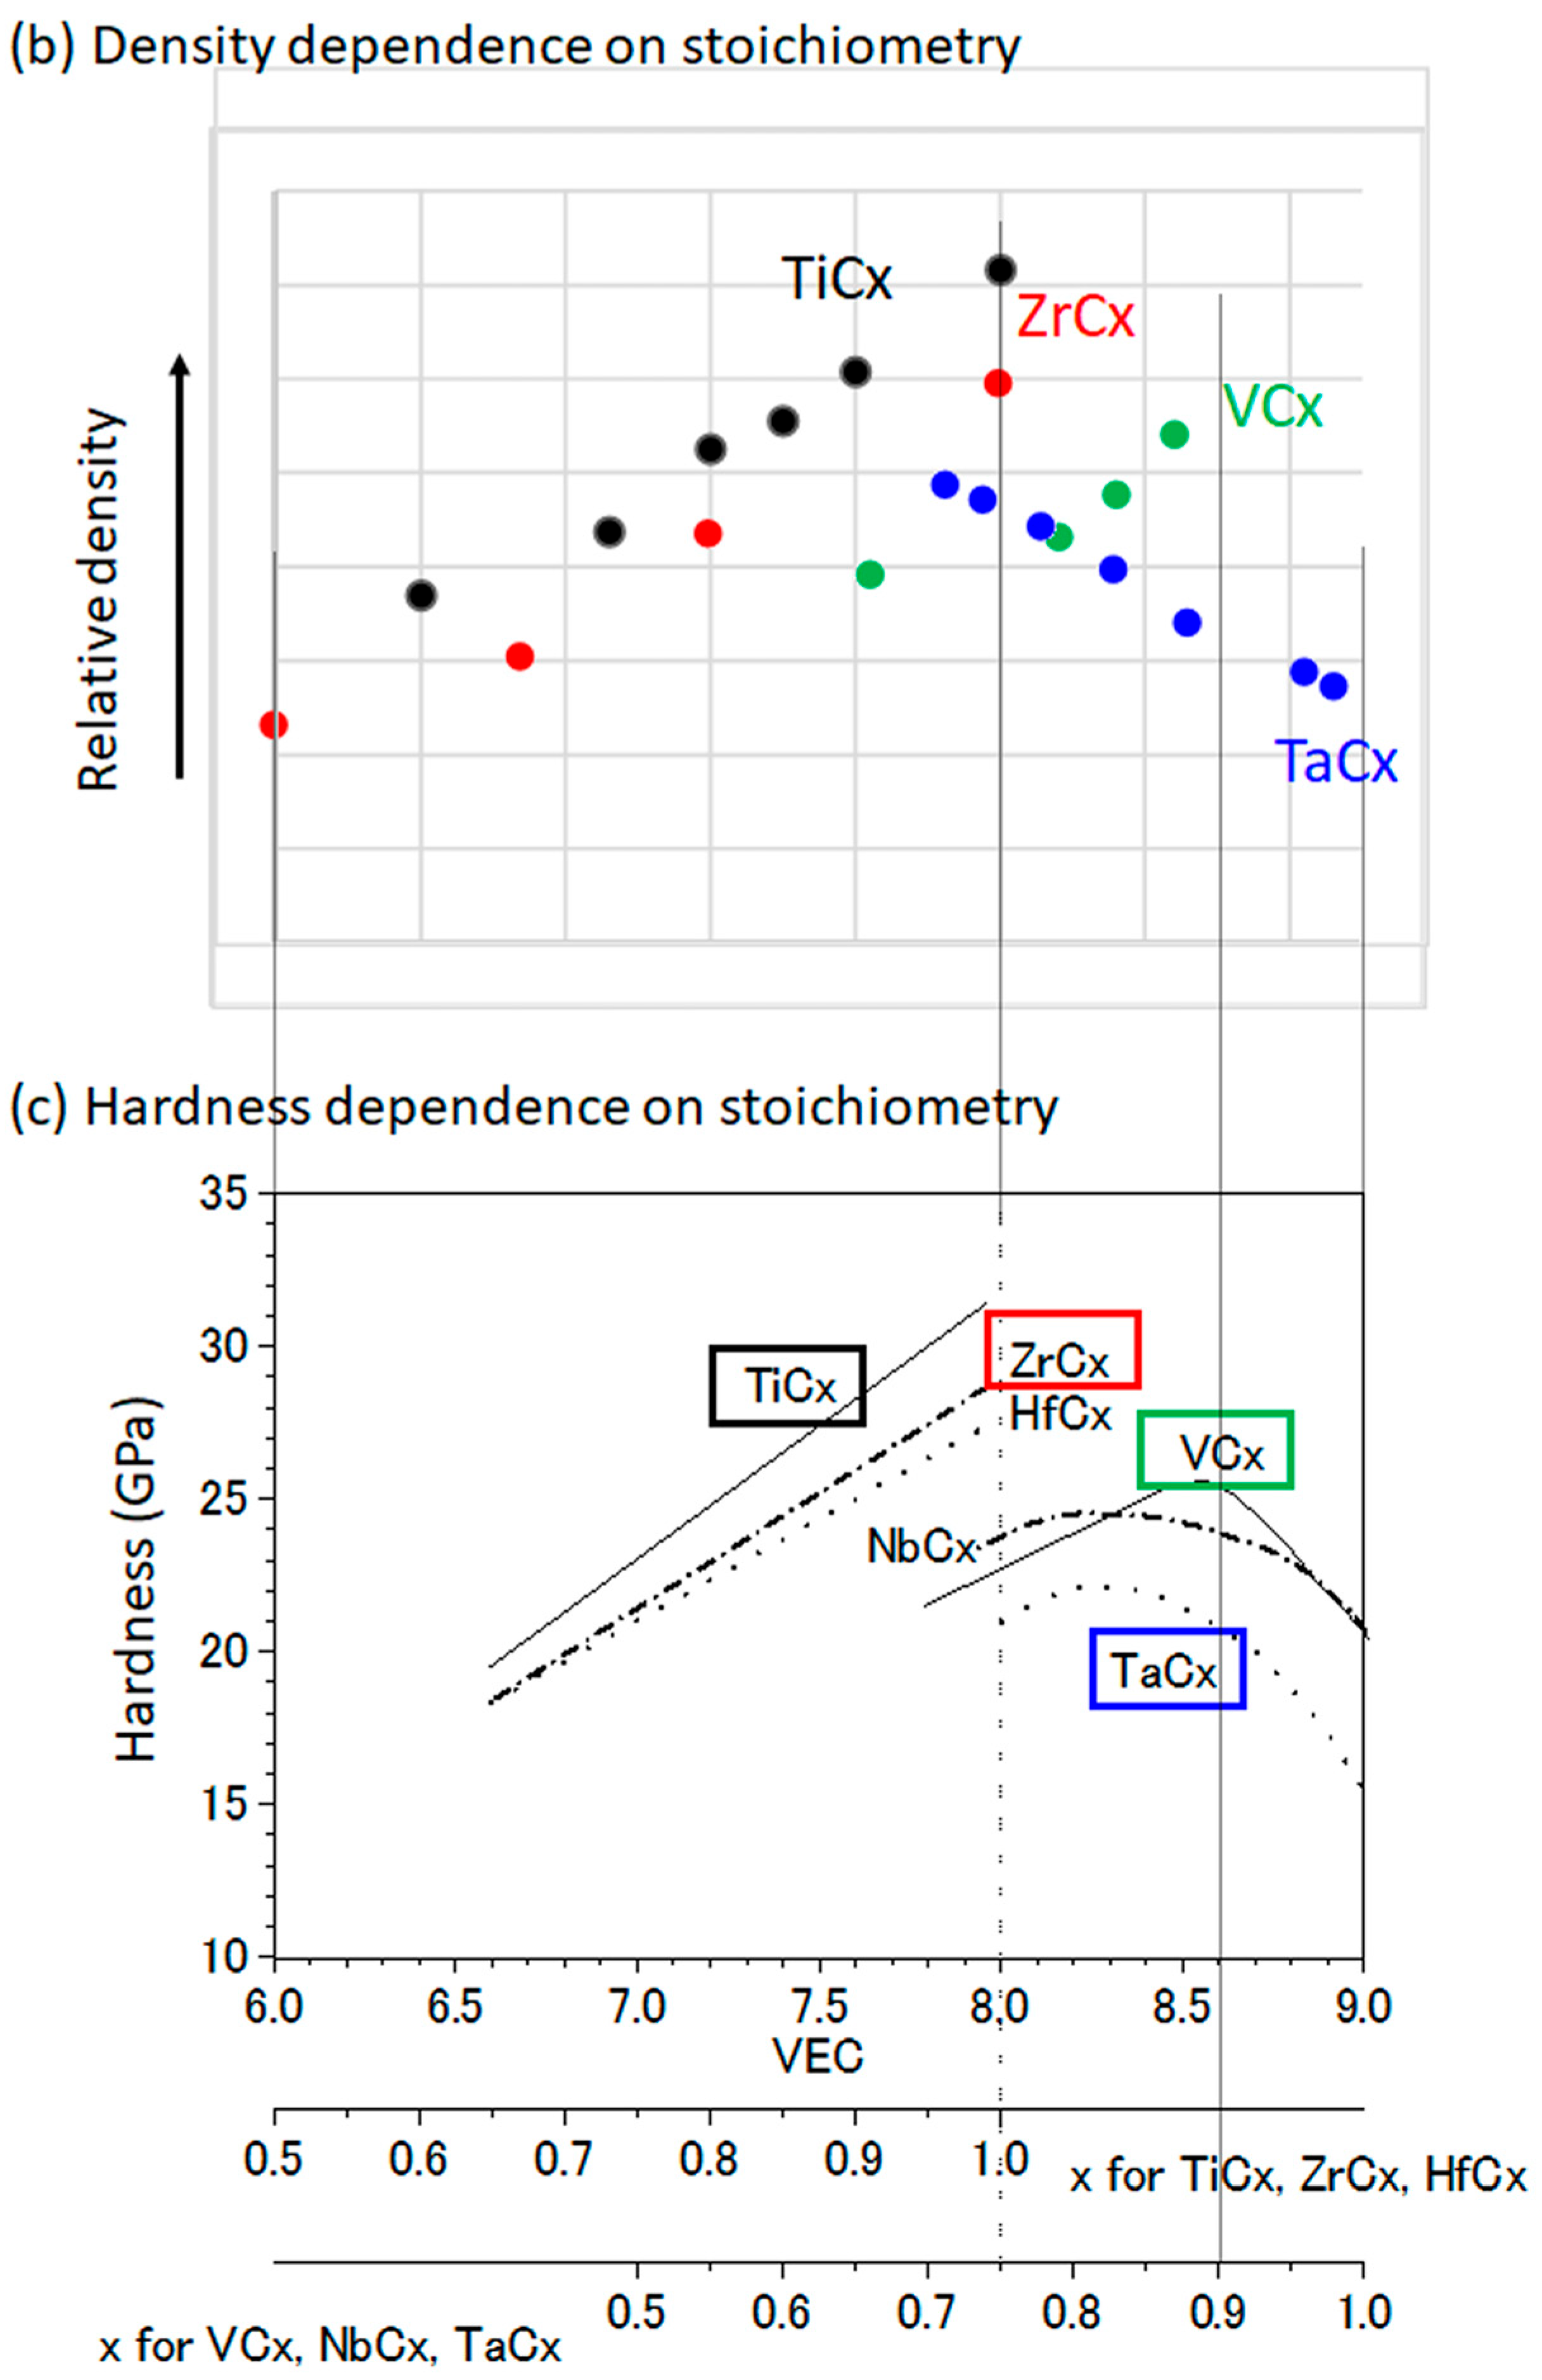
Another application of the materials property knowledge graph is identifying a material property that can be used as a descriptor for machine learning. Since the values of “work function” in carbon-deficient transition metal carbides are not available in a database or are difficult to measure, the author attempted to find an alternative property. Initially, Vicker’s hardness was identified as a viable alternative and was successfully used to explain and predict the work function values of carbon-deficient transition metal carbides [
32]. However, through the materials property knowledge graph, the author discovered that “density” could also serve as an alternative property, as it is connected to “work function” via “bonding energy”, as shown in
Figure 5a. In fact, experimental data revealed that density variations with carbon deficiency closely resemble that variations in hardness [
33], as illustrated in
Figure 5b,c, suggesting that density could also be an alternative descriptor for the work function.
Work function is a very important property in electronics, and transition metal carbides are good for electrodes, whose function is determined by the work function. Transition metal carbides often have a carbon deficiency, and work function values are greatly influenced by carbon deficiency. However, the influence has been measured and calculated only for two materials, TaC
0.5 and HfC
0.6, where the work function increased by carbon deficiency for TaC, while it decreased for HfC. Even the direction of the influence is opposite between the two. The difficulty of reliable and repeatable work function measurements causes such conditions, making the correlation of numerical data impossible. However, with the help of the logic in the calculations for the two materials, we could find a reason for the influence of carbon deficiency on work function values and relate it to hardness [
32]. With the help of the knowledge graph, the work function is related to a more common property, density, than hardness. Hardness is only measured when researchers are interested in mechanical applications, while density (mostly calculated from XRD) is measured for almost all crystalline materials regardless of the researchers’ interest. Therefore, the number of numerical data for density is far more than that of hardness. There are many similar advantages in referring to the knowledge graph of material property relationships to overcome the shortage of experimental and simulated data.
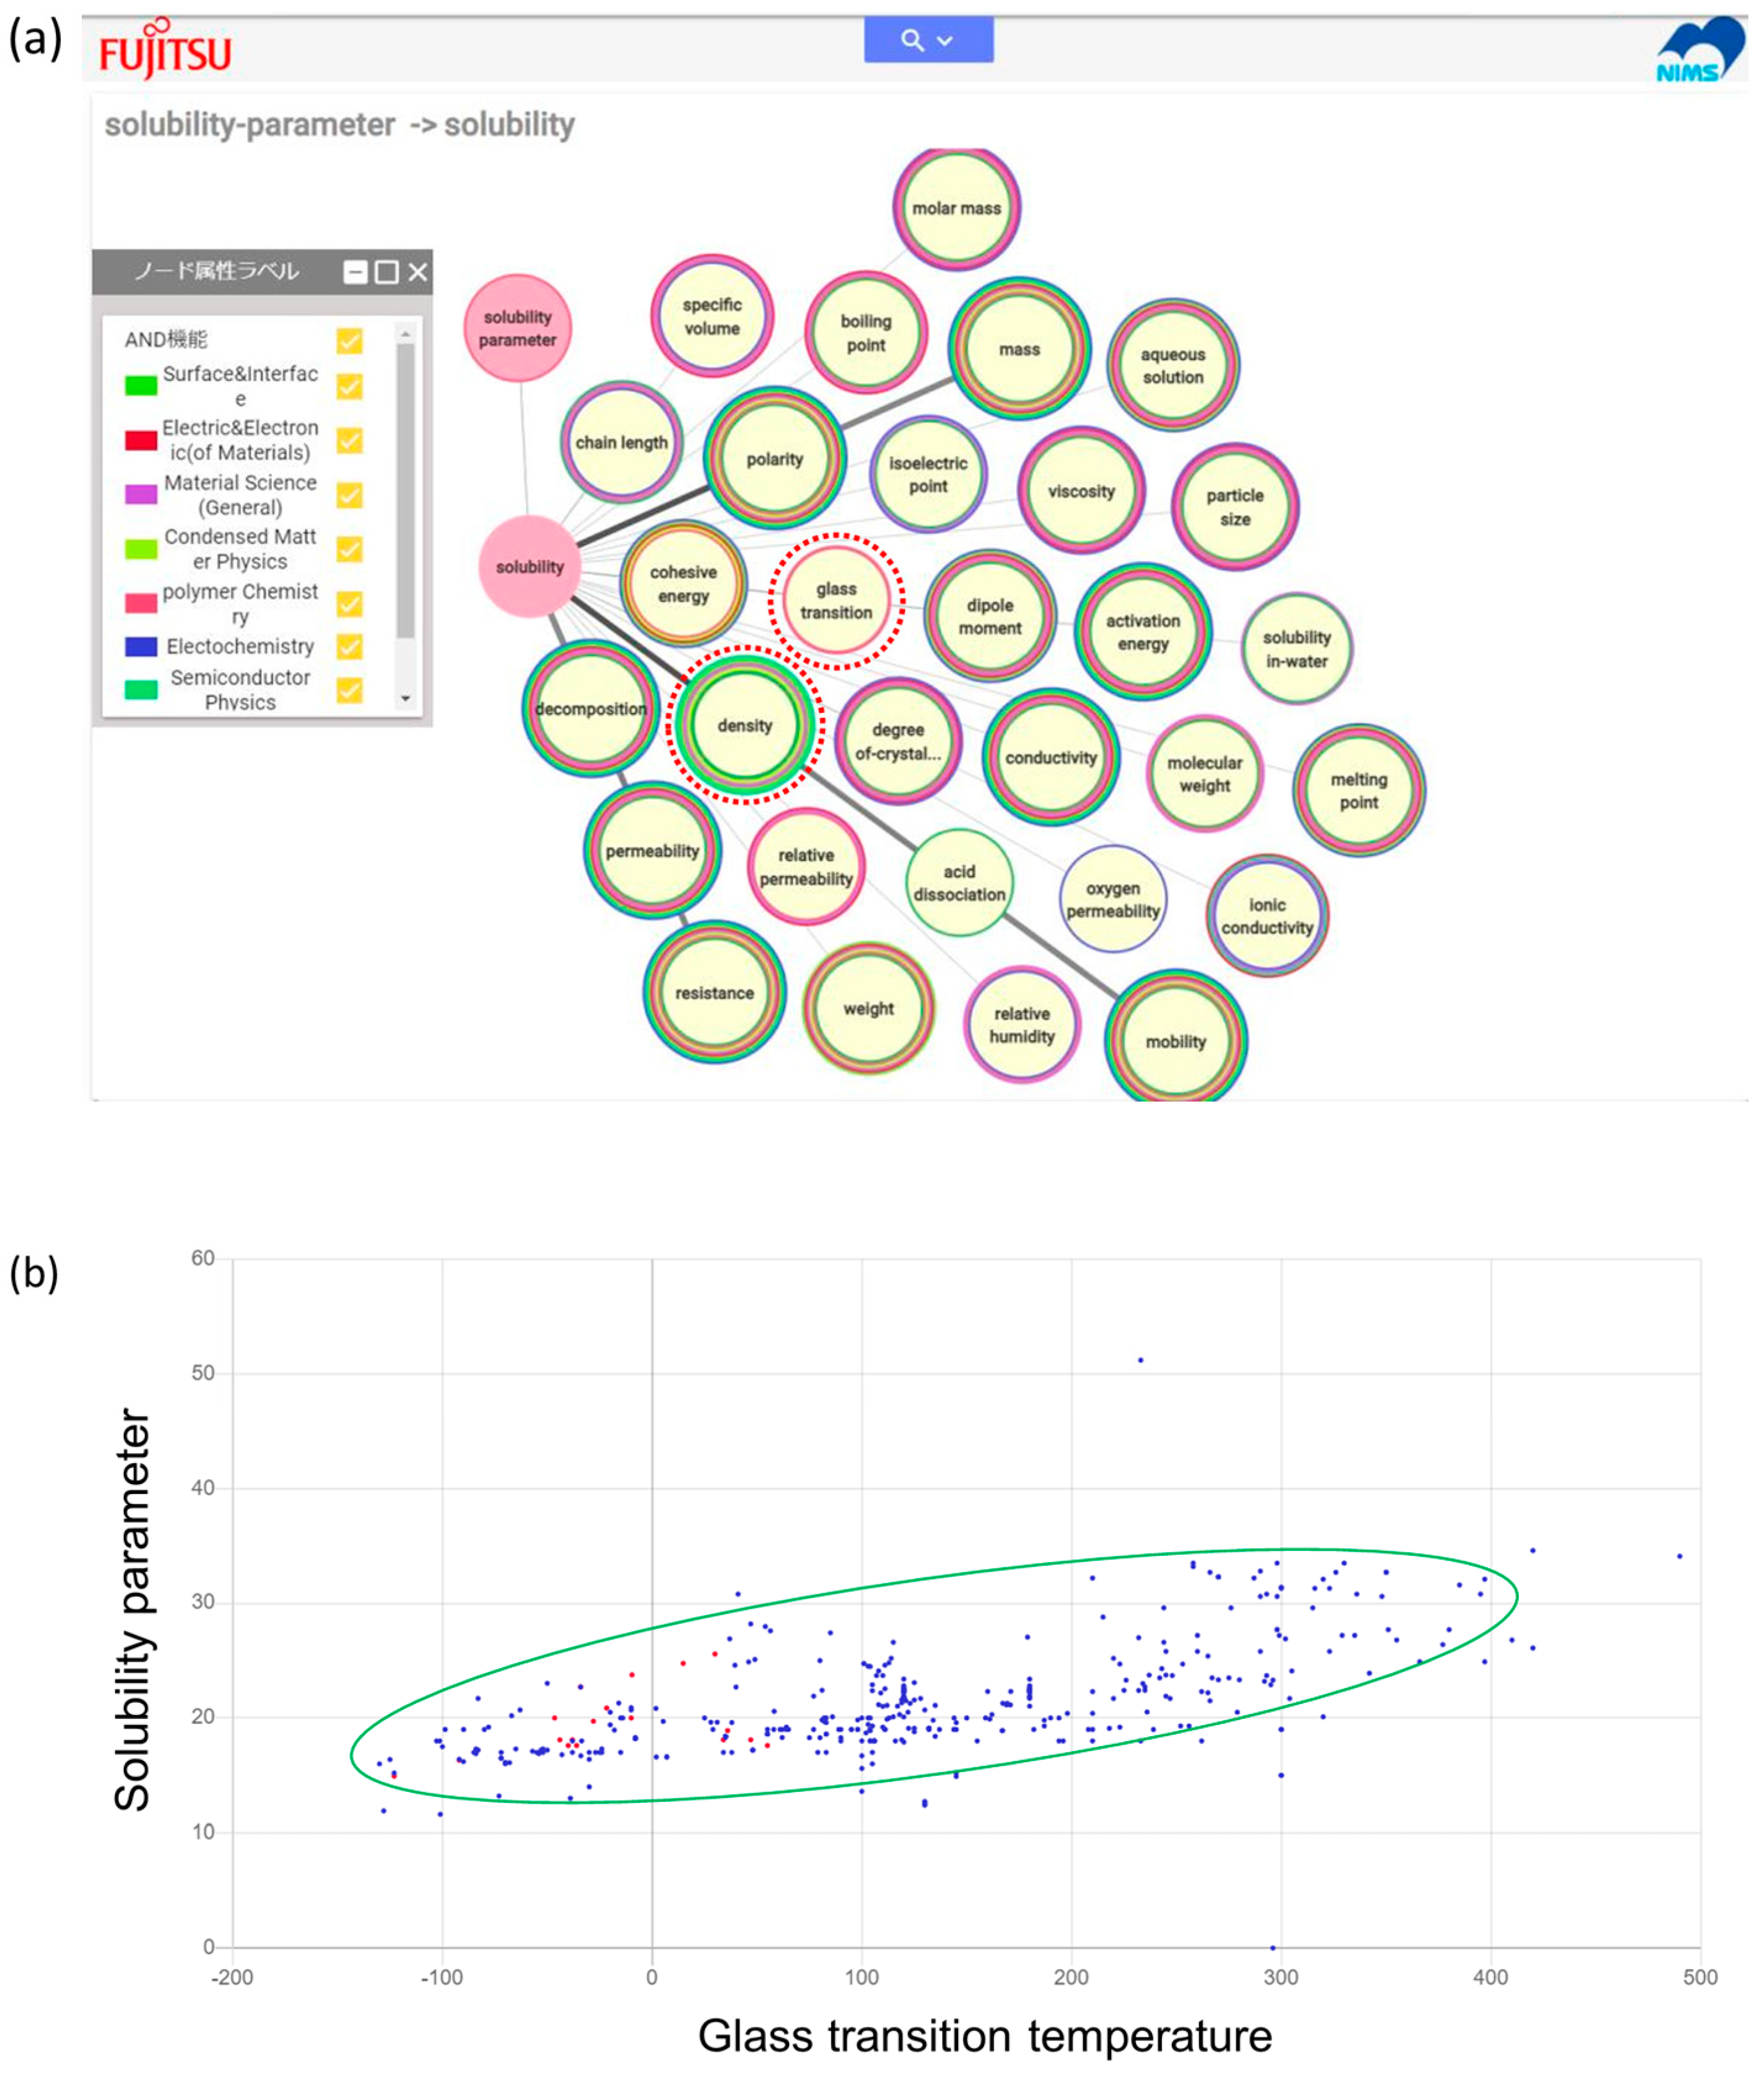
The materials property graph can also be applied to the properties of organic materials.
Figure 6a demonstrates how “solubility parameter” relates to other properties, showing that “glass transition” is one of the connected properties [
24]. From a polymer database [
34], it is evident that the solubility parameter correlates strongly with the glass transition temperature, as shown in
Figure 6b. This correlation suggests that the “glass transition temperature” can be used as an alternative descriptor for the “solubility parameter”, and vice versa.
4. Generation of Materials Property Knowledge Graph and Its Search Tool Using ChatGPT
The prototype developed in collaboration with the company is no longer available after the termination of the partnership. Therefore, the author attempted to develop a new materials property knowledge graph and a corresponding search system with the help of ChatGPT. Here, we demonstrate how a knowledge graph and its search tool can be generated.
To begin with, a list of material property names should be prepared. It is technically possible to construct a material property knowledge graph without such a list by performing simultaneous entity extraction and relation extraction with simply asking generative AI “Extract material property names and their mutual relationship from the uploaded textbook and make a knowledge graph from the extracted relationship”. However, preparing a list in advance results in much cleaner and more accurate knowledge graphs, with fewer errors and less noise. To create this list, generative language AIs such as ChatGPT can be employed by providing several examples of material property names (e.g., “electrical conductivity” and “thermal conductivity”). In this demonstration, we prepared a list of one hundred material property names by asking ChatGPT, “Output a list of hundred material property names such as ‘electrical conductivity’ and ‘dielectric constant’ as a text file.” Then, the names in the list were manually checked to see whether they were appropriate or not. The names on the list slightly deviate from input to input; however, all names appeared to be appropriate for the demonstration purpose. The list used for the demonstration (
List S1) is attached as a
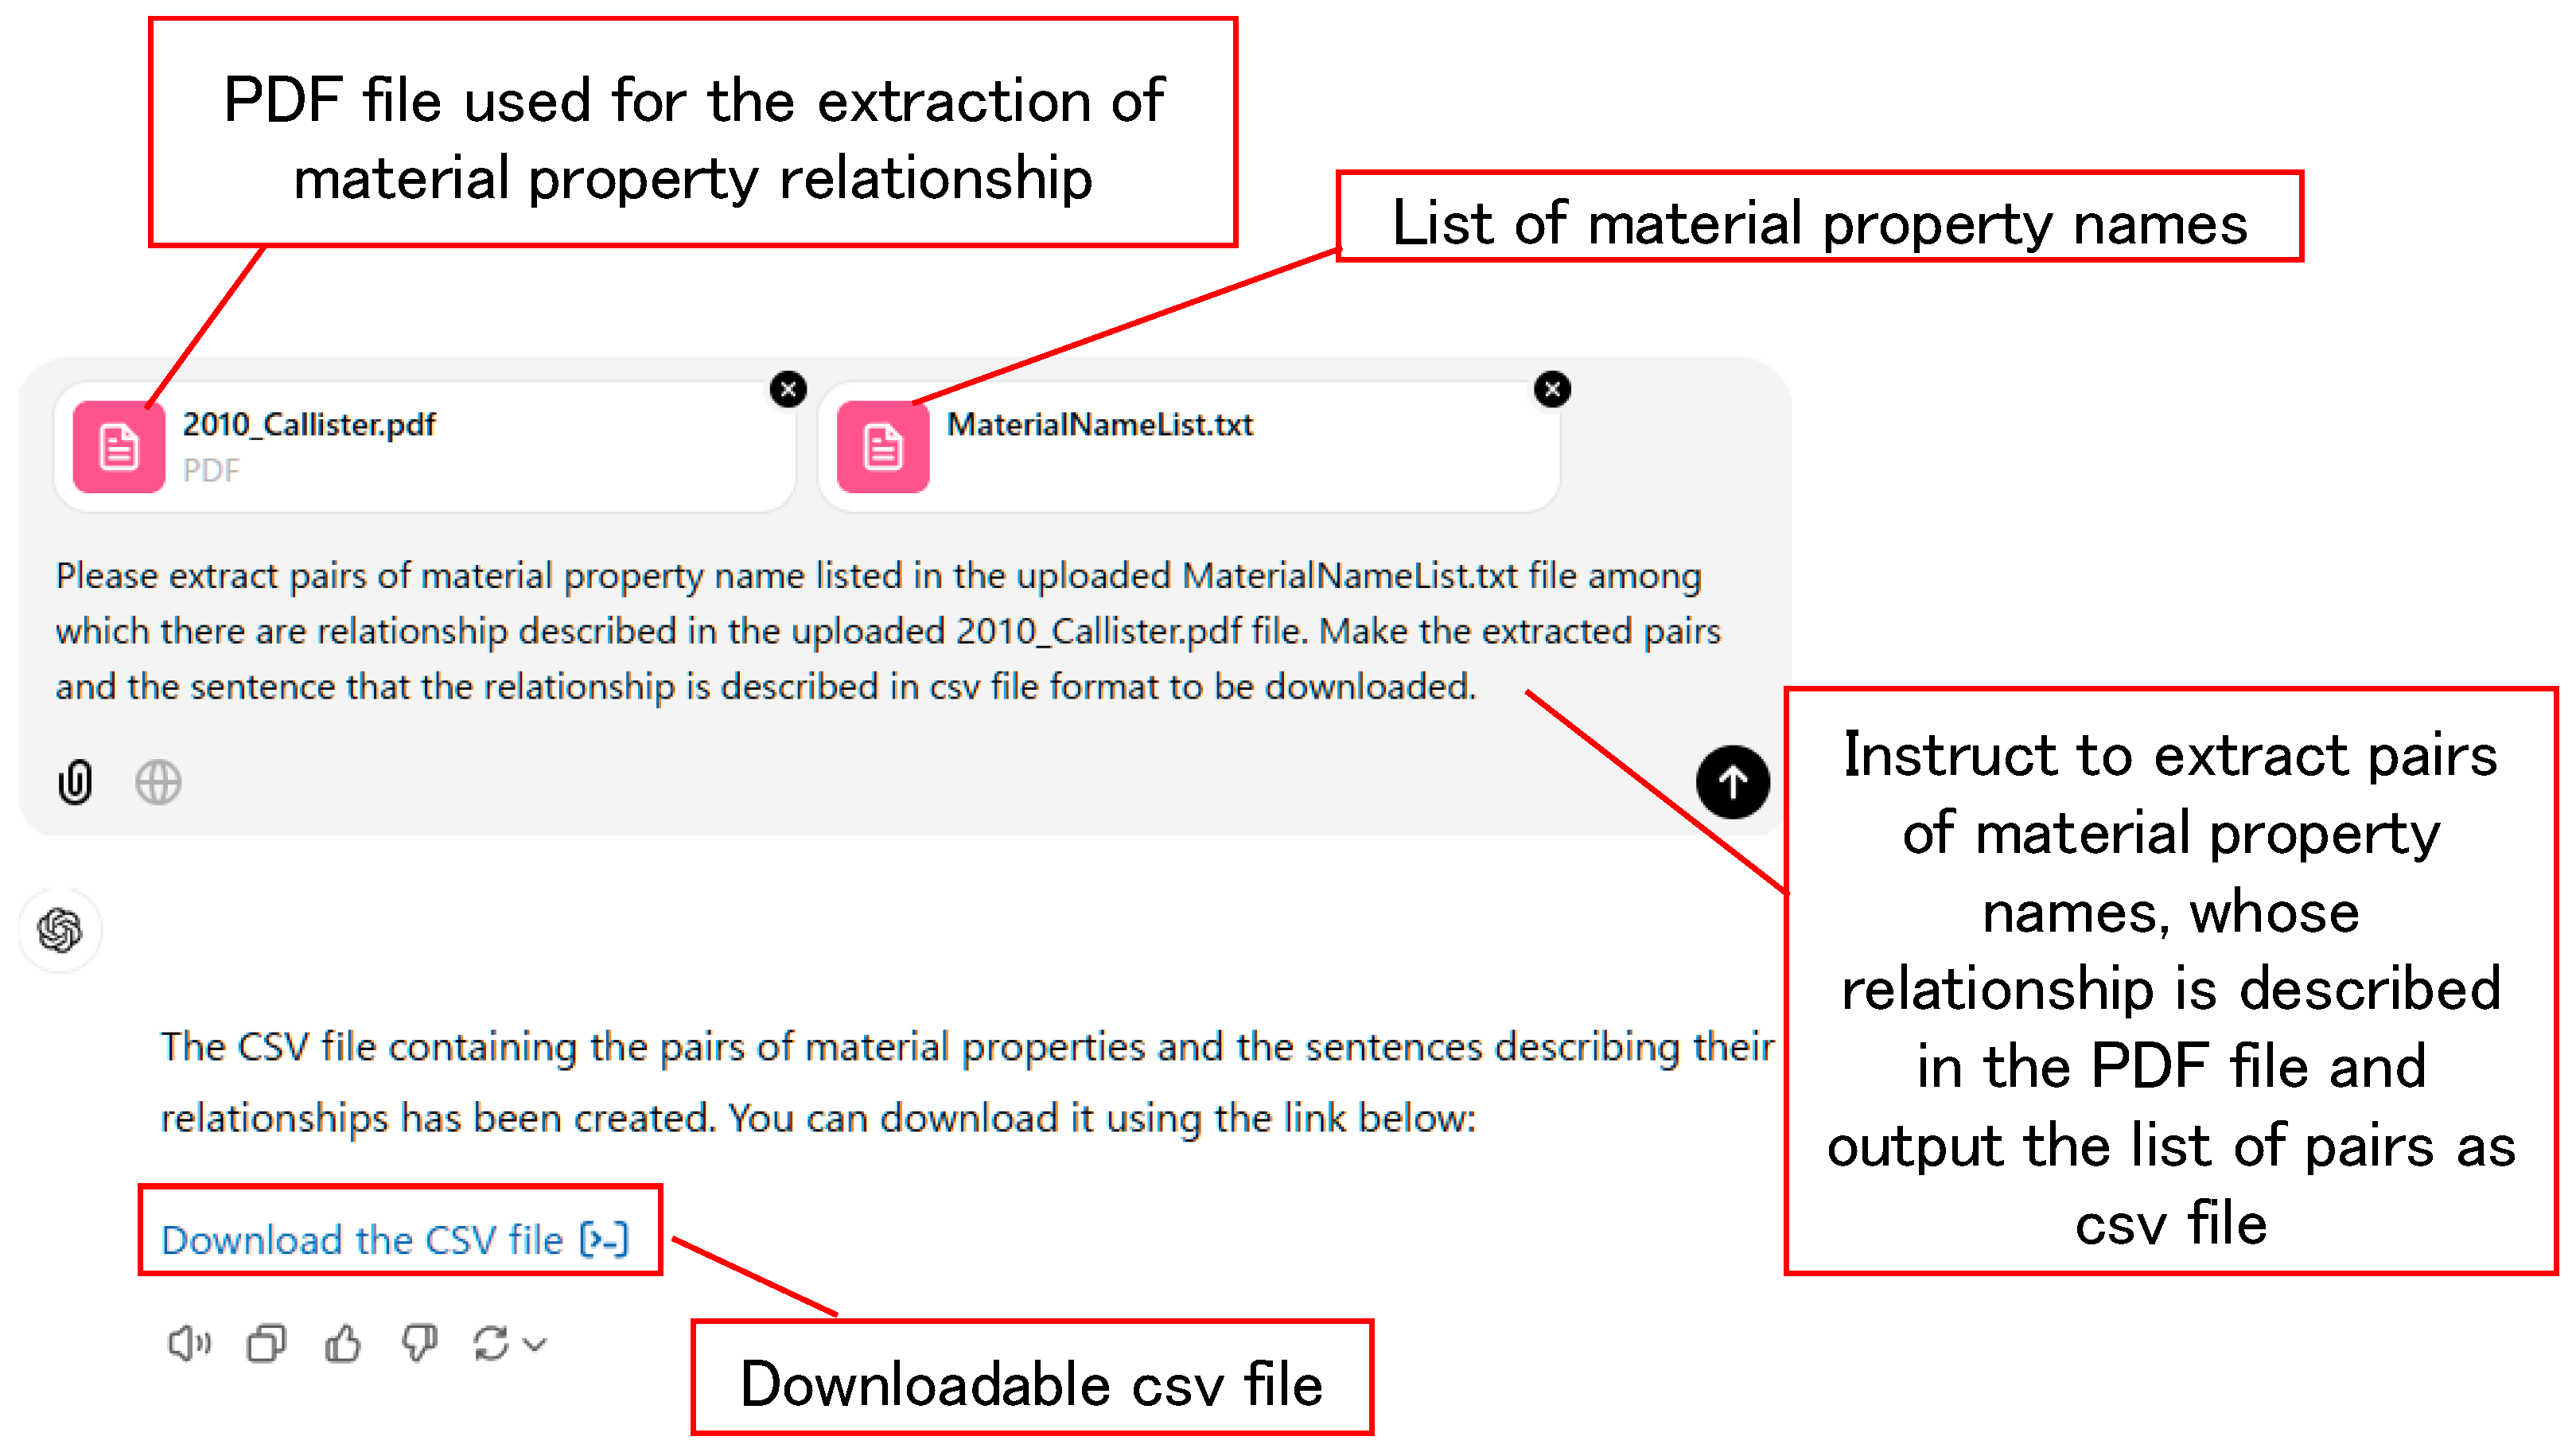
Supplementary file of the article. It is also possible to make a list manually without the help of generative LLMs, of course. Depending on the users, a different list should be uploaded for the knowledge graph generation of their interests. In the second step, the text file containing prepared material property names and a PDF file (or multiple files) of materials science textbooks—in which relationships among material properties are described—were uploaded to ChatGPT-4o (or a more advanced model). The following prompt was used: “Please extract pairs of material property name listed in the uploaded xxx file (name of text file of the list) among which there are relationship described in the uploaded xxxx.pdf (name of textbook file). Output the extracted pairs as a csv file to be downloaded.” In this demonstration, [
35] was used as a textbook, and its PDF file was uploaded.
Figure 7 shows an example of this prompt and the response. A downloadable CSV file was successfully generated. In the CSV file, “property name 1” and “property name 2” are stored in the first and second columns. We eliminated pairs where property name 1 and property name 2 are identical (this is not necessary if we add to exclude them in the prompt). The resulting CSV file is also attached as a
Supplementary file (List S2). The repeated input and output revealed that ChatGPT-4o always outputs the same pairs. We asked ChatGPT-4o to also output the sentences that ChatGPT-4o found the relationships between two material properties, in addition to the two property names. The output of the sentences allows us to confirm the correctness of the pair extraction of material property names. Furthermore, the extracted relationships were exactly the same as one using the prompt in
Figure 7 (without asking to list the sentence that the LLM found the relationship). Therefore, the accuracy and reproducibility appear very good with this task, possibly because this task does not need to “generate” but just “compare” words in two files. There seems to be no problem with OCR, possibly because the current PDFs are provided as a structured PDF.
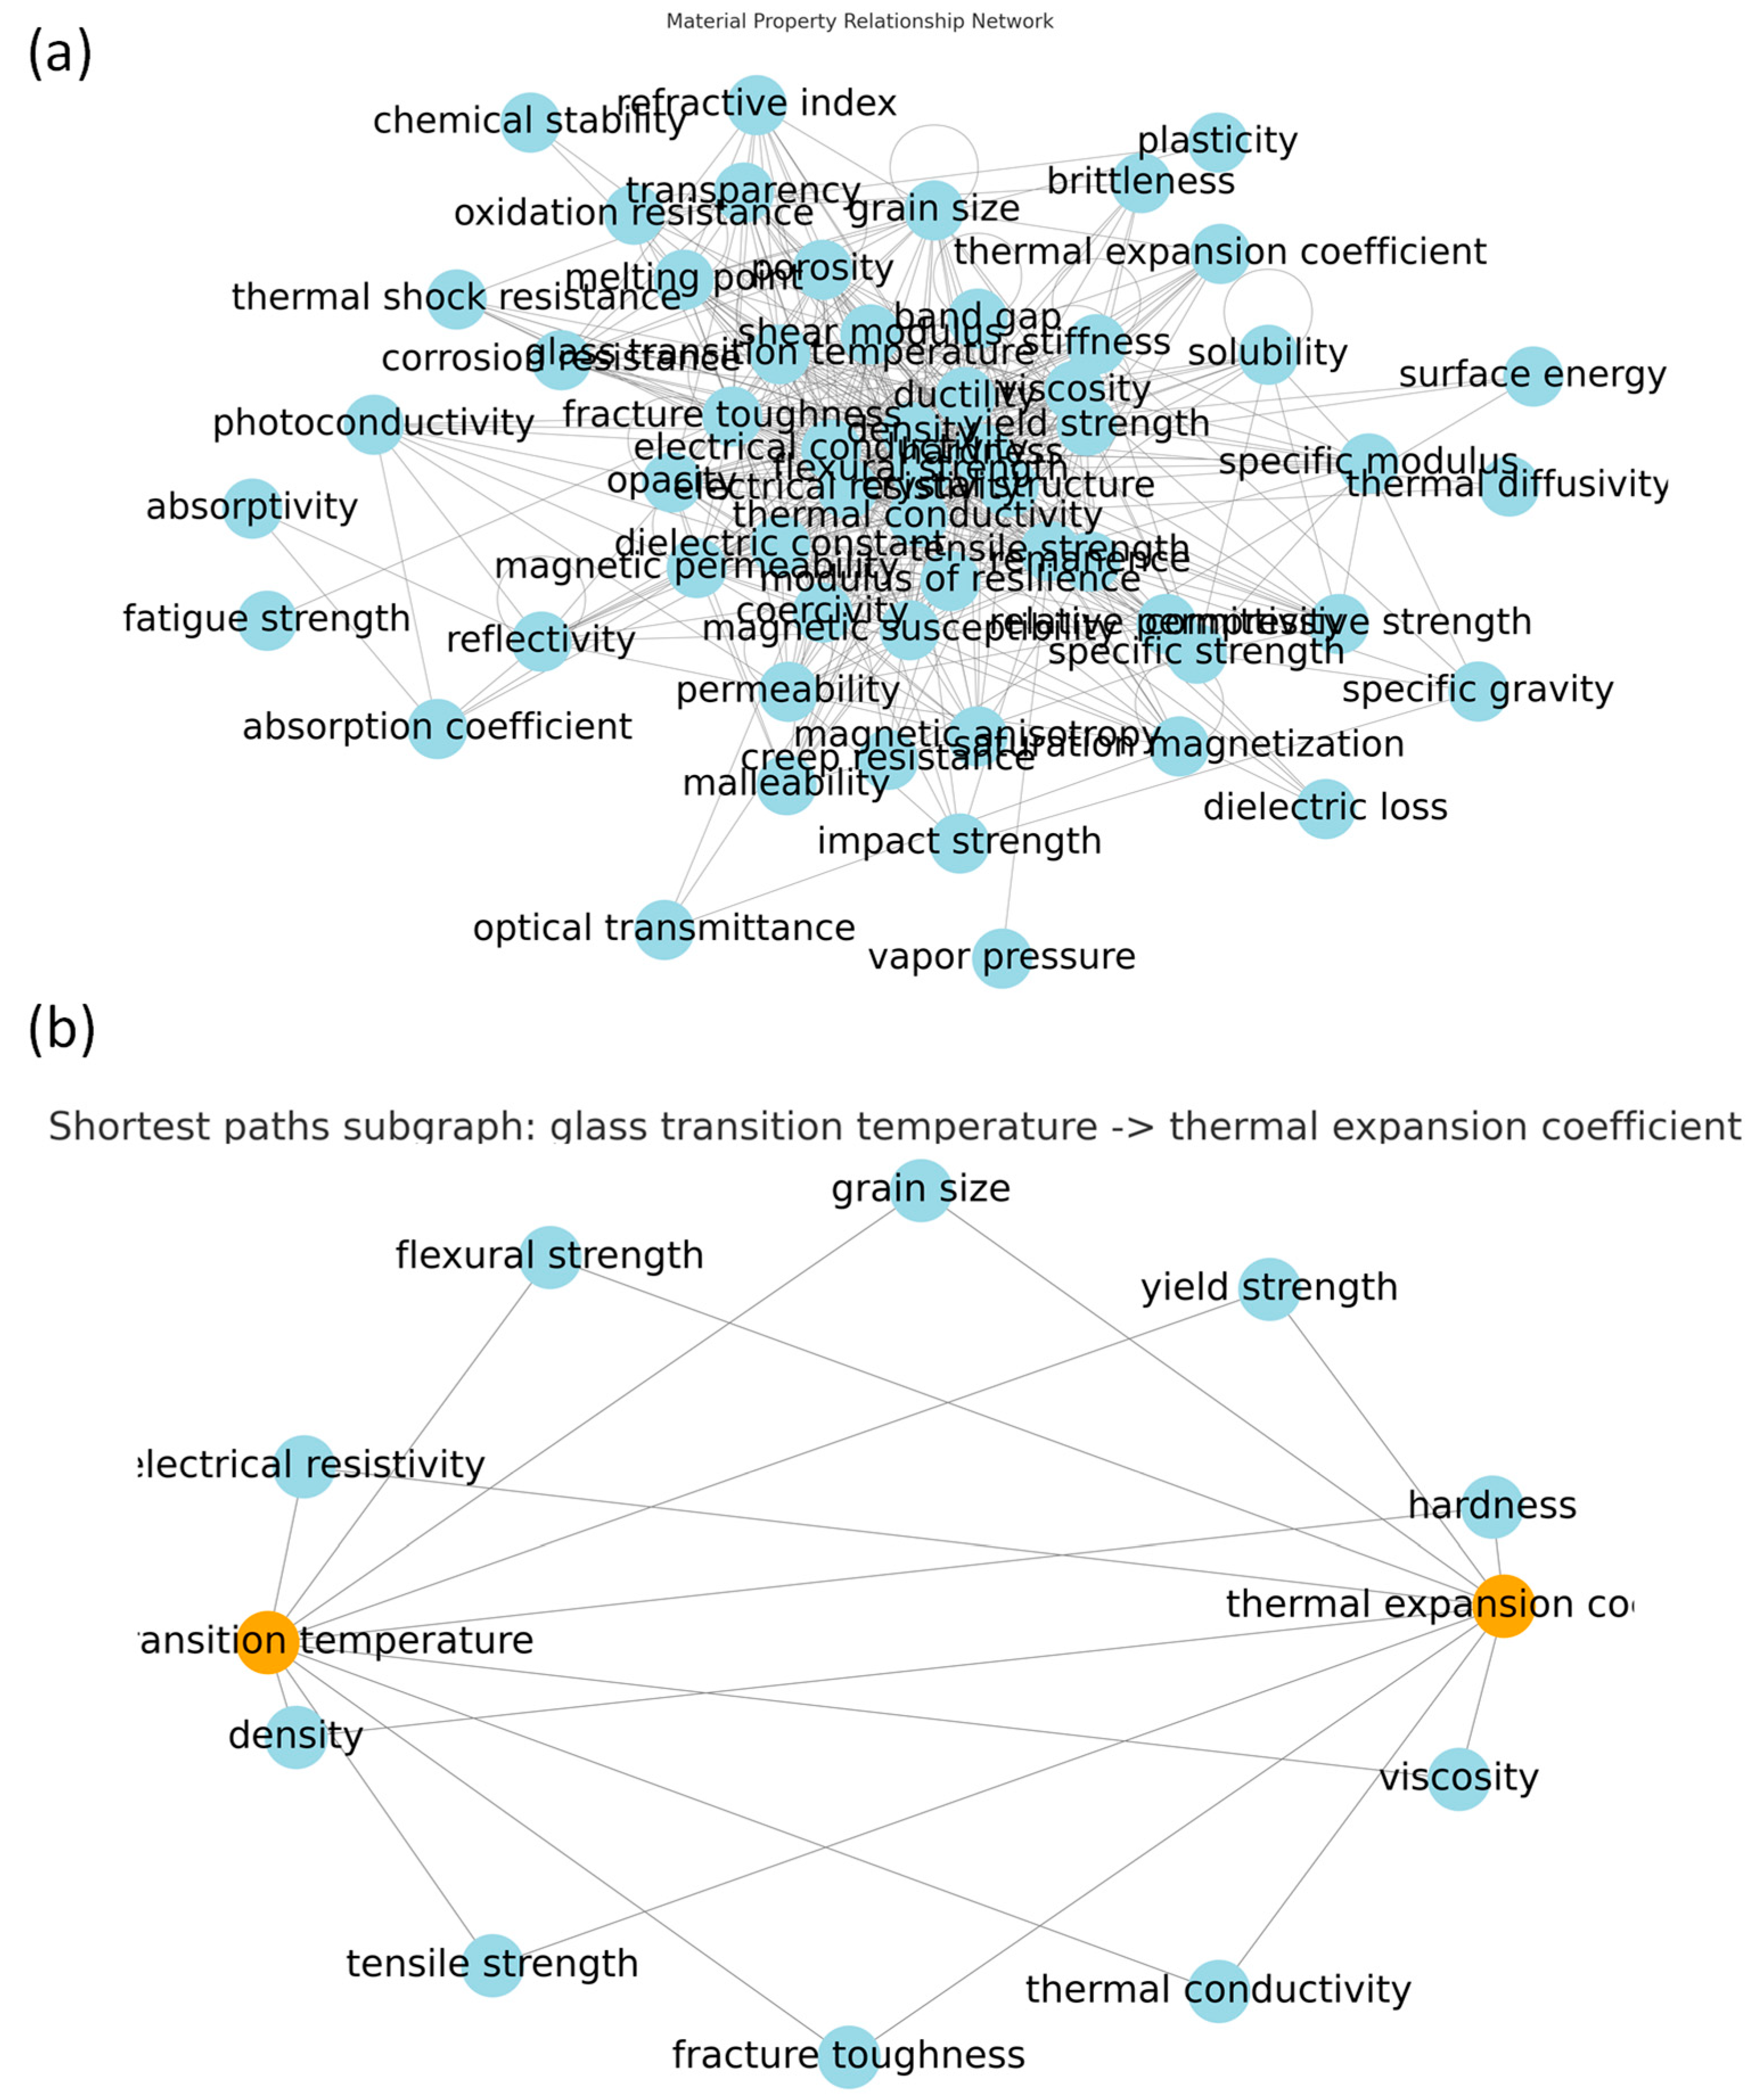
Next, by uploading the CSV file and prompting ChatGPT to draw a network of material properties using the property pairs as nodes and their relationship as edges, a graph such as the one shown in
Figure 8a was produced.
Figure 8b shows the response to a prompt requesting all shortest paths between “glass transition temperature and “thermal expansion coefficient” (the generated graph is undirected). Once the relationship graph is generated, both types of searches—path search (as in the example above) and connectivity search—are easily performed. In this case, since no specific modules were designated, ChatGPT used the default ‘networkx’ in the Python package, as indicated in the response when the source code for the analysis was displayed. It should be noted that the arrangement of nodes and lengths of edges is different for each input. However, the nodes and edges are the same because their information, given as a file, is the same, and the Python package is used for graph generation, where no statistics in generative LLMs are involved. To obtain
Figure 8a, instructions “locate the two nodes, “glass transition temperature”, “thermal expansion coefficient at the left and right sides”, and “use orange color for the two nodes” were used.
To enable others to conduct similar knowledge graph searches, a MyGPT instance called “property graph-EN” was created. MyGPT is a customizable GPT service available to GPT-plus (
$20/month) users, allowing users to build original GPT models with file upload capabilities. In the “property graph-EN” developed for searching material property relationships, users are prompted to choose either path search or connectivity search. Once selected, users are then asked to input one or two material properties of interest (two for path search, one for connectivity search). In the “property graph-EN”, the CSV file where pairs of related two material properties are stored is uploaded, and the instruction to output a partial graph according to a user’s requests is written.
Figure 9a shows an example output of a path search between “glass transition temperature” and “thermal expansion coefficient”, and
Figure 9b shows an example of a connectivity search centered around “dielectric constant”. Since the original knowledge graph (CSV file) is the same,
Figure 8b and
Figure 9a are the same as expected, though the arrangement of nodes is different. The “property graph-EN” will be made publicly accessible upon the publication of this article.
It should be noted that the “property graph-EN” was created solely for demonstration purposes and is not intended for commercial use. It was developed for researchers interested in utilizing material property relationships, but who may lack programming experience to create their own knowledge graphs as described in published references and GitHub repositories. The number of nodes and edges in this version is limited. Significantly more advanced analyses are possible using additional features and functions covered by patents held by a Japanese government institution. For commercial use of the patented technologies—including the utilization of material property relationship knowledge graphs in machine learning applications—a license agreement is required, as outlined in the relevant patents.
It should be noted that constructing a similar knowledge graph starting with a different material property name list of a specific domain, such as magnetism or ferroelectrics, is possible. For such cases, different textbook(s) suitable for the chosen domain should be uploaded. Then users can make their own knowledge graph on their interests, including specific properties in magnetism, ferroelectrics, properties related to chemical reaction, and so forth, without any coding. Furthermore, knowledge graphs of not only material property relationships but also other relationships are able to be generated. For example, making a list of chemical compounds and asking generative LLMs to find pairs of different chemical compounds in the list from the uploaded literature (in this case, not necessarily textbooks) would result in a knowledge graph of chemical reactions. By selecting appropriate chemical compounds in a list and the literature uploaded, various knowledge graphs can be generated for each purpose.
Furthermore, if users subscribe to a subscription plan and learn how to use a MyGPT-like service (Google, Anthropic, and other companies that supply generative LLM services also provide similar functions), searching for such a custom-tuned knowledge graph becomes available, like a software operation.
5. Discussion
The most important issue in knowledge graph generation is determining what types of information should be chosen as nodes (entities) and what types of relationships should be defined as edges (connections). Depending on how nodes and edges are defined, completely different knowledge graphs can be generated from the same information source, leading to diverse applications.
The knowledge graph of material property relationships demonstrated here was constructed with material property names as nodes and relationships among material properties as edges, where the relationships were taken from a textbook of materials science. Therefore, it is oriented toward scientific principles and does not focus on specific material categories such as metal, oxides, or organic materials. Scientific principles are generally applicable to all materials, regardless of their categories or intended applications. This makes the application of the material property relationship knowledge graph applicable to estimate missing numerical data of material properties by interpolation and to replace material properties for use by other material properties, as described in the examples in
Section 3. Due to this applicability, the knowledge graph can serve as background infrastructure for machine learning. When data for a certain material property is missing, automatic interpolation is possible using alternative material properties that are linked to the intended property. If many data points are missing for a given property, the knowledge graph can be used to automatically identify an alternative descriptor for use in machine learning. It is also possible to reduce the number of input descriptors (material properties) by identifying and removing properties that are strongly correlated, thereby eliminating redundancy. All these processes can be handled in the background, without the user being explicitly aware of the underlying operations.
The material property relationship knowledge graph can also be used in a graph RAG framework to support large language models in materials science contexts, as is commonly practiced in generative AI in general [
36,
37,
38].
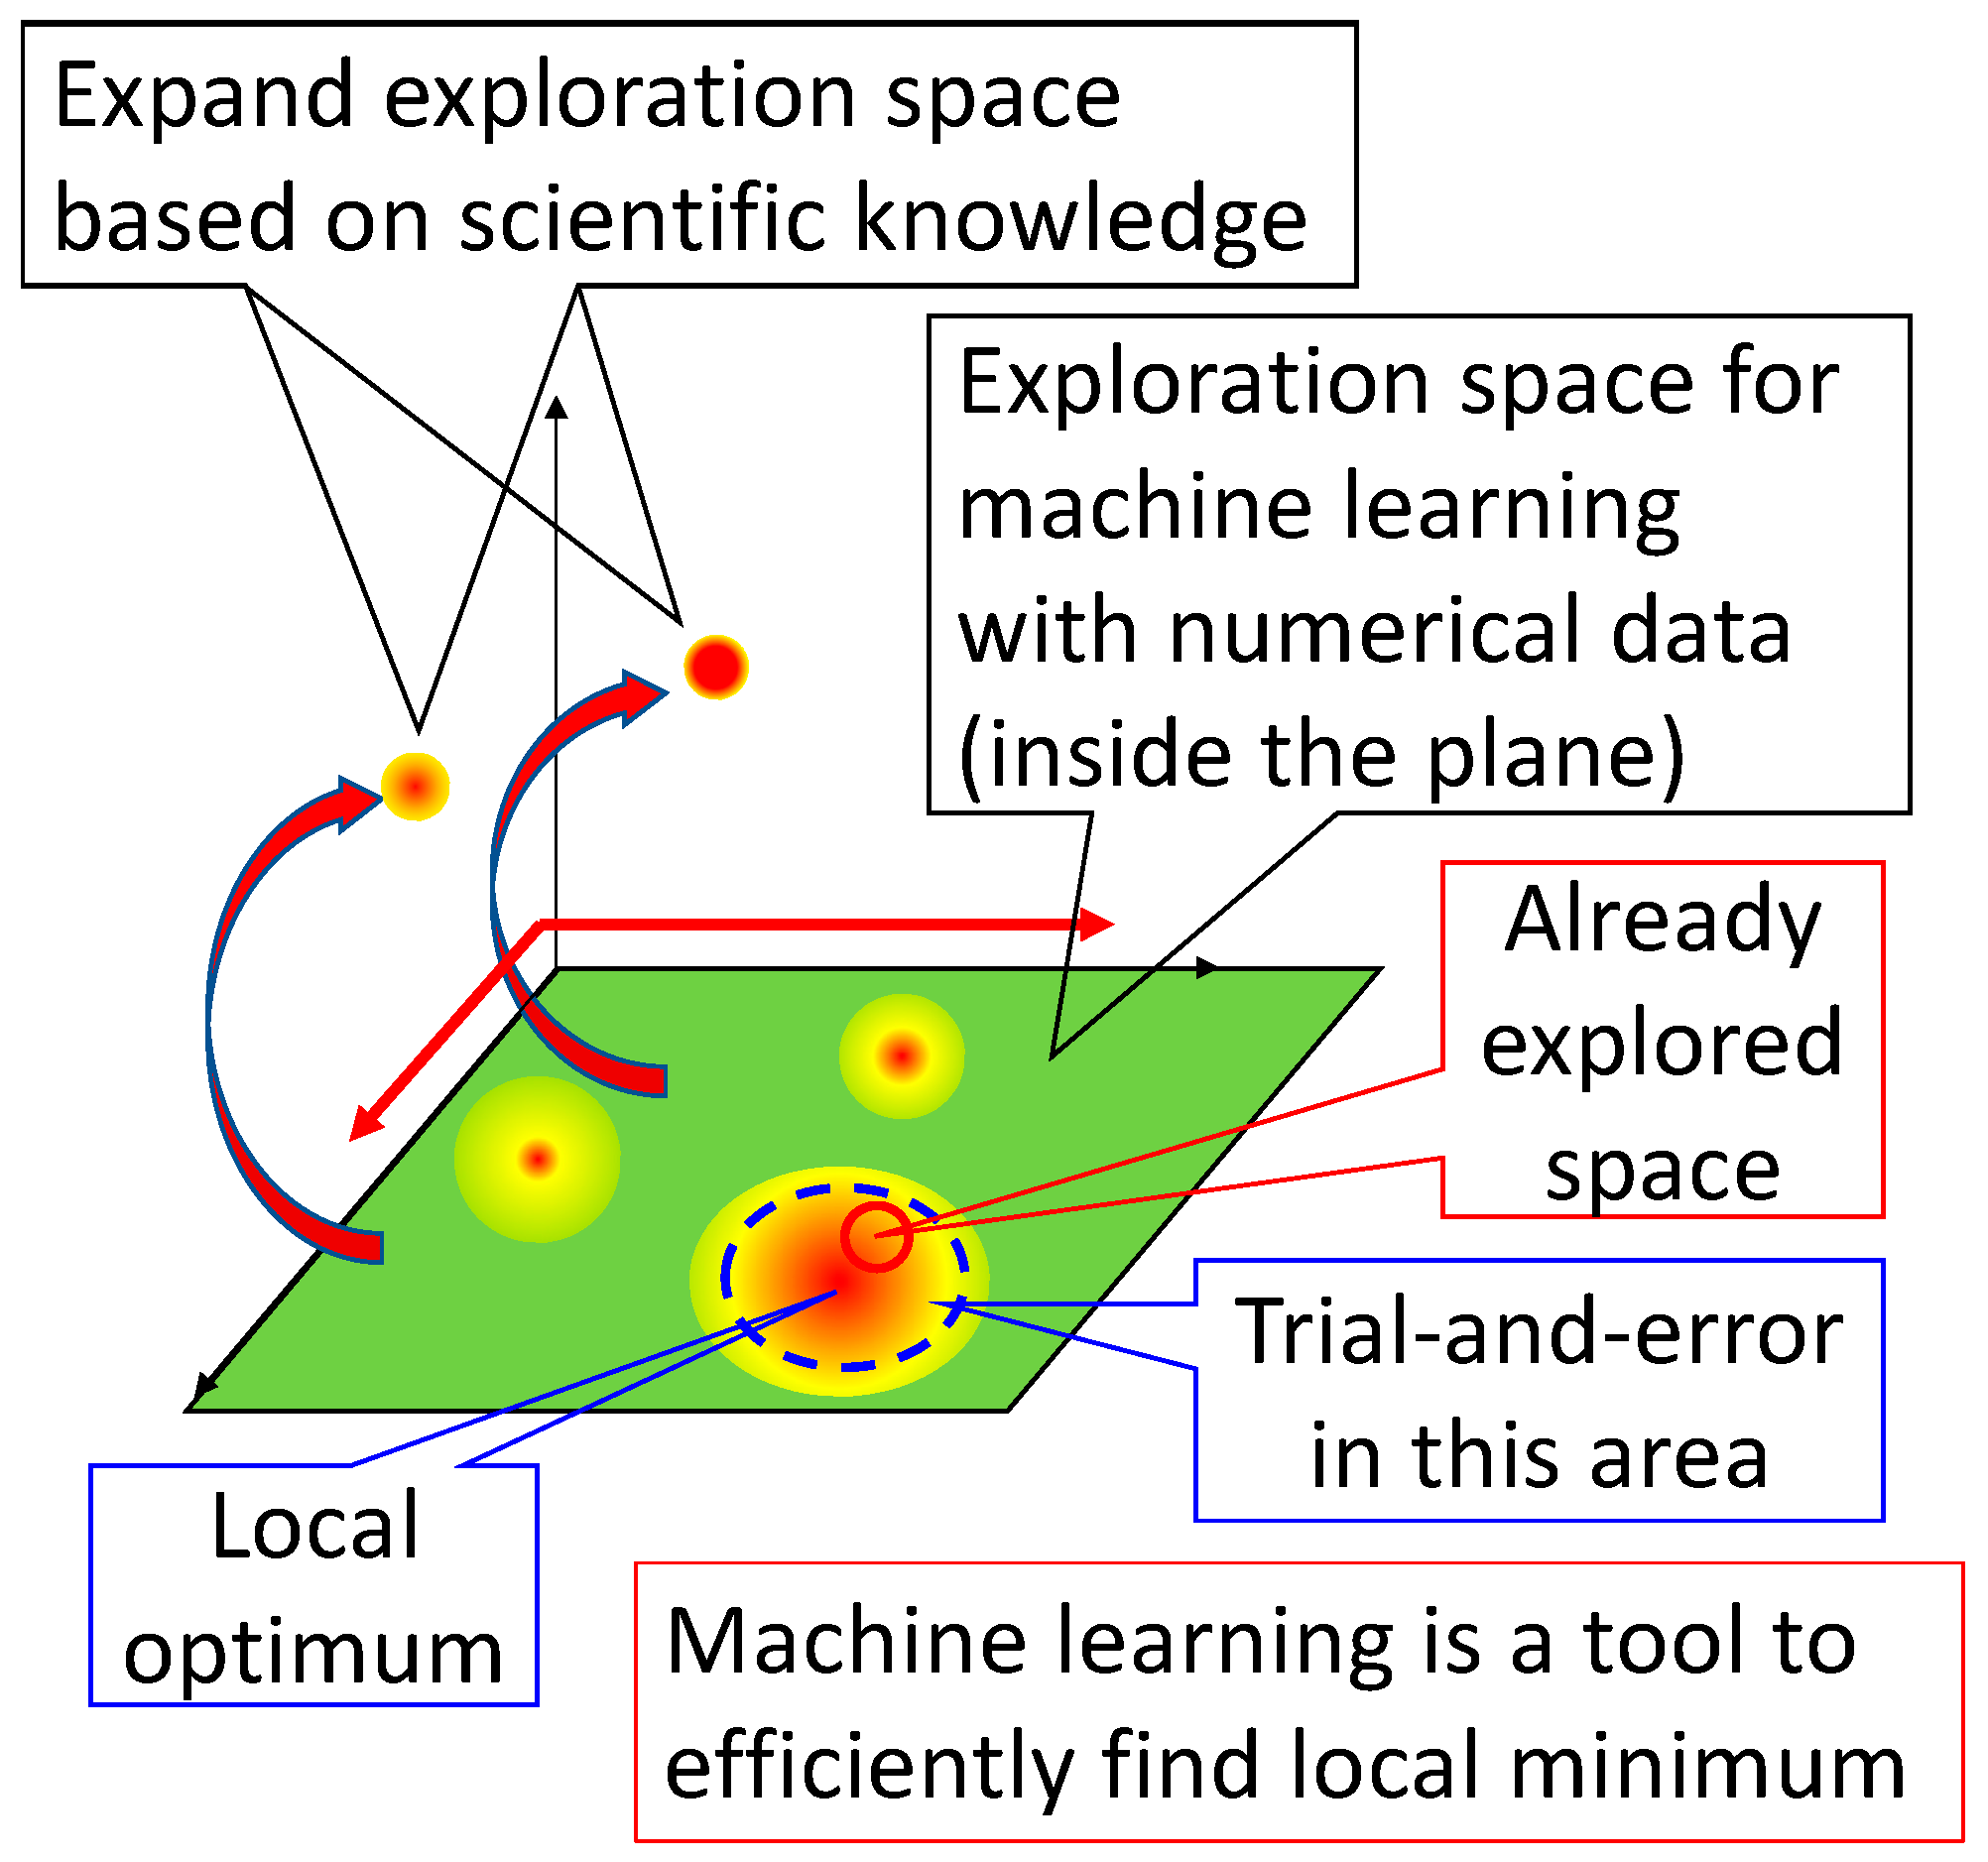
Being based on scientific principles, not numerical data, where the relationships are primarily applicable to all materials, makes the material property relationship knowledge graph unique among other knowledge graphs in materials science. Because of this uniqueness, it enables users to think beyond existing frameworks and not be constrained by the uneven distribution of experimental or computational data across materials. A schematic representation of this advantage is shown in
Figure 10 [
39]. As mentioned in
Section 3 about thermal conductivity and work function, materials having numerical data on specific properties being reported are very limited. This limitation is schematically shown as a green plane in
Figure 10, where the whole material search space is expressed as a three-dimensional space. While machine learning is a strong tool to search for the optimum material when numerical data are available, there is a huge space that is not being explored, and no numerical data exists. Occasionally, revolutionary materials such as famous YBCO-like oxide superconductors [
40] were discovered outside of the exploration space in green. However, it has been known that the discovered revolutionary materials are not outside of already known scientific principles. Therefore, the knowledge graph of material property relationships based on scientific principles has the potential to make users think in an interdisciplinary way and to search for materials beyond the exploration space.
This knowledge graph also has potential for many other applications beyond the already mentioned ones. For example, it can help identify previously unconsidered applications of known materials: If material-a is used for application-A due to favorable characteristics in property-x, and property-x has a strong positive correlation with property-y, and property-y is known to be important for application-B, then, it can be suggested that material-a may also be suitable for application-B. Although the same inference might be derived using a material–application-specific knowledge graph, the material property relationship graph allows for broader and more flexible exploration. Other applications involving machine learning or algorithmic inference are also possible.
Because graph-structured data can be easily added to or removed from, combining the material property relationship knowledge graph with other domain-specific knowledge graphs can be especially powerful [
32]. For example, a new subgraph related to “ferroelectricity” can be merged to extend the knowledge graph’s relevance to ferroelectric materials. Likewise, a graph detailing characterization methods for various material properties—where each method is connected to the material property it can measure—can be added [
41]. Many other types of simple, specific knowledge graphs can be integrated depending on the intended use.
To compare the knowledge graph of material property relationships with other knowledge graphs in materials science fields, knowledge graphs are divided into two categories. One is a rather general knowledge graph, with different kinds of entities as nodes and various types of relationships as edges, such as those in [
13,
14,
15]. For example, entities in “material”, “application”, and “property” categories may serve as nodes, with edges representing different relationships: between “Cu” node in “material” category and “electrical conductor” node in “application” category, or between “Li battery” node in “application” category and “ion conductivity” node in “property” category. This type of knowledge graph collects a broad range of material-related information from a wide range of scientific articles. These graphs are often massive, containing approximately 70,000 to 163,000 nodes and between 0.7 and 5.4 million edges. In such graphs, material properties are directly connected to applications, synthesis methods, or characterization techniques, as well as materials—not to other material properties like the knowledge graph demonstrated in this article. These massive graphs are effective for searching alternative materials or processes among known options and are often used as background data structures in machine learning or graph RAG applications [
42]. Since the information in these general graphs is extensive and rapidly evolving, frequent updates are desired for practical use.
The other type of knowledge graphs is constructed with specific nodes and relationships, as the knowledge graph demonstrated here. Other examples of this type are the knowledge graphs representing relationships between specific catalytic reactions and catalysts extracted from scientific articles [
43,
44]. In this type of knowledge graph, the type of information to be used as nodes and edges is clearly defined. Therefore, they are relatively simple, focus on specific issues of interest, and are useful for targeted applications.
The knowledge graph of material property relationships also has clear, narrow definitions on nodes and edges, and focuses on specific information for the construction. The biggest difference in the knowledge graph demonstrated from others in both types is that the relationships were extracted from textbooks, which have scientific reasoning for the relationships. It appears there are no similar knowledge graphs reported. Since the relationships are scientifically reasoned, not relying on the correlation in numerical data, the relationships are extended to groups of materials with no numerical data, which is the largest advantage of this knowledge graph. According to this advantage, there are two main merits in the applications, as in the examples described in
Section 3 and above. One is that when there is not enough numerical data on an input property for machine learning, (1) a possibility of interpolation using other numerical data can be suggested, or (2) a possibility of replacing an input property with another property with more numerical data. The other merit is that it enables thinking beyond existing frameworks, without being constrained by the uneven distribution of experimental or computational data across materials. This kind of thinking is very important to discover revolutionary materials.
Regarding the method of knowledge graph construction, most knowledge graphs in materials science were constructed before ChatGPT-4o and used primarily entity extraction techniques with different LLMs and pre-treatments through complicated coding. To construct a huge, general knowledge graph on materials science, such complicated coding with LLMs and pre-treatments may not be avoidable. However, this study revealed that the construction of a simple knowledge graph is plausible with a current generative LLM without coding, if the information extracted as nodes is specifically defined or a list of possible nodes is given in advance, information type of edges is specifically defined, and the reference for extraction relationships is supplied to the generative LLM. That materials scientists can construct their own knowledge graphs of their interests, specifically regarding properties in magnetism, ferroelectrics, properties related to chemical reactions, or whatever, without coding, is good news.
6. Conclusions
Although numerical data analysis has played a central role in materials informatics, the shortage of numerical data has been a long-time issue in practice. Thanks to the rapidly emerging LLMs, information extraction from textual data and retrieving scientific articles are now possible with high accuracy. With the remarkable development of generative LLMs, the construction of a knowledge graph—even without coding—has become feasible. In this article, we discussed the features of a knowledge graph on material property relationships extracted from textbooks, where the relationships are scientifically reasoned; we demonstrated an example of a material property relationship knowledge graph, its applications for estimating missing numerical data and replacing a materials property with another one, and the code-free construction of such a graph using ChatGPT and a graph search system with MyGPT.
The main advantage of the knowledge graph based on scientific reasoning is the application of relationships beyond materials whose numerical data already exist. Two merits arise from this advantage. One is the possibility of interpolating the value of the required property by that of another property, or replacing the input property with another property in data analysis. The other is the possibility of searching materials beyond existing frameworks, without being constrained by the uneven distribution of experimental or simulation data across materials.
Regarding the construction of the knowledge graph of material property relationships with generative LLMs without coding, it was revealed that construction with few errors and good reproducibility was possible when a list of possible nodes and a reference to be extracted from are provided. This result suggests that material scientists who are not familiar with programming can make their own knowledge graph of interest.
7. Patents
The techniques for the utilization of knowledge graphs of material property relationships are patented, which are all granted as JP: Nos. 6719748, 6876344, 7169685, 7352313, 7142325, 7026973, 7111354, 7082414, 7186436, 7396619, 7411977, and 7352315. US: Nos. US11,138,772B2: US 11,163,829 B2: US 11,449,552 B2: US 11,544,295 B2: US 12,105,741 B2 and EP: No. EP3812923 B1.


