Article

Influence of Water Level Change on Vibration Response and Isolation of Saturated Soil Under Moving Loads

School of Civil Engineering, Beijing Jiaotong University, Beijing 100044, China
*
Author to whom correspondence should be addressed.
Appl. Sci. 2025, 15(19), 10461; https://doi.org/10.3390/app151910461
Submission received: 3 September 2025 / Revised: 20 September 2025 / Accepted: 22 September 2025 / Published: 26 September 2025

Abstract

This paper investigates the influence of groundwater level fluctuations on the vibration response and isolation performance of saturated soil foundations under moving loads. A coupled model consisting of an overlying elastic layer and a saturated half-space is established, with water level variation simulated by adjusting the elastic layer thickness. Using Biot’s theory and Fourier transforms, the dynamic response is solved analytically and validated numerically via COMSOL6.0 simulations with perfectly matched layers. Results indicate that the groundwater level significantly affects wave propagation: deeper water levels lead to responses resembling an elastic half-space, while rising water levels amplify surface displacement due to wave reflection at the saturation interface. As water levels approach the surface, behavior converges to that of a fully saturated foundation. P-wave resonance at certain water levels reduces isolation effectiveness. Furthermore, isolation performance is sensitive to load frequency, soil permeability, and trench dimensions. These findings offer valuable insights for designing vibration mitigation measures in environments with variable groundwater conditions.

1. Introduction

Environmental vibration has become a hot issue of social concern. In addition to construction and industrial production, the environmental vibration caused by traffic has the most serious impact on the lives of surrounding residents. Most of the environmental vibration propagates through soil, so it is of guiding significance to study the response of soil vibrations under moving loads for the environmental vibration problems caused by traffic [1].
The composition of soil is very complex, so it is very difficult to accurately simulate the wave propagation in soil. Eason [2] used the integral transformation method to solve the analytical solution of the elastic wave equation and studied the dynamic response of the moving point load on the three-dimensional homogeneous elastic half-space soil surface. Lefeuve-Mesgouez [3] used the Foueier transform to solve the problem of vibration transmission of vertically moving harmonic load on a two-dimensional elastic half-space and gave the numerical results of the surface displacement response under different velocities and vibration frequencies. Andersen, L. [4] deduced the three-dimensional boundary element formula of the steady-state response of an elastic medium under moving harmonic load in a local coordinate system and solved the time-domain basic solutions of displacement and surface stress in the moving coordinate system. Galving, P. [5] used the three-dimensional boundary element method to analyze the vibration of elastic soil under high-speed moving loads. Zuada, B. [6] used a stochastic finite element model to study the effect of spatial heterogeneity of soil stiffness on three-dimensional wave propagation. Zhang [7] proved that the influence of various material properties of fluid-saturated porous media on the body wave propagation characteristics cannot be ignored.
For saturated soil, Biot [8,9] first proposed the elastic dynamics theory of porous fluid-filled soil skeleton, and explained the inertial coupling, viscous coupling, and elastic coupling of solid–liquid two-phase media in detail. Theodorakopoulos [10] used the Fourier series expansion method to study the vibration of saturated soil under plane strain under a rectangular load, considering the fluid–solid coupling effect. Lu et al. [11] used the Helmholtz decomposition method to derive the analytical solution of the dynamic response of a saturated half-space under moving point loads. Based on the Biot wave equation for porous saturated media, Gao Guanyun et al. [12,13] derived 2.5-dimensional finite element equations in u-p format and u-w format and discussed the effects of parameters such as dynamic permeability coefficient, porosity, soil skeleton density, and shear wave velocity on the propagation and attenuation of ground vibration. Anthony [14] used the Biot theory to simulate seismic waves in porous media, using vectorized derivative operators to improve the computational efficiency.
The influence of water level changes introduces further complexity into these dynamics, as variations in saturation significantly alter soil properties [15]. Fluctuations in the groundwater table stratify the soil medium, leading to reflection and refraction of waves, modifying the natural frequency of the system, and altering the dynamic response characteristics. Several researchers have focused on this aspect: Yuan [16] studied the effects of the hydraulic boundary of scattering surface and the change in groundwater level on the ground vibration response. He [17] used the transfer matrix method and the Helmholtz transform to study the influence of the relationship between groundwater level and tunnel location on ground vibration. Feng [18] established a two-dimensional finite element model of overlying elastic layer saturated foundation of open trench by using COMSOL and comparing the vibration isolation effect of an open trench with water and without water, pointing out that the critical water level will reduce the vibration isolation effect of the open trench. However, studies on vibration isolation for saturated foundations with an overlying elastic layer—a configuration that introduces complex coupling mechanisms between elastic and saturated soil—remain limited, particularly compared to the more extensively examined layered saturated foundation models.
In this paper, the soil layer above the groundwater level is assumed to be the elastic medium, and the wave motion in the elastic medium is described by the degenerate form of Biot porous media equation. The term “vibration isolation” is used throughout this study primarily to describe the natural attenuation of wave energy within the soil mass itself due to its inherent material damping, radiation damping, and the wave scattering effects induced by stratigraphic interfaces and excavated trenches. Below the water level, a porous saturated medium was used for simulation to derive the transfer matrix between the elastic layer and the saturated half-space, and the surface displacement expression of the overlying elastic layer in the saturated half-space was obtained.
The wave composition of soil under different water levels is studied in wave number, and the influence of water level change on the vertical displacement of the ground is analyzed in a spatial domain. The elastic wave module of COMSOL is coupled with the porous elastic wave module, and the perfect matching layer is used to simulate the propagation of infinite domain waves. A saturated half-space vibration isolation trench model with an overlying elastic layer was developed, and the effects of water level changes on the vibration isolation effect of empty and filled trenches are discussed.

2. Basic Equation

The physics equations for porous saturated media are as follows:
σ i j = λ δ i j θ + 2 μ ε i j α δ i j p
p = α M θ + M e
where ui and wi (i = 1, 2, 3) are the displacement of the solid soil skeleton and the displacement of fluid relative to the solid soil skeleton, respectively; pore water pressure is p; and σij and εij are the total stress–strain components of soil, respectively. δij is the Kronecker function; e and θ represent the volume strain of the soil skeleton and fluid volume strain in unit volume, respectively, where e = divw and θ = divu. λ and μ are Lame constants; α and M are Biot parameters related to compression in the saturated porous media.
The relative displacement form of the Biot equation for saturated porous media is
μ u i , j j + λ + α 2 M + μ u j , j i + α M w j , j i = ρ u ¨ i + ρ f w ¨ i
α M u j , j i + M w j , j i = ρ f u ¨ i + m w ¨ i + b K ( t ) w ˙ i
where ρ and ρf are the densities of saturated soil and liquid, respectively; ρ = 1 n ρ s + n ρ f , and ρ s is the soil skeleton density; n is the porosity; m = a ρ f / f , and a is the bending coefficient of the porosity medium; b = η / k , and b is the coefficient of reaction viscous coupling, and η and k are the viscosity coefficient and the dynamic permeability coefficient of the pore medium, respectively; K ( t ) is the time-dependent viscosity factor; the point above the displacement represents the derivative with respect to time; and the symbol “∗” represents the convolution of two variables.
The Biot governing equation is solved, and the equation is transformed from the time-space domain to the frequency-wave number domain, and the transformation rules are as follows:
f ^ ( ω ) = + f ( t ) e i ω t d t f ( t ) = 1 2 π + f ^ ( ω ) e i ω t d ω
f - ~ ( ξ , η ) = + + f ( x , y ) e ( i ξ x + i η y ) d x d y f ( x , y ) = ( 1 2 π ) 2 + + f - ~ ( ξ , η ) e i ξ x + i η y d ξ d η
where ^ represents the Fourier transform from t to ω; − and ~ represent the Fourier transforms from x to ξ and y to η, respectively.
By transforming Equations (2) and (4) according to the rules of Equation (5), the relationship between liquid relative displacement and pore water pressure can be obtained:
w ^ = p ^ , j m ω 2 i b K ^ ( ω ) ω ϑ u ^ j
where ϑ = ρ f ω 2 / ( m ω 2 i b K ( ω ) ω ) .
According to the rules of Equation (5), transform Equations (2) and (3), and combine Equation (7) to get
θ ^ = ϑ 2 p ^ ρ f ω 2 ( α ϑ ) p ^ ( α ϑ ) M
Find the divergence on both sides of Equation (3) to get
( λ + α 2 M + 2 μ ) 2 θ ^ + ω 2 ( ρ ρ f ϑ ) θ ^ ( α ϑ ) 2 p ^ = 0
Bring Equation (8) into Equation (9) to get
4 p ^ + β 1 2 p ^ + β 2 p ^ = 0
where β 1 = ( m ω 2 i b K ( ω ) ω ) ( λ + α 2 M + 2 μ ) + ρ M ω 2 2 α M ρ f ω 2 ( λ + 2 μ ) M ; β 2 = ( m ω 2 i b K ^ ( ω ) ω ) ρ ω 2 ( ρ f ) 2 ω 4 ( λ + 2 μ ) M .
According to Equation (6), Fourier transform is applied to Equation (10), and the solution can be obtained:
p - ~ ^ ( ξ , η , z , ω ) = A 1 e γ 1 z + B 1 e γ 2 z + A 2 e γ 2 z + B 2 e γ 2 z
where γ j = ξ 2 + η 2 ι j 2 ;   ι 1 2 = β 1 β 1 2 4 β 2 2 ;   ι 2 2 = ( β 1 + β 1 2 4 β 2 ) / 2 ; ιi (i = 1, 2) refers to the complex number of the first and second types of expansion waves in saturated soil, respectively, which should meet Re(γj) > 0 (j = 1, 2). It can be obtained by Equation (11):
w - ~ ^ = γ 1 l 1 A 1 e γ 1 z B 1 e γ 2 z + γ 2 l 2 ( A 2 e γ 2 z B 2 e γ 2 z ) ϑ ( A 4 e γ 3 z + B 4 e γ 3 z )
u - ~ ^ y = i η a 1 ( A 1 e γ 1 z + B 1 e γ 2 z ) i η a 2 ( A 2 e γ 2 z + B 2 e γ 2 z ) + i A 3 e γ 3 z + i B 3 e γ 3 z
u - ~ ^ z = γ 1 a 1 ( A 1 e γ 1 z B 1 e γ 1 z ) γ 2 a 2 ( A 2 e γ 2 z B 2 e γ 2 z ) + A 4 e γ 3 z + B 4 e γ 3 z
i ξ u - ~ ^ x = v 1 ( A 1 e γ 1 z + B 1 e γ 2 z ) + v 2 ( A 2 e γ 2 z + B 2 e γ 2 z ) + η ( A 3 e γ 3 z + B 3 e γ 3 z ) γ 3 ( A 4 e γ 3 z B 4 e γ 3 z )
where a i = χ i λ + μ α + ϑ S 2 ι i 2 μ ;   l i = a i ϑ + ρ f ω 2 ϑ ;   S 2 = ρ ρ f ϑ ω 2 μ ;   γ 3 = ξ 2 + η 2 S 2 ; and S is the complex wave number related to the shear wave of saturated soil, satisfying Re( γ 3 ) > 0. Ai and Bi (i = 1, 2, 3, 4) are arbitrary functions related to ξ, η, ω.
Bring Equations (11) and (13)–(15) into Equation (1) to get
i ξ σ - ~ ^ x z = γ 1 g 1 μ ( A 1 e γ 1 z B 1 e γ 2 z ) + γ 2 g 2 μ ( A 2 e γ 2 z B 2 e γ 2 z ) + γ 3 η μ ( A 3 e γ 3 z B 3 e γ 3 z ) ( ξ 2 + γ 3 2 ) μ ( A 4 e γ 3 z + B 4 e γ 3 z )
σ - ~ ^ y z = 2 i η γ 1 a 1 μ ( A 1 e γ 1 z B 1 e γ 2 z ) 2 i η γ 2 a 2 μ ( A 2 e γ 2 z B 2 e γ 2 z ) + i γ 3 μ ( A 3 e γ 3 z B 3 e γ 3 z ) + i η μ ( A 4 e γ 3 z + B 4 e γ 3 z )
σ - ~ ^ z z = τ 1 ( A 1 e γ 1 z + B 1 e γ 1 z ) + τ 2 ( A 2 e γ 2 z + B 2 e γ 2 z ) + 2 μ γ 3 ( A 4 e γ 3 z B 4 e γ 3 z )
where g j = χ j + a j 2 ξ 2 ι j 2 ;   τ j = λ χ j 2 μ a j γ j 2 α ;   v j = χ j + a j ( γ j 2 η 2 ) .

3. Analysis of Soil Vibration Response

3.1. Vibration Response Model

Groundwater is generally located below the surface, and the soil can be simulated as a saturated half-space model of the overlying elastic layer, as shown in Figure 1. Above the water level is the dry soil layer, and the material properties are assumed to be viscoelastic foundation soils; The part below the groundwater table is a saturated half-space, which is simulated as a porous saturated medium. When the groundwater level rises, the submerged part will reach saturation and be regarded as a porous saturated medium. The lower saturated soil is still simulated by the Biot saturated medium equation, and the upper elastic medium can be described by the Biot equation with a special value degradation.
In Figure 1, at the surface of the elastic soil layer, there is a moving simple harmonic load. The load size is 2a × 2b, the moving velocity is c, the circular frequency is ω 0 , and the moving direction is from the negative half axis of x to the positive half axis. The groundwater is located at z = h.
In order to calculate the displacement and stress field generalizations for different soil layers, Equation (18) is written in matrix form:
u i σ i = C u + i C u i C σ + i C σ i E + i 0 0 E i A i B i
where superscript i represents the number of layers, ordered from top to bottom, the second layer is the infinite half-space, and + and −, respectively, represent the positive or negative degree of the exponential terms.
Each layer of soil properties is homogeneous and defined by a set of material parameters. Each layer has a local Cartesian coordinate system with the origin at its top, while Oxyz represents a global coordinate system with the origin at the top surface of the first layer. In the local coordinate system, the vertical position of the top surface is zu(i) = 0, and the vertical position of the bottom surface of the elastic layer is zd(1) = h.
The components of ui, σi, Ai, and Bi (i = 1,2) are
u = ( ω , i ξ u x , u y , u z ) T , σ = ( p , i ξ σ x z , σ y z , σ z z ) T
A = [ A 1 , A 2 , A 3 , A 4 ] T , B = [ B 1 , B 2 , B 3 , B 4 ] T
If at ground z = 0, E + i and E i are unit matrix, then
u 0 1 σ 0 1 = C u + 1 C u 1 C σ + 1 C σ 1 A 1 B 1
At the junction of the two layers, the displacement and stress fields of the upper layer and the displacement and stress fields of the lower layer are continuous, which can be expressed as
C u + 2 C u 2 C σ + 2 C σ 2 A 2 B 2 = C u + 1 C u 1 C σ + 1 C σ 1 E + , h 1 0 0 E , h 1 A 1 B 1
According to the radiation conditions at infinity, A2 is a zero vector, and the displacement and stress in the second layer of soil are not 0, so B2 is not 0, which can be obtained as follows:
C u 2 B 2 = C u + 1 E + , h 1 A 1 + C u 1 E , h 1 B 1 C σ 2 B 2 = C σ + 1 E + , h 1 A 1 + C σ 1 E , h 1 B 1
It can be obtained by solving Equation (22):
A 1 = ( T 1 ) 1 T 2 B 1
where T 1 = C σ + 1 E + , h 1 C σ 2 ( C u 2 ) 1 C u + 1 E + , h 1 ; T 2 = C σ 2 ( C u 2 ) 1 C u 1 E , h 1 C σ 1 E , h 1 .
Bring Equation (23) into Equation (20) to get
u 0 1 = δ σ 0 1
where δ = ( C u + 1 R + C u 1 ) ( C σ + 1 R + C σ 1 ) 1
The paper only analyzes the vertical vibration displacement component of the ground; therefore, only the effect of the vertical load is considered, and the effect of two kinds of shear stresses on the ground can be ignored. Assuming that the surface of the foundation is a permeable boundary, the following boundary conditions exist:
σ 0 1 = ( 0,0 , 0 , σ - ~ ^ z z ) T
σ z z 1 ( x , y , 0 , t ) = q e i ω 0 t ;   a x c t , b y 0 ;   a x c t , b y
The transformation of Equations (5) and (6) to Equation (26) is obtained as follows:
σ - ~ ^ z z ( ξ , η , 0 , ω ) = 8 π q δ ( ω ω 0 + c ξ ) sin ( a ξ ) ξ sin ( b η ) η
Therefore, the vertical displacement of the foundation surface can be expressed as
u - ~ ^ z ( ξ , η , 0 , ω ) = ϕ 44 ( ξ , η , ω ) σ - ~ ^ z z ( ξ , η , 0 , ω )
ϕ 44 ( ξ , η , 0 , ω ) is referred to as the dynamical flexibility matrix of the saturated laminar half-space in the frequency wave number domain, or as the dynamical Green’s function matrix in the frequency wave number domain.
This can be obtained by Equations (20) and (24):
B 1 = ( C u + 1 R + C u 1 ) 1 ( 0,0 , 0 , σ - ~ ^ z z ) T
The downward wave coefficient A 1 of the first soil layer can be calculated using Equation (28), and the transfer matrix allows the calculation of the displacement, stress, and pore water pressure expressions at any point throughout the layered saturated model.
The inverse Fourier transform is applied to Equation (28), from the wavement–frequency domain to time–space domain, and the displacement of any point of the model is obtained by using the property of the Dirac function:
u z ( x , y , 0 , t ) = + + ϕ 44 ( ξ , η , ω 0 ξ c ) F e i ξ ( x c t ) e i η y d ξ d η
where F = q e i ω 0 t π 2 sin ( ξ a ) ξ sin ( η b ) η .
The damping of the material is expressed in the complex form of constants: λ = λ e   ( 1 + 2 i β ) , μ = μ e ( 1 + 2 i β ) , and μ e and λ e are the original Lame constants of the material, respectively, and β is the material damping ratio of the soil mass.
According to Equation (30), the velocity of the moving load will affect the frequency of the response of the porous medium. When the velocity of the load is too large, many high-frequency components will be generated, and the Biot equation is mainly applied to the low-frequency motion.
In order to describe the high-frequency resistance between the pore fluid and the solid skeleton, the Biot theory is combined with the JKD model [19], which can approximately deal with the problem of combining low-frequency and high-frequency resistance. The frequency domain expression for K(t) is
K ( ω ) = ( 1 + i ω ω c a g ) 1 2
where ω c = b n / ( ρ f a ) , ω c is the transition frequency separating the flow controlled by the viscous force from the flow dominated by the inertial force; a g is the pore geometry constant, and the porous elastic media is usually 0.5.

3.2. Analysis of Vibration Calculation Results

3.2.1. Model Verification

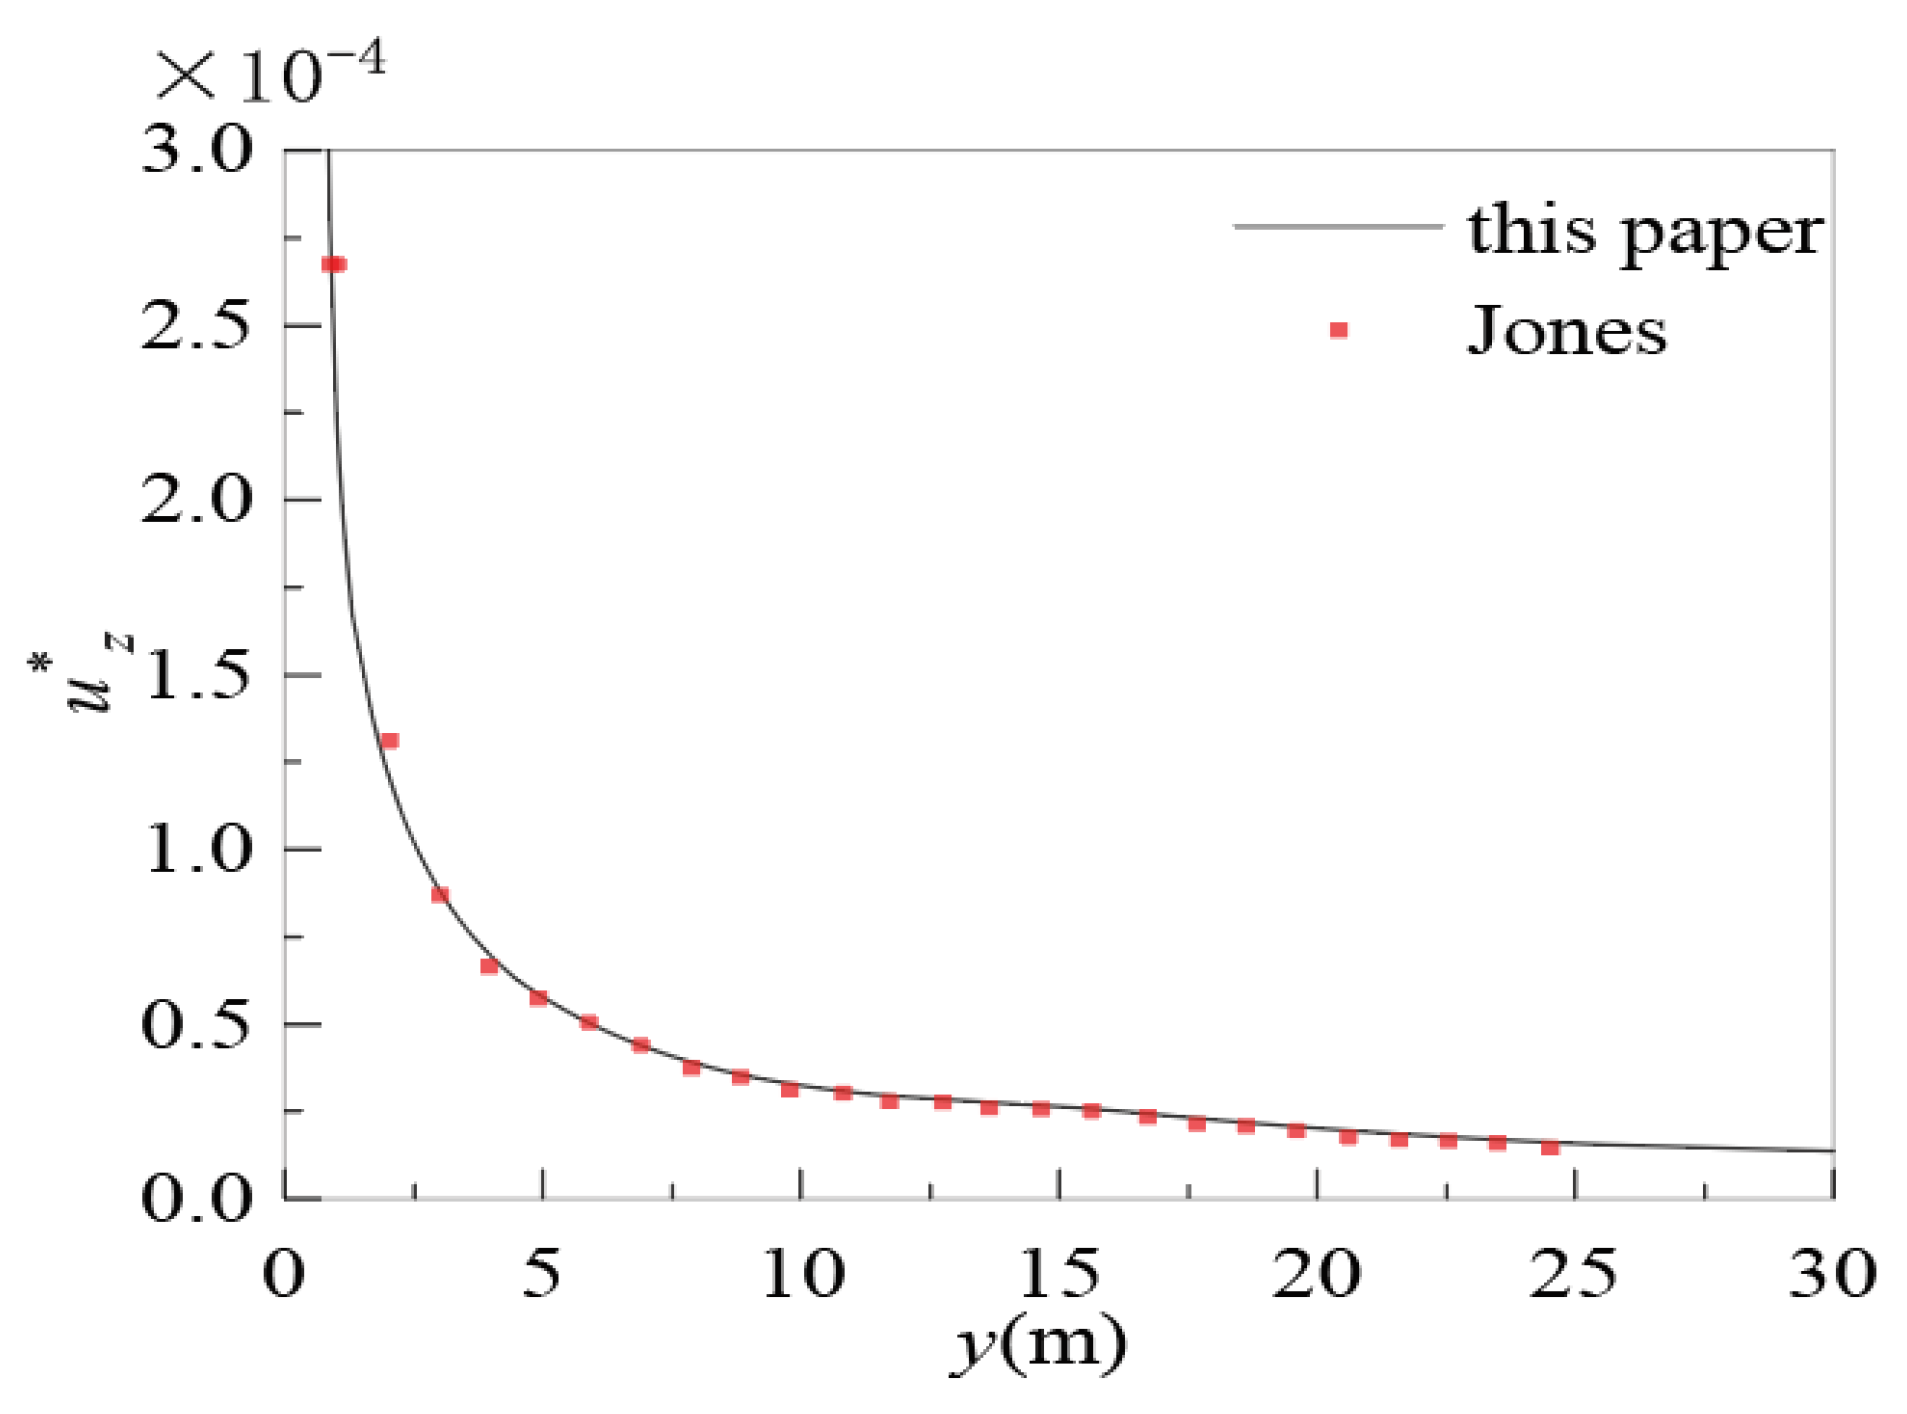
When Biot modulus M, effective stress coefficient α, fluid density ρ f , width of moving load b, and mass coupling parameter m are close to 0, the saturated soil half-space model can be used to simulate the wave movement in a single elastic half-space. In this paper, all parameters are taken as 0.0001, h is small enough, and the same parameters are taken from the upper and lower layers to simulate the elastic half-space. The elastic soil parameters and load values consistent with Jones [20] are selected.
The calculated results in this paper are compared with those of the analytical solution of the elastic half-space. Figure 2 shows the normalized vertical ground displacement response u z * under a load frequency of 64 Hz. ( u z * = μ R u z a b q ; μ R = 1 × 10 7 N/m2).
As can be seen from Figure 2, the results of this paper are basically consistent with Jones’ results.

3.2.2. Analysis in Wave Number Domain

To investigate the influence of water level variations on the ground displacement response under a moving harmonic load, a numerical analysis in the wavenumber domain was conducted. A rectangular load with dimensions of 2a × 2b = 0.6 m × 0.6 m and uniform intensity q = 1/(a × b) was applied, moving along the x-axis at a speed of c = 100 m/s and with a vibration frequency of f = 30 Hz.
The specific parameters of the saturated soil are as follows: μ = 2 × 10⁷ N/m2, λ = 2 × 10⁷ N/m2, n = 0.3, ρs = 2000 kg/m3, ρf = 1000 kg/m3, β = 0.01, α = 1, M = 2.4 × 10⁸ N/m2, b = 1 × 10⁸ kg/(m3·s), and a = 1. The elastic constants of the elastic layer are the same as those of the saturated soil, and the parameters M, α, b, ρ f , and m of the saturated soil liquid are taken as 0.0001. The matlab program is used to calculate and normalize the vertical displacement. u z * = μ u z / ( a b q ) is used to evaluate the change in vibration.
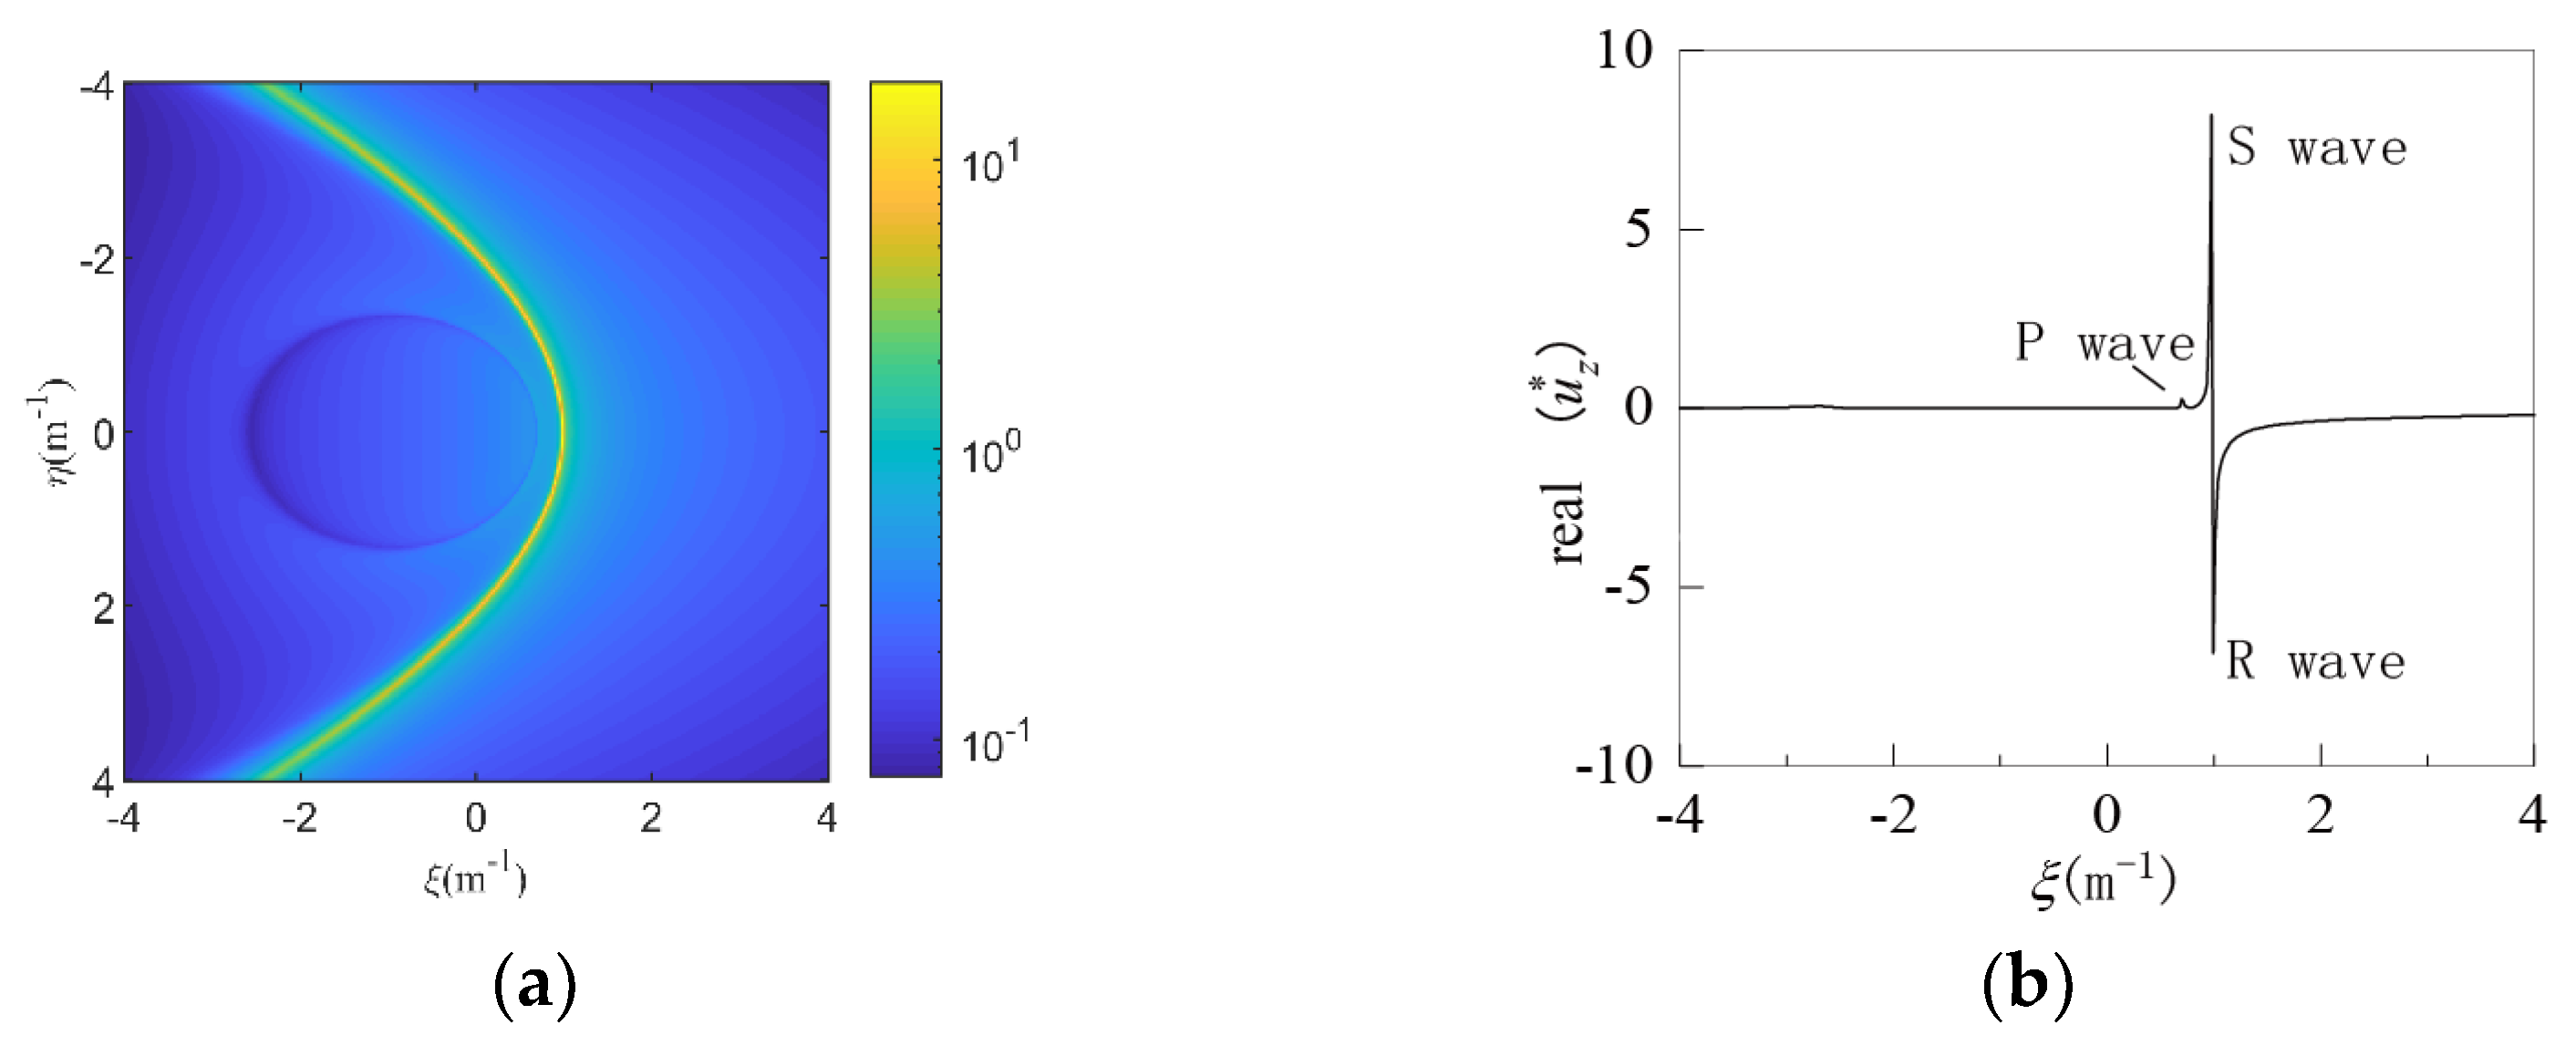
Figure 3, Figure 4 and Figure 5 present the displacement amplitude in the wavenumber domain, derived from Equation (30), for four configurations: an elastic half-space and a saturated half-space overlaid by elastic layers with thicknesses of 0.5 m, 1 m, and 5 m.
As shown in Figure 3, the response for the elastic half-space is dominated by three distinct peaks in the wavenumber spectrum, corresponding to the Rayleigh (R), shear (S), and compressional (P) waves, respectively. In contrast, Figure 4 and Figure 5 demonstrate that the wavefield becomes significantly more complex when a saturated half-space is overlain by an elastic layer. The observed wave field in the saturated half-space with an overlying elastic layer is significantly more complex than that in a homogeneous elastic half-space. This is an expected result, consistent with classical wave theory [21] and prior studies on saturated media [22,23,24]. The complexity arises from mode conversion at the layer interface, where incident P- and SV-waves generate reflected and refracted waves of both types, leading to a complex interference pattern that governs the surface displacement response.
The influence of the water table depth is evident in these results. When the water level is relatively shallow, h = 0.5 m or 1 m, the wave reflection at the saturated elastic interface strongly affects the ground vibration, generating additional peaks and spectral broadening. As the groundwater level deepens, h = 5 m. Figure 5 reflects that the wave energy decreases and the wavenumber distribution converges towards the elastic half-space. In this case, the ground vibration is primarily governed by R and S waves, with minimal contribution from interface-related wave components.

3.2.3. Analysis in Space Domain

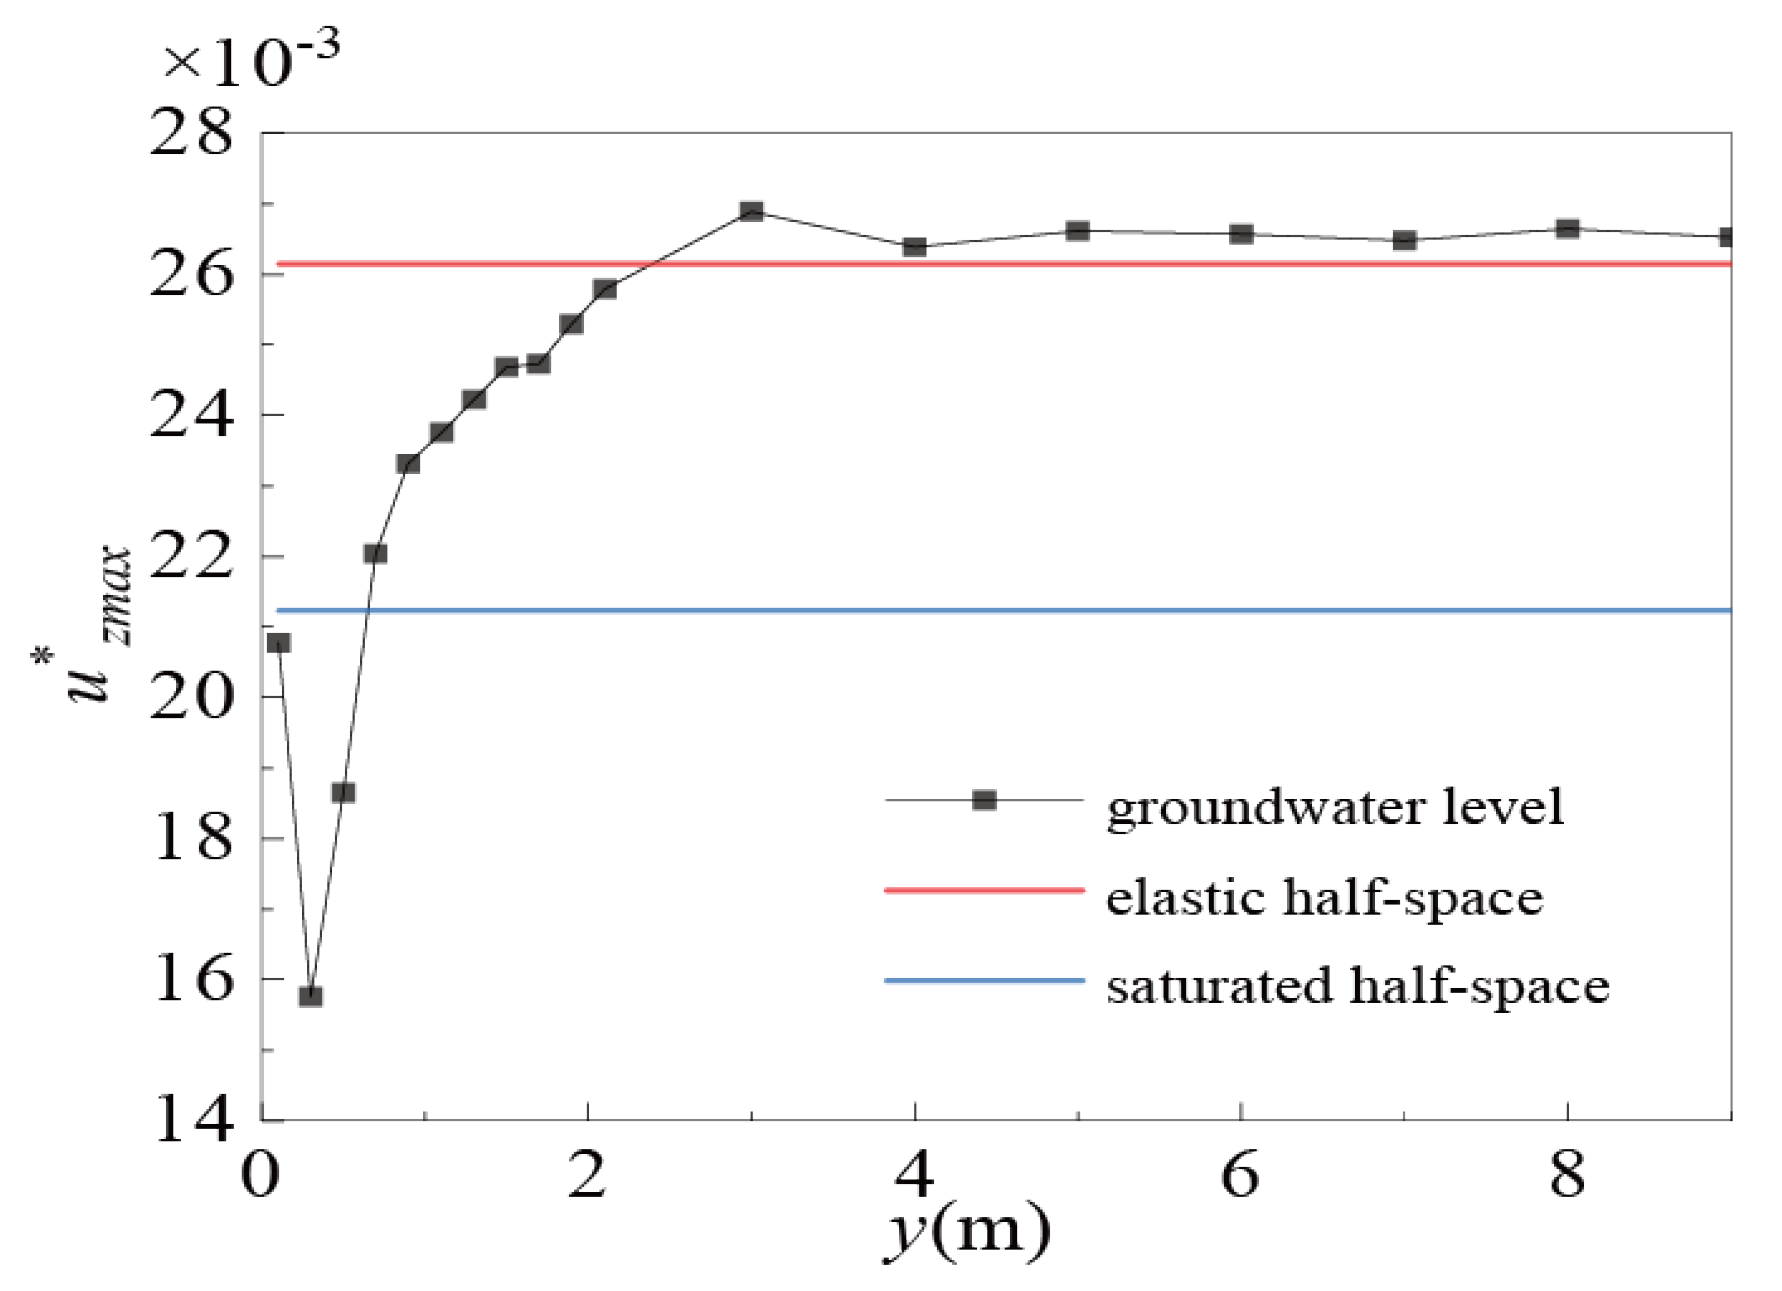
Figure 6 shows the variation curve of the maximum vertical displacement amplitude under different groundwater levels.
As can be seen from Figure 6, when the lower water level is close to the surface, the maximum displacement of the surface is close to the saturated half-space. With the decrease in water level, the displacement begins to decrease, and when the depth of water level reaches 0.3 m, the surface displacement appears at the minimum value. With the continuous decrease of water level, the maximum displacement amplitude of the surface shows an increasing trend. When the water level depth exceeds 4 m, it eventually tends to stabilize.
When the water level is relatively high, the reflected wave has a great influence on the dynamic response of the surface. However, with the increase in the distance, the incident wave rapidly attenuates, the energy of the reflected wave gradually decreases, and there is a secondary attenuation in the process of transmission to the ground. At this time, the dynamic response of the foundation is similar to an elastic half-space.
Figure 7a shows the variation in surface displacement amplitude with distance attenuation for fetched depths of 0.5 m, 1 m, 2 m, and 5 m. Figure 7b shows the curves of the local enlarged portion of the box in Figure 7a.
As can be seen from Figure 7, when the water level depth is 0.5 m and 1 m, the maximum surface displacement is smaller than that of 2 m and 5 m, the displacement amplitude decays more slowly, and the attenuation curve fluctuates in a disorderly way due to the different amplitudes and wavelengths of various waves and the existence of a certain phase difference, which is caused by superposition of each other.

4. Research on Natural Isolation Effect of Soil Mass

4.1. Establishment of Vibration Isolation Model

4.1.1. Model Assumptions

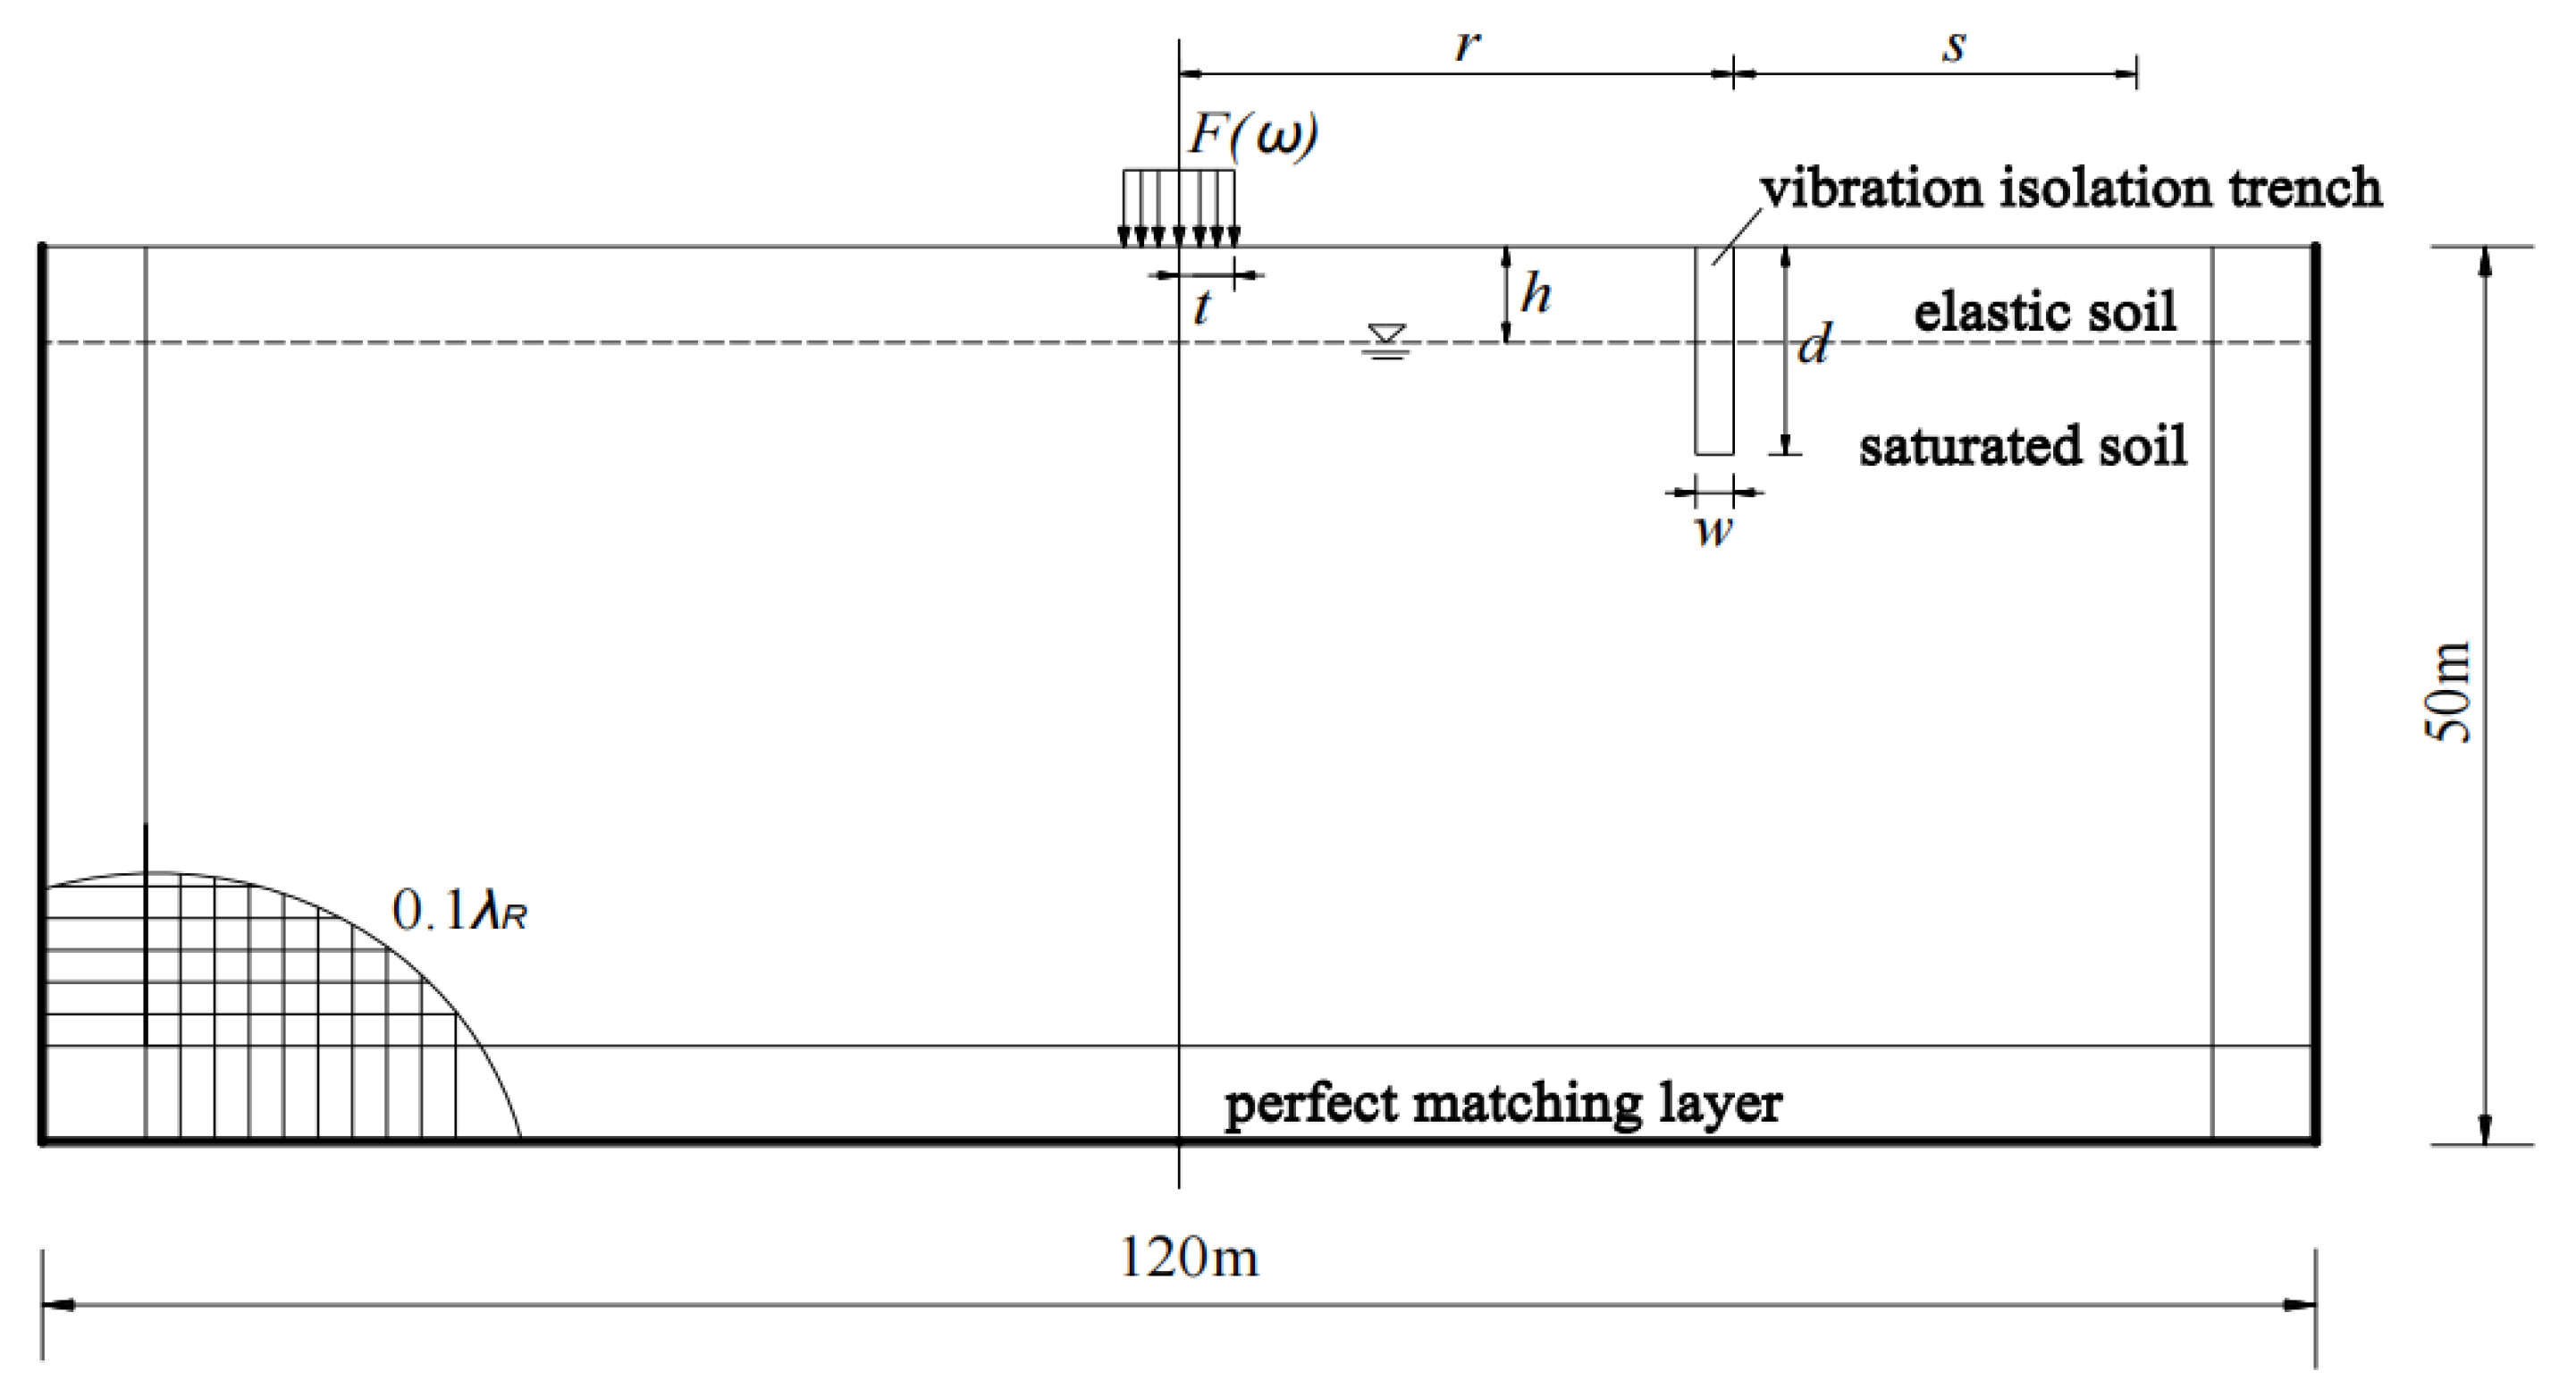
Qiu [21] Research shows that two-dimensional models can achieve relatively good results in the analysis of vibration isolation trenches. A 2D overlying elastic layer saturated soil foundation vibration isolation trench model was established using COMSOL, as shown in Figure 8. Yang [22] believes that when the height and width of the finite element model are 1–1.5 times the maximum shear wavelength, more accurate results can be obtained, and the width of the model is 120 m and the height is 50 m.
An elastic medium is used to simulate the upper elastic layer and the in-filled trench, and the constitutive relationship is as follows in Equation (32):
σ i j e = λ e δ i j θ e + μ i , j e ( u i , j e + u j , i e )
where u i e ( i = 1 , 2 , 3 ) refers to the skeleton displacement of solid soil; θ e represents the volumetric strain of soil skeleton per unit volume; θ e = u i , i e ; σ i j represents the total stress component of soil; and λ e and λ e are the Lame constants in elastic media.
The momentum equation in an elastic medium is
σ i , j e + f i v = ρ e u ¨ i e
where f i v represents physical strength under external action; ρ e represents the density of the elastic medium.
Bring Equation (32) into Equation (33), f i v = 0 , and the Navier equation for wave motion in elastic media can be obtained:
( λ e + μ e ) ( u ¨ e ) + μ e 2 u e = ρ e u ¨ e
The frequency domain form is
( λ e + μ e ) ( u ¨ e ) + μ e 2 u e = ω 2 ρ e u e
Porous saturated media are often simulated by the u-p form of Biot equation in COMSOL. The u-w form of Biot equation is
μ 2 u + ( λ + α 2 M + μ ) ( u ) + α M ( w ) = ρ u ¨ + ρ f w ¨
α M ( u ) + M ( w ) = ρ f u ¨ + m w ¨ + b w ˙
The continuous permeability equation is as follows:
p = α M θ + M e
The equation of liquid motion is as follows:
p , i = ρ f u ¨ i + m w ¨ i + b w ˙ i
Take Equations (38) and (39) into the u-w Biot equation and perform the Fourier transform to get the u-p Biot equation in the frequency domain:
μ 2 u + ( λ + μ ) ( u ) + ω 2 ( ρ ρ f γ ) u ( α ρ f γ ) p = 0
2 p + ω 2 γ M p + ω 2 ( α γ ρ f ) u = 0
where
γ = m + i b / ω

4.1.2. Model Size and Mesh Division

The size of the model and the size of the grid are crucial to accurately simulate the propagation characteristics of the wave in the medium, so it is necessary to set a reasonable model size and grid size to meet the requirements of calculation accuracy. The density of the finite element mesh division is related to the shear wavelength of the soil medium. When the mesh size L and the shear wavelength λ s of the soil medium meet L λ s / 12 , more accurate results can be obtained. In the position outside the vibration source, the free quadrilateral mesh is selected, and the maximum mesh size is 0.1 λ s .

4.1.3. Damping Settings

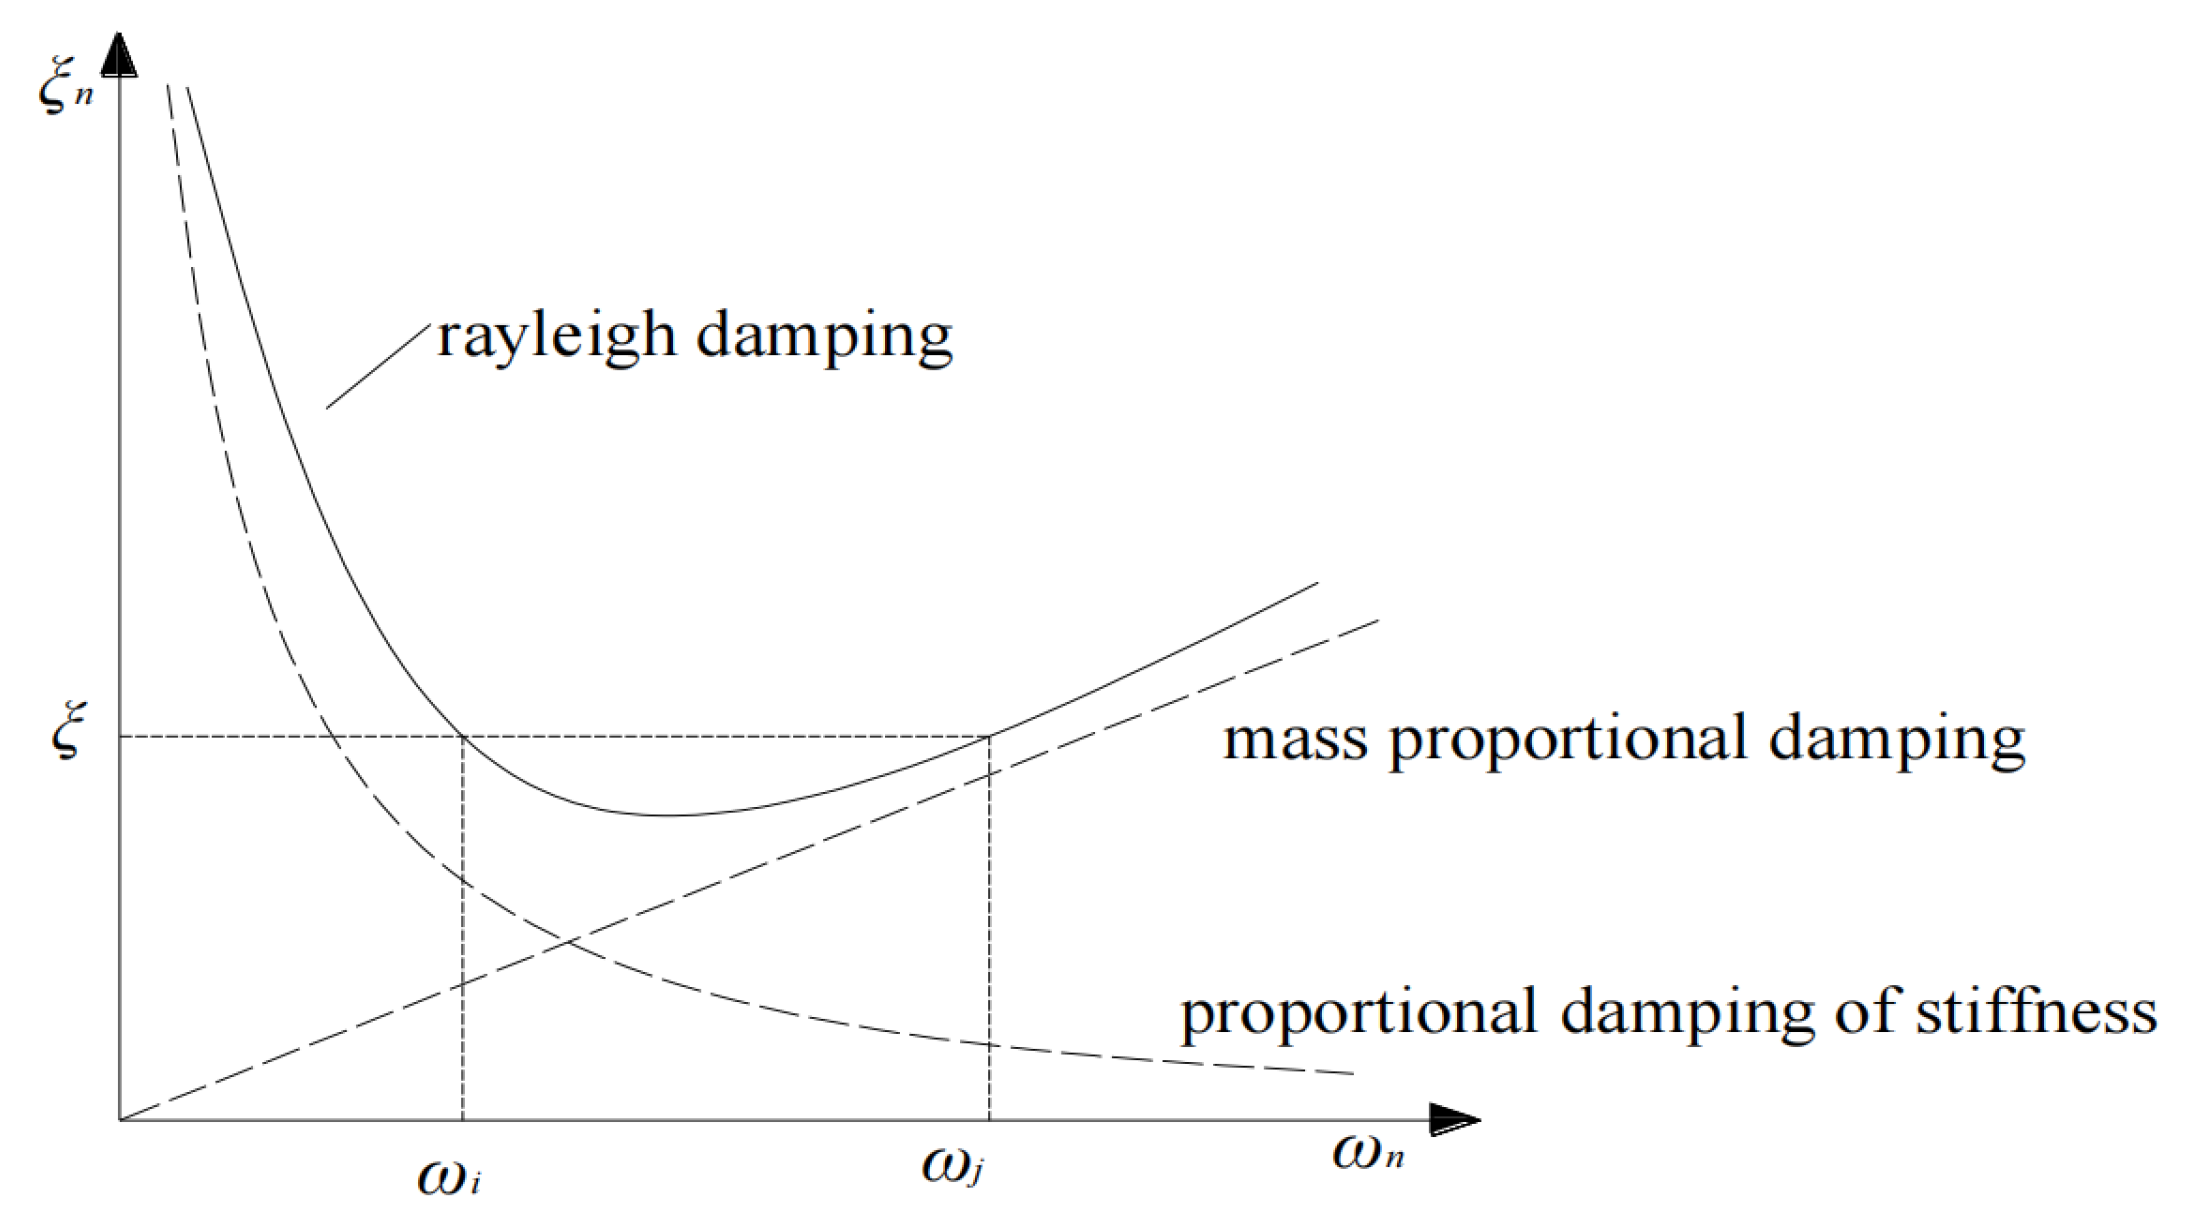
The existence of damping leads to the constant attenuation of the wave propagation energy in the elastic medium. Rayleigh damping is adopted for the soil mass. The calculation model is shown in Figure 9.
The Rayleigh damping matrix is a combination of a mass matrix and a stiffness matrix:
ξ = 1 2 ( α ω + β ω )
where α is the scale coefficient of the mass matrix; β is the scale coefficient of the stiffness matrix; [C] is the damping matrix of the structure; [M] is stiffness matrix of the structure; and [K] is mass matrix of the structure.
According to the principle of orthogonality of modes,
ξ i = 1 2 ( α ω i + β ω i )
where ξ i is damping ratio of the ith order natural frequency; ω i is the ith order natural frequency.
Take two different natural frequencies ( ω i , ω j ) and the corresponding damping ratio ( ξ i , ξ j ) into Equation (44) to obtain α and β [23]:
α = 2 ( ξ i ω j ξ j ω i ) ω j ω i ( ω j + ω i ) ( ω j ω i )
β = 2 ( ξ i ω j ξ j ω i ) ( ω j + ω i ) ( ω j ω i )
It is usually assumed in the calculation that if the damping ratio of each mode is the same, then
α = 2 ω j ω i ξ ( ω j + ω i ) ,   β = 2 ξ ( ω j + ω i )
In this paper, the load frequency is selected in the range of 5–60 Hz, 5 Hz and 60 Hz are selected to calculate the damping proportional coefficient, and the damping ratio is 0.02.
There are many ways to deal with artificial truncation boundaries in COMSOL, and the perfect matching layer is usually used in frequency domain research, and the corresponding stretch function of the perfect matching layer is adopted. The form of the stretch function in each coordinate direction is the same, defined as the function f(ξ) of dimensionless coordinates ξ, where the value of ξ is between 0 and 1. f(ξ) can be used to obtain the reset shift Δx in any direction; its specific expression is as follows:
Δ x = λ f i ( ξ ) Δ w ξ
where λ is the typical wavelength, representing the maximum wavelength of the wave in the medium; Δ w is the true thickness of the perfectly matched layer.
The polynomial stretch function expression is as follows:
f p ( ξ ) = s ξ p ( 1 i )
The expression for the rational stretch function is as follows:
f r ( ξ ) = s ξ ( 1 3 p ( 1 ξ ) + 4 i 3 p ( 1 ξ ) )
where p represents the curvature parameter; s represents the scale factor.
In the modeling process, the thickness of the perfectly matched layer is usually set to about one-tenth of the vibration source to the boundary, and the grid needs to match the direction of the coordinates in the stretch function. In this paper, the thickness of the perfectly matched layer is set to 6 m, the stretch function adopts polynomial form, and the number of grid layers is eight, as shown in Figure 10.
In this paper, the displacement amplitude reduction coefficient proposed by Woods [24] is used to evaluate the vibration isolation effect of the in-filled trench and the empty trench. Its expression for A R is as follows:
A R = u 1 u 0
where u 1 represents the displacement amplitude of a certain position on the surface after vibration isolation measures are taken; u 0 represents the displacement amplitude of the same location on the ground surface when no vibration isolation measures are taken. The smaller the A R , the better the vibration isolation effect.
Since the A R of different positions after the isolation trench is different, to reflect the isolation effect more comprehensively, the average amplitude reduction coefficient A R R is introduced, and its expression is as follows:
A R R = 1 s x 1 x 2 A R ( x ) d x
where x1 and x2 represent the starting point and end point coordinates of the isolation effect area behind the barrier; s represents the effective length of the isolated region, where s = x 1 x 2 , at 15 m in this paper.

4.2. Model Verification

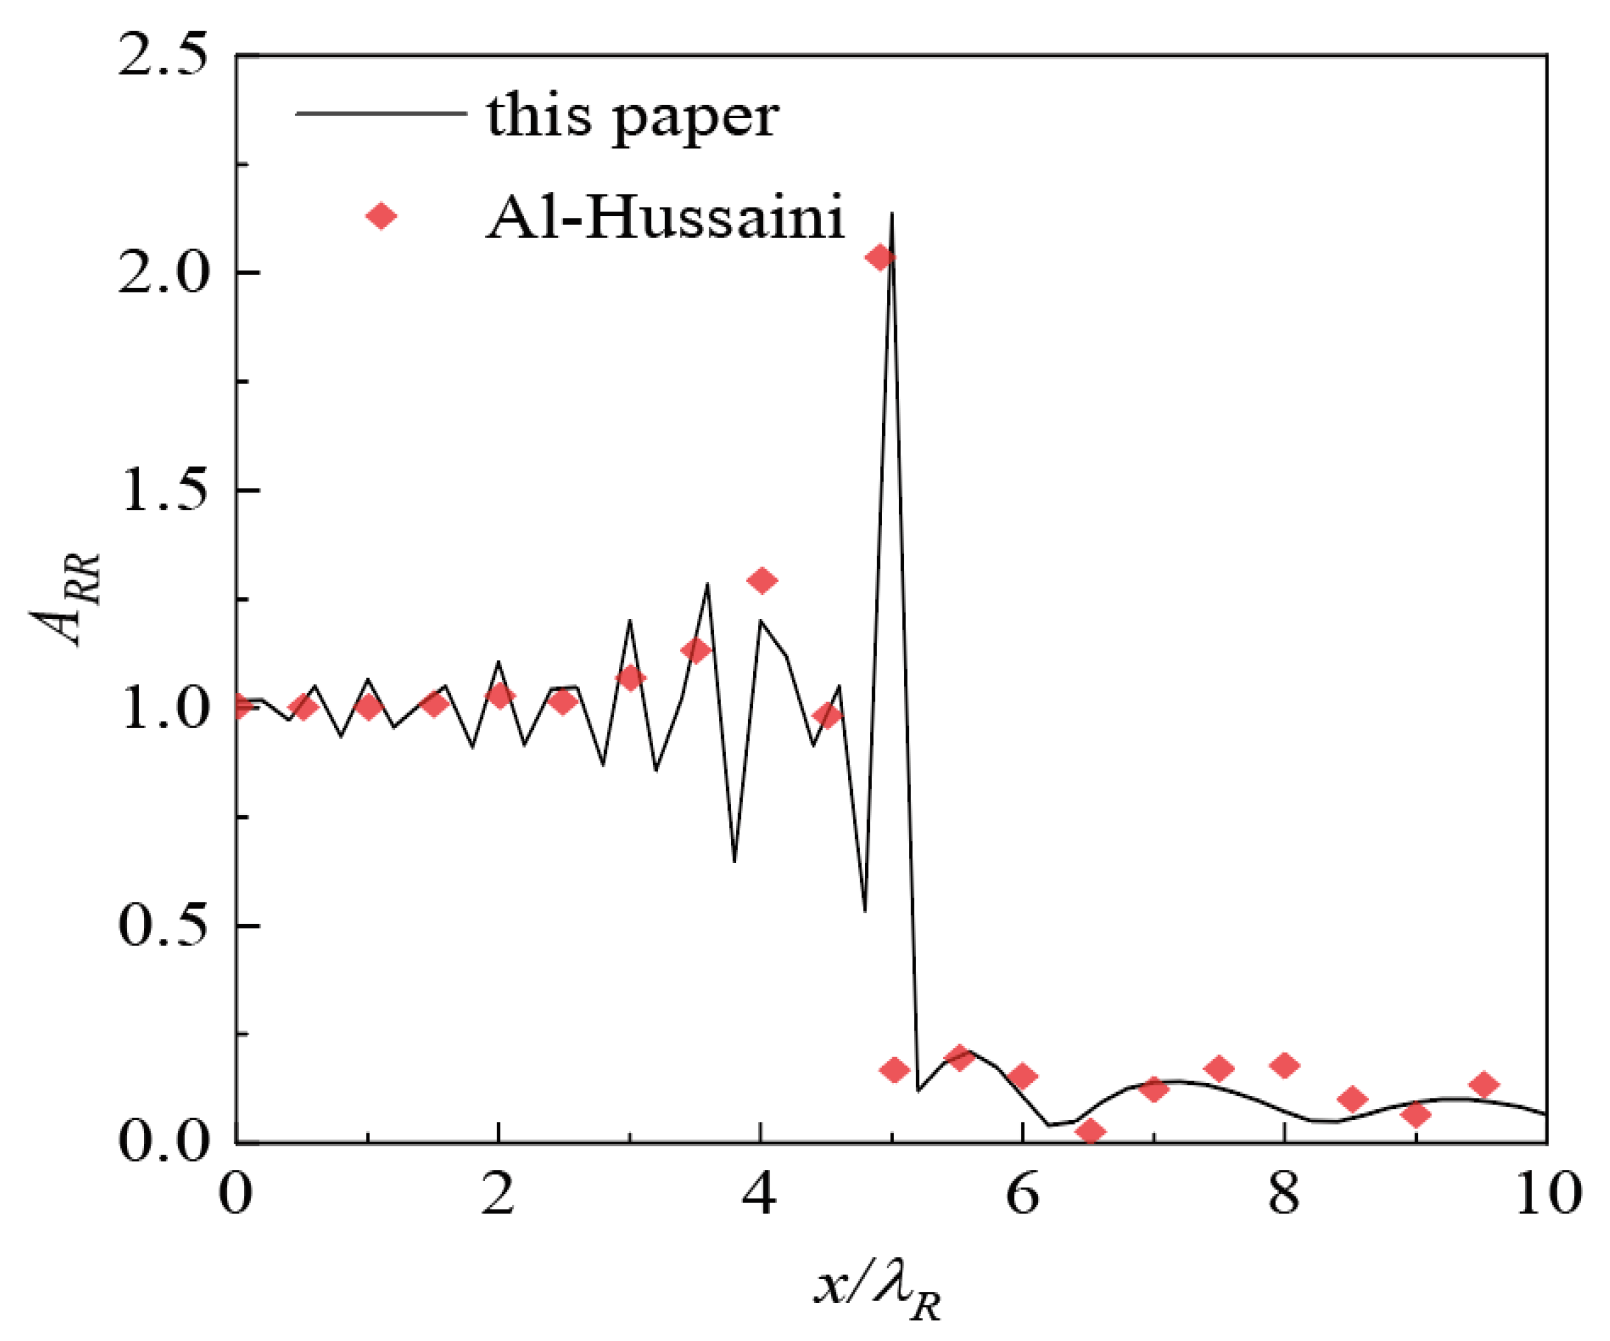
To verify the correctness of the model, the lower saturated soil is degraded into an elastic soil medium, and the vibration isolation effect of the ditch is calculated by using the parameters of Al-Hussaini [25]. Figure 11 shows the curve of the A R versus the normalized distance. The calculated results are in excellent agreement with the analytical results, verifying the correctness of the model.

4.3. Parameter Analysis

Elastic soil adopts the same elastic parameters and damping ratio as saturated soil. The specific values of saturated soil are shown in Table 1.
The parameter values in Table 1 were selected to represent a competent, saturated sandy soil. The elastic properties (μ, λ), densities (ρs, ρf), and permeability (k) are consistent with typical values for medium-dense sands [26,27]. Fluid compressibility and the Biot parameters (α, a) reflect simplified yet realistic assumptions for granular saturated media [28]. This parameter set ensures theoretical consistency and allows for a focused analysis of the coupling mechanisms between pore pressure and the soil skeleton under dynamic loading.
The in-filled trench was constructed using C30 concrete as the filling material. C30 refers to a standardized grade of concrete based on its characteristic compressive strength. The specific material parameters for the concrete mix used in this study are provided in Table 2.
A simple harmonic homogeneous load with a length of 1.5 m is adopted, with a size of 1000 N and a frequency of 30.6 Hz. The R wave velocity of the elastic layer is 91 m/s and the wavelength λR is 3 m. For convenience of analysis, the dimensions of the trench and the water level height were normalized with respect to the wavelength of the R-wave in the upper elastic soil layer. The dimensionless depth of the water level is H = h/λR, the depth of the isolation trench is D = d/λR, the width of the isolation trench is W = w/λR, and the distance from the isolation trench to the source is R = r/λR.

4.3.1. Influence of Water Level on Vibration Isolation Ditch

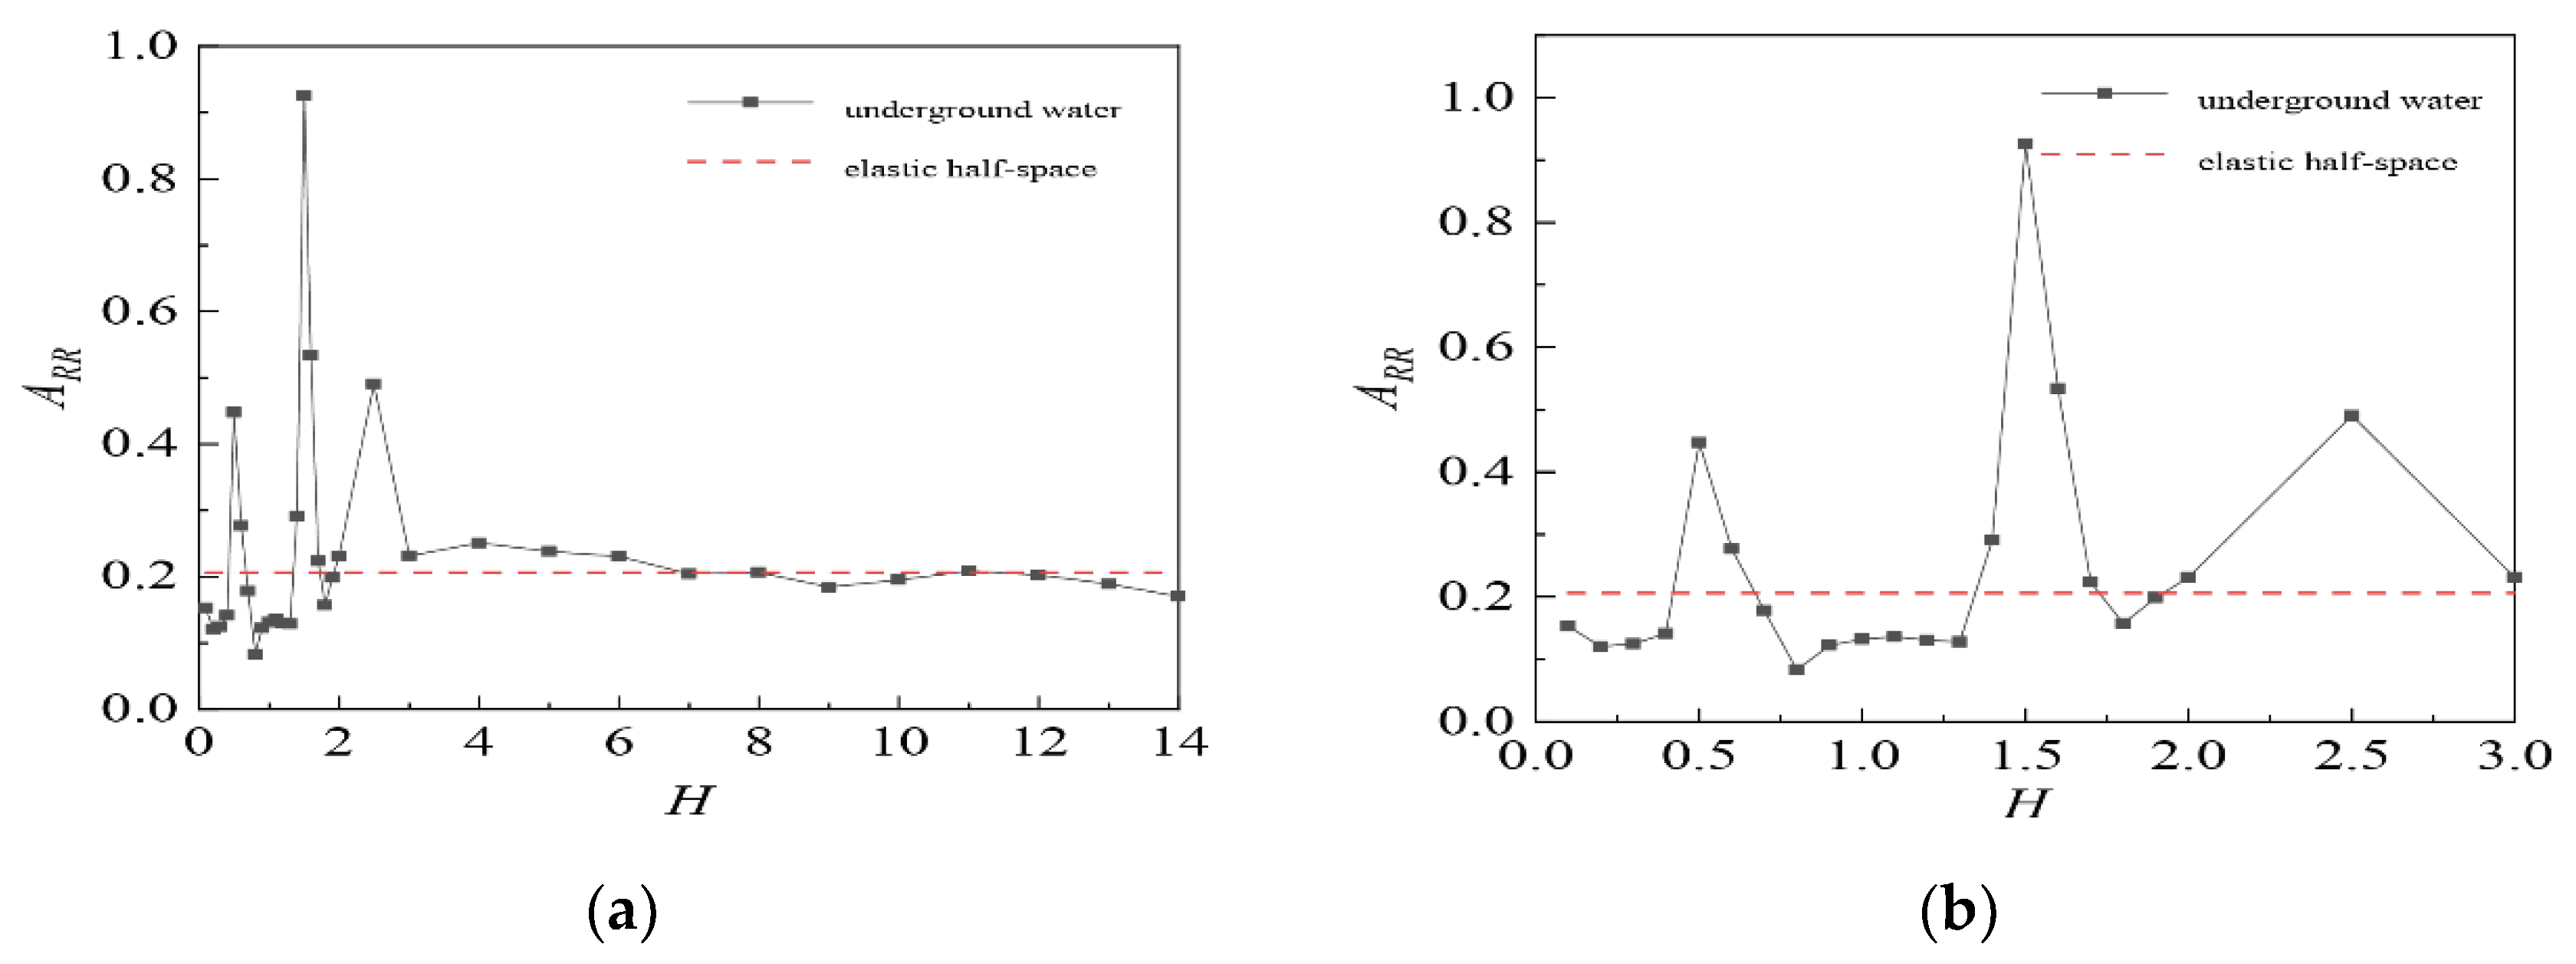
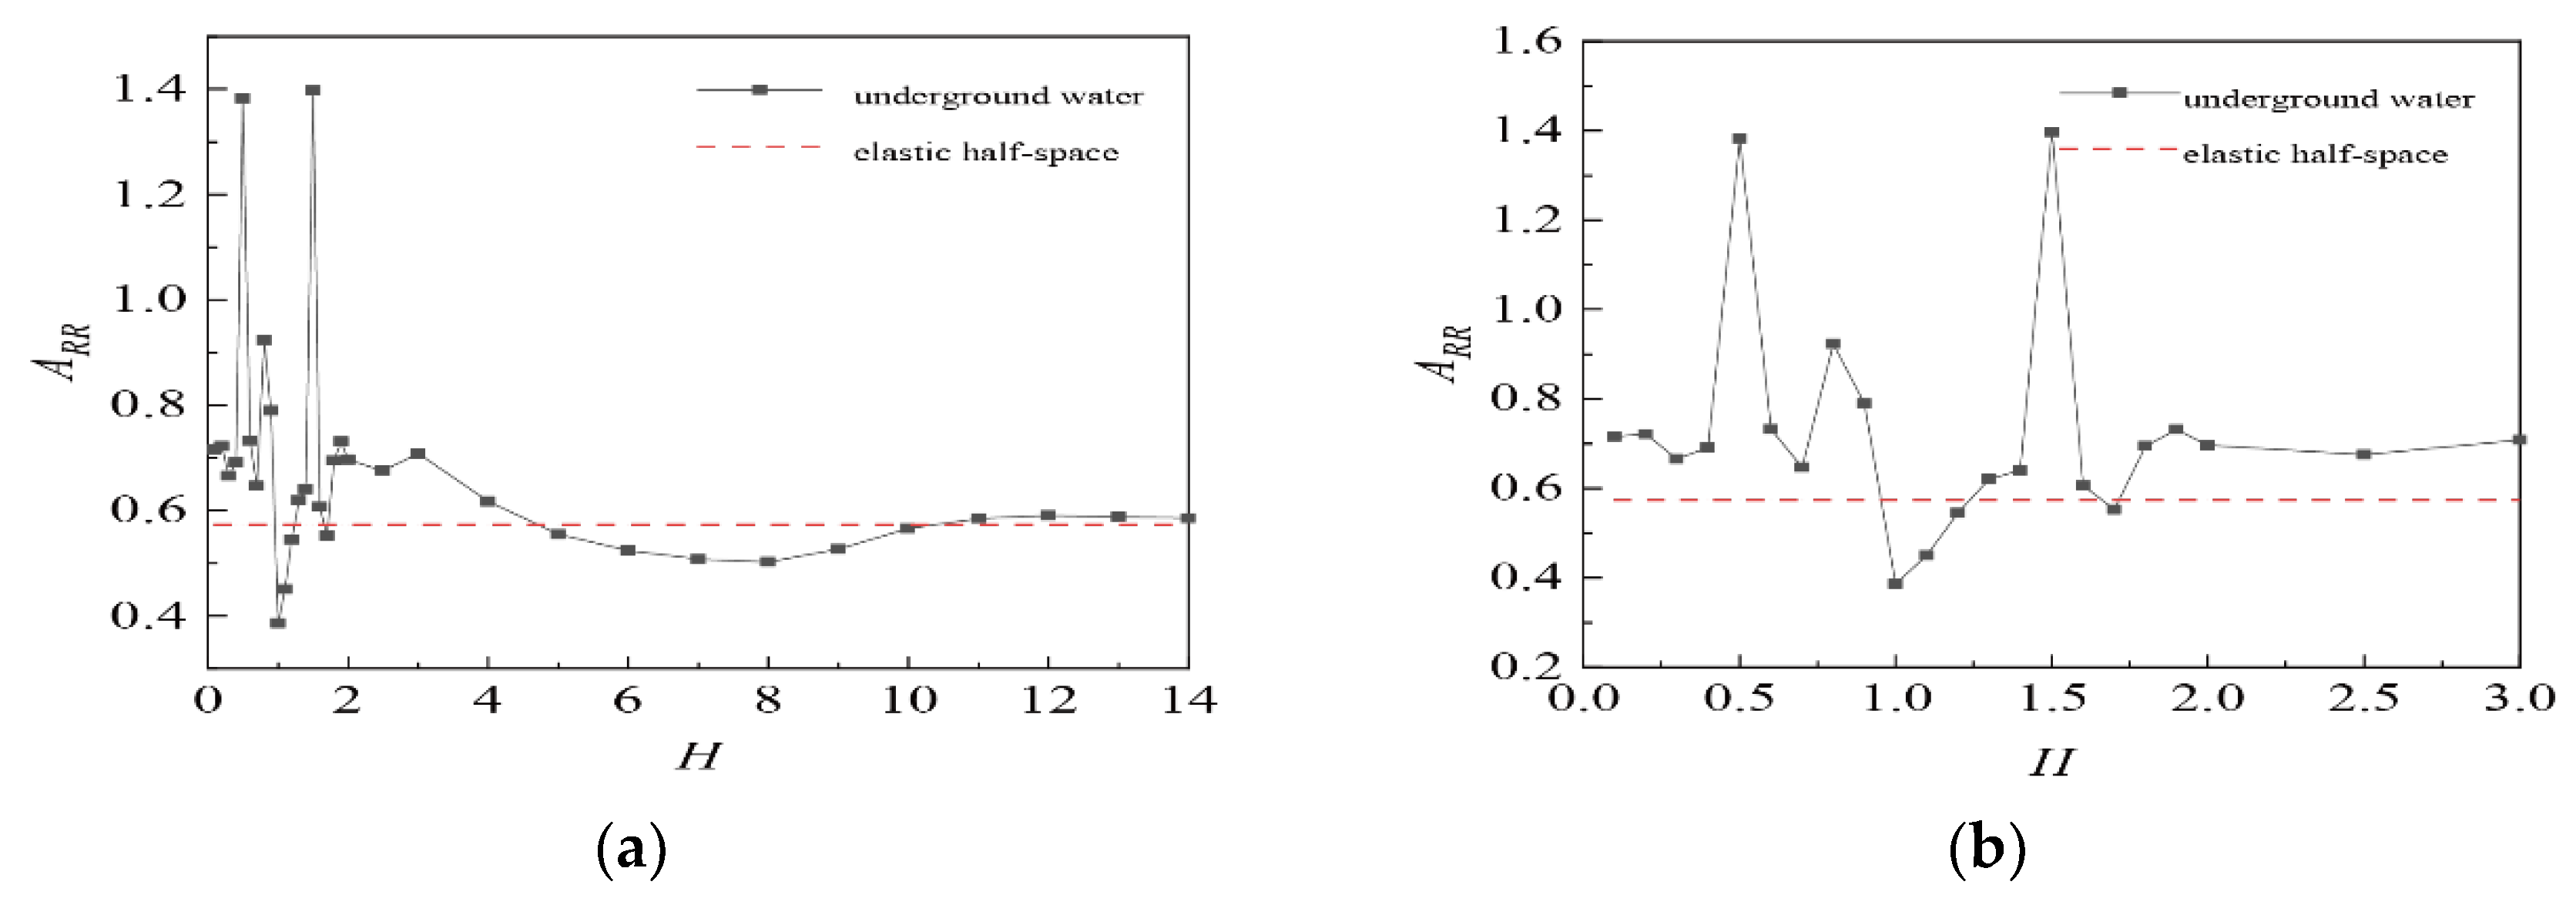
Normalized water level H was set as 0–14 for analysis, trench width W = 0.3, trench depth D = 1, and distance R = 5. Figure 12 and Figure 13 show the curves of ARR in an empty trench and an in-filled trench as the water level height changes, where (a) is the change analysis of 0 ≤ H ≤ 14, and (b) is the part of 0 ≤ H ≤ 3 selected for detailed analysis.
It can be seen from Figure 12 and Figure 13 that
(1)
When the water level H ≤ 3, the water level change has a greater impact on the vibration isolation trench, and when the water level continues to decrease, the vibration isolation effect of the water level change is small. The water level is in the range of 0–3, the ARR in most positions of the empty trench is smaller than that in the elastic half-space, the ARR in the concrete in-filled trench is larger, and the vibration isolation effect of the empty trench is obviously better than that of the in-filled trench.
(2)
When the water level is near 0.5, 1.5, and 2.5 in the empty trench and 0.5 and 1.5 in the in-filled trench, ARR suddenly increases, and even exceeds 1 in the in-filled trench, because the elastic layer above these water levels resonates, consistent with the findings of Schevenels [29] (When n = 1, the thickness of the resonant elastic layer is 1.41 m, and the normalized water level height is H = 0.47; when n = 2, H = 1.41; when n = 3, H is 2.35, which basically corresponds to the resonance position in the figure).
In order to further analyze the influence of resonance on vibration isolation zone, normalized water levels of 0.3, 0.5, 1.0, 1.5, and 2.0 are selected for research. Figure 14 and Figure 15 show the variation curves of amplitude attenuation factor A R after empty and in-filled trenches at different water levels, respectively.
As can be seen from Figure 14 and Figure 15, resonance does not suppress the vibration of all points behind the trench; at the resonance water level, the isolation trench in most positions still plays a role, but at the local position, the vibration behind the trench is not reduced, yet the phenomenon of displacement amplification occurs, resulting in the increase of ARR; Furthermore, the water level at which the resonance effect of the open trench exerts the most significant influence is 1.5, while this effect is even more pronounced at a water level of 0.5 for the filled trench. The position of ARR amplification is basically the same, but the displacement amplification factor in the in-filled trench is much larger than that in the empty trench.

4.3.2. Influence of Load Frequency on Vibration Isolation Trench

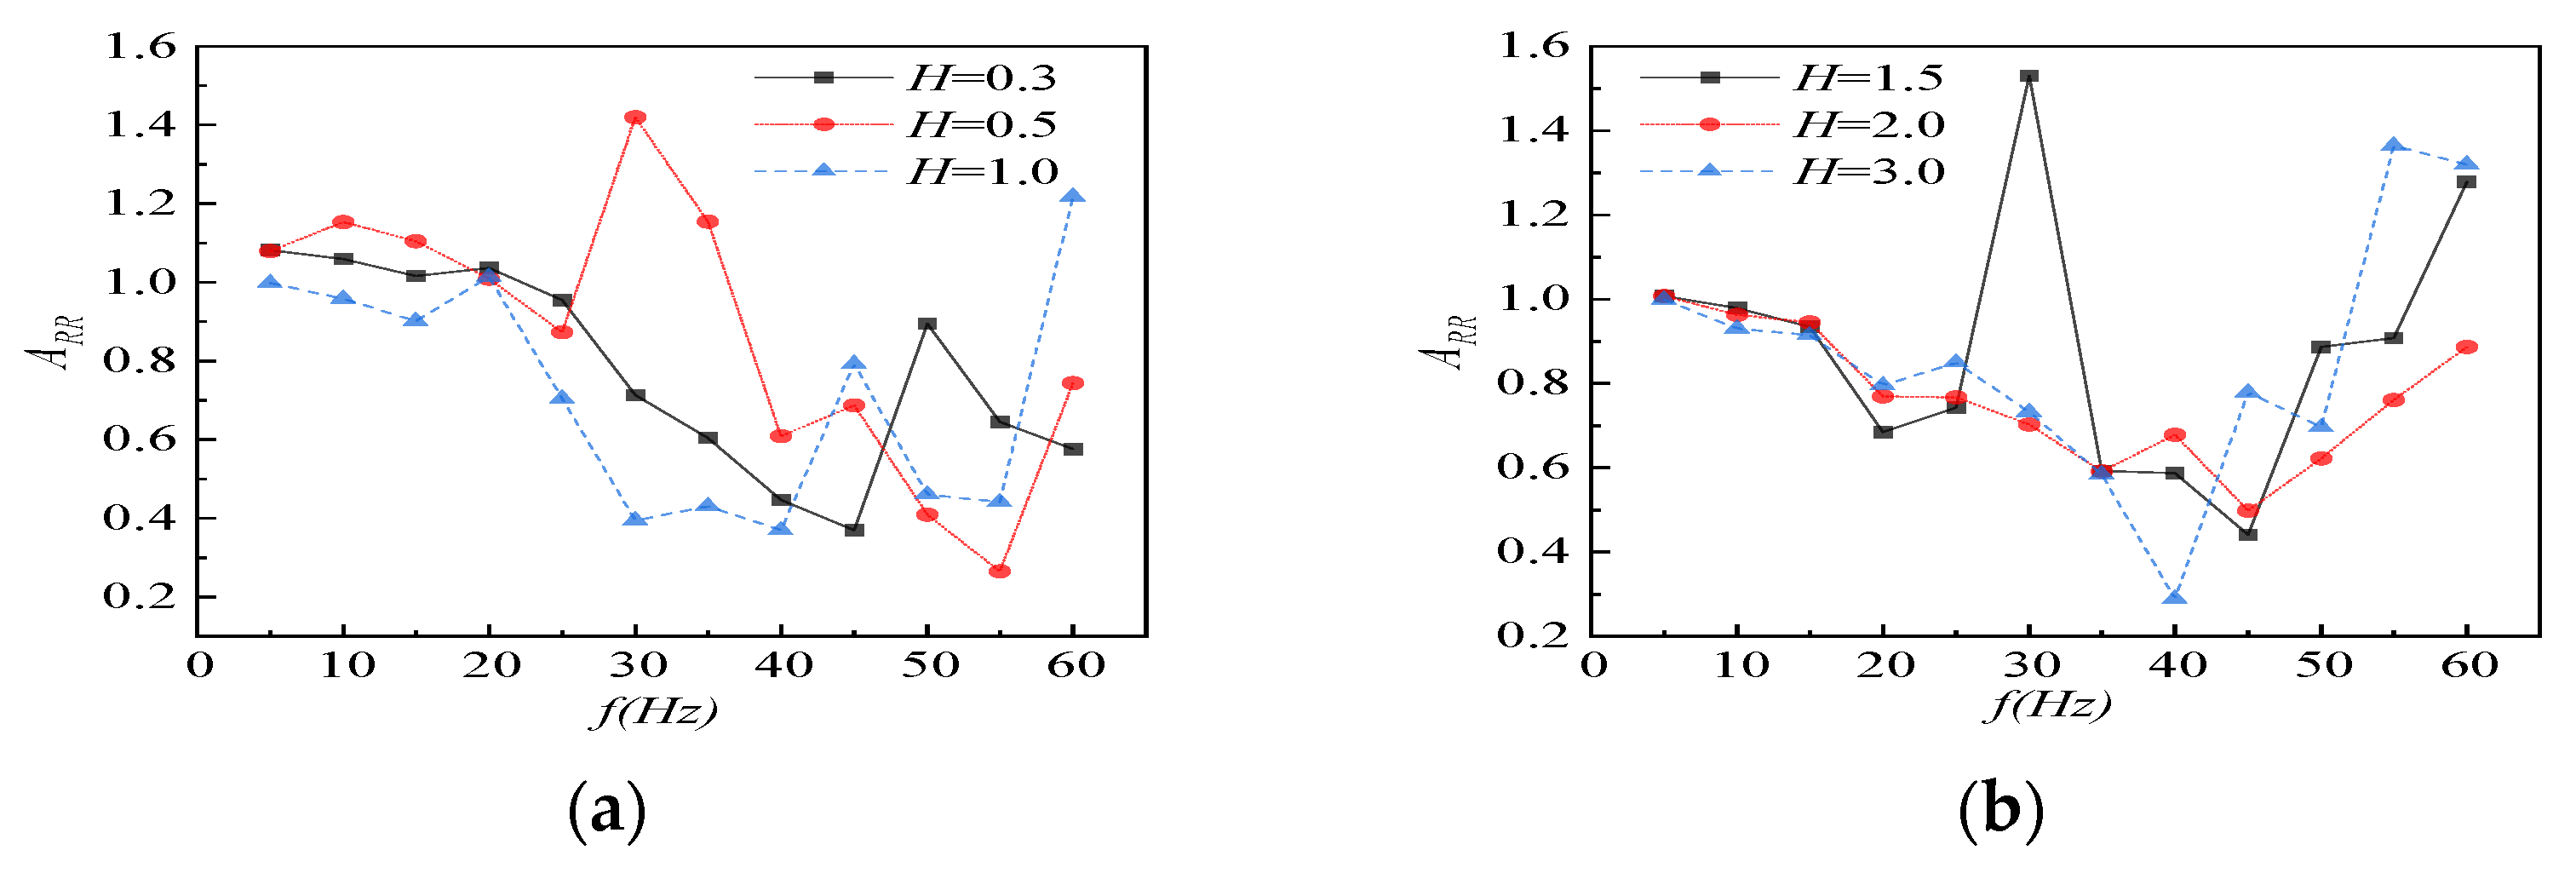
The load frequency range is 5–60 Hz, and the water table H is 0.3, 0.5, 1,1.5, and 2.5. Figure 16 and Figure 17 are the curves of ARR changing with frequency under different water levels, respectively.
As can be seen from Figure 16 and Figure 17,
(1)
The results show that vibration isolation effectiveness is not monotonic but highly frequency-dependent. These two types of trenches are most effective in the medium frequency range of approximately 20–50 Hertz. However, at very high frequencies, if they exceed 50 Hertz, it is consistent with the established principles of wave barrier design. This aligns with the work of Yang et al. [22]
(2)
The R wave, which is the main influence on far-field vibration isolation, is isolated, and the component of the P wave becomes larger. The influence on the vibration isolation effect in the overlying elastic soil layer is mainly the P wave. In the figures, at different water levels, ARR > 1 exists, indicating that both vibration isolation trenches have certain amplification frequencies that match the resonance frequency of the P wave, which is even more unfavorable for the vibration isolation effect. Both types of vibration isolation trenches have the phenomenon of vibration isolation failure caused by resonance at the same water level.

4.3.3. Influence of Water Permeability Coefficient on Vibration Isolation Effect

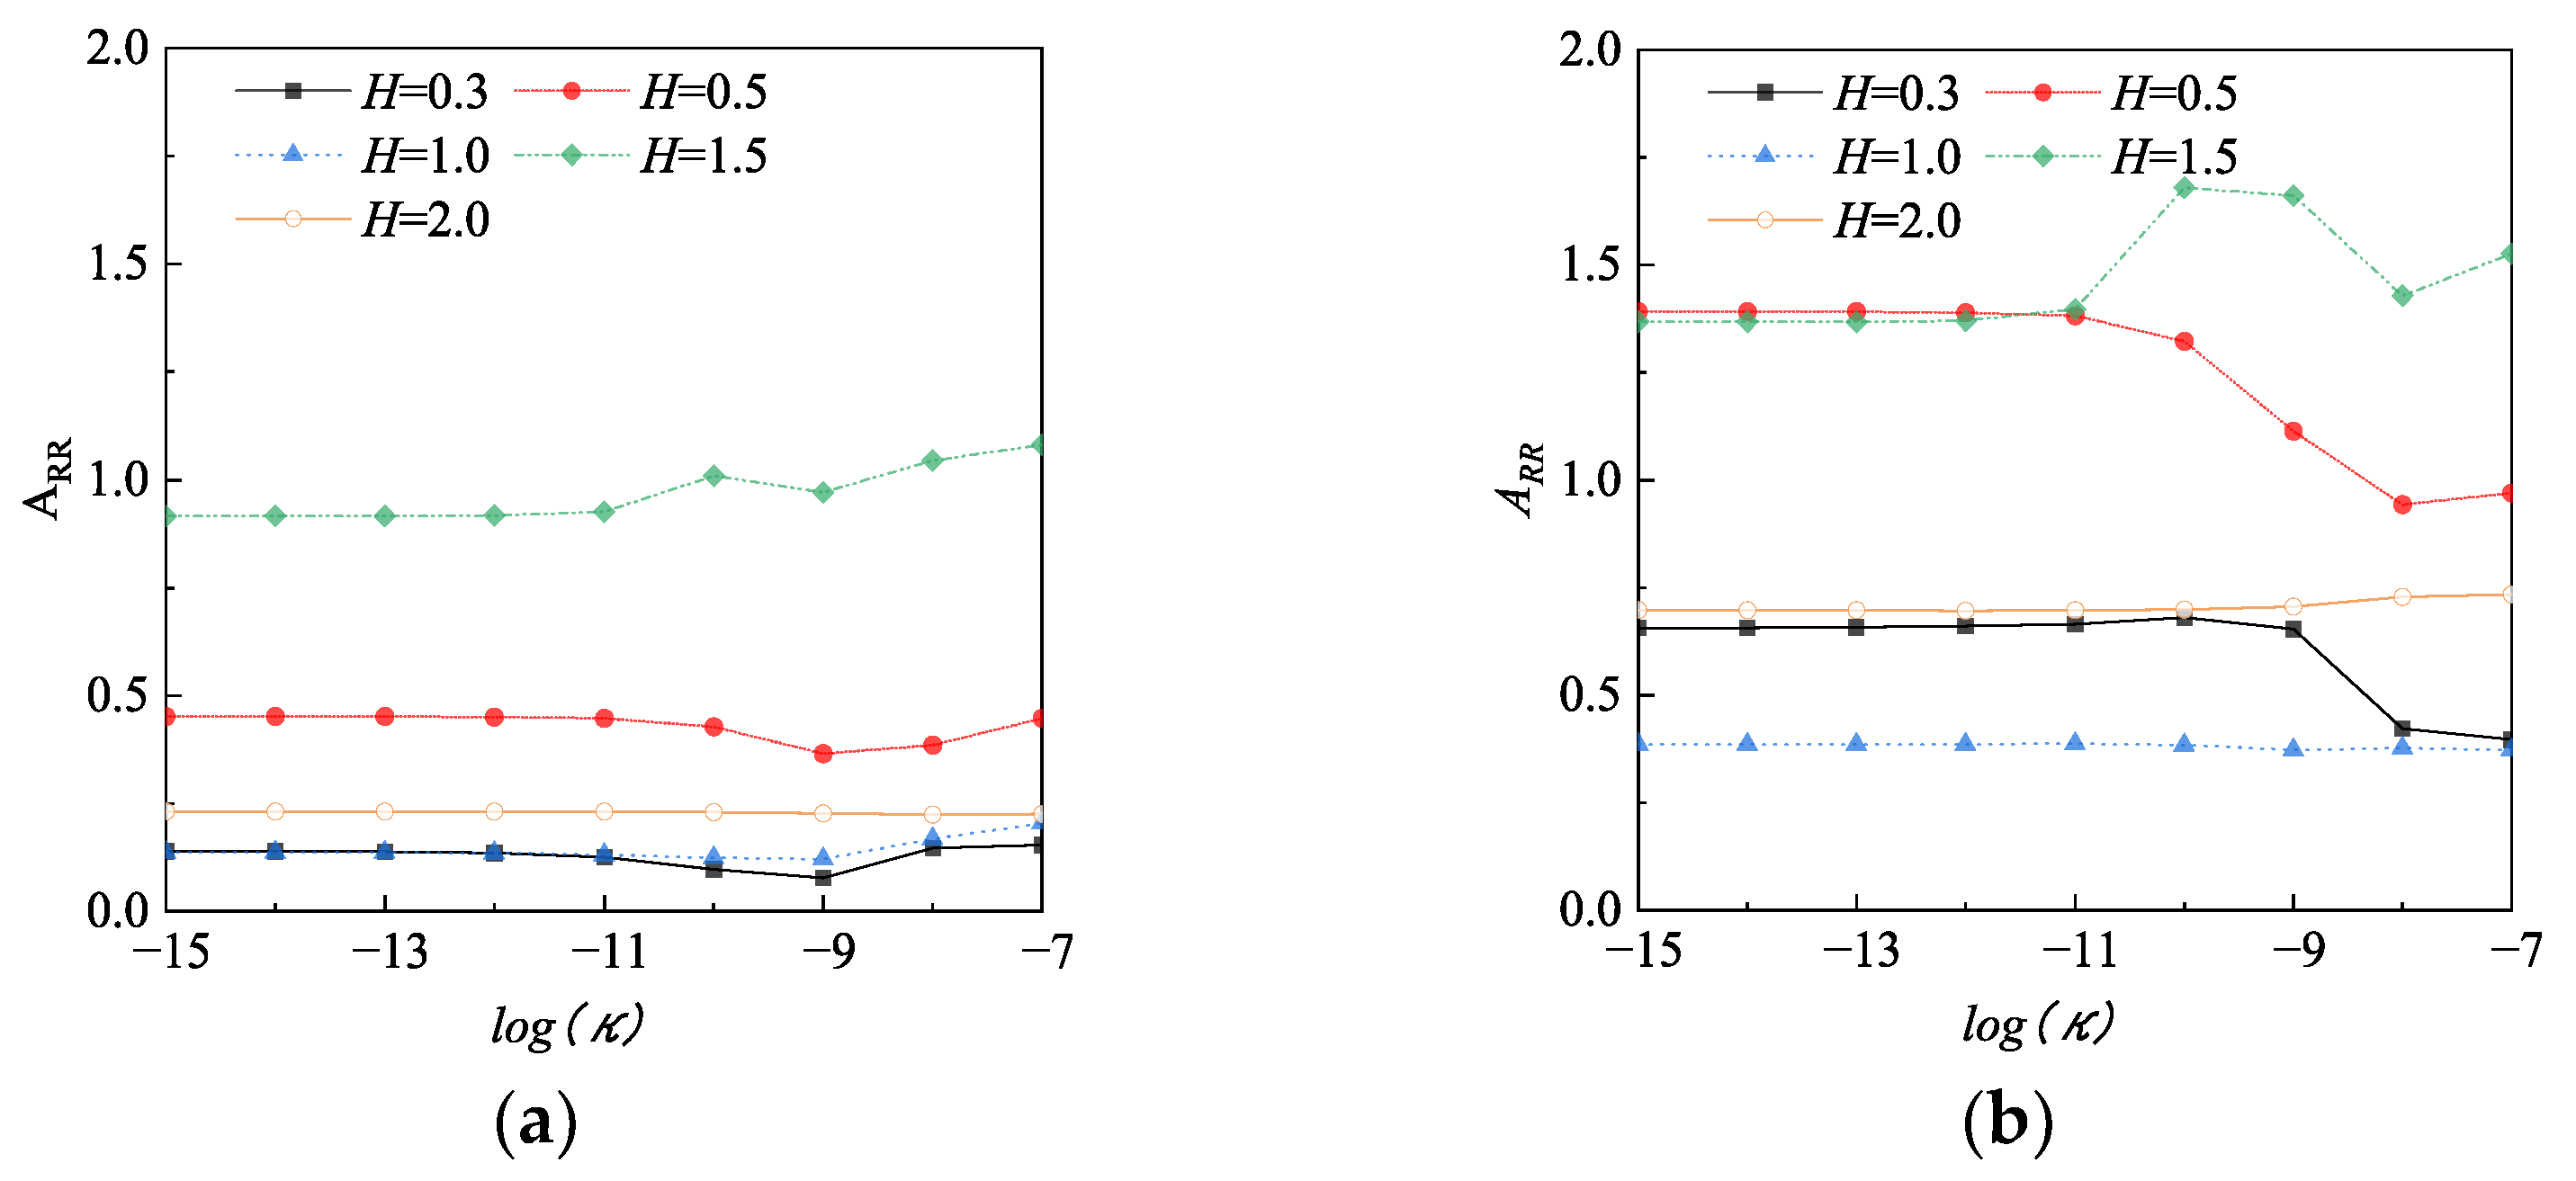
The permeability coefficient of saturated half-space water will also have a certain impact on the vibration isolation effect. The permeability coefficient of water intake ranges from 1 × 10⁻⁷ m2 to 1 × 10⁻¹⁵ m2, and the groundwater level is 0.3, 0.5, 1, 1.5, and 2, respectively. Figure 18 shows the curves of ARR for both the open and filled trenches, plotted against the hydraulic conductivity under different water levels.
As can be seen from Figure 18, the influence of the water permeability coefficient on the in-filled trench is obviously greater than that on the empty trench, but the trend is basically the same. When the water permeability coefficient is less than 1 × 10⁻¹¹ m2, for the water level of H ˂ 1, the water level is higher than the bottom of the vibration isolation trench, and the change in the permeability coefficient will lead to the change in the vibration isolation effect. When H = 1.5, the change in the permeability coefficient will also change ARR, and the permeability coefficient will have an impact on the reflection of the P wave on the boundary.
When the permeability coefficient of water is less than 1 × 10⁻¹¹ m2, the change in the permeability coefficient has basically no effect on the vibration isolation effect of the empty trench. At this time, the nature of the pore water in the porous medium is close to solid, which can be equated to elastic soil, and the saturated half-space of the overlying elastic layer becomes a double-layer elastic medium foundation. This transition explains why the vibration isolation effect becomes insensitive to further changes in permeability within this low range, as the fundamental wave propagation mechanism has changed from poroelastic to purely elastic [30].

4.3.4. Influence of Barrier Depth on Vibration Isolation Effect

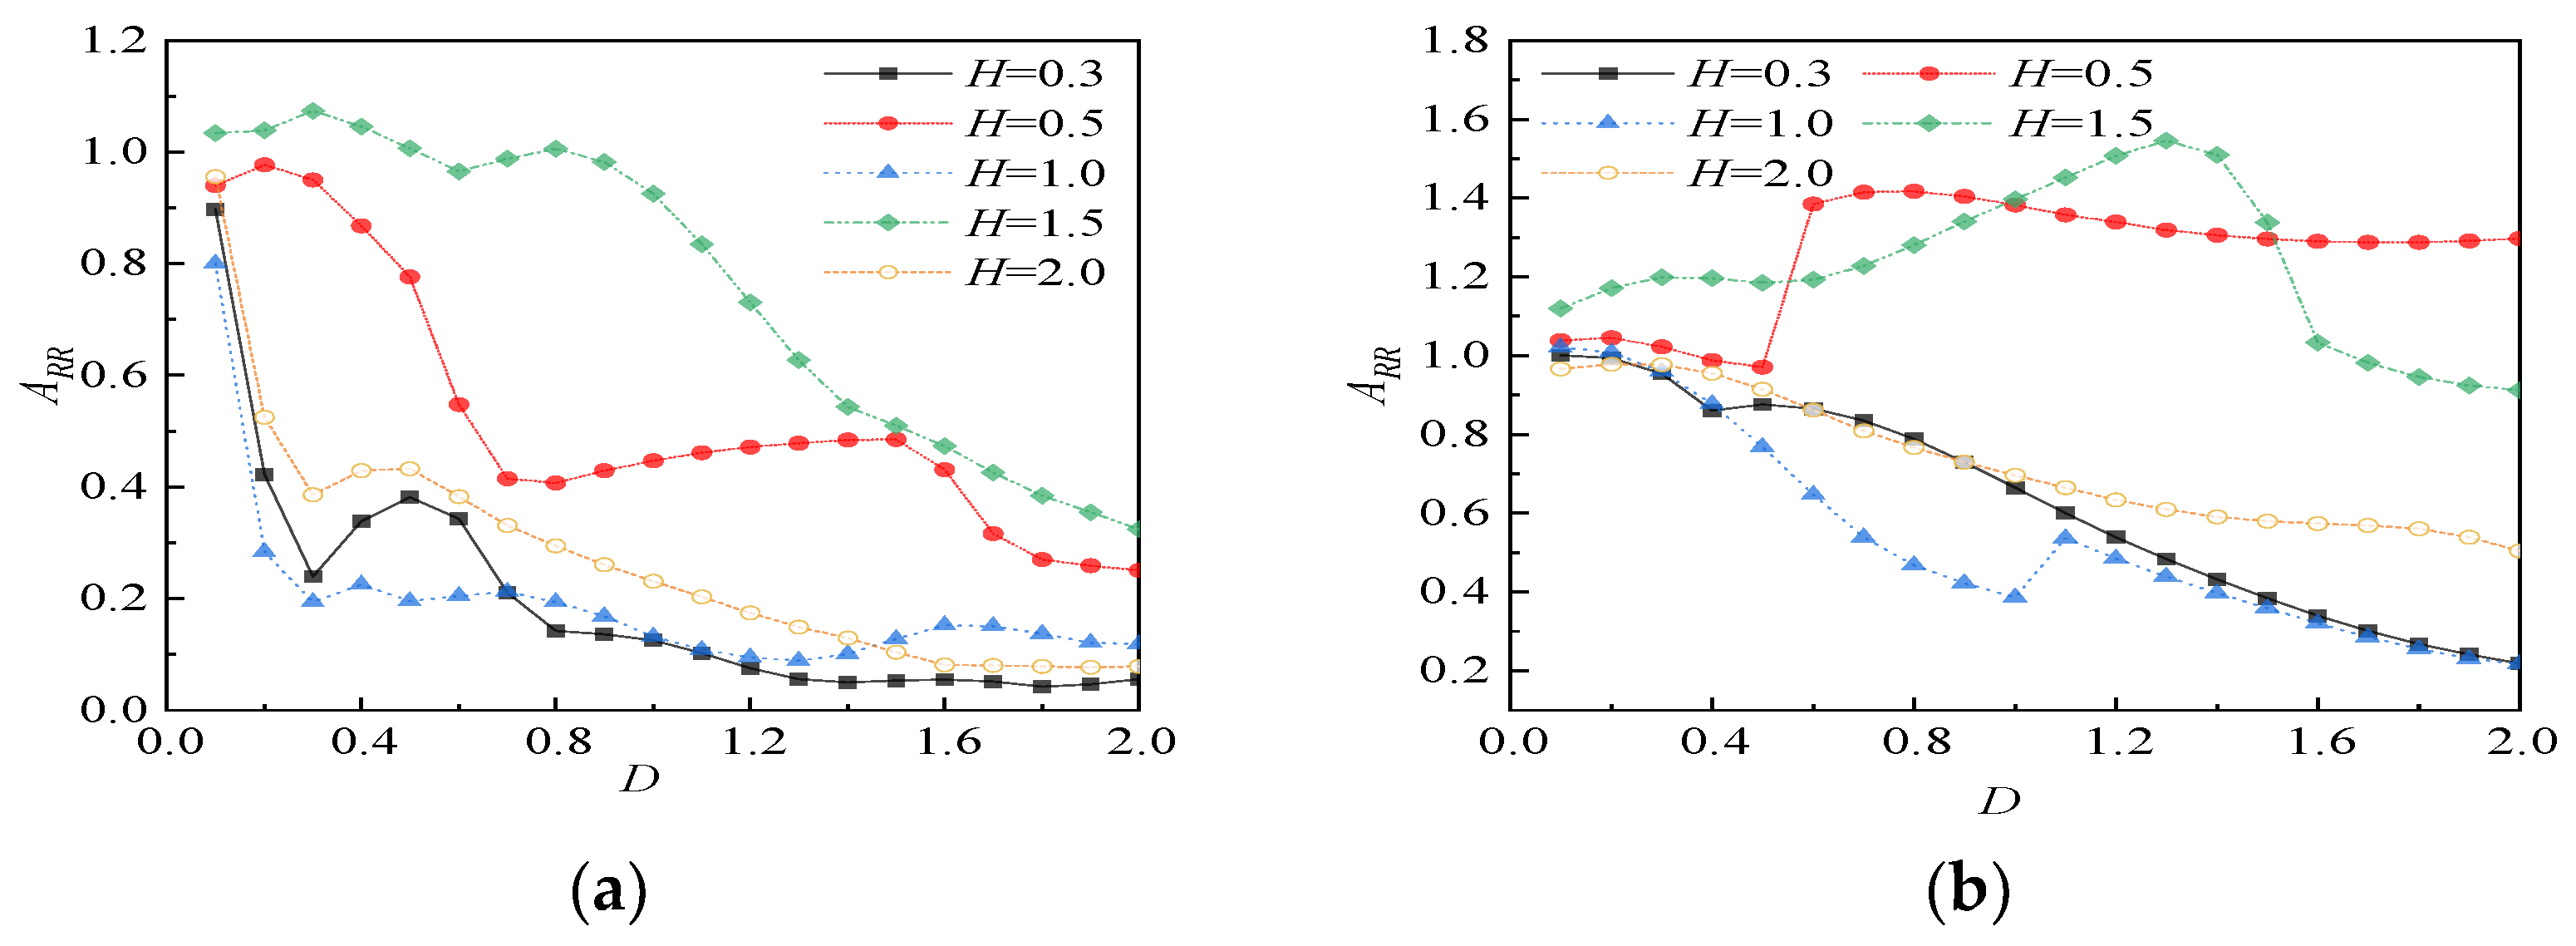
Barrier depth is an important parameter in the design of vibration isolation ditch. The normalized depth D is 0.1–6 for research, and the water level H is 0.3, 0.5, 1, 1.5, and 2, respectively. Figure 19 shows the variation curves of ARR of empty trench and in-filled trench with depths under different barrier depths.
As can be seen from Figure 19, the general trend of ARR decreases with the increase in the depth of both empty trenches and in-filled trenches. However, the vibration isolation effect decreases with the increase of barrier depth in different depth ranges. When the depth of the bottom of the in-filled trench increases to the water level, A R R suddenly increases, indicating that the depth of the in-filled trench and the position of the water level will also affect the vibration isolation effect. In addition to the abrupt depth, the increase in the depth of the in-filled trench cannot well suppress the negative influence of resonance on the vibration isolation effect. This result is consistent with findings by [18], who noted that the efficiency of wave barriers is highly sensitive to interactions with groundwater, which can alter the soil’s dynamic stiffness and damping characteristics.

4.3.5. Influence of Barrier Distance on Vibration Isolation Effect

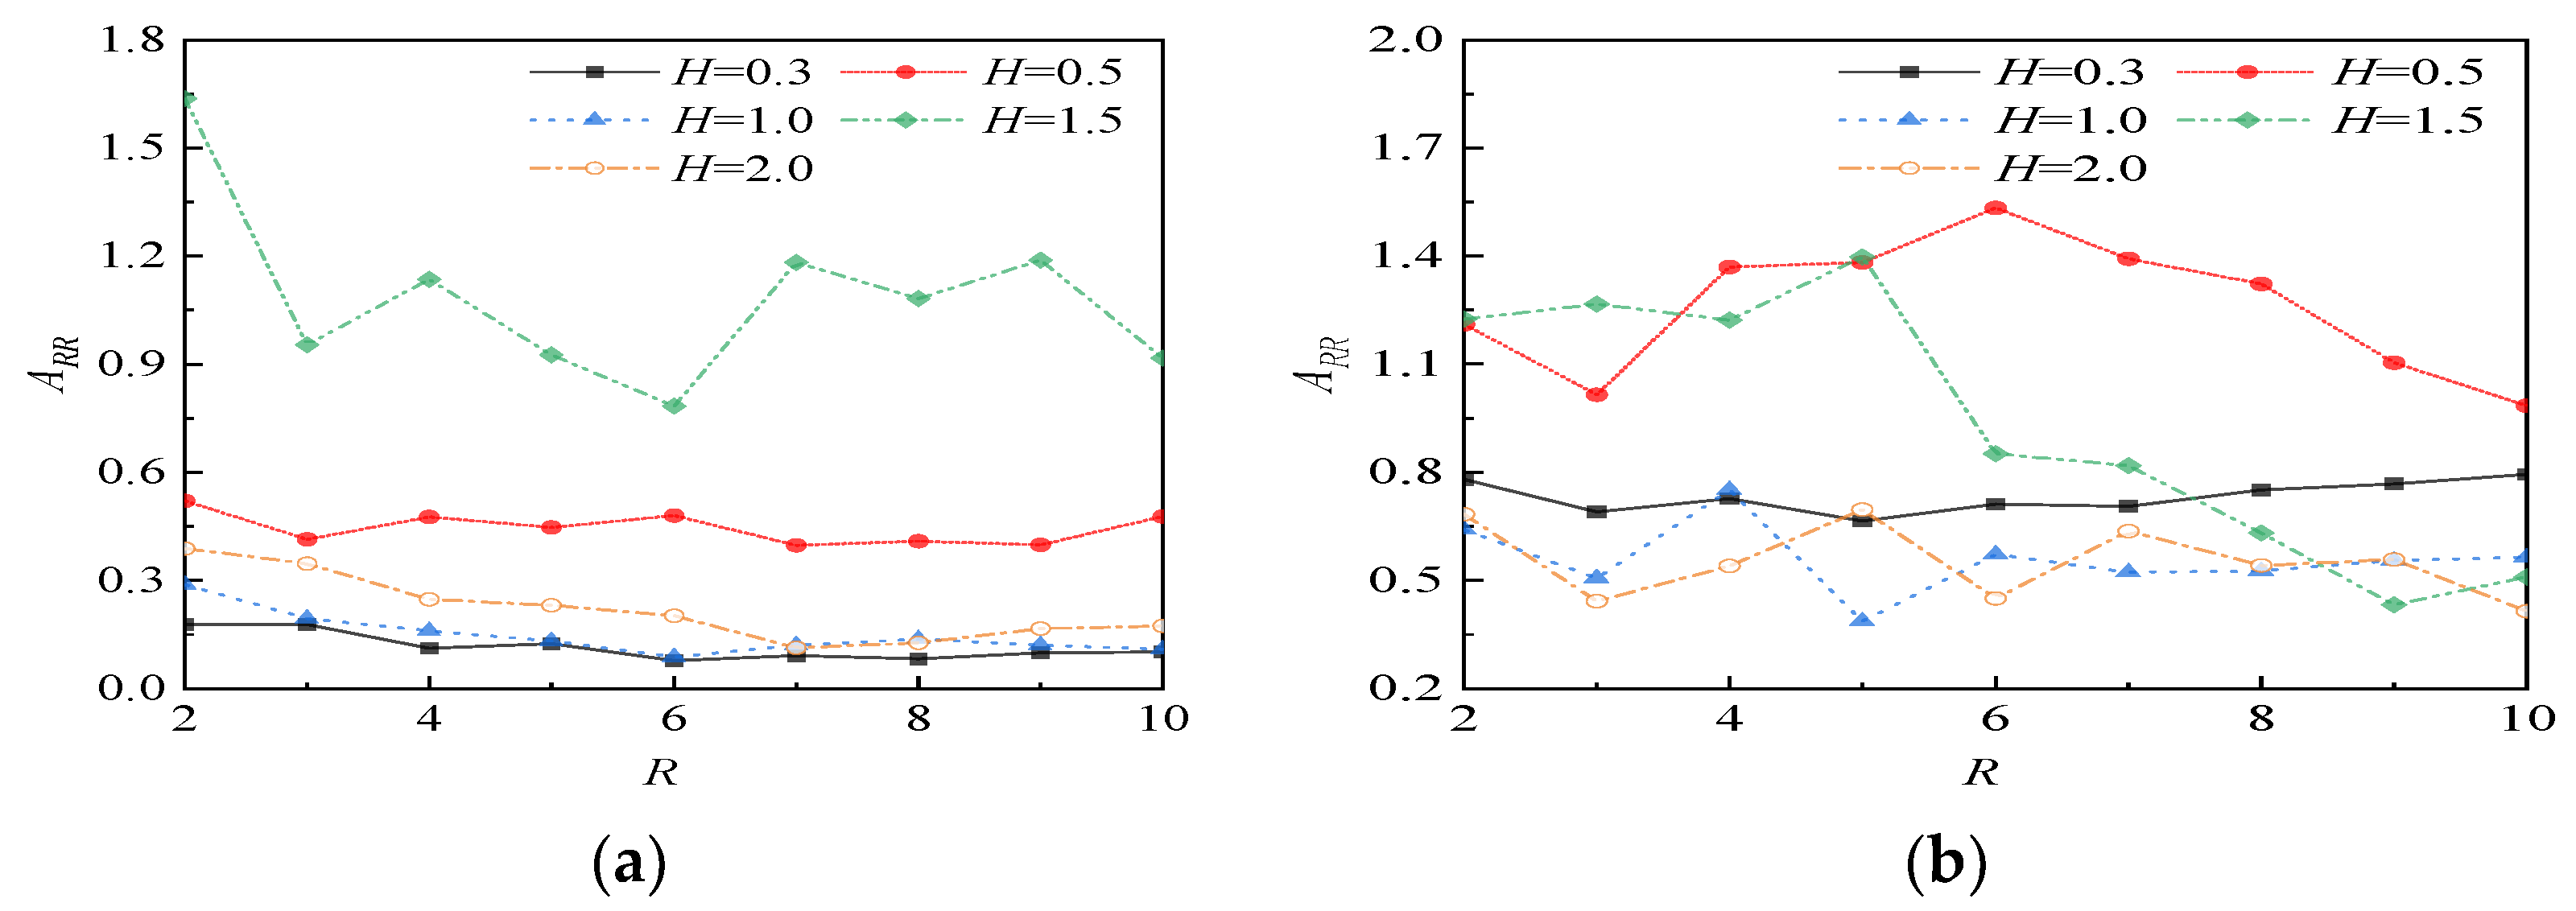
The normalized distance R = 2–10 was taken for analysis, and the water level H was taken as 0.3, 0.5, 1, 1.5, and 2. Figure 20 shows the variation curves of A R R of empty and in-filled trenches with distance under different barrier distances.
As can be seen from Figure 20,
(1)
In the empty trench, except for the resonance water level, A R R continuously decreases and then becomes stable as the barrier distance increases; The impact on the low water level is greater than that on the high water level. The empty trench’s performance is governed primarily by geometric diffraction, which is most effective in a homogeneous medium and benefits from distance until natural attenuation dominates.
(2)
In the in-filled trench, the change in barrier distance has an obvious influence on the vibration isolation effect, but the trend shows a certain fluctuation. At the resonance water level, when the distance is relatively large, the increase in barrier distance will enhance the vibration isolation effect. The in-filled trench’s performance is a result of complex wave transmission and interference, making it highly sensitive to placement and capable of counterintuitive behavior, particularly under resonant conditions.

4.3.6. Influence of Barrier Width on Vibration Isolation Effect

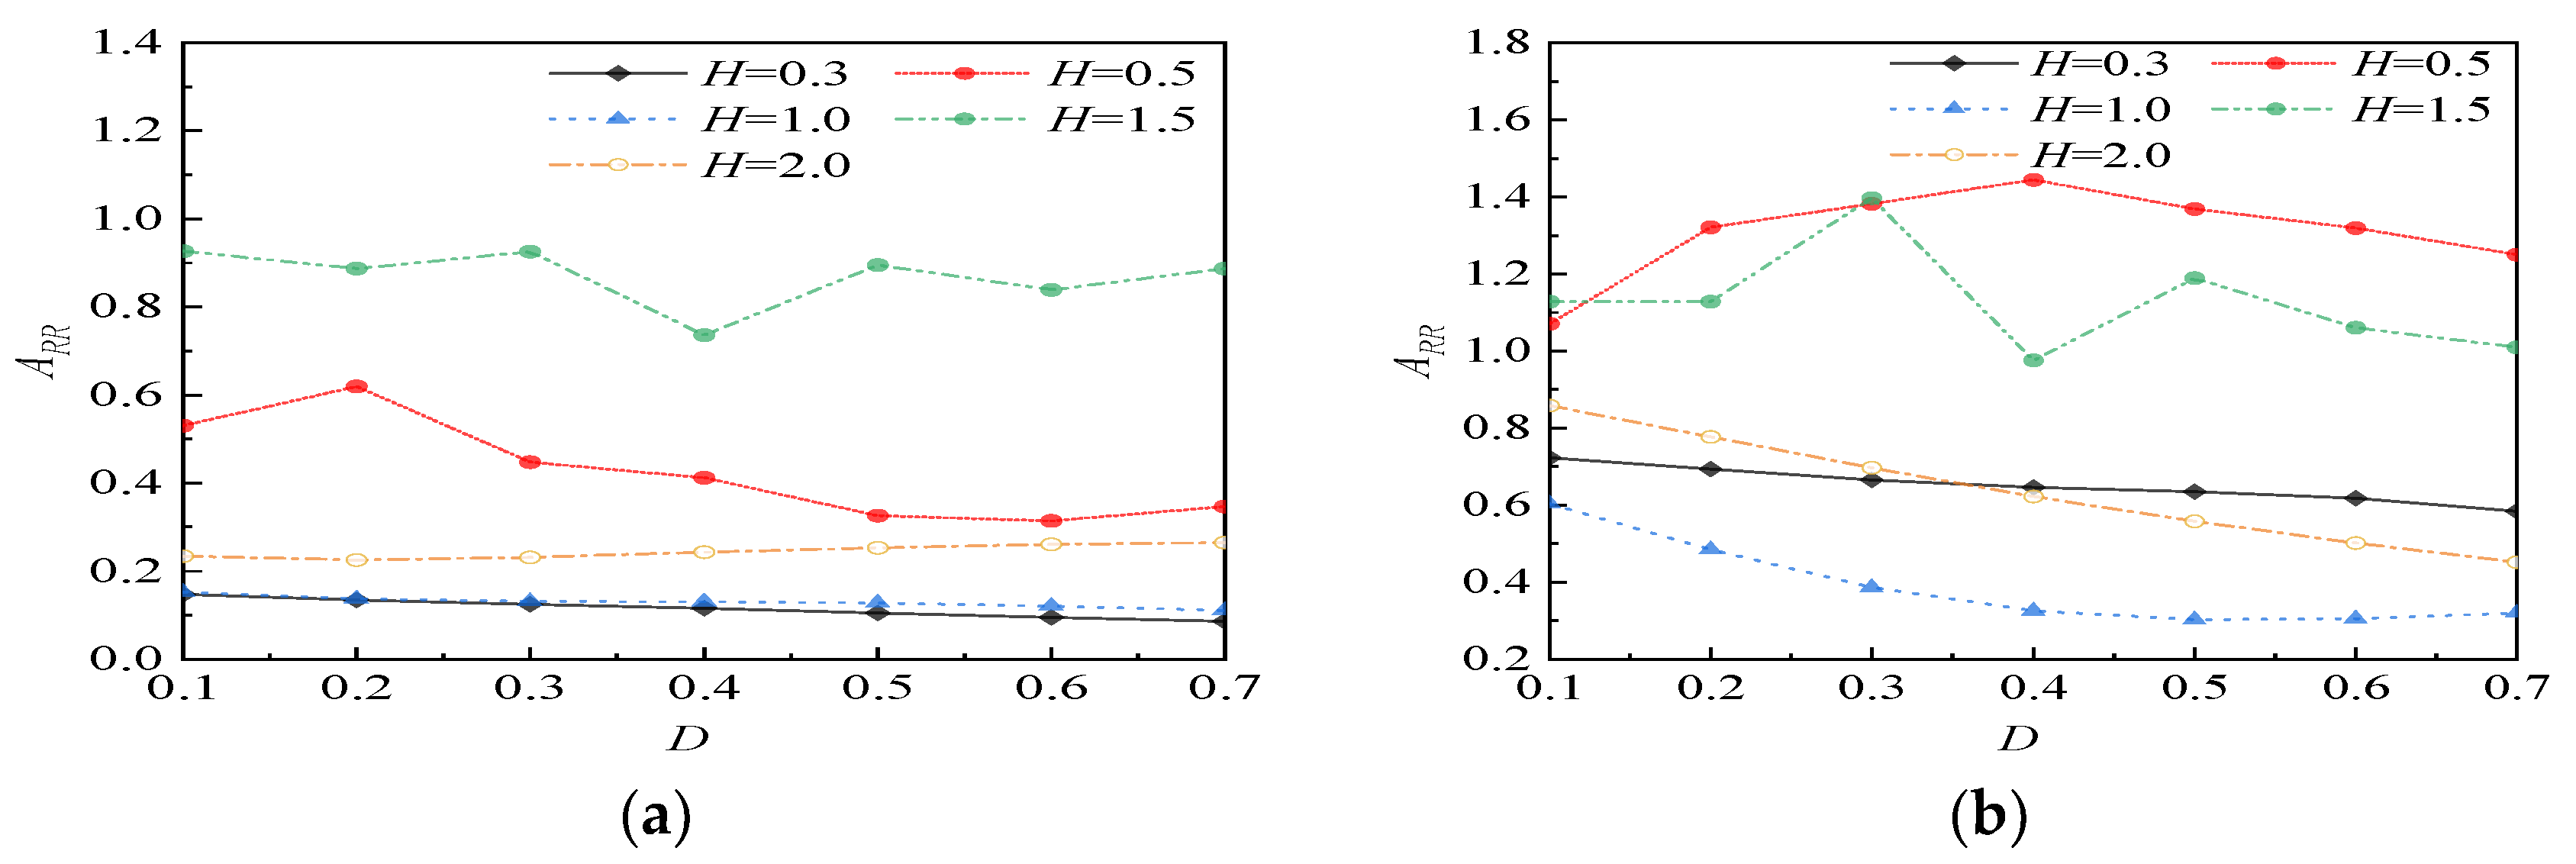
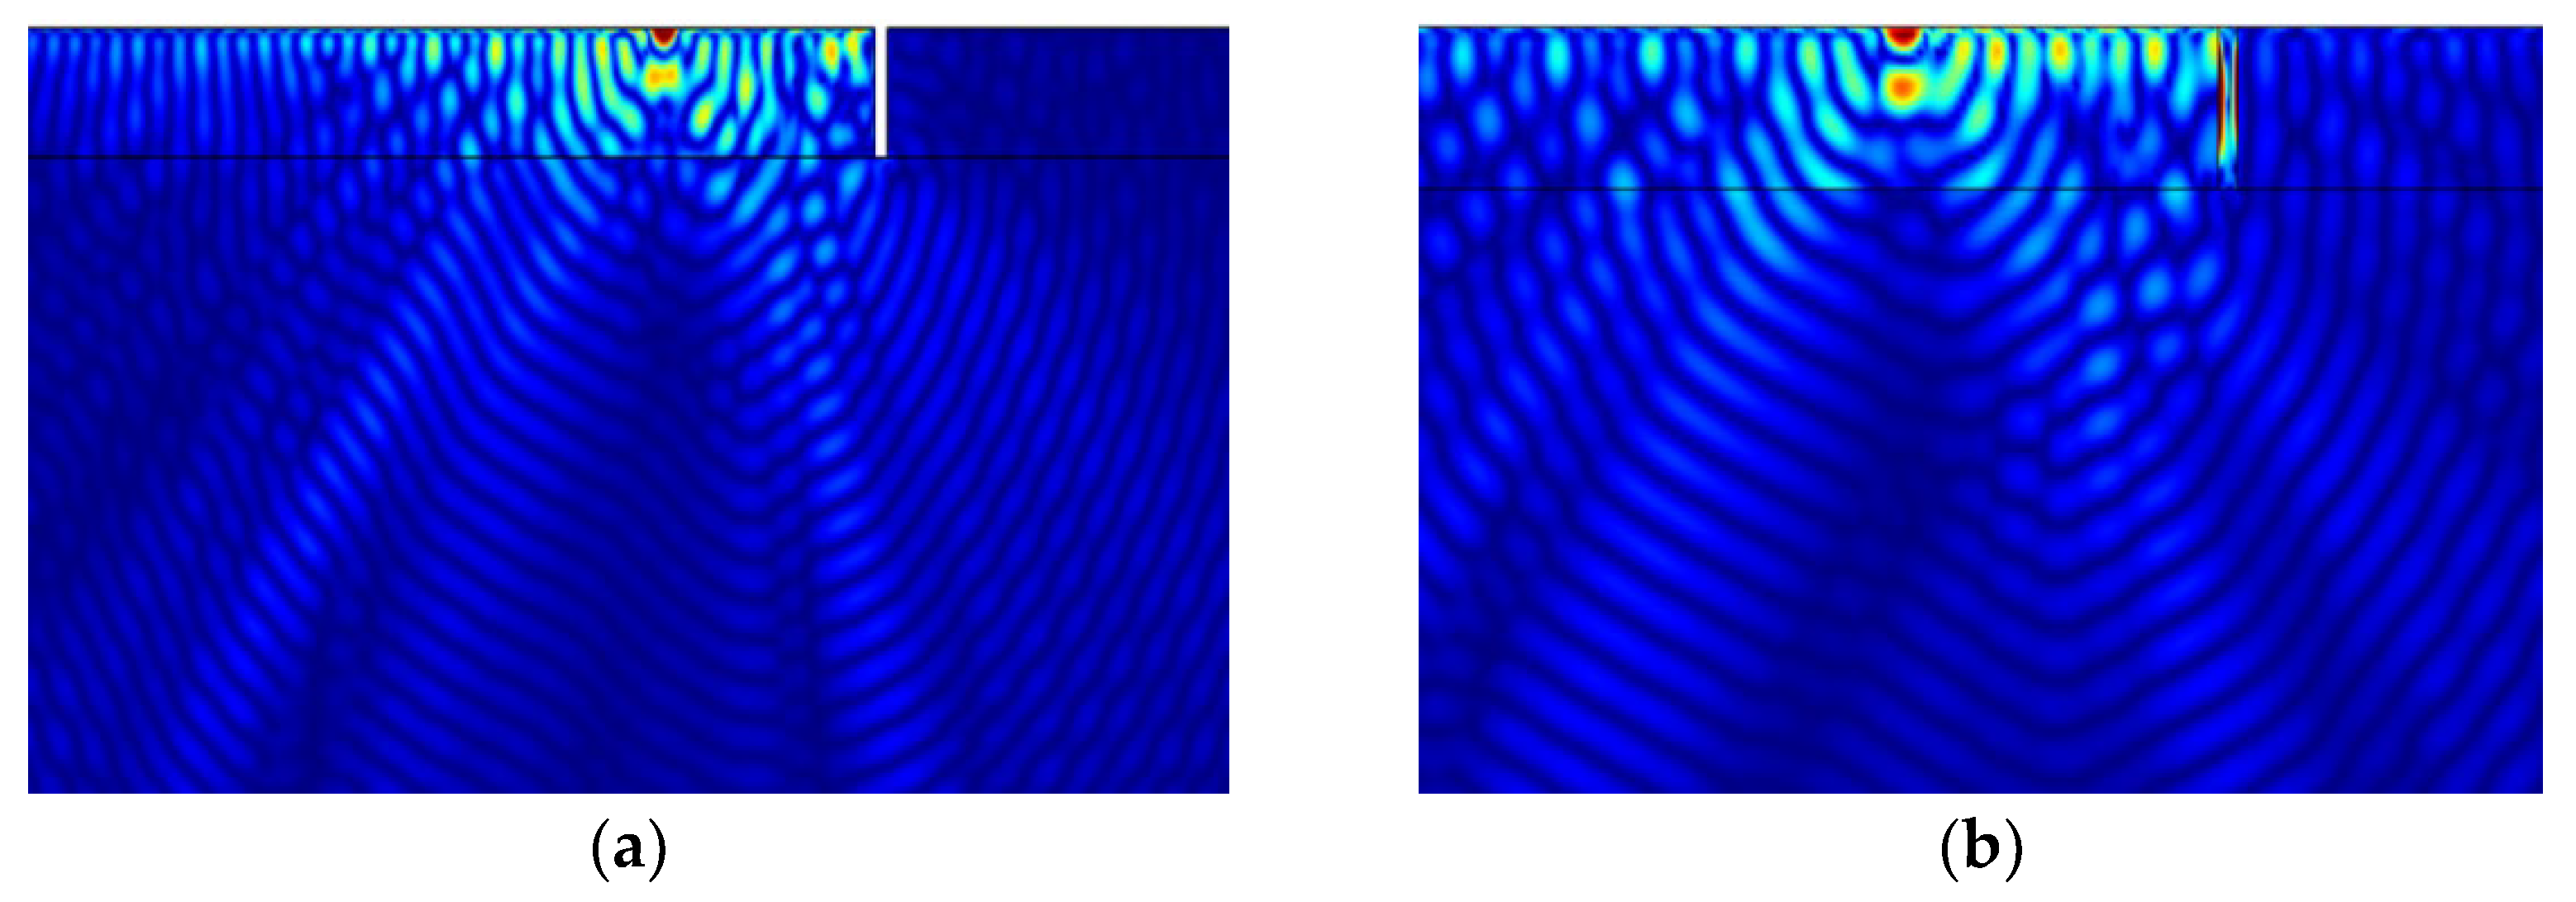
The normalized width W = 0.1–0.7 was used for analysis, and the water level H was 0.3, 0.5, 1, 1.5, and 2, respectively. Figure 21 shows the variation curves of ARR in the empty trench and the in-filled trench with the width of the isolation trench, respectively, and Figure 22 shows the stress cloud diagram of the empty trench and the isolation trench, respectively.
As can be seen from Figure 21 and Figure 22,
(1)
With the increase in empty trench width, ARR shows a decreasing trend, but the influence is limited; The effect of empty trench width on a high water level is greater than that of a low water level; For in-filled trenches, increased barrier width can effectively reduce the vibration behind the trenches.
(2)
The waves in the in-filled trench can be propagated to the vibration isolation area through the filling medium, and the transmitted energy of the waves through the filling medium can be reduced by increasing the width. The isolation of the empty trench is mainly through the distance change in the wave diffraction, so the increase in the barrier width is more conducive to enhancing the isolation effect of the in-filled trench.

5. Conclusions

This paper studies the influence of water level change on the vertical displacement of a saturated soil foundation surface under a moving load, and the influence of water level change, load frequency, permeability coefficient, and distance and size of the isolation ditch on vibration isolation effect. The following conclusions are reached:
(1)
Groundwater-induced stratification significantly alters the dynamic response of the soil foundation. The interface between the elastic layer and the saturated zone causes wave reflection and refraction, which amplifies or attenuates surface vibrations depending on the water table depth. When the water table is shallow, the response resembles that of a fully saturated half-space. As the water table lowers, the influence of reflections diminishes, and the behavior progressively approaches that of an elastic half-space.
(2)
The influence of water level depth on the isolation trench is limited to above a certain water level, and the isolation effect tends to be in the elastic medium when it is below this water level; The difference in water level height will cause P-wave resonance in elastic dry soil layer, which is not conducive to vibration isolation.
(3)
There will be different resonance water levels at different frequencies, so that the barrier loses the effect of vibration isolation but magnifies the vibration at some positions behind the ditch; The resonance of different types of waves has different effects on the isolation effect of empty trench and in-filled trench.
(4)
When the permeability coefficient of saturated soil is high, it will affect the vibration isolation effect, and when the permeability coefficient is relatively low, it will hardly affect the vibration isolation effect. The increase in the depth of the isolation ditch is generally conducive to vibration isolation; the relationship between the in-filled trench and the water level will also affect the isolation effect, and the depth of the in-filled trench below the water level will be worse than the isolation effect when the water level is higher.
This study has certain limitations that point toward valuable future work. The model’s sensitivity to key parameters, particularly the permeability and porosity coefficients, was not exhaustively analyzed and represents a critical area for further research to assess the robustness of the findings under material uncertainty.

Author Contributions

Conceptualization, J.Y. and L.D.; methodology, J.Y.; software, Y.C.; validation, J.Y., L.D. and Y.C.; formal analysis, J.Y.; investigation, L.D.; resources, J.Y.; data curation, Y.C.; writing—original draft preparation, L.D.; writing—review and editing, J.Y.; visualization, Y.C.; supervision, J.Y.; project administration, J.Y.; funding acquisition, J.Y. All authors have read and agreed to the published version of the manuscript.

Funding

This research was funded by National Natural Science Foundation of China, grant number 52472320.

Institutional Review Board Statement

Not applicable.

Informed Consent Statement

Not applicable.

Data Availability Statement

The original contributions presented in the study are included in the article, further inquiries can be directed to the authors.

Conflicts of Interest

The authors declare no conflicts of interest.

References

  1. Xia, H.; Wu, X.; Yu, D.M. Environment vibration induced by urban rail transit system. J. North. Jiaotong Univ. 1999, 23, 1–7. [Google Scholar]
  2. Eason, G. The stresses produced in a semi-infinite solid by a moving surface force. Int. J. Eng. Sci. 1965, 2, 581–609. [Google Scholar] [CrossRef]
  3. Lefeuve-Mesgouez, G.; Houedec, D.L.; Peplow, A.T. Ground vibration in the vicinity of a high-speed moving harmonic strip load. J. Sound Vib. 2000, 231, 1289–1309. [Google Scholar] [CrossRef]
  4. Andersen, L.; Nielsen, S.R.K. Boundary element analysis of the steady-state response of an elastic half-space to a moving force on its surface. Eng. Anal. Bound. Elem. 2003, 27, 23–38. [Google Scholar] [CrossRef]
  5. Galvin, P.; Dominguez, J. Analysis of ground motion due to moving surface loads induced by high-speed trains- Science Direct. Eng. Anal. Bound. Elem. 2007, 31, 931–941. [Google Scholar] [CrossRef]
  6. Coelho, B.Z.; Nuttall, J.; Noordam, A.; Dijkstra, J. The impact of soil variability on uncertainty in predictions of induced vibrations. Soil Dyn. Earthq. Eng. 2023, 169, 107855. [Google Scholar] [CrossRef]
  7. Zhang, B.; Chen, X.; Qiu, L.; Dong, J.; Zhou, Z.; Ji, Z.; Liang, L. Characteristics of Elastic Wave Propagation in Fluid-Saturated Porous Media Based on the Model of Soil Mechanics. Pure Appl. Geophys. 2023, 180, 2309–2326. [Google Scholar] [CrossRef]
  8. Biot, M.A. Theory of propagation of elastic waves in a fluid-saturated porous solid. I. Low frequency range. J. Acoust. Soc. Am. 1955, 28, 168–191. [Google Scholar] [CrossRef]
  9. Biot, M.A. Theory of propagation of elastic waves in a fluid-saturated porous solid: II. Higher frequency range. J. Acoust. Soc. Am. 1956, 28, 179–191. [Google Scholar] [CrossRef]
  10. Theodorakopoulos, D.D.; Chassiakos, A.P.; Beskos, D.E. Dynamic effects of moving load on a poroelastic soil medium by an approximate method. Int. J. Solids Struct. 2004, 41, 1801–1822. [Google Scholar] [CrossRef]
  11. Lu, J.F.; Jeng, D.S. A half-space saturated poro-elastic medium subjected to a moving point load. Int. J. Solids Struct. 2007, 44, 573–586. [Google Scholar] [CrossRef]
  12. Gao, G.Y.; Li, N.; He, J.F.; Gao, M. Analysis of ground vibration generated by train moving loads on saturated soil. J. Vib. Shock 2011, 30, 86–92. [Google Scholar]
  13. Gao, G.Y.; Chen, Q.S.; He, J.F.; Liu, F. Investigation of Ground Vibration Due to Trains Moving on Saturated Multi-Layered Ground by 2.5D Finite Element Method. Soil Dyn. Earthq. Eng. 2012, 40, 87–98. [Google Scholar] [CrossRef]
  14. Anthony, E.; Vedanti, N. Simulation of seismic wave propagation in poroelastic media using vectorized Biot’s equations: An application to a CO2 sequestration monitoring case. Acta Geophys. 2020, 68, 435–444. [Google Scholar] [CrossRef]
  15. Alamo, G.M.; Bordón, J.D.; Aznarez, J.J.; Lombaert, G. The effectiveness of a pile barrier for vibration transmission in a soil stratum over a rigid bedrock. Comput. Geotech. 2019, 110, 274–286. [Google Scholar] [CrossRef]
  16. Yuan, Z.; Cao, Z.; Boström, A.; Cai, Y. The influence of pore-fluid in the soil on ground vibrations from a tunnel embedded in a layered half-space. J. Sound Vib. 2018, 419, 227–248. [Google Scholar] [CrossRef]
  17. He, C.; Zhou, S.; Guo, P. Train-Induced Vibrations from a Tunnel in a Layered Half-Space with Varied Groundwater Table. Int. J. Geomech. 2020, 20, 04020174. [Google Scholar] [CrossRef]
  18. Feng, S.-J.; Li, J.-P.; Zhang, X.-L.; Chen, Z.-L.; Li, Y.-C. Effects of water table on ground-borne vibration screening effectiveness by using open trenches. Soil Dyn. Earthq. Eng. 2020, 131, 10603. [Google Scholar] [CrossRef]
  19. Johnson, D.L.; Koplik, J.; Dashen, R. Theory of dynamic permeability and tortuosity in fluid-saturated porous-media. J. Fluid Mech. 1987, 176, 379–402. [Google Scholar] [CrossRef]
  20. Jones, D.V.; Houedec, D.L.; Petyt, M. Ground vibrations due to a rectangular harmonic load. J. Sound Vib. 1998, 212, 61–74. [Google Scholar] [CrossRef]
  21. Bo, Q.; Ali, L.; Irini, D.M. Numerical study of wave barrier and its optimization design. Finite Elem. Anal. Des. 2014, 84, 1–13. [Google Scholar] [CrossRef]
  22. Yang, Y.B.; Hung, H.H. A parametric study of wave barriers for reduction of train-induced vibrations. Int. J. Numer. Methods Eng. 2007, 40, 3729–3747. [Google Scholar] [CrossRef]
  23. Bérenger, J.P. A perfectly matched layer for the absorption of electromagnetic waves. J. Comput. Phys. 1994, 114, 185–200. [Google Scholar] [CrossRef]
  24. Woods, R.D. Screening of surface wave in soils. J. Soil Mech. Found. Div. 1968, 94, 951–979. [Google Scholar] [CrossRef]
  25. Ahmad, S.; Al-Hussaini, T.M. Simplified design for vibration screening by open and in-filled trenches. J. Geotech. Eng. (ASCE) 1991, 117, 67–88. [Google Scholar] [CrossRef]
  26. Lambe, T.W.; Whitman, R.V. Soil Mechanics; John Wiley & Sons: Hoboken, NJ, USA, 1969. [Google Scholar]
  27. Biot, M.A. Theory of Propagation of Elastic Waves in a Fluid-Saturated Porous Solid. J. Acoust. Soc. Am. 1956, 28, 168–178. [Google Scholar] [CrossRef]
  28. Wang, H.F. Theory of Linear Poroelasticity with Applications to Geomechanics and Hydrogeology; Princeton University Press: Princeton, NJ, USA, 2017. [Google Scholar]
  29. Schevenels, M.; Degrandec, G.; Lombaert, G. The influence of the depth of the ground water table on free field road traffic-induced vibrations. Int. J. Numer. Anal. Methods Geomech. 2004, 28, 395–419. [Google Scholar] [CrossRef]
  30. Zienkiewicz, O.C.; Chan, A.H.C.; Pastor, M.; Schrefler, B.A.; Shiomi, T. Computational Geomechanics with Special Reference to Earthquake Engineering; John Wiley & Sons: Hoboken, NJ, USA, 1999. [Google Scholar]
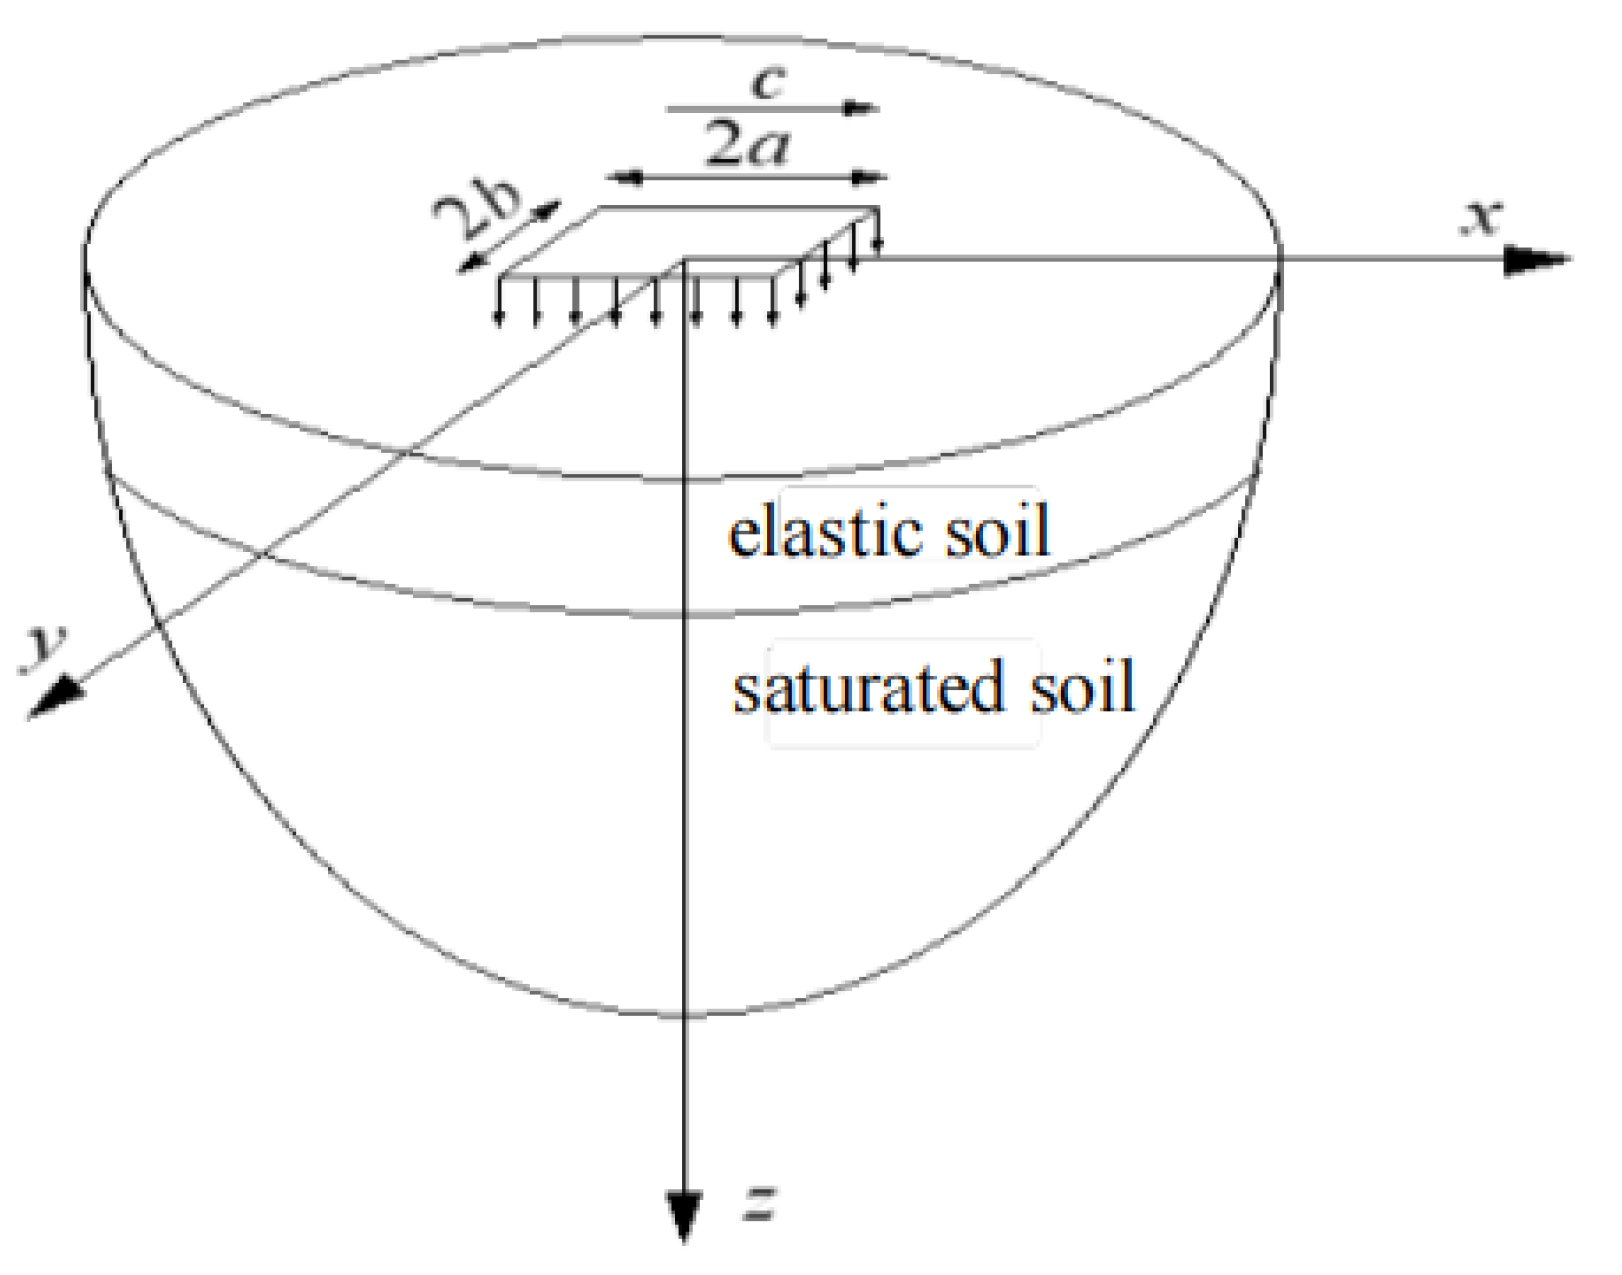
Figure 1. Schematic diagram of a saturated half-space of the overlying elastic layer.
Applsci 15 10461 g001
Figure 2. Comparison between the calculation results of this article and Jones’ results.
Applsci 15 10461 g002
Figure 3. Wavenumber–domain displacement for the model with an overlying elastic layer thickness h = 0.5 m: (a) displacement amplitude cloud map; (b) real part of vertical displacement at η = 0.
Applsci 15 10461 g003
Figure 4. Wavenumber–domain displacement for the model with an overlying elastic layer thickness h = 1 m: (a) displacement amplitude contour; (b) real part of vertical displacement at η = 0.
Applsci 15 10461 g004
Figure 5. Wavenumber–domain displacement for the model with overlying elastic layer thickness h = 5 m: (a) Displacement amplitude contour; (b) Real part of vertical displacement at η = 0.
Applsci 15 10461 g005
Figure 6. The relationship between the maximum vertical displacement of the surface and water level.
Applsci 15 10461 g006
Figure 7. Relationship between displacement and distance at different water levels. (a) The variation of surface displacement amplitude with distance attenuation. (b) The curve of the magnified part of the box.
Applsci 15 10461 g007
Figure 8. Schematic diagram of vibration isolation model.
Applsci 15 10461 g008
Figure 9. Schematic diagram of Rayleigh damping.
Applsci 15 10461 g009
Figure 10. Schematic diagram of the finite element model. (a) Empty trench; (b) In-filled trench.
Applsci 15 10461 g010
Figure 11. Comparison of this paper with Al-Hussaini’s results.
Applsci 15 10461 g011
Figure 12. Effect of water level on vibration isolation of empty trench. (a) 0 ≤ H ≤ 14; (b) 0 ≤ H ≤ 3.
Applsci 15 10461 g012
Figure 13. Effect of water level on vibration isolation in-filled trench. (a) 0 ≤ H ≤ 14; (b) 0 ≤ H ≤ 3.
Applsci 15 10461 g013
Figure 14. The curve of A R R versus distance after the empty trench.
Applsci 15 10461 g014
Figure 15. The curve of A R R versus distance after the in-filled trench.
Applsci 15 10461 g015
Figure 16. Influence of load frequency on vibration isolation of empty trenches. (a) H ≤ 1.0; (b) H > 1.0.
Applsci 15 10461 g016
Figure 17. Influence of load frequency on vibration isolation of in-filled trenches. (a) H ≤ 1.0; (b) H > 1.0.
Applsci 15 10461 g017
Figure 18. Effect of permeability coefficient on vibration isolation of trenches. (a) Empty trenches; (b) In-filled trenches.
Applsci 15 10461 g018
Figure 19. Effect of trench depth on vibration isolation effect depths. (a) Empty trenches; (b) in-filled trenches.
Applsci 15 10461 g019
Figure 20. Effect of trench distance on vibration isolation effect. (a) Empty trenches; (b) in-filled trenches.
Applsci 15 10461 g020
Figure 21. Effect of trench width on vibration isolation. (a) Empty trenches; (b) in-filled trenches.
Applsci 15 10461 g021
Figure 22. Stress contour of trench. (a) Empty trenches; (b) in-filled trenches.
Applsci 15 10461 g022
Table 1. Saturated soil parameters.
Parameter NamesNumerical Value
Shear modulus of saturated soil, μ2 × 10⁷ N/m2
Lame constant, λ2 × 10⁷ N/m2
Soil particle density, ρs2000 kg/m3
Pore water density, ρf1000 kg/m3
Porosity, n0.3
Damping ratio, β0.02
Permeability coefficient, k1 × 1011 m2
Pore fluid bulk modulus, K f 2.19 × 10⁹ pa
Hydrodynamic viscosity, η1 × 10⁻³ Pa
Soil particle compression constant, α1
Bending coefficient of porous media, a1
Table 2. C30 Concrete Parameters.
Parameter NamesNumerical Value
Modulus of elasticity, E3 × 1010 Pa
Poisson’s ratio, ν 0.2
Damping coefficient, β 0.05
Disclaimer/Publisher’s Note: The statements, opinions and data contained in all publications are solely those of the individual author(s) and contributor(s) and not of MDPI and/or the editor(s). MDPI and/or the editor(s) disclaim responsibility for any injury to people or property resulting from any ideas, methods, instructions or products referred to in the content.