Graph-DEM: A Graph Neural Network Model for Proxy and Acceleration Discrete Element Method
Abstract
1. Introduction
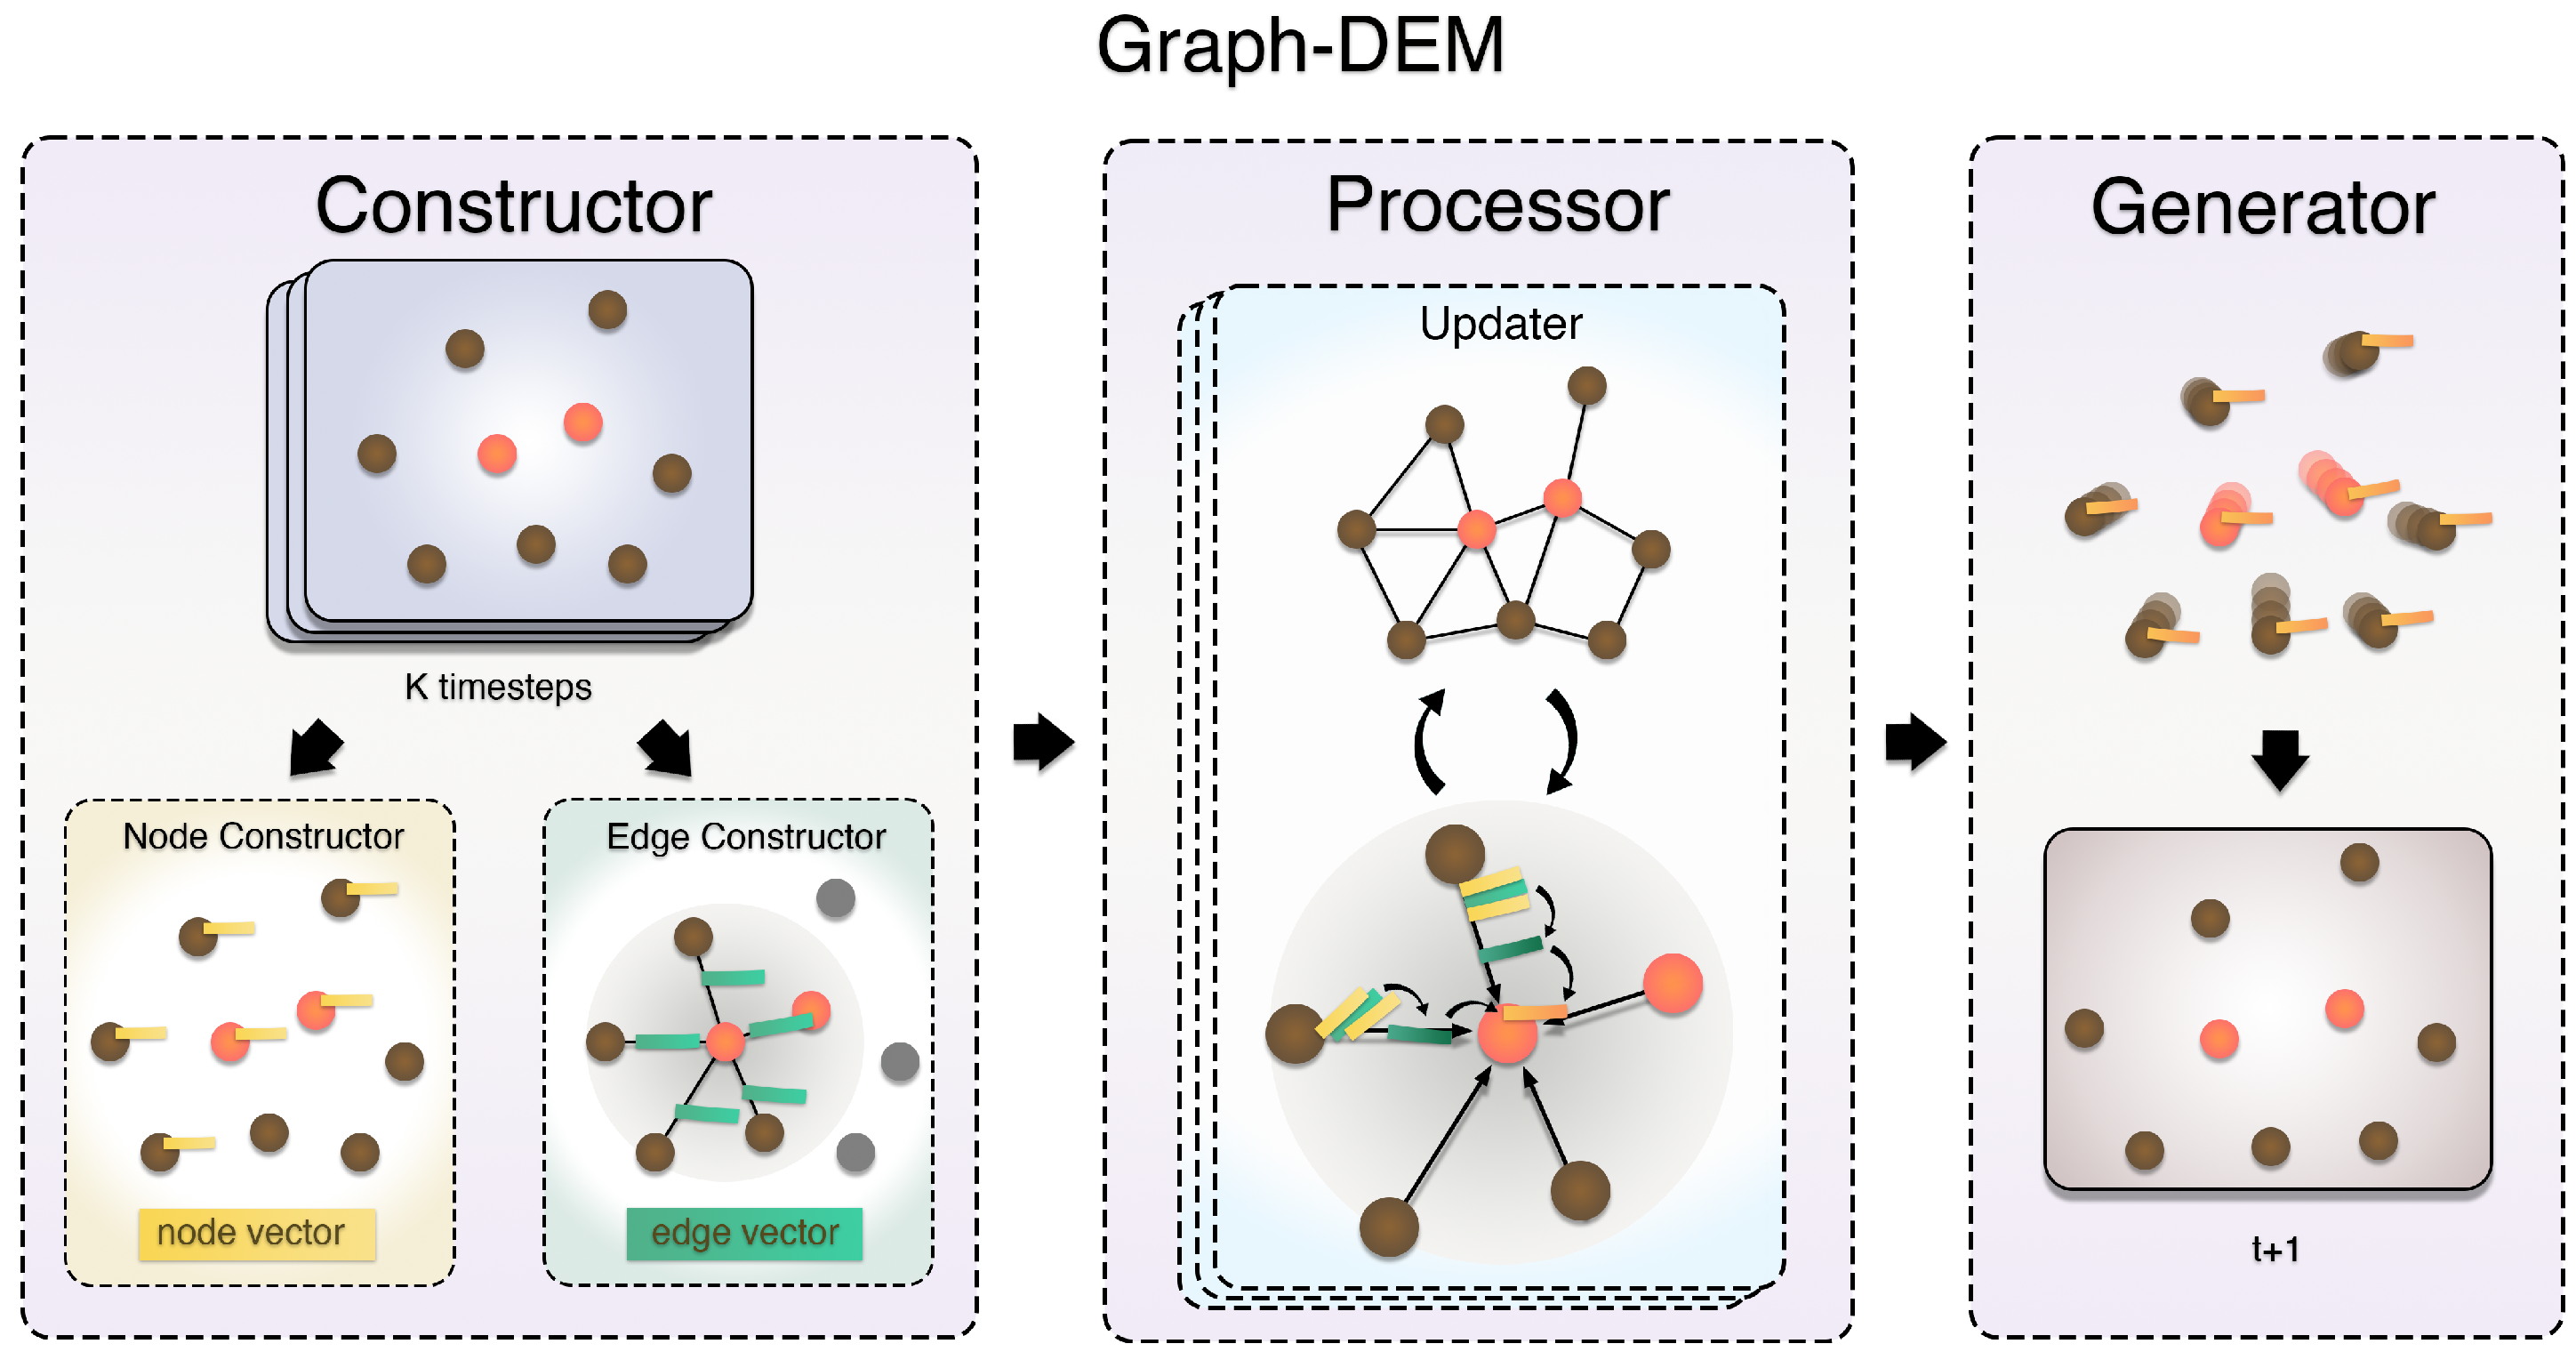
- We propose a graph neural network model, namely, Graph-DEM (The code and data can be found at https://github.com/LIPO714/Graph-DEM, accessed on 20 September 2025), which can predict the trajectories of geotechnical particles. It exploits the unique topological structure of graphs and learnable neural networks to approximate the physical computation in the discrete element method.
- We construct three experimental datasets with different constitutive relations that reflect dynamic experiments, static experiments, and principle experiments, respectively. We validate the prediction performance of our model on these three datasets.
- We demonstrate the model’s accuracy by evaluating both the overall motion trends of geotechnical structures and the particle-trajectory predictions on the three constructed datasets, and we further assess its competitiveness on two public benchmarks. Additionally, we demonstrate and discuss the universality of our proposed framework for different constitutive equations through accurate predictions in different cases.
- We compare the computational efficiency of our model with conventional DEMs and show its advantage in this aspect.
2. Related Work
2.1. Discrete Element Method
2.2. Graph Neural Network
3. Preliminaries
3.1. Model Consistency
3.2. Problem Formalization
3.3. Directed Graph
4. Graph-DEM
4.1. Overview
4.2. Constructor Details
4.2.1. Node Constructor
4.2.2. Edge Constructor
4.3. Processor Details
4.4. Generator Details
4.5. Structure of MLPs
5. Experiment
5.1. Datasets
- Meteorite ImpactThe Meteorite Impact dataset describes the process of a meteorite colliding with the surface of the Earth, typically depicted using an impact dynamics model.The Meteorite Impact dataset simulates meteorite impacts over 50 time steps within a domain. The interval between two steps was 0.0004 s. By modifying the angle and velocity of the meteorite, we simulated a total of 961 impacts. Including meteorite and ground particles, there were about 5000 particles in total. We recorded the two-dimensional position of particles in multiple steps and the particle types.
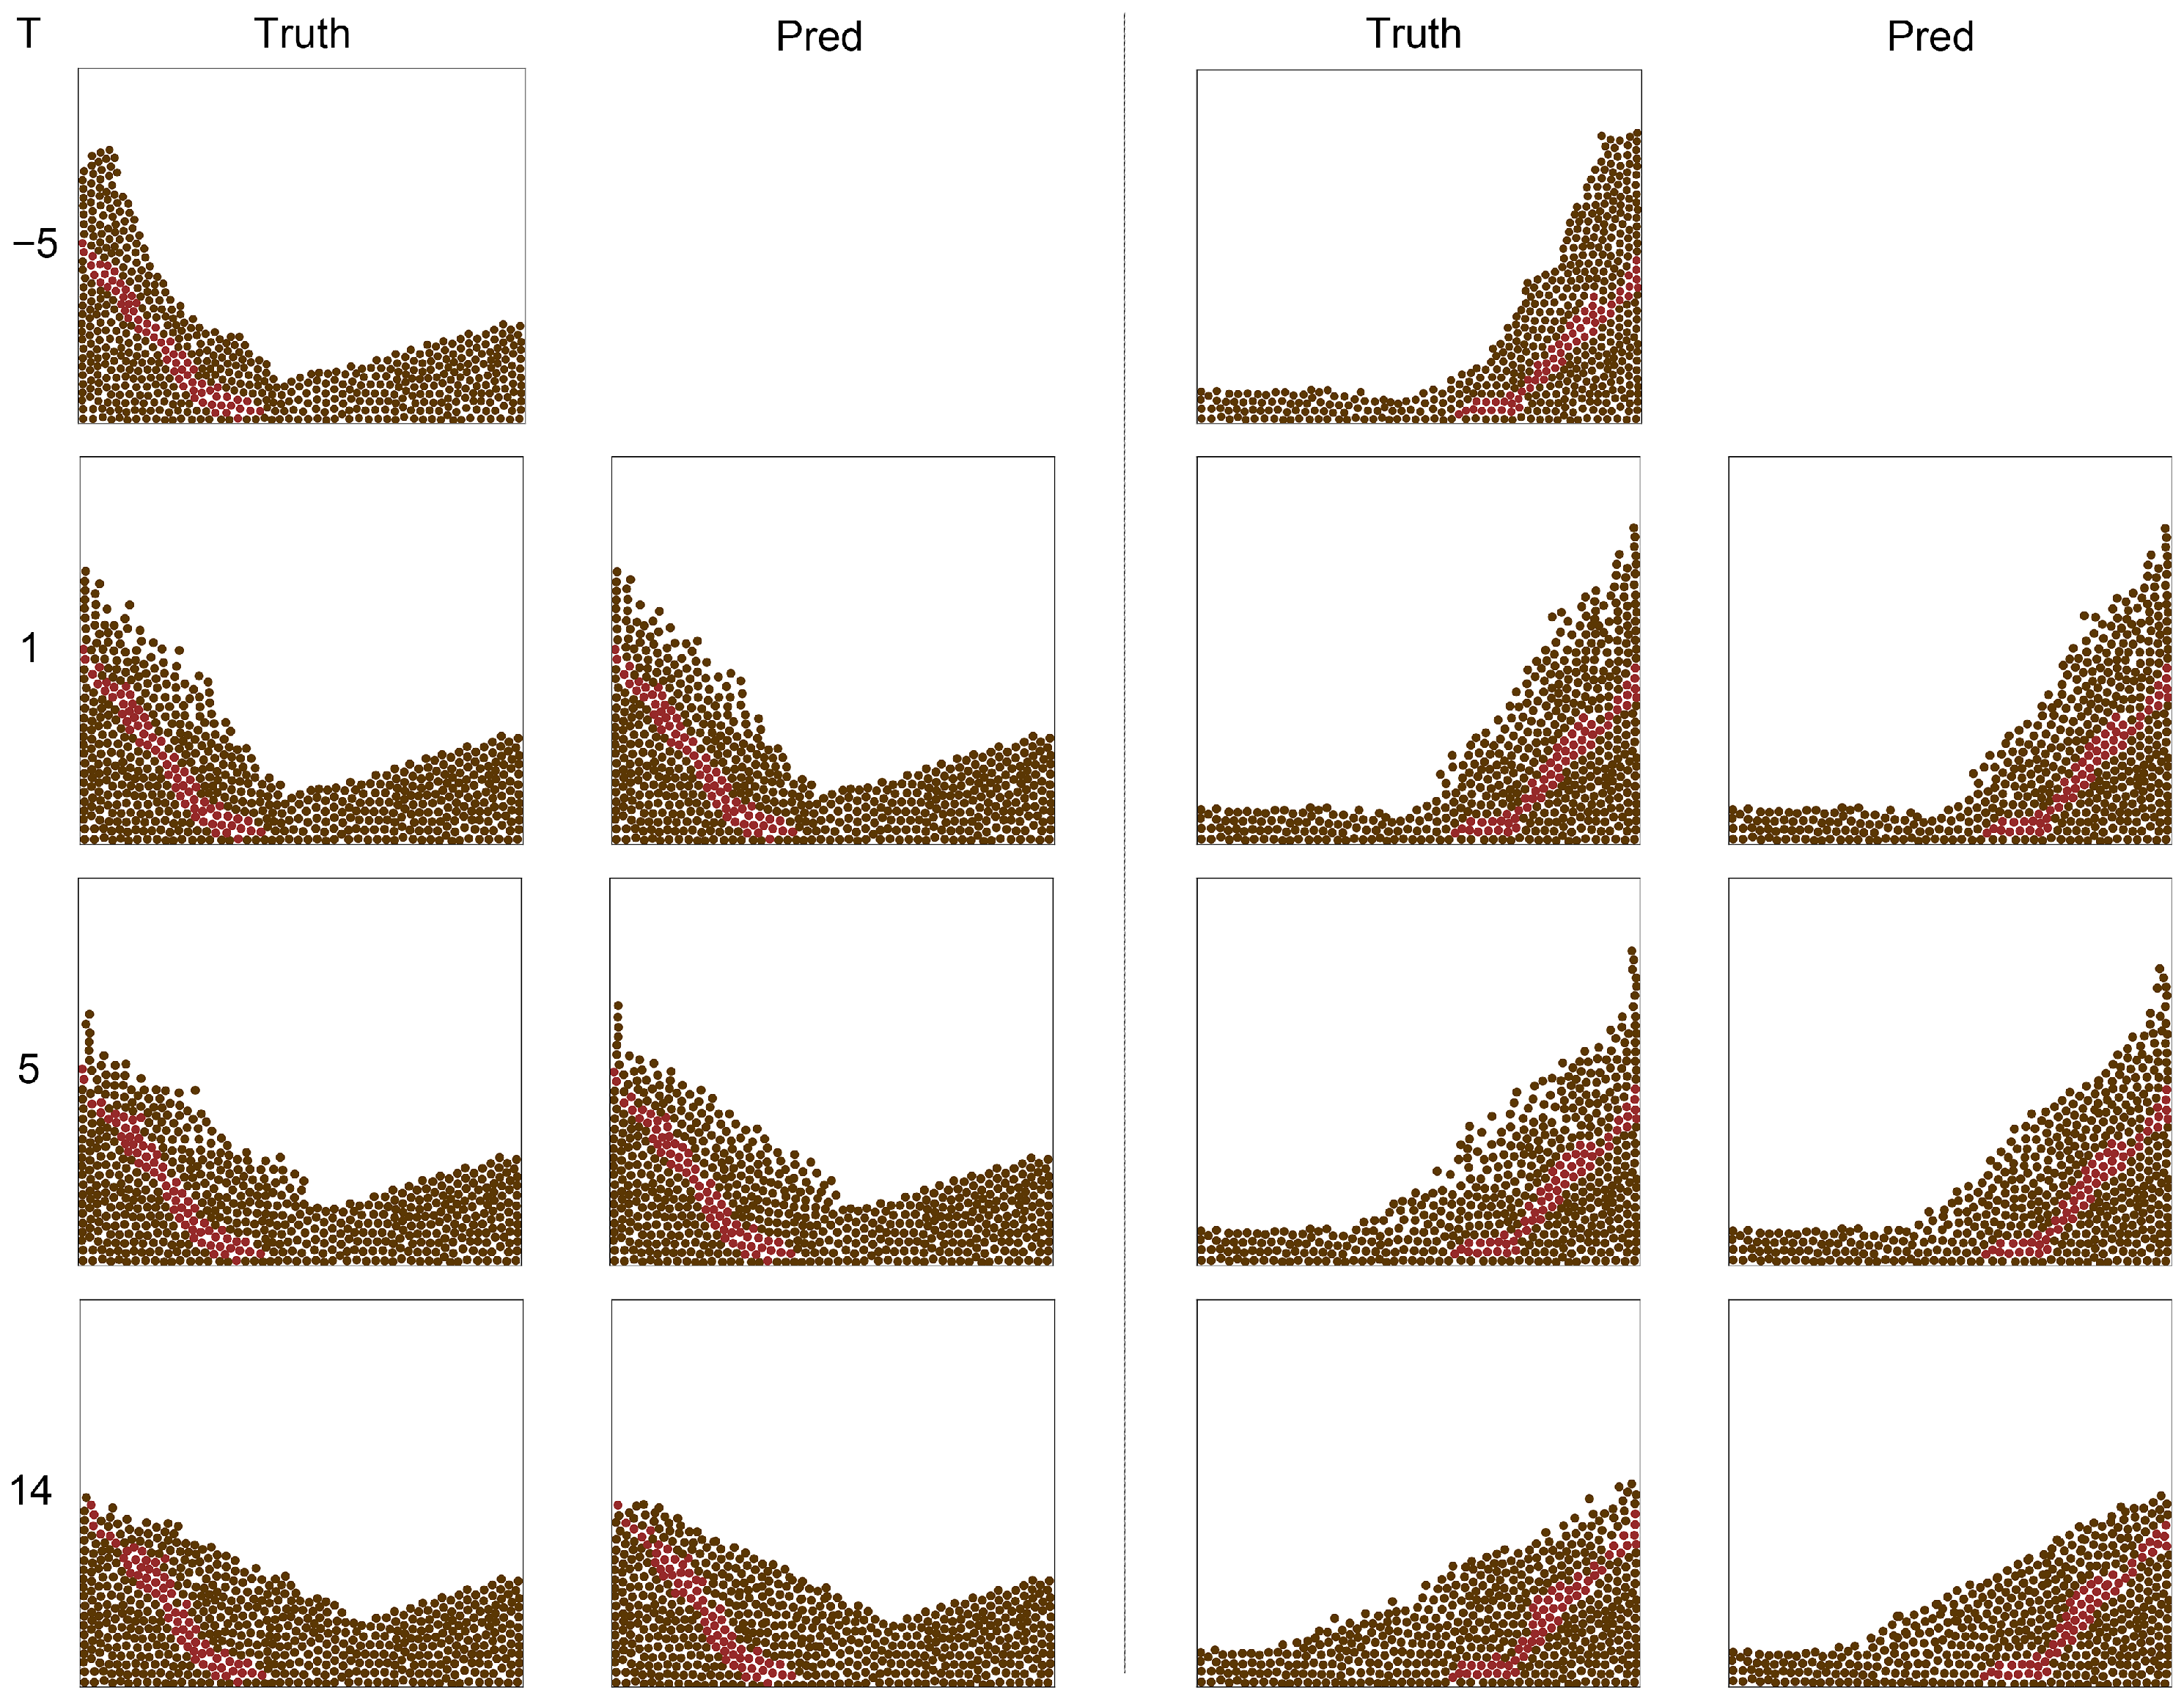
- SlideThe Slide dataset describes the displacement process of the soil and rock mass on a hillside due to gravitational forces, typically characterized using elastoplastic constitutive relationships, and the Mohr–Coulomb model as the strength criterion.The Slide contains 1000 landslide sequences, each spanning 20 time steps within a domain. The interval between two steps was 0.001 s. There were three soil layers and two kinds of soil particles with different properties. The middle layer was filled with soil particles that are more prone to sliding, which is a contributing factor to landslides. By modifying the distribution area of the three soil layers, we generated 1000 landslides. An average of 700 particles participated in each simulation. We recorded the two-dimensional particle trajectories and the particle types.
- Direct ShearThe Direct Shear experiment simulates the deformation process of soil and rock mass under shear stress, characterized by elastoplastic constitutive relationships. Additionally, the Mohr–Coulomb model was employed as the strength criterion.
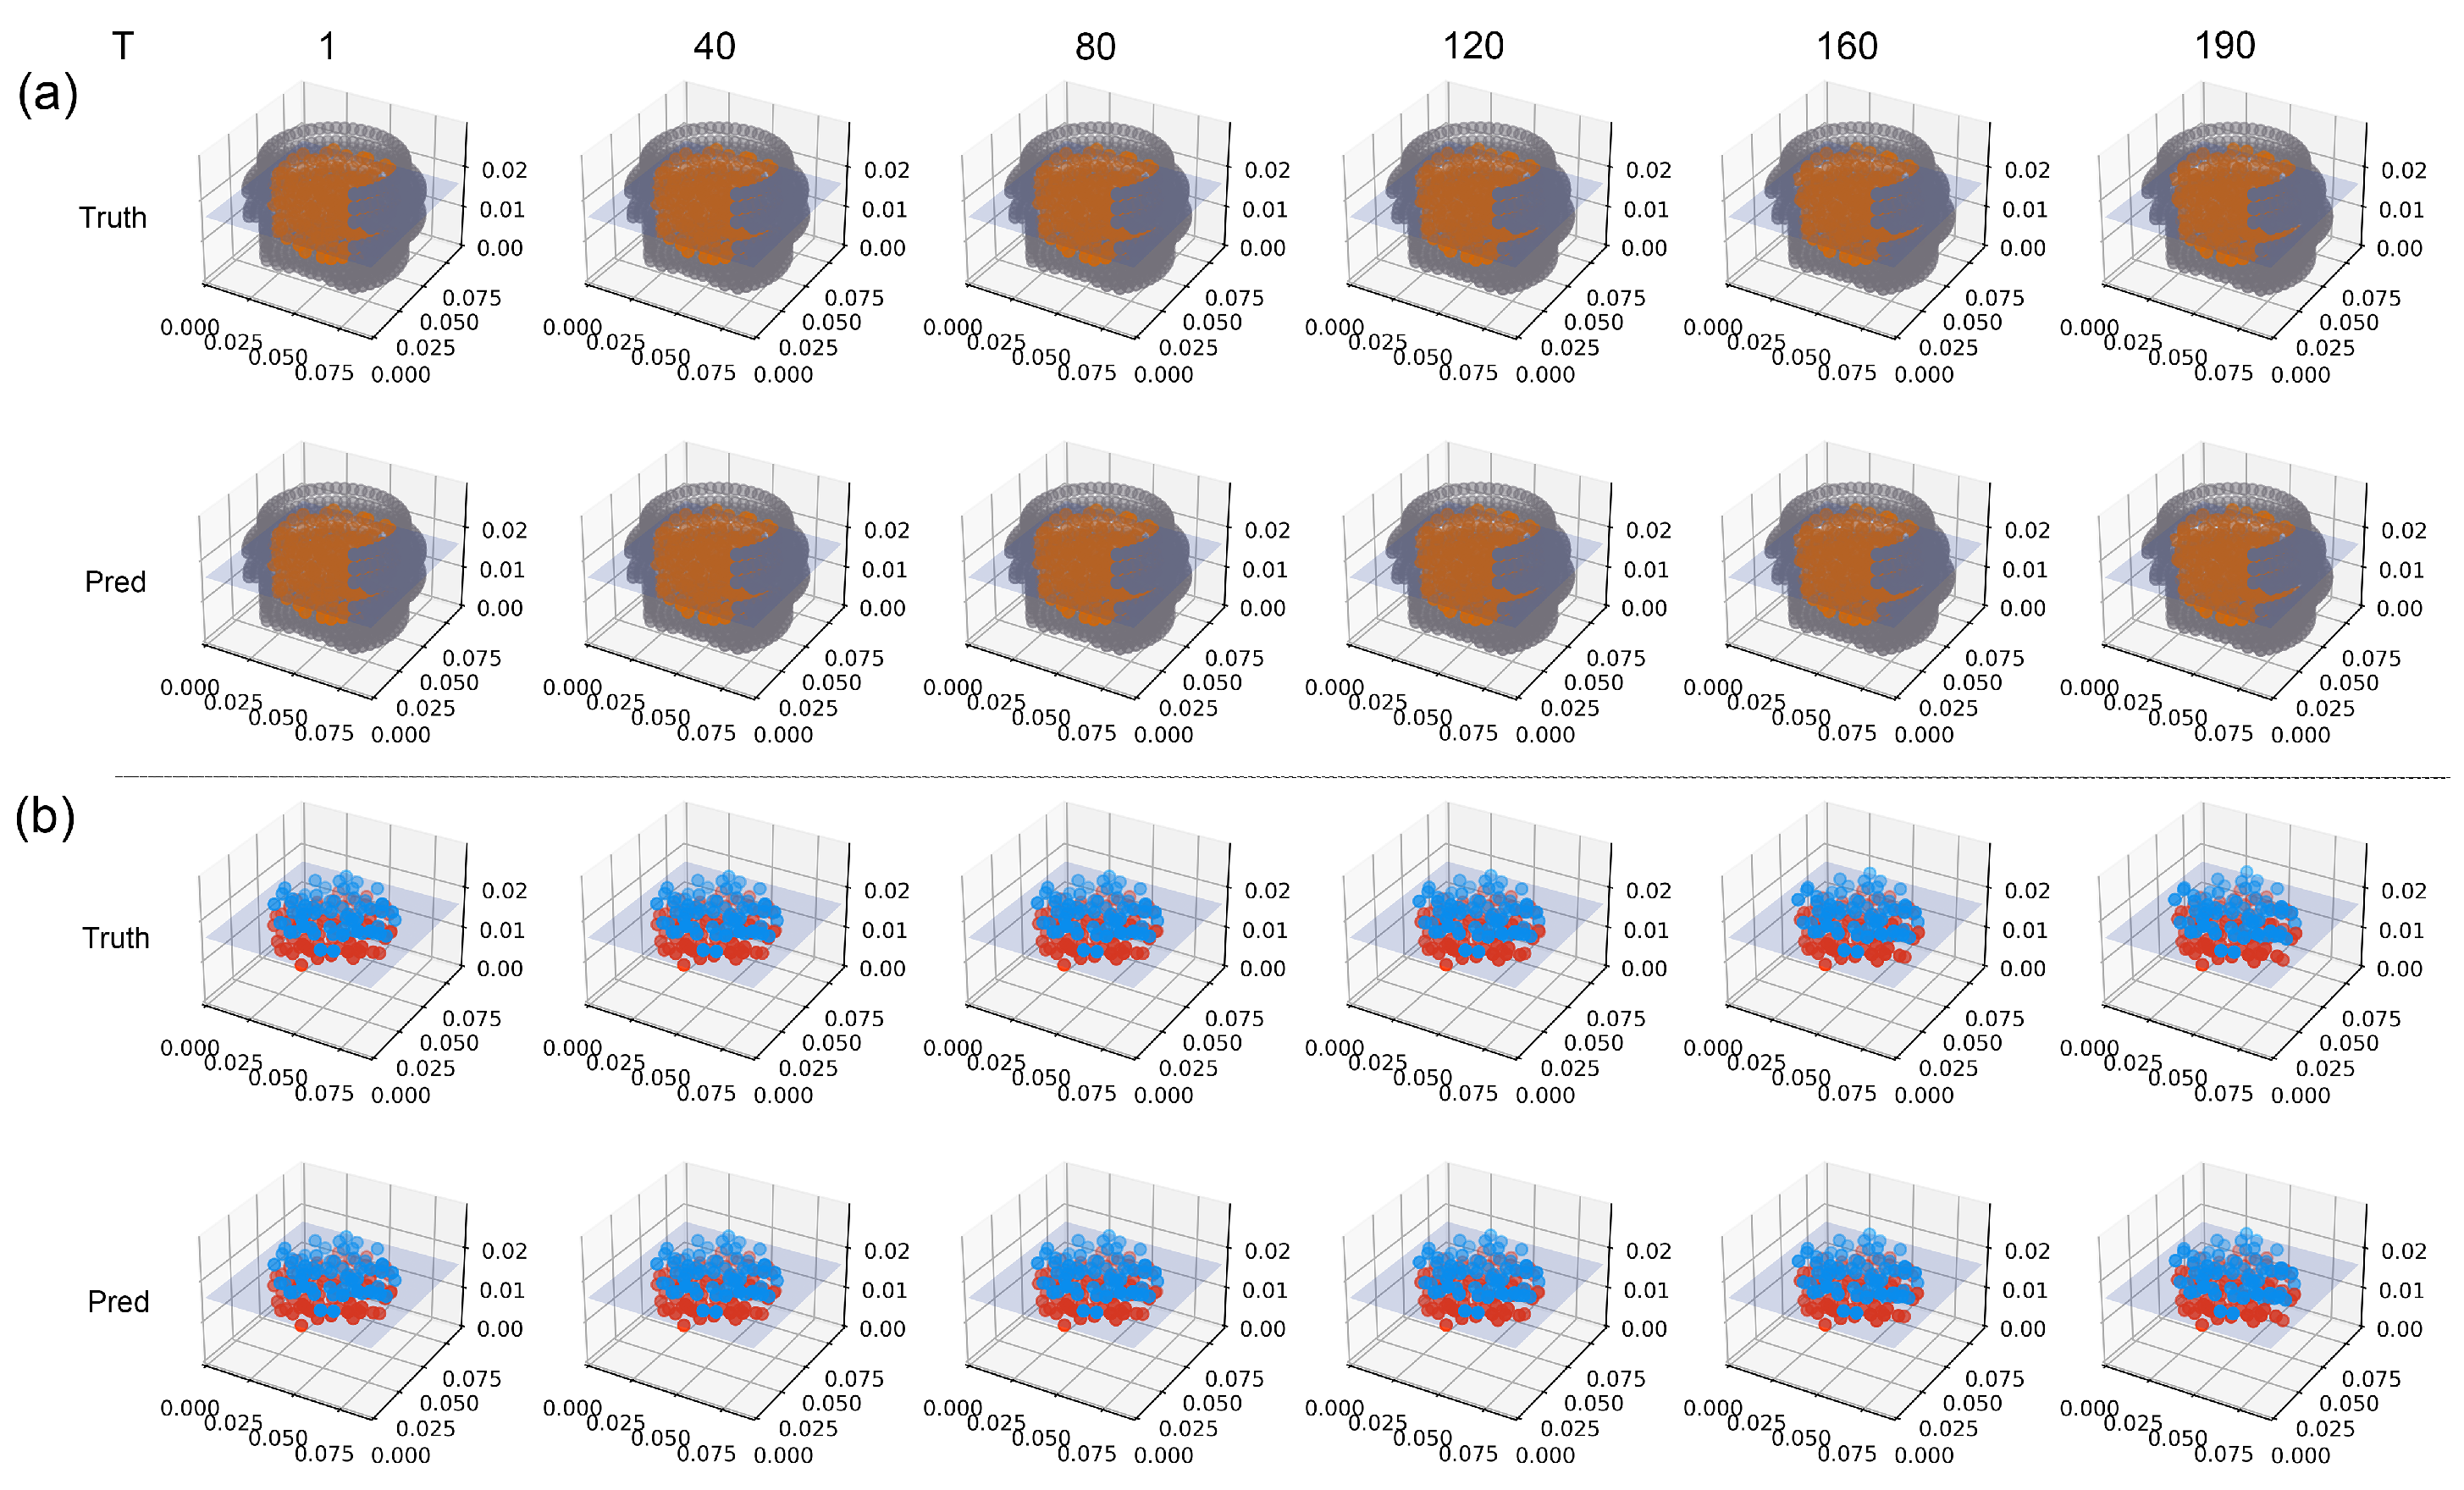
- The Direct Shear dataset describes 400 direct shear processes in 200 time steps within a domain. The interval between two steps was 0.000006 s. Unlike the other two datasets, the Directed Shear dataset adjusted the Young’s modulus of soil particles for 20 time steps. For each type of soil, we recorded 20 time steps of the direct shear process with different moving distances. The purpose of modifying soil particle properties was to verify that the model had the ability to perceive material properties. Therefore, in addition to three-dimensional positions and particle types, particle physical properties needed to be recorded.
- Slide-SameR and Slide-SmallThese public benchmarks capture small-scale landslide scenarios with trajectories of approximately 40 particles over 20 time steps. In Slide-SameR, all particles share the same radius, whereas Slide-Small uses heterogeneous radii. Further details are provided in [52]. Note: To avoid confusion with our newly constructed Slide dataset, we refer to the dataset named “Slide” in [52] as Slide-Small.
5.2. Performance Measure
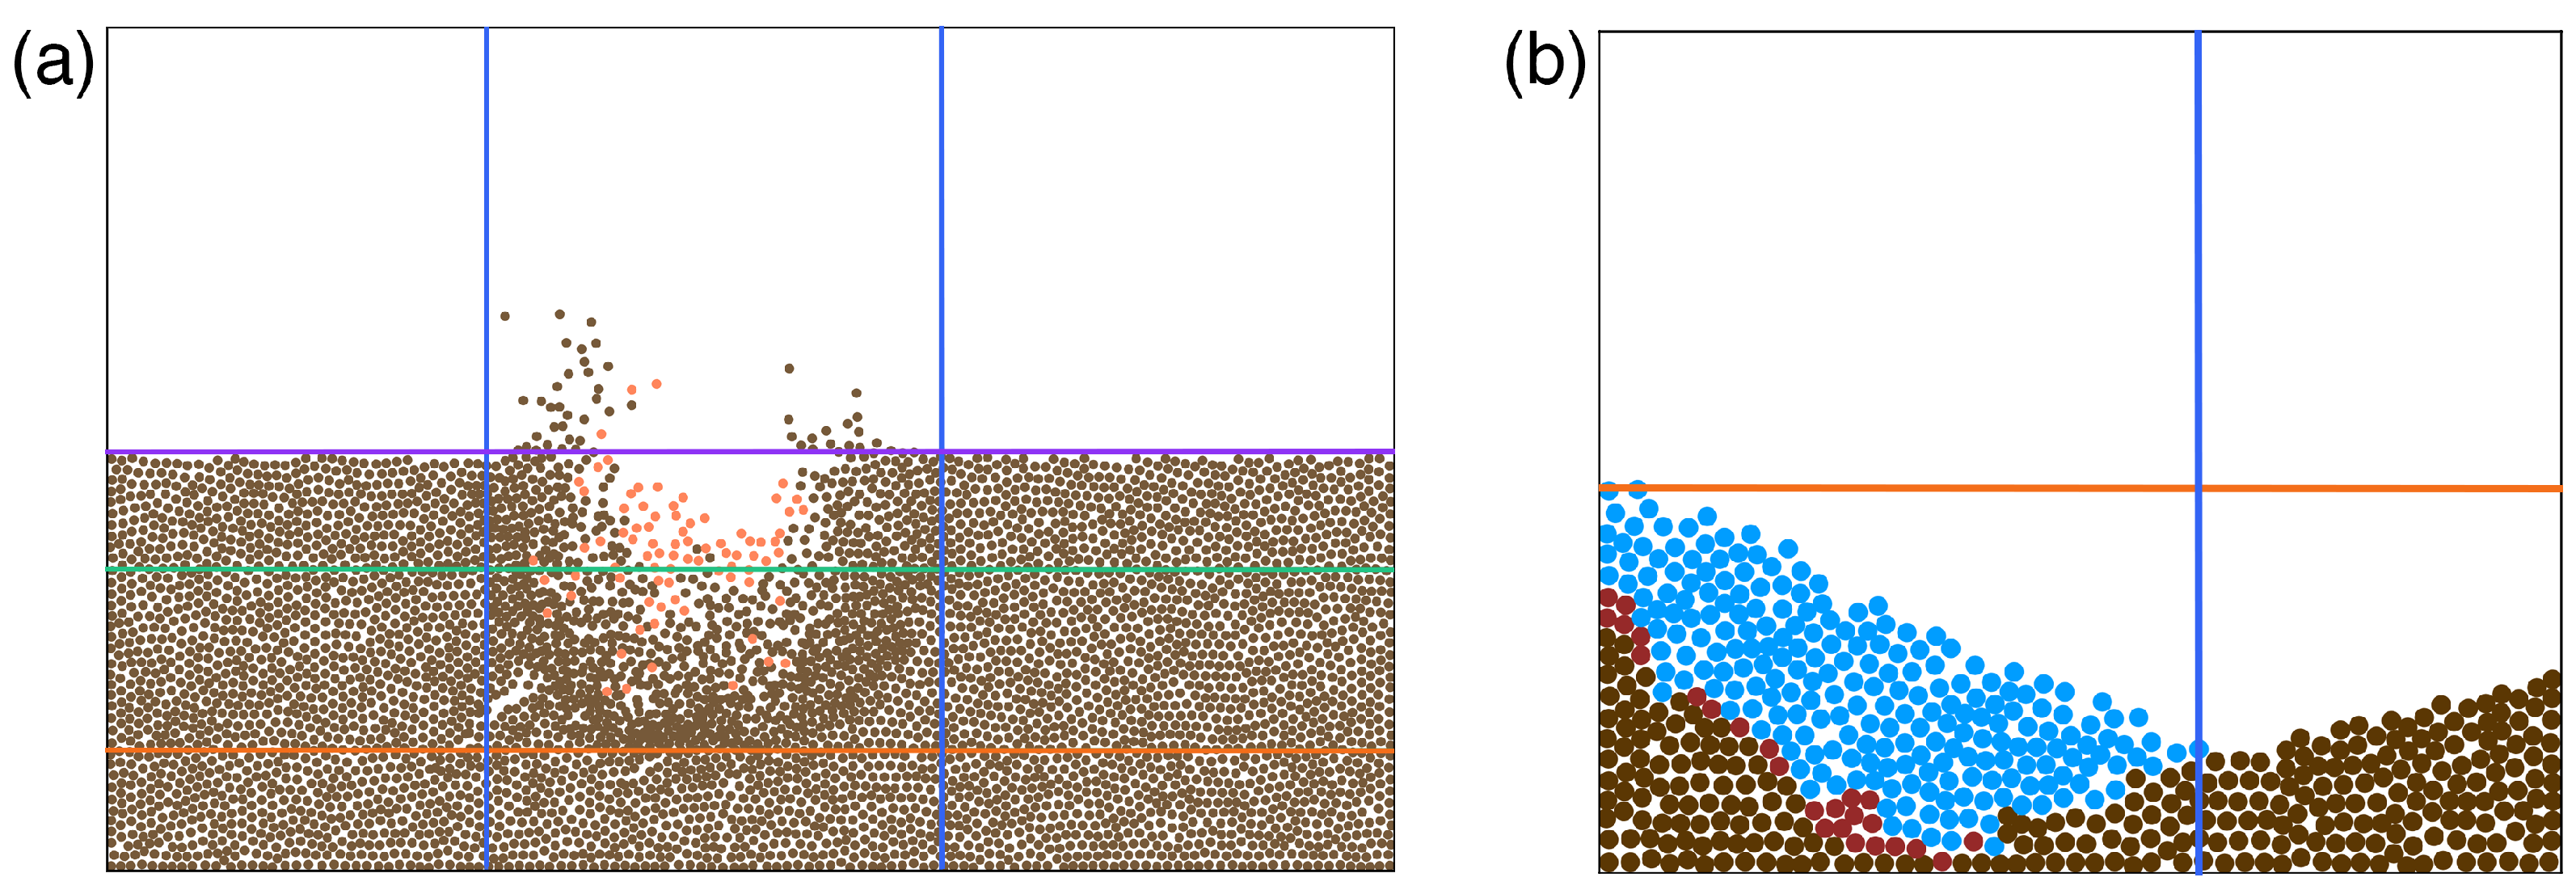
- Imp Dep: impact depth. As the orange line in Figure 5a, the impact depth is the deepest depth caused by the meteorite impact. We measured this depth by statistical particle density.
- Cra Dep: crater depth. As an auxiliary indicator for assessing impact depth, the crater depth refers to the vertical measurement of the crater. This measurement was determined by observing changes in the terrain, as illustrated by the green line in Figure 5a.
- Imp R(L/R): impact range (left/right). As marked by the blue line in Figure 5a, the impact range represents the impact on the left and right sides in the horizontal direction caused by the impact. We measured them by judging the position change of particles.
- Sp Num(L/R): number of splashed particles (left/right). We categorize particles situated above the ground as splashed particles. The purple line demarcated in Figure 5a signifies the ground level. Subsequently, we conducted a tally of the splashed particles on both the left and right sides.
- Max Ht(L/R): max height of splash (left/right). The maximum height of splashed particles.
- Mean Ht(L/R): mean height of splash (left/right). The average height of splashed particles.
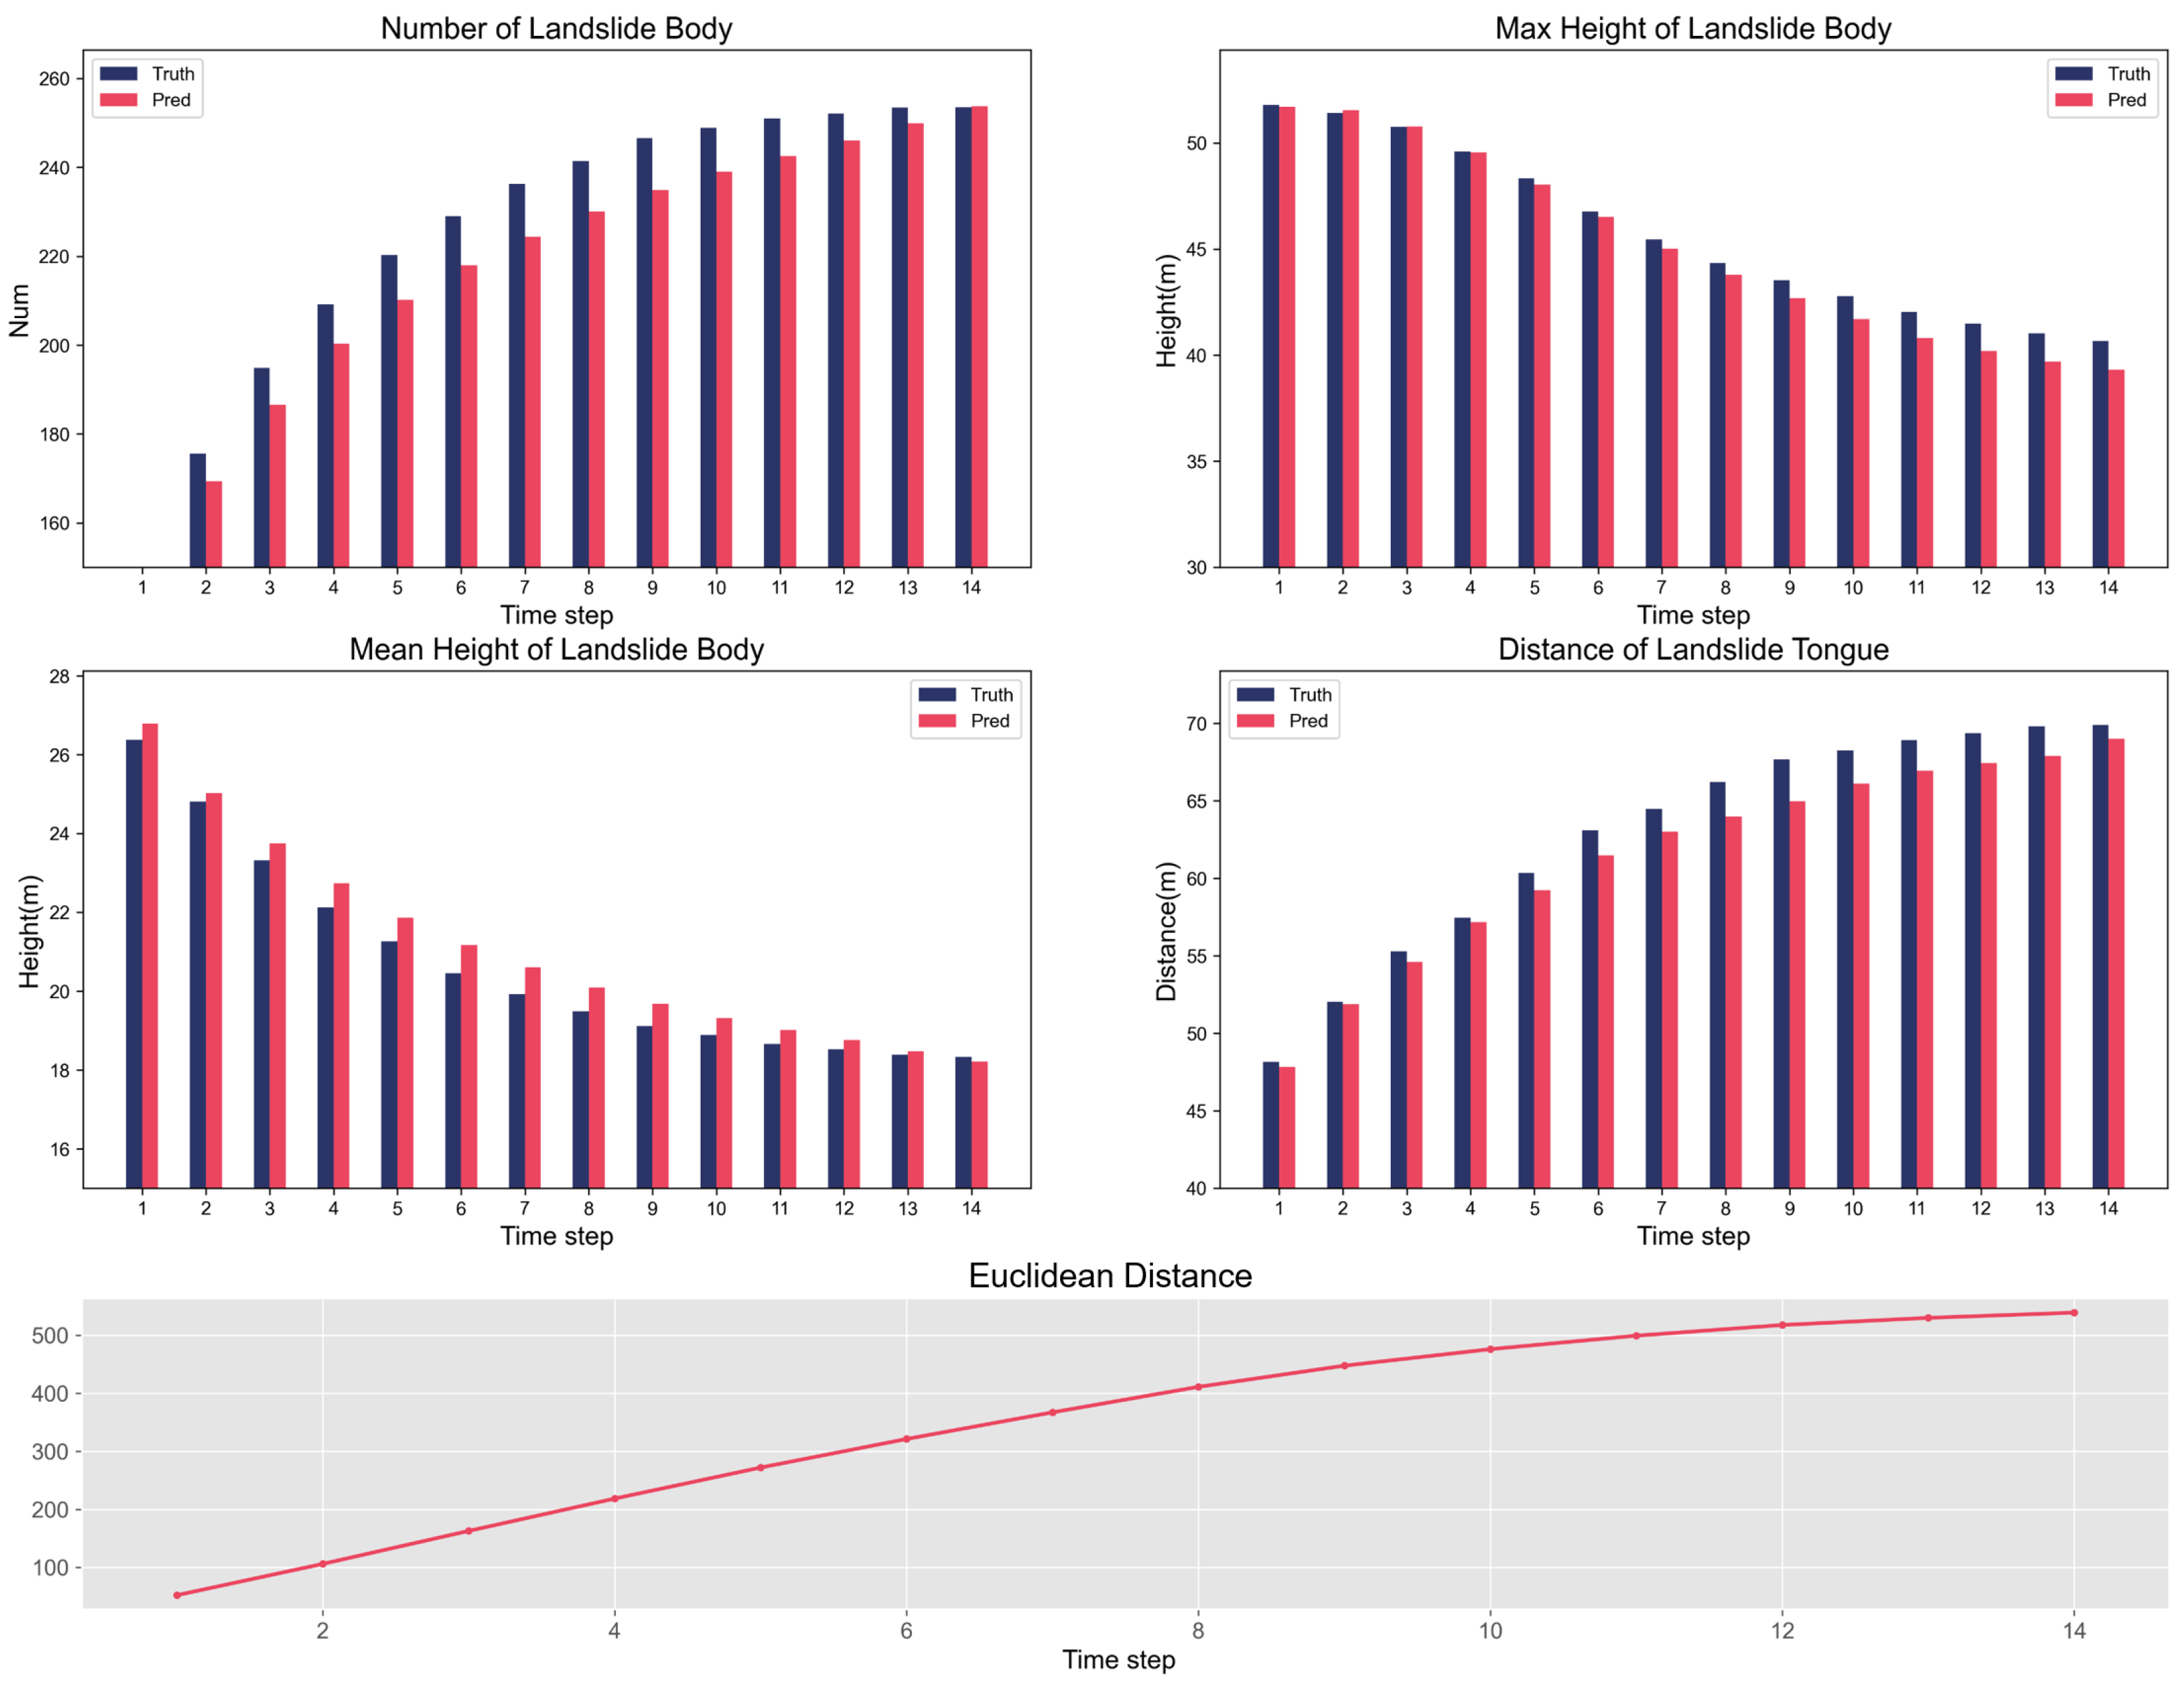
- Slide Num: number of landslide body.
- Max Ht: max height of landslide body. The height of the highest particle in the landslide body, as the orange line marked in Figure 5b.
- Mean Ht: mean height of landslide body. The average height of the particles in the landslide body.
- Tongue Dis: distance of landslide tongue. This indicator reflects the longest distance that the landslide tongue can reach, as the blue line marked in Figure 5b.
- Dis: accuracy of landslide body. In order to further reflect the difference between the predicted particle position of the landslide body, denoted as , and the actual position, denoted as , we calculated the Euclidean distance between the two:where and .
- Distance to Failure Surface (Above/Below): We calculated the Euclidean distance between the predicted particle position 5 mm above or below the failure surface, denoted as , and the actual position, denoted as :where , and .
- Distance of All Particles: The calculation was the same as the above, except that the Euclidean distance of all particles was calculated.
5.3. Baselines
5.4. Experimental Setup
5.4.1. Model Implementation
5.4.2. Input and Output Details
5.4.3. Training
5.4.4. Evaluation
6. Results and Discussion
6.1. Dynamics Problem
6.2. Statics Problem
6.3. Principle Problem
6.4. Universality Across Different Constitutive Relations
6.5. Computational Efficiency
6.6. Further Comparisons and Discussion
6.6.1. Comparison with Conventional DEM
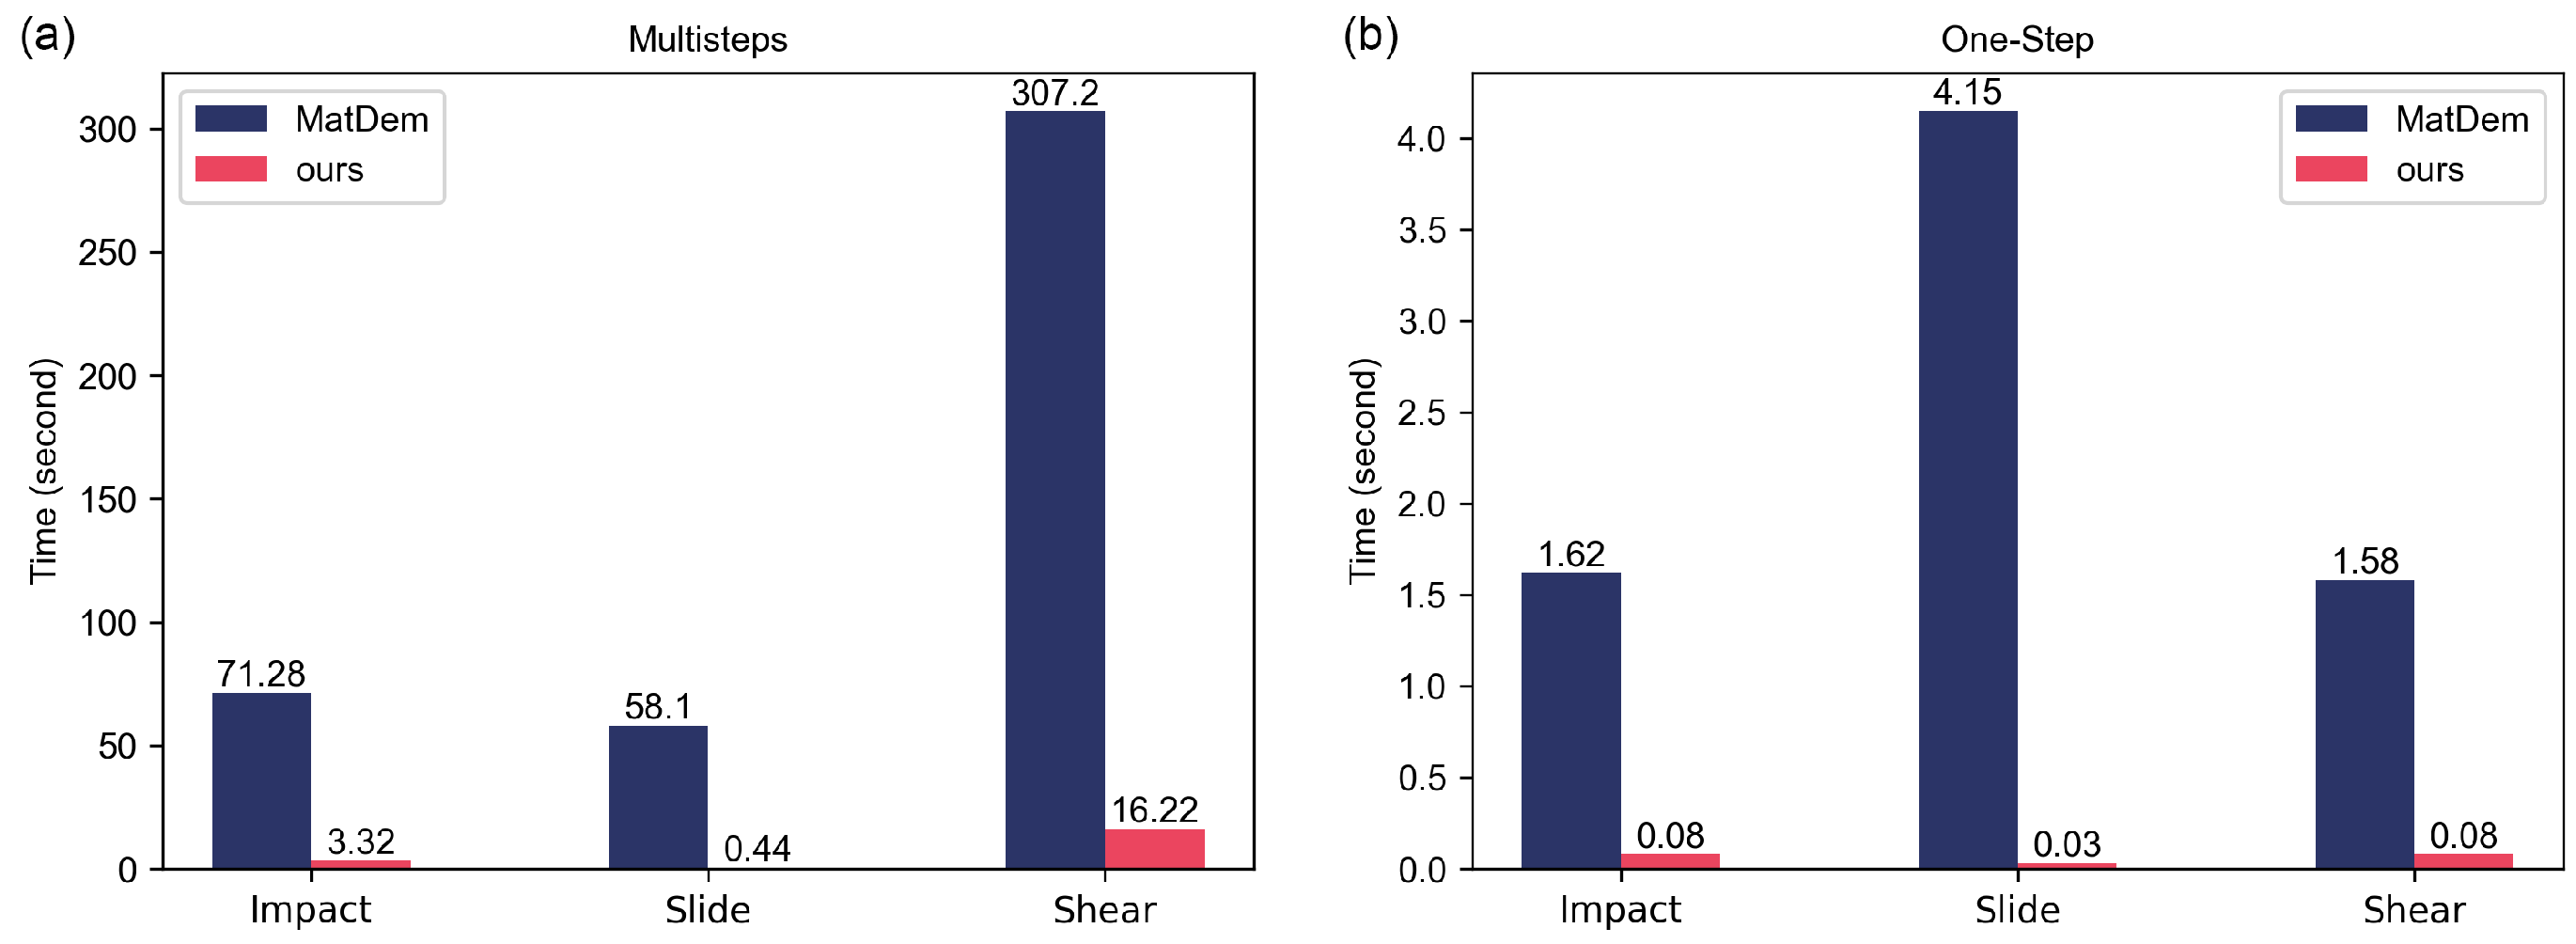
- Efficiency. As a learned surrogate, Graph-DEM delivers substantial wall-clock speedups by replacing costly contact search and force integration with parallel neural inference.
- Generality. The framework is agnostic to specific scenarios and can proxy multiple granular phenomena under a unified graph formulation.
- Accuracy. Against DEM references (ground truth), Graph-DEM attains an accuracy above 93% on multiple metrics across datasets.
6.6.2. Comparison with Related DL-Based Methods
7. Conclusions
Author Contributions
Funding
Institutional Review Board Statement
Informed Consent Statement
Data Availability Statement
Conflicts of Interest
Appendix A. Hyperparameter Sensitivity Analysis
| Meteorite Impact | Slide | Direct Shear () | ||||
|---|---|---|---|---|---|---|
| Q | =5 | 7.732 | =5 | 3.887 | =5 | 11.851 |
| =10 | 6.931 | =10 | 2.305 | =10 | 7.419 | |
| =15 | 7.193 | =15 | 2.806 | =15 | 7.712 | |
| R | =1 | 35.028 | =1 | 28.365 | =0.001 | 858.752 |
| =8 | 7.506 | =8 | 2.839 | =0.01 | 10.138 | |
| =10 | 6.931 | =10 | 2.305 | =0.015 | 7.419 | |
| =12 | 7.012 | =12 | 2.337 | =0.02 | 7.808 | |
| Vector Length | =64 | 8.082 | =64 | 3.068 | =64 | 8.730 |
| =128 | 6.931 | =128 | 2.305 | =128 | 7.419 | |
| =256 | 6.807 | =256 | 2.358 | =256 | 7.862 | |
References
- Cundall, P.A.; Strack, O.D. A discrete numerical model for granular assemblies. Geotechnique 1979, 29, 47–65. [Google Scholar] [CrossRef]
- Liu, C. Matrix Discrete Element Analysis of Geological and Geotechnical Engineering; Springer: Berlin/Heidelberg, Germany, 2021. [Google Scholar] [CrossRef]
- Elman, J.L. Finding structure in time. Cogn. Sci. 1990, 14, 179–211. [Google Scholar] [CrossRef]
- Krizhevsky, A.; Sutskever, I.; Hinton, G.E. Imagenet classification with deep convolutional neural networks. Commun. ACM 2017, 60, 84–90. [Google Scholar] [CrossRef]
- Scarselli, F.; Gori, M.; Tsoi, A.C.; Hagenbuchner, M.; Monfardini, G. The graph neural network model. IEEE Trans. Neural Netw. 2008, 20, 61–80. [Google Scholar] [CrossRef] [PubMed]
- Bruna, J.; Zaremba, W.; Szlam, A.; LeCun, Y. Spectral networks and locally connected networks on graphs. arXiv 2013, arXiv:1312.6203. [Google Scholar] [CrossRef]
- Vaswani, A.; Shazeer, N.; Parmar, N.; Uszkoreit, J.; Jones, L.; Gomez, A.N.; Kaiser, Ł.; Polosukhin, I. Attention is all you need. In Advances in Neural Information Processing Systems; Curran Associates Inc.: Red Hook, NY, USA, 2017; Volume 30. [Google Scholar]
- Zhang, W.; Li, H.; Tang, L.; Gu, X.; Wang, L.; Wang, L. Displacement prediction of Jiuxianping landslide using gated recurrent unit (GRU) networks. Acta Geotech. 2022, 17, 1367–1382. [Google Scholar] [CrossRef]
- Wang, Z.Z.; Goh, S.H. A maximum entropy method using fractional moments and deep learning for geotechnical reliability analysis. Acta Geotech. 2022, 17, 1147–1166. [Google Scholar] [CrossRef]
- Guo, D.; Li, J.; Jiang, S.H.; Li, X.; Chen, Z. Intelligent assistant driving method for tunnel boring machine based on big data. Acta Geotech. 2022, 17, 1019–1030. [Google Scholar] [CrossRef]
- Kipf, T.N.; Welling, M. Semi-supervised classification with graph convolutional networks. arXiv 2016, arXiv:1609.02907. [Google Scholar] [CrossRef]
- Gilmer, J.; Schoenholz, S.S.; Riley, P.F.; Vinyals, O.; Dahl, G.E. Neural message passing for quantum chemistry. In Proceedings of the International Conference on Machine Learning, Sydney, Australia, 6–11 August 2017; pp. 1263–1272. [Google Scholar]
- Hornik, K.; Stinchcombe, M.; White, H. Multilayer feedforward networks are universal approximators. Neural Netw. 1989, 2, 359–366. [Google Scholar] [CrossRef]
- LeCun, Y.; Bengio, Y.; Hinton, G. Deep learning. Nature 2015, 521, 436–444. [Google Scholar] [CrossRef] [PubMed]
- Utili, S.; Nova, R. DEM analysis of bonded granular geomaterials. Int. J. Numer. Anal. Methods Geomech. 2008, 32, 1997–2031. [Google Scholar] [CrossRef]
- Krzaczek, M.; Nitka, M.; Tejchman, J. Modelling of Hydraulic Fracturing in Rocks in Non-isothermal Conditions Using Coupled DEM/CFD Approach with Two-Phase Fluid Flow Model. In Multiscale Processes of Instability, Deformation and Fracturing in Geomaterials, Proceedings of the 12th International Workshop on Bifurcation and Degradation in Geomechanics; Springer: Cham, Switzerland, 2022; pp. 114–126. [Google Scholar] [CrossRef]
- El Shamy, U.; Abdelhamid, Y. Modeling granular soils liquefaction using coupled lattice Boltzmann method and discrete element method. Soil Dyn. Earthq. Eng. 2014, 67, 119–132. [Google Scholar] [CrossRef]
- Cai, M.; Kaiser, P.; Morioka, H.; Minami, M.; Maejima, T.; Tasaka, Y.; Kurose, H. FLAC/PFC coupled numerical simulation of AE in large-scale underground excavations. Int. J. Rock Mech. Min. Sci. 2007, 44, 550–564. [Google Scholar] [CrossRef]
- O’Sullivan, C. Particulate Discrete Element Modelling: A Geomechanics Perspective; CRC Press: Boca Raton, FL, USA, 2011. [Google Scholar]
- Wang, X.; Ji, H.; Shi, C.; Wang, B.; Ye, Y.; Cui, P.; Yu, P.S. Heterogeneous graph attention network. In Proceedings of the World Wide Web Conference, San Francisco, CA, USA, 13–17 May 2019; pp. 2022–2032. [Google Scholar] [CrossRef]
- Qu, L.; Zhu, H.; Duan, Q.; Shi, Y. Continuous-time link prediction via temporal dependent graph neural network. In Proceedings of the Web Conference 2020, Taipei, Taiwan, 20–24 April 2020; pp. 3026–3032. [Google Scholar] [CrossRef]
- Velickovic, P.; Cucurull, G.; Casanova, A.; Romero, A.; Lio, P.; Bengio, Y. Graph attention networks. arXiv 2017, arXiv:1710.10903. [Google Scholar] [CrossRef]
- Wu, Z.; Pan, S.; Long, G.; Jiang, J.; Chang, X.; Zhang, C. Connecting the dots: Multivariate time series forecasting with graph neural networks. In Proceedings of the 26th ACM SIGKDD International Conference on Knowledge Discovery & Data Mining, Virtual Event, 6–10 July 2020; pp. 753–763. [Google Scholar] [CrossRef]
- Zhang, M.; Chen, Y. Link prediction based on graph neural networks. In Advances in Neural Information Processing Systems; Curran Associates Inc.: Red Hook, NY, USA, 2018; Volume 31. [Google Scholar]
- Nasiri, E.; Berahmand, K.; Rostami, M.; Dabiri, M. A novel link prediction algorithm for protein-protein interaction networks by attributed graph embedding. Comput. Biol. Med. 2021, 137, 104772. [Google Scholar] [CrossRef]
- Zhou, J.; Cui, G.; Hu, S.; Zhang, Z.; Yang, C.; Liu, Z.; Wang, L.; Li, C.; Sun, M. Graph neural networks: A review of methods and applications. AI Open 2020, 1, 57–81. [Google Scholar] [CrossRef]
- Li, Y.; Yu, R.; Shahabi, C.; Liu, Y. Diffusion convolutional recurrent neural network: Data-driven traffic forecasting. arXiv 2017, arXiv:1707.01926. [Google Scholar] [CrossRef]
- Yu, B.; Yin, H.; Zhu, Z. Spatio-temporal graph convolutional networks: A deep learning framework for traffic forecasting. arXiv 2017, arXiv:1709.04875. [Google Scholar] [CrossRef]
- Duvenaud, D.K.; Maclaurin, D.; Iparraguirre, J.; Bombarell, R.; Hirzel, T.; Aspuru-Guzik, A.; Adams, R.P. Convolutional networks on graphs for learning molecular fingerprints. In Advances in Neural Information Processing Systems; MIT Press: Cambridge, MA, USA, 2015; Volume 28. [Google Scholar]
- Schlichtkrull, M.; Kipf, T.N.; Bloem, P.; Van Den Berg, R.; Titov, I.; Welling, M. Modeling relational data with graph convolutional networks. In The Semantic Web: 15th International Conference, ESWC 2018, Heraklion, Crete, Greece, 3–7 June 2018; Proceedings 15; Springer: Cham, Switzerland, 2018; pp. 593–607. [Google Scholar]
- Ying, R.; He, R.; Chen, K.; Eksombatchai, P.; Hamilton, W.L.; Leskovec, J. Graph convolutional neural networks for web-scale recommender systems. In Proceedings of the 24th ACM SIGKDD International Conference on Knowledge Discovery & Data Mining, London, UK, 19–23 August 2018; pp. 974–983. [Google Scholar] [CrossRef]
- He, X.; Deng, K.; Wang, X.; Li, Y.; Zhang, Y.; Wang, M. Lightgcn: Simplifying and powering graph convolution network for recommendation. In Proceedings of the 43rd International ACM SIGIR Conference on Research and Development in Information Retrieval, Virtual Event, 25–30 July 2020; pp. 639–648. [Google Scholar] [CrossRef]
- Grzeszczuk, R.; Terzopoulos, D.; Hinton, G. Neuroanimator: Fast neural network emulation and control of physics-based models. In Proceedings of the 25th Annual Conference on Computer Graphics and Interactive Techniques, Orlando, FL, USA, 19–24 July 1998; pp. 9–20. [Google Scholar] [CrossRef]
- Chern, A.; Knöppel, F.; Pinkall, U.; Schröder, P. Inside fluids: Clebsch maps for visualization and processing. ACM Trans. Graph. (TOG) 2017, 36, 142. [Google Scholar] [CrossRef]
- Wu, K.; Truong, N.; Yuksel, C.; Hoetzlein, R. Fast fluid simulations with sparse volumes on the GPU. Comput. Graph. Forum 2018, 37, 157–167. [Google Scholar] [CrossRef]
- Skrivan, T.; Soderstrom, A.; Johansson, J.; Sprenger, C.; Museth, K.; Wojtan, C. Wave curves: Simulating lagrangian water waves on dynamically deforming surfaces. ACM Trans. Graph. (TOG) 2020, 39, 65. [Google Scholar] [CrossRef]
- Wolper, J.; Fang, Y.; Li, M.; Lu, J.; Gao, M.; Jiang, C. CD-MPM: Continuum damage material point methods for dynamic fracture animation. ACM Trans. Graph. (TOG) 2019, 38, 119. [Google Scholar] [CrossRef]
- Fei, Y.; Batty, C.; Grinspun, E.; Zheng, C. A multi-scale model for simulating liquid-fabric interactions. ACM Trans. Graph. (TOG) 2018, 37, 51. [Google Scholar] [CrossRef]
- Ruan, L.; Liu, J.; Zhu, B.; Sueda, S.; Wang, B.; Chen, B. Solid-fluid interaction with surface-tension-dominant contact. ACM Trans. Graph. (TOG) 2021, 40, 120. [Google Scholar] [CrossRef]
- Ladickỳ, L.; Jeong, S.; Solenthaler, B.; Pollefeys, M.; Gross, M. Data-driven fluid simulations using regression forests. ACM Trans. Graph. (TOG) 2015, 34, 199. [Google Scholar] [CrossRef]
- Li, Y.; Wu, J.; Tedrake, R.; Tenenbaum, J.B.; Torralba, A. Learning particle dynamics for manipulating rigid bodies, deformable objects, and fluids. arXiv 2018, arXiv:1810.01566. [Google Scholar] [CrossRef]
- Ummenhofer, B.; Prantl, L.; Thuerey, N.; Koltun, V. Lagrangian fluid simulation with continuous convolutions. In Proceedings of the International Conference on Learning Representations, Addis Ababa, Ethiopia, 26–30 April 2020; Available online: https://openreview.net/forum?id=B1lDoJSYDH (accessed on 20 September 2025).
- Sanchez-Gonzalez, A.; Godwin, J.; Pfaff, T.; Ying, R.; Leskovec, J.; Battaglia, P. Learning to simulate complex physics with graph networks. In Proceedings of the International Conference on Machine Learning, Virtual, 13–18 July 2020; pp. 8459–8468. [Google Scholar]
- Rubanova, Y.; Sanchez-Gonzalez, A.; Pfaff, T.; Battaglia, P. Constraint-based graph network simulator. arXiv 2021, arXiv:2112.09161. [Google Scholar] [CrossRef]
- Wu, T.; Wang, Q.; Zhang, Y.; Ying, R.; Cao, K.; Sosic, R.; Jalali, R.; Hamam, H.; Maucec, M.; Leskovec, J. Learning large-scale subsurface simulations with a hybrid graph network simulator. In Proceedings of the 28th ACM SIGKDD Conference on Knowledge Discovery and Data Mining, Washington, DC, USA, 14–18 August 2022; pp. 4184–4194. [Google Scholar] [CrossRef]
- Cranmer, M.; Greydanus, S.; Hoyer, S.; Battaglia, P.; Spergel, D.; Ho, S. Lagrangian neural networks. arXiv 2020, arXiv:2003.04630. [Google Scholar]
- Bhattoo, R.; Ranu, S.; Krishnan, N. Learning articulated rigid body dynamics with lagrangian graph neural network. In Advances in Neural Information Processing Systems; Curran Associates Inc.: Red Hook, NY, USA, 2022; Volume 35, pp. 29789–29800. [Google Scholar]
- Satorras, V.G.; Hoogeboom, E.; Welling, M. E(n) equivariant graph neural networks. In Proceedings of the International Conference on Machine Learning, Virtual, 18–24 July 2021; pp. 9323–9332. [Google Scholar]
- Huang, W.; Han, J.; Rong, Y.; Xu, T.; Sun, F.; Huang, J. Equivariant graph mechanics networks with constraints. arXiv 2022, arXiv:2203.06442. [Google Scholar] [CrossRef]
- Wu, L.; Hou, Z.; Yuan, J.; Rong, Y.; Huang, W. Equivariant spatio-temporal attentive graph networks to simulate physical dynamics. In Advances in Neural Information Processing Systems; Curran Associates Inc.: Red Hook, NY, USA, 2023; Volume 36, pp. 45360–45380. [Google Scholar]
- Han, J.; Huang, W.; Ma, H.; Li, J.; Tenenbaum, J.; Gan, C. Learning physical dynamics with subequivariant graph neural networks. In Advances in Neural Information Processing Systems; Curran Associates Inc.: Red Hook, NY, USA, 2022; Volume 35, pp. 26256–26268. [Google Scholar]
- Li, B.; Du, B.; Ye, J.; Huang, J.; Sun, L.; Feng, J. Learning solid dynamics with graph neural network. Inf. Sci. 2024, 676, 120791. [Google Scholar] [CrossRef]
- Glorot, X.; Bengio, Y. Understanding the difficulty of training deep feedforward neural networks. In Proceedings of the Thirteenth International Conference on Artificial Intelligence and Statistics, Sardinia, Italy, 13–15 May 2010; pp. 249–256. Available online: http://proceedings.mlr.press/v9/glorot10a (accessed on 20 September 2025).
- Ba, J.L.; Kiros, J.R.; Hinton, G.E. Layer normalization. arXiv 2016, arXiv:1607.06450. [Google Scholar] [CrossRef]
- Liu, Z.; Wang, B.; Meng, Q.; Chen, W.; Tegmark, M.; Liu, T.Y. Machine-learning nonconservative dynamics for new-physics detection. Phys. Rev. E 2021, 104, 055302. [Google Scholar] [CrossRef] [PubMed]
- Arya, S.; Mount, D.M.; Netanyahu, N.S.; Silverman, R.; Wu, A.Y. An optimal algorithm for approximate nearest neighbor searching fixed dimensions. J. ACM (JACM) 1998, 45, 891–923. [Google Scholar] [CrossRef]
- Rumelhart, D.E.; Hinton, G.E.; Williams, R.J. Learning representations by back-propagating errors. Nature 1986, 323, 533–536. [Google Scholar] [CrossRef]
- Kingma, D.P.; Ba, J. Adam: A method for stochastic optimization. arXiv 2014, arXiv:1412.6980. [Google Scholar] [CrossRef]






| Meteorite Impact | Slide | Direct Shear | Slide-SameR | Slide-Small | |
|---|---|---|---|---|---|
| Data num | 961 | 1000 | 1000 | 1000 | |
| Type num () | 2 | 2 | 2 | 2 | 2 |
| Nodes | 5000 | 700 | 3000 | 40 | 40 |
| Time steps | 50 | 20 | 200 | 20 | 20 |
| Position () | ✓ | ✓ | ✓ | ✓ | ✓ |
| Type () | ✓ | ✓ | ✓ | ✓ | ✓ |
| Property () | ✗ | ✗ | ✓ | ✗ | ✓ |
| Dimension | 2 | 2 | 3 | 2 | 2 |
| Generation time (s) | 77,841 | 83,000 | 126,680 | – | – |
| T | Imp Dep | Imp R(L) | Imp R(R) | Sp Num(L) | Sp Num(R) | |||||
| Truth | Pred | Truth | Pred | Truth | Pred | Truth | Pred | Truth | Pred | |
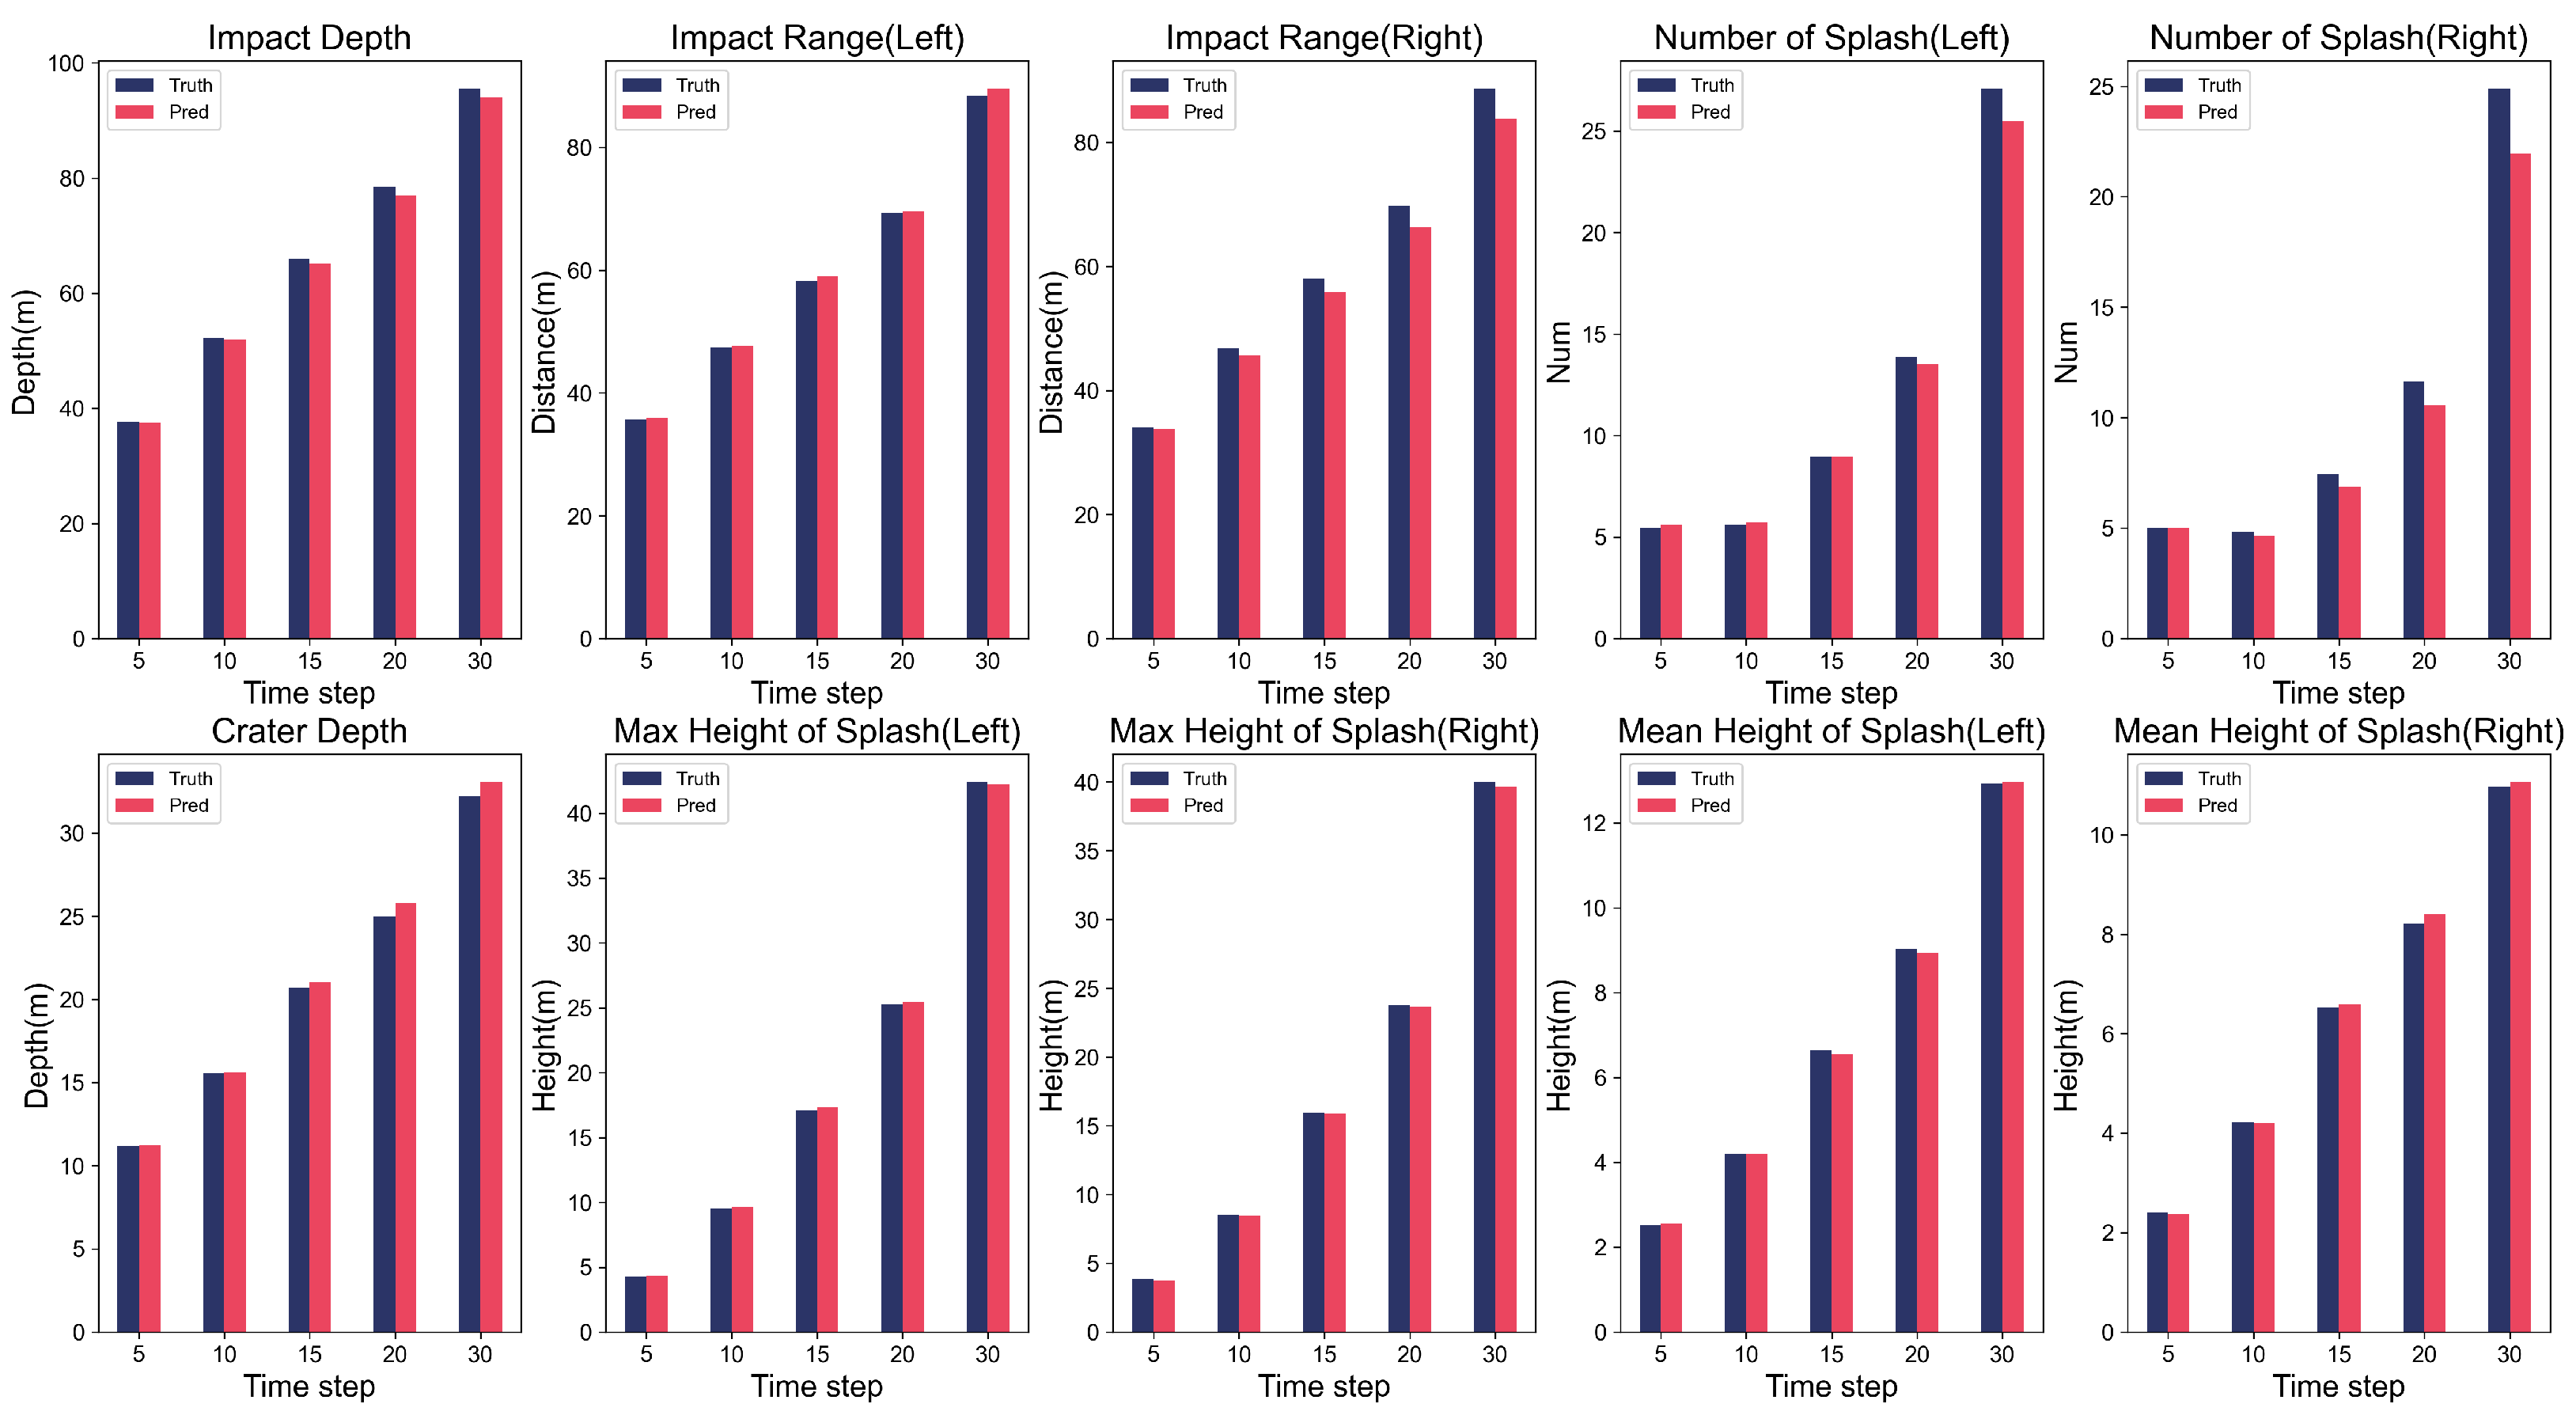
| 5 | 37.63 | 37.52 | 35.69 | 35.92 | 34.07 | 33.78 | 5.46 | 5.60 | 5.01 | 5.01 |
| 10 | 52.27 | 52.02 | 47.39 | 47.71 | 46.75 | 45.66 | 5.60 | 5.73 | 4.84 | 4.68 |
| 15 | 65.93 | 65.11 | 58.27 | 59.00 | 57.99 | 55.80 | 8.94 | 8.95 | 7.45 | 6.89 |
| 20 | 78.51 | 77.06 | 69.31 | 69.49 | 69.75 | 66.36 | 13.86 | 13.52 | 11.65 | 10.57 |
| 30 | 95.58 | 94.00 | 88.32 | 89.62 | 88.70 | 83.72 | 27.09 | 25.47 | 24.91 | 21.96 |
| Acc | 98.90% | 99.14% | 96.51% | 97.31% | 93.61% | |||||
| T | Cra Dep | Max Ht(L) | Max Ht(R) | Mean Ht(L) | Mean Ht(R) | |||||
| Truth | Pred | Truth | Pred | Truth | Pred | Truth | Pred | Truth | Pred | |
| 5 | 11.20 | 11.24 | 4.28 | 4.33 | 3.84 | 3.78 | 2.52 | 2.56 | 2.41 | 2.37 |
| 10 | 15.54 | 15.62 | 9.52 | 9.63 | 8.49 | 8.48 | 4.21 | 4.21 | 4.20 | 4.21 |
| 15 | 20.69 | 21.04 | 17.12 | 17.35 | 15.94 | 15.91 | 6.63 | 6.55 | 6.53 | 6.59 |
| 20 | 24.99 | 25.78 | 25.23 | 25.47 | 23.77 | 23.69 | 9.03 | 8.93 | 8.21 | 8.41 |
| 30 | 32.21 | 33.08 | 42.42 | 42.25 | 40.01 | 39.65 | 12.92 | 12.97 | 10.97 | 11.06 |
| Acc | 98.31% | 99.00% | 99.38% | 99.14% | 98.79% | |||||
| T | Slide Num | Max Ht | Mean Ht | Tongue Dis | Dis | ||||
|---|---|---|---|---|---|---|---|---|---|
| Truth | Pred | Truth | Pred | Truth | Pred | Truth | Pred | Distance | |
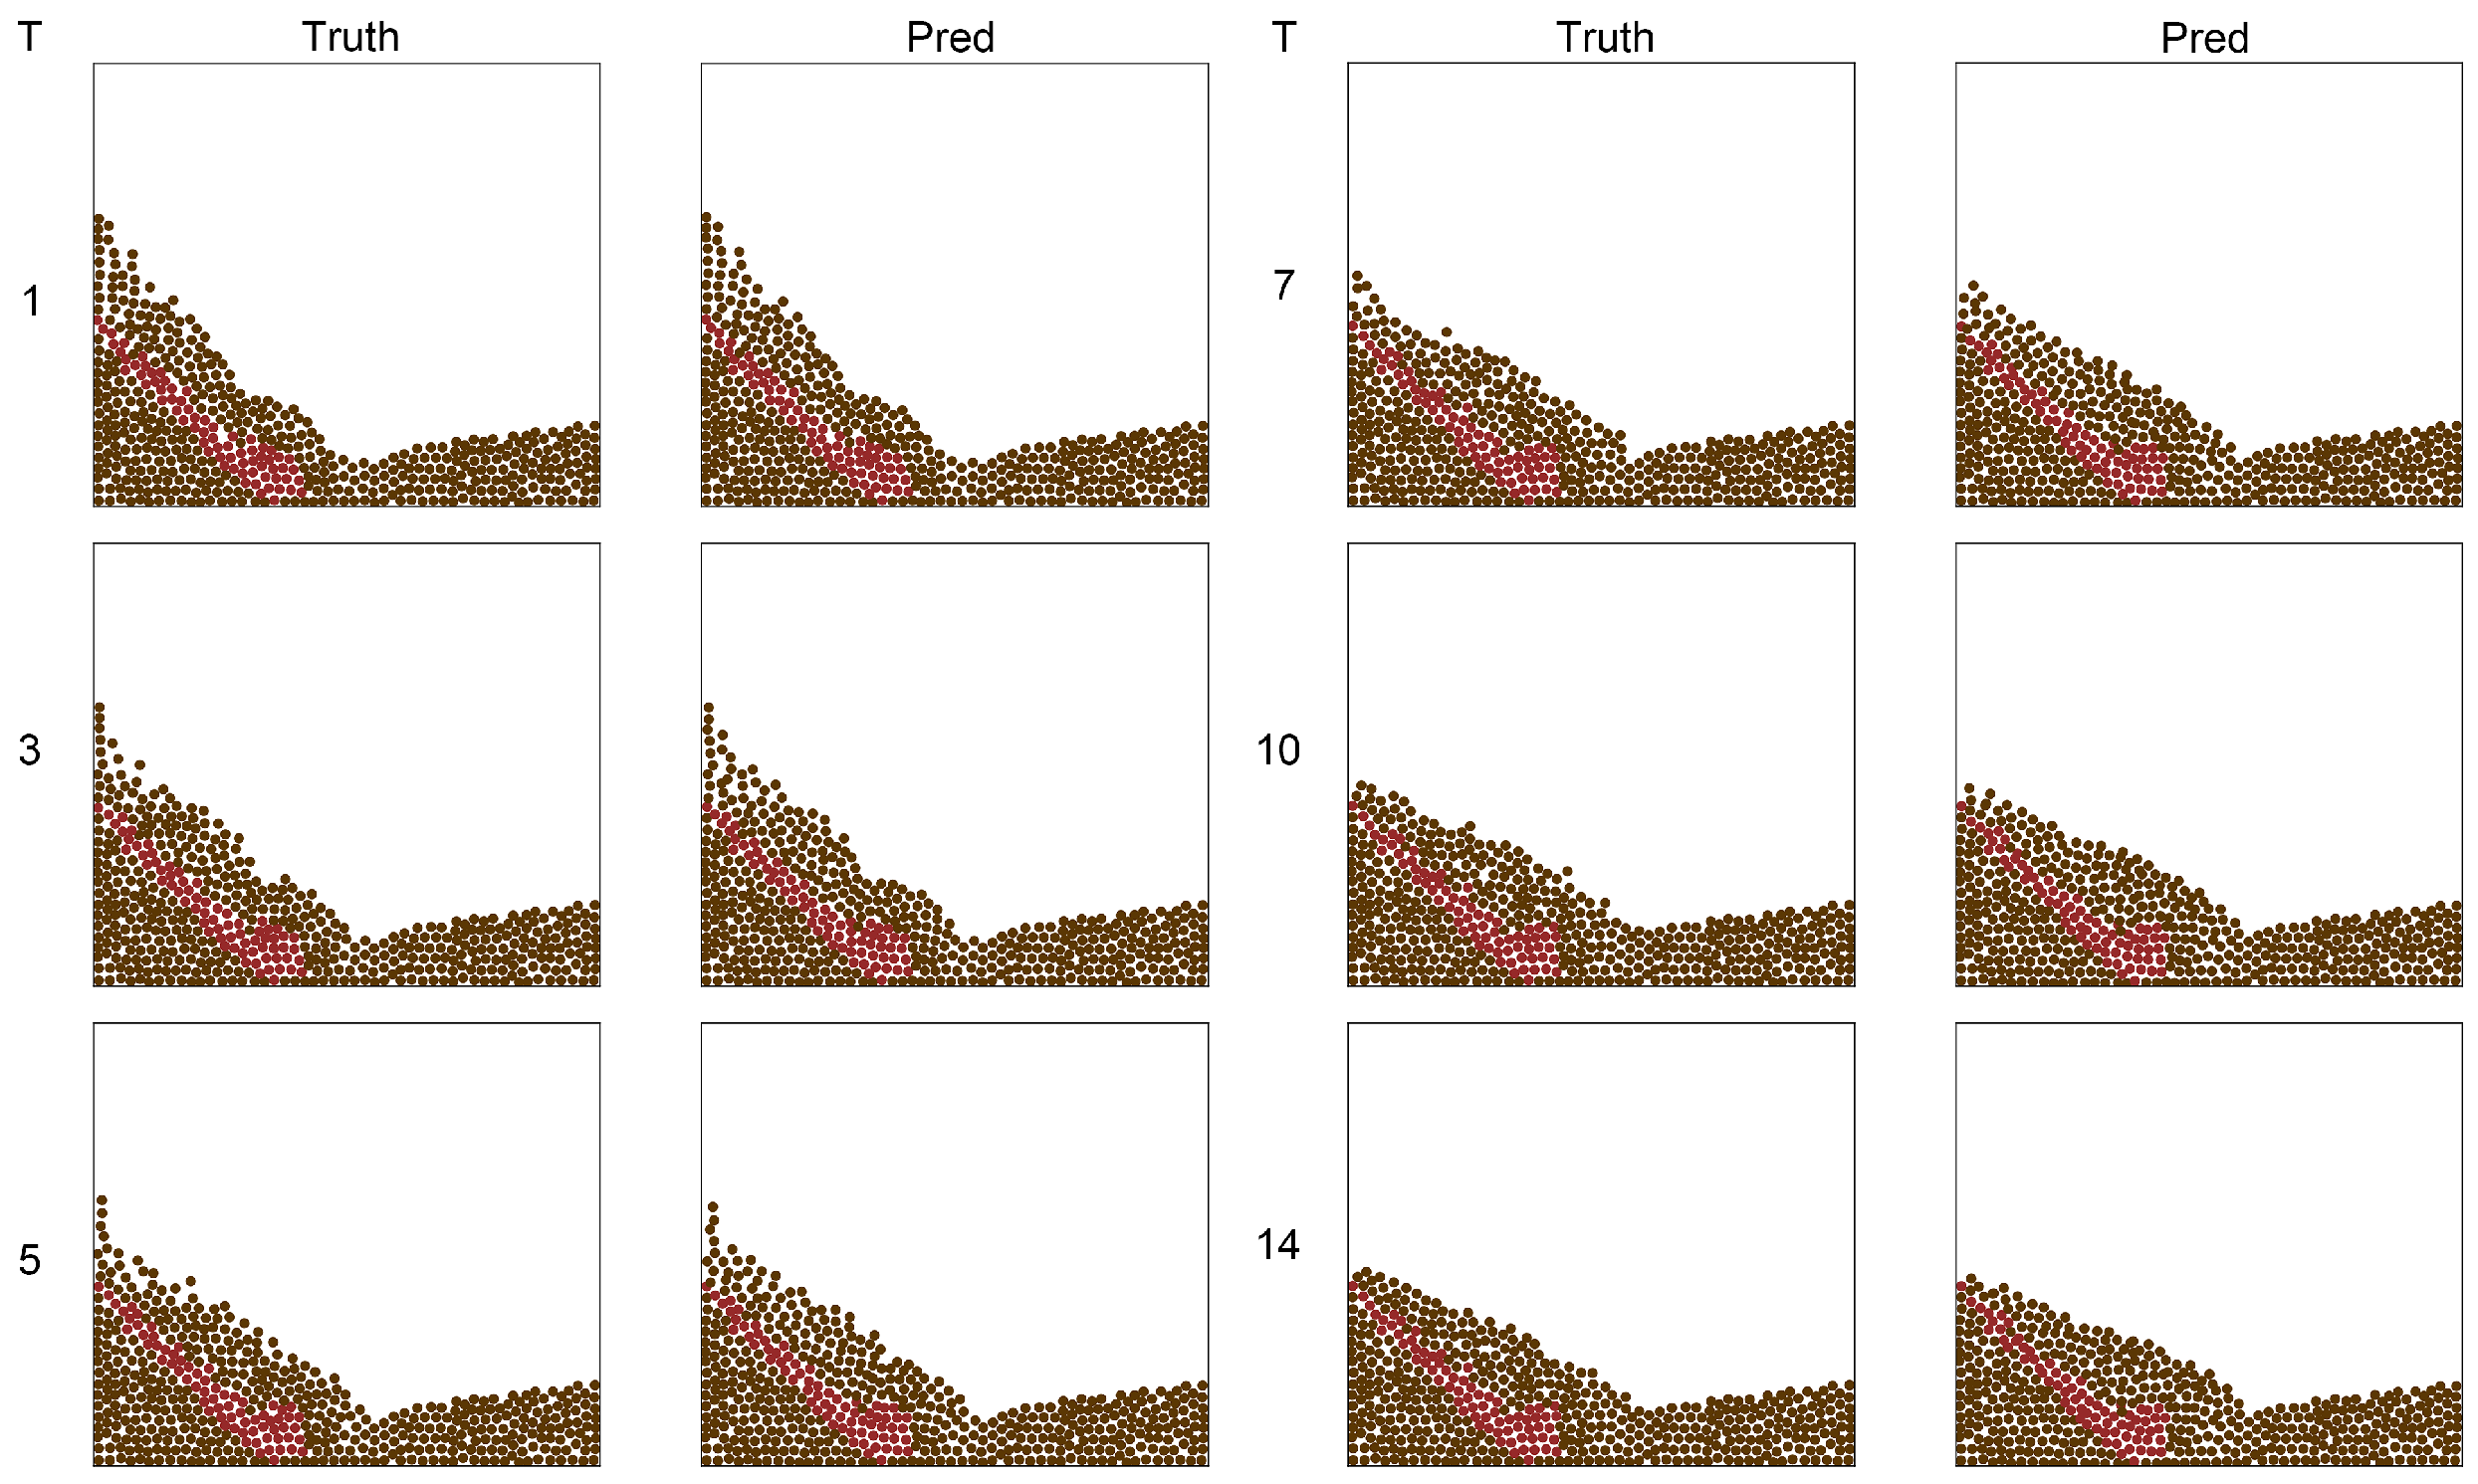
| 1 | 144.82 | 138.55 | 51.80 | 51.70 | 26.38 | 26.79 | 48.15 | 47.82 | 52.27 |
| 2 | 175.59 | 169.36 | 51.41 | 51.54 | 24.81 | 25.03 | 52.03 | 51.89 | 106.24 |
| 3 | 194.90 | 186.60 | 50.76 | 50.77 | 23.32 | 23.75 | 55.29 | 54.61 | 163.04 |
| 4 | 209.18 | 200.28 | 49.60 | 49.54 | 22.13 | 22.74 | 57.48 | 57.17 | 218.68 |
| 5 | 220.28 | 210.23 | 48.34 | 48.03 | 21.26 | 21.87 | 60.36 | 59.23 | 272.13 |
| 6 | 229.03 | 217.97 | 46.76 | 46.51 | 20.46 | 21.17 | 63.09 | 61.47 | 321.32 |
| 7 | 236.29 | 224.43 | 45.45 | 45.02 | 19.92 | 20.61 | 64.50 | 63.02 | 367.23 |
| 8 | 241.49 | 230.02 | 44.34 | 43.78 | 19.49 | 20.09 | 66.22 | 64.01 | 411.16 |
| 9 | 246.58 | 234.86 | 43.53 | 42.69 | 19.12 | 19.68 | 67.67 | 64.99 | 447.61 |
| 10 | 248.91 | 238.98 | 42.78 | 41.70 | 18.88 | 19.32 | 68.26 | 66.12 | 476.01 |
| 11 | 250.99 | 242.50 | 42.03 | 40.81 | 18.66 | 19.01 | 68.91 | 66.95 | 499.26 |
| 12 | 252.13 | 246.11 | 41.49 | 40.20 | 18.52 | 18.76 | 69.37 | 67.45 | 517.60 |
| 13 | 253.46 | 249.87 | 41.02 | 39.69 | 18.39 | 18.48 | 69.82 | 67.90 | 529.95 |
| 14 | 253.52 | 253.75 | 40.67 | 39.32 | 18.33 | 18.22 | 69.90 | 69.00 | 538.93 |
| Acc | 96.32% | 98.50% | 97.90% | 97.89% | |||||
| T | Failure Surface | Above | Below | All |
|---|---|---|---|---|
| 10 | ||||
| 20 | ||||
| 30 | ||||
| 40 | ||||
| 50 | ||||
| 60 | ||||
| 70 | ||||
| 80 | ||||
| 90 | ||||
| 100 | ||||
| 110 | ||||
| 120 | ||||
| 130 | ||||
| 140 | ||||
| 150 | ||||
| 160 | ||||
| 170 | ||||
| 180 | ||||
| 190 |
| Time | Meteorite Impact | Slide | Direct Shear | |||
|---|---|---|---|---|---|---|
| Ours | MatDEM | Ours | MatDEM | Ours | MatDEM | |
| Multiple steps (s) | 3.32 | 71.28 | 0.44 | 58.10 | 16.22 | 307.20 |
| One step (s) | 0.08 | 1.62 | 0.03 | 4.15 | 0.08 | 1.58 |
| Generation (s) | 77,841 | - | 83,000 | - | 126,680 | - |
| Training (days) | 3 | - | 0.5 | - | 8.5 | - |
| Slide-SameR | Slide-Small | |
|---|---|---|
| GNS | 35.789 | 47.166 |
| MLP | 169.72 | 148.04 |
| LGNN | 471.69 | 505.63 |
| NNPhD | 40.037 | 51.338 |
| EGNN | 81.492 | 119.36 |
| GMN | 120.52 | 138.11 |
| ESTAG | 96.126 | 124.02 |
| SGNN | 39.440 | 52.478 |
| Graph-DEM | 35.721 | 46.198 |
Disclaimer/Publisher’s Note: The statements, opinions and data contained in all publications are solely those of the individual author(s) and contributor(s) and not of MDPI and/or the editor(s). MDPI and/or the editor(s) disclaim responsibility for any injury to people or property resulting from any ideas, methods, instructions or products referred to in the content. |
© 2025 by the authors. Licensee MDPI, Basel, Switzerland. This article is an open access article distributed under the terms and conditions of the Creative Commons Attribution (CC BY) license (https://creativecommons.org/licenses/by/4.0/).
Share and Cite
Li, B.; Du, B.; Liu, K.; Cheng, K.; Ye, J.; Feng, J.; Cui, X. Graph-DEM: A Graph Neural Network Model for Proxy and Acceleration Discrete Element Method. Appl. Sci. 2025, 15, 10432. https://doi.org/10.3390/app151910432
Li B, Du B, Liu K, Cheng K, Ye J, Feng J, Cui X. Graph-DEM: A Graph Neural Network Model for Proxy and Acceleration Discrete Element Method. Applied Sciences. 2025; 15(19):10432. https://doi.org/10.3390/app151910432
Chicago/Turabian StyleLi, Bohao, Bowen Du, Kaixin Liu, Ke Cheng, Junchen Ye, Jinyan Feng, and Xuhao Cui. 2025. "Graph-DEM: A Graph Neural Network Model for Proxy and Acceleration Discrete Element Method" Applied Sciences 15, no. 19: 10432. https://doi.org/10.3390/app151910432
APA StyleLi, B., Du, B., Liu, K., Cheng, K., Ye, J., Feng, J., & Cui, X. (2025). Graph-DEM: A Graph Neural Network Model for Proxy and Acceleration Discrete Element Method. Applied Sciences, 15(19), 10432. https://doi.org/10.3390/app151910432


