1. Introduction
Lodging has significant adverse effects on crop production. It can be classified into two types: root lodging and stem lodging. Root lodging is characterized by the uprooting of plants without direct stem breakage, whereas stem lodging involves bending failure at the base of the stem [
1,
2]. In wheat (
Triticum aestivum L.), stem lodging is the predominant form. Lodging can substantially reduce wheat yield, e.g., heavy rains in 2020 caused severe lodging in approximately 70% of wheat fields in Henan Province, resulting in economic losses exceeding CNY 2 billion [
3]. Therefore, the development of lodging-resistant varieties is a crucial objective in wheat breeding programs. Wheat consists of six major organs: roots, stems, leaves, flowers, fruits, and seeds. The wheat stem possesses a naturally occurring multi-scale structural organization, spanning the organ, tissue, and cellular levels. Tissues are composed of numerous cells, which serve as the fundamental building units. The mechanical strength of these cells is primarily governed by their cell walls, which in turn depend on microstructural features (e.g., thickness of cell wall layers, lumen dimensions), ultrastructural properties (e.g., microfibril angle, crystallite size), and the composition and spatial distribution of chemical components [
4].
At the macroscopic level, the lodging index shows significant positive correlations with plant height, center-of-gravity height, and the length of the second basal internode, while it exhibits a significant negative correlation with stem wall thickness [
5,
6,
7,
8,
9,
10]. At the microscopic level, lodging resistance was influenced by factors such as microfibril angle, crystallite size, tissue thickness, lignin and cellulose content, and vascular bundle area in wheat stems [
11,
12,
13,
14,
15,
16,
17]. The microfibril angle is considered a key load-bearing component of the cell wall structure [
18]. Crystallite size also serves as an important parameter for characterizing the supramolecular organization of cellulose microfibrils [
19]. Numerous studies have investigated the micro-structure of plant cells using Transmission Electron Microscopy [
20,
21], and have measured microfibril angles and cellulose crystallite sizes through X-Ray Diffraction techniques [
22,
23,
24,
25]. However, limited quantitative research has been conducted to explore the relationship between cellular structural characteristics and stem mechanical strength.
In this study, in order to analyze the relationship between the mechanical strength of wheat stems and their cell structure characteristics, the tensile strength, elastic modulus, thickness of each cell wall layer, microfibril angle, and crystallite size in the stems of two wheat varieties were measured across three growth stages. The correlations between these micro (ultra-micro) structural features and the macroscopic mechanical properties of the stem were systematically analyzed.
2. Materials and Methods
2.1. Plant Materials
Two representative wheat cultivars from Henan Province—‘Zhoumai 36’ (a common variety) and ‘Angong 38’ (a lodging-resistant variety)—were selected for this study. Healthy plants free of pests and diseases were collected at three growth stages: the anthesis stage (Biologische Bundesanstalt, Bundessortenamt and Chemical industry scale, BBCH) (BBCH 60), the grain filling stage (BBCH 85), and the maturity stage (BBCH 90). All plant materials were grown at the experimental field of Anyang Institute of Technology. Field management was standardized across the trial period, including synchronized sowing dates, uniform fertilizer application rates, and consistent plant protection measures. All agricultural practices were carried out by the same technical team.
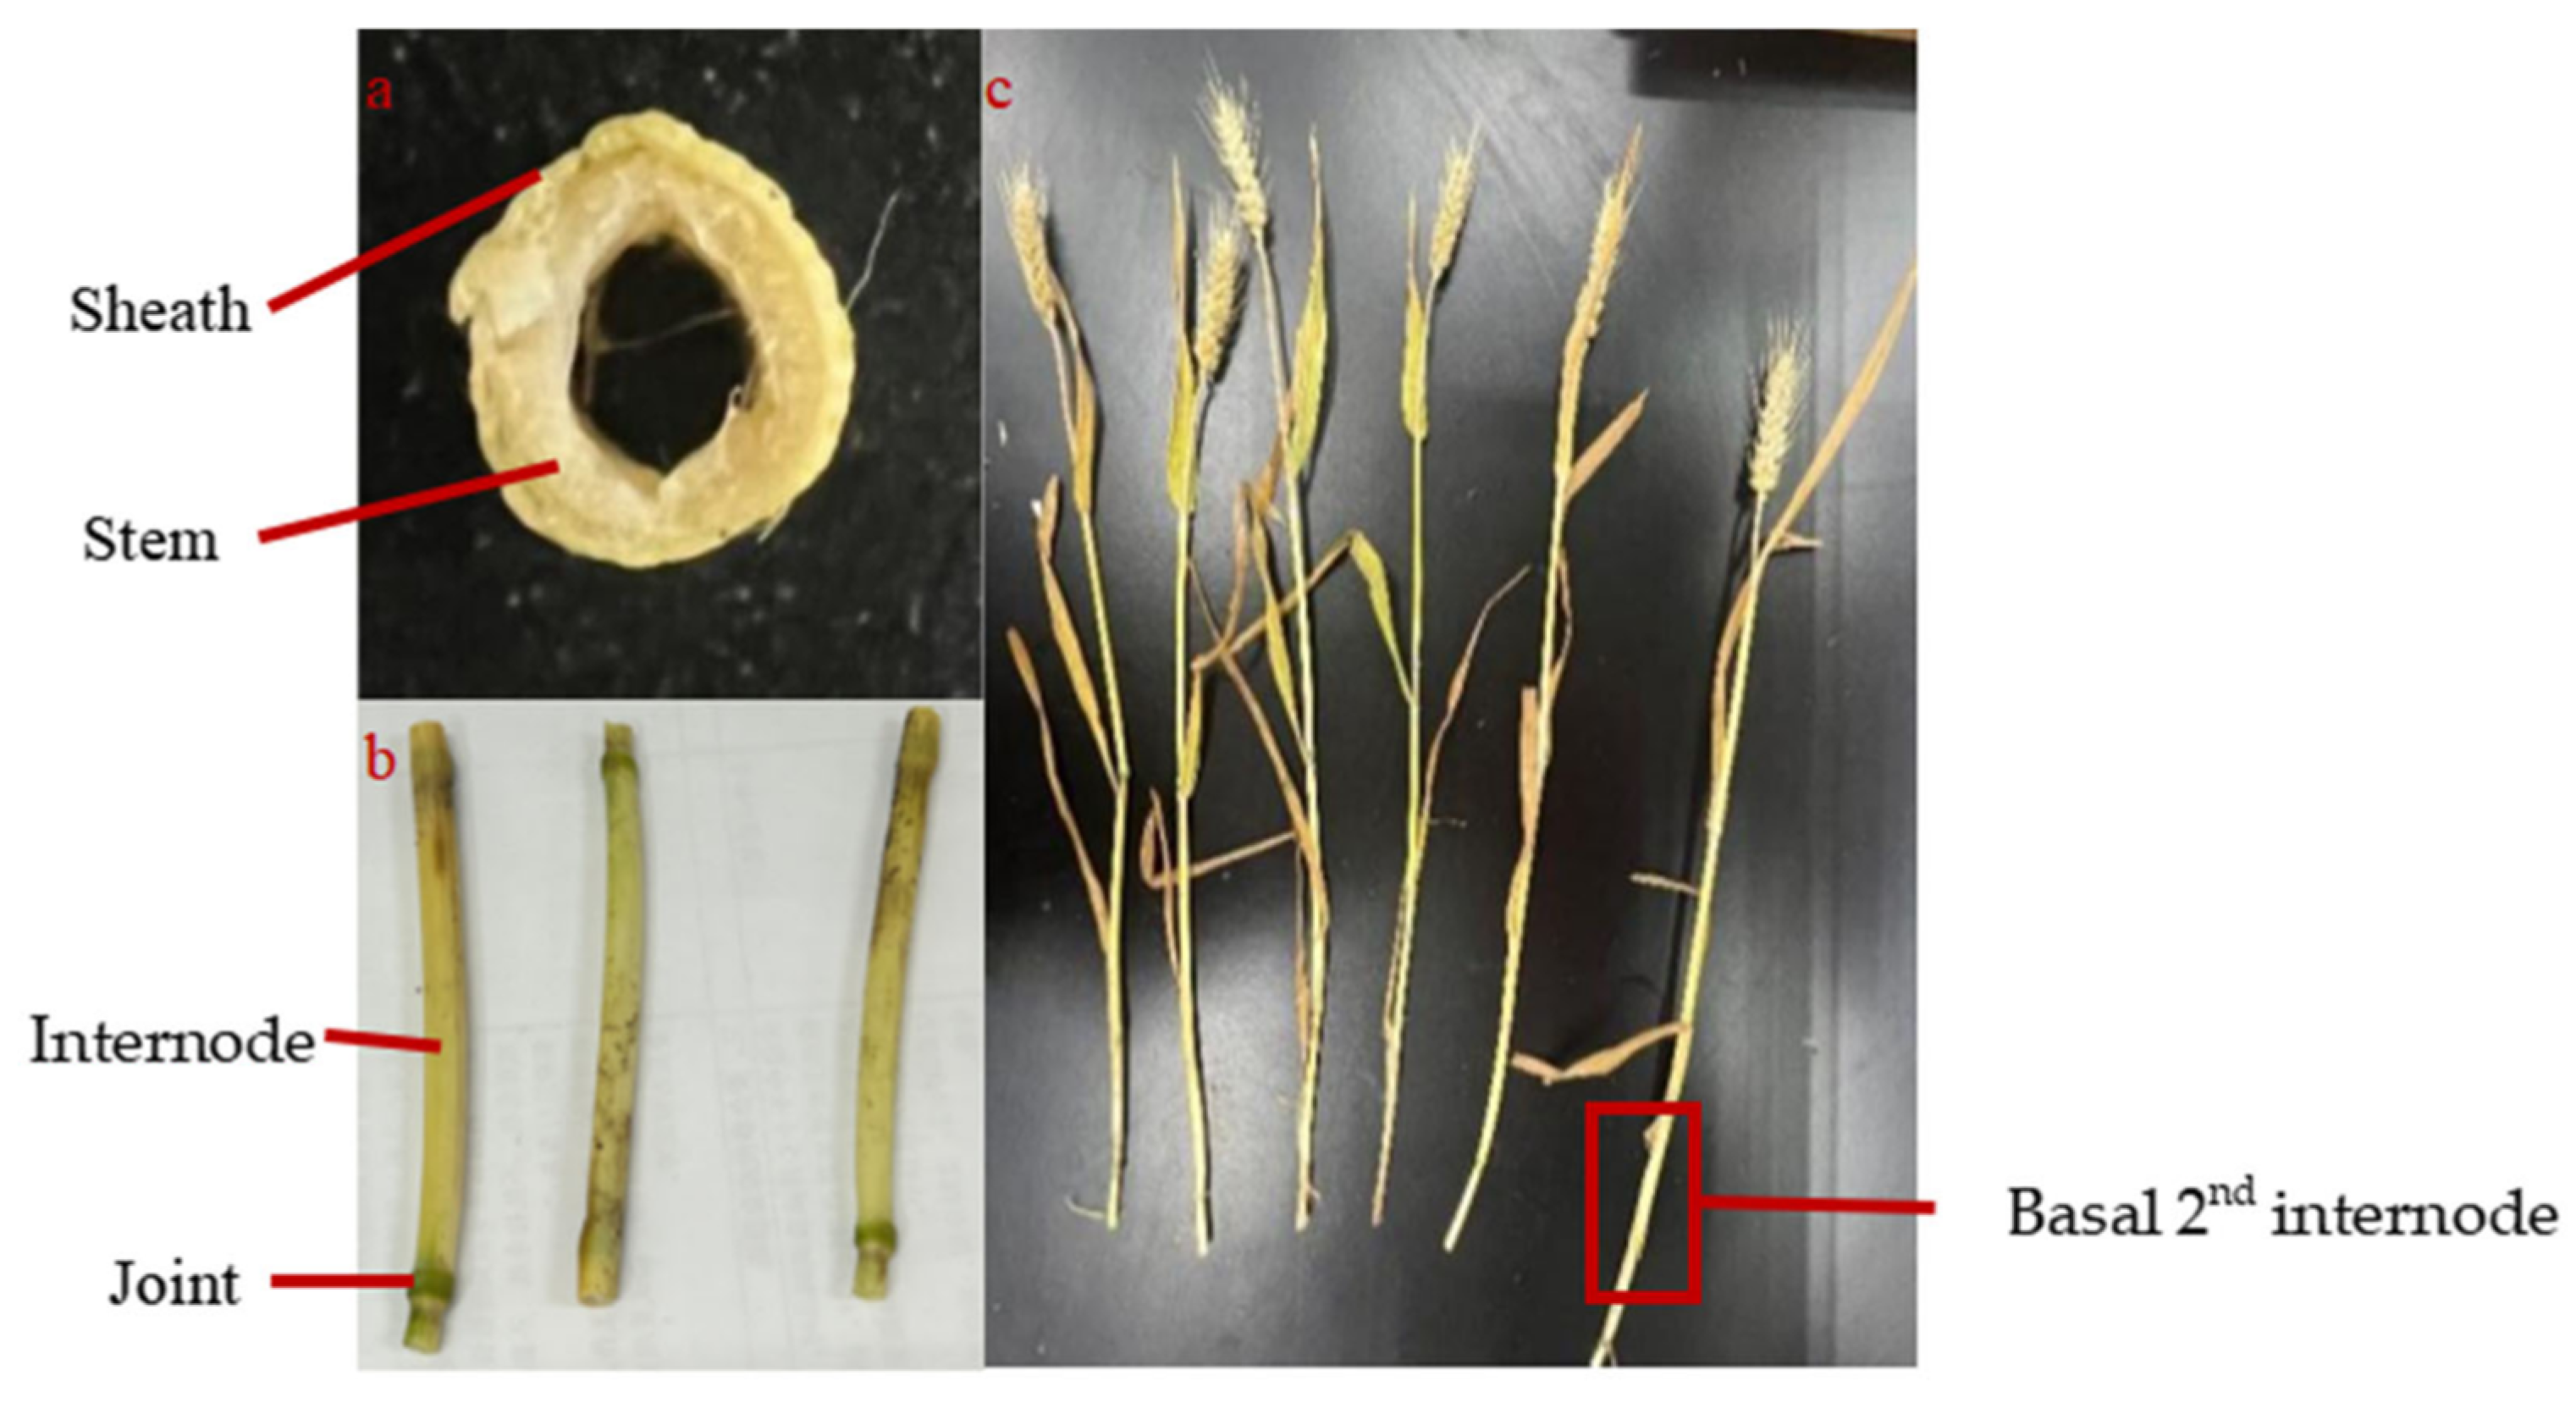
The wheat stem exhibited a hollow, thin-walled cylindrical structure (
Figure 1a) composed of alternating nodes and internodes (
Figure 1b). The above-ground internodes were sequentially numbered from the base as the 1st to the nth internode (
Figure 1c). Lodging predominantly occurred at the basal 1st and 2nd internodes, with the 2nd internode exerting the most significant influence on lodging resistance [
1,
26,
27]. In this study the basal second internode of fresh wheat stems was excised and sliced longitudinally to prepare the test samples. Samples for different tests varied in sizes. For water content and tensile testing, the samples were 60 mm long and 2 mm wide. For Transmission Electron Microscopy (TEM), the samples were 3 mm long and 1 mm wide. For X-Ray Diffraction (XRD) testing, the samples were 20 mm long and 10 mm wide. Each test carried out at three growth stages involved 6 samples, resulting in a total of 36 samples from the two varieties.
2.2. Methods
2.2.1. Water Content Test
Samples were dehydrated in a forced-air drying oven set at 50 °C. Mass measurements were recorded at 30 min intervals until consecutive measurements showed a variation of ≤1%. The water content was calculated using the following formula:
Here, represents the water content, Gb denotes the mass of the fresh sample, and G refers to the mass of the sample in the dry condition.
The test results of the water content are shown in
Table 1. The water content of ‘Zhoumai 36’ stem samples was lower than that of ‘Angong 38’ at the same growth stage.
2.2.2. Tensile Test
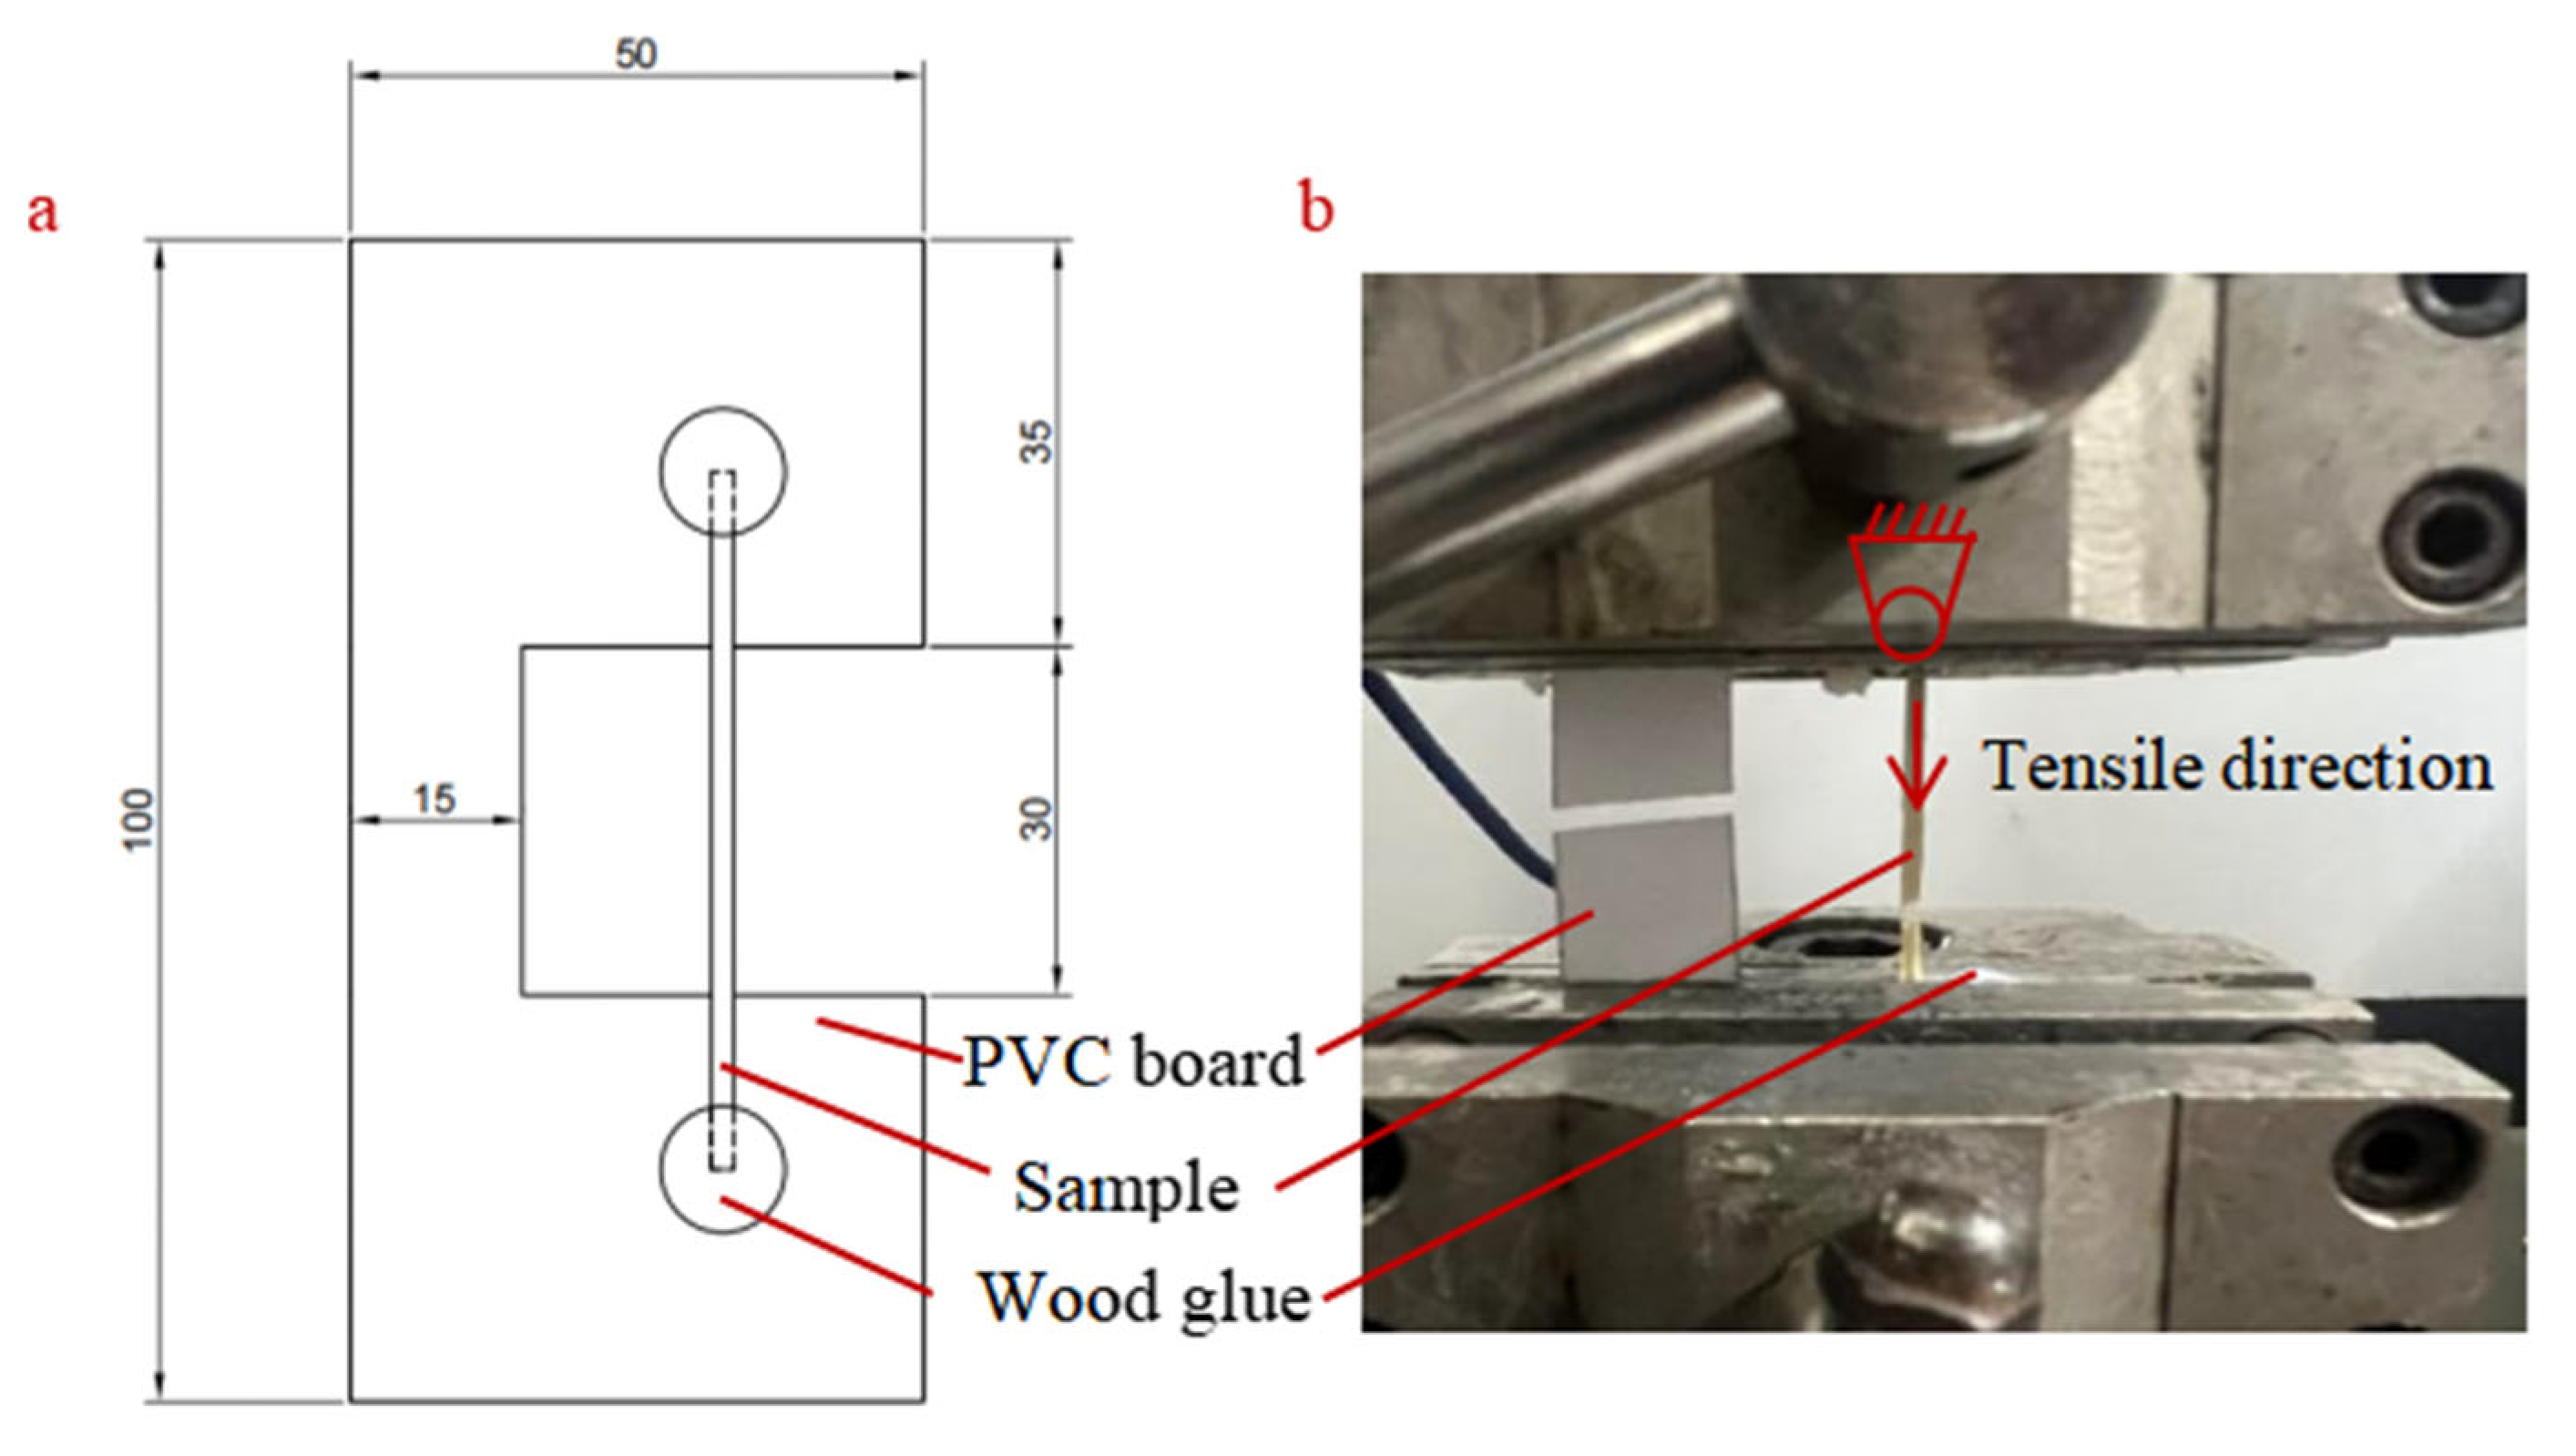
Tensile testing was carried out in accordance with ASTM C1557-03. The tests were conducted using a QX-W500 electronic universal testing machine (Qixiang Inc., Shanghai, China), which had a load capacity ranging from 1 N to 10,000 N and operated at a constant cross-head speed of 10 mm/min. The samples were fixed to a PVC board with wood glue (Weile series, Yancheng Disheng Building Materials Co., Ltd. Yancheng, Jiangsu, China) to prevent slippage during mechanical testing (
Figure 2a). Importantly, the glue was only applied to the two ends of the samples outside the effective tensile section, ensuring it did not affect the mechanical properties of the effective test area. The effective tensile length was set to 30 mm. Following sample fracture (
Figure 2b), the cross-sectional area was measured at three equally spaced longitudinal positions—selected to avoid the edge effect caused by sample fracture and ensure the representativeness of the measurements—using a stereo-microscope (Leica M165 FC, Leica Microsystems, Wetzlar, Hesse, Germany) at 40× magnification; meanwhile, Image Pro Plus (v.7.0), specialized measurement software, was used for area measurement to enhance the accuracy and consistency of the results. The average of these measurements was used as the effective cross-sectional area.
2.2.3. Transmission Electron Microscopy Test
The samples were fixed in a solution containing 4% glutaraldehyde and 2% paraformaldehyde in 0.2 M phosphate buffer (pH 7.2) at 4 °C for 24 h. Subsequently, the samples were rinsed four times with fresh buffer, with each rinse lasting 20 min. Post-fixation was carried out in a mixture of 1% osmium tetroxide and 1% potassium ferricyanide in 0.2 M phosphate buffer (pH 6.8) at 25 °C for 4 h, followed by four additional buffer rinses with the same buffer. Dehydration was performed using a graded ethanol series (25%, 50%, 75%, 90%, 100%), with each step lasting 10 min. After dehydration, the samples were infiltrated with a graded mixture of acetone and Spurr’s resin gradients (5:1, 3:1, 1:1, 1:3, and 1:5), with each infiltration step lasting 2 h. Finally, the samples were embedded in pure resin at 60 °C for 24 h. Ultrathin sections (70–100 nm) were prepared using a Leica UC7 ultramicrotome and stained with 2% potassium permanganate for 15 min. Imaging was conducted using an FEI F200S field-emission transmission electron microscope (FE-TEM; Thermo Fisher Scientific, Hillsboro, OR, USA) operated at 200 kV. All reagents were obtained from Sinopharm Chemical Reagent Co., Ltd., Shanghai, Shanghai, China.
2.2.4. X-Ray Diffraction Test
X-Ray Diffraction analysis was conducted using an X’Pert
3 MRD diffractometer (Malvern Panalytical, Almelo, Overijssel, The Netherlands) in transmission mode with Cu Kα radiation (λ = 0.15406 nm). The instrument was operated at 40 kV and 40 mA, scanning 2θ from 5° to 40° with a step size of 2° and an integration time of 1 min per step. Diffractograms were processed using Origin Pro 2022 (OriginLab Corporation, Northampton, MA, USA) for Gaussian multi-peak deconvolution. Microfibril angle distributions were determined from azimuthal intensity scans, while the crystallite size perpendicular to the lattice planes was calculated using the Scherrer equation [
28].
presents the crystallite size, K denotes the Scherrer constant (0.9), indicates the wavelength of the incident X-ray (0.15406 nm), refers to the full width at half-maximum (FWHM) of the diffraction peak (in radians), and xc represents the Bragg angle.
3. Results
3.1. Analysis of Wheat Stem Tensile Tests Results
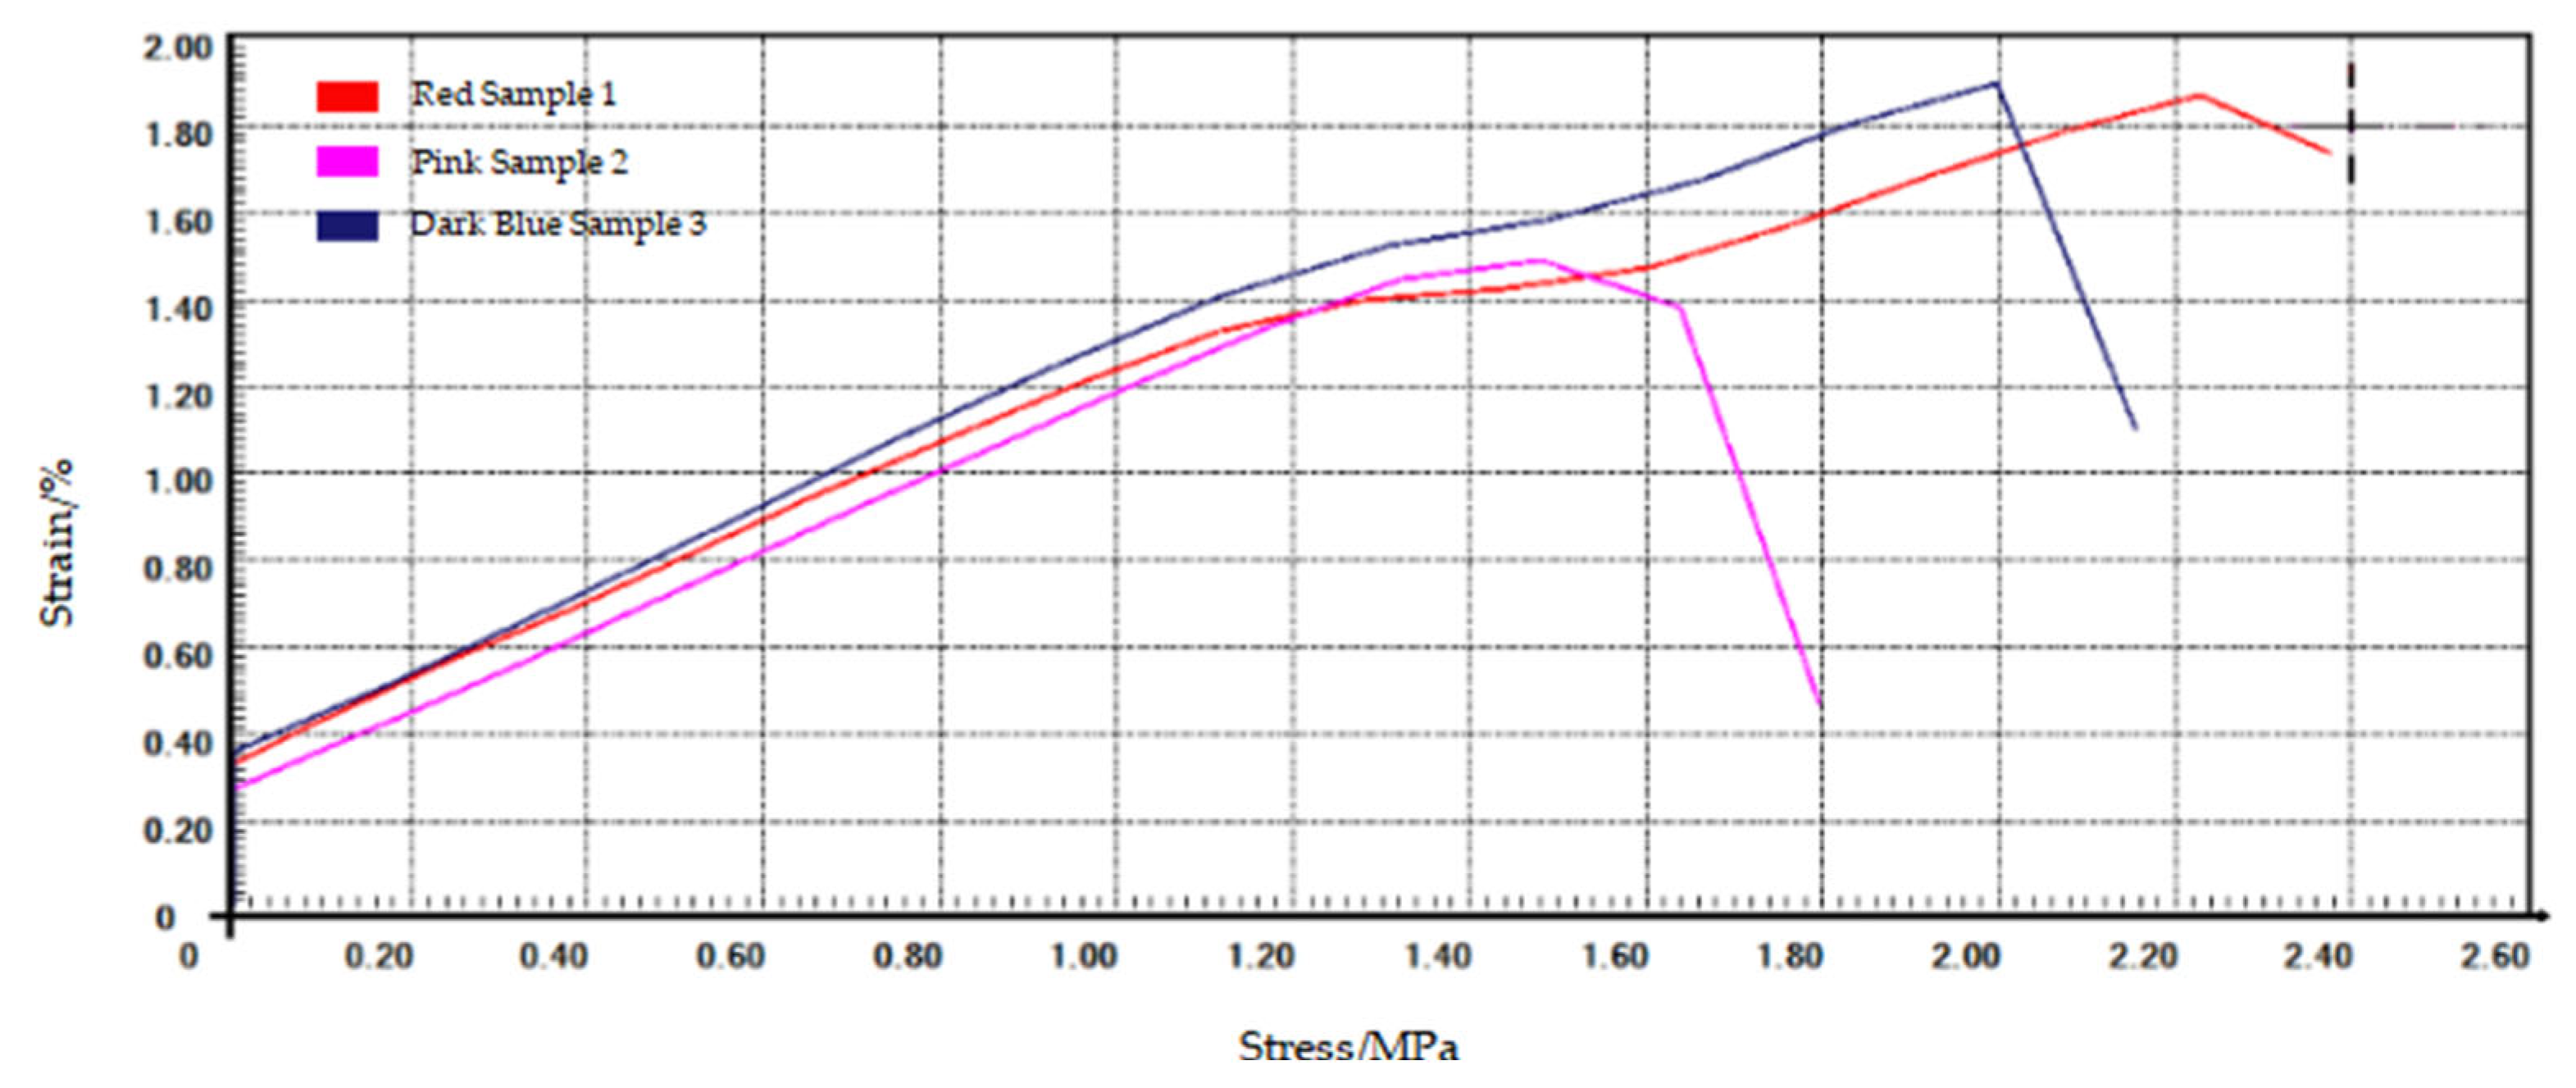
The tensile stress–strain curves of ‘Angong 38’ stems at BBCH 60 are shown in
Figure 3. The elastic modulus was determined from the linear region (strain < 2%) and is shown in
Table 2.
The elastic modulus ranges of the stem samples of ‘Zhoumai 36’ at BBCH 60, BBCH 85, and BBCH 90 were 1.41–1.88 GPa, 0.90–1.30 GPa, and 1.15–1.45 GPa, respectively. For ‘Angong 38’, the corresponding elastic modulus ranges were 1.02–1.46 GPa, 1.22–1.84 GPa, and 0.92–2.03 GPa, respectively. The average elastic modulus of ‘Angong 38’ was lower than that of ‘Zhoumai 36’ at BBCH 60, whereas ‘Angong 38’ exhibited higher values at both BBCH 85 and BBCH 90. The tensile strength of ‘Angong 38’ was consistently lower than that of ‘Zhoumai 36’ across all growth stages.
3.2. Analysis of Transmission Electron Microscopy Tests Results on Wheat Stem Cells
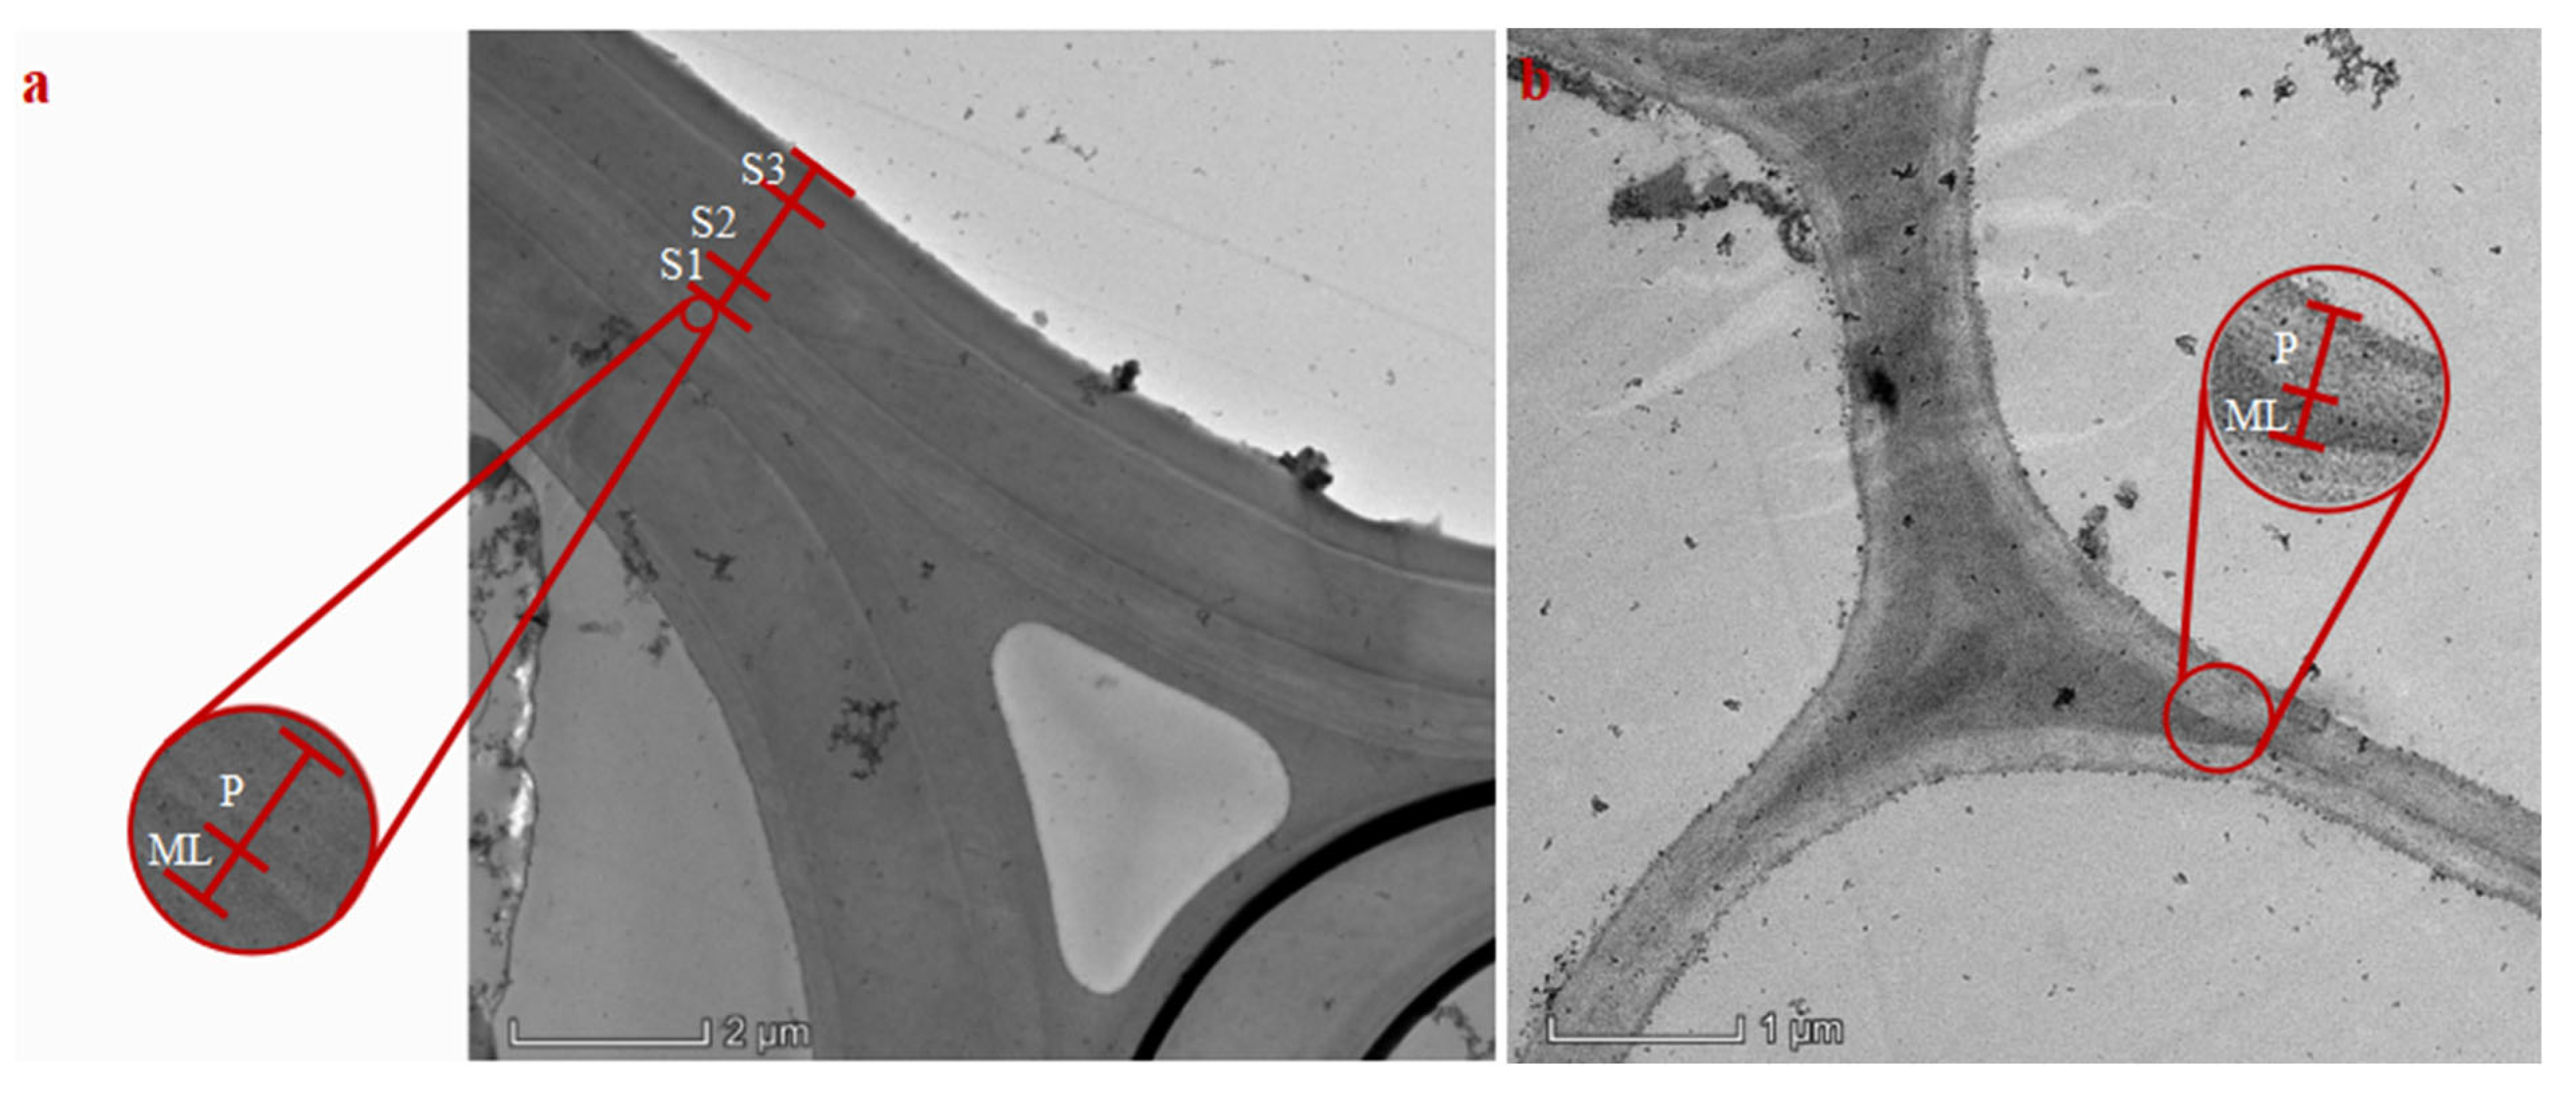
Wheat stems were primarily composed of mechanical, thin-walled, and vascular tissues. The mechanical tissue consisted of stacks of sclerenchyma cells. The vascular tissue was composed of vessel cells, bundle sheath, and lacuna, among others. The thin-walled tissue was made up of stacks of parenchyma cells. The cell wall layers of collenchyma and vessel cells comprised the middle lamella, primary wall, and secondary wall layers, whereas the cell wall layers of parenchyma cells consisted only of the middle lamella and primary wall. Sections of the samples were observed under a transmission electron microscope (
Figure 4). The thickness of each layer in the three cell types was measured using the corresponding scale bar and measuring tool at various magnifications. The data are shown in
Table 3. Across the three growth stages, the thickness of each wall layer tended to first increase and then decrease. The middle layer of the secondary wall (S2) was the thickest among all cell wall layers, and the overall cell wall thickness was predominantly contributed by S2. The cell wall thickness of all three types in ‘Angong 38’ was greater than that in ‘Zhoumai 36’.
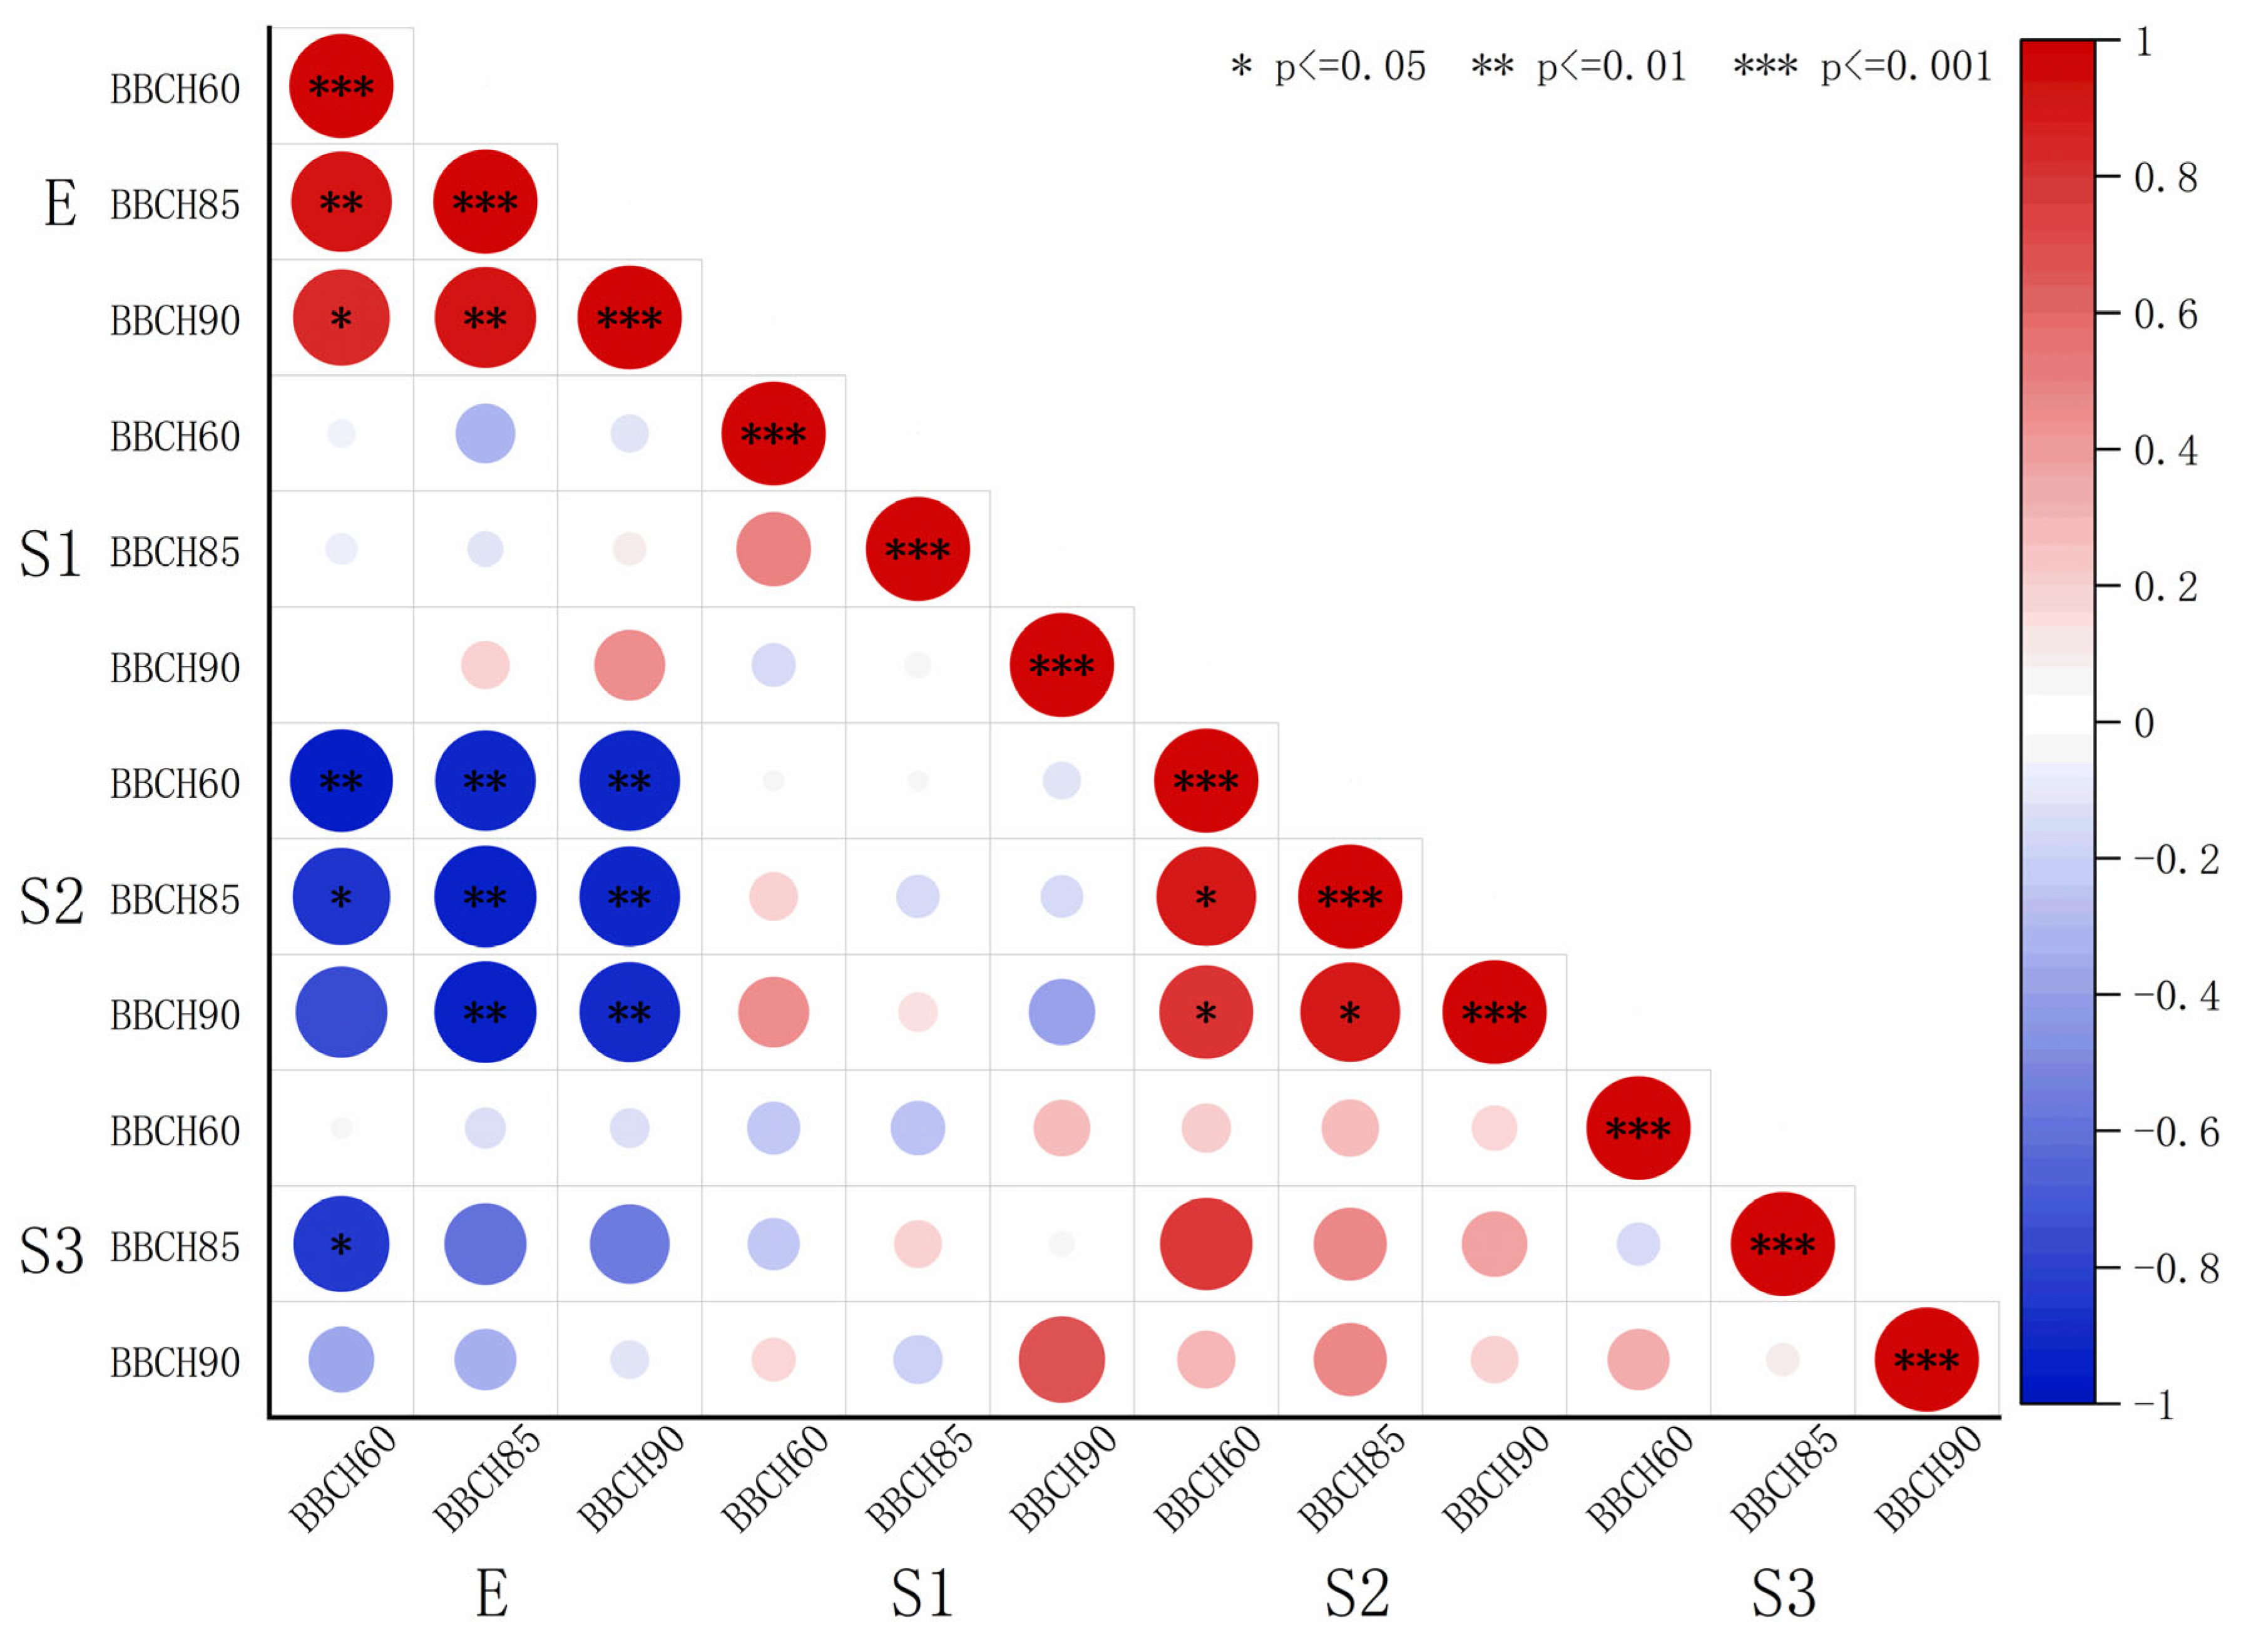
The elastic modulus and thickness data shown in
Table 2 and
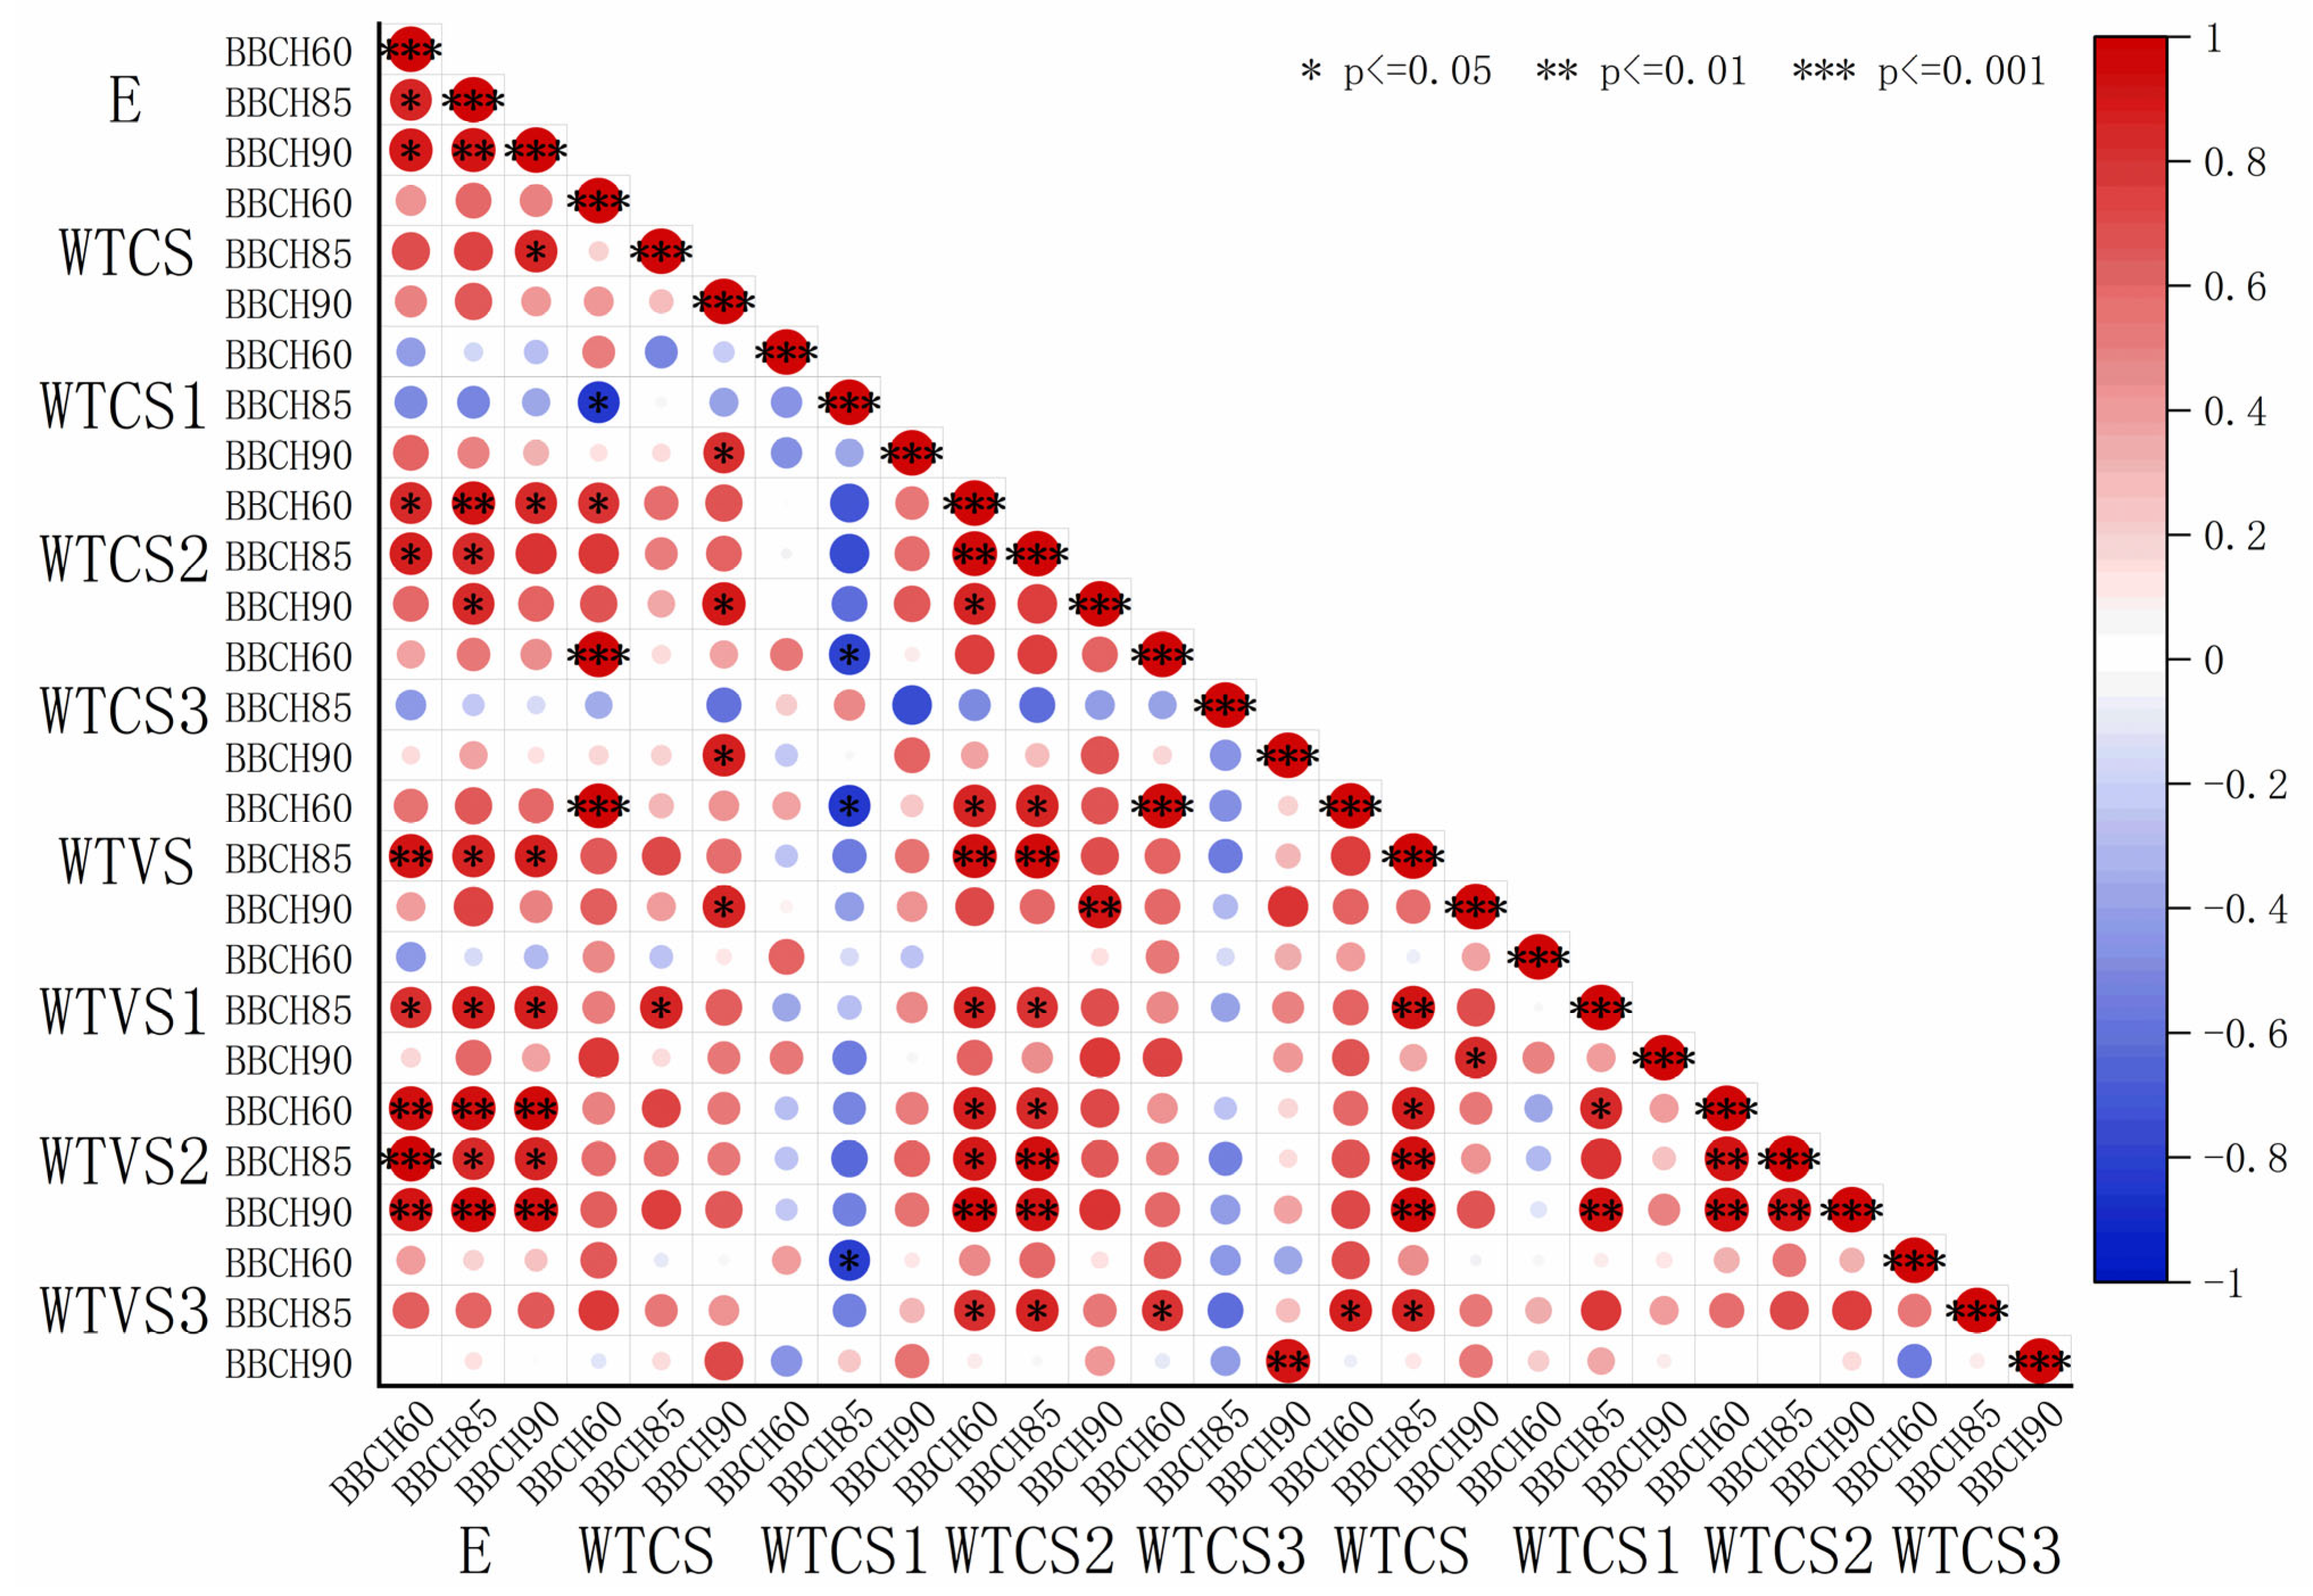
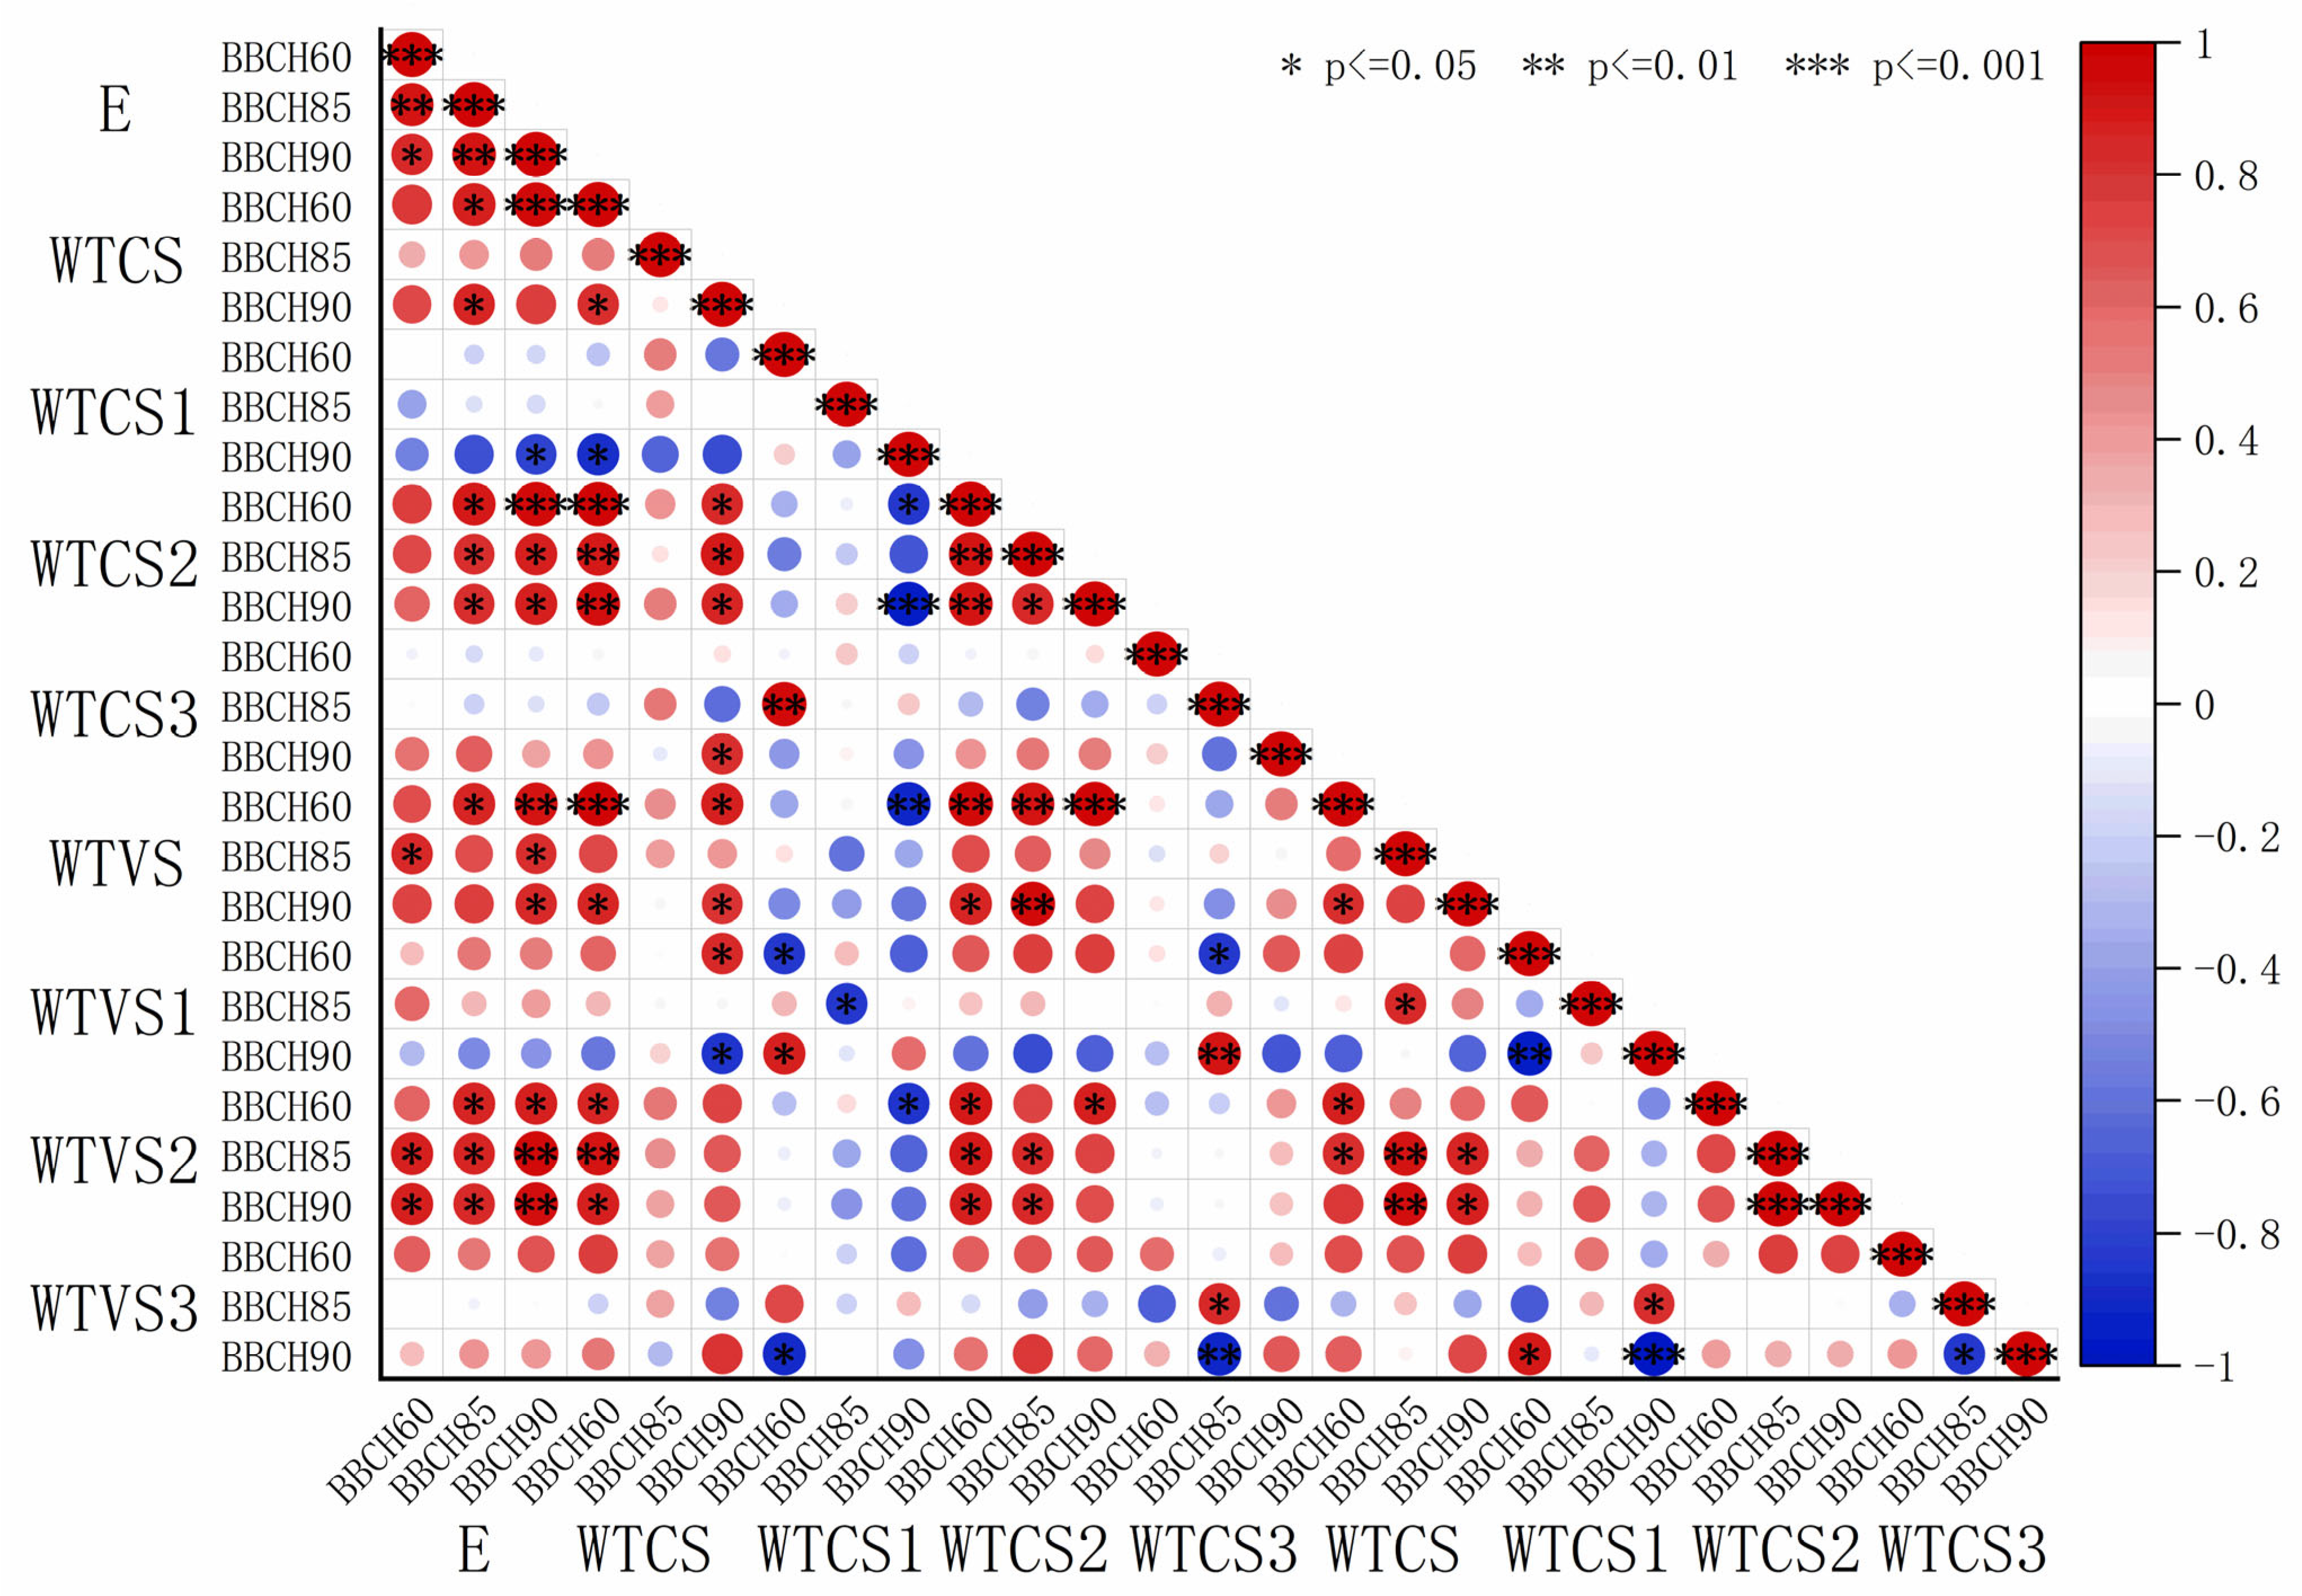
Table 3 were fitted, and the resulting coefficients were visualized using heatmaps (
Figure 5 and
Figure 6). A highly significant and positive correlation was observed between the elastic modulus and S2 thickness in both sclerenchyma and vessel cells. In contrast, the elastic modulus showed a weak negative correlation with S1 and S3 thickness in sclerenchyma cells, while it exhibited a positive correlation with S1 and S3 thickness in the vessel cells. The correlation coefficients r between elastic modulus and sclerenchyma cell S2 thickness were 0.86 (BBCH60), 0.84 (BBCH 85), and 0.62 (BBCH 90) for ‘Zhoumai 36’ and 0.88 (BBCH60), 0.83 (BBCH 85), and 0.78 (BBCH 90) for ‘Angong 38’. For vessel cell S2 thickness, the correlation coefficients r were 0.96 (BBCH60), 0.85 (BBCH 85), and 0.94 (BBCH 90) for ‘Zhoumai 36’ and 0.64 (BBCH60), 0.87 (BBCH 85), and 0.94 (BBCH 90) for ‘Angong 38’.
3.3. Analysis of X-Ray Diffraction Test Results on Wheat Stem Cells
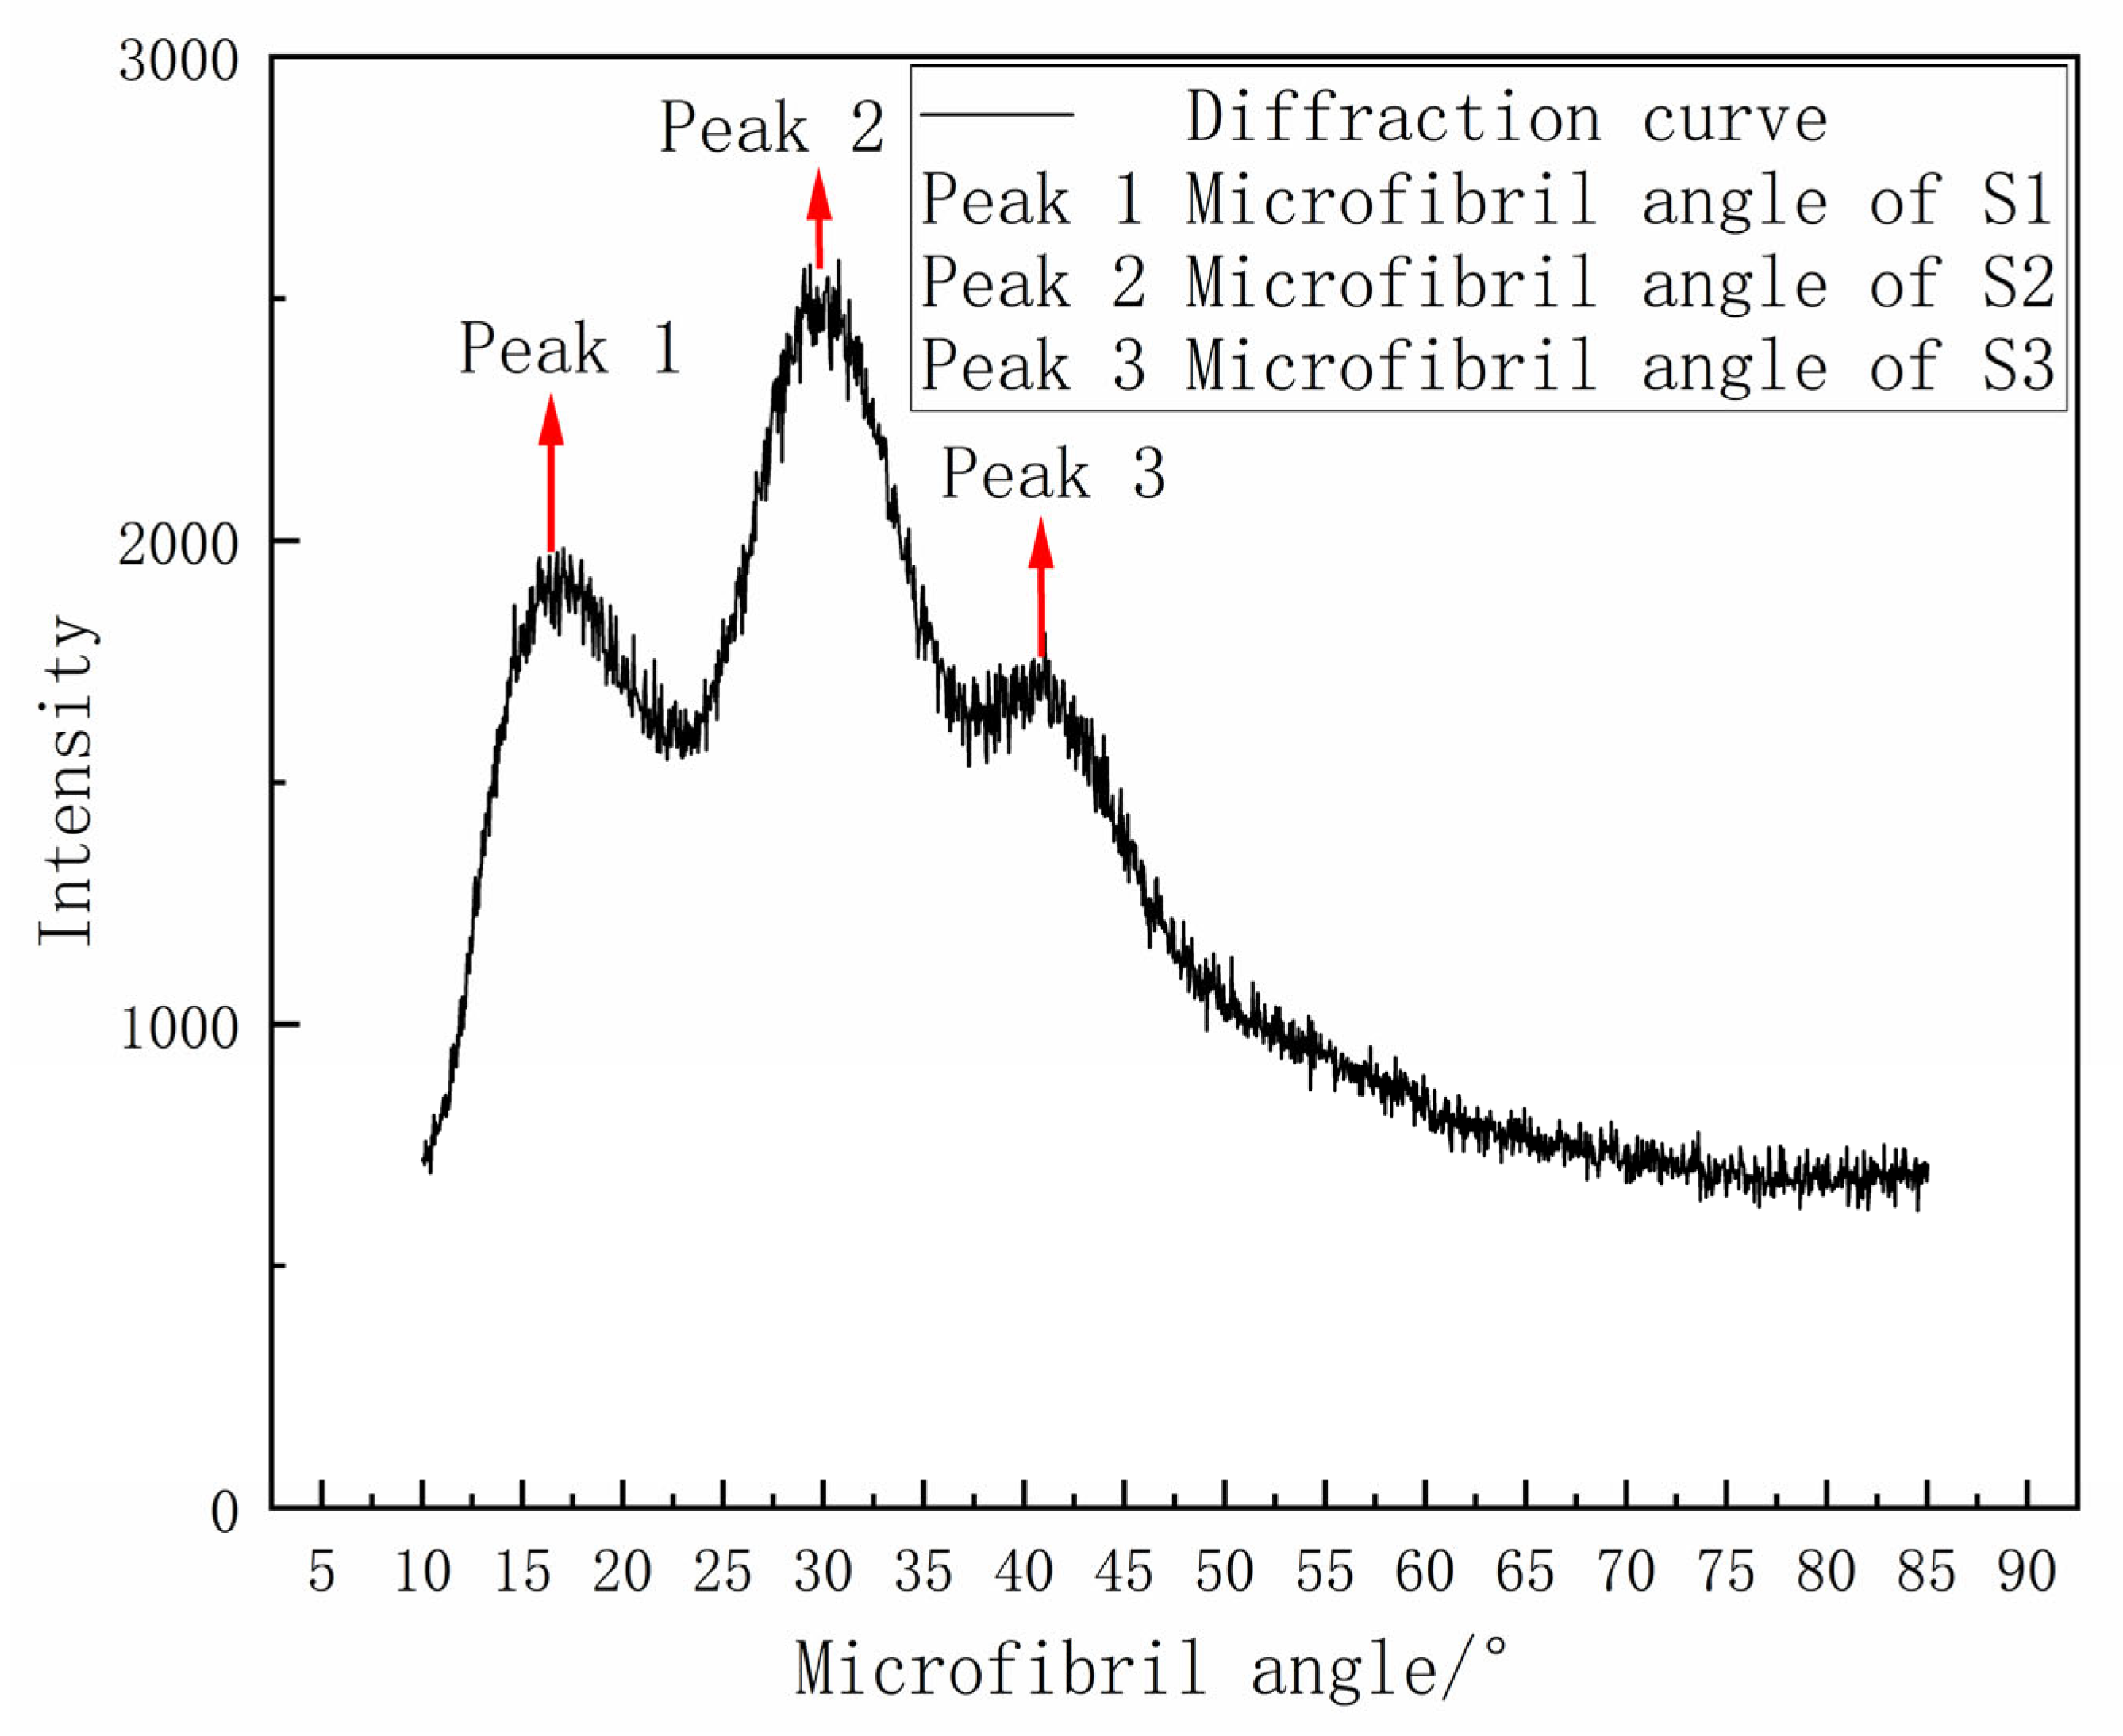
In the X-Ray Diffraction tests, the outer structure of the wheat stem was scanned, and the measured values represented the microfibril angles of sclerenchyma cells. The microfibril angle distributions of sclerenchyma cells in the two wheat varieties exhibited three distinct peaks in the fitting curves (
Figure 7), corresponding to the S1, S2, and S3 layers of the secondary cell walls. The average microfibril angle values are shown in
Table 4. As the growth period progressed, the microfibril angle did not show significant changes.
The elastic modulus and microfibril angle data from
Table 2 and
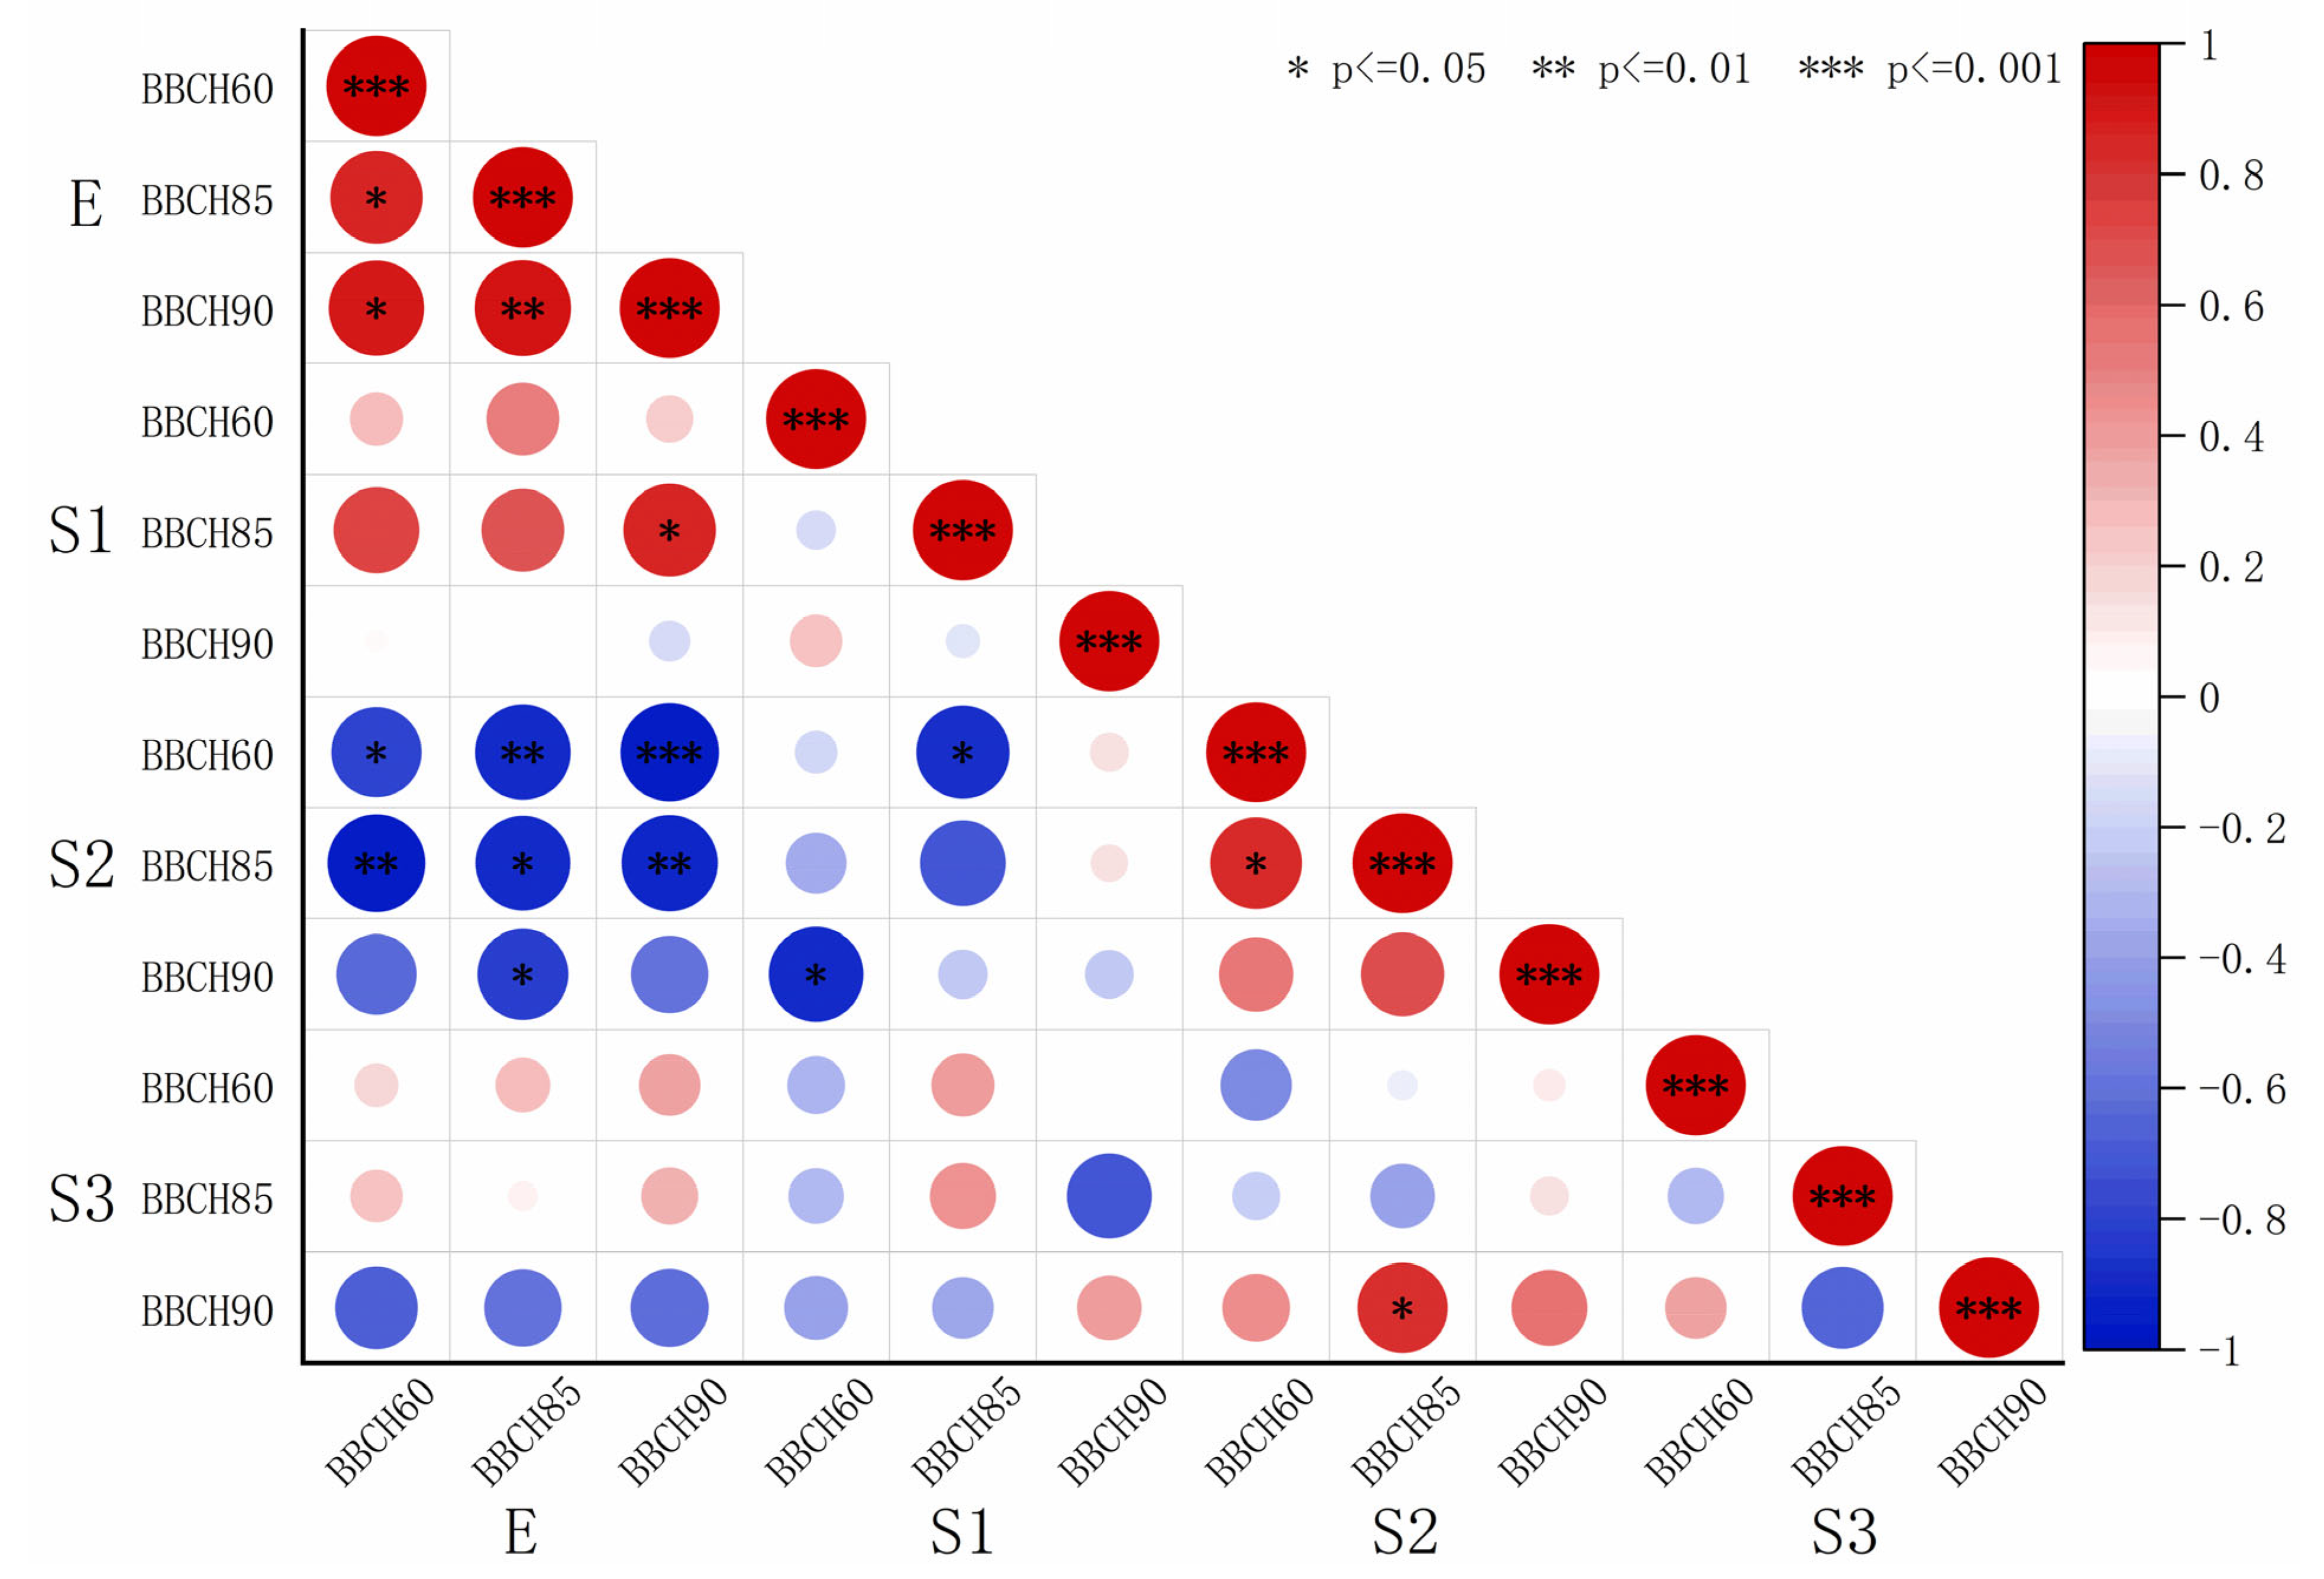
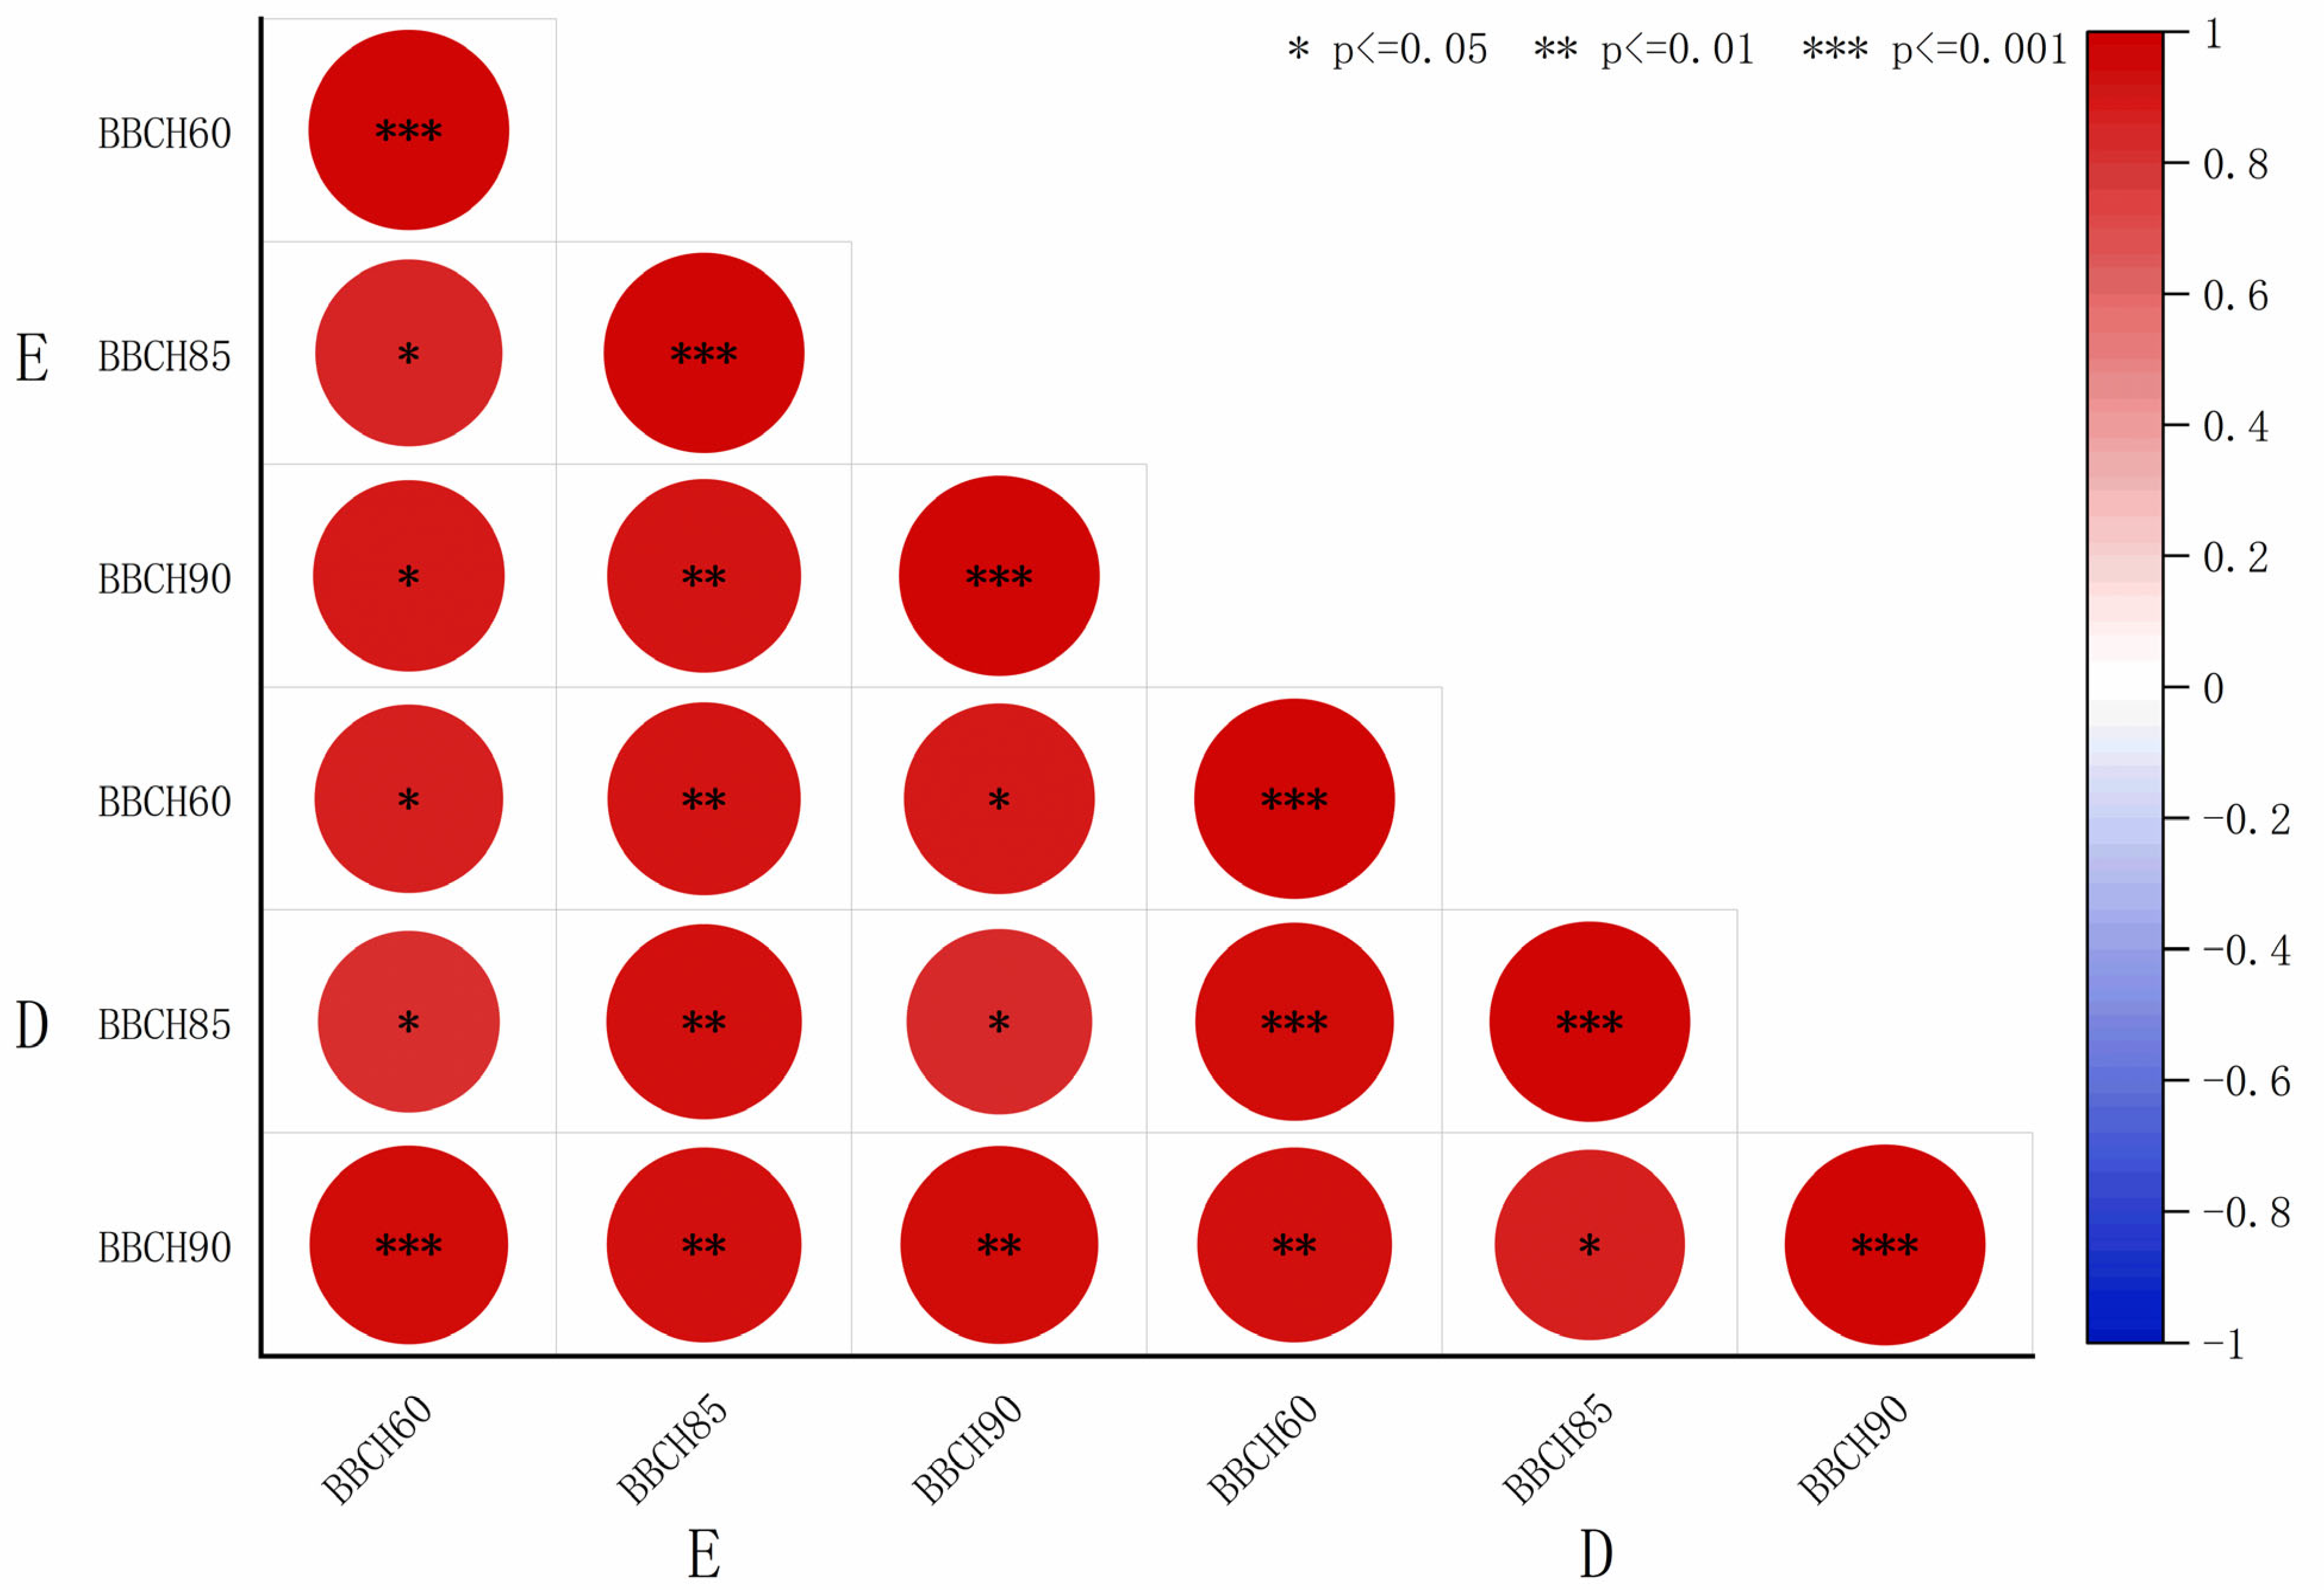
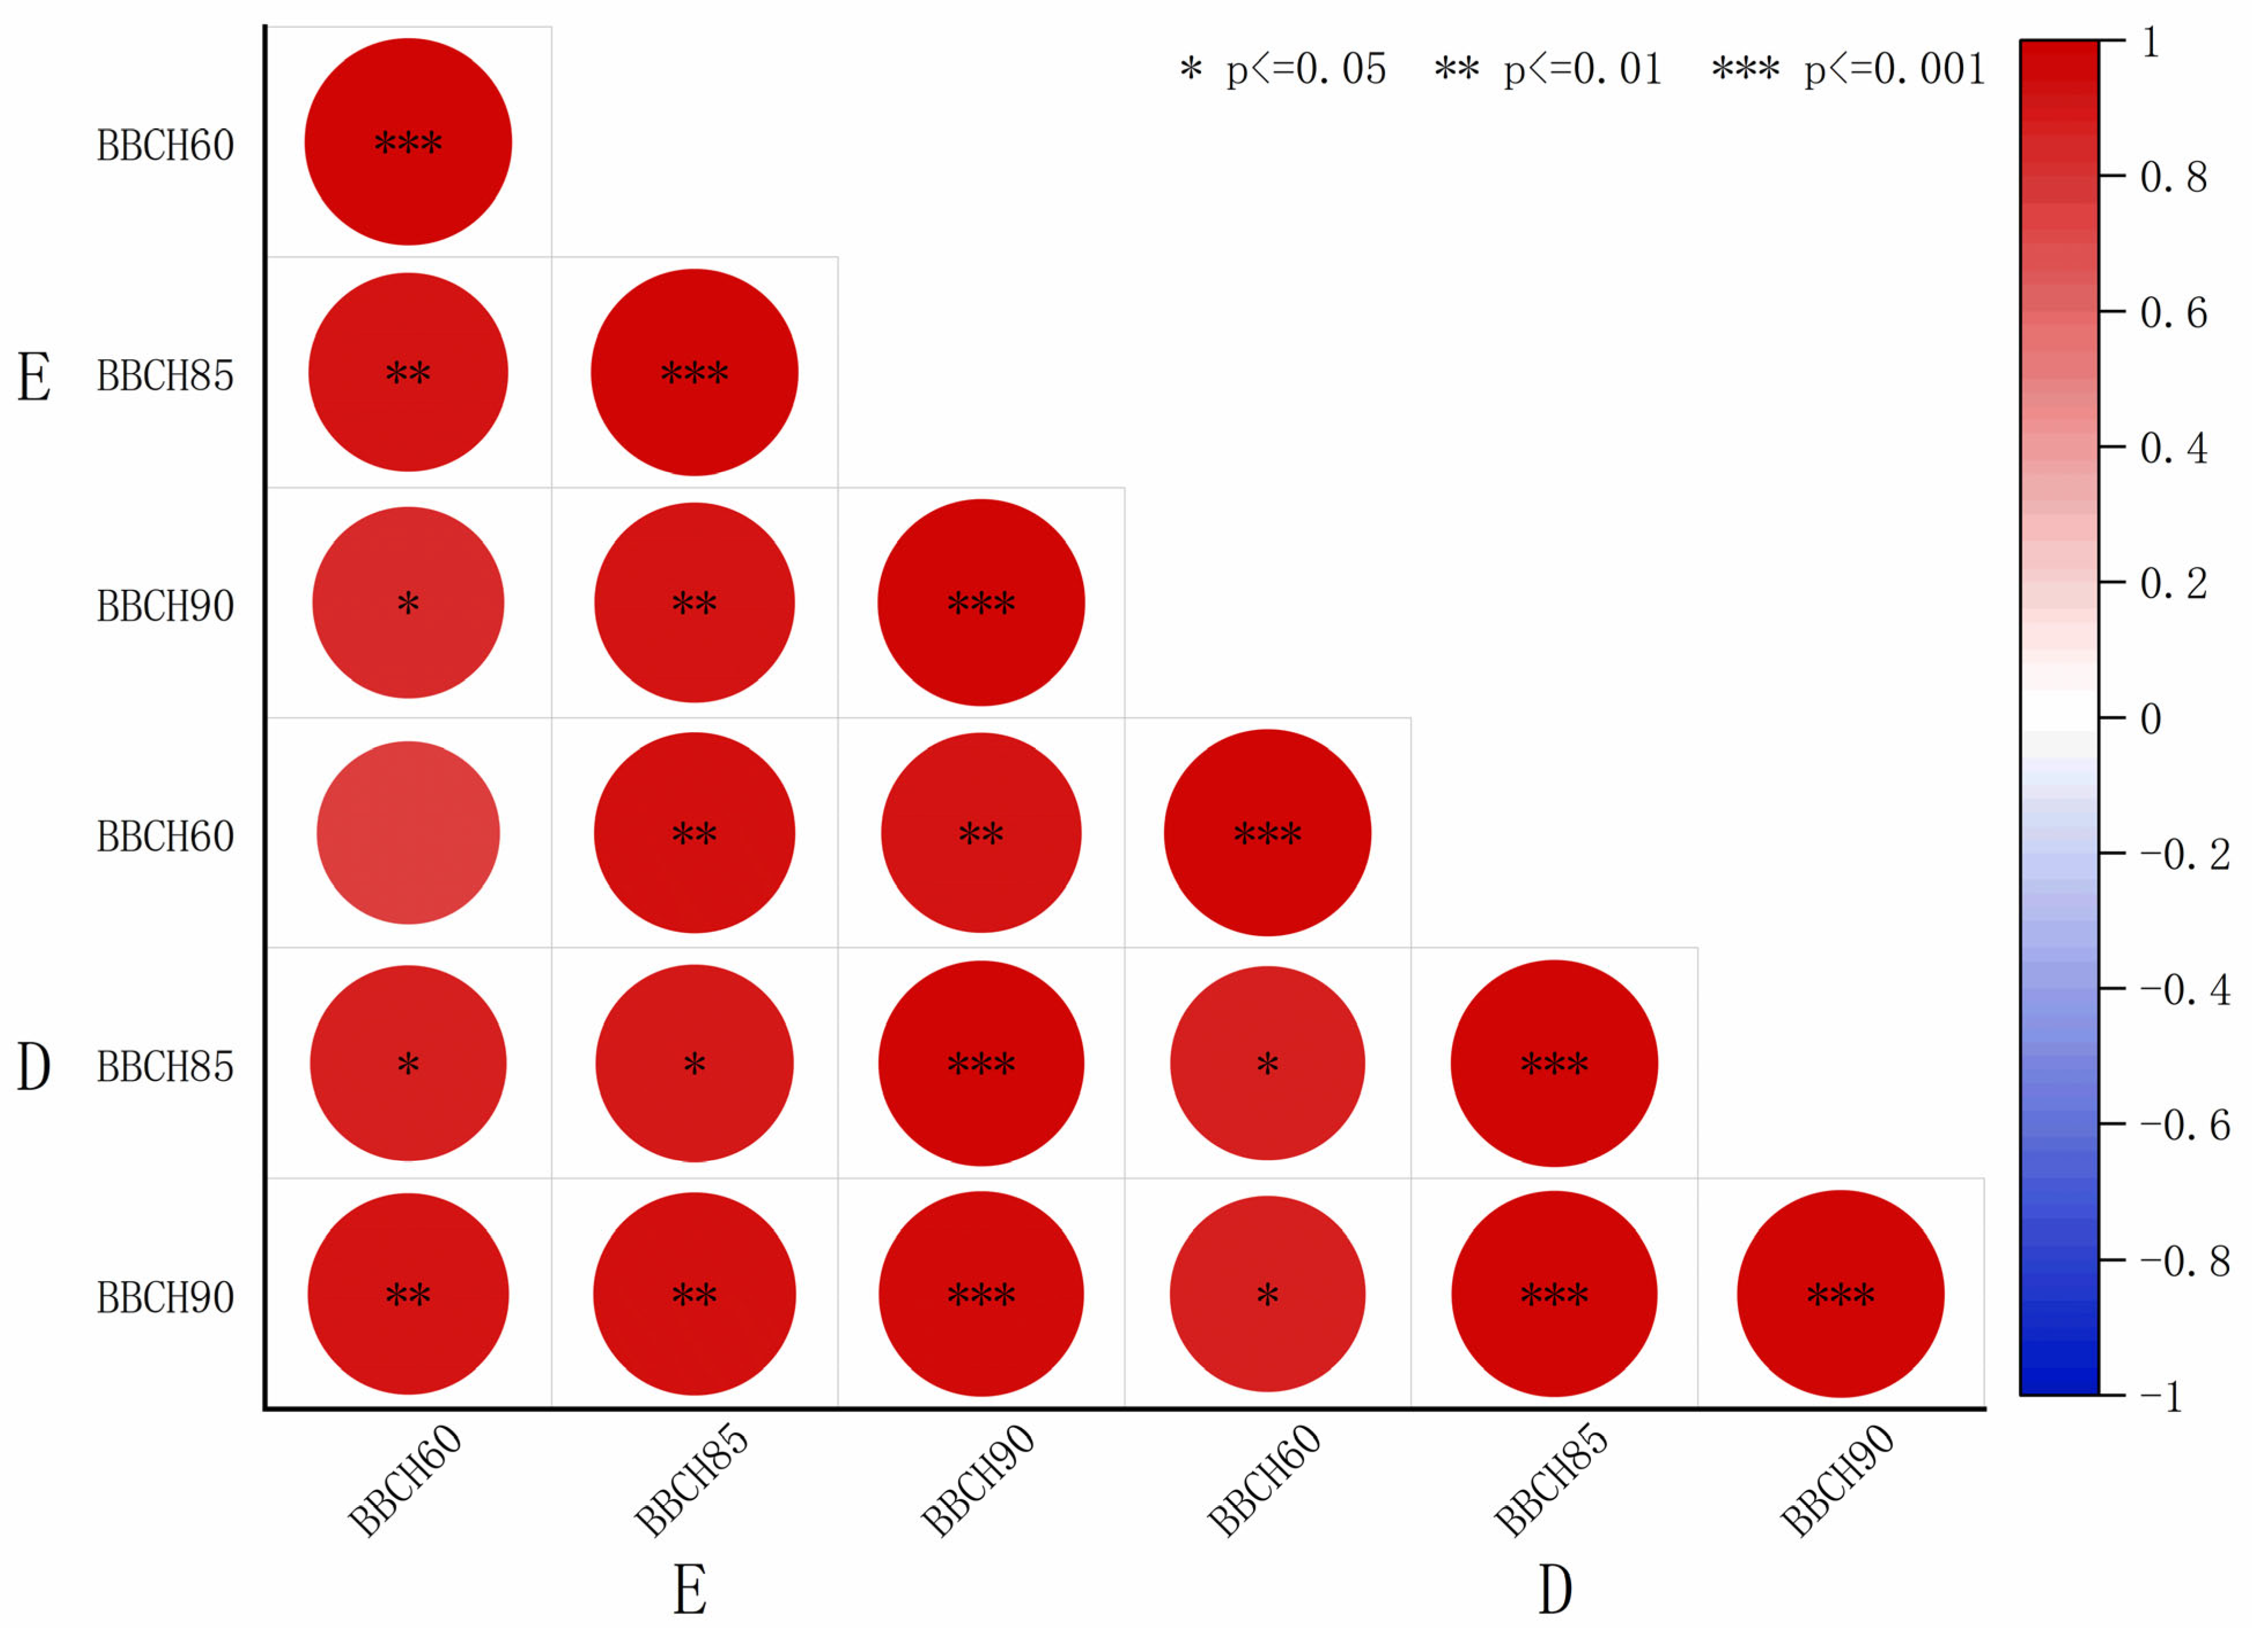
Table 4 were fitted, and the resulting coefficients were visualized using heatmaps (
Figure 8 and
Figure 9). A highly significant negative correlation was observed between the elastic modulus and microfibril angle of the S2 layer. The correlation coefficients r between the elastic modulus and microfibril angle of S2 were −0.81 (BBCH60), −0.90 (BBCH 85), and −0.60 (BBCH 90) for ‘Zhoumai 36’ and −0.96 (BBCH60) −0.95 (BBCH 85), and −0.92 (BBCH 90) for ‘Angong 38’.
The crystal structure of cellulose in the cell wall can be analyzed based on the diffraction curve. The average crystallite size of ‘Angong 38’ was consistently larger than that of ‘Zhoumai 36’ across all three growth stages. The elastic modulus and crystallite size data from
Table 2 and
Table 4 were fitted, and the resulting coefficients were visualized using heatmaps (
Figure 10 and
Figure 11). A positive correlation was observed between elastic modulus and crystallite size. The correlation coefficients r were 0.89 (BBCH60), 0.95 (BBCH 85), 0.97 and (BBCH 90) for ‘Zhoumai 36’ and 0.78 (BBCH60), 0.91 (BBCH 85), and 0.98 (BBCH 90) for ‘Angong 38’.
4. Discussion
The water content of the samples generally decreased as the growth stage progressed, consistent with the findings of Wu [
29]. The average elastic modulus of the stem samples from ‘Zhoumai 36’ showed a decreasing trend with the progression of the growth period, whereas that of ‘Angong 38’ exhibited an increasing trend, aligning with the results reported by Li [
30]. Compared with ‘Zhoumai 36’, Angong 38 (lodging-resistant variety) demonstrated higher water content and elastic modulus at BBCH 90. The stems of this lodging-resistant variety were better able to retain their water content during the later growth stages. Wheat varieties with higher water content at maturity tend to have a higher elastic modulus, which contributes to improved lodging resistance.
In the tensile test results, all curves display two distinct phases: an initial linear phase, in which stress is proportional to strain, followed by a nonlinear phase. The nonlinear behavior was attributed to the progressive slippage of cellulose microfibrils within the secondary cell wall under tensile loading. The two-phase behavior in the stress–strain curves (linear followed by nonlinear) reflects the mechanical response of wheat stem cell walls to tensile loading. The initial linear phase corresponds to the elastic deformation of cellulose microfibrils and matrix components, while the subsequent nonlinear phase may indicate plastic deformation caused by microfibril reorientation or interfibrillar slippage. This observation is consistent with the results presented by Liu [
25], as a similar mechanical response pattern was also observed in their tensile tests on sugarcane stems.
The ratio of mechanical tissue area to thin-walled tissue area influenced stem wall thickness and lodging resistance [
31,
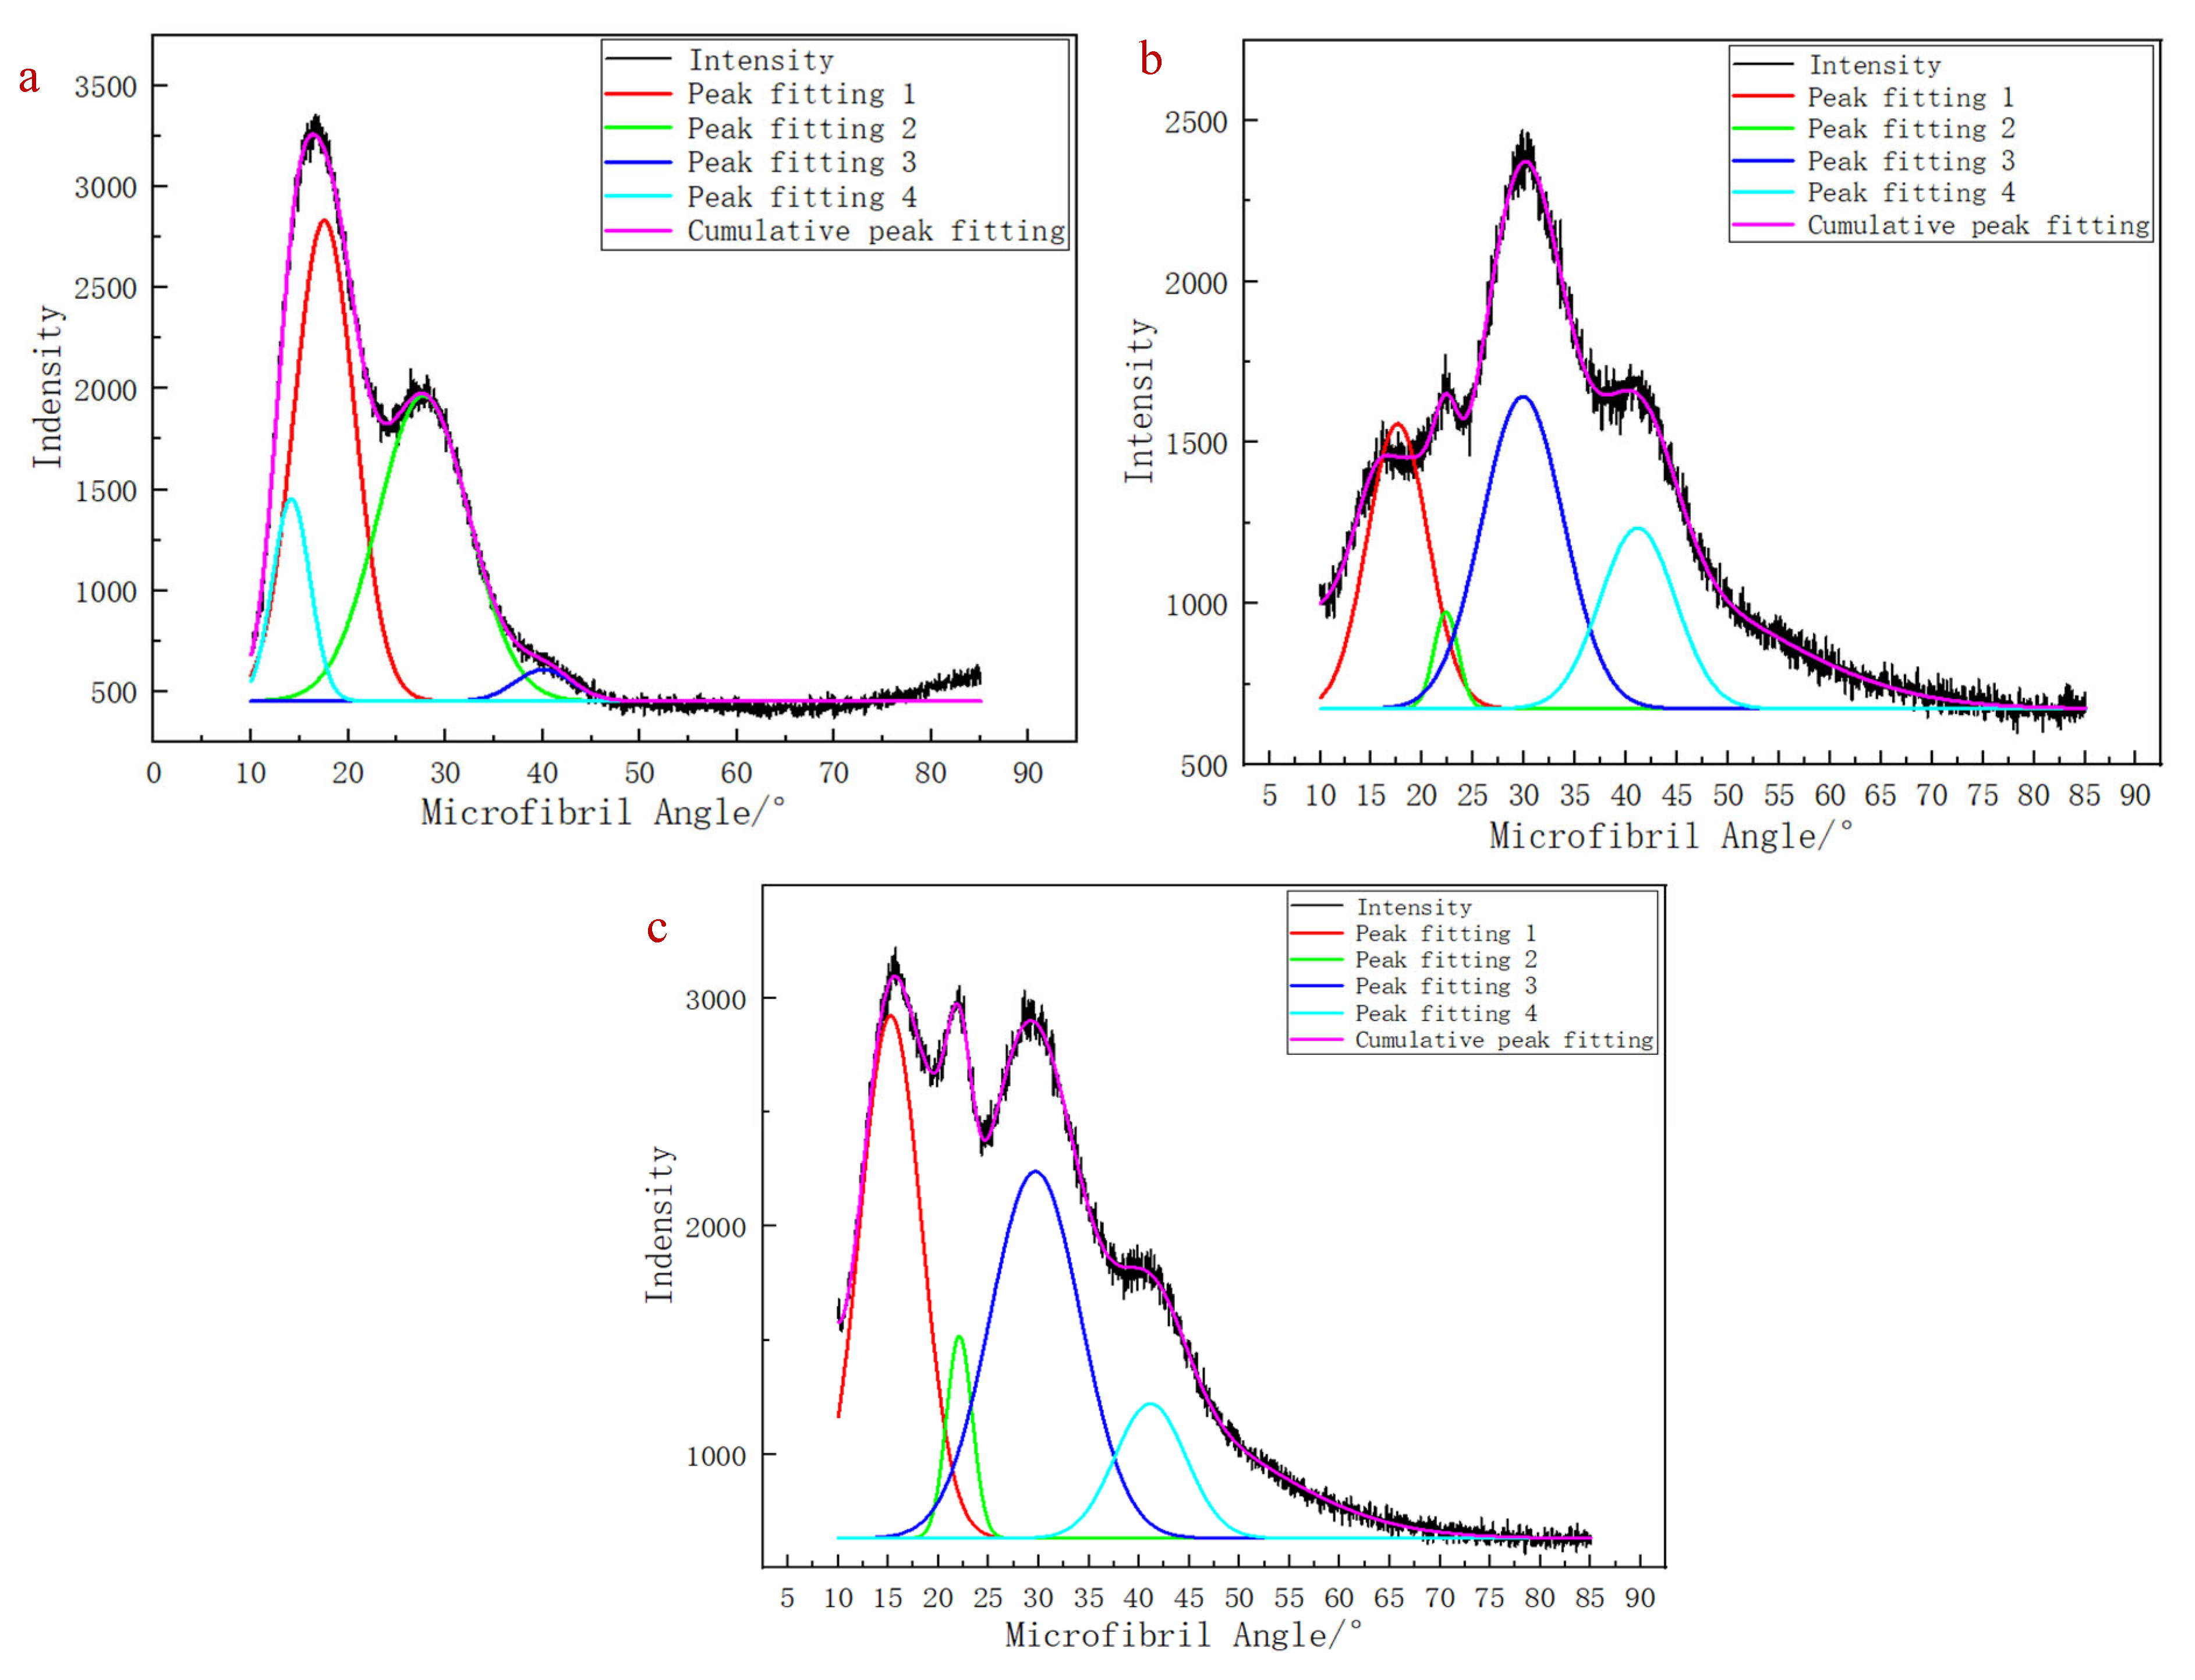
32], while stem water content showed a positive correlation with cell wall thickness. Both water content and cell wall thickness were higher at BBCH 85 compared to the other two growth stages. Furthermore, an increase in cell wall layer thickness was associated with a greater area of the corresponding tissue. The microfibril angles of wheat stem cellulose were approximately 15°, 30°, and 40°, respectively, which is very close to those observed in wood, cotton, and flax fibers. This suggests that the crystalline structure of wheat stem cellulose also belongs to the typical cellulose I type [
30]. Two distinct types of diffraction curves were observed during X-Ray Diffraction: The first type (data from the ‘Zhoumai 36’ samples at BBCH 85 and BBCH 90) (
Figure 12a,b) exhibited two consecutive sharp peaks in the microfibril angle within the range of 15° to 25°, with no significant difference in the peak intensity. This phenomenon may be attributed to the transformation of cellulose Iα into cellulose Iβ, during which the internal crystalline structure of cellulose changes, resulting in multiple sharp peaks upon X-ray exposure; both cellulose Iα and cellulose Iβ belong to the broader cellulose I category. The second type (data from the ‘Angong 38’ samples at the BBCH 90 stage) (
Figure 12c) lacked a clearly defined peak near 40°. This could be due to a decrease in the moisture content, which increased the peak intensity of the crystal plane diffraction peak. As a result, the highest peak became overly dominant, masking the peak near 40°. Additionally, wheat growth is a continuous and dynamic process influenced by both external environmental factors and intrinsic developmental changes. During this process, the chemical components of wheat stems—such as cellulose, hemicellulose, and lignin—are in a state of ongoing development and remain relatively unstable [
33,
34,
35,
36]. Moreover, peak intensity was also affected by the position of the sample surface relative to the optical path center.
In this study, six independent stem samples were used for each experiment at each growth stage of each wheat cultivar, a total of 36 samples from the two varieties. Multiple repeated measurements were performed on each sample, and the reliability of the data was verified through statistical analysis. Comparative experiments were conducted on only two wheat cultivars. The limited number of cultivars results in a lack of generalizability to some extent. A greater range of the most commonly cultivated varieties in China will be analyzed in our future research. At the macroscopic scale, the research only focused on the factor of water content, and only a tensile elastic modulus test was conducted. In the next study, the thickness of the stem wall will also be a factor, and three-point bending and shear tests will also be conducted.
In this research, only the S2 layer thickness in the cell wall, microfibril angle, and cellulose crystallite size were studied. To better explore the relationship between the micro-structure and macroscopic mechanical properties of wheat stems, further examinations of micro-structural factors such as cell size and components of the cell wall (e.g., cellulose, hemicellulose, and lignin) will be conducted in our next study.
5. Conclusions
The study investigated the influence of cellular structural characteristics on the mechanical strength of stems in two wheat cultivars: ‘Zhoumai 36’ and ‘Angong 38’. The results indicated that the mechanical strength of wheat stems was closely associated with the structural properties of sclerenchyma and vessel cells, particularly the S2 layer of cell walls. The main findings can be summarized as follows:
Dynamic changes in stem elastic modulus. The elastic modulus of stems exhibited distinct trends between the two varieties. In ‘Zhoumai 36’, it decreased from 1.60 ± 0.08 GPa to 1.25 ± 0.04 GPa, whereas in ‘Angong 38’, it increased from 1.15 ± 0.07 GPa to 1.48 ± 0.18 GPa. The elastic modulus of the second internode increased with the progression of the growth stage. Higher stem water content at BBCH 90 was associated with a higher elastic modulus, suggesting that maintaining appropriate water content during late grain filling may help preserve the mechanical strength of the stem.
The S2 (middle layer of the secondary cell wall) thickness of both cell types showed a positive correlation with the elastic modulus of the stem. The S2 layer (middle layer of the secondary cell wall) in both sclerenchyma and vessel cells was identified as the most critical structural component influencing cellular characteristics. It underwent significant thickening during the BBCH 85 stage. Increased stem water content was associated with a greater secondary cell wall thickness. This greater wall layer thickness corresponded to a larger tissue area occupied by these cells, which further contributed to a larger elastic modulus of the stem and a higher stem mechanical strength.
The microfibril angle of the S2 layer showed a negative correlation with the elastic modulus. The specific diffraction curves were influenced not only by the effect of cellulose crystal structure on stem mechanical strength, but also by the external environmental conditions and intrinsic growth factors. Both aspects require further investigation. This complexity highlights the need for controlled experiments to isolate the effects of individual factors in future studies.
A positive correlation was observed between crystallite size and elastic modulus. The cellulose crystallite sizes ranged from 1.22 ± 0.10 nm to 1.83 ± 0.30 nm in ‘Zhoumai 36’ and from 1.42 ± 0.11 nm to 1.85 ± 0.23 nm in ‘Angong 38’.
These findings provide valuable insights for the breeding of lodging-resistant wheat varieties.
Author Contributions
Q.L.: Conceptualization, Supervision, Review and Editing. Z.L. (Zhenghe Luo): Writing—Original MS Preparation, Research, Experiments, Data Analysis. M.W.: Corresponding Author, Review and Editing, Research Task Assignment, and Funding Acquisition. Z.L. (Zhichao Lin), Y.H., Q.Z. and X.H.: Experiments, Data Analysis. Each author has approved the final version of the manuscript and agrees to be accountable for all aspects of the work. All authors have read and agreed to the published version of the manuscript.
Funding
The work was supported by the National Natural Science Foundation of China [32271995].
Data Availability Statement
The data presented in this study are available on request from the corresponding author. The data are not publicly available due to their association with ongoing research projects and other unpublished manuscripts from our research group, where premature public release may compromise the novelty and integrity of subsequent studies.
Conflicts of Interest
No potential conflicts of interest were reported by the authors.
References
- Wang, D.; Ding, W.; Feng, S.; Hu, T.; Li, G.; Li, X.; Yang, Y.; Ru, Z. Stem characteristics of different wheat varieties and its relationship with lodging-resistance. Chin. J. Appl. Ecol. 2016, 27, 1496–1502. [Google Scholar]
- Hu, Y. The Effect of Population Heterogeneity Distribution on the Lodging Resistance of Wheat. Master’s Thesis, Northwest A&F University, Xianyang, China, 2024. [Google Scholar]
- Sun, Y.; Wang, C.; Wang, R.; Mu, Q.; Mi, Y.; Lv, G.; Qi, X.; Sun, X.; Chen, Y.; Qian, Z.; et al. Wheat Lodging: Cause and Mechanism and Its Effect on Wheat Yield and Quality. J. Agric. 2022, 12, 1–5. [Google Scholar]
- Liu, Q.; Lin, Z.; Hu, P.; Zheng, M.; Li, Z.; Li, T. Preliminary Study on Crop Multi-Scale Mechanies. Trans. Chin. Soc. Agric. Eng. (Trans. CSAE) 2023, 39, 295–304. [Google Scholar]
- Liu, Q.; Su, Y.; Ma, Y.; Chen, D.; Liu, B.; Li, X.; Wang, X.; Zhang, Q. Study on the Stem Characteristics and Lodging Resistance of Different Wheat Varieties. Guizhou Agric. Sci. 2022, 50, 48–54. [Google Scholar]
- Yang, X.; Song, W.; Liu, D.; Zhao, L.; Song, Q.; Zhang, C.; Xin, W.; Xiao, Z. Research Progress on Stem Strength in Wheat. Heilongjiang Agric. Sci. 2002, 45, 106–109. [Google Scholar]
- Liu, R.; Chen, J.; Shang, X.; Xu, F.; Xu, Q.; Peng, Y.; Dong, G.; Dong, J.; Qin, D. Correlations Between Lodging Resistance and the Stem and Spike Characteristics of Barley and Wheat. Barley Cereal Sci. 2022, 39, 14–21. [Google Scholar]
- Yao, J.; Mang, H.; Yao, G.; Yang, X.; Zhou, M.; Zhang, P.; Zhang, P. Research Progress on Lodging Resistance in Wheat (Triticum aestivum L.). J. Plant Genet. Resour. 2013, 14, 208–2013. [Google Scholar]
- Zhang, Z.; Fu, J.; Wang, F.; Wang, L.; Zhao, S.; Wang, W.; Zhang, H.; Yu, L.; Niu, L. Research Progress in Wheat Lodging. J. Anhui Agric. Sci. 2013, 41, 2020–2022. [Google Scholar]
- Meng, L.; Guo, X.; Li, H.; Yang, L.; Mai, C.; Yu, L.; Zhou, Y.; Zhang, H. Research Progress on Lodging Resistance of Wheat. J. Triticeae Crops 2014, 34, 1720–1727. [Google Scholar]
- Zhang, P.; Yan, S.; Zhang, C.; Shao, Q.; Liu, L.; Wang, P.; Liu, F.; Li, W. Relationship Between Stem Lodging Resistance and Basal Internode Traits of Wheat Along Huaihe River. J. Jianghan Univ. (Nat. Sci. Ed.) 2022, 50, 41–49. [Google Scholar]
- Wang, J.; Zhu, J.; Lin, Q.; Li, X.; Teng, N.; Li, Z.; Li, B.; Zhang, A.; Lin, J. Influence of wheat stalk structure and cell wall chemistry on compressive strength. Chin. Sci. Bull. 2006, 57, 679–685. [Google Scholar]
- He, J.; Sun, S.; Ge, C.; Song, D.; Qiao, J.; Li, S.; Su, Y.; Liao, P. Relationship Between Stem Microstructure, Biochemical Composition and Stem Strength of Different Wheat Varieties (Lines). Acta Agric. Boreali-Sin. 2022, 37, 68–76. [Google Scholar]
- Chen, X.; Shi, C.; Yin, Y.; Wang, Z.; Shi, Y.; Peng, D.; Ni, Y.; Cai, T. Relationship between Lignin Metabolism and Lodging Resistance in Wheat. Acta Agron. Sin. 2011, 37, 1616–1622. [Google Scholar] [CrossRef]
- Wang, K.; Zhao, X.; Yao, X.; Yao, Y.; Bai, Y.; Wu, K. Relationship of stem characteristics and lignin synthesis with lodging resistance of hulless barley. Acta Agron. Sin. 2019, 45, 621–627. [Google Scholar] [CrossRef]
- Liu, W.; Deng, Y.; Hussain, S.; Zou, J.; Yuan, J.; Luo, L.; Yang, C.; Yuan, X.; Yang, W. Relationship between cellulose accumulation and lodging resistance in the stem of relay intercropped soybean [Glycine max (L.) Merr]. Field Crops Res. 2016, 196, 261–267. [Google Scholar] [CrossRef]
- Tripathi, S.; Sayre, K.; Kaul, J.; Narang, R. Growth and morphology of spring wheat (Triticum aestivum L.) culms and their association with lodging: Effects of genotypes, N levels and ethephon. Field Crops Res. 2003, 84, 271–290. [Google Scholar] [CrossRef]
- Tian, G. The Main Influence Factors of Bamboo Fiber Mechanical Properties. Ph.D. Dissertation, Chinese Academy of Forestry, Beijing, China, 2015. [Google Scholar]
- Ren, W. The Supramolecular Structure of Bamboo Cellulose and Its Effect on Hydrolysis Saccharification. Master’s Thesis, Chinese Academy of Forestry, Beijing, China, 2021. [Google Scholar]
- Huang, X.; Qin, X.; Yang, X.; Li, J.; Peng, X.; Wu, M.; Jin, G.; Chen, T. Analysis of Morphological and Structural Characteristics of Sisal Leaf Fiber Cells. Crops 2022, 38, 99–103. [Google Scholar]
- Guo, Y.; Wang, R.; Liu, L.; He, X. Changes in microstructure of stored wheat before and after heat and mildew. Food Sci. Technol. 2019, 44, 157–162. [Google Scholar]
- Wang, Y.-H.; Zhang, F.-F.; Xue, X.; Ji, B.-C.; Li, D.; Zhang, L.-P. Application of X-Ray in the Study of Cell Wall Structure of Rattan Fibers. Spectrosc. Spectr. Anal. 2020, 40, 1442–1446. [Google Scholar]
- Rekha, B.; Nagarajaganesh, B. X-ray diffraction: An efficient method to determine microfibrillar angle of dry and matured cellulosic fibers. J. Nat. Fibers 2022, 19, 3689–3696. [Google Scholar] [CrossRef]
- Lin, Z.; Liu, Q.; Wu, T.; Huang, J.; Yang, H.; Li, Z. Effects of Cellulose Structure of Sugarcane Stem on Mechanical Properties of Cell Wall. J. Nat. Fibers 2025, 22, 2445573. [Google Scholar] [CrossRef]
- Liu, Q.; Li, T.; Lin, Z.; Huang, J.; Luo, Z.; Huang, Y. Effect of Cell Wall Structural Characteristics of Sugarcane Stem on Its Mechanical Properties of Vascular Bundle. Genom. Appl. Biol. 2024, 43, 1163–1171. [Google Scholar]
- Dong, Q.; Wang, A.; Liang, S. Study on the Architectural Characteristics of Wheat Stalks. J. Shanxi Agric. Univ. (Nat. Sci. Ed.) 2003, 47, 188–191. [Google Scholar]
- Li, Z.; Li, Y.; Bai, X.; Xu, C.; Zhang, M.; Wu, H.; Kang, J.; Ma, W. Study on the Relationship between Stem Characteristics and Lodging Resistance in Winter Wheat. J. Agric. Sci. 2024, 45, 26–30+43. [Google Scholar]
- Andersson, S.; Serimaa, R.; Paakkari, T.; Saranpää, P.; Pesonen, E. Crystallinity of wood the size of cellulose crystallites in Norway spruce (Picea abies). J. Wood Sci. 2003, 49, 531–537. [Google Scholar] [CrossRef]
- Wu, C.; Liu, Y.; Wang, R.; Feng, Q.; Guo, Y. Experimental Study on the Biomechanical Properties of Fine Variety Wheat’s Stalk and Taproot in Different Growth Periods. J. Agric. Mech. Res. 2017, 39, 154–157+168. [Google Scholar]
- Lu, S. Study on the Photoluminescence Behavior of Cellulose During the Change of Crystallinity and Crystal Form. Master’s Thesis, Zhejiang Sci-Tech University, Zhejiang, China, 2021. [Google Scholar]
- Kong, E.; Liu, D.; Guo, X.; Yang, W.; Sun, J.; Li, X.; Zhan, K.; Cui, D.; Lin, J.; Zhang, A. Anatomical and chemical characteristics associated with lodging resistance in wheat. Crop J. 2013, 1, 43–49. [Google Scholar] [CrossRef]
- Zhang, W.; Wu, L.; Wu, X.; Ding, Y.; Li, G.; Li, J.; Weng, F.; Liu, Z.; Tang, S.; Ding, C.; et al. Lodging Resistance of Japonica Rice (Oryza sativa L.): Morphological and Anatomical Traits Due to Top-Dressing Nitrogen Application Rates. Rice 2016, 9, 35. [Google Scholar] [CrossRef]
- Peng, D. Effects of Lodging on Grain Yield and Starch Characteristics and its Relationship to Stem Lignin Metabolism in Wheat. Ph.D. Dissertation, Shandong Agricultural University, Taian, China, 2014. [Google Scholar]
- Zhang, J. Effects of Low Light Intensity on Lignin Synthesis and Accumulation in Wheat Stem. Master’s Thesis, Northwest A&F University, Xianyang, China, 2023. [Google Scholar]
- Yan, Q.; Lu, J.; Zheng, Z.; Wang, M.; Jia, Y.; Dong, F.; Yang, F.; Li, F. Effect of Growth Regulator on Stem Characters, Grain Yield and Quality of Black-Grained Wheat. J. Triticeae Crops 2020, 40, 1082–1089. [Google Scholar]
- Yu, H. Functional Analysis of Wheat HCT Gene in Stem Lignin Synthesis. Master’s Thesis, Shandong Agricultural University, Taian, China, 2022. [Google Scholar]
Figure 1.
Material of wheat stem (a) stem and sheath (b) Basal second internode of stem (c) Diagram of the nodal structure of wheat stem. (The figure only shows the above-ground stems, and the roots are not shown).
Figure 1.
Material of wheat stem (a) stem and sheath (b) Basal second internode of stem (c) Diagram of the nodal structure of wheat stem. (The figure only shows the above-ground stems, and the roots are not shown).
Figure 2.
Tensile test of wheat stem: (a) samples and specimens, (b) effective fracture sample.
Figure 2.
Tensile test of wheat stem: (a) samples and specimens, (b) effective fracture sample.
Figure 3.
Tensile stress–strain curve of wheat stem at BBCH 60 of ‘Angong 38’.
Figure 3.
Tensile stress–strain curve of wheat stem at BBCH 60 of ‘Angong 38’.
Figure 4.
Two cell wall layer compositions: (a) Cell wall layering in sclerenchyma or vessel cells. (b) Cell wall layering in parenchyma cells. (ML is the middle lamella of the cells; P is the primary wall; and S1, S2, and S3 are the outer, middle, and inner layers of the secondary wall layers.).
Figure 4.
Two cell wall layer compositions: (a) Cell wall layering in sclerenchyma or vessel cells. (b) Cell wall layering in parenchyma cells. (ML is the middle lamella of the cells; P is the primary wall; and S1, S2, and S3 are the outer, middle, and inner layers of the secondary wall layers.).
Figure 5.
Heatmap depicting the correlation coefficients between elastic modulus and cell wall layer thickness in ‘Zhoumai 36’. (E denotes the elastic modulus and WTCS denotes the secondary wall thickness of sclerenchyma cells, with WTCS1, WTCS2, and WTCS3 corresponding to the outer, middle, and inner layers of the secondary wall. Similarly, WTVS indicates the secondary wall thickness of vessel cells, with WTVS1, WTVS2, and WTVS3 representing the outer, middle, and inner layers, respectively. Red for positive correlation and blue for negative correlation. Larger circles indicate stronger correlations.)
Figure 6.
Heatmap depicting the correlation coefficients between elastic modulus and cell wall layer thickness in ‘Angong 38’.
Figure 6.
Heatmap depicting the correlation coefficients between elastic modulus and cell wall layer thickness in ‘Angong 38’.
Figure 7.
X-Ray Diffraction curve of the basal second internode of wheat stems.
Figure 7.
X-Ray Diffraction curve of the basal second internode of wheat stems.
Figure 8.
Heatmap depicting the correlation coefficients between the elastic modulus and microfibril angle in ‘Zhoumai 36’.
Figure 8.
Heatmap depicting the correlation coefficients between the elastic modulus and microfibril angle in ‘Zhoumai 36’.
Figure 9.
Heatmap depicting the correlation coefficients between the elastic modulus and microfibril angle in ‘Angong 38’.
Figure 9.
Heatmap depicting the correlation coefficients between the elastic modulus and microfibril angle in ‘Angong 38’.
Figure 10.
Heatmap depicting the correlation coefficients between the elastic modulus and crystallite size in ‘Zhoumai 36’.
Figure 10.
Heatmap depicting the correlation coefficients between the elastic modulus and crystallite size in ‘Zhoumai 36’.
Figure 11.
Heatmap depicting the correlation coefficients between the elastic modulus and crystallite size in ‘Angong 38’.
Figure 11.
Heatmap depicting the correlation coefficients between the elastic modulus and crystallite size in ‘Angong 38’.
Figure 12.
Three-peak distribution maps of microfibril angle. (a) Zhoumai 36: test samples at BBCH 85; (b) Zhoumai 36: test samples at BBCH 90; (c) Angong 38: test samples at BBCH 90.
Figure 12.
Three-peak distribution maps of microfibril angle. (a) Zhoumai 36: test samples at BBCH 85; (b) Zhoumai 36: test samples at BBCH 90; (c) Angong 38: test samples at BBCH 90.
Table 1.
Water contents of wheat stem samples of two varieties.
Table 1.
Water contents of wheat stem samples of two varieties.
| Growth Stage | Water Content |
|---|
| Zhoumai 36 | Angong 38 |
|---|
| BBCH 60 | 74.29% | 84.50% |
| BBCH 85 | 59.04% | 72.97% |
| BBCH 90 | 52.78% | 73.19% |
Table 2.
Tensile test results of wheat stem samples.
Table 2.
Tensile test results of wheat stem samples.
| Cultivar | Growth Stage | Tensile Strength/MPa | Elastic Modulus/GPa |
|---|
| Average Value | Standard Error |
|---|
| Zhoumai 36 | BBCH 60 | 56.76 | 1.60 | 0.08 |
| BBCH 85 | 33.19 | 1.09 | 0.05 |
| BBCH 90 | 40.46 | 1.25 | 0.04 |
| Angong 38 | BBCH 60 | 29.28 | 1.15 | 0.07 |
| BBCH 85 | 27.22 | 1.51 | 0.09 |
| BBCH 90 | 33.75 | 1.48 | 0.18 |
Table 3.
Thickness data for each layer of the sample cell walls.
Table 3.
Thickness data for each layer of the sample cell walls.
| Cultivar | Growth Stage | Cell Type | ML (nm) | P (nm) | S1 (nm) | S2 (nm) | S3 (nm) |
|---|
| Zhoumai 36 | BBCH 60 | Sclerenchyma | 147.01 ± 31.82 | 68.61 ± 6.95 | 214.09 ± 7.34 | 300.87 ± 12.62 | 240.99 ± 28.79 |
| Vessel | 247.91 ± 91.06 | 204.48 ± 41.48 | 419.68 ± 88.45 | 704.33 ± 96.84 | 526.53 ± 57.22 |
| Parenchyma | 246.00 ± 19.81 | 1025.43 ± 63.02 | | | |
| BBCH 95 | Sclerenchyma | 173.09 ± 9.55 | 363.58 ± 31.08 | 668.39 ± 48.55 | 1320.77 ± 73.87 | 397.37 ± 22.80 |
| Vessel | 215.68 ± 31.17 | 231.26 ± 53.49 | 448.26 ± 61.83 | 664.61 ± 109.15 | 384.14 ± 48.86 |
| Parenchyma | 244.57 ± 25.99 | 1985.86 ± 88.26 | | | |
| BBCH 90 | Sclerenchyma | 127.23 ± 12.99 | 101.75 ± 17.52 | 146.72 ± 18.64 | 323.11 ± 29.39 | 211.30 ± 27.47 |
| Vessel | 208.60 ± 31.47 | 295.27 ± 70.17 | 607.92 ± 47.19 | 766.68 ± 20.48 | 307.13 ± 31.32 |
| Parenchyma | 199.58 ± 18.92 | 1109.93 ± 39.39 | | | |
| Angong 38 | BBCH 60 | Sclerenchyma | 70.08 ± 5.19 | 104.43 ± 18.11 | 141.50 ± 7.06 | 595.08 ± 68.56 | 172.53 ± 10.10 |
| Vessel | 244.82 ± 67.06 | 218.49 ± 49.35 | 488.81 ± 59.47 | 1530.61 ± 132.37 | 1339.86 ± 102.41 |
| Parenchyma | 165.39 ± 7.48 | 833.11 ± 33.87 | | | |
| BBCH 95 | Sclerenchyma | 171.91 ± 15.78 | 202.47 ± 30.51 | 336.73 ± 44.97 | 980.82 ± 60.62 | 500.01 ± 72.26 |
| Vessel | 167.52 ± 17.92 | 122.16 ± 5.52 | 375.78 ± 34.63 | 519.09 ± 66.23 | 294.65 ± 12.00 |
| Parenchyma | 303.89 ± 31.12 | 1470.82 ± 72.96 | | | |
| BBCH 90 | Sclerenchyma | 199.30 ± 11.60 | 132.84 ± 16.81 | 395.11 ± 43.76 | 796.52 ± 66.74 | 501.85 ± 17.33 |
| Vessel | 217.93 ± 18.82 | 342.03 ± 74.24 | 675.14 ± 63.83 | 865.73 ± 74.34 | 491.87 ± 113.20 |
| Parenchyma | 89.04 ± 7.99 | 285.67 ± 54.28 | | | |
Table 4.
Statistical analysis of the mean microfibril angles and crystallite sizes in wheat stems of two varieties across different growth stages. (S1, S2, and S3 represent the outer, middle, and inner layers of the secondary wall of thick-walled cells; D denotes the crystallite size. The data are shown as “Mean ± SEM”.).
| Cultivar | Growth Stage | S1/° | S2/° | S3/° | D/nm |
|---|
| Zhoumai 36 | BBCH 60 | 75.65 ± 0.57 | 27.53 ± 1.11 | 40.31 ± 0.65 | 1.22 ± 0.10 |
| BBCH 85 | 74.07 ± 0.35 | 28.90 ± 0.32 | 39.54 ± 0.42 | 1.43 ± 0.13 |
| BBCH 90 | 73.77 ± 0.36 | 29.90 ± 0.17 | 40.44 ± 0.17 | 1.83 ± 0.30 |
| Angong 38 | BBCH 60 | 74.65 ± 0.70 | 29.19 ± 0.39 | 40.26 ± 0.45 | 1.42 ± 0.11 |
| BBCH 85 | 73.98 ± 0.41 | 29.35 ± 0.24 | 39.54 ± 0.56 | 1.64 ± 0.19 |
| BBCH 90 | 74.84 ± 0.28 | 29.56 ± 0.12 | 40.32 ± 0.28 | 1.85 ± 0.23 |
| Disclaimer/Publisher’s Note: The statements, opinions and data contained in all publications are solely those of the individual author(s) and contributor(s) and not of MDPI and/or the editor(s). MDPI and/or the editor(s) disclaim responsibility for any injury to people or property resulting from any ideas, methods, instructions or products referred to in the content. |
© 2025 by the authors. Licensee MDPI, Basel, Switzerland. This article is an open access article distributed under the terms and conditions of the Creative Commons Attribution (CC BY) license (https://creativecommons.org/licenses/by/4.0/).
