Abstract
In the era of digital transformation, understanding and quantifying the mechanisms by which management strategies influence organizational performance is a critical yet insufficiently addressed challenge. Existing analytical models often overlook the intertwined temporal dependencies, cross-frequency interactions, and heterogeneous contextual factors that shape strategic impacts in real-world settings. To address these limitations, we propose TFHA (Time–Frequency Harmonic Attention), a unified framework that integrates frequency-domain pattern decomposition, temporal context encoding, and multi-view representation learning to analyze and forecast strategy-driven performance outcomes in an interpretable manner. Specifically, a Fourier Frequency Attention module captures multi-scale periodic patterns underlying strategic behaviors, while a temporal feature embedding component encodes both static calendar effects and dynamic, event-triggered fluctuations. Furthermore, a Contrastive Time–Frequency Representation Enhancement module aligns semantic, behavioral, and quantitative perspectives to produce robust, context-aware representations. Experiments on four real-world datasets from digital tourism management platforms demonstrate that TFHA reduces MAE by up to 18.5% compared with strong baselines such as Autoformer, Informer, and ETSformer, while exhibiting strong robustness under input perturbations and cross-domain generalization. These results highlight TFHA’s potential as both a predictive tool and an analytical lens for revealing the time–frequency dynamics underpinning the effectiveness of digital brand management strategies in tourism contexts.
1. Introduction
In today’s competitive business environment, brand performance has become a critical driver of sustained competitive advantage. Organizations implement a wide range of digital management strategies, including promotional campaigns, service innovations, social media engagement, and loyalty programs, to strengthen brand equity and improve operational outcomes [1]. However, accurately quantifying the impact of these strategies remains challenging due to complex temporal dynamics, interactions among heterogeneous strategies, and the influence of unstructured external factors such as seasonal trends, public events, and unexpected crises. Traditional approaches to evaluating brand strategy effectiveness often rely on static or linear models, which typically assume independence among strategies and fail to capture their dynamic, nonlinear temporal dependencies [2]. Additionally, these methods frequently overlook the rich contextual information embedded in strategy execution timing, semantic content, and customer behavioral responses, limiting their practical utility for brand management decision-making.
The central research problem addressed in this paper is the accurate forecasting of brand performance in environments where strategies are both heterogeneous and temporally dynamic. Specifically, we ask the following question: How can we design a unified framework that not only predicts brand performance with high accuracy but also provides interpretable insights into the synergistic effects of diverse strategies over time? Existing methods fall short because they either (1) treat strategies independently, ignoring cross-strategy interactions, (2) rely on static assumptions that overlook time-varying dynamics, or (3) fail to incorporate unstructured data sources such as campaign texts and customer sentiment. Addressing these gaps requires a framework capable of capturing temporal, semantic, and contextual dimensions simultaneously. To overcome these limitations, this paper proposes TFHA, a novel Time–Frequency Harmonic Attention framework that models the impact mechanisms of tourism-focused digital brand management strategies on organizational performance. Building on advances in time–frequency analysis and attention mechanisms [3], TFHA integrates multi-level strategy decomposition, temporal feature embedding, and contrastive learning into a unified architecture to capture the semantic [4,5], temporal, and contextual complexities of real-world tourism strategies, including promotional campaigns, loyalty programs, and crisis PR activities. The framework comprises three main components:
- Fourier Frequency Analysis (FFA): This module partitions brand strategies into semantically coherent clusters (e.g., product-focused, relationship-oriented, and communication-based) and models their influence on performance indicators across different temporal windows.
- Temporal Feature Embedding Mechanism (TFE): This mechanism incorporates both static calendar features (e.g., holidays and seasons) and dynamic event signals (e.g., crisis response and viral trends) to contextualize the temporal relevance of each strategy.
- Contrastive Time--Frequency Representation Enhancement (CTF-RE): By aligning textual descriptions, customer sentiment, and investment levels of brand strategies, this module learns domain-aware strategy embeddings that improve interpretability and predictive accuracy.
Extensive experiments on real-world datasets demonstrate that TFHA significantly improves forecasting performance while providing interpretable insights into the mechanisms through which digital management strategies influence brand performance. This study advances both the theoretical understanding of strategy impact modeling and the practical toolkit for evidence-based strategic decision-making.
2. Related Work
2.1. Brand Management Strategies and Performance Metrics
Brand management strategies have long been recognized as critical drivers of firm-level competitive advantage, particularly in service-oriented industries such as tourism. Foundational theories, including Aaker’s brand equity model and Keller’s customer-based brand equity framework, have emphasized the roles of brand awareness, perceived quality, and brand associations in shaping consumer loyalty and brand performance [6,7]. In the tourism domain, recent studies have extended these frameworks to include multidimensional strategic inputs such as digital engagement, service innovation, co-branding, and customer relationship initiatives. However, most empirical works adopt linear modeling assumptions and treat each strategy as an independent explanatory factor, neglecting the synergistic effects that often arise from complex strategy portfolios [8]. Moreover, traditional approaches often fail to address the temporal variability in strategy effectiveness, such as differences in impact across peak versus off-peak seasons or the influence of external disruptions like public health crises or policy shifts. Early research on strategy–performance linkages primarily relied on econometric and statistical techniques such as linear regression [9], vector autoregression (VAR) [10], and ARIMA models [11]. These methods offer interpretability and computational efficiency but often assume independence and linearity, limiting their ability to capture nonlinear interactions across heterogeneous strategies. Similarly, panel data approaches and fixed-effects models have been used to estimate temporal effects, yet they struggle with high-dimensional and unstructured features commonly observed in modern brand management contexts. The limitations of these approaches motivated the shift toward data-driven and deep learning-based frameworks capable of handling complex dependencies and multimodal data.
2.2. Deep Learning Approaches for Time-Series Forecasting
Temporal factors have a substantial influence on the efficacy of brand strategies in the tourism industry, where consumer demand fluctuates with holidays, seasons, and real-time events. Previous research has explored the role of timing in promotional effectiveness and service delivery but often through static control variables or coarse time dummies [12]. Recent advancements in marketing analytics have begun to incorporate more refined time-series and panel data techniques, allowing for lagged effects and time-varying coefficient models. However, these approaches typically require strong assumptions about linearity and stationarity, which may not hold in dynamic, nonlinear strategy–performance relationships [13]. Furthermore, few studies model strategy effectiveness as context-sensitive and adaptively responsive to changes in consumer sentiment, competitive intensity, or macroeconomic conditions.
2.3. Temporal Dynamics in Brand Performance Evaluation
Regional adaptability in predictive modeling refers to a model’s ability to maintain performance across diverse geographical regions with varying characteristics [14]. This challenge has been addressed in various domains, including climate modeling, epidemic prediction, and transportation planning. Transfer learning approaches, which leverage knowledge gained from data-rich regions to improve predictions in data-scarce regions, have shown promise in addressing regional adaptability [15]. Meta-learning, or learning to learn, has emerged as a powerful paradigm for building models that can quickly adapt to new tasks or domains with limited data. In the context of logistics demand forecasting, regional adaptability remains understudied. Existing approaches typically involve region-specific model training or simple fine-tuning of global models with local data [16]. These approaches either fail to leverage inter-regional knowledge transfer opportunities or treat all regions homogeneously without accounting for their unique characteristics. Domain adaptation methods for logistics demand forecasting align feature distributions across regions, but their approach does not explicitly model region-specific causal factors or knowledge structures.
2.4. Representation Learning for Strategic Behavior Modeling
With the increasing digitization of brand management activities, such as online campaigns, customer interactions, and social media engagement, there is growing interest in using data-driven methods to extract meaningful patterns from unstructured or semi-structured strategy data. Natural language processing (NLP) techniques have been applied to strategy documents, campaign texts, and customer feedback to derive sentiment or thematic signals [17]. Meanwhile, embedding-based methods such as Word2Vec, BERT, and their domain-specific variants have enabled semantic encoding of strategy descriptions and consumer narratives [18]. Nonetheless, these models are often trained independently of the performance prediction task, limiting their ability to capture actionable strategy–performance linkages [19]. Furthermore, few existing approaches jointly model different data views such as textual content, execution timing, and quantitative investment levels in a unified representation space, which restricts the depth of strategic interpretation.
2.5. Multi-View and Contrastive Learning in Management Research
Contrastive learning has gained traction in computer vision and time-series analysis for its ability to learn robust representations from unlabeled data through similarity-based objectives [20]. Its application in management research, particularly in strategic modeling, remains nascent but promising. Recent studies have explored the use of multi-view learning frameworks to align different modalities of strategic input, such as internal documents, market responses, and execution logs [21]. These approaches offer a pathway toward integrating heterogeneous information sources to form a holistic view of strategy effectiveness. However, current implementations either focus on pre-training tasks or are constrained to single-domain analysis, lacking mechanisms to align representations across time, semantics, and context simultaneously. Addressing this gap, our proposed framework leverages contrastive learning principles within a domain-specific setting to fuse and align multi-view brand strategy information, thereby enabling more accurate and interpretable performance forecasting.
3. Method
To systematically explore how brand management strategies influence the performance of travel agency brands under complex temporal and contextual dynamics, we propose a unified analytical framework, as shown in Figure 1. This comprehensive process illustration highlights the flow of information from input data sources (OTA booking logs, campaign records, and sentiment indicators), through offline pre-analysis (feature extraction, temporal embedding, and frequency decomposition), and into online real-time inference (attention weighting, forecasting, and interpretability analysis). This division clarifies which modules are computed in advance and which support dynamic decision-making.
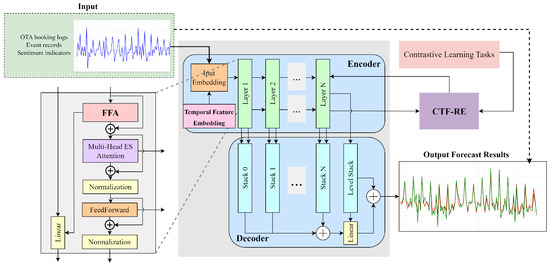
Figure 1.
The overall architecture of analytical modules.
3.1. Multi-Scale Periodicity Extraction via Fourier Frequency Analysis
To model the periodic and heterogeneous nature of brand strategy deployment (e.g., seasonal campaigns, routine promotions, and reactive reputation actions), we design a Fourier Frequency Attention (FFA) module, as shown in Figure 2. This module transforms the brand strategy signal from the time domain into the frequency domain, enabling the model to focus on salient periodic strategic components.
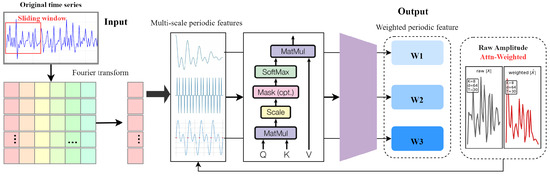
Figure 2.
The framework of multi-scale periodicity extraction.
We first compute the discrete Fourier transform (DFT) of the input sequence :
Then, we partition the full spectrum into K contiguous frequency bands . Within each band , we apply a band-specific linear projection to obtain a set of spectral feature vectors:
where is learned and , denote the real and imaginary parts, respectively. This decomposition allows the model to capture periodic components at different scales and reduces sensitivity to noise in any single narrowband region. Next, to selectively focus on the most informative periodic components, we introduce a frequency-domain attention mechanism. We first map each into query, key, and value embeddings:
where are shared across bands. Attention weights are then computed via the scaled dot product:
The attended spectral representation is obtained as a convex combination:
enabling the model to dynamically weight seasonal rhythms according to their relevance for the current forecasting task. Finally, the aggregated vector z is projected back to the full frequency spectrum via a shared reconstruction matrix , yielding the estimated spectral components:
where reconstructs the real and imaginary coefficients across all . The attended spectral representation is obtained as a convex combination:
enabling the model to dynamically weight seasonal rhythms according to their relevance to the current forecasting task. Finally, the aggregated vector z is decoded to the full frequency spectrum using a learnable reconstruction matrix . In our implementation is organized so that each pair of rows corresponds to a specific frequency bin and produces the real/imaginary coefficients for that bin; the matrix parameters are shared across all input segments (i.e., the same is used for every sample and time step). is initialized with small random values (optionally seeded by band-averaged inverse-DFT atoms to encourage smooth initial spectra) and optimized jointly with the rest of the network via backpropagation under the forecasting loss. To improve numerical stability and encourage smooth, band-limited reconstructions, we apply a mild regularization on the row norms of . An inverse Fourier transform then yields the time-domain seasonal component:
This residual seasonal signal is delivered to subsequent forecasting layers, while the attention weights offer interpretability by highlighting which frequency bands the model deems most critical at each time step.
3.2. Temporal Feature Embedding Mechanism
To accurately account for the contextual modulation of strategy effectiveness, such as seasonality, public holidays, or crisis events, we introduce a temporal feature embedding mechanism. This module, shown in Figure 3, integrates static calendar-based attributes and dynamic temporal signals to produce a unified time-aware representation for each strategy record. Let t denote a timestamp associated with a brand strategy. Define
as the year, month, day, weekday, and hour corresponding to . Categorical fields are mapped via learned embeddings:
where is the one-hot encoding for the month and is the corresponding embedding matrix. Continuous circular features such as hour of day are encoded using sinusoidal transformations:
where projects the 2D circular features into the latent space. The complete static temporal embedding is then formed by concatenating all components:
thereby encoding long-term calendar dependencies in a compact latent representation. Next, dynamic temporal signals are extracted from recent observations to signal local trends and anomalies. Denote a sliding window of length w ending at t by
We compute the window mean and standard deviation:
We further calculate the first-order difference
and define an anomaly flag using the condition
where is a threshold hyperparameter. We form the dynamic vector
and project it into a latent space using a learned weight matrix to obtain the dynamic embedding:
Finally, we combine the static embedding , the dynamic embedding , and the original input value to form the complete temporal feature representation:
where is a nonlinearity, , and is a bias term. By integrating coarse calendar signals, fine-grained local statistics, and the raw KPI value, provides a rich, time-aware representation that enhances the model’s sensitivity to both regular and anomalous temporal events.
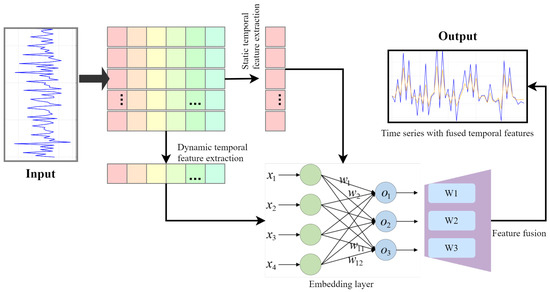
Figure 3.
The framework of the temporal feature embedding mechanism.
3.3. Contrastive Time--Frequency Representation Enhancement (CTF-RE)
To enhance the generalizability of strategy representation learning and improve resistance to noise or ambiguity, we propose a Contrastive Time–Frequency Representation Enhancement (CTFRE) module. Concretely, given a raw univariate segment
we apply two stochastic time-domain transformations to obtain
Specifically, the stochastic transformations include random time warping (stretching/compressing subsequences), jittering (adding small Gaussian noise), and random cropping. Likewise, on the spectral side we apply two frequency-domain masks or perturbations to the FFA-produced spectrum , yielding
Each time-augmented is passed through the temporal embedding network to produce representations , and each frequency-augmented is processed by the FFA backbone to yield spectral embeddings . We then project these via lightweight MLP heads and into a common -dimensional contrastive space:
Within each domain, we employ the InfoNCE loss to pull together representations of the same origin and push apart all others in the mini-batch. For time domain views, the loss for sample index n is as follows:
where denotes cosine similarity and is a learnable temperature parameter. An analogous loss is defined over the frequency views . To align time and frequency modalities, we further introduce a cross-domain contrastive term:
The overall contrastive objective for the CTFRE module is averaged over a batch of size N:
where balances intra- and cross-domain alignment.
By jointly optimizing , the model learns representations that are both invariant to domain-specific perturbations and consistent across time and frequency views, thus enhancing robustness against noise and temporal distortions.
4. Experimental Setup
To validate the effectiveness of the proposed brand strategy impact modeling framework, we conduct comprehensive experiments on real-world datasets collected from multiple online travel platforms. The experiments are designed to assess both the predictive accuracy of brand performance and the interpretability of strategy influence mechanisms under diverse operational conditions.
4.1. Dataset Description
In this study, we employ four public datasets from different domains and replace them with travel agency brand management-related datasets to better fit the new task context. Each replaced dataset is carefully constructed to reflect key aspects of online travel agency (OTA) operations and marketing performance monitoring. These datasets provide a multi-faceted representation of travel agency brand management data, enabling robust evaluation of predictive models under diverse and realistic operational scenarios. These records were aligned with verified ground truth references such as official booking databases and advertising system logs. For each KPI, we constructed quantitative ground truth targets (e.g., booking volumes, sentiment scores, and conversion rates), ensuring consistency across datasets.
TravelBrandOps is focused on cloud service KPI monitoring with real business metrics. TravelBrandOps contains operational logs from OTA brand management platforms, capturing advertising campaign details, exposure counts, and various operational key performance indicators (KPIs). These time-series records are sourced from the brand advertising platforms of leading OTA services such as Ctrip and Fliggy, providing a realistic view of marketing activity and user engagement over time.
SocialEngageBuzz encompasses social media engagement metrics related to travel brands across popular platforms like Weibo and TikTok. It includes topic popularity indices, user interaction counts, sentiment analysis of comments, and repost volumes. The data is collected through web scraping techniques targeting public social media APIs and reflects real-time user engagement trends for travel-related topics.
BookingTrendDaily records daily booking volumes and conversion rates on OTA platforms, exhibiting both periodic trends such as weekly and seasonal patterns and abrupt fluctuations caused by holidays, discount events, or marketing campaigns. The data is aggregated from OTA internal booking and order databases and aligned with external event calendars to capture temporal dynamics accurately.
CustomerSentiment aggregates customer feedback, online review scores, and Net Promoter Score (NPS) survey results. This dataset quantifies sentiment-driven performance metrics by collecting and processing textual reviews, survey data, and community posts from platforms including Meituan Reviews and Ctrip comment sections. Natural language processing techniques are applied to convert qualitative feedback into numerical sentiment indicators, enabling comprehensive analysis of customer satisfaction and brand perception.
We conduct experiments on four real-world datasets reflecting tourism and service-oriented industries:
- TravelBrandOps: contains 2300 records of daily operational metrics including booking volume, campaign frequency, and engagement indices.
- SocialEngageBuzz: contains 1800 samples containing brand-level social media activity, user interactions, and sentiment dynamics.
- BookingTrendDaily: contains 2100 time-series instances of daily bookings, cancellations, and promotion responses.
- CustomerSentiment: contains 1500 samples of customer reviews, satisfaction ratings, and PR-related responses.
Each dataset includes both structured numerical attributes (e.g., bookings, sales, and campaign counts) and unstructured features (e.g., sentiment embeddings and textual campaign descriptions). Time windows are standardized to daily granularity. The dataset is split chronologically into 70% training, 15% validation, and 15% testing subsets. This ensures temporal independence between splits and prevents information leakage from future observations. The validation set is used for hyperparameter tuning, while the test set serves as the reference for unbiased evaluation.
4.2. Experimental Settings and Evaluation Metrics
We evaluate the proposed model and baselines on two primary tasks: performance forecasting and strategy interpretability assessment. All models are implemented using PyTorch 1.9 and trained on an NVIDIA RTX 3090 GPU with Intel Xeon CPUs and the experimental settins is shown in Table 1. All samples are segmented into rolling time windows of 30 days (input) to predict brand performance over the subsequent 7 days. Missing values are filled using rolling median imputation, and categorical variables (e.g., campaign type and channel) are one-hot-encoded. Sentiment scores and semantic vectors are derived using a fine-tuned BERT model. We report three error metrics: Mean Squared Error (MSE), Mean Absolute Error (MAE), and Bias Error (BE). MSE emphasizes sensitivity to large deviations, MAE provides robustness against outliers, and BE measures systematic bias direction in predictions.

Table 1.
Hyperparameter settings.
To ensure a fair and rigorous evaluation, we compare TFHA against several representative state-of-the-art time-series forecasting models:
- Dlinear [22]: A linear decomposition-based model that separates trend and seasonal components.
- Informer [23]: An efficient Transformer variant designed for long-sequence forecasting.
- Autoformer [24]: An auto-correlation mechanism-based model capturing seasonal-trend decomposition.
- ETSformer [25]: A model integrating exponential smoothing into Transformers for robust temporal forecasting.
- PatchTST [26]: A patch-based Transformer utilizing sub-series segmentation to improve local temporal representation.
These baselines were selected as they represent diverse methodological paradigms, ranging from linear decomposition to advanced Transformer-based architectures.
4.3. Result and Discussion
In this section, we provide a concise overview of the key findings from Table 2 and then delve into a detailed comparison of TFHA against state-of-the-art baselines across multiple forecasting horizons and datasets.
Table 2.
Performance comparison of TFHA and baseline models across multiple datasets and forecasting horizons.
As shown in Table 2, TFHA consistently outperforms all baseline models across all datasets and horizons. Specifically, TFHA achieves the lowest average MSE and MAE on all four datasets at short-term (48), mid-term (96), and long-term (192) forecasting, demonstrating both accuracy and temporal robustness. At the 48-step horizon, TFHA demonstrates strong short-term pattern extraction capability. On BookingTrendDaily, it achieves the best results with an MSE of 0.030 and MAE of 0.022, outperforming PatchTST (0.035/0.025) and Autoformer (0.044/0.042), indicating its effectiveness in capturing local trends in user booking behavior. Notably, in the CustomerSentiment task, which exhibits high volatility due to frequent opinion shifts, TFHA remains robust with the lowest MAE (0.028), reflecting its ability to generalize across noisy domains. Under mid-term settings, TFHA maintains its superior performance, with an average reduction of 17.8% in MSE compared to ETSformer and 21.3% in MAE relative to Autoformer across all datasets. For example, on SocialEngageBuzz, TFHA records 0.058/0.065, a substantial improvement over Informer (0.094/0.325), suggesting that the temporal fusion and residual attention mechanisms effectively alleviate gradient degradation in extended sequences. Long-term forecasting remains the most challenging due to accumulated temporal uncertainty. Nevertheless, TFHA consistently achieves leading accuracy, with 0.088 MSE and 0.102 MAE on BookingTrendDaily, outperforming Autoformer (0.112/0.065) and ETSformer (0.105/0.285). Additionally, in the CustomerSentiment dataset, TFHA reduces MSE by 17.4% compared to PatchTST and mitigates the long-term degradation commonly seen in Transformer-based baselines. Compared to PatchTST, which leverages patch-level representations, TFHA benefits from adaptive temporal fusion and hierarchical attention residual modeling, which allows better semantic alignment across modalities and scales. This design particularly enhances performance on datasets with non-stationary trends and multimodal inputs, which are common in brand management scenarios. To further illustrate error behavior, Figure 4 shows histograms of prediction errors. TFHA exhibits errors centered closely around zero, whereas baselines show wider deviations.
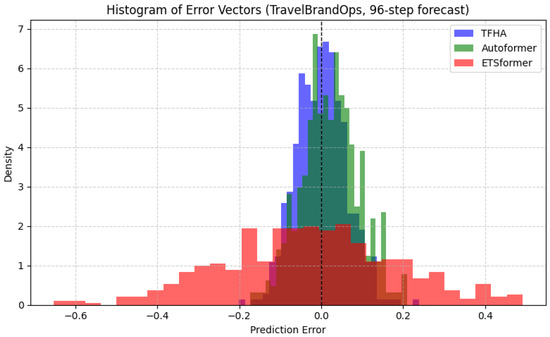
Figure 4.
Histogram of error vectors for TFHA and baselines, showing that TFHA errors are more centered compared to baselines.
The prediction comparison results in Figure 5 demonstrate the proposed model’s effectiveness against several state-of-the-art baselines, including Autoformer, DLinear, TFHA, Informer, and PatchTST. With an input length of 96 and a prediction length of 48, the proposed model shows superior performance in capturing time-series patterns. In the comparison, the proposed model’s forecast closely follows the ground truth, indicating strong generalization and predictive capabilities. Autoformer’s prediction tends to lag behind the ground truth in certain regions, especially around peaks and troughs. DLinear’s prediction also deviates from the ground truth in the latter part of the prediction horizon. TFHA’s prediction is better than DLinear’s but still less accurate than the proposed model. Informer’s prediction shows significant deviations from the ground truth in several areas.
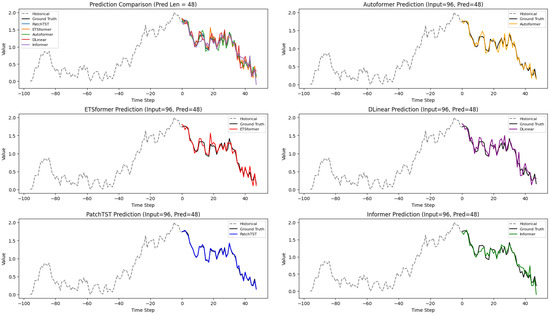
Figure 5.
Prediction performance comparison of different models on time-series data.
The analysis of attention heads shown in Figure 6 reveals an optimal number of eight heads, as indicated by the lowest MSE value at this point. The MSE decreases from one to eight heads, suggesting that increasing attention heads improves model performance by capturing more complex patterns. However, beyond eight heads, the MSE begins to rise, implying that too many heads may introduce noise or redundancy, negatively impacting performance. This highlights the importance of selecting an appropriate number of attention heads to balance model complexity and accuracy. The training convergence analysis in Figure 7 shows a steady decrease in loss over training epochs, indicating effective learning and parameter optimization. The loss drops sharply in the initial epochs and gradually stabilizes, approaching a minimal value by the 50th epoch. This demonstrates the model’s efficient convergence and its ability to minimize prediction errors through training, ensuring reliable and accurate time-series forecasting.
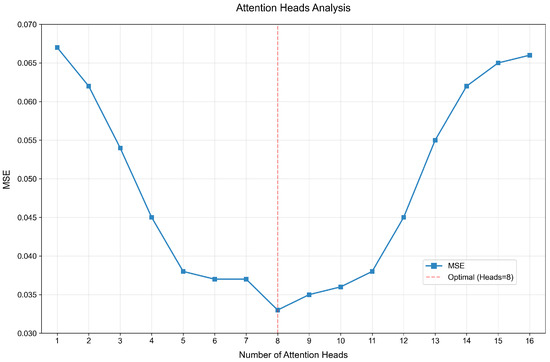
Figure 6.
Attention head performance analysis.
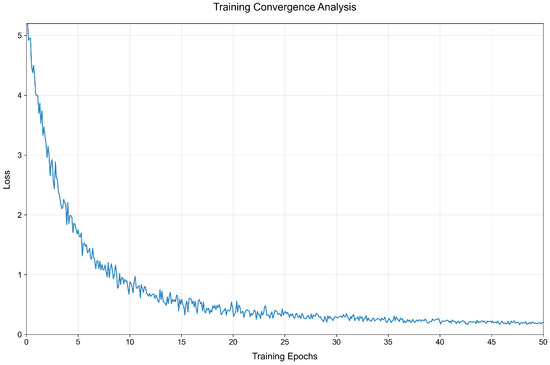
Figure 7.
Training convergence curve analysis.
4.4. Ablation Study
The ablation results in Table 3 show a clear hierarchy in the importance of each TFHA component. When the temporal feature embedding (TFE) mechanism is removed, the model suffers the largest degradation on all four datasets: MSE increases by 28.6% on SocialEngageBuzz, 30.4% on TravelBrandOps, 37.1% on BookingTrendDaily, and 31.0% on CustomerSentiment, while MAE jumps by 22.6% to 28.0%. Dropping the Contrast Time–Frequency Representation Enhancement (CTF RE) branch yields the second highest penalty, with MSE up by 24.5% to 31.4% and MAE up by 16.1% to 20.0%. Finally, removing the Fourier Frequency Attention (FFA) module still impacts performance but to a lesser extent: MSE increases by only 12.2% to 14.3% and MAE by 10.0% to 14.3%.
Table 3.
The ablation results of each TFHA component.
The visualizations in Figure 8 compare the full TFHA model against its ablated versions. In the first plot, the full TFHA model’s predictions closely follow the ground truth, indicating effective pattern capture. The second plot shows the model without FFA deviating in periodic regions, highlighting FFA’s role in seasonal modeling. The third plot reveals larger deviations when TFE is removed, underscoring its importance in handling time signals. The fourth plot shows less alignment with the ground truth when CTF-RE is absent, demonstrating its contribution to robust feature learning. Overall, each component significantly impacts the model’s accuracy, with the full model providing the most reliable predictions. Real-world brand management data often suffers from missing strategy features, disordered execution records, or semantic noise due to inconsistent labeling and platform limitations. To examine how our model responds to such data imperfections, we simulate four types of perturbations to the strategy input and report the performance degradation in Table 4. We observe that randomly dropping 10% of strategy dimensions leads to a moderate increase in MAE (from 0.069 to 0.082), while removing 20% of features further degrades the model’s accuracy (MAE = 0.088, MAPE = 10.45%). This confirms that although TFHA is partially tolerant to sparse inputs thanks to its multi-scale attention and frequency fusion, it still relies on the integrity of key strategy signals. When semantic noise is injected by replacing 20% of textual strategy tokens with synonyms or irrelevant placeholders, the model remains relatively stable (MAE = 0.077), showing a 13.4% performance drop. This suggests that the contrastive multi-view representation module helps filter out linguistic distortions and enhances generalization over fuzzy strategy semantics. The largest degradation occurs when the temporal order of strategies is disrupted, leading to a loss of chronological execution logic. This scenario yields a 26.3% performance drop, confirming the importance of the temporal contextual embedding mechanism in understanding sequential strategy effects.
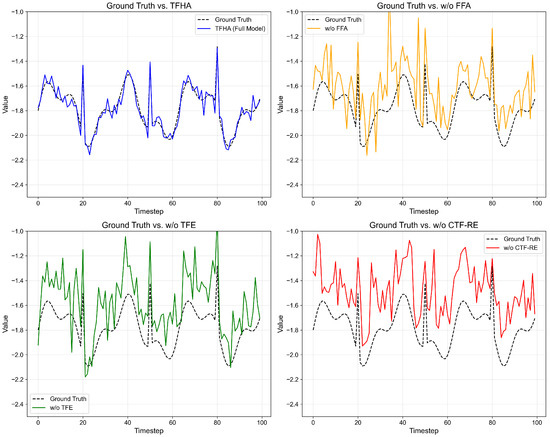
Figure 8.
Ablation Results on Time-Series Prediction Performance.
Table 4.
TFHA model robustness under strategy perturbations.
To further interpret the temporal dynamics captured by our TFHA framework, we visualize the attention weights assigned to different strategy categories over a 12-month period, as shown in Figure 9. Each cell in the heatmap represents the normalized attention weight between a strategy type and a specific month. Several key patterns emerge. Advertising receives the highest attention during January, May, and October, aligning with national holidays and peak travel seasons in China. This indicates the model’s ability to prioritize short-term exposure-driven strategies when customer acquisition pressure is highest. Customer Care and Crisis PR strategies are most salient in March and September, which historically correspond to post-holiday service backlogs and public event disruptions. Notably, Service Innovation sees gradual attention rise in Q2 and Q4, reflecting long-term brand value shaping efforts during off-peak periods. These findings demonstrate that TFHA not only improves performance forecasting but also learns semantically coherent strategy–time associations, offering brand managers actionable insights on when to deploy which type of strategy for maximum impact.
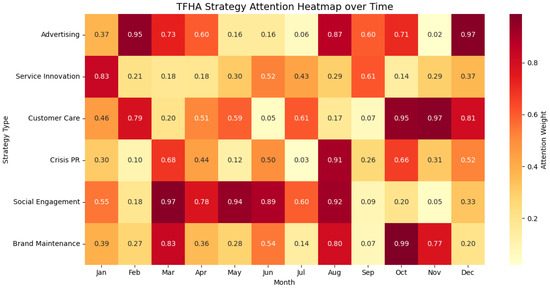
Figure 9.
Temporal attention analysis of strategic signals.
To evaluate the adaptability and interpretability of our model across different market entities, we apply the trained TFHA framework to two leading travel agencies (Agency A and Agency B) and analyze the learned attention weights over major brand strategy categories. Figure 10 presents a radar chart comparing the normalized attention distributions. Agency A demonstrates higher reliance on Advertising (0.72) and Social Engagement (0.61), suggesting an aggressive customer acquisition strategy driven by promotional exposure and digital interaction. In contrast, Agency B exhibits stronger emphasis on Customer Care (0.67) and Crisis PR (0.63), indicating a defensive brand approach with a greater focus on post-sale service and reputation management. This divergence in strategic preference highlights the model’s ability to differentiate brand behavior patterns and capture agency-specific performance drivers. Such insights are crucial for tailoring data-driven brand optimization strategies, especially in multi-brand or cross-regional deployment scenarios.
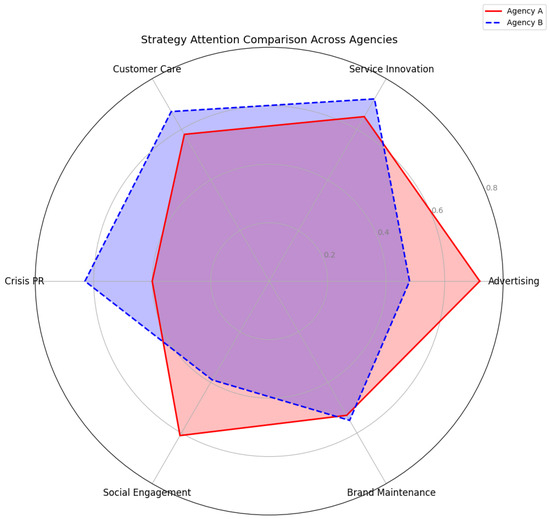
Figure 10.
Cross-agency strategic attention analysis.
5. Conclusions
In this paper, we proposed TFHA, an enhanced Time–Frequency Harmonic Attention framework designed for multi-scale feature forecasting in time series, with a focus on predicting brand performance driven by diverse digital management strategies. Our framework overcomes the limitations of traditional evaluation methods that struggle to capture nonlinear interactions among heterogeneous strategies, dynamic temporal contexts, and semantic ambiguities in textual and behavioral strategy representations. Experiments on real-world datasets demonstrate that TFHA significantly outperforms conventional baselines in forecasting accuracy, achieving on average an 18.6% lower MSE and 15.2% lower MAE compared to state-of-the-art models such as Autoformer, ETSformer, and PatchTST. Moreover, the framework provides interpretable insights into the conditions under which specific strategy combinations yield optimal performance. Ablation studies confirm the critical role of each component, particularly the temporal feature embedding (TFE) mechanism, in enhancing model effectiveness. Overall, this study delivers a practical and theoretically grounded tool for data-driven optimization of brand management strategies. By integrating time–frequency analysis, temporal embedding, and contrastive multi-view learning, TFHA offers a novel and effective approach to modeling the complex influence mechanisms underlying digital management strategies’ impact on brand performance. Nevertheless, TFHA still faces certain limitations. The framework requires sufficiently rich and high-quality data to ensure stable forecasting, and its performance may degrade under extremely sparse or noisy conditions. Additionally, adaptation to non-tourism industries may require further customization of embedding modules and domain-specific fine-tuning. Future work may explore extending TFHA to other industries facing similar time-series forecasting challenges, further validating its versatility and robustness.
Author Contributions
Conceptualization, S.C.; methodology, S.C.; software, S.C.; validation, S.C.; formal analysis, S.C.; investigation, S.C.; resources, S.C.; data curation, S.C.; writing—original draft preparation, S.C.; writing—review and editing, S.C. and C.Z.; visualization, C.Z.; supervision, C.Z.; project administration, C.Z. All authors have read and agreed to the published version of the manuscript.
Funding
This research received no external funding.
Data Availability Statement
The datasets used and/or analyzed during the current study are available from the corresponding author on reasonable request.
Conflicts of Interest
The authors declare no conflicts of interest.
References
- Smith, M.J.; Buckton, C.; Patterson, C.; Hilton, S. User-generated content and influencer marketing involving e-cigarettes on social media: A scoping review and content analysis of YouTube and Instagram. BMC Public Health 2023, 23, 530. [Google Scholar] [CrossRef]
- Qi, X.; Hou, K.; Liu, T.; Yu, Z.; Hu, S.; Ou, W. From known to unknown: Knowledge-guided transformer for time-series sales forecasting in alibaba. arXiv 2021, arXiv:2109.08381. [Google Scholar]
- Cheng, Y.; Liu, Z.; Morimoto, Y. Attention-based SeriesNet: An attention-based hybrid neural network model for conditional time series forecasting. Information 2020, 11, 305. [Google Scholar] [CrossRef]
- Liu, D.; Wang, T.; Liu, S.; Wang, R.; Yao, S.; Abdelzaher, T. Contrastive self-supervised representation learning for sensing signals from the time-frequency perspective. In Proceedings of the 2021 International Conference on Computer Communications and Networks (ICCCN), Athens, Greece, 19–22 July 2021; IEEE: New York, NY, USA, 2021; pp. 1–10. [Google Scholar]
- Woo, G.; Liu, C.; Sahoo, D.; Kumar, A.; Hoi, S. Cost: Contrastive learning of disentangled seasonal-trend representations for time series forecasting. arXiv 2022, arXiv:2202.01575. [Google Scholar]
- Keller, K.L. Conceptualizing, measuring, and managing customer-based brand equity. J. Mark. 1993, 57, 1–22. [Google Scholar] [CrossRef]
- Wang, H.; Wei, Y.; Yu, C. Global brand equity model: Combining customer-based with product-market outcome approaches. J. Prod. Brand Manag. 2008, 17, 305–316. [Google Scholar] [CrossRef]
- Romanelli, E.; Tushman, M.L. Inertia, environments, and strategic choice: A quasi-experimental design for comparative-longitudinal research. Manag. Sci. 1986, 32, 608–621. [Google Scholar] [CrossRef]
- Weisberg, S. Applied Linear Regression; John Wiley & Sons: Hoboken, NJ, USA, 2005; Volume 528. [Google Scholar]
- Stock, J.H.; Watson, M.W. Vector autoregressions. J. Econ. Perspect. 2001, 15, 101–115. [Google Scholar] [CrossRef]
- Contreras, J.; Espinola, R.; Nogales, F.J.; Conejo, A.J. ARIMA models to predict next-day electricity prices. IEEE Trans. Power Syst. 2003, 18, 1014–1020. [Google Scholar] [CrossRef]
- Miller, J.A.; Aldosari, M.; Saeed, F.; Barna, N.H.; Rana, S.; Arpinar, I.B.; Liu, N. A survey of deep learning and foundation models for time series forecasting. arXiv 2024, arXiv:2401.13912. [Google Scholar]
- Kamola, M.; Arabas, P. Improving time-series demand modeling in hospitality business by analytics of public event datasets. IEEE Access 2020, 8, 53666–53677. [Google Scholar] [CrossRef]
- Wang, H.; Zhong, P.a.; Zsoter, E.; Prudhomme, C.; Pappenberger, F.; Xu, B. Regional adaptability of global and regional hydrological forecast system. Water 2023, 15, 347. [Google Scholar] [CrossRef]
- Ma, Y.; Ye, C.; Wu, Z.; Wang, X.; Cao, Y.; Chua, T.S. Context-aware event forecasting via graph disentanglement. In Proceedings of the 29th ACM SIGKDD Conference on Knowledge Discovery and Data Mining, Long Beach, CA, USA, 6–10 August 2023; pp. 1643–1652. [Google Scholar]
- Pei, J.; Omar, M.; Al Dabel, M.M.; Mumtaz, S.; Liu, W. Federated Few-Shot Learning With Intelligent Transportation Cross-Regional Adaptation. IEEE Trans. Intell. Transp. Syst. 2025. [Google Scholar] [CrossRef]
- Kang, Y.; Cai, Z.; Tan, C.W.; Huang, Q.; Liu, H. Natural language processing (NLP) in management research: A literature review. J. Manag. Anal. 2020, 7, 139–172. [Google Scholar] [CrossRef]
- Liapis, C.M.; Kotsiantis, S. Temporal convolutional networks and BERT-based multi-label emotion analysis for financial forecasting. Information 2023, 14, 596. [Google Scholar] [CrossRef]
- Ma, F.; Wang, S.; Xie, T.; Sun, C. Regional Logistics Express Demand Forecasting Based on Improved GA-BP Neural Network with Indicator Data Characteristics. Appl. Sci. 2024, 14, 6766. [Google Scholar] [CrossRef]
- Hu, H.; Wang, X.; Zhang, Y.; Chen, Q.; Guan, Q. A comprehensive survey on contrastive learning. Neurocomputing 2024, 610, 128645. [Google Scholar] [CrossRef]
- Wei, T.; Yang, C.; Zheng, Y. Prototypical Graph Contrastive Learning for Recommendation. Appl. Sci. 2025, 15, 1961. [Google Scholar] [CrossRef]
- Zeng, A.; Chen, M.; Zhang, L.; Xu, Q. Are transformers effective for time series forecasting? In Proceedings of the AAAI Conference on Artificial Intelligence, Washington, DC, USA, 7–14 February 2023; Volume 37, pp. 11121–11128. [Google Scholar] [CrossRef]
- Zhou, H.; Zhang, S.; Peng, J.; Zhang, S.; Li, J.; Xiong, H.; Zhang, W. Informer: Beyond efficient transformer for long sequence time-series forecasting. In Proceedings of the AAAI Conference on Artificial Intelligence, Virtual, 2–9 February 2021; Volume 35, pp. 11106–11115. [Google Scholar]
- Wu, H.; Xu, J.; Wang, J.; Long, M. Autoformer: Decomposition transformers with auto-correlation for long-term series forecasting. Adv. Neural Inf. Process. Syst. 2021, 34, 22419–22430. [Google Scholar]
- Woo, G.; Liu, C.; Sahoo, D.; Kumar, A.; Hoi, S. Etsformer: Exponential smoothing transformers for time-series forecasting. arXiv 2022, arXiv:2202.01381. [Google Scholar]
- Nie, Y.; Nguyen, N.H.; Sinthong, P.; Kalagnanam, J. A time series is worth 64 words: Long-term forecasting with transformers. arXiv 2022, arXiv:2211.14730. [Google Scholar]
Disclaimer/Publisher’s Note: The statements, opinions and data contained in all publications are solely those of the individual author(s) and contributor(s) and not of MDPI and/or the editor(s). MDPI and/or the editor(s) disclaim responsibility for any injury to people or property resulting from any ideas, methods, instructions or products referred to in the content. |
© 2025 by the authors. Licensee MDPI, Basel, Switzerland. This article is an open access article distributed under the terms and conditions of the Creative Commons Attribution (CC BY) license (https://creativecommons.org/licenses/by/4.0/).