Abstract
Tunnel drilling and blasting will cause large vibrations in the surrounding rock and structures. This vibration effect weakens the rock, greatly threatening the surrounding rock’s structural integrity and the safety of tunnel construction. Based on an analysis of the status quo of rock blasting, this study performs on-site monitoring of blasting vibration and examines the characteristics of the vibration velocity in the tunnel’s surrounding rock. A load-time history diagram is used to establish a three-dimensional numerical model of the tunnel to analyze the distribution characteristics of the vibration velocity. The applicability of the model is verified by field monitoring data. The simulation revealed a maximum vertical vibration velocity of 48.6 cm/s near the blast source. The response of the rock mass to the blasting load is analyzed at each key position, and the particle vibration velocity law is studied. On this basis, the corresponding Sadovsky formula is thus derived, which can be used to determine the site coefficient, K, and the attenuation exponent, α (with values ranging from 1.268 at the arch waist to 1.594 at the vault and invert), and to predict the vibration velocity in the far blasting area. The maximum charge dose and safety distance are derived under different control standards based on these data. For a control standard of 15 cm/s and a maximum charge of 20 kg, the required safety distance was determined to be 11.8 m. The findings can contribute to blasting scheme design and enhance the security management of construction sites.
1. Introduction
Rock blasting uses blast waves, stress waves, and blast gas to fracture or damage a structure. The resulting blasting area can be divided into the blasting zone, the near and far zones, the crushed zone, the fracture zone, and the vibration zone, among which the fracture zone presents the main part of failure in the blasting construction of an engineering rock mass [1]. The cracks in this zone substantially reduce the load-bearing capacity of the rock mass to a capacity that no longer satisfies the load-bearing requirements in engineering construction. Although no obvious macroscopic fractures are found in the vibration zone around the rupture zone under the action of dynamic stress, the mechanical properties of the rock deteriorate to a certain extent while its bearing capacity decreases. In blasting construction, the mechanism of the explosion load on the rock mass and the resulting rock mass fractures have received the attention of many scholars at home and abroad [2,3,4]. For instance, Song and Kim [5] studied a model rock fracture process under the action of explosion based on Newton’s second law, Minchinton and Lynch [6] studied the rock-breaking process and movement due to explosive gas, and Li et al. [7,8] studied the dynamic mechanical properties of rock samples under the influence of the two aforementioned factors from the aspects of loading rate and confining pressure. Huang et al. [9] used the wave wavelet packet method to study the characteristics of blasting seismic waves, such as frequency distribution characteristics of blasting seismic wave and blasting energy distribution. Man et al. [10] found that the blast energy distribution of single-wedge and double-wedge cutting is more uniform, mainly concentrated in the high-frequency part, while the blast energy of straight parallel hole cutting is more concentrated in the low-frequency part.
The propagation characteristics and attenuation laws of blasting vibration in a rock mass are extremely complex, while the dynamic response of a rock mass under blasting vibration is also difficult to predict. Scholars have adopted various methods to examine these problems. Numerical simulation tools, such as FLAC (v1994) [11], ANSYS (v2024) [12], ABAQUS (v2024) [13], and the boundary element model [14], have been widely adopted to model blasting vibrations due to their capabilities in handling wave propagation and structural dynamics. However, these studies often rely on simplified load models or lack validation through detailed field monitoring. In contrast, our study utilizes MIDAS/GTS NX to develop a high-resolution 3D model calibrated with on-site vibration data, enabling a more accurate analysis of vibration distribution and the derivation of site-specific safety criteria. Many research studies have used blast vibration wave velocity and signal to analyze the blasting vibration effect [15,16,17]. For example, Shen et al. [18] statistically analyzed the test blasting vibration data collected from the New Liujiagou tunnel and found that the vibration velocity and amplitude of the resultant particles increases and decreases with increasing blasting center distance, respectively. Lu et al. [19] examined the longitudinal wave as a research object and used the wave function expansion method to deduce an analytical solution for the dynamic response of the composite lining tunnel in an infinite elastic medium under the action of a seismic wave induced by blasting.
The peak values of the displacement, velocity, and acceleration of particle vibration are important indices for measuring blasting vibration intensity. Given the dynamic nature of blasting earthquake action, both the maximum acceleration and maximum velocity have been widely used in blasting engineering applications. Many studies have revealed a positive correlation between the damage degree of the blasting earthquake and the magnitude of the vibration velocity. The vibration vectors of rock and soil media are obtained from the sum of the perpendicular, horizontal, and tangential vibration vectors. The largest component vector, often the vertical vibration velocity of the particle, is generally adopted as a judgment standard [20]. Shao et al. and Li et al. [21,22] quantitatively studied the influence of different delay times (ms) on the dynamic response of the tunnel lining and determined a reasonable blasting delay time based on the safety criterion for the particle vibration speed. Ak et al. [23] proposed prediction graphics of maximum charge weight per delay versus distance for different damage criteria to be able to perform controlled blasting in order to not damage the nearby structures.
An empirical formula derived from measured engineering blasting data can be used to calculate the velocity of blasting vibration. Many researchers (J.R. Devine from the American Mining Bureau [24] and P.B. Attewel et al. [25]) have collected test data and derived their own formulas for calculating such a velocity. For instance, Sadovsky’s formula has been modified in many blasting projects across China based on their respective conditions [26]. These formulas show that the blasting vibration velocity, V, is related to the loading capacity, Q; the blast source distance, R; and site coefficients, K and α. In specific projects, the value of K is selected based on the geological conditions of the site and the adopted blasting method to predict the peak vibration at different distances from the explosion source.
According to the safety regulations for blasting (GB6722-2014) [27], the vibration of the buildings, rock, and soil within the vicinity of the explosion source must be monitored, the vibration intensity of the particles must be strictly controlled, and damage of the blasting vibration to the buildings (structure), rock, and soil must be prevented during excavation and blasting construction. Moreover, the blasting operation must be suspended when the particle vibration velocity exceeds the allowable value, and the blasting dosage and safe distance must be determined through a blasting test.
This study conducts a blasting vibration test during the upper step excavation of the Xiaobeishan No. 1 Tunnel, where semi-theoretical and semi-empirical blasting load pressure derived from a specified time history curve is applied to the blast hole wall or excavation contour surface. The primary objective of this study is to numerically investigate the dynamic response characteristics of a mountain tunnel under blasting vibration and to provide quantitative predictions for vibration control, so it employs MIDAS/GTS NX (v2018) software for high-fidelity 3D numerical simulations to analyze the tunnel’s dynamic response under blasting action and compare experimental with simulated data. Given the gap in the existing extensive blasting vibration research—specifically, the lack of quantitative prediction for detailed vibration velocity distribution around the entire tunnel profile (including the vault, arch waist, and invert) and direct linkage of findings to site-specific safety criteria for mountain tunnel construction—this study innovatively integrates detailed field monitoring with the aforementioned 3D numerical simulation to explore the effects of blasting vibration on the vibration velocity–time history curve, vertical vibration velocity, axial distribution of vibration velocity, and distribution law of peak vibration velocity, with the core novelty lying in deriving and validating site-specific coefficients for Sadovsky’s vibration formula based on simulated data to accurately predict far-field vibration velocity induced by blasting and determine the maximum charge dosage and safety distances required to meet different control standards, ultimately providing practical, quantitative support for blasting scheme design and contributing to enhancing construction site safety management.
2. Blast Vibration Test in the Xiaobeishan No. 1 Tunnel
The Xiaobeishan No. 1 tunnel is located along Guangdong Highway, which extends from Jieyang to Huilai. This tunnel is located in a hilly gully region and has a ground elevation of approximately 50 m to 420 m, a relative difference of approximately 370 m. The tunnel crosses the east–west ridge tunnel in the north–south direction, a topographically undulating mountainous area. The tunneling area is primarily Yanshan-period granite and diabase dikes; the covering layer comprises clay and completely or strongly weathered rocks, and the bedrock comprises medium-sized or very small weathered rock fragments. The surrounding rocks, arch gate, and lower steps of the tunnel are formed using step method excavation, seismic smooth blasting, and one-time blasting construction, respectively.
Blasting vibration is closely related to the greatest explosive charge. Nonelectric millisecond blasting technology can effectively control the initial dosage and initiation time of each grade detonator, avoid the superposition of the blasting vibration waveform, and fracture rock to achieve an ideal effect, which includes preventing harmful effects of blasting vibration. The upper step and cut-hole of the tunnel have depths of 1.5 m and 1.7 m, respectively; furthermore, the cut-hole is made by a triangular arrangement of three straight hollow holes.
The blasting parameters and hole layout in the upper step excavation of the tunnel are given in Table 1 and Figure 1, respectively. The location of the three holes is marked as a triangle in Figure 1. The nonelectric millisecond detonator has the same time delay for each segment, thereby indicating that the order of the segments is the order of the initial blasting.

Table 1.
Blasting paraments in the upper step excavation.
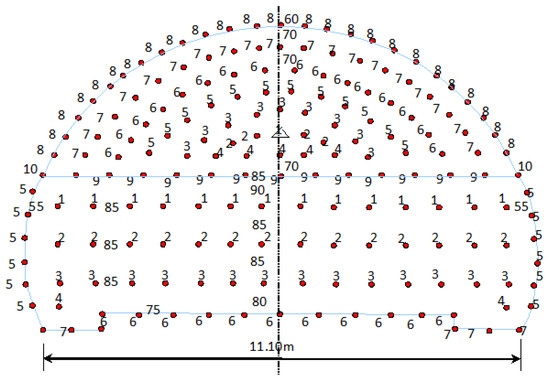
Figure 1.
Hole layout in the upper step of the Xiaobeishan No. 1 tunnel.
The TC-4850 blasting vibration meter (manufactured by the Chengdu Zhongke Test Company, affiliated with the Chinese Academy of Sciences (CAS), and purchased in Wuhan, China) is used in the blast vibration experiment. Each meter has three channels and a configurable three-vector speed sensor. Channels x, y, and z correspond to the tunnel axis, the vertical axis, and the horizontal tangent, respectively. The adopted meter can record either the one-way blasting vibration at three measurement points or record the three vibration components at one measurement point. The meter also has a liquid crystal display that can show all the collection parameters, including the waveform, peak, and frequency, as soon as they are measured. This tool can also be connected to a computer to transfer data that can be analyzed using special software.
The sensor is closely connected to the surface of the measuring point and bonded to the surface or sidewall with a plaster to record the overall vibration and to ensure the accuracy of the test results. Upon installing the sensor, the loose surface is removed, and the surface flatness is measured. Figure 2 shows a three-vector speed sensor that is connected to the host by a data line.
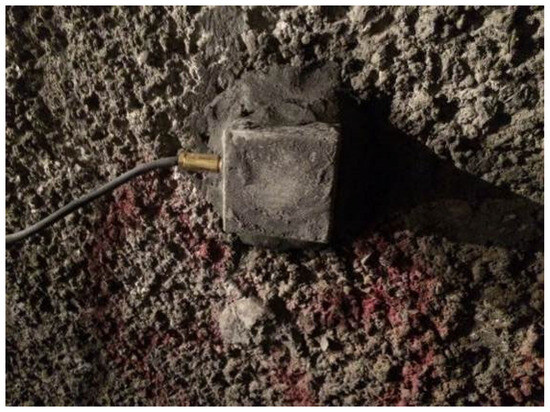
Figure 2.
Sensor bonded to the lining of the tunnel.
3. Drilling and Blasting Simulation
3.1. Methodology
Flowchart of the integrated research methodology is shown in Figure 3. The research integrates field monitoring with numerical simulation. The process begins with the acquisition of field blast design and vibration data, which inform the theoretical blasting load model. This load is then applied in a meticulously calibrated 3D finite element model. The simulation results are validated against field data before being analyzed to extract key vibration patterns. Finally, the data are used to derive a site-specific empirical formula for predicting vibrations and establishing safety criteria.
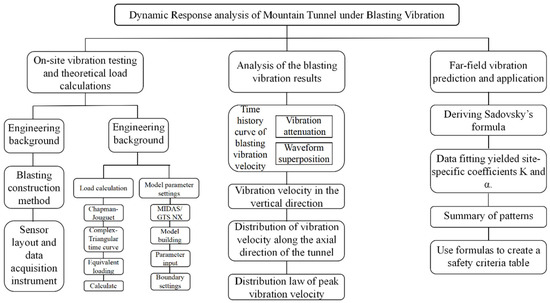
Figure 3.
Flowchart of the integrated research methodology.
3.2. Load Calculation
The blasting vibration load is usually applied with a semitheoretical, semiempirical blasting load pressure–time history curve on the blast hole wall or the excavation contour surface. This load curve can create a detonation wave to calculate the expansion of the explosion in the cavity. The blasting vibration can be numerically simulated using feasible and accurate methods for simplifying and equilibrating the blasting load.
3.2.1. Explosive Load
Following a strong explosion, the zone near the explosion area shows complex changes, such as the propagation of compression waves, the occurrence of plastic deformation, the destruction of the medium, and the formation of explosive cavities. Based on the degree of damage, the rock mass surrounding the blast hole can be divided into the crushing zone, the fracture zone, and the elastic vibration zone.
Based on the results of a theoretical analysis and numerical simulation, a blasting load–time history curve is plotted [28,29], as shown in Figure 4. The blasting load–time history curve is simplified as a triangular load, where denotes the peak value of the blasting load, denotes the blasting load loading time, and denotes the blasting load positive pressure action time.
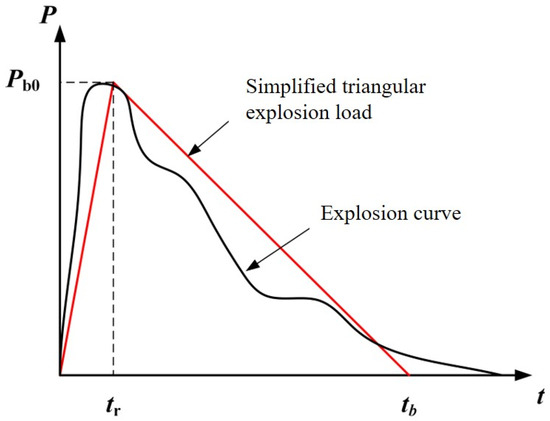
Figure 4.
Time history diagram of the explosion load.
According to the Chapman–Jouguet theory of condensed explosive detonation, the peak blast hole blasting load, under coupled charge conditions can be computed as follows:
Meanwhile, the initial shockwave peak pressure from the radial and axial uncoupled charge at the hole wall during tunneling of the peripheral holes is computed as follows:
where is the peak blasting load of the uncoupled charge, is the peak blasting load of the coupled charge, is the charge diameter, is the blast hole diameter, is the charge length, is the blast hole length, is the explosive density, D is explosive detonation, and is the entropic coefficient of the explosives, which is generally 3.0.
To determine the elastic constitutive relation based on continuum mechanics, the entire inelastic zone (including the crushing and broken zones) must be equivalent to the explosion source zone, while the blasting load must be applied to the equivalent elastic boundary. The radius of the crushing zone is 3 to 5 times larger than that of the charge under the columnar charge condition, while the radius of the crushing zone is 10 to 15 times larger than the radius of the charge [30].
For the cut-hole of the group hole detonation, the blasting load equivalent to the elastic boundary is calculated as follows:
where k is the load influence coefficient of the group hole detonation, which is related to the number of holes and the distribution of the blast holes; r0 is the hole radius; r1 is the crushing zone radius; r2 is the broken zone radius; and is Poisson’s ratio of the rock.
Without a cutting hole, the blasting load on the blast hole wall of the circular tunnel must have the same centerline and axis as the tunnel. For blasting without cutting, the blasting load of only the residual part of the blast hole is transmitted to the surrounding rocks. Half of the circumference of the blast hole formed without cutting is considered in the following equation:
where n is the number of holes formed without cutting, is the blast radius formed without a cutting hole, is the perimeter of the equivalent elastic boundary enclosed without a cutting hole, and is the load peak of a single blast hole.
The equivalent load on the equivalent elastic boundary of each segment is attenuated in the tunnel profile of each excavation step. According to the law of stress wave attenuation, the load on the equivalent elastic boundary is attenuated by the propagation distance and then applied to the tunnel contour surface to obtain the final equivalent load. Following an explosion in the rock, the attenuation driven by geometric attenuation and energy loss increases with the propagation distance of the stress wave, while the peak stress continuously decreases. Therefore, when the equivalent load is attenuated from the equivalent elastic boundary to the tunnel excavation profile, the relationship can be expressed as follows:
where is the equivalent peak load on the excavation contour, is the equivalent peak load on the elastic boundary, is the radius of the tunnel excavation profile, is the radius of the equivalent elastic boundary, is the ratio in the two aforementioned radii, and is the stress decay index.
The empirical relationship between the stress decay index and Poisson’s ratio can be expressed as follows [31]:
where is Poisson’s ratio of the surrounding rock, is the equivalent elastic boundary radius, and is the equivalent elastic boundary (or tunnel profile) cross-sectional area.
The blasting load loading and unloading times are calculated using the following empirical formulas for the triangular explosive load boosting time and positive pressure time [32]:
where is the loading time, is the unloading time, K is the volumetric compressive modulus of the rock, is Poisson’s ratio of the rock, is the blast hole charge, and is the difference in the radii of the tunnel excavation profile and the equivalent elastic boundary.
3.2.2. Calculation of Blasting Load in the Step Excavation of the Xiaobeishan No. 1 Tunnel
Based on the simplified method for calculating the blasting load and according to the relevant blasting design data, the equivalent blasting load peak value and the loading and unloading times at different steps of the excavation blasting in the Xiaobeishan No. 1 tunnel are calculated. Take the calculation of the fifth step as an example:
- (1)
- The explosive density is represented by (1000 kg/m3), the explosive detonation speed is represented by (4200 m/s and 4500 m/s for diameters of 25 mm and 32 mm, respectively), and the isentropic coefficient of the explosives (generally equal to 3.0) is represented by . The peak value, , of the blast hole blasting load under coupled charge conditions is computed as
- (2)
- The peak of the explosive load for the coupled charge is represented by , the diameter of the charge is represented by , the diameter of the auxiliary hole is 32 mm, the diameter of the blast hole (40 mm) is represented by , the total length of the charge (1.0 m) is represented by , and the length of the blast hole charge section (1.5 m according to the excavation plan) is represented by . For the tunnel holes formed with an uncoupled charge, the initial shock wave peak pressure of the hole wall is computed as follows:
- (3)
- The equivalent blasting peak load, , without the cut-hole is calculated as follows:
- (4)
- Poisson’s ratio is equal to 0.33, while the stress decay index is computed as follows:
Meanwhile, the equivalent blasting load peak at the excavation face of the tunnel contour is computed as
- (5)
- The loading and unloading times are computed as
The peak blasting load and the loading and unloading times of the other sections are shown in Table 2.

Table 2.
Details of the blasting load in the upper step excavation of the Xiaobeishan No. 1 tunnel.
The peak load and loading time in the table above are combined with the millisecond detonator segment to plot the blasting load graph, as shown in Figure 5. Using the abovementioned blasting load–time history curve, the blasting excavation of the Xiaobeishan No. 1 tunnel can be numerically simulated, and the dynamic response of the tunnel blasting vibration can be further analyzed.
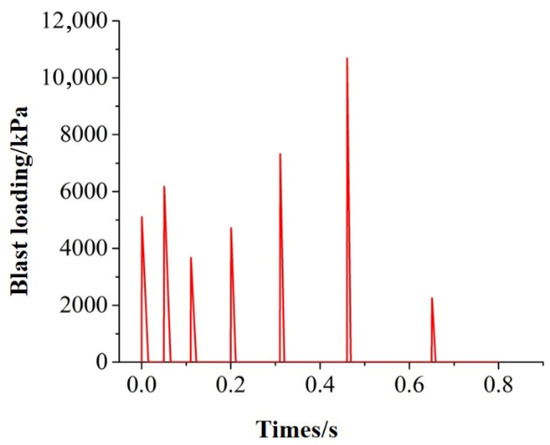
Figure 5.
Time history curve of the blasting load in the upper step of the Xiaobeishan No. 1 tunnel.
It is noteworthy that the application of a semi-theoretical, semi-empirical blasting load curve represents a simplification of a highly complex process. However, this approach is widely adopted in engineering practice for large-scale simulations [28,29]. The justification for this simplification is threefold: (1) it is rooted in the theoretical Chapman–Jouguet equations; (2) its empirical components (e.g., timing parameters) are derived from established formulas calibrated by field tests [32]; and (3), most importantly, its validity is confirmed by the close agreement between the simulated and field-measured vibration responses, as shown in Section 4.1.
3.3. Calculation Model and Parameters
The structure of the tunnel is affected by the dynamic response of the blasting vibration, which is complicated and variable due to many factors. An actual blasting vibration test often fails to meet the research needs, and the vibration in some places that are difficult to test, including those locations close to the tunnel face or the vault, cannot be measured. Several numerical software programs have been developed to provide a convenient platform and opportunity for studying the blasting vibration problem. The finite element software MIDAS/GTS NX, which presents a major advantage in studying geotechnical and tunnel engineering problems, can be used to simulate and analyze the response law of the tunnel under the action of blasting and to explore the influence of various factors on blasting vibration.
The parameters of the surrounding rock are determined based on the results of on-site drilling and indoor laboratory tests. The surrounding rock is elastically deformed since it is located outside the excavation boundary. In the elastic vibration state, the elastic modulus and Poisson’s ratio slightly change with the loading rate. The explosion produces shockwaves in only an extremely small range around the charging area. After propagating to the surrounding rock, these shockwaves decay into stress waves or seismic waves, while the loading and unloading rates of the load sharply decrease. Therefore, the mechanical parameters of the surrounding rock and support are still in accordance with the results of the static analysis, as listed in Table 3 below.

Table 3.
Mechanical parameters of the surrounding rock and supporting structure.
In finite element numerical simulation, only part of the infinite rock mass is generally selected for the modeling analysis, inevitably creating artificial boundaries. Specific boundary conditions must be adopted to eliminate the reflection effect of the artificial boundary on the seismic wave and to ensure the continuous state of the original medium. Lysmer and Wass [33] proposed the concept of a viscous boundary in 1972 to address this problem. This boundary condition considers the influence of energy loss due to wave energy dissipation on the dynamic characteristics of rock mass. Before the dynamic analysis is performed, an eigenvalue analysis must be performed using the finite element system to understand its natural vibration characteristics. MIDAS/GTS NX provides some special modules for analyzing the dynamic response characteristics of the system under dynamic loading.
This study employs MIDAS/GTS NX to analyze the influence of tunnel blasting construction on the surrounding rock and lining. A three-dimensional finite element model was established, with dimensions of 120 m (length along the tunnel axis), 65 m (width), and 65 m (height). The upper boundary was set at a depth of 150 m to simulate the overburden pressure accurately. The lateral and bottom boundaries, placed 5 to 6 times the tunnel width (12 m × 9 m) away from the excavation, were assigned viscous (dashpot) boundary conditions to minimize wave reflection and simulate an infinite domain. The surrounding rock was discretized using tetrahedral elements, while the lining was modeled with plate elements. The mesh was refined around the tunnel excavation zone to capture stress concentrations and wave propagation accurately, with an average element size of 0.8–1.2 m in this critical region. The complete model comprised a total of 177,348 elements and 29,869 nodes. The finite element model of the Xiaobeishan No. 1 tunnel, including the upper and lower bench excavations, is shown in Figure 6. For the dynamic analysis, a fixed time step of 2 ms was adopted, and the total computation time was set to 1 s to fully capture the blasting vibration response until complete dissipation.
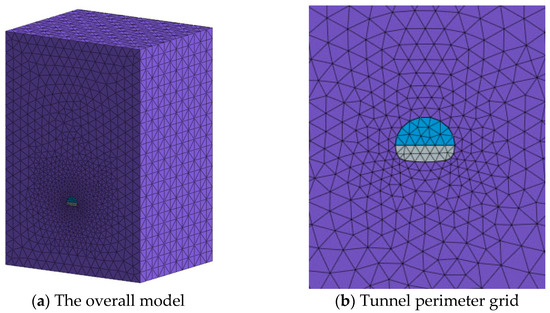
Figure 6.
Finite element model of the Xiaobeishan No. 1 tunnel.
The surrounding rock is modeled as an elastic material. This assumption is justified, as this study focuses on the far-field propagation of blast-induced vibrations, where the rock mass response is predominantly elastic, rather than on the near-source non-linear damage process [9,18]. The mechanical parameters (Table 3) are derived from site-specific tests.
To assess the influence of the elastic parameters on the simulation results, a sensitivity analysis was conducted. The elastic modulus of the intact rock was varied by ±20%. The results indicate that while the absolute magnitude of the peak particle velocity (PPV) was affected, the fundamental patterns of vibration distribution and attenuation and the relative relationships between the key monitoring points (vault, arch waist, invert) remained consistent. Crucially, the derived site-specific coefficients (K and α) for the Sadovsky formula varied by less than 10%, confirming that the primary conclusions of this study are robust against reasonable uncertainties in the elastic input parameters.
In addition, a key aspect of the numerical model is the application of a semi-theoretical, semi-empirical blasting load curve and the use of an elastic constitutive model for the surrounding rock. These simplifications are justified for this study for two main reasons. First, the primary focus is on the propagation of blast vibrations in the far-field (elastic zone) rather than the nonlinear fracturing process in the immediate vicinity of the blast source, making an elastic model a standard and appropriate choice [9,18,19]. Second, while the load curve is a simplification, its parameters are derived from the established detonation theory and empirical formulas calibrated by field tests [28,32]. The validity of these combined assumptions is ultimately demonstrated by the strong agreement between the simulated and measured vibration velocities presented in Section 4.1.
4. Analysis of the Blasting Vibration Results
To clearly examine the characteristics of the vibration in the lateral (x), longitudinal (y), and vertical (z) directions, a blasting analysis is conducted based on the resulting blasting load. The nodes in the key parts of the blasting tunnel are selected, and the response of the rock mass under the blasting load is processed and analyzed to study the vibration velocity law of the particles. The vibration velocity data presented in the following tables and analyses are outputs from the numerical model. The values have been rounded to one decimal place to reflect a precision appropriate for engineering analysis.
4.1. Time History Curve of Blasting Vibration Velocity
The velocity–time history curve of each key point of the tunnel can be extracted by applying a blasting load to the tunnel. The vertical vibration velocity–time history curves of the dome and left arch waist are plotted in Figure 7 and Figure 8.
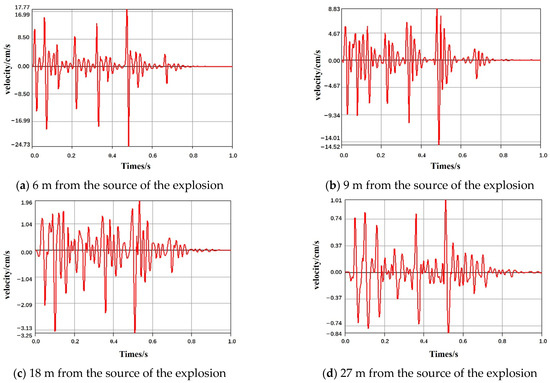
Figure 7.
Time history curves of the vibration velocity in the z-direction of the tunnel.
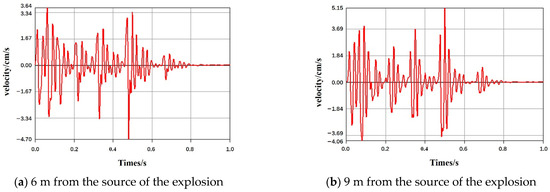
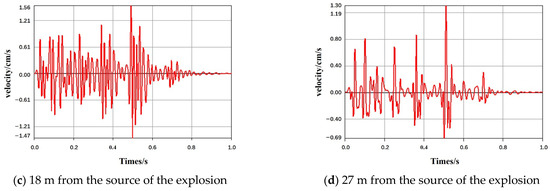
Figure 8.
Time history curves of the vibration velocity in the z-direction of the tunnel left arch.
4.1.1. Vertical Vibration Velocity–Time History Curve
Figure 7 shows that 6 m away from the source of the explosion, the vertical vibration velocity peaks at 24.729 cm/s. Such vibration velocities can be effectively used to distinguish the different waveforms generated by multistage blasting during delayed blasting. The vibration velocity of the segment is also attenuated at the same time.
At a location 18 m away from the explosion source, the vibration velocity peaks at 3.25 cm/s, while the vibration velocity curves generated by the loads overlap. These results indicate that with increasing distance, the peak vibration velocity gradually decreases, the seismic waves generated by blasting with the short delay of the first few segments gradually become mixed and superimposed, and the boundary between these segments gradually blurs. The vibration velocity of each segment at this distance also decelerates.
4.1.2. Vertical Vibration Velocity–Time History Curve at the Left Arch Waist
The vibration velocity–time history curve of the left arch waist is higher than that of the dome. However, the vibration velocity is relatively small. Figure 8 shows the vertical vibration velocity–time history curve of the tunnel left arch waist. At a location 6 m away from the source of the explosion, the vibration velocity peaks at 4.69 cm/s. A similar pattern is observed in the vaults. Specifically, at a location 18 m away from the source of the explosion, the vibration velocity is reduced, the frequency is increased, and the boundary between the segments is blurred.
In addition, the applicability of the numerical model was verified by comparing the simulated peak particle velocities (PPV) with field monitoring data. The simulation results show good agreement with the measured values, with the relative error of PPV at all key points (vault, arch waist, invert) remaining within 15%. This confirms the model’s reliability in capturing the essential characteristics of the blasting-induced vibration.
4.2. Vibration Velocity in the Vertical Direction
The vertical vibration velocity cloud map presented in Figure 9 is used to analyze the variations in the vibration of the surrounding rock under the action of the blasting load. This cloud map shows the changes in the vertical vibration velocity of the surrounding rock along the left side of the tunnel axis for various differential times.
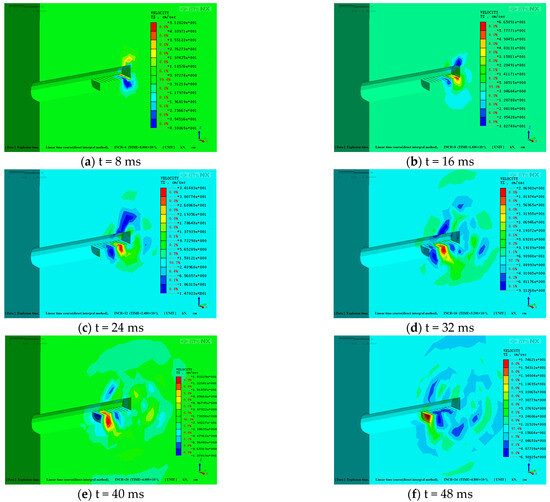
Figure 9.
Vertical vibration velocity cloud maps with various differential times.
Figure 9 reveals the following:
- (1)
- The vertical vibration velocity increases continuously from t = 0 ms to t = 16 ms and reaches a peak value of 66.51 cm/s at t = 16 ms before gradually decreasing.
- (2)
- The vertical vibration velocity distribution is symmetrical across the tunnel axis. Over time, the peak speed of the vibration shifts up and down from the blasting face, simultaneously shifting in front of and behind the blasting head.
- (3)
- The velocity at a distance in front of the face is greater than the velocity at the same distance into the unexcavated rock mass. This finding can be explained by the excavation of the tunnel, which reduces the constraints of the surrounding rock and makes it more susceptible to the seismic waves induced by blasting, thereby generating vibration.
4.3. Distribution of Vibration Velocity Along the Axial Direction of the Tunnel
A section is taken every 3 m along the axial direction of the tunnel in front of and behind the blasting head. The distance is positive in front of the face, while the distance is negative behind the face. Each section includes four key points, namely, the vault, the two arched sides, and the arch bottom. The peaks of the vibration velocity in the lateral (Vxmax), longitudinal (Vymax), and vertical (Vzmax) directions of each key point are extracted and plotted in Figure 10.
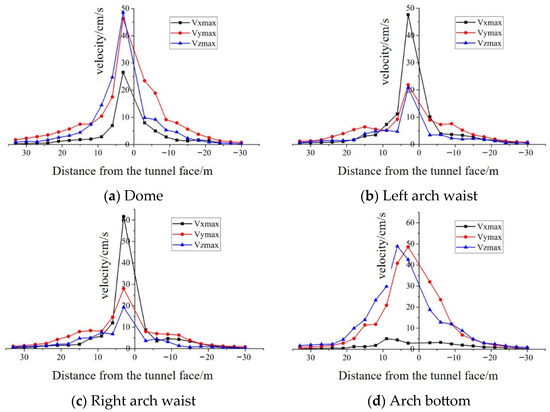
Figure 10.
Distribution of the vibration velocity at different points along the axial direction of the tunnel.
The vibration velocity along the axial direction of the tunnel can be obtained from Figure 10. The following can be observed from the figure:
- (1)
- The change in the three-way vibration velocity of the node corresponding to the position in front of the face is similar to that corresponding to the position behind the face, but the vibration velocity of the node in front of the face is greater. Increasing the distance from the node to the face significantly decreases the peak vibration velocity and reduces the attenuation rate. The peak value of the vibration velocity of the node also reflects the change in the energy of the seismic wave induced by blasting, to a certain extent. Therefore, the energy carried by the seismic wave induced by blasting rapidly attenuates during the propagation process.
- (2)
- As the vibration velocity distribution map in Figure 10a shows, the vibration velocity in the vertical direction is the highest, followed by that in the longitudinal and lateral directions. These observations can be ascribed to the fact that the vertical vibration of the vault in front of the face has a good air-surface exchange and is under few constraints and that the rock mass can be easily vibrated.
- (3)
- The distribution diagram of the vibration velocity of the arch waist (Figure 10b,c) shows that close to the face, the lateral vibration velocity of the arch waist is significantly higher than that in the other two directions. This finding can be ascribed to the fact that the waist position of the arch has a weak lateral constraint and that the rock mass can easily generate a large initial velocity there.
- (4)
- The vibration velocity distribution diagram for the arch bottom (Figure 10d) shows that the vertical and longitudinal vibration speeds are higher than the lateral vibration speed. A low lateral vibration speed is also observed near the explosion source because the blasting load mainly acts on the vertical stress of the arch bottom, and the lateral force is small. The lateral vibration of the arch bottom is also strongly restrained, thereby resulting in a low vibration velocity.
4.4. Distribution Law of Peak Vibration Velocity
To analyze the distribution law of the vibration velocity in the three directions at different distances from the blasting face, the lateral (x), longitudinal (y), and vertical (z) directions are applied to the section of the blasting load at a distance of R = 4.0 m. The peak vibration velocity data are extracted and processed, as shown in Figure 11. In this figure, the polar coordinate system is used; the coordinate origin is at the center of the tunnel section, and the black curve represents the tunnel outline.
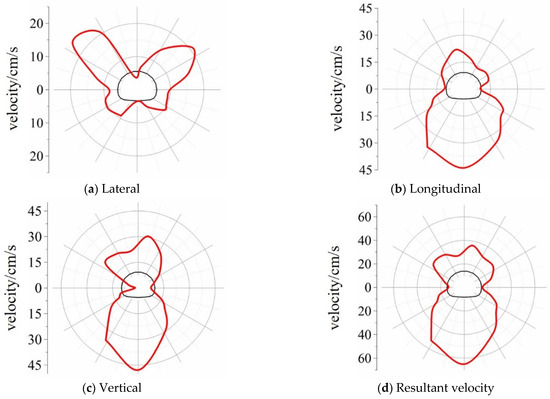
Figure 11.
Section peak vibration velocity distribution map (R = 4.0 m).
The maximum peak lateral vibration velocity (24.123 cm/s) appears at the left arch waist. The lateral vibration velocity peaks at the left and right arch waists are the highest, while those at the arch bottom are the lowest. A significant decrease in the lateral vibration velocity can also be observed along the bottom of the arch. The maximum peak longitudinal vibration velocity (43.922 cm/s) is observed at the bottom of the arch. The peak velocity along the entire arch bottom is highest, followed by those at the dome and both sides of the arch waist. The maximum peak vertical vibration velocity (47.883 cm/s) is observed at the bottom of the arch. The other characteristics of the vertical vibration velocity distribution are the same as those of the longitudinal vibration velocity. Specifically, the combined velocity profile shows that the vibration velocity at the bottom of the arch is highest, followed by that at the dome. In actual construction projects, the dome area is relatively dangerous due to the influence of gravity. Therefore, the dome must be closely monitored, and some supporting measures must be devised.
The peaks in the lateral (x), longitudinal (y), and vertical (z) directions at distances of R = 10.0, 19.0, and 28.0 m from the face of the blasting load are plotted in Figure 12, Figure 13 and Figure 14.

Figure 12.
Distribution of the peak vibration velocity at the R = 10.0 m section.

Figure 13.
Distribution of the peak vibration velocity at the R = 19.0 m section.

Figure 14.
Distribution of the peak vibration velocity at the R = 28.0 m section.
A comparative analysis of the vibration velocity profiles at R = 10.0, 19.0, and 28.0 m reveals that at different distances, the arch waist maintains the highest lateral vibration velocity. Meanwhile, the maximum longitudinal vibration velocity is initially observed at the arch bottom, then shifts to the vault, and then shifts back to the arch bottom with distance from the face of the blasting load. The maximum peak vertical vibration velocity is always observed at the bottom of the arch, and the distribution map tends to be round in general. The vibration response of each area tends to be consistent. Comparing the horizontal and vertical vibration velocity peaks at different sections reveals that in the first 20 m, the maximum vibration velocity is in the vertical direction. In the R = 28.0 m section, the peak longitudinal vibration velocity reaches its maximum value, but the difference between this peak and the peak vertical vibration velocity is small, thereby indicating that the vertical vibration velocity rapidly decays.
5. Prediction of the Far-Field Vibration Velocity Induced by Blasting
The maximum velocity, dose, and distance of Sadovsky’s vibration are empirically determined as follows:
If , , , and . Then,
Sadovsky’s formula is obtained by applying the equations above to the vibration velocity data of each key point in front of the tunnel blasting face.
The maximum charge for this blasting is 14.592 kg. The peripheral hole charge is 25.09 kg, but the explosive has a small diameter, and the calculated peak load is also small; therefore, the maximum charge is 14.592 kg. The vertical (z-direction) vibration velocity data for each key point are listed in Table 4, while the curve obtained by fitting is shown in Figure 15.

Table 4.
Vertical vibration velocity peaks (cm/s) at different distances and at each key point.
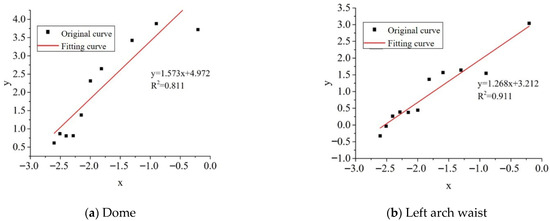
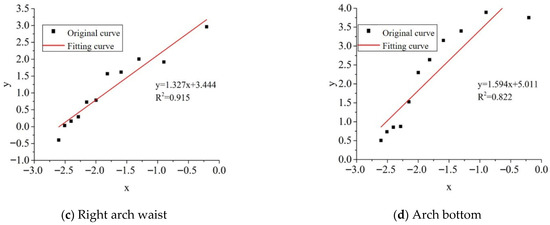
Figure 15.
Fitting curves of the vertical vibration velocity.
The fitted Sadovsky’s formulas for each key point, along with their correlation coefficients (R2), are summarized in Table 5. The high R2 values, ranging from 0.811 to 0.915, indicate a strong goodness of fit between the formula predictions and the simulated vibration data across the entire range of distances investigated (3–33 m). This confirms the applicability of the derived site-specific coefficients (K and α) for predicting far-field vibration velocities under the geological and blasting design conditions of the Xiaobeishan No. 1 tunnel.

Table 5.
Vertical vibration velocity attenuation formula for each key point of the tunnel.
The vibration velocity attenuation formula of each key point (Table 5) reveals that the highest attenuation index values, , are observed at the vault (1.573) and at the bottom of the arch (1.594), thereby suggesting that the vertical vibration velocity decays faster than the other velocities decay. Meanwhile, the attenuation index values, , in the left and right arch waist positions are low (1.268 and 1.327, respectively), thereby indicating that the vertical vibration velocity is slower than those of the other velocities. The vibration velocity attenuation indices in the same direction at different positions show considerable differences, and the highest attenuation index is obtained where the vibration is most likely to occur.
The vertical vibration velocity is the highest of the three vibration velocities measured, while that at the dome is also dangerously high at each key point. Sadovsky’s formula is employed to determine the safety distance and the maximum charge dose under different control standards. The K and α values in Table 4 (K = 150 and α = 1.57) are used for the calculation, and the results are presented in Table 6 and Table 7.

Table 6.
Relationship between maximum dose and minimum safety distance for different vibration speed control standards.

Table 7.
Distance and allowable maximum dose for different vibration speed control standards.
According to the “Requirements of the Blasting Safety Regulations” (GB6722-2014), when the control standard is Vmax = 15 cm/s and when the maximum charge is 20 kg, the safety distance is 11.8 m. The maximum dose for the small section of the Xiaobeishan No. 1 tunnel is 14.592 kg, while its safety distance is 10.6 m.
When a vibration test cannot be easily performed in the field, the site coefficients K and α are determined using geological data and performing numerical simulation. The maximum dose and safety distance under different control standards are derived based on these data. The findings can also contribute to blasting scheme design and enhance security management of construction sites.
6. Conclusions
6.1. Limitations and Future Work
While this study offers valuable insights and practical tools, its limitations must be noted to properly contextualize the findings.
In terms of the numerical model, necessary simplifications were adopted for large-scale 3D simulation feasibility—primarily assuming a homogeneous, linear-elastic rock mass with average mechanical properties. In reality, rock masses are highly heterogeneous and discontinuous and may show nonlinear behavior under high-strain dynamic loading. Though the model accurately captures the field-test-validated global average response, it may underpredict peak vibrations in significantly weaker rock zones. Future work should integrate advanced constitutive models (for material nonlinearity) and random field theory (to account for geotechnical parameter spatial variability) for probabilistic vibration risk assessment Chen et al., 2025 [34].
For the fitted Sadovsky’s formula, the limitations are twofold: First, as an empirical correlation from specific geological contexts and blast designs, its predictive accuracy is only reliable within the calibrated parameter range (e.g., charge weights ~10–70 kg, distances 3–33 m) and geological conditions, with extrapolation beyond this range discouraged due to high uncertainty. Second, it provides deterministic peak velocity predictions without quantifying inherent geotechnical variability-related probabilities or confidence intervals. A more robust framework would use reliability analysis to determine safety distances with specific exceedance probabilities (e.g., 95% confidence that Vmax < 15 cm/s).
6.2. Summary of Findings
Despite these limitations, this study successfully establishes a validated baseline model and immediately applicable design charts for Xiaobeishan tunnel conditions and highlights the importance of site-specific coefficients, and its core conclusions (based on the validated baseline) remain valid:
- (1)
- Chapman–Jouguet’s theory of coagulated explosive detonation waves is used to calculate the peak value of each blast hole explosion load. The peak load gradually approaches the excavation contour surface according to the stress wave attenuation law, thereby blasting the Xiaobeishan No. 1 tunnel. The time history curve is input into the blast simulation. When compared with the measured signals, the blasting load–time history curve shows good applicability in predicting waveform and amplitude, with the simulated peak velocities closely matching the field data (e.g., a measured peak of 48.6 cm/s at the arch bottom versus a simulated value of 48.6 cm/s at 6 m from the source).
- (2)
- A numerical simulation is performed to examine the dynamic response of the tunnel under the action of blasting vibration. The simulation results indicate that the maximum vertical vibration velocity in the surrounding rock reached 66.51 cm/s at t = 16 ms. The vibration velocity–time history curve of the left arch waist plots higher than that of the dome, but the vibration velocity of the former location is smaller than that of the latter (e.g., 4.69 cm/s vs. 24.73 cm/s at 6 m). The vertical vibration velocity distribution is symmetrical across the tunnel axis. The peak vibration speed gradually shifts up and down from the blasting face, simultaneously shifting in front of and behind the blasting head.
- (3)
- The vibration velocity of the node corresponding to the position in front of the face shows similar changes in the three measured directions, but the vibration velocity of the node in front of the face is larger than that of the node behind the face. When the distance from the node to the face increases, the attenuation rate gradually decreases, while the peak vibration velocity of the node significantly decreases (e.g., dropping from 24.73 cm/s at 6m to 3.25 cm/s at 18m for the vault). The dominant vibration velocity at the vault and arch bottom is vertical, while the dominant vibration velocity at both sides of the arch waist is in the lateral direction.
- (4)
- Applying Sadovsky’s vibration formula and fitting and analyzing the obtained data reveal that the attenuation index reaches its highest value in the direction of the dominant vibration velocity (e.g., α = 1.594 at the vault and arch bottom compared to α ≈ 1.27–1.33 at the arch waist). The attenuation index in the same direction also varies with position. The lateral vibration velocity is high at the sides and low at the upper and lower sides of the tunnel, while the longitudinal and vertical vibration velocities are high and low at the sides, respectively. As the blasting distance increases, the vibration velocity distributions in the three measured directions gradually become circular, and the difference between the components gradually decreases. The maximum dose and safety distance under different control standards are then calculated using Sadovsky’s formula (e.g., for Vmax = 15 cm/s, a 20 kg charge requires a safety distance of 11.8 m), which can be conveniently applied when designing blasting parameters.
The practical implications of this study are significant for guiding safe blasting design in similar mountain tunnel projects. The derived site-specific Sadovsky formula coefficients (K and α) enable accurate prediction of blast-induced vibrations at critical locations, such as the vault, arch waist, and invert. Engineers can use the provided charts (Table 6 and Table 7) to determine the maximum allowable charge per delay and the minimum safe distance for any given vibration control standard (e.g., 15 cm/s), thereby optimizing blast designs to minimize vibration risks without compromising excavation efficiency. Furthermore, the validated numerical modeling approach offers a cost-effective tool for pre-construction blast impact assessment, reducing reliance on extensive field trials. This methodology enhances on-site safety management by providing quantitative criteria for vibration control, ultimately protecting structural integrity and ensuring compliance with national safety regulations.
Author Contributions
Z.C.: funding acquisition, supervision, writing—review and editing, conceptualization, resources. C.W.: writing—original draft, methodology, visualization, validation, data curation. L.Z.: writing—review and editing, resources, conceptualization. H.X.: writing—review and editing, resources. X.L.: writing—review and editing. S.C.: writing—review and editing, resources, conceptualization. All authors have read and agreed to the published version of the manuscript.
Funding
This research was mainly supported by the Key Research and Development Program of Hubei Province (No. 2023BCB116).
Data Availability
The data used to support the findings of this study are included within the article. The calculation model used to support the findings of this study is available from the corresponding author upon request.
Acknowledgments
We would like to acknowledge the anonymous reviewers who played a significant role in shaping and improving the manuscript.
Conflicts of Interest
The authors declare that there are no conflicts of interest regarding the publication of this paper.
References
- Wang, T.; Tan, L.; Xie, S.; Ma, B. Development and applications of common utility tunnels in China. Tunn. Undergr. Space Technol. 2018, 76, 92–106. [Google Scholar] [CrossRef]
- Zhang, S.; Gao, W.; Yan, L.; Liu, J.; Liu, L. The characteristics of blasting vibration frequency bands in jointed rock mass slope. Environ. Earth Sci. 2020, 79, 519. [Google Scholar] [CrossRef]
- Gou, Y.; Shi, L.; Huo, X.; Yu, Z.; Chen, Y. Propagation and Prediction of Blasting Vibration on Ground Surface Induced by Underground Mining with Comparison to Vibration Inside Rock. Rock Mech. Rock Eng. 2024, 57, 10283–10306. [Google Scholar] [CrossRef]
- Li, Y.; Zhu, J.; Han, D.; Zhao, R.; Ma, Y.; Zhou, T. Experimental study of the dynamic responses of surrounding jointed rock masses and adjacent underground openings and induced ground vibrations subjected to underground explosion. Tunn. Undergr. Space Technol. 2023, 135, 105060. [Google Scholar] [CrossRef]
- Song, J.; Kim, K. Micromechanical modeling of the dynamic fracture process during rock blasting. Int. J. Rock Mech. Min. Sci. Geomech. Abstr. 1996, 33, 387–394. [Google Scholar] [CrossRef]
- Minchinton, A.; Lynch, P.M. Fragmentation and heave modelling using coupled discrete element gas flow code. Fragblast 1997, 1, 41–57. [Google Scholar] [CrossRef]
- Li, H.B.; Zhao, J.; Li, T.J.; Yuan, J.X. Analytical simulation of the dynamic compressive strength of a granite using the sliding crack model. Int. J. Numer. Anal. Methods Geomech. 2001, 25, 853–869. [Google Scholar] [CrossRef]
- Li, H.; Zhao, J.; Li, J.; Liu, Y.; Zhou, Q. Experimental studies on the strength of different rock types under dynamic compression. Int. J. Rock Mech. Min. Sci. 2004, 41, 365. [Google Scholar] [CrossRef]
- Huang, D.; Cui, S.; Li, X. Wavelet packet analysis of blasting vibration signal of mountain tunnel. Soil Dyn. Earthq. Eng. 2019, 117, 72–80. [Google Scholar] [CrossRef]
- Man, K.; Liu, X.; Wang, J.; Wang, X.; Sun, S. Blasting Energy Analysis of the Different Cutting Methods. Shock Vib. 2018, 13, 9419018. [Google Scholar] [CrossRef]
- Kong, L.; Yan, P.; Liu, X.; Lu, W.; Zhou, C.; Gao, Q.; Yang, X.; Li, M. Estimating the mechanical and dynamic parameters in surrounding rock mass of tunnels based on velocities of blasting seismic waves. Tunn. Undergr. Space Technol. 2025, 165, 106897. [Google Scholar] [CrossRef]
- Zhou, J.; Gao, S.; Luo, P.; Fan, J.; Zhao, C. Optimization of Blasting Parameters Considering Both Vibration Reduction and Profile Control: A Case Study in a Mountain Hard Rock Tunnel. Buildings 2024, 14, 1421. [Google Scholar] [CrossRef]
- Ma, K.; Peng, Y.; Liao, Z.; Wang, Z. Dynamic responses and failure characteristics of the tunnel caused by rockburst: An entire process modelling from incubation to occurrence phases. Comput. Geotech. 2024, 171, 106340. [Google Scholar] [CrossRef]
- Gao, G.; Li, N.; Gu, X. Field experiment and numerical study on active vibration isolation by horizontal blocks in layered ground under vertical loading. Soil Dyn. Earthq. Eng. 2015, 69, 251–261. [Google Scholar] [CrossRef]
- Mu, H.; Zhang, Y.; Gao, M.; Zhu, Q.; Li, J.; Cao, J.; Fan, W. Research on the attenuation characteristics of seismic energy in multicoal seam mining and the warning method of rock burst. Energy Sci. Eng. 2024, 12, 4932–4949. [Google Scholar] [CrossRef]
- Du, H.; Huang, X.; Wang, H.; Wan, Y.; Huang, S.; Li, W. Numerical investigation on damage characteristics of surrounding rocks in the deep underground tunnel subjected to full-face smooth blasting. Sci. Rep. 2025, 15, 14659. [Google Scholar] [CrossRef] [PubMed]
- Zhao, D.; Huang, Y.; Chen, X.; Han, K.; Chen, C.; Zhao, X.; Chen, W. Numerical investigations on dynamic responses of subway segmental tunnel lining structures under internal blasts. Tunn. Undergr. Space Technol. 2023, 135, 105058. [Google Scholar] [CrossRef]
- Shen, Y.S.; Gao, B.; Wang, Z.J.; Meng, F.J. Effect of blasting in double line tunnel on existing tunnel. Chin. J. Undergr. Space Eng. 2009, 5, 980–984. [Google Scholar]
- Lu, L.; Long, Y.; Guo, T.; Xie, Q.-M.; Zhao, C.-X.; Gao, F.-Y. Dynamic response sensitivity of urban tunnel structures under blasting seismic waves to parameters. Explos. Shock Waves 2014, 34, 701–708. [Google Scholar]
- Jiang, N.; Zhu, B.; Zhou, C.; Li, H.; Wu, B.; Yao, Y.; Wu, T. Blasting vibration effect on the buried pipeline: A brief overview. Eng. Fail. Anal. 2021, 129, 105709. [Google Scholar] [CrossRef]
- Shao, S.; Wang, X.; Qiao, R. Numerical investigation into the reasonable delay time in millisecond in blast engineering of the tunnel. Chin. J. Undergr. Space Eng. 2015, 11, 1009–1015. [Google Scholar]
- Li, Q.; Qiao, L.; Dasgupta, G.; Ma, S.; Wang, L.; Dong, J. Blasting Vibration Safety Criterion Analysis with Equivalent Elastic Boundary: Based on Accurate Loading Model. Shock Vib. 2015, 10, 604683. [Google Scholar] [CrossRef]
- Ak, H.; Iphar, M.; Yavuz, M.; Konuk, A. Evaluation of ground vibration effect of blasting operations in a magnesite mine. Soil Dyn. Earthq. Eng. 2009, 29, 669–676. [Google Scholar] [CrossRef]
- Devine, J.R.; Gunary, D.; Larsen, S. Availability of phosphate as affected by duration of fertilizer contact with soil. J. Agric. Sci. 1968, 71, 359–364. [Google Scholar] [CrossRef]
- Attewell, P.; Farmer, I. Fatigue behaviour of rock. Int. J. Rock Mech. Min. Sci. Geomech. Abstr. 1973, 10, 1–9. [Google Scholar] [CrossRef]
- Yang, R.; Pratt, L.; Zhao, G. A Case Study on Trim Blast Fragmentation Optimization Using the MBF Model and the MSW Blast Vibration Model at an Open Pit Mine in Canada. Rock Mech. Rock Eng. 2023, 56, 3641–3658. [Google Scholar] [CrossRef]
- GB6722-2014; Safety Rules for Blasting. China Standard Press: Beijing, China, 2015.
- Tao, J.; Yang, X.-G.; Li, H.-T.; Zhou, J.-W.; Fan, G.; Lu, G.-D. Effects of in-situ stresses on dynamic rock responses under blasting loading. Mech. Mater. 2020, 145, 103374. [Google Scholar] [CrossRef]
- Zhang, H.; Xing, X.; Du, Y.; Li, T.; Yu, J. An approach of rock blasting simulation of equivalent blasting dynamic-static action. Undergr. Space 2025, 23, 68–88. [Google Scholar] [CrossRef]
- Hajibagherpour, A.; Mansouri, H.; Bahaaddini, M. Numerical modeling of the fractured zones around a blasthole. Comput. Geotech. 2020, 123, 103535. [Google Scholar] [CrossRef]
- Wan, Y.; Li, W.; Du, H.; Yang, X. Investigation of Shock Wave Pressure Transmission Patterns and Influencing Factors Caused by Underwater Drilling Blasting. Water 2022, 14, 2837. [Google Scholar] [CrossRef]
- Moomivand, H.; Gheybi, M. Novel empirical models to assess rock fragment size by drilling and blasting. Measurement 2024, 238, 115375. [Google Scholar] [CrossRef]
- Lysmer, J.; Waas, G. Shear Waves in Plane Infinite Structures. J. Eng. Mech. Div. 1972, 98, 85–105. [Google Scholar] [CrossRef]
- Chen, X.; Zhang, J.; Hu, Y.; Wang, W.; Liu, Y. Random large-deformation modelling on face stability considering dynamic excavation process during tunnelling through spatially variable soils. Can. Geotech. J. 2025, 62, 1–21. [Google Scholar] [CrossRef]
Disclaimer/Publisher’s Note: The statements, opinions and data contained in all publications are solely those of the individual author(s) and contributor(s) and not of MDPI and/or the editor(s). MDPI and/or the editor(s) disclaim responsibility for any injury to people or property resulting from any ideas, methods, instructions or products referred to in the content. |
© 2025 by the authors. Licensee MDPI, Basel, Switzerland. This article is an open access article distributed under the terms and conditions of the Creative Commons Attribution (CC BY) license (https://creativecommons.org/licenses/by/4.0/).