Abstract
With the continuous expansion of urban rail transit networks, construction safety of connecting passages—as critical weak links in underground structural systems—has become pivotal for project success. Although artificial ground freezing technology effectively addresses adverse geological conditions (e.g., high permeability and weak self-stability), it is influenced by multi-field coupling effects (temperature, stress, and seepage fields), which may trigger chain risks such as freezing pipe fractures and frozen curtain leakage during construction. This study deconstructed the freezing method workflow (‘drilling pipe-laying → active freezing → channel excavation → structural support’) and established a hierarchical evaluation index system incorporating geological characteristics, technological parameters, and environmental impacts by considering sandy soil phase-change features and hydro-thermal coupling effects. For weight calculation, the Analytic Hierarchy Process (AHP) was innovatively applied to balance subjective-objective assignment deviations, revealing that the excavation support stage (weight: 52.94%) and thawing-grouting stage (31.48%) most significantly influenced overall risk. Subsequently, a Bayesian network-based risk assessment model was constructed, with prior probabilities updated in real-time using construction monitoring data. Results indicated an overall construction risk probability of 46.3%, with the excavation stage exhibiting the highest sensitivity index (3.97%), identifying it as the core risk control link. These findings provide a quantitative basis for dynamically identifying construction risks and optimizing mitigation measures, offering substantial practical value for enhancing safety in subway connecting passage construction within water-rich sandy strata.
1. Introduction
With the acceleration of urbanization in China, underground space development has become an increasingly important approach to addressing urban development challenges [1,2]. This approach not only alleviates resource constraints and traffic congestion but also contributes to sustainable development and the establishment of a resource-efficient society. As of 30 June 2024, 58 cities in mainland China had operational urban rail transit lines totaling 11,409.79 km. During the first half of 2023, 194.06 km of new lines were commissioned, with average daily passenger traffic exceeding 80 million [3]. Tunnel and underground engineering construction frequently encounters complex geological conditions with numerous unpredictable factors [4,5,6]. Water-rich weak strata, characterized by high water tables, elevated moisture content, and low strength, significantly increase construction difficulty and risk [7]. Consequently, artificial ground freezing technology—with its dual functionality of waterproofing and reinforcement—has emerged as a critical solution [8] and is widely employed in urban railway connecting corridor construction. Nevertheless, this method still presents risks, including groundwater inrushes, frozen wall imperfections, tunnel stability issues, and freeze–thaw effects [9]. Therefore, identifying and managing risks during freezing method construction for urban subways and their connecting passages has become paramount to ensure the successful execution of subway projects.
Risk identification forms the cornerstone of risk management, requiring in-depth analysis of potential threats or opportunities to project objectives. Huang Sai et al. [10] investigated subway construction risk management using the XTC project case study, establishing Work Breakdown Structures (WBS) for core processes and risk factors before developing a risk evaluation model through Analytic Hierarchy Process (AHP) and Analytic Network Process (ANP) methods. Huang Yipeng et al. [11] developed a risk evaluation index system comprising 8 primary and 59 secondary indicators, calculated weights using network analytic hierarchy processes, and constructed a cloud theory-based evaluation model. Lu Xinyue et al. [12] innovatively proposed a dynamic risk assessment model integrating Dynamic Bayesian Networks (DBN) and Fuzzy Comprehensive Evaluation Methods (FCEM), enabling real-time risk assessment during tunneling beneath existing structures and enhancing evaluation timeliness and accuracy. Zhou Zhipeng et al. [5] established a Bayesian network model for subway risk prevention, while Wang et al. [13] created a Fuzzy Comprehensive Bayesian Network (FCBN) method combining fuzzy evaluation with Bayesian networks to analyze safety risks under uncertainty, providing foundations for dynamic risk early-warning systems.
Regarding freezing method construction risks, Zhai Qiang et al. [14] identified primary risk factors for subway connecting passages and established an evaluation index system, proposing an integrated AHP-FCE-BN assessment methodology. Ma Long [15] categorized risk sources across four freezing method stages and proposed mitigation measures for preparatory, freezing reinforcement, and excavation phases. Zheng Zhipeng [16] employed analytic hierarchy processes to identify principal and general construction risks, formulating corresponding control measures.
In summary, existing research has employed multiple methodologies—including Bayesian networks, fuzzy comprehensive evaluation, and analytic hierarchy processes—to identify, analyze, and evaluate subway construction risks while proposing response measures. However, these studies often exhibit two main limitations: (1) Conventional static evaluation methods (e.g., FCE and AHP) are limited in capturing dynamic risk evolution, with reported response lags exceeding 48 h in freezing projects [5], necessitating real-time probabilistic modeling. (2) While some research has applied Bayesian networks, a comprehensive dynamic framework integrating real-time monitoring data specifically for the freezing method construction of subway connecting passages remains underdeveloped. To address these gaps, this study conducts a detailed analysis of freezing method construction processes, identifies risk factors through WBS-RBS, determines risk weights through AHP, and constructs a Bayesian theory-based risk assessment model capable of real-time probability updating. The model’s applicability and accuracy are validated through an actual engineering case, ultimately establishing a dynamic risk early-warning framework integrating real-time monitoring data with Bayesian probability updating. The novelty of this research lies in the integration of WBS-RBS with a dynamically updated BN for real-time risk warning in freezing method construction, providing a more quantitative and dynamic approach compared to existing static methods.
2. Methodology
The overall research workflow, integrating risk identification, model construction, and application, is illustrated in Figure 1.
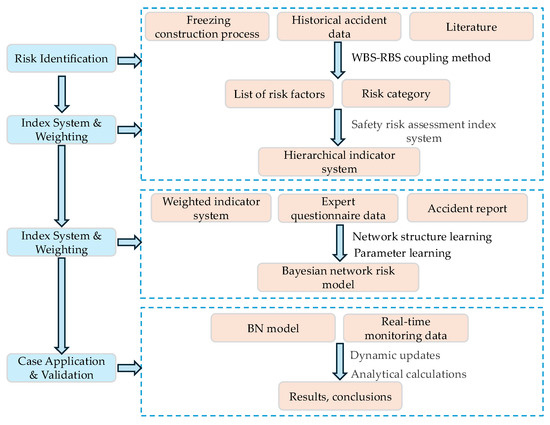
Figure 1.
Technology roadmap.
2.1. Identification of Causes of Safety Accidents and WBS-RBS Matrix Construction
The WBS-RBS method [17] integrates the Work Breakdown Structure (WBS) and Risk Breakdown Structure (RBS) to establish a systematic framework for engineering risk identification [18]. Through construction of the WBS-RBS matrix, each element is evaluated to determine risk presence (coded as 1) or absence (coded as 0). Analysis of this matrix enables identification of risk source typologies and their associated project phases.
Analyzing the main characteristics of freezing method construction, the freezing method is divided into four main phases: the freezing hole construction phase, the active freezing construction phase, the excavation and construction phase, and the melting and sinking grouting construction phase [9,19,20]. The work decomposition structure for freezing method construction is presented in Figure 2.
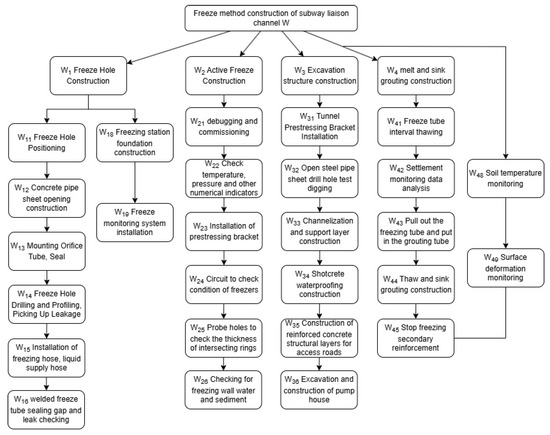
Figure 2.
Construction work decomposition structure method of freezing method.
Construction risks and quality are predominantly influenced by the integrated effects of personnel, materials, mechanical equipment, process technology, and environmental factors (i.e., 4M1E) [21,22]. When the difference between the actual state of 4M1E and the expected target is smaller, the possibility of construction risk is smaller; on the contrary, when the intrinsic characteristics of 4M1E cannot meet the specific construction requirements, it is more likely to cause engineering accidents and related risks. Firstly, the risk of accidents that may occur in subway construction is analyzed, and it is found that the risk sources are mainly concentrated in the personnel and environmental factors in 4M1E, and the RBS risk decomposition method is used to finally obtain the 4E1M risk decomposition structure method based on 4E1M, as shown in Figure 3.
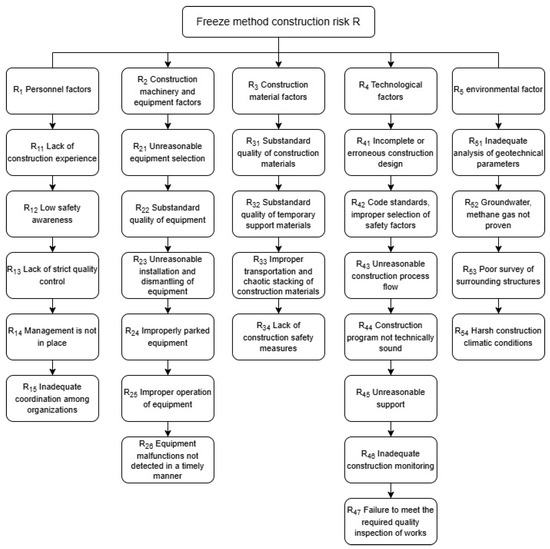
Figure 3.
Risk decomposition structure method based on 4E1M.
Combining the work decomposition structure and risk decomposition structure, the bottom risk factor after decomposition is intersected with the basic work to construct the WBS-RBS matrix and synthesize the views of the experts of the contact channel freezing method, the management personnel, the designers, the technicians, and the construction-experienced workers on the risk of the construction of the contact channel freezing method, and judge one by one the value of each element C in the WBS-RBS matrix, as shown in Appendix A. The expert panel was composed of 10 professionals with diverse backgrounds (2 designers, 2 project managers, 3 senior engineers, and 3 technicians with over 10 years of experience) to ensure a balanced perspective. All judgments were required to pass consistency checks (CR < 0.1) before being included in the analysis. The final weights were determined by calculating the geometric mean of all consistent expert judgments, thereby mitigating individual subjectivity.
After the WBS-RBS coupling of the above work decomposition structure and risk decomposition structure, all the risk factors in the construction process of the subway trench freezing method can be deduced, and the risk events that may occur in each stage of the construction of the freezing method can be identified as to what causes are formed, as shown in Table 1.

Table 1.
List of risk categories.
2.2. Establishment of Construction Risk Index of Freezing Method
Based on the above WBS-RBS-based combination of methods for the identification of risk factors for the construction of the freezing method of the contact channel, the main influencing factors are classified, screened, summarized, and analyzed in terms of cause and effect, and the index system for the safety risk assessment of the construction of the freezing method of the subway contact channel has been established, which is shown in Table 2, consisting of a total of 20 indexes, with a hierarchical structure as shown in Figure 4.

Table 2.
Safety risk assessment indicator system for freezing method construction of liaison corridor.
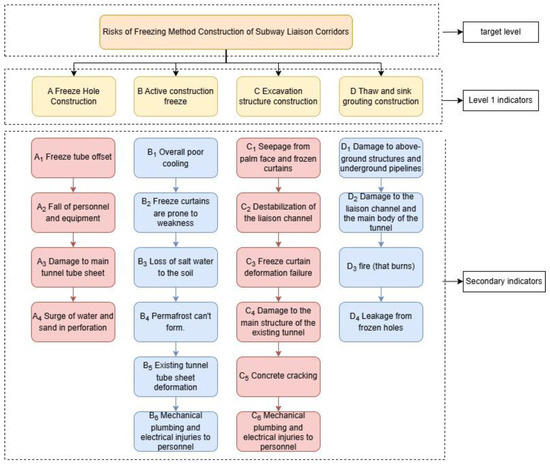
Figure 4.
Security risk assessment indicator system.
2.3. Determination of Indicator Weights Using AHP
For the 20 level 2 risks in the four stages listed in Table 3, combined with the hierarchical structure in Figure 4, an expert survey was used to score the indicators. Take the first-level indicator freezing method construction risk judgment matrix as an example, as shown in Table 3.

Table 3.
Tier 1 indicator freeze method construction risk judgment matrix.
The consistency ratio of this judgment matrix is 0.0763 < 0.1, indicating that the consistency of the matrix is acceptable. The calculation results are shown in Table 4. It can be found that the maximum impact stage in the freezing method construction is C → excavation structure stage, followed by D → grouting and melting and sinking stage.

Table 4.
Calculation of weights and consistency test.
The analysis of the risk judgment matrix of freezing method construction by a total of six experts is shown in Table 5. It can be found that the biggest impact stage in the freezing method construction is C → excavation structure stage, followed by D → grouting and thawing stage.

Table 5.
Calculation of average weights for tier 1 indicators.
Similarly, construct the judgment matrix of the secondary indicators, respectively, consistency test, correct the data, and take the arithmetic mean of the weighting results for integration to obtain the contact channel freezing method of construction safety risk loss weighting results as shown in Table 6.

Table 6.
Results of loss weighting calculations.
2.4. Bayesian Network Based Risk Assessment Model
Constructing the risk network topology diagram of the contact channel freezing method and the risk network topology diagram of each construction stage from the cause and effect relationship, the initial Bayesian network structure established by the freezing method construction risk system is divided into four layers, and the whole of it is a directed acyclic graph with 59 risk factors as the root nodes, 20 risk categories and 4 risk groups as the intermediate sub-nodes in order, and the comprehensive dynamic risk of the project as the target node, characterized by the ability to The hierarchical distribution and logical relationship of each risk indicator is visualized in the form of a directed acyclic graph. The structure of the Bayesian network is shown in Figure 5, which provides a simplified conceptual illustration of the BN architecture for one risk category. The detailed full network models are provided in Appendix A figures for reference.
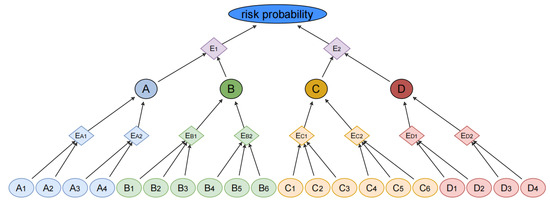
Figure 5.
Total risk Bayesian model.
To conduct an expert survey, the number of questionnaires issued to the public was 100. A total of 92 questionnaires were considered valid. To achieve the frequency of occurrence of each risk indicator, we used the calculation of conditional probability, as shown in Table 7.

Table 7.
Frequency of occurrence of selected risk indicators.
Netica software (version 5.18; Norsys Software Corp., Vancouver, BC, Canada) was used to learn the structure and parameters of the Bayesian network to obtain the posterior probability values of the risk indicators.
The conditional probability data of this model are derived from accident reports and questionnaires. Since all the nodes in this model have only two states, “Yes” or “No”, the following assumptions can be made: ① When the state of each parent node has a favorable effect on the “No” of the child node, it can be assumed that its “Yes” or “No” is a favorable effect on the “No” of the child node. When the state of each parent node has a favorable impact on the “no” of the child node, it can be assumed that the probability of “yes” is Pmin, which is generally assumed to be 0; this parameterization is commonly used in BN studies when data is scarce [13,22]. ② On the contrary, when the state of each parent node has a favorable impact on the “yes” of the child node, it can be assumed that the probability of “yes” is Pmax, which is generally assumed to be 1. Pmax, which is generally assumed to be 1; ③ In the scenario constituted by other state combinations of the parent node, the probability of the corresponding child nodes “yes” should be between Pmin and Pmax, and the specific probability value can be referred to the weight of each parent node as well as the corresponding weight of the corresponding state. Therefore, on the basis of the conditional probability table, the corresponding scoring system is added as the basis for calculating the conditional probability, as shown in Table 8.

Table 8.
Conditional probability scale.
In the above table, aij denotes the weighting coefficient of the corresponding state of the ith parent node under scenario j. Since all the nodes in the network have only two states, their values can be set to 0 (no) and 1 (yes). b denotes the score of the corresponding child node under scenario j, which is calculated as shown in Equation (1). Finally, P denotes the probability that a child node’s state is “yes” under scenario j, which is calculated as shown in the following Equation (2):
From this, the probability that the child node’s state is “yes” under scenario j is P, and the probability that its state is “no” is 1 − P, which leads to the conditional probability table.
This method is suitable for the case that the child nodes will be completely affected by all the corresponding parent nodes, that is, Pmim = 0 and Pmax = 1, but there are also cases that are not completely affected. For example, many factors can cause grounding or collision accidents. This model reflects the direct factors that can mainly cause accidents that is, 0 < Pmin < Pmax < 1 should be satisfied at this time. The other parent nodes are used as a coefficient for the average distribution of scores. Considering that there are only two kinds of weighting coefficients, 0 and 1, in order to facilitate the calculation, the score of the child nodes under each scenario can be replaced by the score of each parent node to meet the requirements of less than 1; the numerator needs to be smaller than the denominator and can be used to increase the average distribution of scoring coefficients. Therefore, Equation (3) is derived. Based on Equation (3), one can derive a probability Equation (4) that is consistent with 0 < P<1.
Equation (1) is used in conjunction with Equation (4) to obtain the probability of a sub-node’s state being “yes” under scenario j, P, and the probability of its state being “no”, 1 − P. Next, the conditional probability of a sub-node’s weakness in the freezing curtain during the active freezing phase is used as a demonstration of the calculation process. Next, the conditional probability of a weak frozen curtain in the active freezing construction phase of the child node is used as a demonstration to show the calculation process. The node has five parent nodes, with the help of two intermediate nodes, each corresponding to four and eight scenarios. The five parent nodes are the brine loss to the soil layer due to the fracture of the freezing pipe, the excessive deflection of the freezing pipe position, the imbalance of the cooling supply of the freezing equipment in series, the excessive equipment outage time, and the decrease in the strength of the geotechnical soil after many freeze–thaw cycles, which correspond to the frequency numbers of 43, 25, 12, 23, and 11 in the questionnaire, respectively (see Table 8), i.e., corresponding to A1 = 15, A2 = 29, A3 = 28, A4 = 31, A5 = 43, and the state weighting coefficients a under the corresponding scenario j are taken as 0 (no) and 1 (yes), then the sub-node scores B and corresponding probabilities under the corresponding scenario j can be calculated according to Formulas (1) and (2) as shown in Table 9 and Table 10, and the model diagram is shown in Appendix A figures.

Table 9.
The conditional probability table of child node EB3.

Table 10.
Table of conditional probabilities for EB4.
The conditional probability table of all intermediate nodes can be obtained through the above method to obtain the conditional probability of nodes in the Bayesian network, and the calculation process of each node will not be repeated here. After inputting the data into the Bayesian network, the probability distribution of the corresponding nodes can be obtained through the calculation of Netica software, and the Bayesian network model is obtained as shown in Figure 6 and Figure 7 is the network model of the construction stage of the freezing hole. The network models for each construction stage are provided in Appendix A figures.
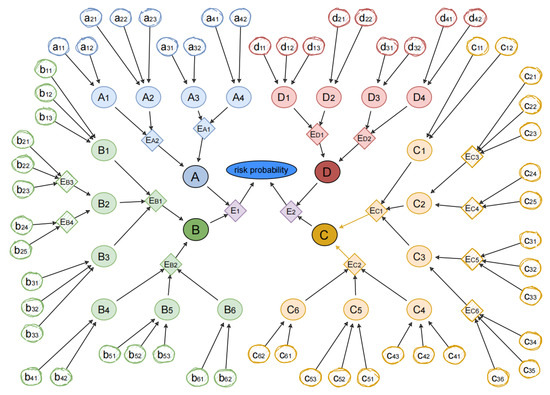
Figure 6.
Construction risk topology of the freezing method for the liaison.
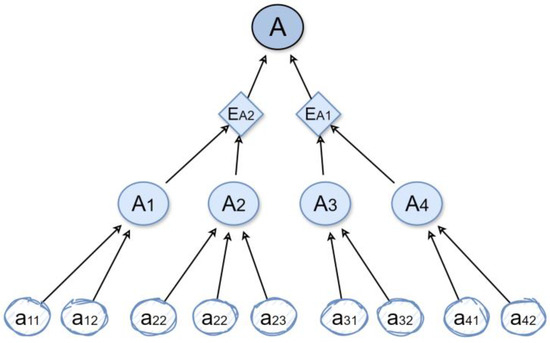
Figure 7.
Risk topology of frozen hole construction.
3. Case Study and Results
3.1. Case Background
This paper relies on the Nanchang Metro Line 2 Hu Fang Station—Nanchang East Station interval, tunnel length of 834 m. Therefore, according to the specification, in the interval, need to establish a contact channel used to connect the tunnel, drainage, personnel evacuation, and the role of fire lamps, using the freezing method plus the concealed excavation method of construction technology, as shown in Figure 8.
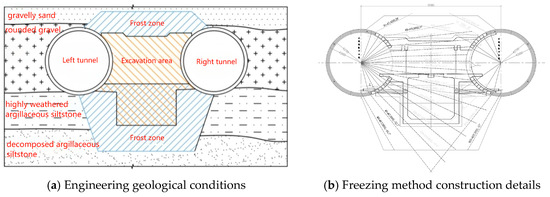
Figure 8.
Schematic diagram of the freezing method for dependent projects.
3.2. Risk Probability and Sensitivity Analysis
As can be seen from Figure A2, the probability of occurrence of safety risk in freezing method construction is 45.9%. This value represents the probability of the top event (“Risk”) being active, which aggregates all underlying risks in the project. While this may seem high, it is consistent with the complex, high-risk nature of underground construction in water-rich strata [5,13]. It indicates that the construction has a high level of safety risk, and reasonable preventive and control measures need to be taken to reduce the construction risk.
Setting the top event as an evidence node, the a posteriori probability of each factor can be evaluated by backward reasoning in the case where the risk of lane change is known to occur (P(RISK = YES) = 100%). When the above conditions are entered into the model, the posteriori probabilities of the remaining nodes are calculated and displayed, as shown in Figure A3. By comparing the a priori probability of each node with the a posteriori probability, the a posteriori probabilities of the remaining nodes are increased in case that the total risk node status is YES. Among them, the a posteriori probability of the excavation structure construction phase (node C) increased most significantly by 12.1%. In addition, by analyzing the changes in the a priori and a posteriori probability of the root node, it can be found that the risk factor that has a greater impact on the topping event is the stage of brine loss due to the breakage of the freezing pipe (node b21). To demonstrate the cascading effects quantitatively, when evidence of ‘Freezing Pipe Fracture (B3)’ is set to 100%, the probability of a ‘Weakened Freezing Curtain (B2)’ increases from 24.5% to 78.3%. Consequently, the probability of ‘Excavation Instability (C2)’ rises from 16.7% to 42.9%.
The reliability of the Bayesian network model for the construction risk of the freezing method was analyzed using sensitivity analysis. Sensitivity analysis with RISK as the target variable: the higher sensitivity of a risk factor indicates that the factor has a greater impact on the occurrence of the risk, and the size of the sensitivity index of all the factors was calculated and ranked, as shown in Table 11.

Table 11.
Sensitivity indices with total risk as the target variable.
The sensitivity analysis shows that the excavation phase of building C has the largest sensitivity index of 3.97%, which has the strongest correlation to the occurrence of risk, followed by the active freezing construction phase of B, which has a greater impact on the results of the risk evaluation of the freezing method of construction.
4. Discussion
4.1. Key Risk Factors and Comparative Analysis
By integrating WBS-RBS risk decomposition with Bayesian network dynamic modeling, this study systematically elucidates the core risk mechanism in freezing method construction of subway connecting passages. Analysis reveals that the excavation stage (weight: 52.94%; sensitivity: 3.97%) constitutes the absolute core of risk prevention, with risk contribution substantially exceeding other phases. This finding aligns with real-world accident statistics in subway construction [15,16] and industry reports that identify excavation as the most hazardous phase in tunneling projects. The predominance stems from multi-field coupling complexity (temperature-stress-seepage fields): when the freezing curtain interfaces with water-rich sand layers, risk factors including insufficient support strength (C3/C4), groundwater seepage (R52), and freezing pipe fracture (B3) initiate cascading failures that amplify accident probability by 46.3%. These findings align with Zhai et al.’s [14] freezing pipe fracture warnings and Zheng’s [16] support failure case study in aquiferous strata. Crucially, this work provides the first quantitative dynamic pathway analysis via Bayesian networks. For instance, freezing pipe fracture (B3) → brine leakage → weakened freezing curtain (B2) increases excavation instability risk by 12.1%, demonstrating the critical failure chain: equipment failure → structural compromise → stratum deformation.
4.2. Methodological Advantages and Comparisons
The Bayesian network approach developed in this study offers significant advantages over traditional risk assessment methods. Compared to static methods like Fuzzy Comprehensive Evaluation (FCE) [11] or Analytic Hierarchy Process (AHP) alone, our BN model provides dynamic updating capabilities that allow for real-time risk assessment as new information becomes available. Unlike machine learning approaches that often function as “black boxes,” our BN model offers transparent, explainable reasoning through its network structure and conditional probability tables, which is crucial for engineering decision-making. While some studies have combined FCE with BN [13], our work advances the field by integrating WBS-RBS for systematic risk identification with AHP for weighted prioritization, creating a more comprehensive framework specifically tailored for freezing method construction risks.
Sensitivity analysis further identifies human management factors (R12/R14) as the most pervasive influences among 59 root nodes, affecting 12 risk events. Inadequate safety awareness and management deficiencies persist from drilling through thawing stages, indicating that sole reliance on technical controls is insufficient. Integration of intelligent monitoring platforms (e.g., personnel positioning systems) with standardized operational procedures is therefore essential.
4.3. Practical Implications for Risk Management
The findings of this study have significant implications for safety management in freezing method construction projects. First, the identification of the excavation stage as the most critical phase suggests that resource allocation and monitoring efforts should be prioritized during this phase. Second, the quantitative risk pathways identified through the BN model provide specific targets for intervention measures. For example, the high sensitivity of freezing pipe fracture suggests that enhanced quality control measures for freezing pipes and more frequent inspections could yield significant risk reduction benefits.
To integrate human/organizational risk control into the Bayesian framework, we propose concrete measures: (1) incorporating real-time data from personnel RFID tags and equipment sensors directly into the BN model to dynamically update the probabilities of human factors (R12, R14); (2) developing a digital twin platform that integrates the BN model with real-time monitoring data for continuous risk assessment and early warning; and (3) implementing regular training programs focused on the specific risk factors identified as most critical in the model.
4.4. Limitations and Future Research
Three primary limitations warrant mention the following: First, data dependency constraints exist. Prior probabilities derived from 92 expert questionnaires, while satisfying consistency thresholds (CR < 0.1), lack generalizability for complex strata like high-permeability clays. Future work should incorporate IoT sensors to capture real-time parameters (frozen soil strength, seepage velocity) and reduce subjectivity. Additionally, future research could employ Monte Carlo simulations to propagate uncertainty through the Bayesian network, providing probability distributions rather than point estimates for more robust risk assessment.
Second, extreme climate responses (e.g., high-intensity rainstorms R54) remain notably absent from the Nanchang case study. The proposed model could be extended to incorporate climate-related variables by adding nodes for rainfall intensity, groundwater level fluctuations, and temperature variations, with conditional probabilities derived from historical weather data and hydrological models.
Third, cross-project validation is limited. Current weight optimization targets sandy strata; in Zheng’s [16] silty clay research, thaw settlement grouting risks (31.48%) may require upward adjustment, necessitating multi-geological case comparisons. The model structure (WBS-RBS) would remain valid for different geological conditions, but the conditional probability tables and AHP weights would need recalibration using project-specific data. Future research should validate and adapt the framework for different geological contexts such as clayey soils or karst conditions.
5. Conclusions
This study established a dynamic risk identification framework for subway connecting passage construction using artificial freezing methods based on Bayesian networks. The main conclusions are as follows:
- (1)
- A risk evaluation system encompassing four construction stages and twenty secondary indicators was developed through integrated WBS-RBS decomposition of construction processes and risk factors.
- (2)
- Using the Analytic Hierarchy Process (AHP), risk weights were quantified, revealing that the excavation support stage (52.94%) and thawing-grouting stage (31.48%) exerted the most significant influence on overall risk.
- (3)
- A Bayesian network-based risk assessment model was constructed, with risk probabilities calculated through expert surveys and accident data. Results demonstrated an overall construction risk probability of 46.3%, with the excavation stage exhibiting the highest sensitivity index (3.97%)—identifying it as the core risk control link. Key contributing factors included freezing pipe fracture, insufficient support strength, and groundwater seepage. Real-time probability updating through construction monitoring data demonstrated the model’s capability for dynamic risk early warning.
- (4)
- Contrary to silty clay strata, where thaw settlement dominates [14], excavation stability emerged as the primary risk in sandy strata, highlighting geological dependencies in risk prioritization.
Author Contributions
Conceptualization, X.G. and L.L.; methodology, L.L.; software, X.G.; verification, X.G., L.L. and S.H.; formal analysis, Z.W.; survey, S.H.; resources, L.L.; data management, S.H.; writing—original preparation, X.G.; writing—review and editing, X.G., L.L. and S.H.; visualization, X.G.; supervision, Z.W.; project Management, L.L.; funding acquisition, L.L. All authors have read and agreed to the published version of the manuscript.
Funding
The Natural Science Foundation of Jiangxi Province (Youth Foundation Program) (Grant number 20232BAB214097); the Key Research and Development Program of the Jiangxi Science and Technology Special Fund Project (No. 20232BBE50025), the Doctoral Scientific Research Foundation Project of East China University of Technology (No. DHBK2023014).
Institutional Review Board Statement
Not applicable.
Informed Consent Statement
Not applicable.
Data Availability Statement
The data supporting the findings of this study are primarily derived from two sources: expert questionnaires used for risk probability assessment and AHP weight calculations (92 validated responses). Project-specific parameters from the engineering case study (Nanchang Metro Line 2 Hu Fang Station–Nanchang East Station interval). Due to the nature of this research, questionnaire data contain expert opinions subject to confidentiality agreements. Engineering data involve proprietary construction details and site-specific geological monitoring records. These datasets are not publicly archived to protect privacy and commercial confidentiality. However, anonymized data supporting Bayesian network modeling (e.g., WBS-RBS matrices, conditional probability tables) and processed AHP results are available in Appendix A and Table 2, Table 3, Table 4, Table 5, Table 6, Table 7, Table 8, Table 9, Table 10 and Table 11 within the manuscript. The detailed WBS-RBS matrix used in this study is not publicly available due to its project-specific nature but can be provided upon reasonable request. Requests for further details should be directed to the corresponding author and will be considered on a case-by-case basis.
Conflicts of Interest
The authors declare no conflicts of interest.
Appendix A
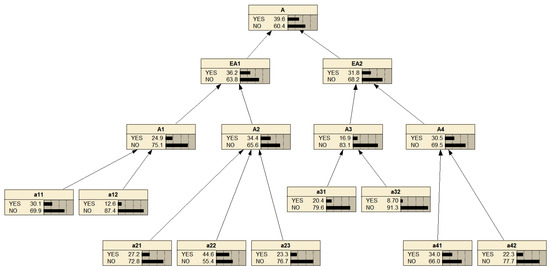
Figure A1.
Network model of the freezing hole construction stage.
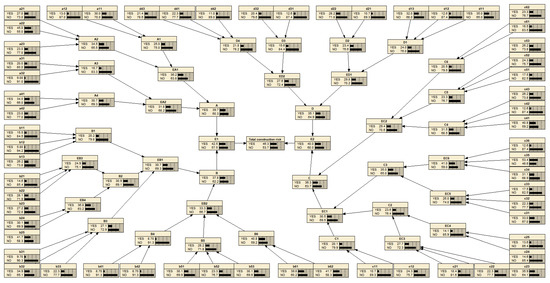
Figure A2.
The construction risk prior probability model of freezing method.
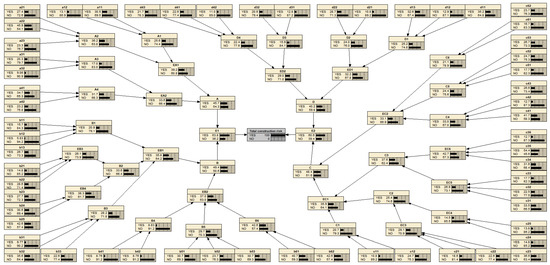
Figure A3.
Risk posterior probability model of freezing method construction.
References
- Chen, H.; Lei, Y.; Xia, L.; Deveci, M.; Chen, Z.-S.; Liu, Y. Dynamic evaluation of the safety risk during shield construction near existing tunnels via a pair-copula Bayesian network. Appl. Soft Comput. 2025, 169, 112583. [Google Scholar] [CrossRef]
- Liu, P.; Jin, X.; Shang, Y.; Zhu, J. Analysis of collapse risks under cut and cover method based on multi-state fuzzy Bayesian network. PLoS ONE 2025, 20, e0321382. [Google Scholar] [CrossRef] [PubMed]
- China Urban Rail Transit Association. Overview of Urban Rail Transit Lines in Mainland China in the First Half of 2024. Available online: https://www.camet.org.cn/xytj/xxfb/589415181037637.shtml (accessed on 18 June 2025).
- Yu, P.; Liu, H.; Wang, Z.; Fu, J.; Zhang, H.; Wang, J.; Yang, Q. Development of urban underground space in coastal cities in China: A review. Deep Earth Sci. 2023, 2, 148–172. [Google Scholar] [CrossRef]
- Zhou, Z.; Liu, S.; Qi, H. Mitigating subway construction collapse risk using Bayesian network modeling. Autom. Constr. 2022, 143, 104541. [Google Scholar] [CrossRef]
- Zhang, Y.; Gu, Y.; Lian, N.; Peng, L.; Hao, Y.; Wang, W.; Tian, R.; Qin, G. Analysis of urban subway construction collapse disaster chain and research on chain breaking and disaster reduction. PLoS ONE 2025, 20, e0318269. [Google Scholar] [CrossRef] [PubMed]
- Shi, Z.; Xu, J.; Xie, X.; Zeng, H.; Xu, W.; Niu, G.; Xiao, Z. Disaster mechanism analysis for segments floating of large-diameter shield tunnel construction in the water-rich strata: A case study. Eng. Fail. Anal. 2024, 157, 107953. [Google Scholar] [CrossRef]
- Zhang, S.; Yue, Z.; Lu, X.; Zhang, Q.; Sun, T.; Qi, Y. Model test and numerical simulation of foundation pit constructions using the combined artificial ground freezing method. Cold Reg. Sci. Technol. 2023, 205, 103700. [Google Scholar] [CrossRef]
- Fu, Y.; Hu, J.; Wu, Y. Finite element study on temperature field of subway connection aisle construction via artificial ground freezing method. Cold Reg. Sci. Technol. 2021, 189, 103327. [Google Scholar] [CrossRef]
- Sai, H. Study on Risk Management of XTC Metro Construction Project. Master’s Thesis, China University of Petroleum, Qingdao, China, 2025. [Google Scholar] [CrossRef]
- Huang, Y. Research on Construction Risk Assessment of Subway Foundation Pit Engineering. Master’s Thesis, Guangxi University, Nanning, China, 2023. [Google Scholar] [CrossRef]
- Lu, X.-Y.; Xu, C.-S.; Hou, B.-W.; Du, X.-L.; Li, L.-Y. Risk assessment of metro construction based on dynamic Bayesian network. Chin. J. Geotech. Eng. 2022, 44, 10. [Google Scholar] [CrossRef]
- Wang, Z.Z.; Chen, C. Fuzzy comprehensive Bayesian network-based safety risk assessment for metro construction projects. Tunn. Undergr. Space Technol. 2017, 70, 330–342. [Google Scholar] [CrossRef]
- Zhai, Q.; Gu, W.H.; Jing, Z.Q. Safety Risk Assessment for a Subway Connecting Passage Constructed by Freezing Method. Mod. Tunn. Technol. 2021, 58, 10. [Google Scholar]
- Ma, L.; Zhang, R.K. Case study on construction risk management and control of contact channel freezing method. J. Highw. Transp. Res. Dev. Appl. Technol. Ed. 2016, 12, 273–274. [Google Scholar]
- Zheng, G.P. Study on Construction Safety Risk Control of Connecting Passage of Metro Tunnel in Rich Water Sand Layer. Master’s Thesis, Huazhong University of Science and Technology, Wuhan, China, 2022. [Google Scholar] [CrossRef]
- Du, P. Research on Safety Management of Assembled Concrete Building Construction on WBS-RBS Method. Master’s Thesis, Anhui University of Science and Technology, Huainan, China, 2020. [Google Scholar] [CrossRef]
- Xu, N.; Guo, C.; Wang, L.; Zhou, X.; Xie, Y. A three-stage dynamic risk model for metro shield tunnel construction. KSCE J. Civil Eng. 2024, 28, 503–516. [Google Scholar] [CrossRef]
- Hong, R.; Cai, H.; Li, M. Integrated prediction model of ground surface deformation during tunnel construction using local horizontal freezing technology. Arab. J. Sci. Eng. 2022, 47, 4657–4679. [Google Scholar] [CrossRef]
- Go, G.-H.; Le, V.D. Optimization study on artificial ground freezing in elliptical tunnel construction: A comprehensive analysis of groundwater flow and thermodynamic parameters of soil. Tunn. Undergr. Space Technol. 2025, 163, 106774. [Google Scholar] [CrossRef]
- Zhou, H.; Zhao, Y.; Shen, Q.; Yang, L.; Cai, H. Risk assessment and management via multi-source information fusion for undersea tunnel construction. Autom. Constr. 2020, 111, 103050. [Google Scholar] [CrossRef]
- Zhou, H.; Gao, B.; Zhao, X.; Peng, L.; Bai, S. Developing a cloud evidence method for dynamic early warning of tunnel construction safety risk in undersea environment. Dev. Built Environ. 2023, 16, 100225. [Google Scholar] [CrossRef]
Disclaimer/Publisher’s Note: The statements, opinions and data contained in all publications are solely those of the individual author(s) and contributor(s) and not of MDPI and/or the editor(s). MDPI and/or the editor(s) disclaim responsibility for any injury to people or property resulting from any ideas, methods, instructions or products referred to in the content. |
© 2025 by the authors. Licensee MDPI, Basel, Switzerland. This article is an open access article distributed under the terms and conditions of the Creative Commons Attribution (CC BY) license (https://creativecommons.org/licenses/by/4.0/).