Article

Study on the Mechanical Behavior of a Large-Segment Fully Prefabricated Subway Station During the Construction Process

1
Key Laboratory of Urban Underground Engineering, Ministry of Education, Beijing Jiaotong University, Beijing 100044, China
2
China Railway Xi’an Bureau Group Co., Ltd., Xi’an 710005, China
*
Author to whom correspondence should be addressed.
Appl. Sci. 2025, 15(18), 9941; https://doi.org/10.3390/app15189941
Submission received: 18 July 2025 / Revised: 31 August 2025 / Accepted: 2 September 2025 / Published: 11 September 2025

Abstract

In response to issues of long construction cycles, high pollution, and labor shortages in traditional cast in situ subway station construction, a refined 3D model of a large-segment prefabricated subway station was established using ABAQUS software 2024, with mechanical behavior throughout the construction process studied based on the Shenzhen Huaxia Station project case. The model incorporates a concrete inelastic damage constitutive model and a steel elastic–plastic model, accurately simulates key components, including dry joints of mortise–tenon grooves, prestressed reinforcement, and bolted connections, and implements a seven-phase construction sequence. Research findings indicate the following: (1) During component assembly, the roof vault settlement remains ≤3.8 mm, but backfilling significantly increases displacements (roof settlement reaches 45 mm, middle slab deflection measures 66.91 mm). (2) Longitudinal mortise–tenon joints develop stress concentrations due to stiffness disparities, with mid-column installation slots identified as vulnerable zones exhibiting maximum Von Mises stress of 32 MPa. (3) Mid-column eccentricity induces structural asymmetry, causing increased deflection in longer-span middle slabs, corbel contact stress differentials up to 6 MPa, and bolt tensile stresses exceeding 1.1 GPa. (4) The arched roof effectively transfers loads via three-hinged arch mechanisms, though spandrel horizontal displacement triggers 5 cm rebound in diaphragm wall displacement. Conclusions confirm overall the stability of the prefabricated structure while recommending the optimization of member stiffness matching, avoidance of asymmetric designs, and localized reinforcement for mortise–tenon edges and mid-column joints. Results provide valuable references for analogous projects.

1. Introduction

Subway station construction faces multifaceted challenges, including large-scale projects, tight schedules, complex subsurface environments, and stringent quality requirements, for which traditional cast in situ methods prove insufficient in meeting contemporary engineering demands [1,2]. Prefabrication technology offers significant advantages by ensuring construction quality, enhancing efficiency, facilitating rapid ground transportation recovery, and substantially reducing environmental impacts, such as dust and noise pollution, thereby effectively promoting sustainable development in the construction industry [3]. Mohamed Marzouk [4] integrated Building Information Modeling (BIM) with Simos’ ranking method to develop a global rating system monitoring Indoor Environmental Quality (IEQ) metrics (temperature/PM concentrations) in subway networks, demonstrating its efficacy in determining maintenance priority indices and optimizing station service levels through globalized maintenance action rankings validated via case study. Peng Ding [5] stated that prefabrication technology constitutes an up-and-coming alternative amid worsening labor shortages. Kunyang Chen [6] developed a low-carbon subway station construction methodology by pioneering novel prefabricated structures with internal bracing systems and large-segment full preassembly, thereby avoiding unnecessary underground space occupation. Song Gao [7] established a 3D nonlinear numerical model considering soil-structure interaction (SSI), comprehensively simulating the entire construction process from foundation pit excavation to structural assembly while clarifying initial pre-dynamic-loading conditions, and conducted an in-depth investigation into seismic response mechanisms of prefabricated subway stations, revealing that neglecting assembly procedures in simulations significantly distorts initial seismic states, causing component bending moment errors reaching 59% and axial force errors up to 35%, thereby providing a fundamental basis for mandating construction process considerations in the seismic design of prefabricated stations. Juyang Wu [8] addressed space constraints and bracing interferences in cut-and-cover internally braced pits for prefabricated subway station construction by proposing a modular design methodology with two novel connection technologies—circular hinged connections (CHC) for circumferential joints and flexible locking joints for longitudinal joints—achieving efficient spatial utilization equilibrium and rapid component assembly, while succeeding in the first application on the Shenzhen Metro, demonstrating the significant potential of prefabricated subway stations. Chunyu Wu [9] validated the superiority of novel partial-preassembly structures incorporating prefabricated roof vaults through refined numerical models of grouted/dry mortise–tenon joints and comparative 3D finite element seismic analyses, demonstrating enhanced plastic strain distribution, improved inter-story deformation capacity, and optimized internal force distribution in critical components, significantly reducing column damage while elevating overall seismic performance. Jinnan Chen [10] systematically compared response differences between prefabricated underground structures with rigid versus non-rigid splicing joints against cast in situ structures by establishing refined finite element models and conducting seismic time-history analyses considering soil-structure interaction, revealing that rigid-joint structures exhibit essentially equivalent displacement responses to cast in situ structures despite slightly reduced internal force damage at mid-column bases, while non-rigid joint structures show modestly increased inter-story drifts but significantly alleviated mid-column internal force damage, further identifying interfacial bond strength between existing and new concrete in horizontal composite members as the critical factor governing stiffness degradation and internal force redistribution in prefabricated structures. Tao L. [11] established a 3D finite element model analyzing nonlinear mechanical and deformation behaviors of subway stations, revealing that prefabricated subway structures form a three-hinged arch load-bearing system supported by diaphragm walls/foundations—demonstrating superior overall load-bearing capacity and thin-walled member lightweight advantages—while identifying cumulative damage in spandrel–waist–foot regions, causing stiffness degradation as the primary failure mechanism, and achieving the comprehensive optimization of safety, cost and constructability.
The traditional construction industry, in employing cast in situ structures, faces issues of multiple construction processes, extended project durations, weather vulnerability, and excessive resource consumption [12]. Another significant drawback of cast in situ concrete lies in crack susceptibility, particularly for mass underground structures where inadequate maintenance may induce widespread cracking. To resolve these issues, achieving sustainable and eco-friendly construction, infrastructure industries urgently require construction industrialization to be embraced through prefabrication methodologies, realizing objectives of enhanced productivity, reduced construction time/cost, and minimized environmental impacts [13,14,15]. As primary load-bearing components of subway station structures, the connection reliability of center columns directly influences structural stability and safety [16,17]. Current practice primarily employs two connection methodologies for precast concrete columns: wet connections using grouted sleeves and dry connections with welded/bolted joints. Extensive research confirms that precast columns with grouted sleeve connections achieve seismic performance comparable to cast in situ counterparts [18,19,20]. Liu H [21] conducted quasi-static tests on end-region joints of precast columns at Beijing Jin’anqiao prefabricated subway station, revealing comparable ultimate bearing capacities between precast and cast in situ columns, though exhibiting significant reductions in ductility and energy dissipation capacities with increasing axial compression ratios. These findings highlight limitations in ductility for wet connections, along with uncontrolled plastic failures, prolonged construction periods, and quality control challenges. While existing studies extensively address component selection and joint mechanical properties of prefabricated subway stations alongside their seismic performance, research gaps persist regarding the mechanical responses of large-segment fully prefabricated subway stations under non-seismic conditions, noting that seismic response analysis remains outside the scope of this investigation. This study, based on Shenzhen Metro Line 6 Branch Phase II Huaxia Station, provides construction-phase-specific investigations into structural displacements, component-level behaviors, and interfacial mechanics, delivering theoretical underpinnings for prefabricated subway station construction.

2. Project Overview

Shenzhen Metro Line 6 Branch Phase II Huaxia Station is situated at the intersection of Guangqiao Road and Huaxia Road in Guangming District, aligned north–south along Guangqiao Road. The station structure spans 213.1 m (prefabricated section: 158 m long × 21.7 m wide; cast in situ section: 55.1 m long × 21.9 m wide) with two ventilation complexes and four entrance–exit passages. The cast in situ section features a two-story underground double-column three-span framed structure, while the prefabricated section adopts a two-story underground column-free concourse with a conventionally columned platform-vaulted structure. Adjacent stations are Guangmingcheng Station (upstream) and Guangming Town Station (downstream). Tunnel sections connecting Guangming Town–Huaxia and Huaxia–Guangmingcheng stations employ shield tunneling methods launched from both ends of this station. Located within Guangqiao Road’s traffic-intensive zone, the station experiences high vehicular flow and complex surroundings, with Figure 1 illustrating its location and environmental context.
The Huaxia Station area features original marine-alluvial plains transformed into level terrain through artificial filling–excavation processes. Overburden strata comprise Holocene anthropogenic fill, Quaternary fluvial–pluvial deposits (mucky clay, silty clay, medium-coarse sand), and Late Pleistocene residual deposits, underlain by Ordovician granite bedrock. Geotechnical characteristics of station strata are tabulated in Table 1.
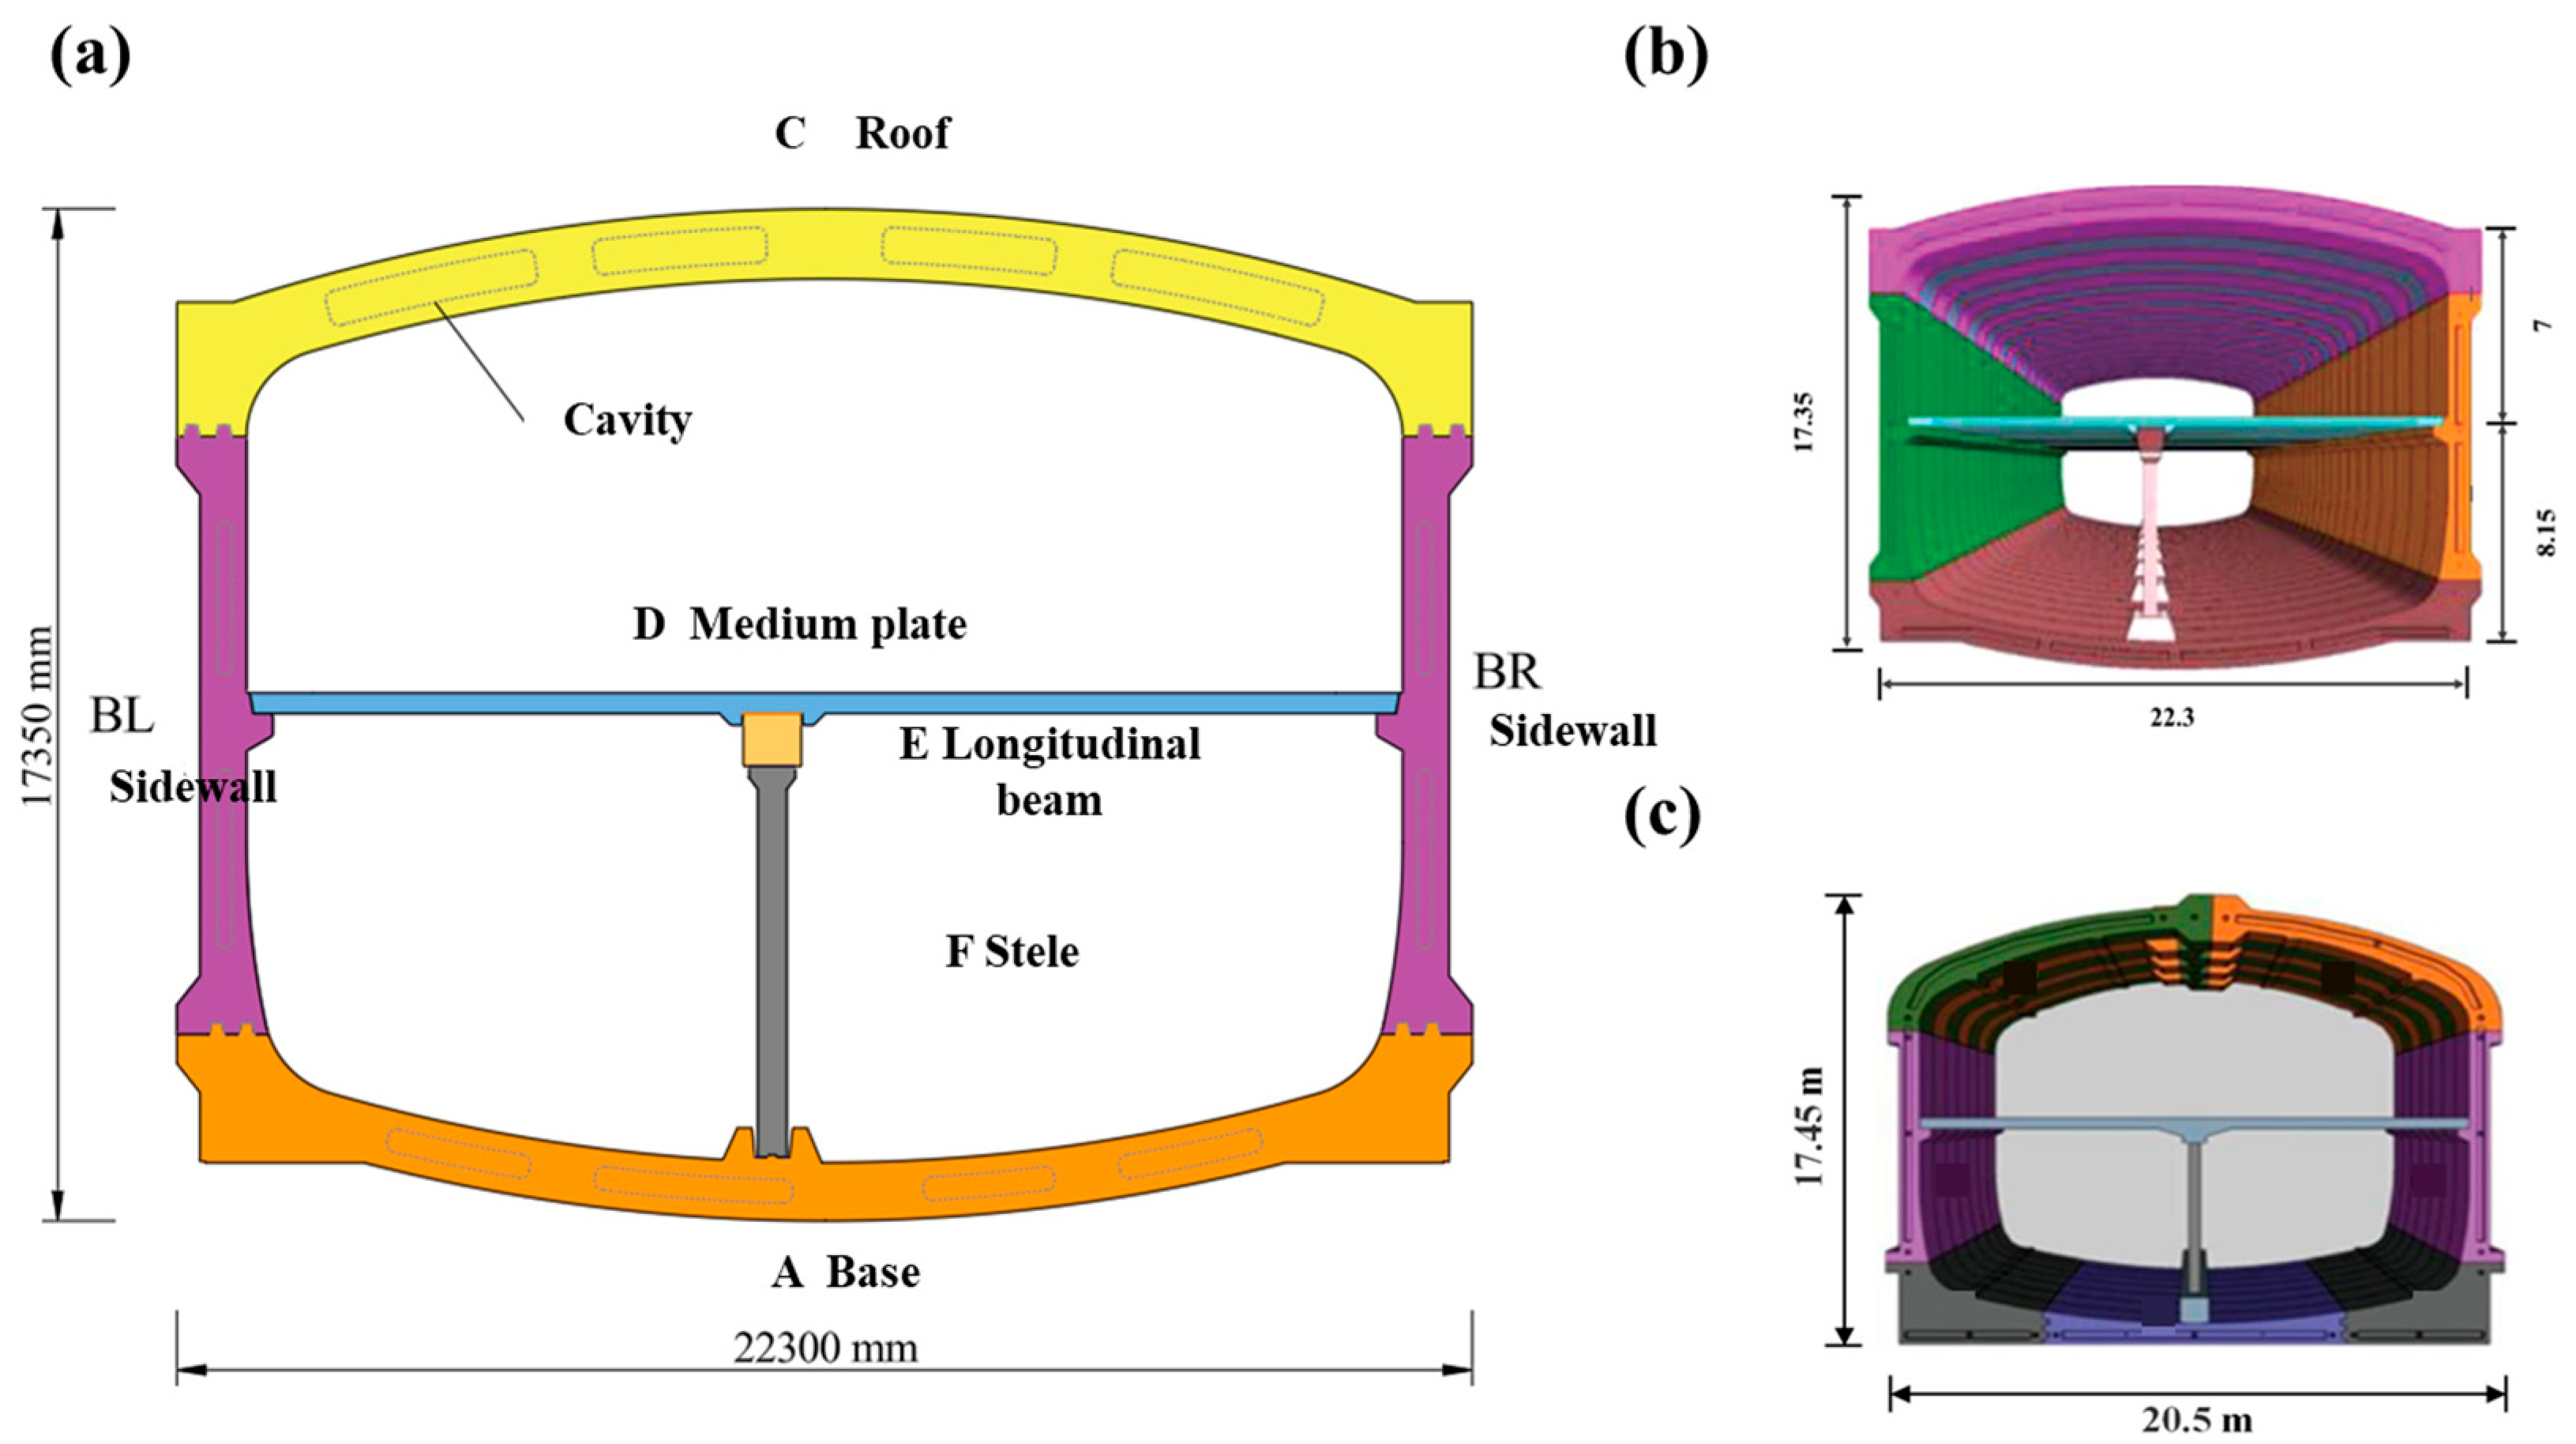
The total length of Huaxia Station’s main structure measures 213.1 m (prefabricated section: 158 m/79 rings; cast in situ section: 55.1 m). The prefabricated section comprises a two-story underground vaulted structure featuring a column-free concourse level and column-supported platform level. Each ring consists of four precast components: base slab, left/right side walls, and roof slab. Precast elements include longitudinal girders and center columns, while the intermediate floor employs cast in situ composite construction. Structural cross-section details are presented in Figure 2a.
The arched roof transfers vertical loads to sidewalls through arch mechanisms, reducing bending deformation while counterbalancing lateral earth pressures. Sidewalls and diaphragm walls form lateral load-resisting systems via integrated force-transfer keys. Prefabricated vault blocks employ mortise groove dry joints for interlocking assembly, connecting to sidewalls through grouted mortise groove joints. The intermediate floor system comprises precast slabs, longitudinal girders, columns, and socket foundations: columns are embedded in socket foundations, with cap anchors securing girders atop columns; slabs connect to girders through dual-connection corbel supports featuring groove sockets with shear bolts. Shenzhen Metro optimized the Changchun prototype (Figure 2b,c) by consolidating segmented base/roof slabs into monolithic designs, enhancing assembly efficiency and watertightness.
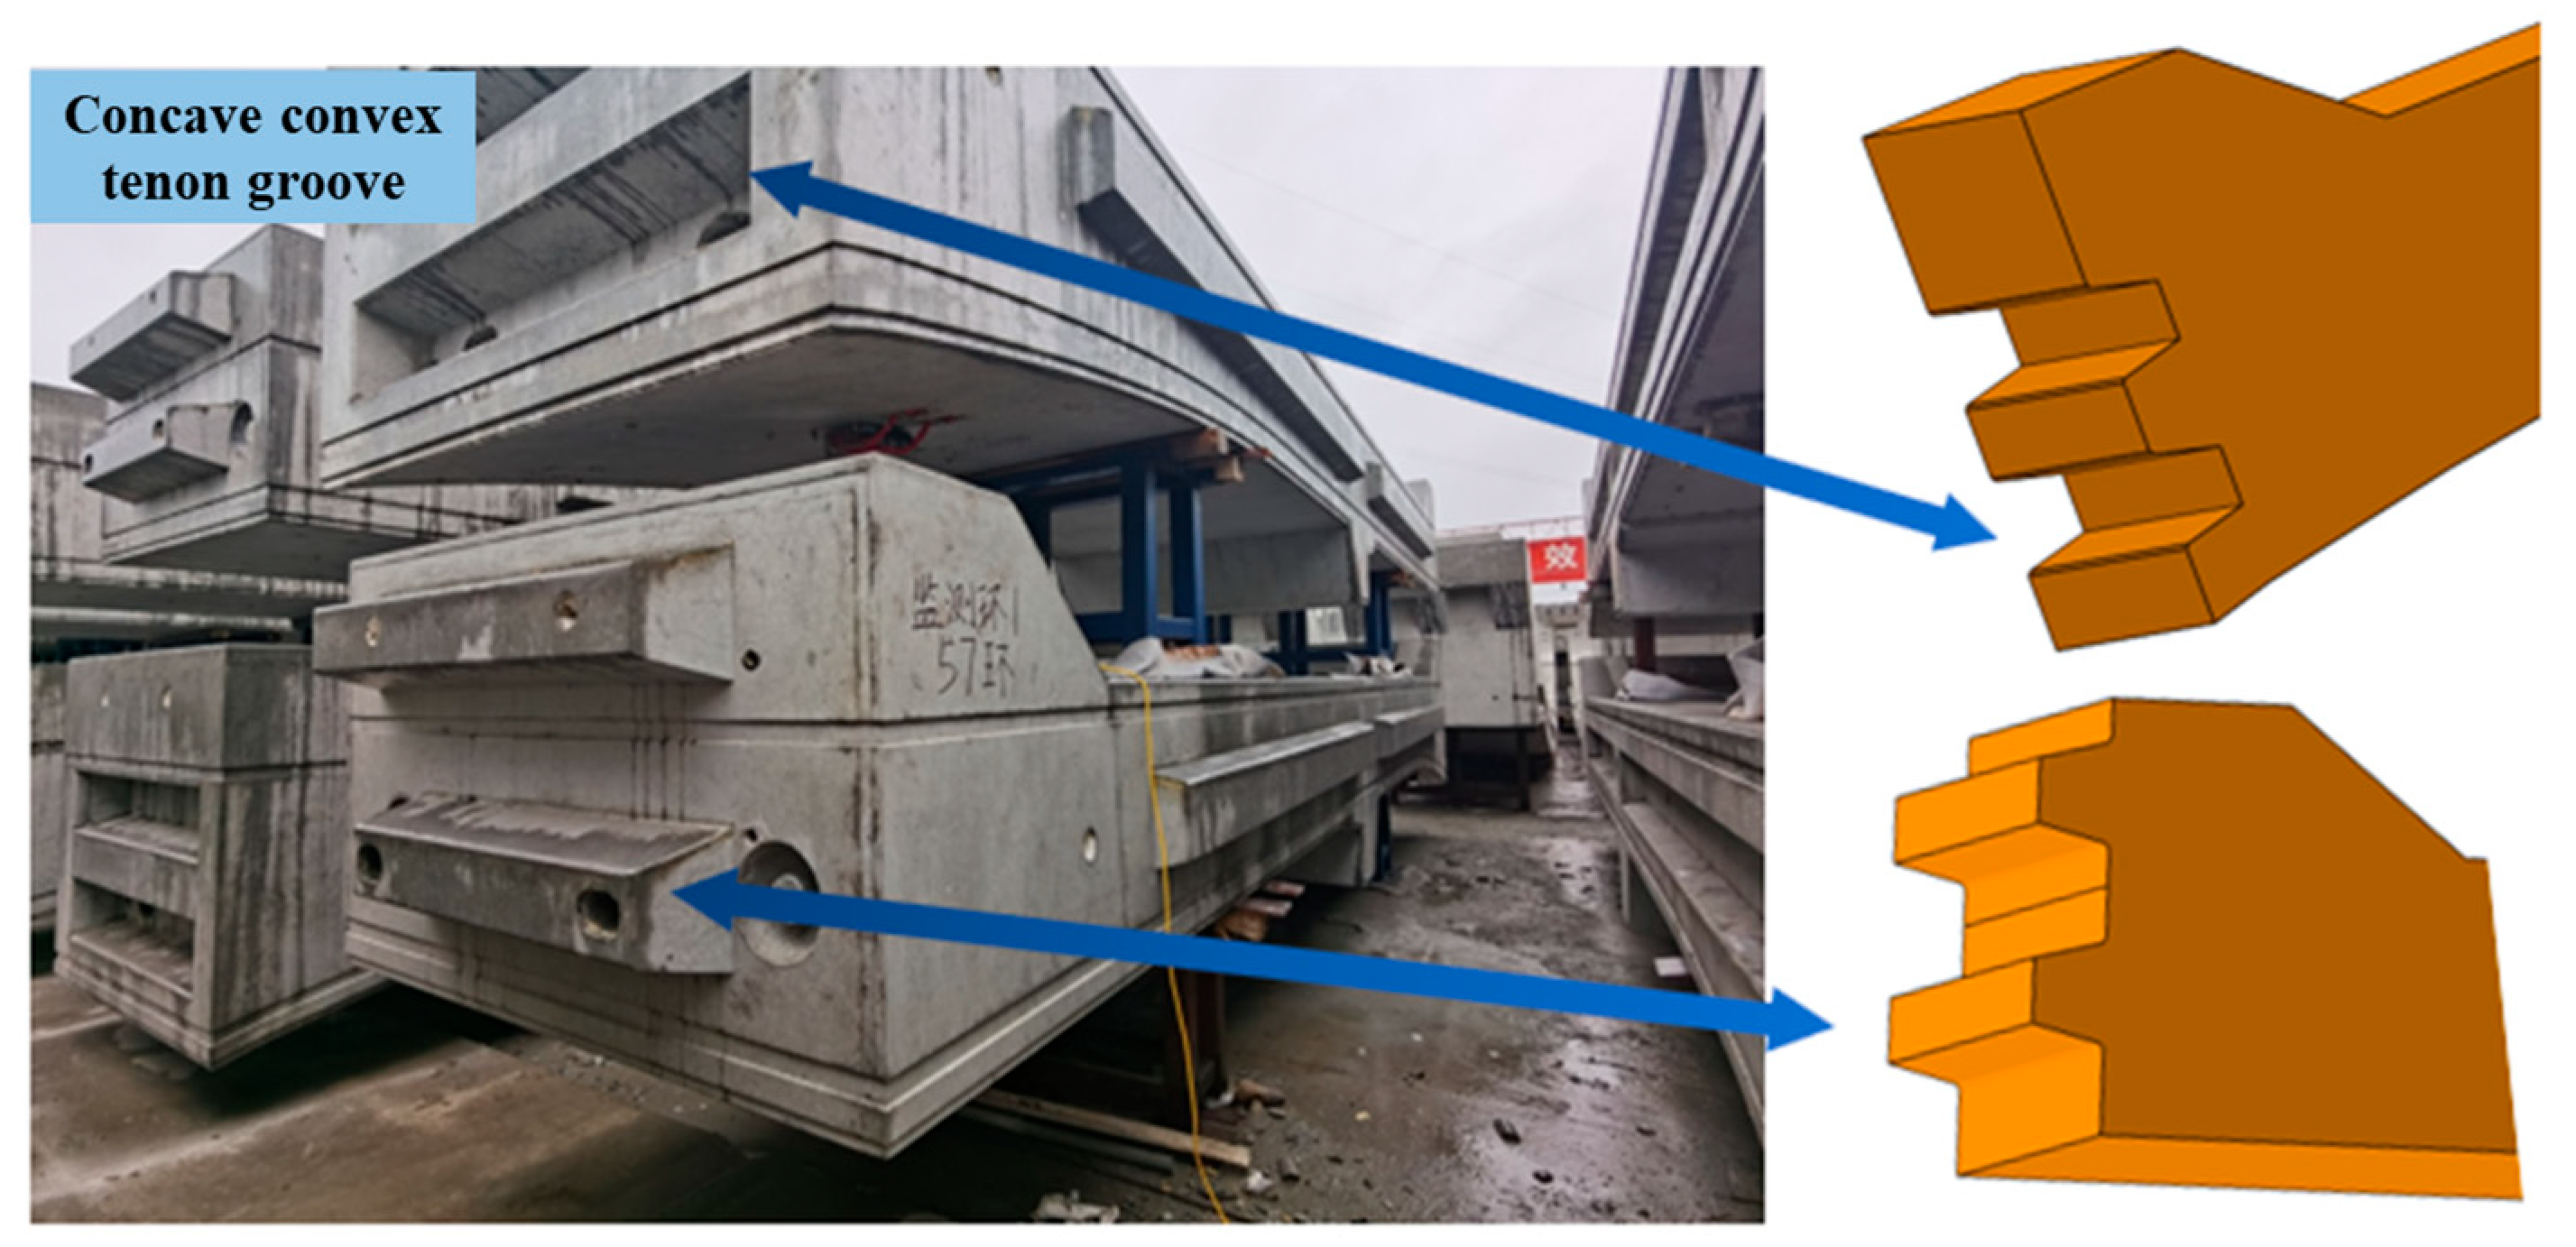
Connection joints of precast components constitute core technology for prefabricated subway stations, with their mechanical behavior and construction quality directly impacting overall structural safety. Tailored to Shenzhen’s engineering requirements, grouted mortise groove joint solutions were adopted as illustrated in Figure 3. This joint system comprises three elements: groove, tenon, and joint clearance. During construction, modified epoxy grout is injected through pre-embedded grouting holes, forming reliable connections upon curing that effectively transfer structural internal forces while controlling interfacial displacements.

3. Study on the Mechanical Behavior of a Large-Segment Fully Prefabricated Subway Station During the Construction Process

3.1. Numerical Model Establishment

This chapter employs ABAQUS software 2024 to simulate the assembly stages of precast components, comprehensively analyzing transverse/longitudinal mechanical behavior distribution across full cross-sections of prefabricated segments, thus proposing full-process construction optimization methodologies for large-segment fully prefabricated subway station structures.

3.1.1. Model Geometry and Mesh Division

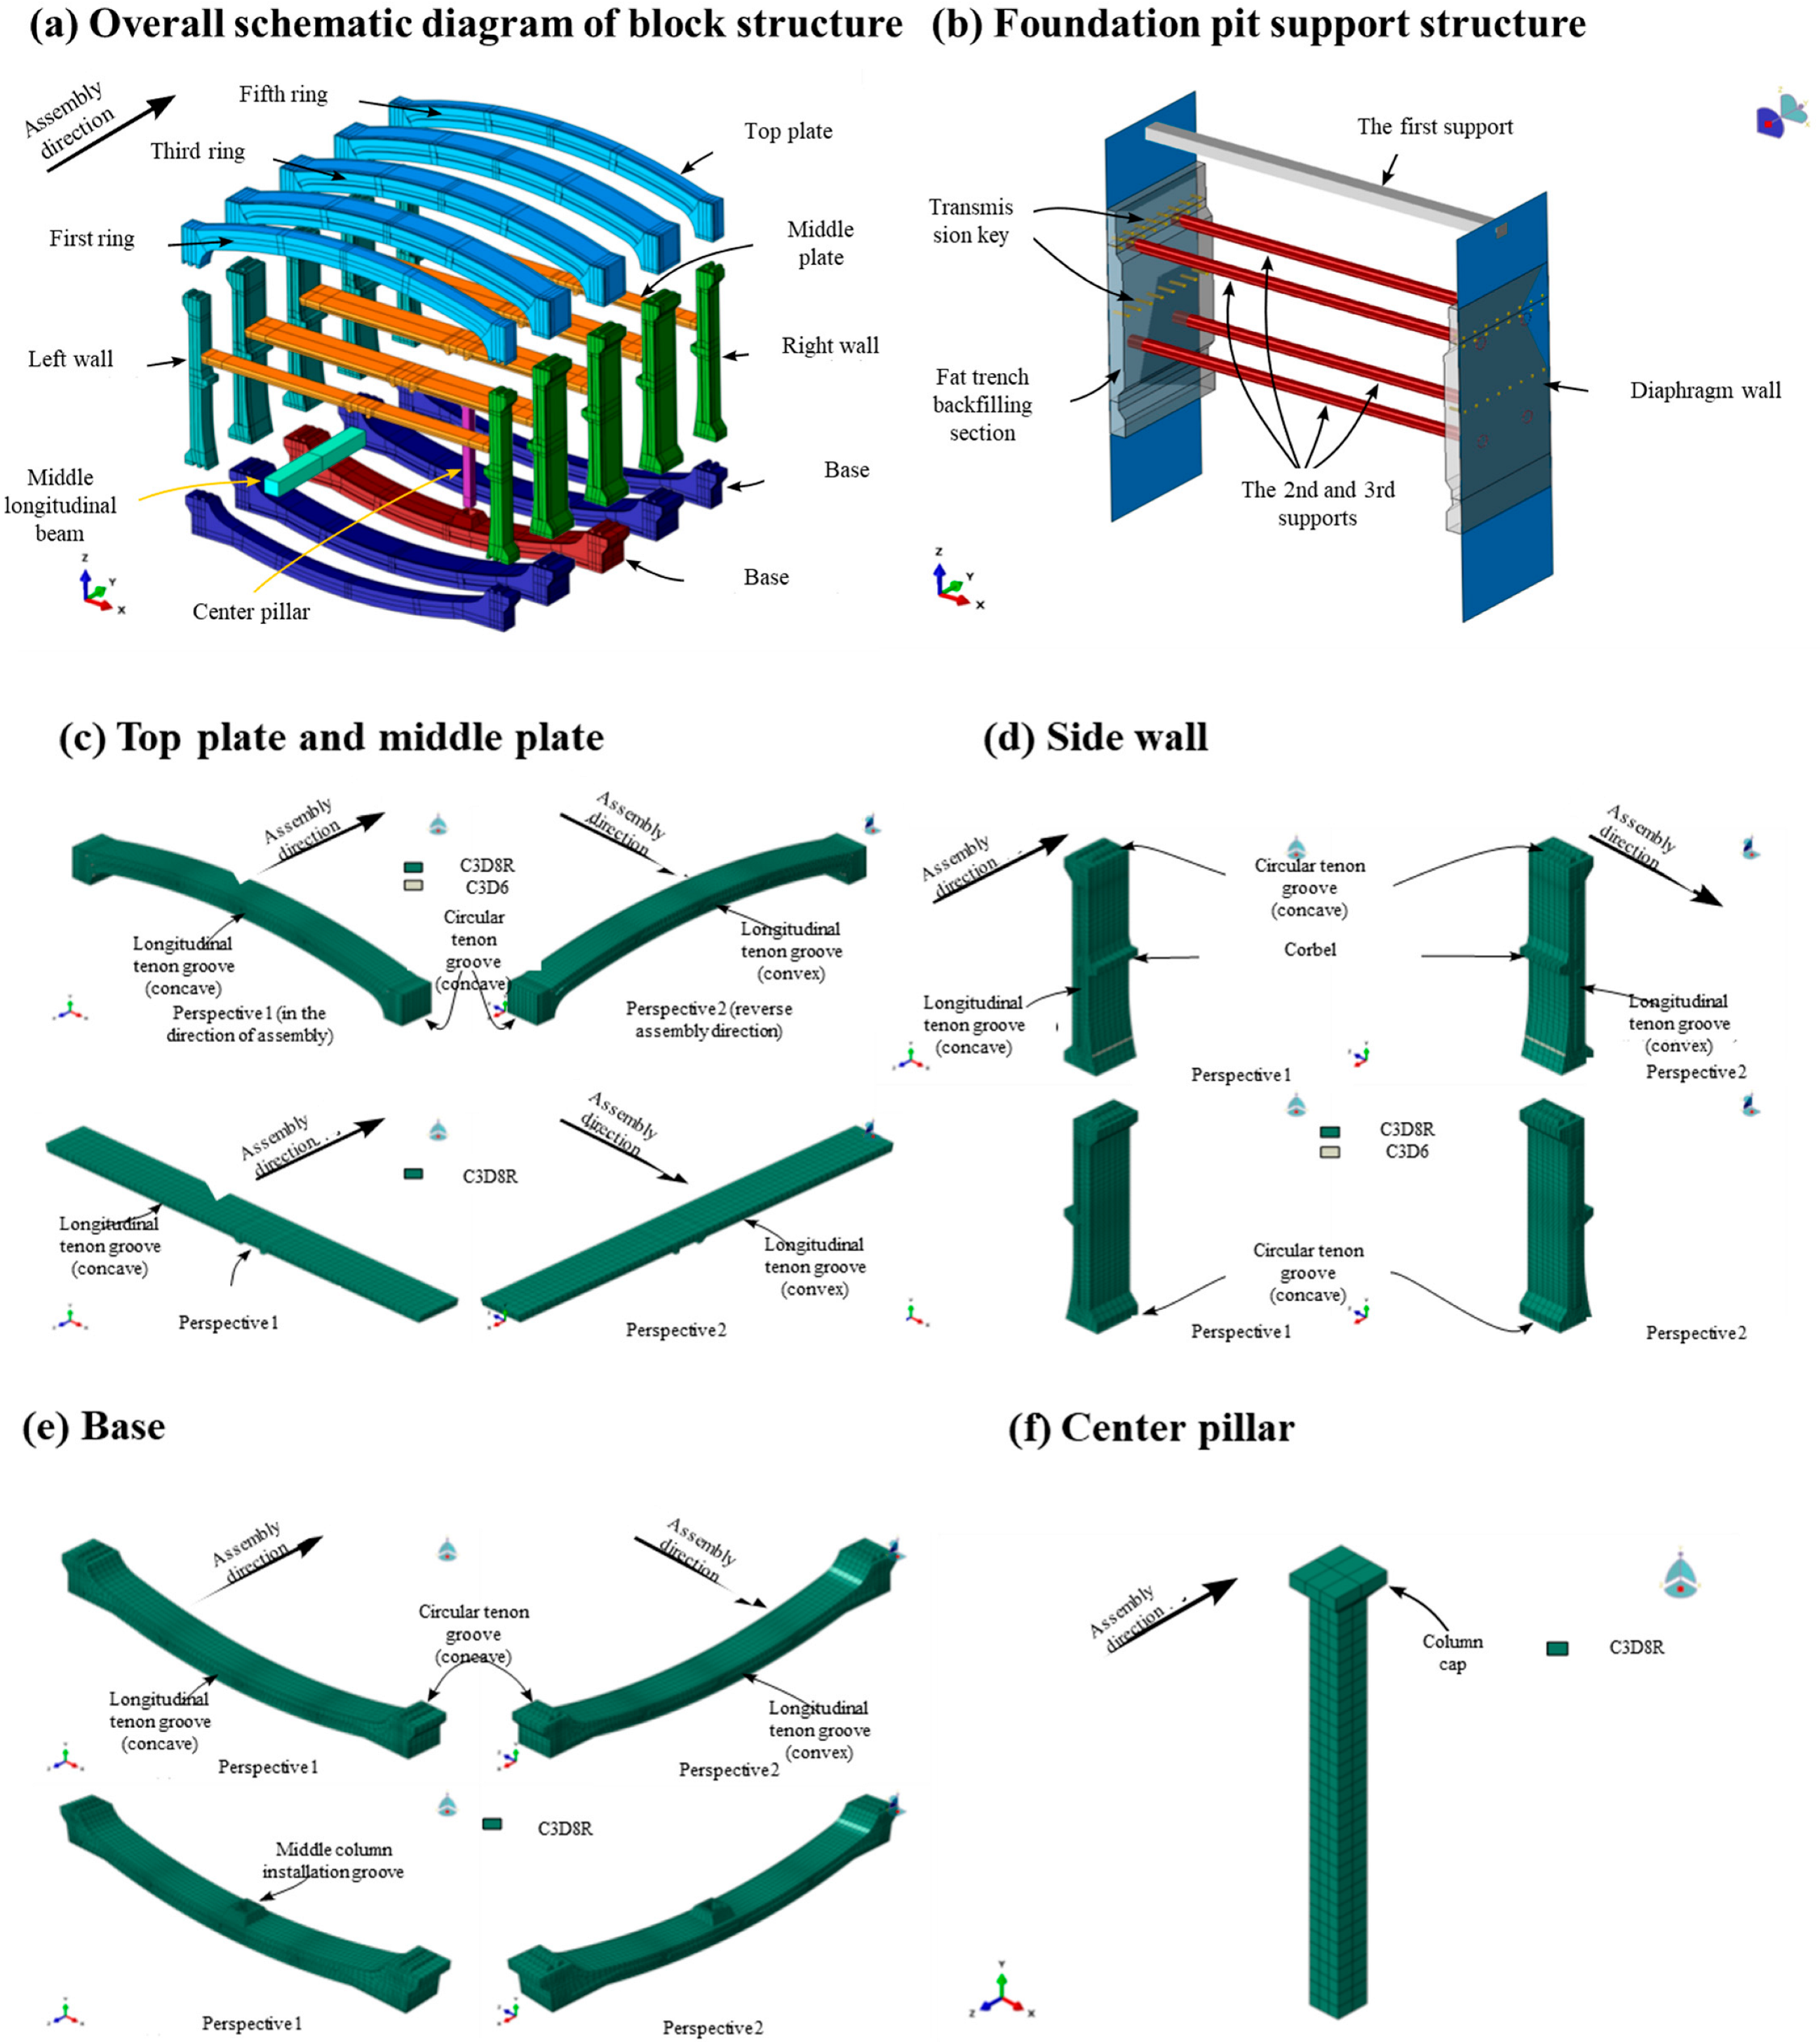
The model simplifies geometric dimensions of Huaxia Station’s prefabricated section, with the XoZ plane parallel to transverse cross-sections and the Y-axis aligned with the longitudinal axis, and gravity acting along the negative Z-direction. An 8 m column-span symmetric model along the longitudinal direction comprised five assembly rings, each containing a roof slab, left/right sidewalls, intermediate floor, base slab, plus center columns and longitudinal girders, totaling 27 components. Components are arranged positively along the Y-axis, with Ring 1/Ring 5 as half-models (1 m long each), and Rings 2–4 at 2 m length. Ring 3, the midline, coincides with the longitudinal symmetry plane (Y = 0 plane), with its base slab containing mid-column installation slots; the other rings share identical configurations. All mortise groove joints are oriented with concave surfaces toward the negative Y-axis and convex surfaces toward the positive Y-axis.
Structural components are modeled with solid elements using predominantly hexahedral meshes supplemented by wedge elements. The vaulted roof features a symmetric configuration with four longitudinal non-uniform mortise grooves. Mesh sizing is 0.2 m (transverse) × 0.3 m (longitudinal), refined to 0.1 m around five prestressing tendon ducts; each roof ring contains 12,291 hexahedrons and 54 wedges. Symmetric sidewalls each incorporate two rectangular mortise grooves and three tendon ducts with identical meshing; each single sidewall per ring comprises ~5160 hexahedrons and 18 wedges. Base slabs differentiate regular segments from slotted special segments: regular segments are symmetric with seven tendon ducts (8404 hexahedrons/ring); special segments refine meshes to 0.1 m near slots (total 13,589 hexahedrons). The intermediate floor employs uniform 0.2 m meshing despite asymmetric girder slots and unequal mortise grooves (1450 hexahedrons/ring). Mid-columns feature rectangular cap anchors at tops without bottom caps (global 0.2 m mesh, 210 elements); longitudinal girders use identical meshing for cuboid shapes (1000 elements). Large-segment modeling of a prefabricated subway station is fully depicted in Figure 4.
The model incorporates critical supporting structures and interfaces: diaphragm walls employ shell elements with 0.5 m meshing totaling 1632 elements; three-tiered pit bracing (primary concrete, secondary/tertiary steel struts) utilizes beam elements, each tier comprising 48 beam elements; there are 32 force-transfer keys at sidewalls and 16 at roof vaults, all simulated with beam elements; and backfill within structure-wall gaps models force-transfer media using solid elements with global 0.5 m meshing (1776 elements). Full-model statistics: 140,806 hexahedra, 370 wedges, 2148 beams, and 1632 shells, aggregating 190,464 nodes. All calculations were performed on our laboratory’s dedicated small-scale server, with a total simulation time of approximately five calendar days (including necessary debugging).

3.1.2. Constitutive Model and Material Parameters

The concrete constitutive model adopts the Concrete Damage Plasticity (CDP) formulation. The strain rate decomposes into elastic and plastic components:
ε ˙ k l = ε ˙ k l e l + ε ˙ k l p l
The integral form is
ε k l = ε k l e l + ε k l p l
ε ˙ k l , ε ˙ k l e l , ε ˙ k l p l are components of the strain rate tensor and its elastic/plastic parts, respectively, and ε k l , ε k l e l , ε k l p l are components of the strain tensor and its elastic/plastic parts.
The initial elastic modulus E0, coupled with relationships among damage variables, yield stresses, and hardening parameters, constitutes the most critical parameter in the Concrete Damage Plasticity (CDP) model. These parameters are derived from uniaxial tensile/compressive stress–strain relationships of materials during model formulation, thus being calculable from the actual material’s uniaxial stress–strain curves. The uniaxial tensile stress–strain curve for concrete follows these equations [22]:
σ = 1 d t E c ε
d t = 1 ρ t 1.2 0.2 x 5 ,       x 1 1 ρ t α t x 1 1.7 + x ,   x > 1
x = ε ε t , r
ρ t = f t , r E c ε t , r
The parameter definitions are as follows: f t , r denotes concrete’s uniaxial tensile strength; ε t , r represents the peak tensile strain corresponding to uniaxial tensile strength; dt signifies the damage evolution parameter under uniaxial tension (noting that this damage variable definition differs from that in the prior constitutive model); and αt indicates the parameter value governing the descending branch of the uniaxial tensile stress–strain curve, obtainable from standard tables. Uniaxial compressive stress–strain relationships for concrete shall be determined per the following formulas:
σ = 1 d c E c ε
d c = 1 ρ c n n 1 + x n ,       x 1 1 ρ c α c x 1 2 + x ,     x > 1
x = ε ε c , r
ρ t = f c , r E c ε c , r
n = E c ε c , r E c ε c , r f c , r
The parameter definitions are as follows: f c , r denotes concrete’s uniaxial compressive strength; ε c , r represents the peak compressive strain corresponding to uniaxial compressive strength; d c signifies the damage evolution parameter under uniaxial compression (noting that this damage variable definition differs from that in the constitutive model described earlier); and αc indicates the parameter value governing the descending branch of the uniaxial compressive stress–strain curve, obtainable from codified tables. Upon determining the concrete grade, these parameters are derived from normative tables to subsequently generate concrete uniaxial stress–strain curves via Equations (3)–(11), as illustrated in Figure 5a.
The obtained stress–strain curves cannot be directly implemented in the model since these curves do not distinctly delineate elastic and plastic deformation phases, while the computationally approximated elastic moduli under tension/compression frequently diverge, contradicting model definitions. Furthermore, the stress–strain curves depict nominal strain–stress relationships, whereas the model requires damage variables and yield stresses to be input as functions of inelastic strain (termed “inelastic strain” herein to differentiate it from actual plastic strain in constitutive definitions). Therefore, curve modifications are necessary to extract model parameters through the following steps.
a. Uniaxial Tensile Segment
Analysis of the concrete’s uniaxial tensile stress–strain curve reveals predominantly elastic deformation followed by plastic softening stages without significant plastic hardening. Thus, using uniaxial tensile strength as the initial yield point, peak tensile strain εt,r is designated as the ultimate elastic strain, enabling the calculation of inelastic strain ε t i n :
ε t i n ε = ε ε t , r
As illustrated in Figure 5b, after the material develops inelastic strain, the unloading rebound curve exhibits a reduced slope 1 η t E 0 compared to the initial elastic loading slope E 0 due to material stiffness degradation. This phenomenon demonstrates that a portion of the inelastic strain recovers during unloading, with the irrecoverable segment constituting the genuine plastic strain. Assuming η t represents the proportion of recoverable segment within the inelastic strain, the damage variable is calculated per the formulation below:
d t = 1 η t E 0 ε t i n ε σ ε + 1 η t E 0 ε t i n ε
The value of η t should be experimentally determined; absent experimental data, η t ranges between 0.5 and 0.95, typically defaulting to 0.9.
b. Uniaxial Compression Segment
Concrete under uniaxial compression sequentially undergoes elastic deformation, plastic hardening, and plastic softening stages. Within the stress–strain curve, the stress value at the transition between elastic deformation and plastic hardening stages defines the proportional limit strength f c , p p t —representing the true initial yield point in the model. Empirically, the proportional limit strength f c , p p t correlates with ultimate compressive strength f c , r as follows:
f c , p p t = 0.7 f c , r
Upon determining the proportional limit strength, substitute f c , p p t into Equations (7)–(11) to inversely compute the corresponding strain ε c , p p t (requiring iterative computation), designating this value as the ultimate elastic strain. Subsequently, inelastic strain and damage variables are calculable via a methodology identical to the tensile segment:
ε c i n ε = ε ε c , p p t d c = 1 η c E 0 ε c i n ε σ ε + 1 η c E 0 ε c i n ε
Within the formulation, η c represents the proportion of recoverable segment in compressive inelastic strain, ranging between 0.35 and 0.7 with a typical default value of 0.6. Taking C50 concrete as an exemplar, its mechanical properties are tabulated in Table 2, while corresponding calculated model parameters are presented in Table 3.
Eccentricity κ, compressive strength ratio σb0/σc0, tension–compression yield ratio Kc, and stiffness recovery factors ωc and ωt are unique model parameters of the CDP model. For quasi-brittle materials like concrete, experimental evidence indicates that crack closure occurs during tension-to-compression transition, rendering tensile damage irrelevant to compressive stiffness; conversely, shear-induced microcracking during compression causes stiffness degradation that persists during compression-to-tension transition. Consequently, stiffness recovery factors default to ωt = 0 and ωc = 1. Concrete material parameters adopted in this chapter are compiled in Table 4, with dilation angle ψ = 15°, Poisson’s ratio ν = 0.2, and density 2.3 t/m3.
The constitutive model of steel adopts the traditional metal plasticity model. The strain increment can be decomposed into elastic and plastic parts:
d ε k l = d ε k l e l + d ε k l p l
The integral form is
ε k l = ε k l e l + ε k l p l
Here, elastic modulus Es, Poisson’s ratio νs, and density ρs constitute conventional steel material parameters obtainable from design codes; the relationship between yield stress σ0 and hardening parameters is derived from steel’s uniaxial tensile stress–strain curve.
The uniaxial tensile stress–strain curve for common mild steel (e.g., Q235) depicted in Figure 5c typically exhibits five distinct stages: (I) elastic stage; (II) elastoplastic hardening stage; (III) yield plateau; (IV) plastic hardening stage; and (V) secondary plastic flow stage. Based on GB/T 228.1-2021 [23], it can be simplified into a five-segment piecewise function expressed as
σ = E s ε ,     ε < ε e A ε 2 + B ε + C , ε e ε < ε e 1 f y ,         ε e 1 ε < ε e 2 f y 1 + α ε ε e 2 ε e 3 ε e 2 ,     ε e 2 ε < ε e 3 f u ,       ε e 3 ε
Within the formulation, fy denotes steel’s yield limit; fu represents ultimate strength; εe corresponds to strain at proportional limit; εe1 indicates strain at yield limit (empirically assignable); εe2 signifies strain initiating plastic hardening stage (empirically assignable); εe3 reflects strain at ultimate strength (empirically assignable); and coefficients A, B, C,α are derived from stress–strain curve continuity conditions via the following method. Substituting ε = εe and ε = εe1 into the second expression of Equation (18) yields
A ε e 2 + B ε e + C = E s ε e d A ε 2 + B ε + C d ε ε = ε e = 2 A ε e + B = E s A ε e 1 2 + B ε e 1 + C = f y
By solving Equation (19), we can obtain
A = E s ε e ,     B = 3 A ε e = 3 E s ,     C = E s ε e = 0.8 f y
By substituting ε = εe3 into the fourth equation of Equation (18), we can obtain
α = f u f y 1
Upon obtaining steel material parameters, the stress–strain curve is derived via Equation (18). Defining εe as the proportional limit strain, plastic strain is calculated per the following formulation:
ε p l ε = ε ε e
This enables the derivation of the yield stress versus plastic strain relationship σ 0 ε p l , which serves as the input parameter for the model. Steel material parameters employed in this study are compiled in Table 5.

3.1.3. Rationality Analysis of Numerical Models Based on Structural Monitoring

To investigate the structural behavior of prefabricated subway station main structures throughout their service life, monitoring points are established at the roof, sidewall, and base slab locations to assess deformation characteristics. The specific instrumentation layout is illustrated in Figure 6. The monitoring plan adopts steel bar gauges, concrete strain gauges, force transmission key force gauges, strain gauges, wireless acquisition devices, and side wall and roof force transmission key sensor acquisition instruments, as shown in Figure 6c. The steel bar gauge and concrete strain gauge are connected to the ZRD-3003 automated acquisition system (manufactured by Qiuzhen Instrument Equipment Co., Ltd., Beijing, China) for data collection and transmission to the user end. The force transmission key dynamometer collects data through the ZRD-709 intelligent vibrating string handheld instrument (Qiuzhen Instrument Equipment Co., Ltd., Beijing, China). The BMB120-3CA strain gauges for mortise and tenon joints were collected using the UT7110Y static strain gauge (Qiuzhen Instrument Equipment Co., Ltd., Beijing, China).
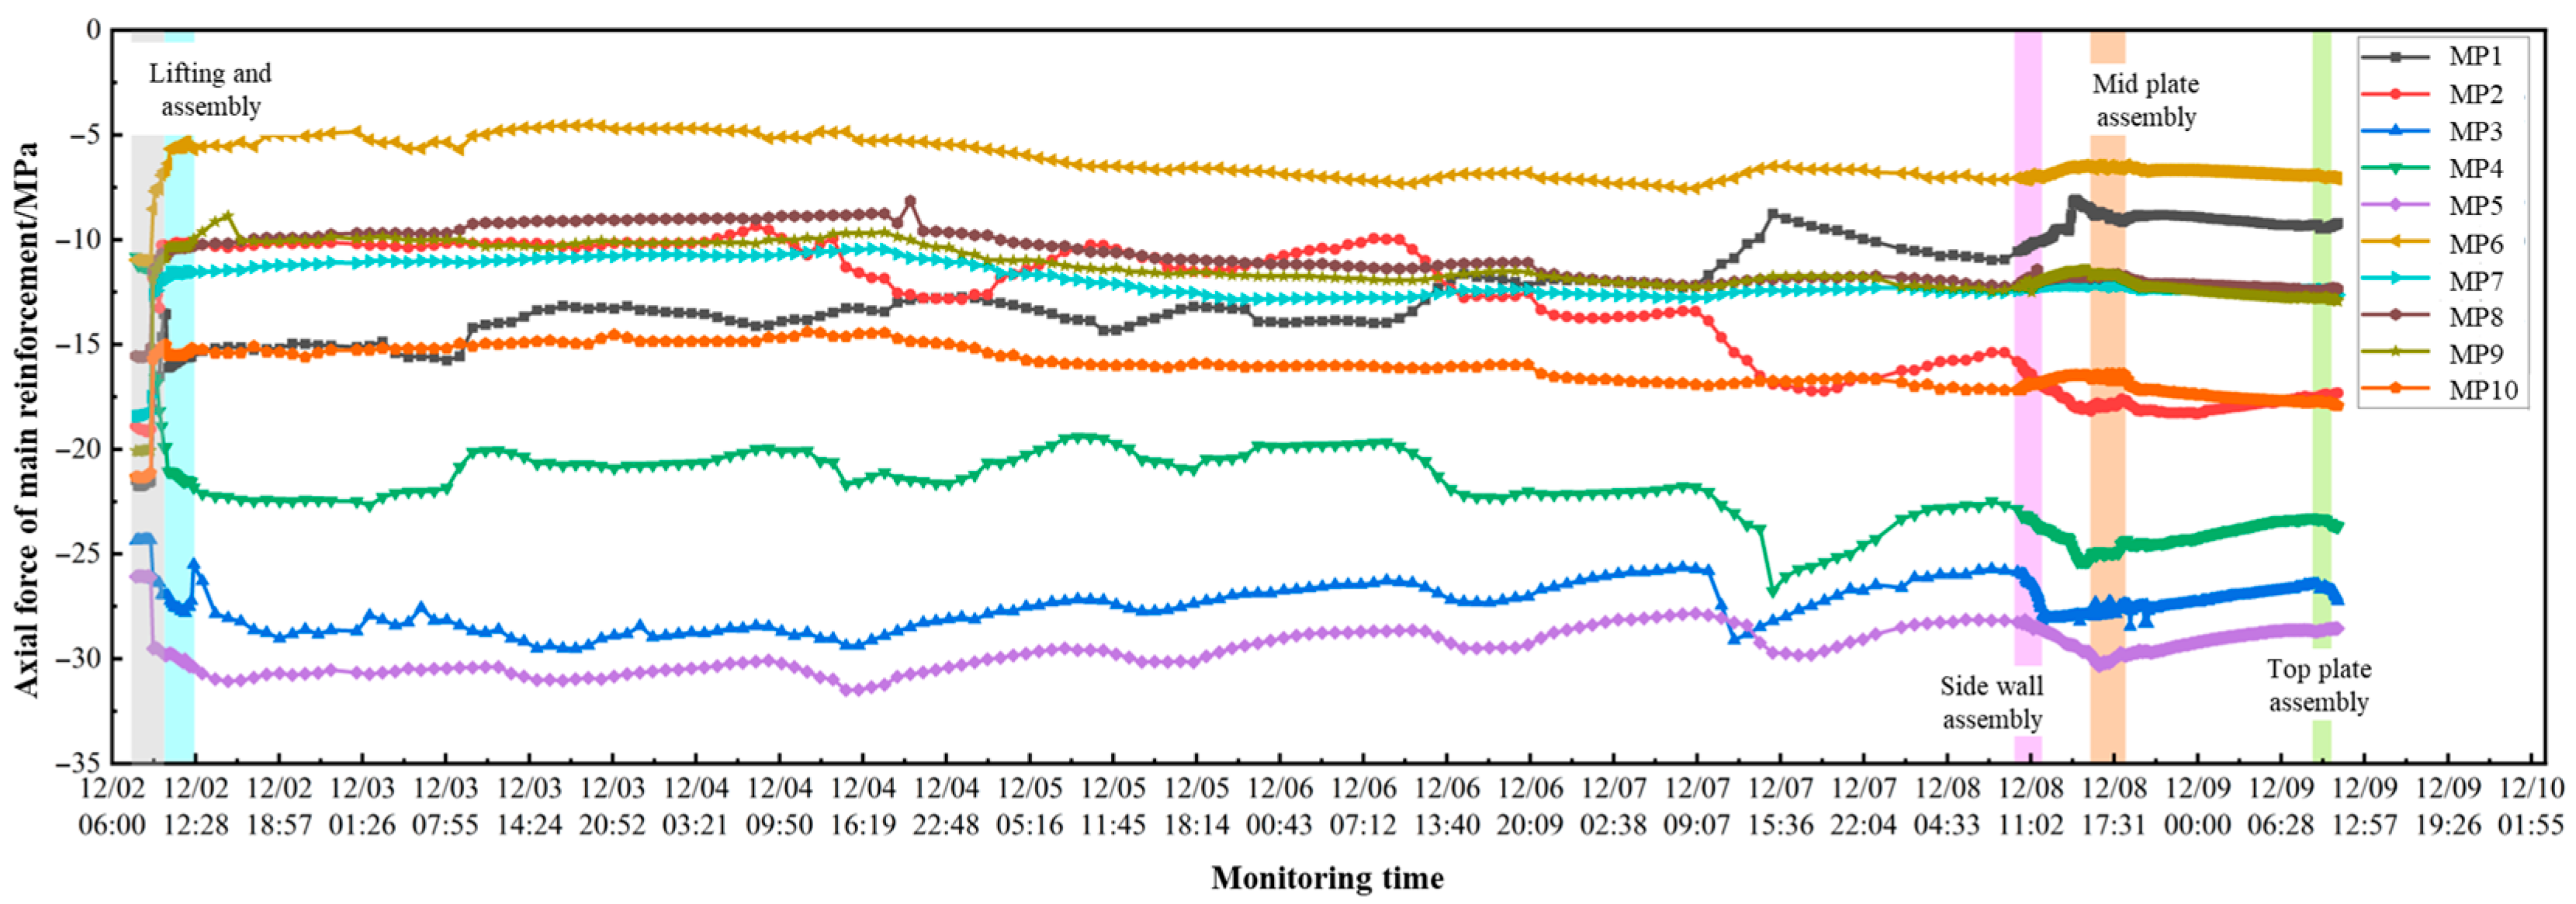
Each instrumented cross-section contains two monitoring points (deployed at upper/lower primary reinforcement locations), with each point comprising two rebar strain gauges and two concrete strain gauges. Concrete strain gauges are installed 10 cm apart from rebar gauges along the main reinforcement. Following instrumentation selection, installation configurations are depicted in Figure 6a–c. An analysis of the main reinforcement axial forces during the assembly phase reveals temporal variations shown in Figure 7, indicating compressive states across all monitoring points during base slab lifting. Globally, axial force trends at MP3–5 align with each other, while the remaining points exhibit consistent patterns. During lifting operations, slings induce compressive stresses in internal reinforcement; stabilized axial forces post-lifting range between −10.82 and −24.36 kN, with minimal variation. Post-assembly, axial compression at MP8–10 progressively intensifies, signifying enhanced end constraint effects on upper reinforcement after base slab positioning. Reduced axial forces at other points post-assembly demonstrate load redistribution to the foundation support. From base slab completion to sidewall assembly, axial forces stabilize overall, with minor fluctuations attributable to construction disturbances, exerting a negligible structural impact. Sidewall assembly minimally affects MP8–10 (<5% force variation), confirming a low influence on bottom-layer reinforcement. Intermediate slab assembly increases axial forces at MP8–9 while maintaining stability elsewhere. Roof assembly induces no abrupt axial force changes across monitoring points.
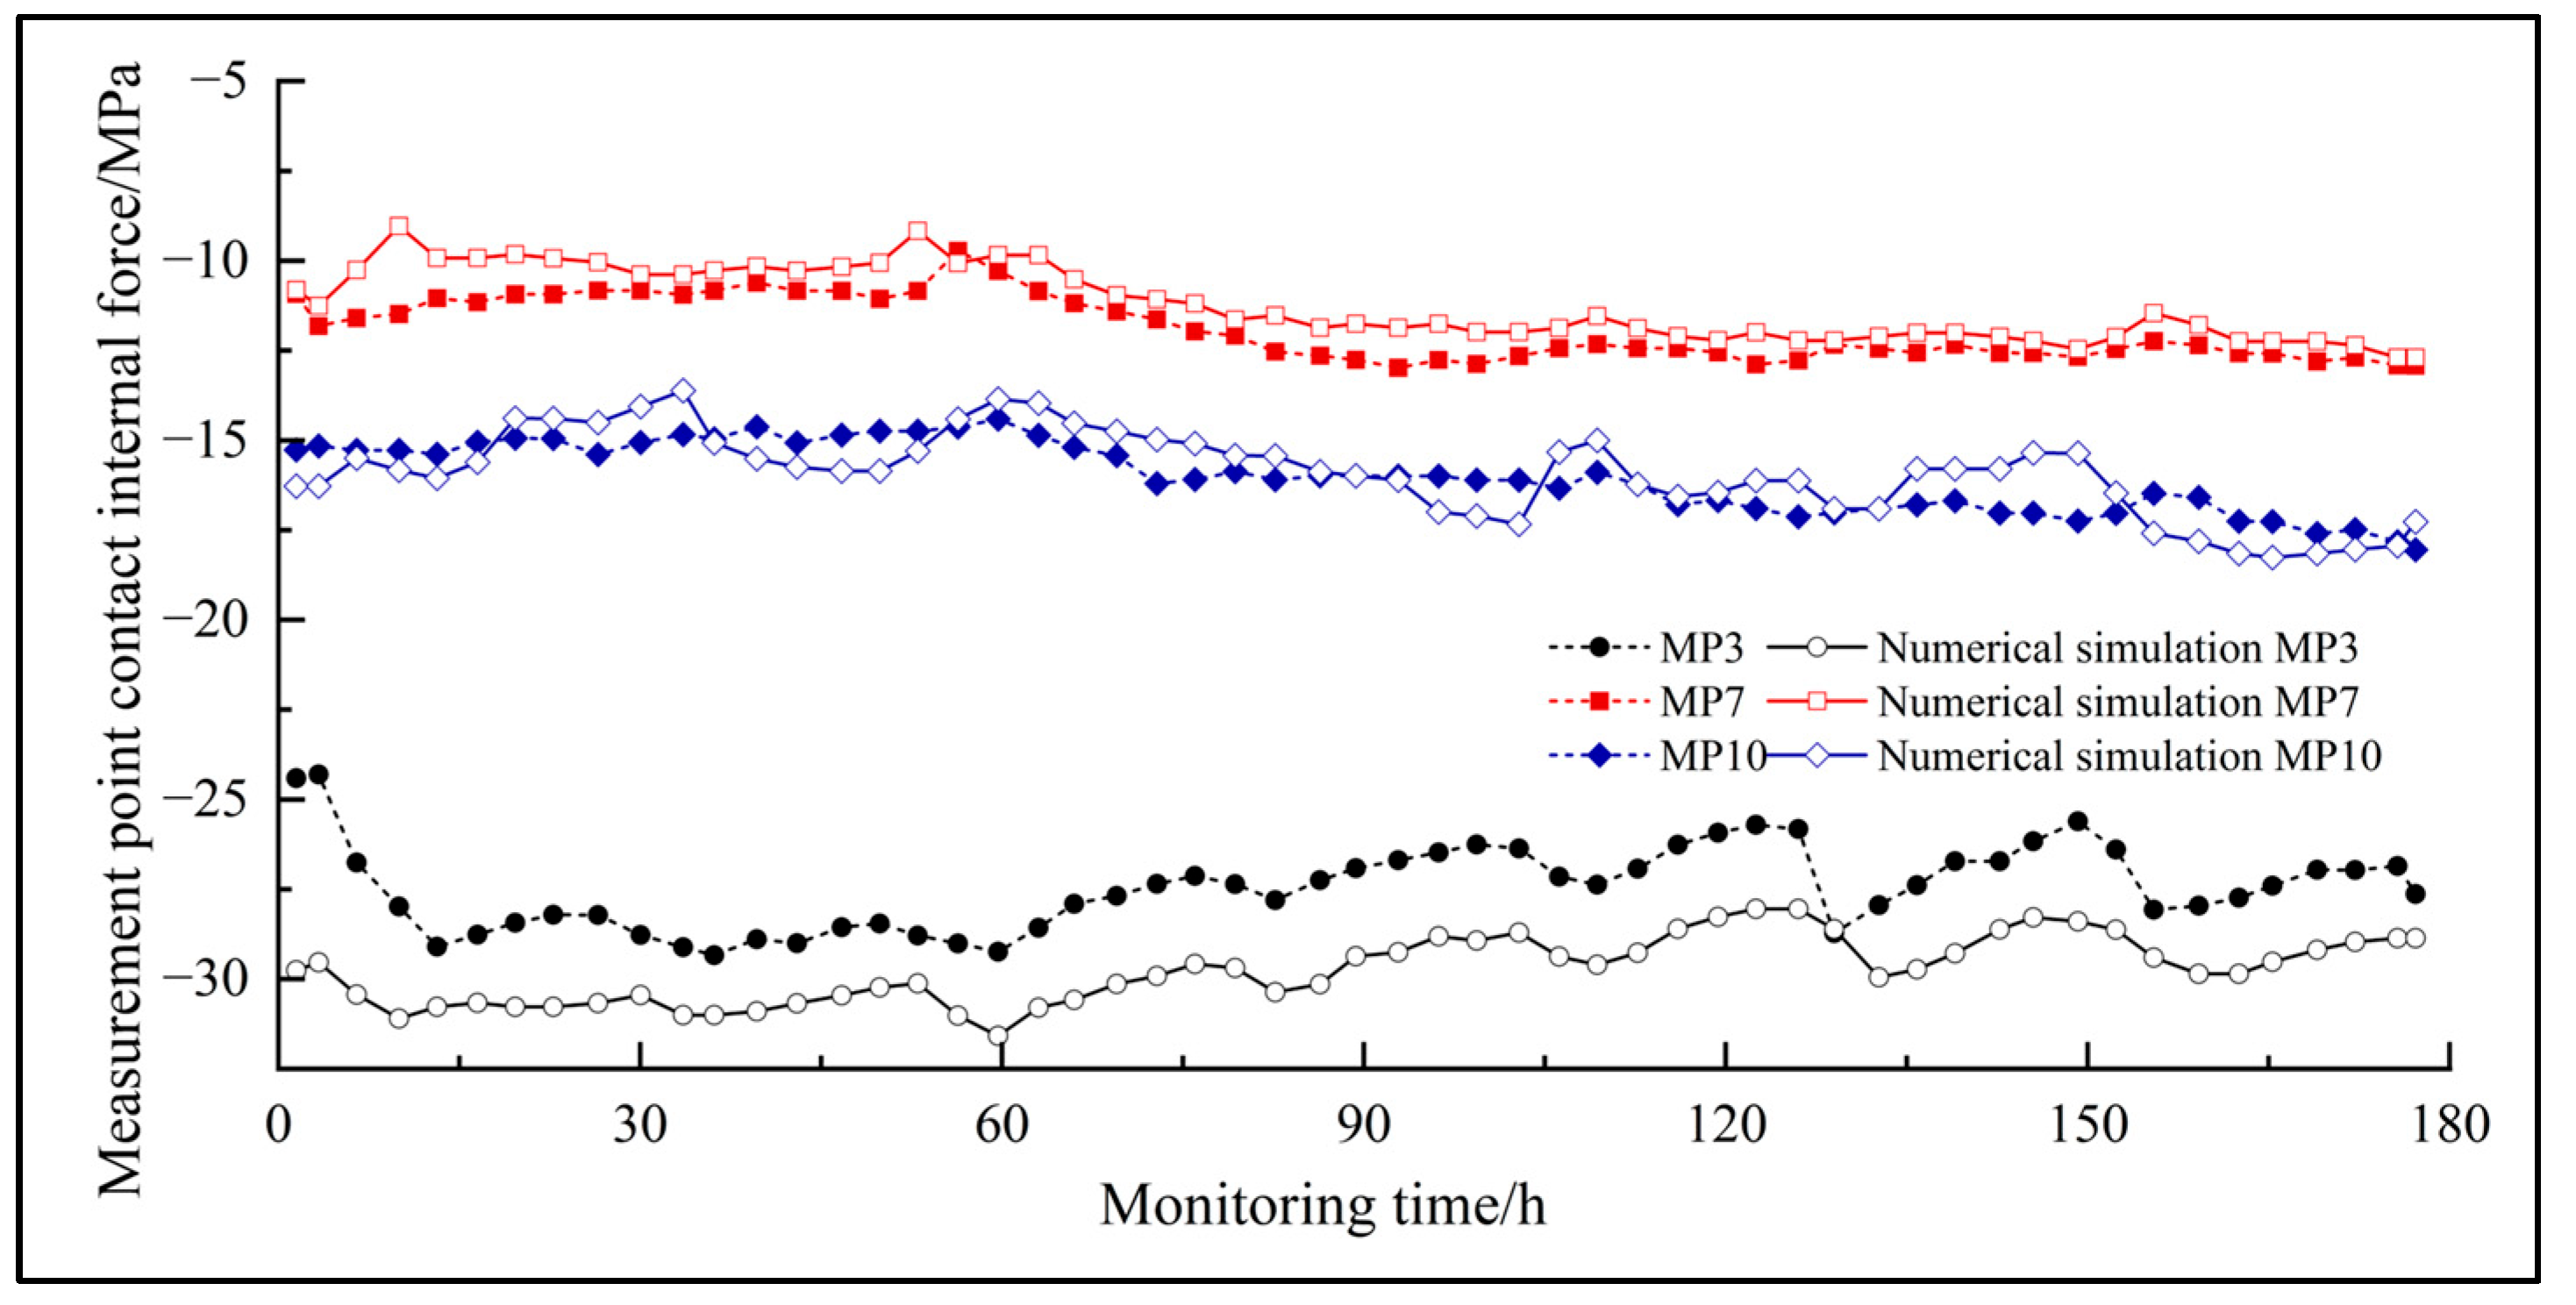
Numerical simulations targeting monitoring points 3, 7, and 10 (representing roof, sidewall, and base slab, respectively) demonstrate strong agreement with field-measured data, as shown in Figure 8. The time-history curves of contact internal forces reveal consistent evolution patterns between measurements (MP3, MP7, MP10) and simulations: during 0–180 h monitoring, all curves exhibit similar oscillatory characteristics—initial decline, mid-term fluctuations, and late-stage variations. Measured and simulated curves consistently operate within identical magnitude ranges (−20 MPa to 80 MPa) without systematic deviation. Critical temporal nodes (30 h, 90 h, 150 h) show precise matching in extreme positions and variation amplitudes, confirming the model’s accuracy in simulating contact force evolution. This outcome validates the numerical model’s reliable parameter settings and mechanical mechanisms for predicting dynamic response characteristics under complex conditions.

3.1.4. Interaction Between Components

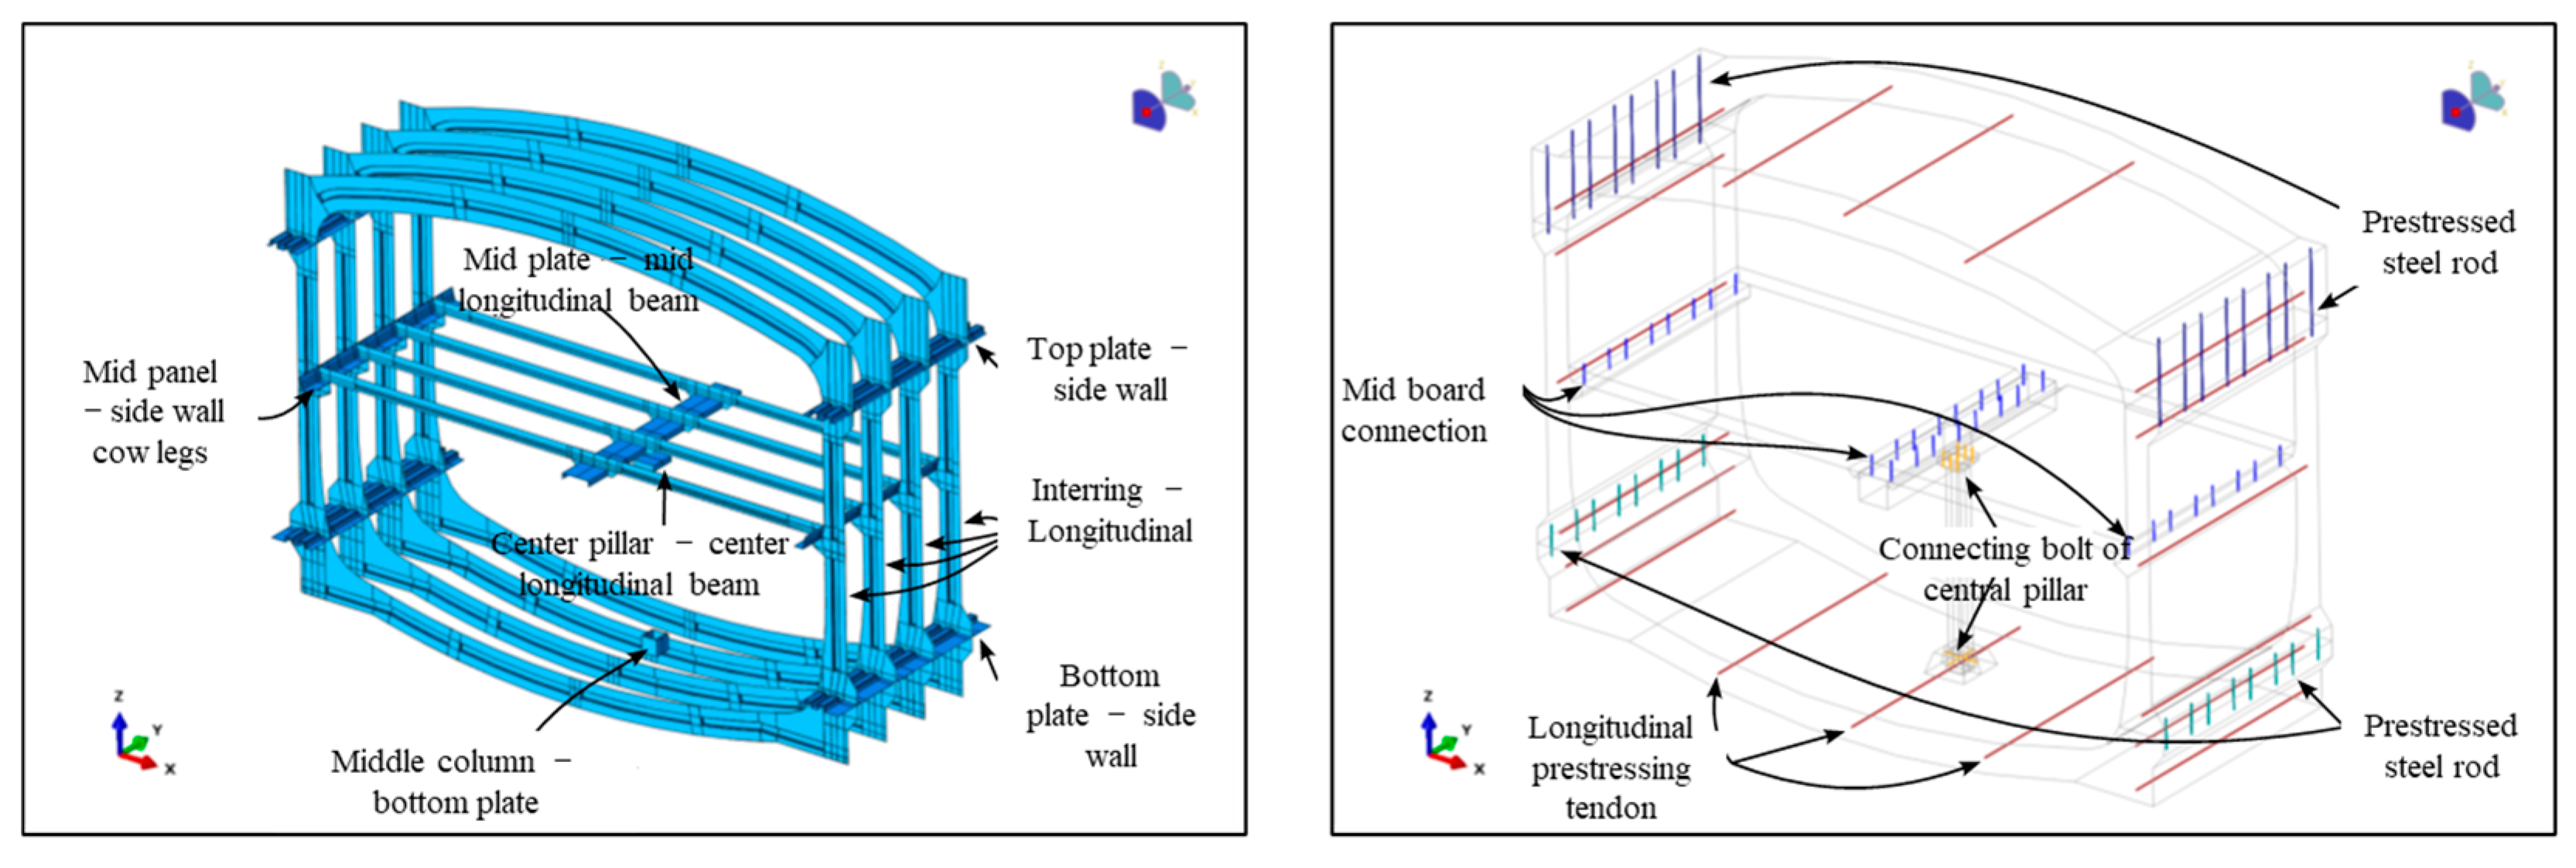
To accurately simulate the mechanical characteristics of prefabricated subway stations, all 27 structural components constituting the station body are modeled as discrete entities, with interactions established through contact surfaces and connecting elements (bolts, prestressed reinforcement).
(1) Contact Surfaces
The model incorporates 57 contact surface pairs, as depicted in Figure 9 (left): 20 longitudinal interfaces between adjacent rings of roof, sidewalls, intermediate floors, and base slabs; 35 intra-ring interfaces comprising base slab-to-sidewall, roof-to-sidewall, sidewall-to-intermediate floor, and intermediate floor-to-longitudinal girder connections; plus interfaces between mid-columns and longitudinal girders/base slabs of Ring 3.
Surface-to-surface contact formulation (ABAQUS standard) is implemented with master–slave assignments, with mortise surfaces as master vs. tenon surfaces as slave for mortise groove joints; corbel surfaces as master vs. intermediate floor surfaces as slave for sidewall–floor connections; groove inner surfaces as master vs. girder top surfaces as slave for floor–girder joints; and both ends of mid-columns assigned as slave surfaces. Contact behavior follows normal “hard contact” and tangential penalty friction (μ = 0.6).
(2) Structural Connectors
Beyond contact surfaces, longitudinal and circumferential connectors are modeled to enhance interaction realism and provide initial stabilization forces. Key connectors shown in Figure 9 (right) include longitudinal prestressed tendons, circumferential prestressed steel bars for sidewall-roof/base slab connections, and bolted joints for intermediate floor/girder/mid-column assemblies. All connectors employ 1D wire elements with beam section properties, coupled to main structural solids via embedded constraints simulating grouted tendon anchorage and sleeve bolt force-transfer mechanisms.
Pre-tensioning forces in tendons and steel bars are simulated through thermal methodology. At installation phase commencement, predefined fields impose virtual temperature fields (e.g., 1 °C) on tensioned elements. Linear temperature reduction (e.g., to 0 °C) during installation induces contraction, generating equivalent tensile stresses via embedded constraints. This model applies 900 kN pre-tension per longitudinal tendon, 600 kN for circumferential bars, with 1 °C cooling magnitude. Nominal thermal expansion coefficients are calculated per
α nom = σ pre E Δ T
The formulation defines αnom as the nominal thermal expansion coefficient; σpre as pretension force; E as elastic modulus; and Δ T as temperature difference.

3.1.5. Simulation Process and Boundary Conditions

The model simplifies construction simulation by focusing on one column-span range longitudinally, decomposing assembly into seven phases: Phase 1 activates diaphragm walls and internal bracing under triangular stratum loads with Y-axis symmetry constraints, fixing X-translation at embedded sections and Z-translation at bases; Phase 2 activates all base slabs and longitudinal tendons, constraining Z-translation at slab bases and X-translation at force-transfer keys while simulating prestress via thermal analogy; Phase 3 removes slab Y-constraints to apply symmetry boundaries, deactivates tertiary bracing, and activates mid-columns/girders/bolts with girder symmetry.
Phase 4 removes secondary bracing, activates sidewall segments/circumferential bars, and constrains Y-translation at symmetric surfaces; Phase 5 applies sidewall symmetry and activates intermediate floors/keys/bolts with floor symmetry; Phase 6 replaces primary bracing with stress-free elements and activates roof segments/tendons/keys/bolts with symmetry constraints; and Phase 7 applies roof symmetry, activates backfill with base Z-constraint and symmetry, removes lateral X-constraints, and imposes uniform vertical loads simulating backfill self-weight. Simulation methodologies and boundary conditions for each phase are detailed in Figure 10.

3.2. Simulation Results and Analysis

3.2.1. Displacement Analysis of Different Process Structures

(1) Base Slab Displacement Analysis
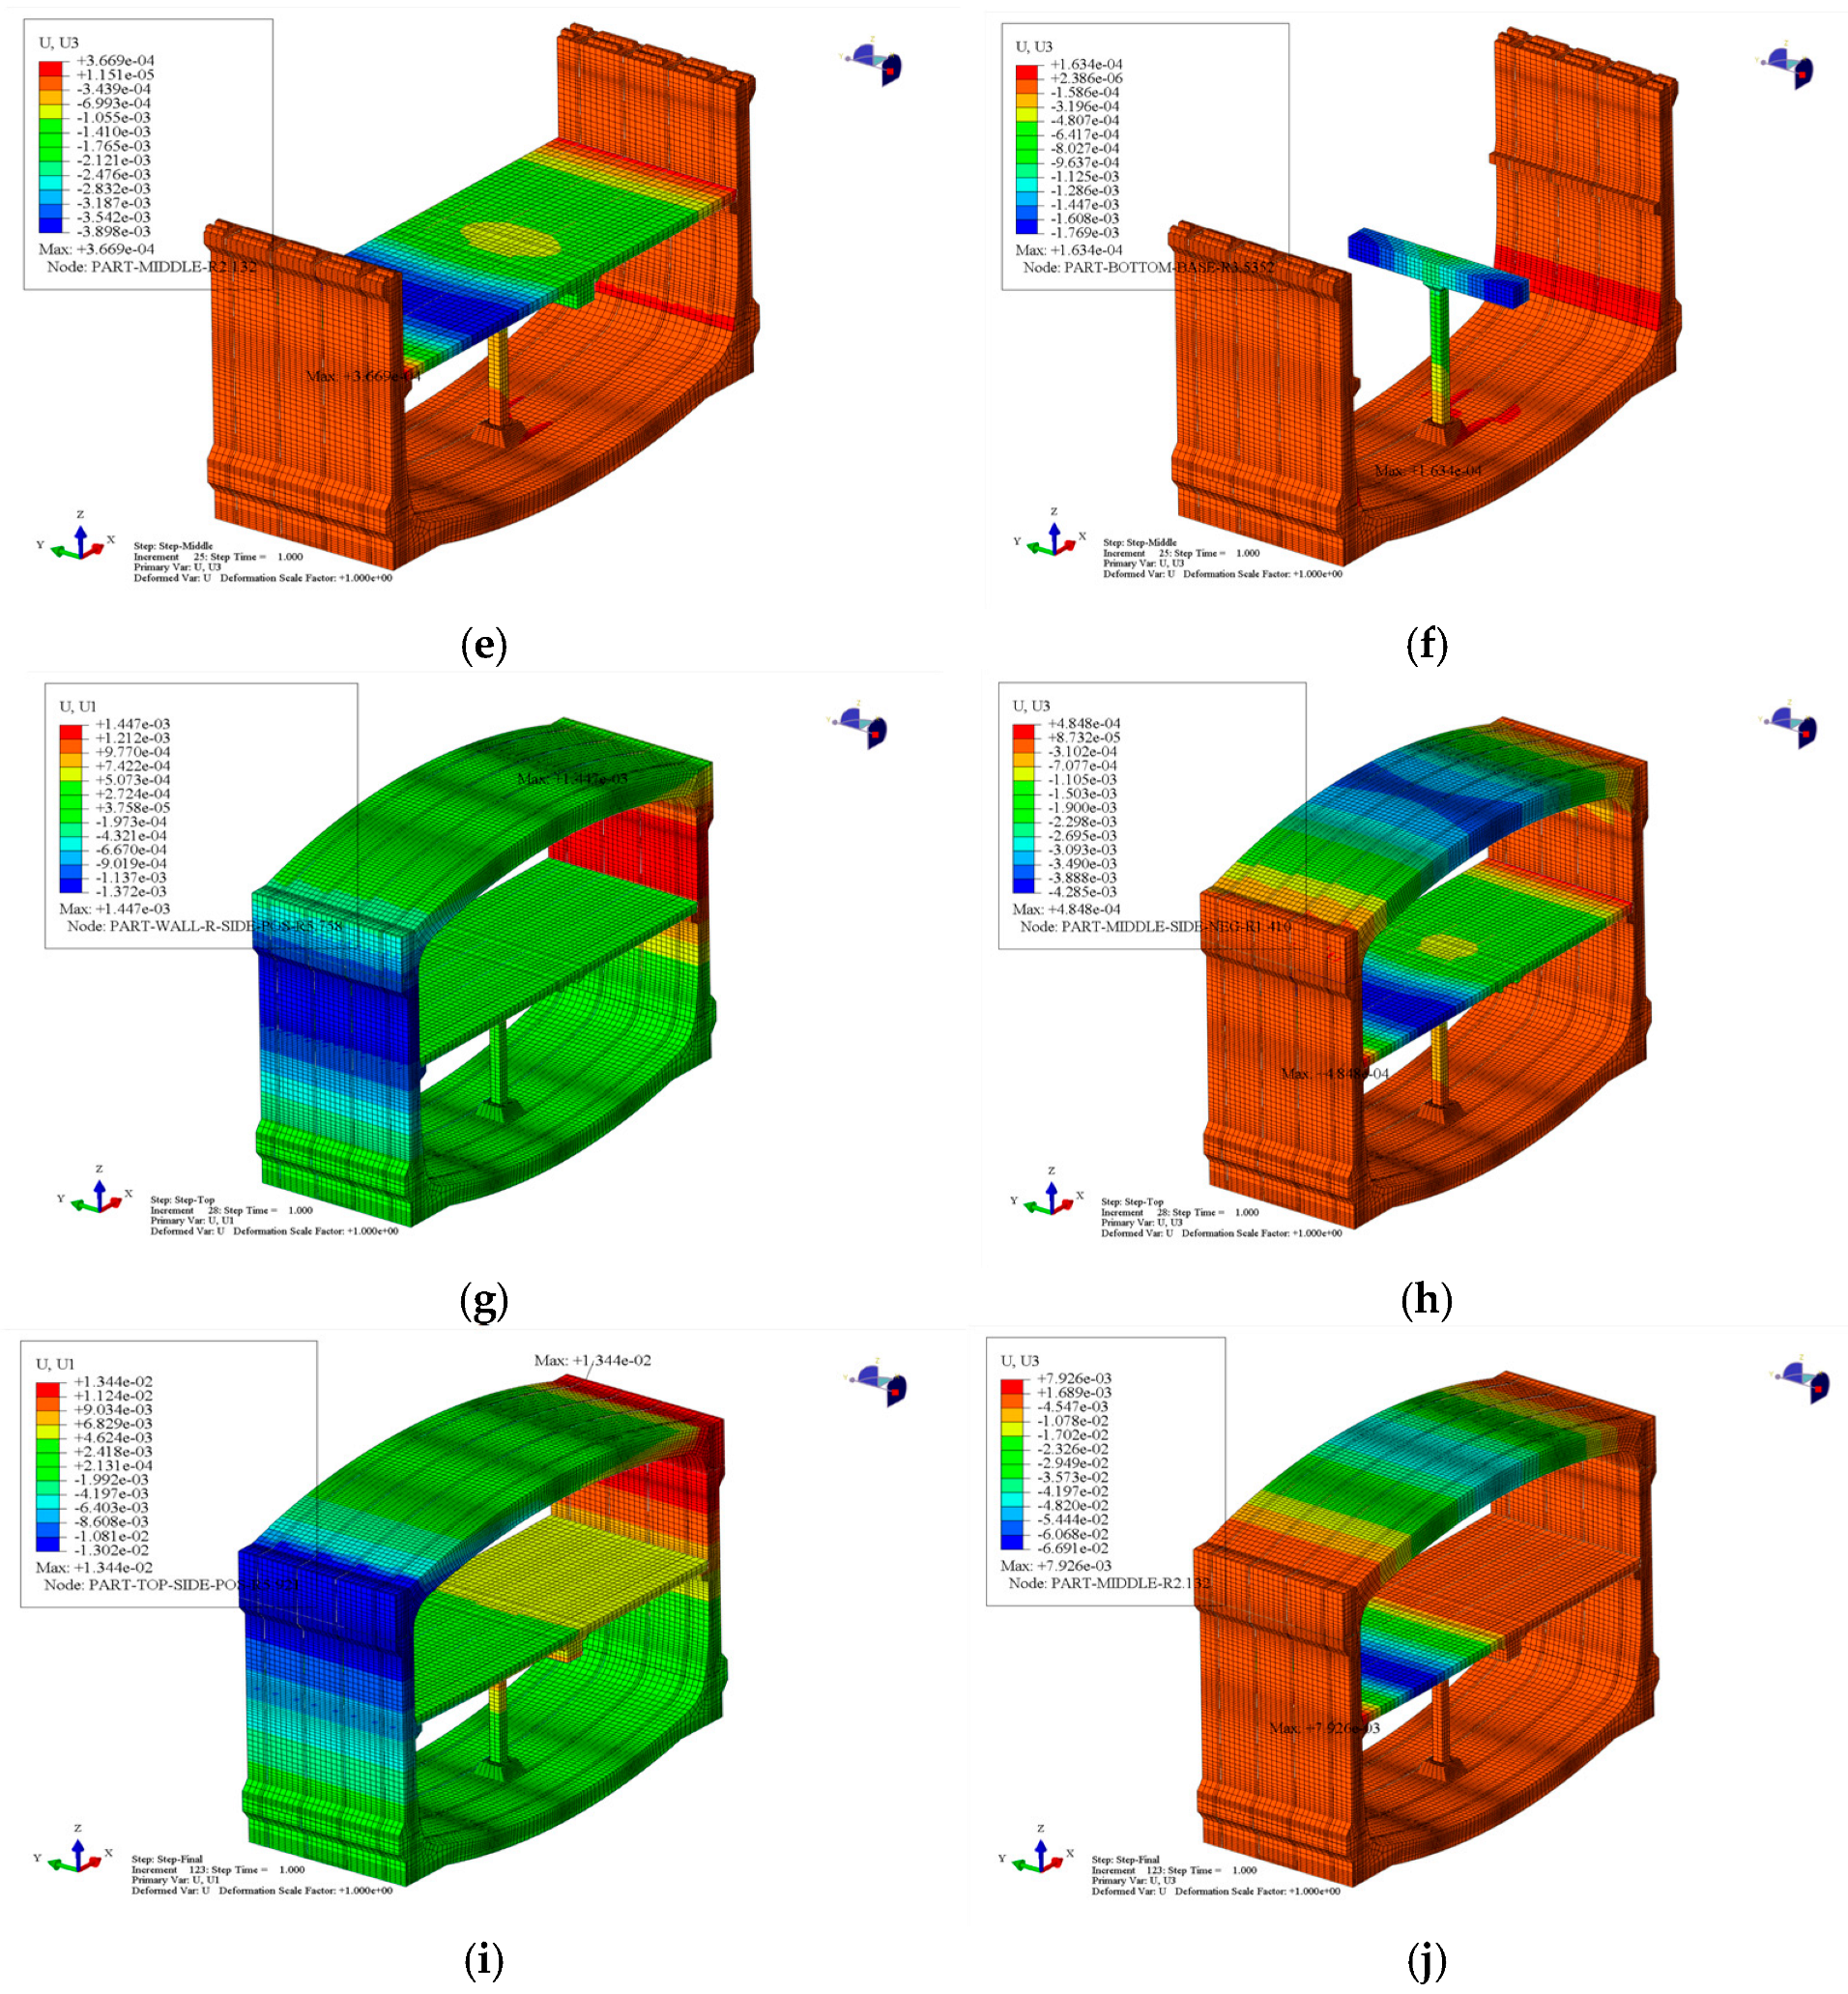
The contour plot of total structural displacement during base slab assembly is presented in Figure 11a. Analysis reveals minimal overall displacement due to the absence of superstructure loads, with localized displacements observed near prestressing tendon ducts attributable to prestressing effects. Notably, a zone of elevated displacement occurs around the mid-column installation slot in the Ring 3 base slab, likely resulting from altered mass/stiffness distribution at the slotted section compared to adjacent standard segments, causing incomplete compatibility in mortise groove deformation during longitudinal assembly and generating additional stress–strain responses.
(2) Displacement Analysis During Mid-column and Longitudinal Girder Assembly
Vertical (Z-direction) displacement contours of the structure during mid-column and girder assembly are shown in Figure 11b. Minor displacements directly caused by self-weight are observed, while significant additional displacement increments occur at mid-column installation slots in base slabs under assembly loads. The displacement field exhibits abrupt gradient changes across slot boundaries between adjacent rings, with demarcation lines aligned precisely with geometric contours of Ring 3 slots, indicating potential local slippage tendencies at mortise groove interfaces. It is reasonable to infer that additional installation loads may exacerbate stress concentrations in mortise groove joints of Ring 3 base slabs.
(3) Displacement Analysis During Sidewall Assembly
Horizontal (X-direction) displacement contours of the structure during sidewall assembly are shown in Figure 11c. Without intermediate floors and force-transfer keys, both left and right sidewall tops displace outward (away from the station axis), with maximum displacements of 0.65 mm (left) and 0.61 mm (right). This displacement asymmetry likely relates to structural asymmetry induced by mid-column slots in Ring 3 base slabs. The absence of lateral constraints from intermediate floors prevents the formation of closed load-transfer paths at wall–roof/base connections, resulting in cantilever-like free deformation characteristics horizontally.
(4) Displacement Analysis During Intermediate Floor Assembly
Horizontal (Figure 11d) and vertical (Figure 11e) displacement contours during floor assembly reveal the following: Left sidewall displacement decreases from 0.65 mm to 0.47 mm while right increases to 0.68 mm (Figure 11e), indicating asymmetric effects from floor-beam-column systems. The left span midspan exhibits −3.9 mm deflection (Figure 11f), significantly exceeding the right span’s maximum deflection due to span asymmetry. Girders show −1.77 mm vertical displacement increments at midspan, demonstrating complex spatial deformation patterns.
(5) Displacement Analysis During Roof Assembly
Displacement contours (Figure 11g) show the following: Spandrel outward translation (Figure 11h) increases sidewall horizontal displacements to 1.45 mm (structurally negligible). Roof installation indirectly increases intermediate floor deflection to −4.3 mm despite non-direct load paths. Roof vault settlement reaches 3.8 mm under self-weight.
(6) Displacement Analysis During Backfill Completion
Post-construction contours (Figure 11i,j) exhibit significant displacement increases: sidewall displacements reach 13.02 mm (left)/13.44 mm (right); intermediate floor deflection peaks at 66.91 mm; roof settlement reaches 45 mm (10–15 × pre-backfill values). Displacements remain at the millimeter-scale except at critical zones, confirming structural controllability.

3.2.2. Stress Analysis of Different Process Structures

(1) Stress Analysis During Base Slab Assembly
Von Mises equivalent stress contours for Ring 2–4 base slabs during assembly are shown in Figure 12 via dual-perspective views due to longitudinal asymmetry. Significant spatial heterogeneity in stress concentration is observed: distinct high-stress zones form near mid-column installation slots in Ring 3 mortise groove regions, exhibiting spatial correlation with prior displacement fields. Maximum stress concentration occurs at the bottom edge of mortise groove joints connecting the mid-column installation ring (Ring 3) and the adjacent ring (Ring 4), likely resulting from deformation compatibility requirements under prestressing effects. Notably, stress concentration effects revert to prestressing tendon duct peripheries when observing slabs beyond immediately adjacent rings, indicating that longitudinal force transfer through mortise groove connections exhibits localized characteristics, with significant stress redistribution confined to directly connected interfaces.
Major principal stress contours for Rings 2–4 base slabs are shown in Figure 13. Analysis indicates significant spatial correspondence between major principal stress concentration zones and Von Mises stress concentrations, both occurring in longitudinal mortise groove regions near Ring 3 mid-column installation slots. Distinct directional differentiation of principal stresses is observed across mortise groove interfaces connecting the mid-column ring (Ring 3) and adjacent rings, indicating tension–compression combined stress states. Notably, peak major principal stress approaches but does not exceed the tensile strength limit of C50 concrete, confirming elastic behavior in joint interfaces. With increasing distance from mid-column rings, principal stress distribution gradually reverts to tendon duct-dominated patterns.
(2) Stress Analysis During Mid-column and Longitudinal Girder Assembly
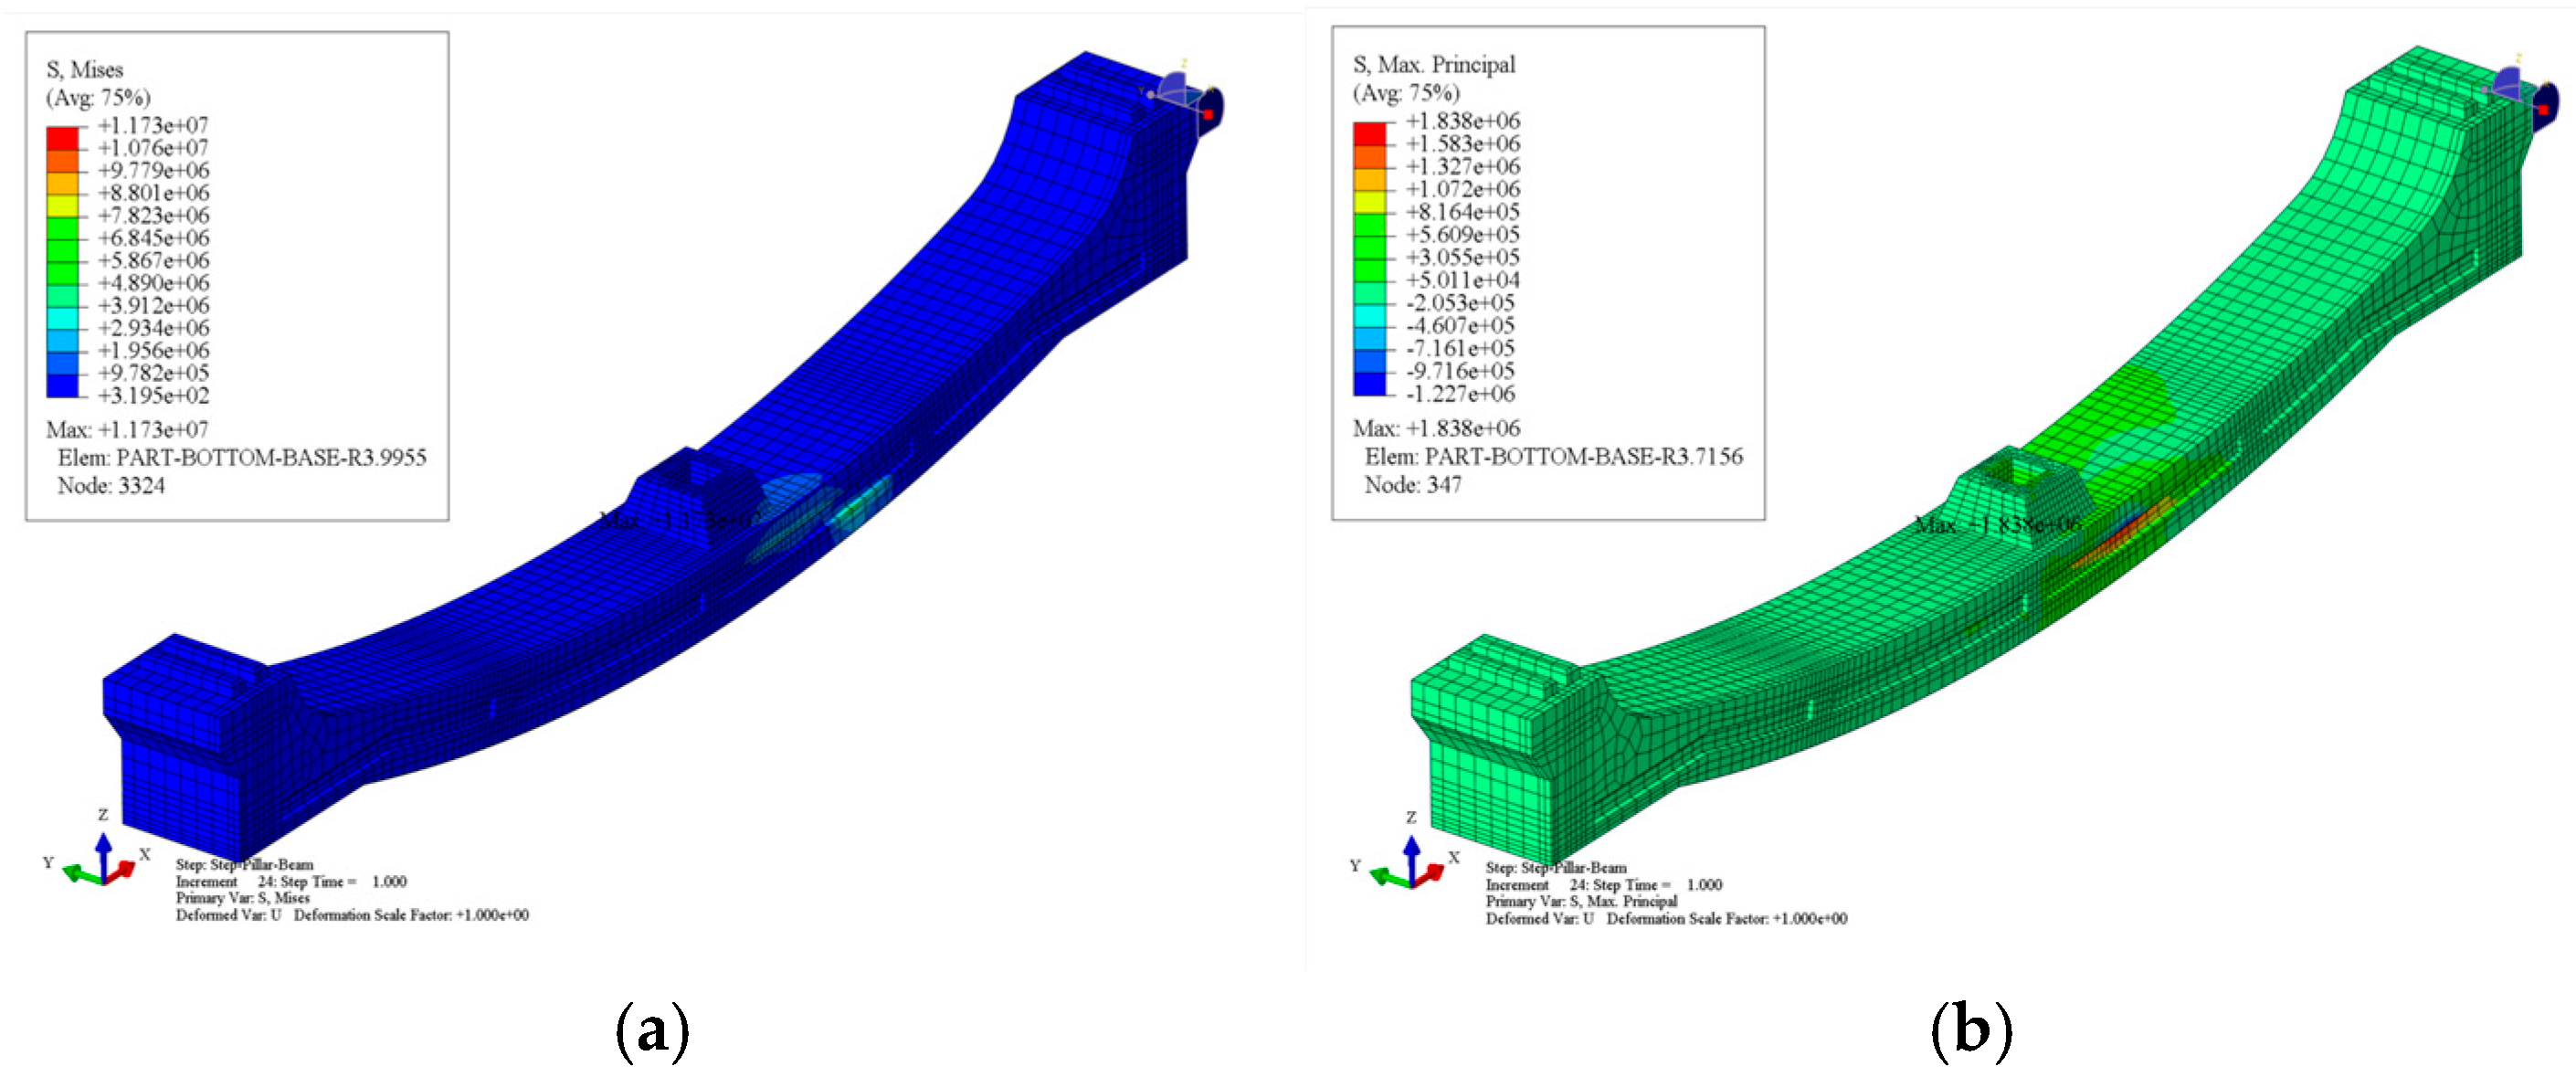
Figure 14a,b present Von Mises equivalent stress and major principal stress contours for Ring 3 base slabs during mid-column and girder assembly. Comparative analysis with Figure 13 reveals that additional installation loads from mid-columns and girders do not significantly alter stress distribution patterns in Ring 3 base slabs. Stress amplitudes and gradient characteristics in pre-existing concentration zones (intersections of longitudinal mortise grooves and mid-column installation slots) remain stable, with major principal stress extrema still located at mortise groove bottom edges.
(3) Stress Analysis During Sidewall Assembly
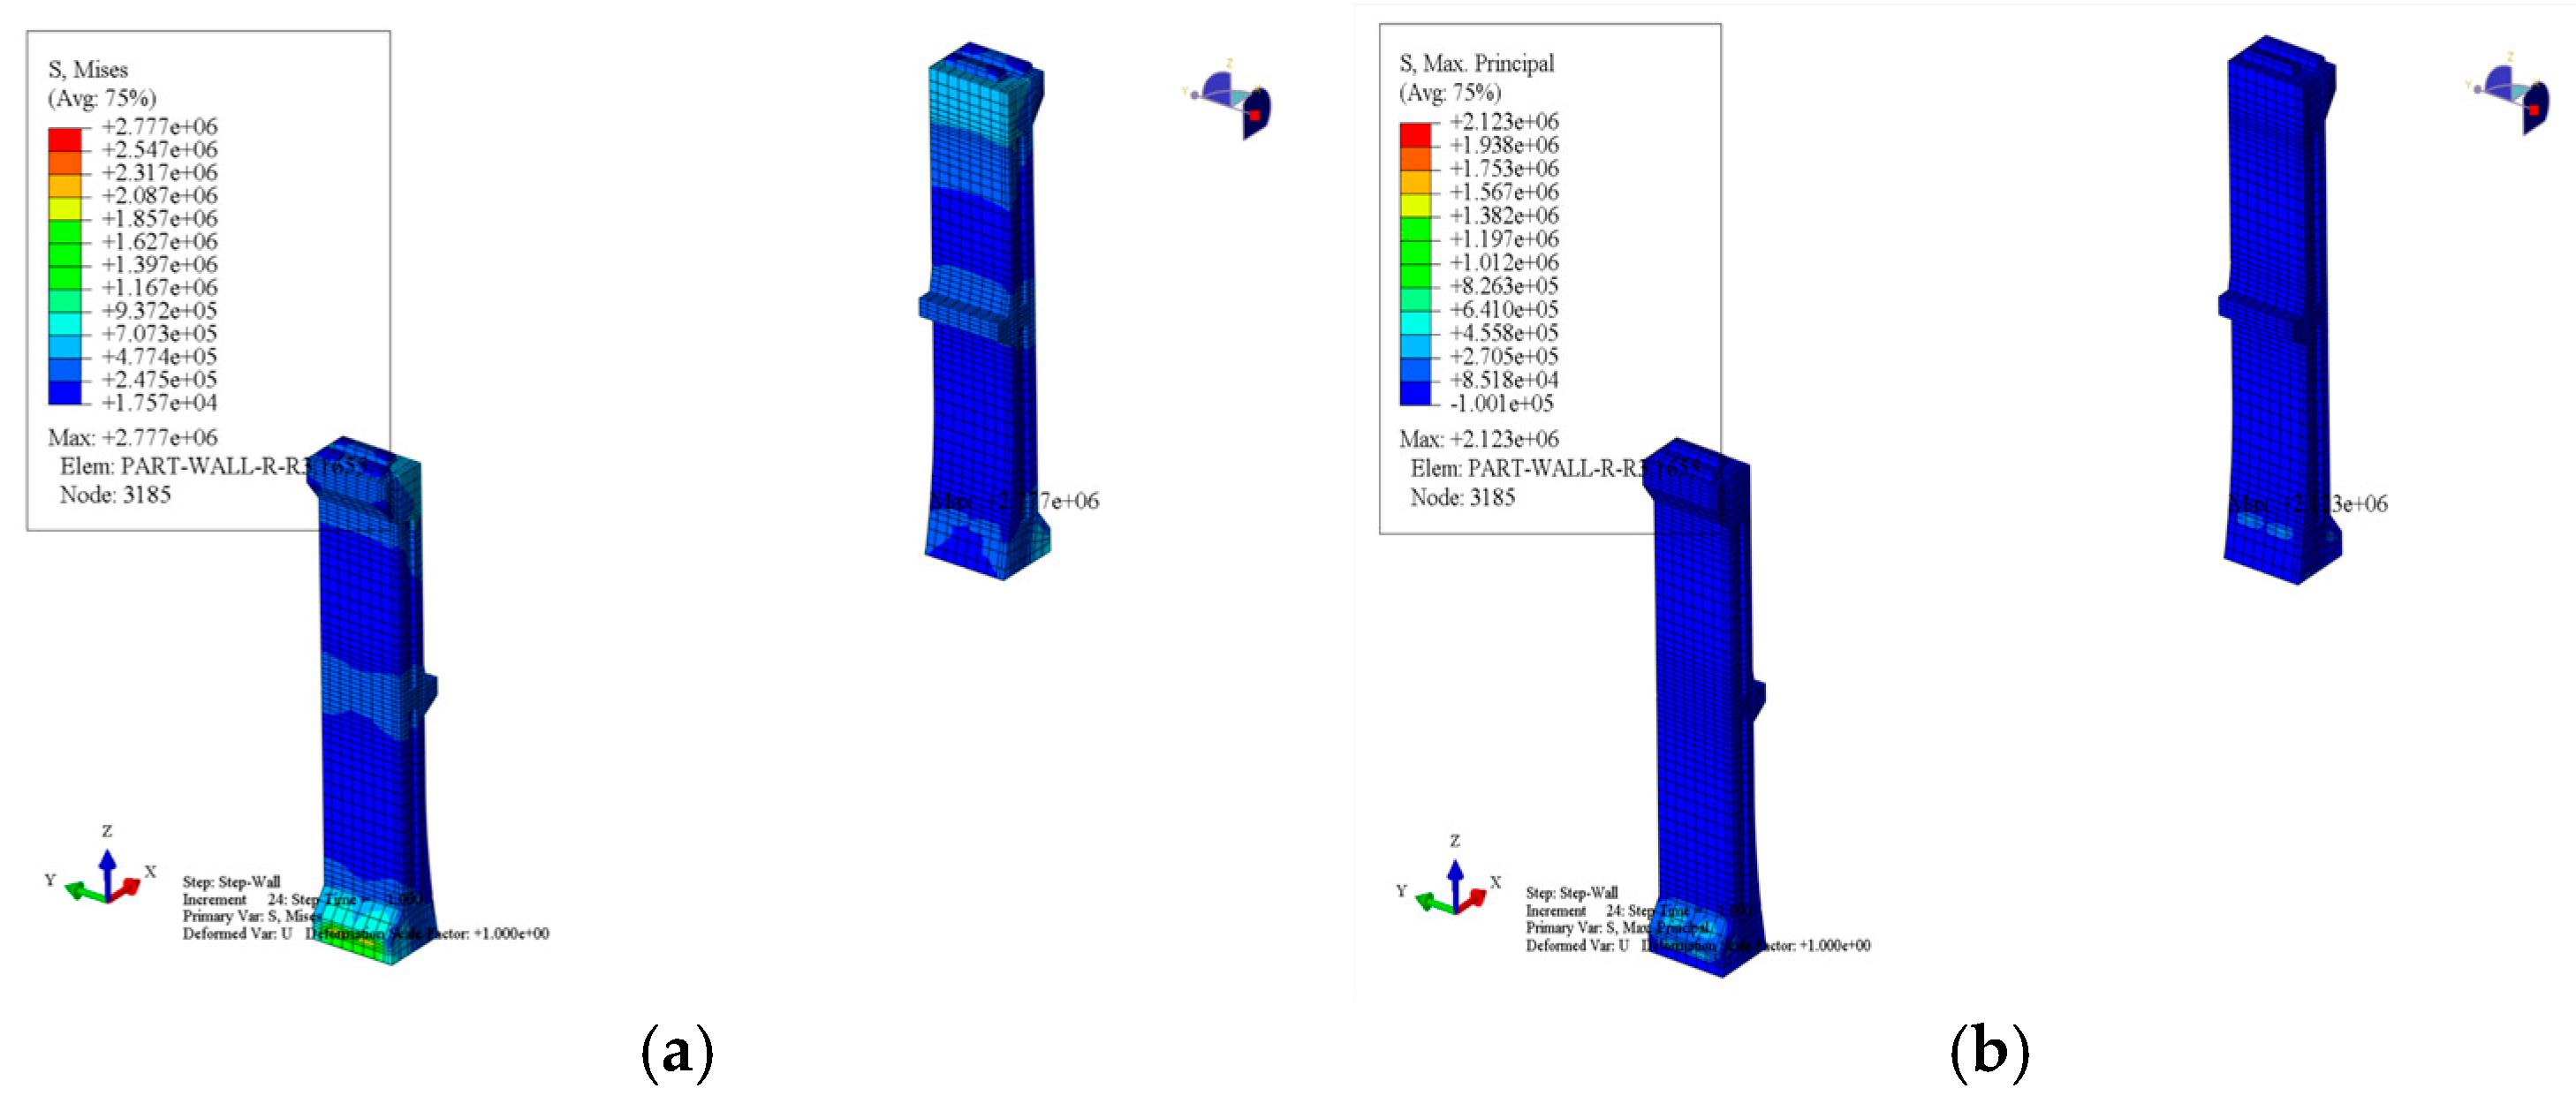
Figure 15a,b present Von Mises equivalent stress and major principal stress contours for the left/right sidewalls of Ring 3 during assembly. Stress states in other rings exhibit similar patterns and are not separately discussed. Distinct stress concentrations form in steel bar anchorage zones at wall–base slab connections, while other regions show low stress magnitudes with major principal stresses even exhibiting tensile states. This indicates that beyond load transfer at steel bar connections, sidewall regions have not developed significant bending/tensile stresses under self-weight, confirming horizontal free displacement states.
(4) Stress Analysis During Intermediate Floor Assembly
Figure 16 presents Von Mises equivalent stress contours for Ring 2–4 intermediate floors during assembly. Analysis reveals peak Von Mises stresses in Ring 3, concentrated at contact zones with longitudinal girders, while Rings 2 and 4 exhibit stress peaks at concave sides of longitudinal mortise grooves, horizontally corresponding to midspan locations of larger-span sides. Notably, Ring 3 displays secondary peak Von Mises stresses approaching magnitudes observed in adjacent rings at identical positions, demonstrating a clear spatial correlation with the −3.9 mm vertical deflection measured at these locations.
Figure 17 displays major principal stress contours for Ring 2–4 intermediate floors. Major principal stresses above girders in Ring 3 significantly exceed corresponding areas in Rings 2/4. Peak zones spatially coincide with Von Mises stress concentrations and vertical deflection maxima, all located at concave sides of longitudinal mortise grooves and girder connections on larger-span sides. This confirms that mid-column offset from the central axis creates larger spans/deformations on the left side, subjecting it to more critical stress states.
(5) Stress Analysis During Roof Assembly
Figure 18a,b present Von Mises equivalent stress and major principal stress contours for the Ring 3 roof, while Figure 18c shows concrete tensile damage values. Stress concentrations prominently occur at small-radius segments of side mortise grooves (Figure 18a,b), coinciding with peak tensile damage zones (Figure 18c). This likely results from diaphragm wall inward displacement tendencies after primary bracing deactivation, transmitting counterforces through force-transfer keys that induce inward compression at roof ends. This causes geometric incompatibility in mortise grooves, inducing complex stress states and localized tensile damage. Prestressed steel bars connecting the roof and sidewalls exhibit moderate stresses but remain negligible compared to mortise groove concentrations.
(6) Stress Analysis During Backfill Completion
Figure 19a,b present Von Mises equivalent stress and major principal stress contours for the Ring 3 structure (excluding mid-columns and longitudinal girders) post-construction. Overall, Von Mises stress peak locations remained consistent with pre-backfill stages, concentrated at intermediate floor left span midspan; small-radius segments of roof mortise grooves; roof vault and spandrels; and intra-ring prestressed steel bar connections. Major principal stress distribution homogenized overall, with elevated values only at the convex sides of intermediate floor mortise grooves in the left span midspan. These results demonstrate favorable macroscopic stress distribution across the prefabricated station cross-section under overburden loads. Beyond critical local stress states at specific zones (e.g., longitudinal mortise grooves in intermediate floor left midspan), yielding risks remain low elsewhere, with no adverse phenomena observed near component interfaces.

3.2.3. Stress Analysis of Contact Surfaces in Different Processes

(1) Contact Analysis During Base Slab Assembly
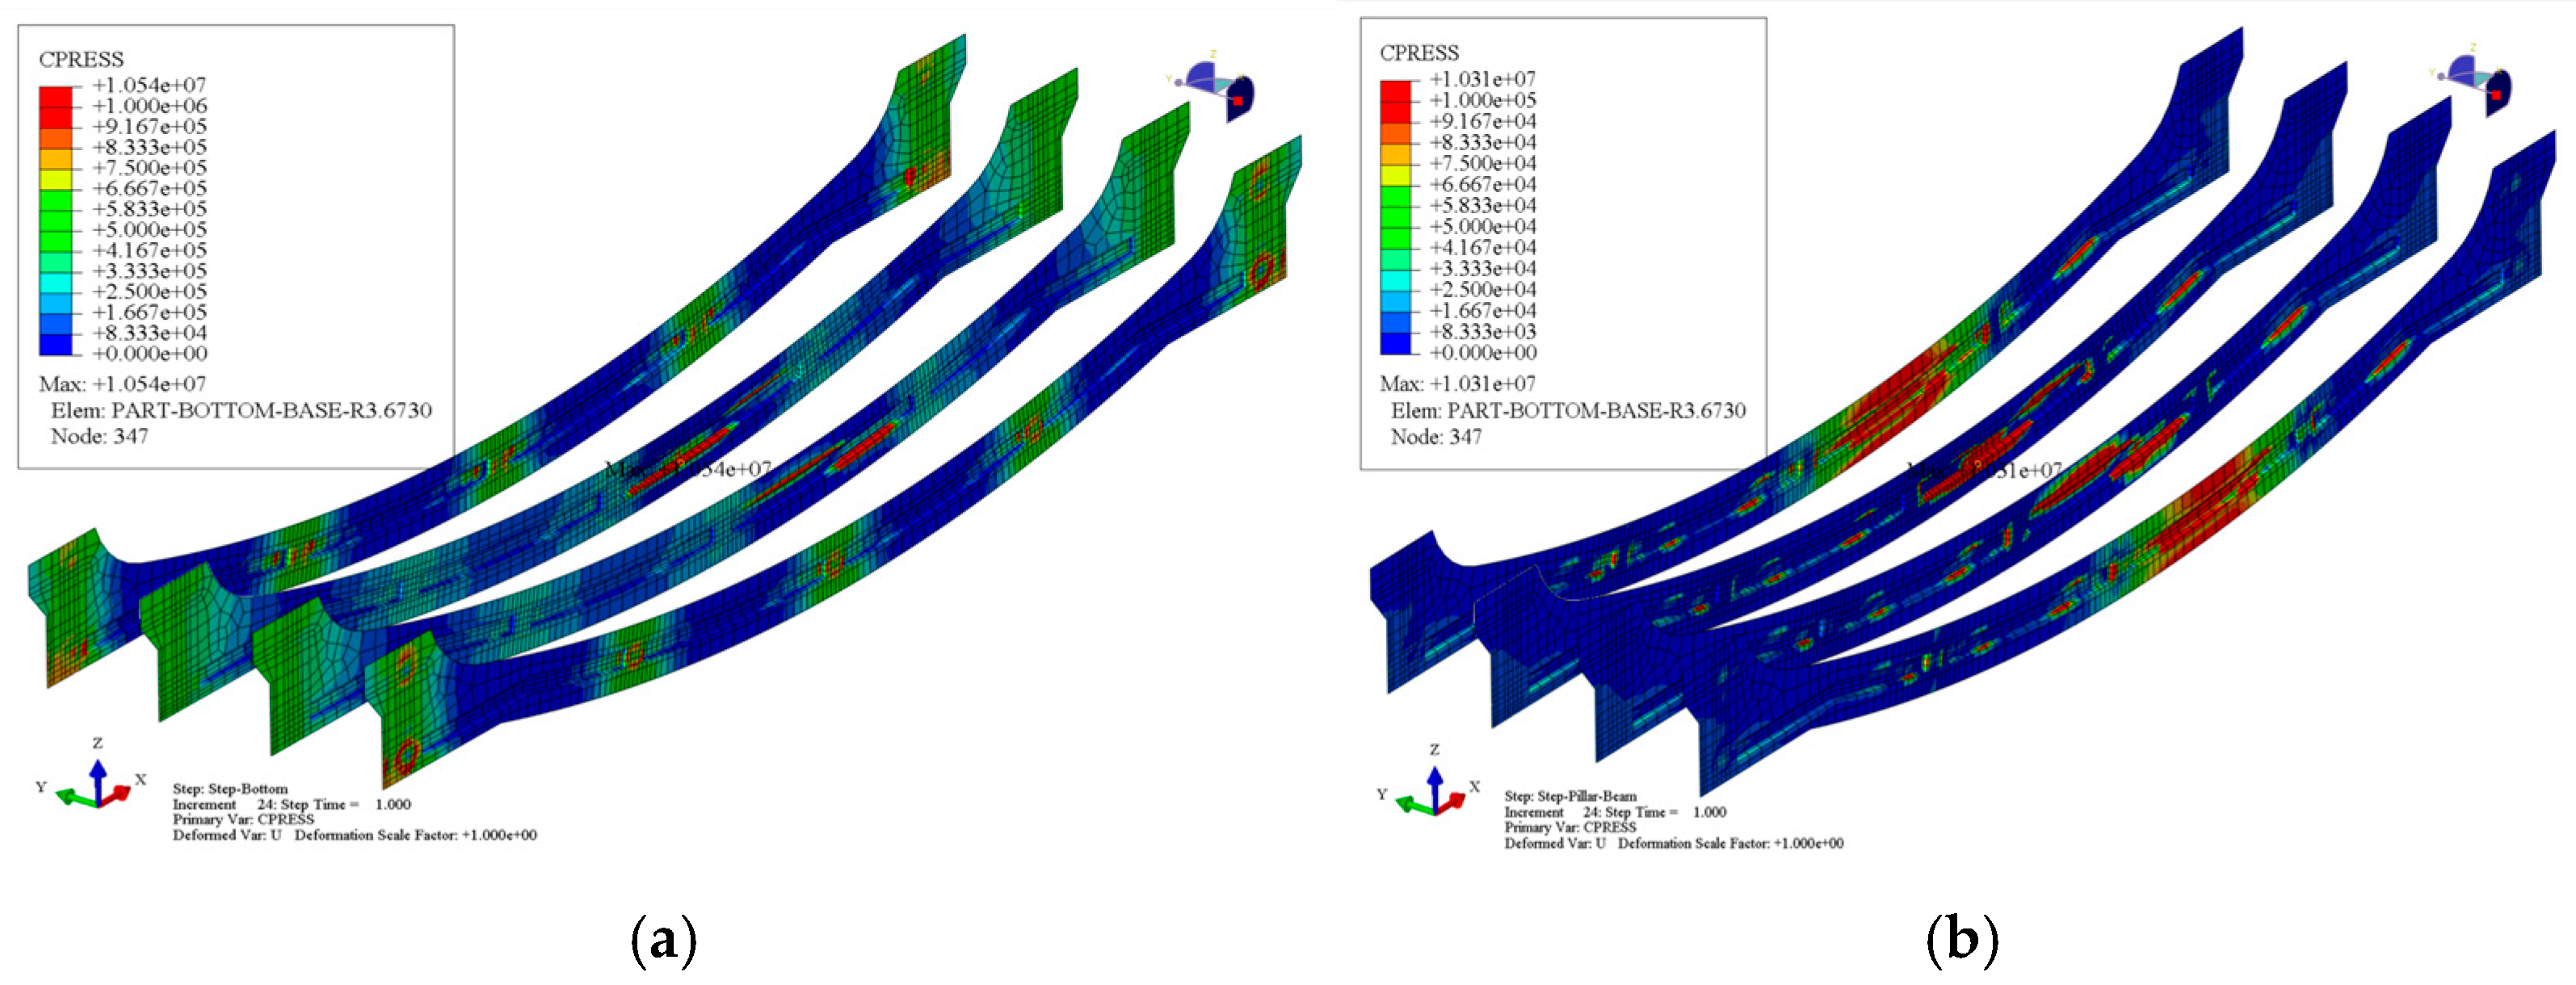
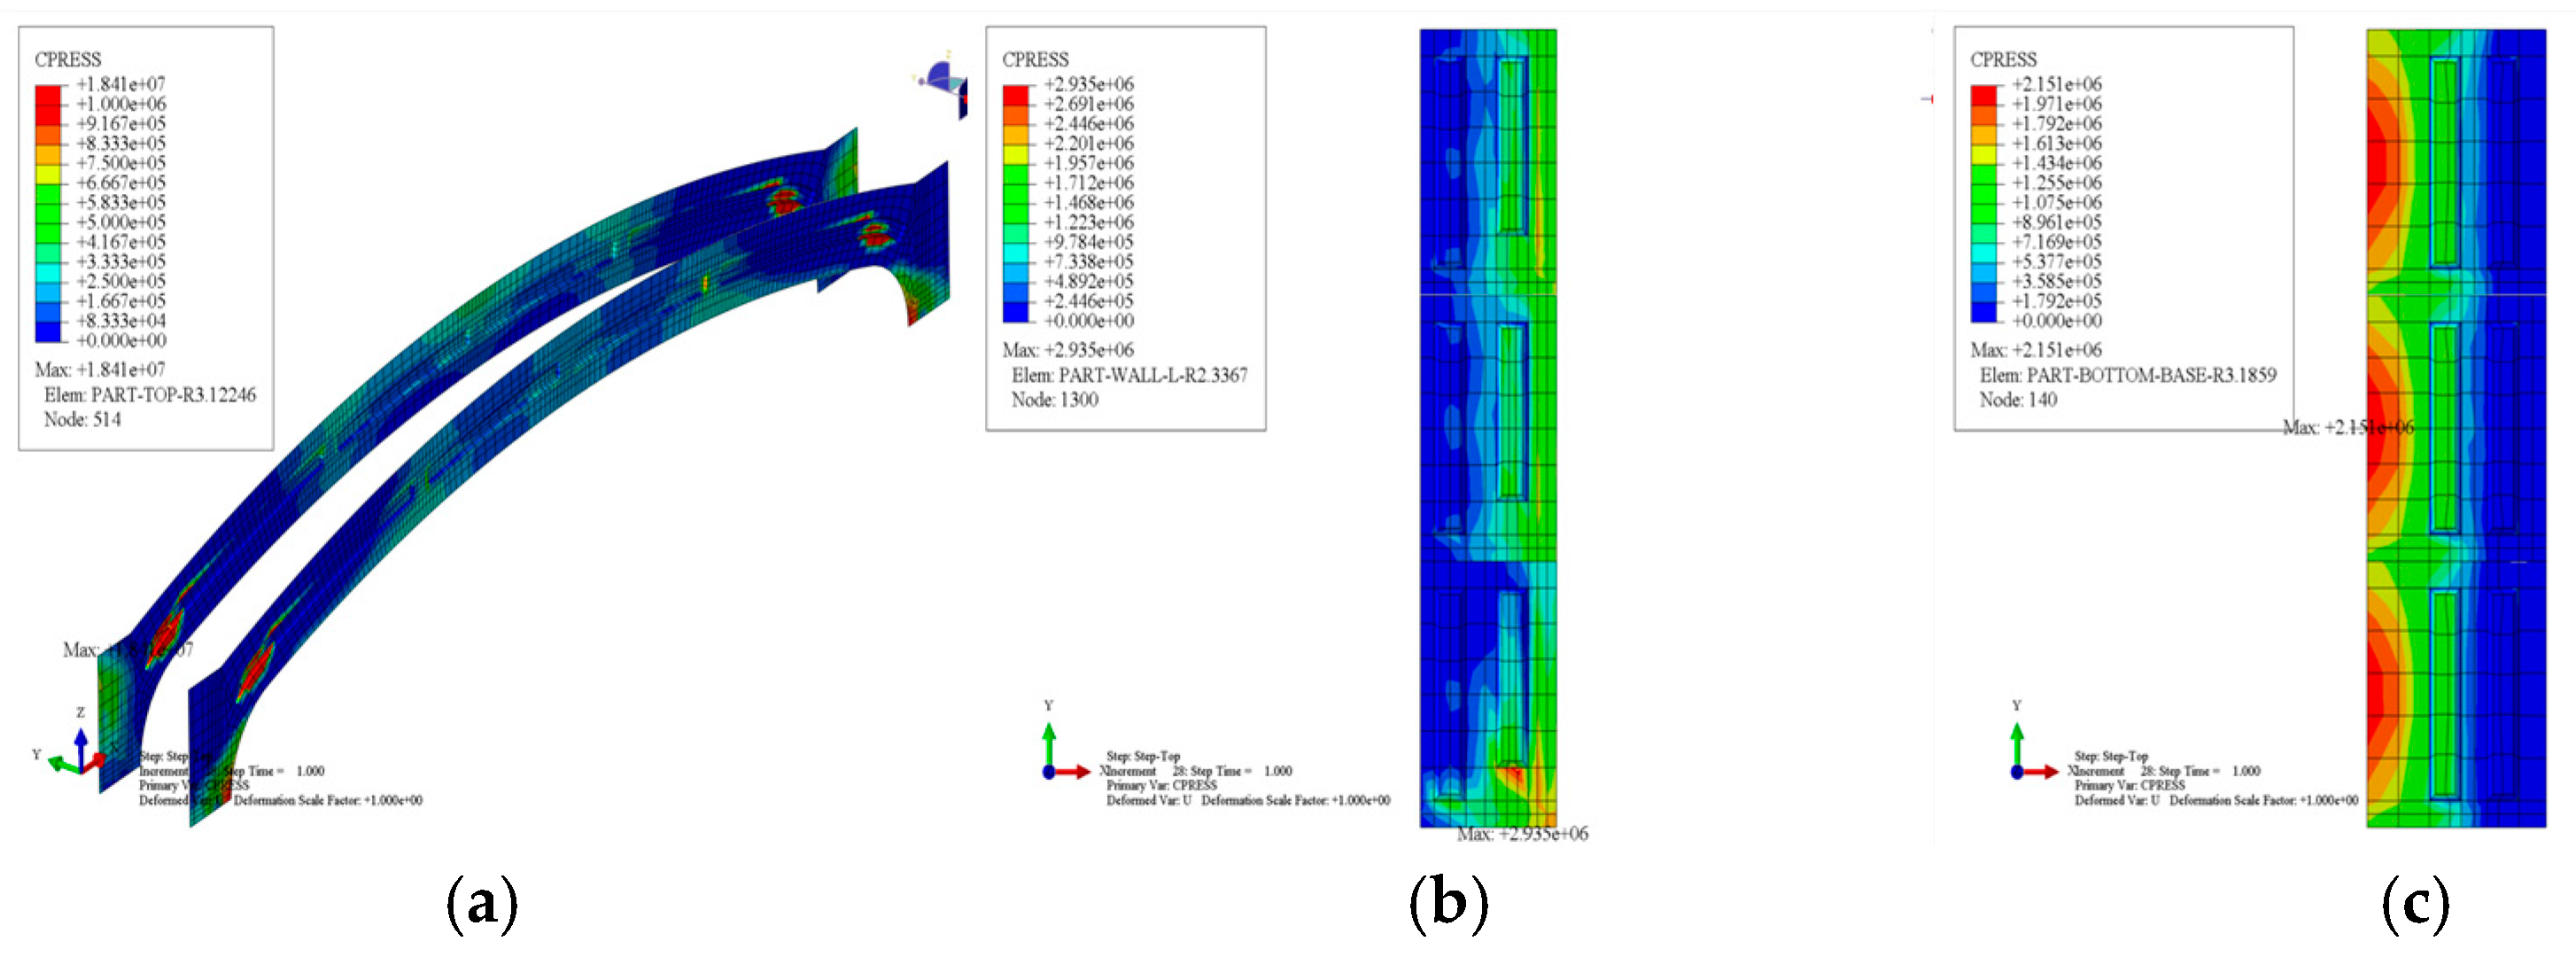
Contact stress contours on inter-ring interfaces of base slabs are shown in Figure 20. To clarify distribution patterns amidst significant stress concentrations near mid-column installation slots, contour values exceeding 1 MPa are truncated and displayed in solid red. Key characteristics emerge: continuous stress concentration bands form along upper/lower edges of longitudinal mortise grooves in the mid-column installation ring (Ring 3), exhibiting clear correspondence with internal stress fields of adjacent rings; contact stresses in non-slotted regions demonstrate relatively uniform amplitudes and gradients, indicating consistent force-transfer mechanisms through mortise grooves in standard ring segments. Elevated contact pressures near longitudinal splicing interfaces traversed by prestressing tendons validate longitudinal pre-tensioning as effectively enhancing interfacial compactness during assembly.
(2) Contact analysis of the assembly stage between the center pillar and the center longitudinal beam
Figure 21 displays inter-ring contact stress contours for base slabs during mid-column and girder assembly. Due to intensified stress concentrations, contour values exceeding 0.1 MPa are truncated and shown in solid red. Installation significantly alters contact stress distribution: intensified concentrations at connection zones propagate transversely and longitudinally to adjacent rings. Load-induced deformation amplifies interfacial stress heterogeneity compared to base slab assembly alone, with discrete high-stress points emerging along mortise groove edges, indicating a transition from continuous surface contact to discrete point-contact patterns.
Figure 22 presents contact stress contours at mid-column ends. Per Figure 4 (top view, assembly direction upward), the station centerline lies left of the mid-column. Contact stresses between the column and girder exhibit axial symmetry, while column–base slab interfaces show ≈5% outward offset due to asymmetry in Ring 3 installation slots. Notably, bolt connections limit peak contact pressures to <1 MPa at both column ends.
(3) Contact analysis during the assembly stage of the side wall
Figure 23 displays major principal stress contours of mid-column connection bolts. Bolt stresses exhibit minor asymmetry due to structural asymmetry in longitudinal and transverse directions. Particularly at column–base connections, transverse bolts near the station centerline sustain lower stresses than opposite-side counterparts, while longitudinal bolts show slight force variations. Overall, bolt stresses remain minimal under self-weight loads, with contact interfaces bearing primary loads.
(4) Contact Analysis During Sidewall Assembly
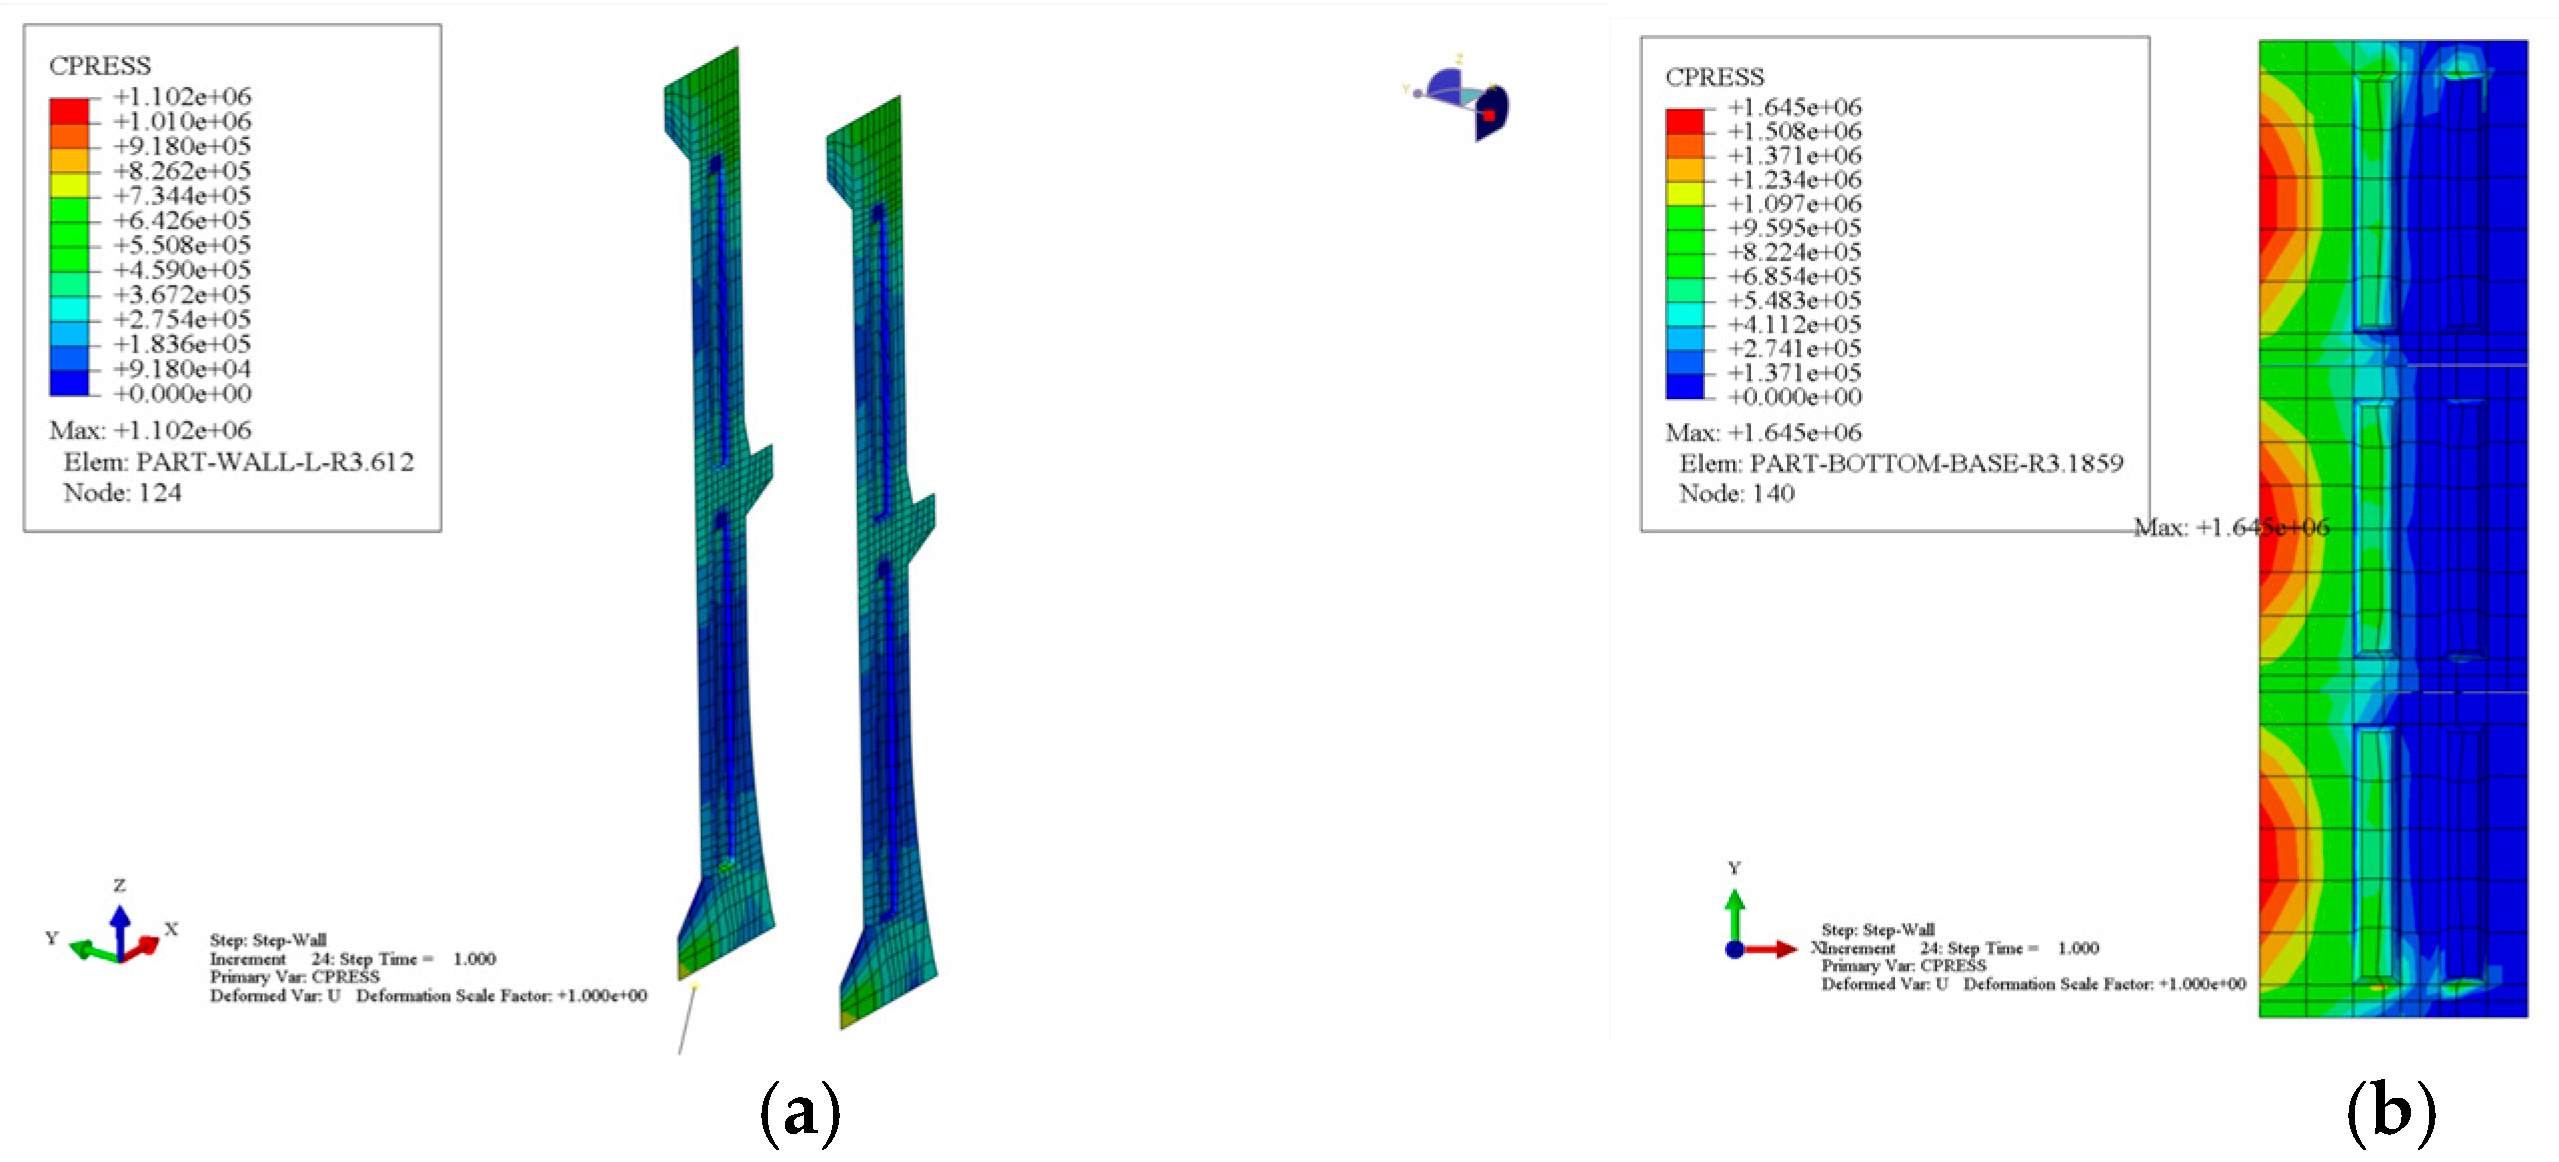
Figure 23a presents inter-ring contact stress contours for left/right sidewalls. Contact stress distribution demonstrates uniformity without significant concentrations, attributable to geometrically simpler configurations of sidewalls and mortise grooves. Elevated contact pressures near prestressing tendon ducts align with established mechanical principles.
Figure 23b presents contact stress contours on intra-ring interfaces between base slabs and sidewalls of Rings 2–4 during sidewall installation. Observation reveals significant stress concentration in outer structural zones for both left/right sidewall–base slab connections, with contact stresses approaching zero at inner regions (near station axis) demarcated by outer mortise grooves. This eccentric distribution is directly induced by tensioning effects of prestressed steel bars connecting base slabs and sidewalls, whose generated moment equilibrium mechanism effectively counteracts the potential overturning tendencies of sidewalls toward the structure’s interior.
(5) Contact analysis during the assembly stage of the middle plate
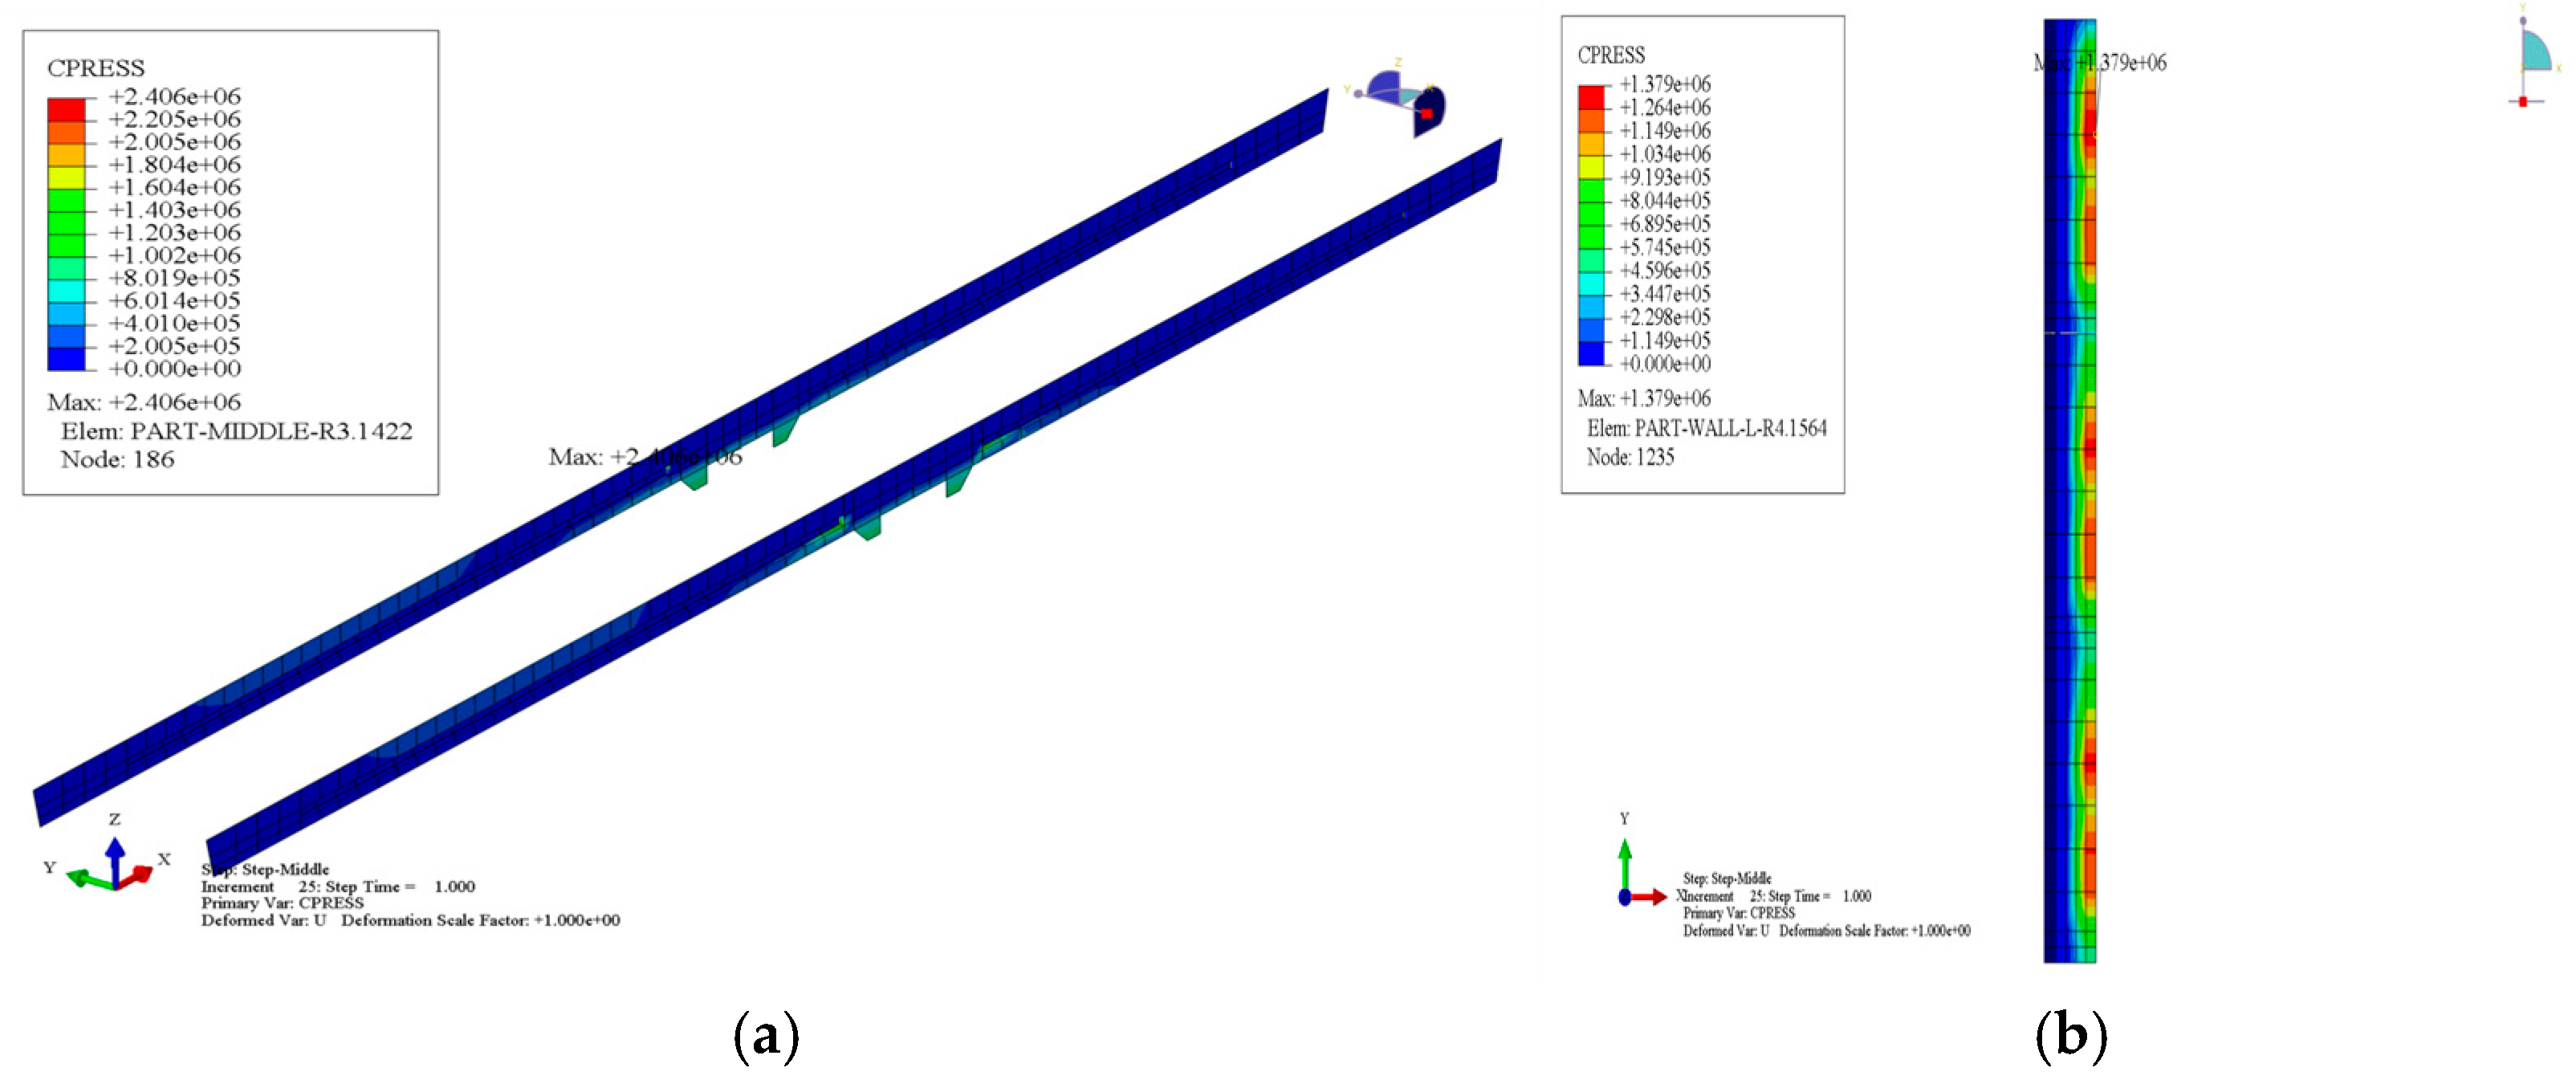
Figure 24a displays inter-ring contact stress contours for Rings 2–4 intermediate floors. Observation reveals overall low-magnitude contact stresses due to absent longitudinal pre-tensioning. Stress concentrations primarily distribute at girder–floor transition zones, likely attributable to significant compressive stresses at critical load-transfer nodes where the Poisson effect induces notable lateral expansion.
Figure 24b presents contact stress contours between sidewall corbels and intermediate floors during assembly. Left/right corbel stress distributions exhibit similar patterns, but left corbel peak stress reaches 1.9 times the right value. This significant disparity stems from spatial asymmetry in floor–girder–column systems, where larger left-span deflection generates higher support reactions, demonstrating substantial asymmetry effects on support conditions.
Figure 25 shows contact stress contours between base slabs and sidewalls post floor installation. Compared with Figure 24b, contact stresses exhibit slight magnitude increases with essentially unchanged distribution, indicating minimal primarily vertical loads transferred from the floor self-weight.
(6) Contact analysis during the assembly stage of the roof panel
Figure 26a displays inter-ring contact stress contours for Ring 2–4 roof slabs during installation. Due to pronounced stress concentrations at longitudinal mortise groove edges, contour values exceeding 1 MPa are truncated and displayed in solid red to clarify distribution patterns.
Analysis reveals complete coincidence between contact stress concentration zones on circumferential roof interfaces and concentrated areas of Von Mises stress, major principal stress, and tensile damage, validating prior hypotheses on damage mechanisms. Inter-ring contact stress distribution remains relatively uniform elsewhere, consistent with other components. However, significant discrepancies exist between contact stress distributions on Ring 2–3 and Ring 3–4 interfaces near spandrels for unknown reasons.
Figure 26b displays contact stress contours between sidewalls and roof slabs for Rings 2–4 during roof assembly. Contrary to sidewall–base slab interfaces, contact stresses concentrate near the structure’s interior side, likely due to potential inward rotation tendencies of spandrels under vertical self-weight loads. Overall, stress concentrations remain insignificant at this stage.
Figure 26c presents contact stress contours between base slabs and sidewalls post-roof installation. Synthesizing Figure 24b and Figure 27, maximum contact stresses synchronously increase on both sidewall–base slab interfaces with expanded compression zones due to added superstructure loads, though distribution patterns remain fundamentally unchanged.
(7) Contact analysis during the backfilling completion stage
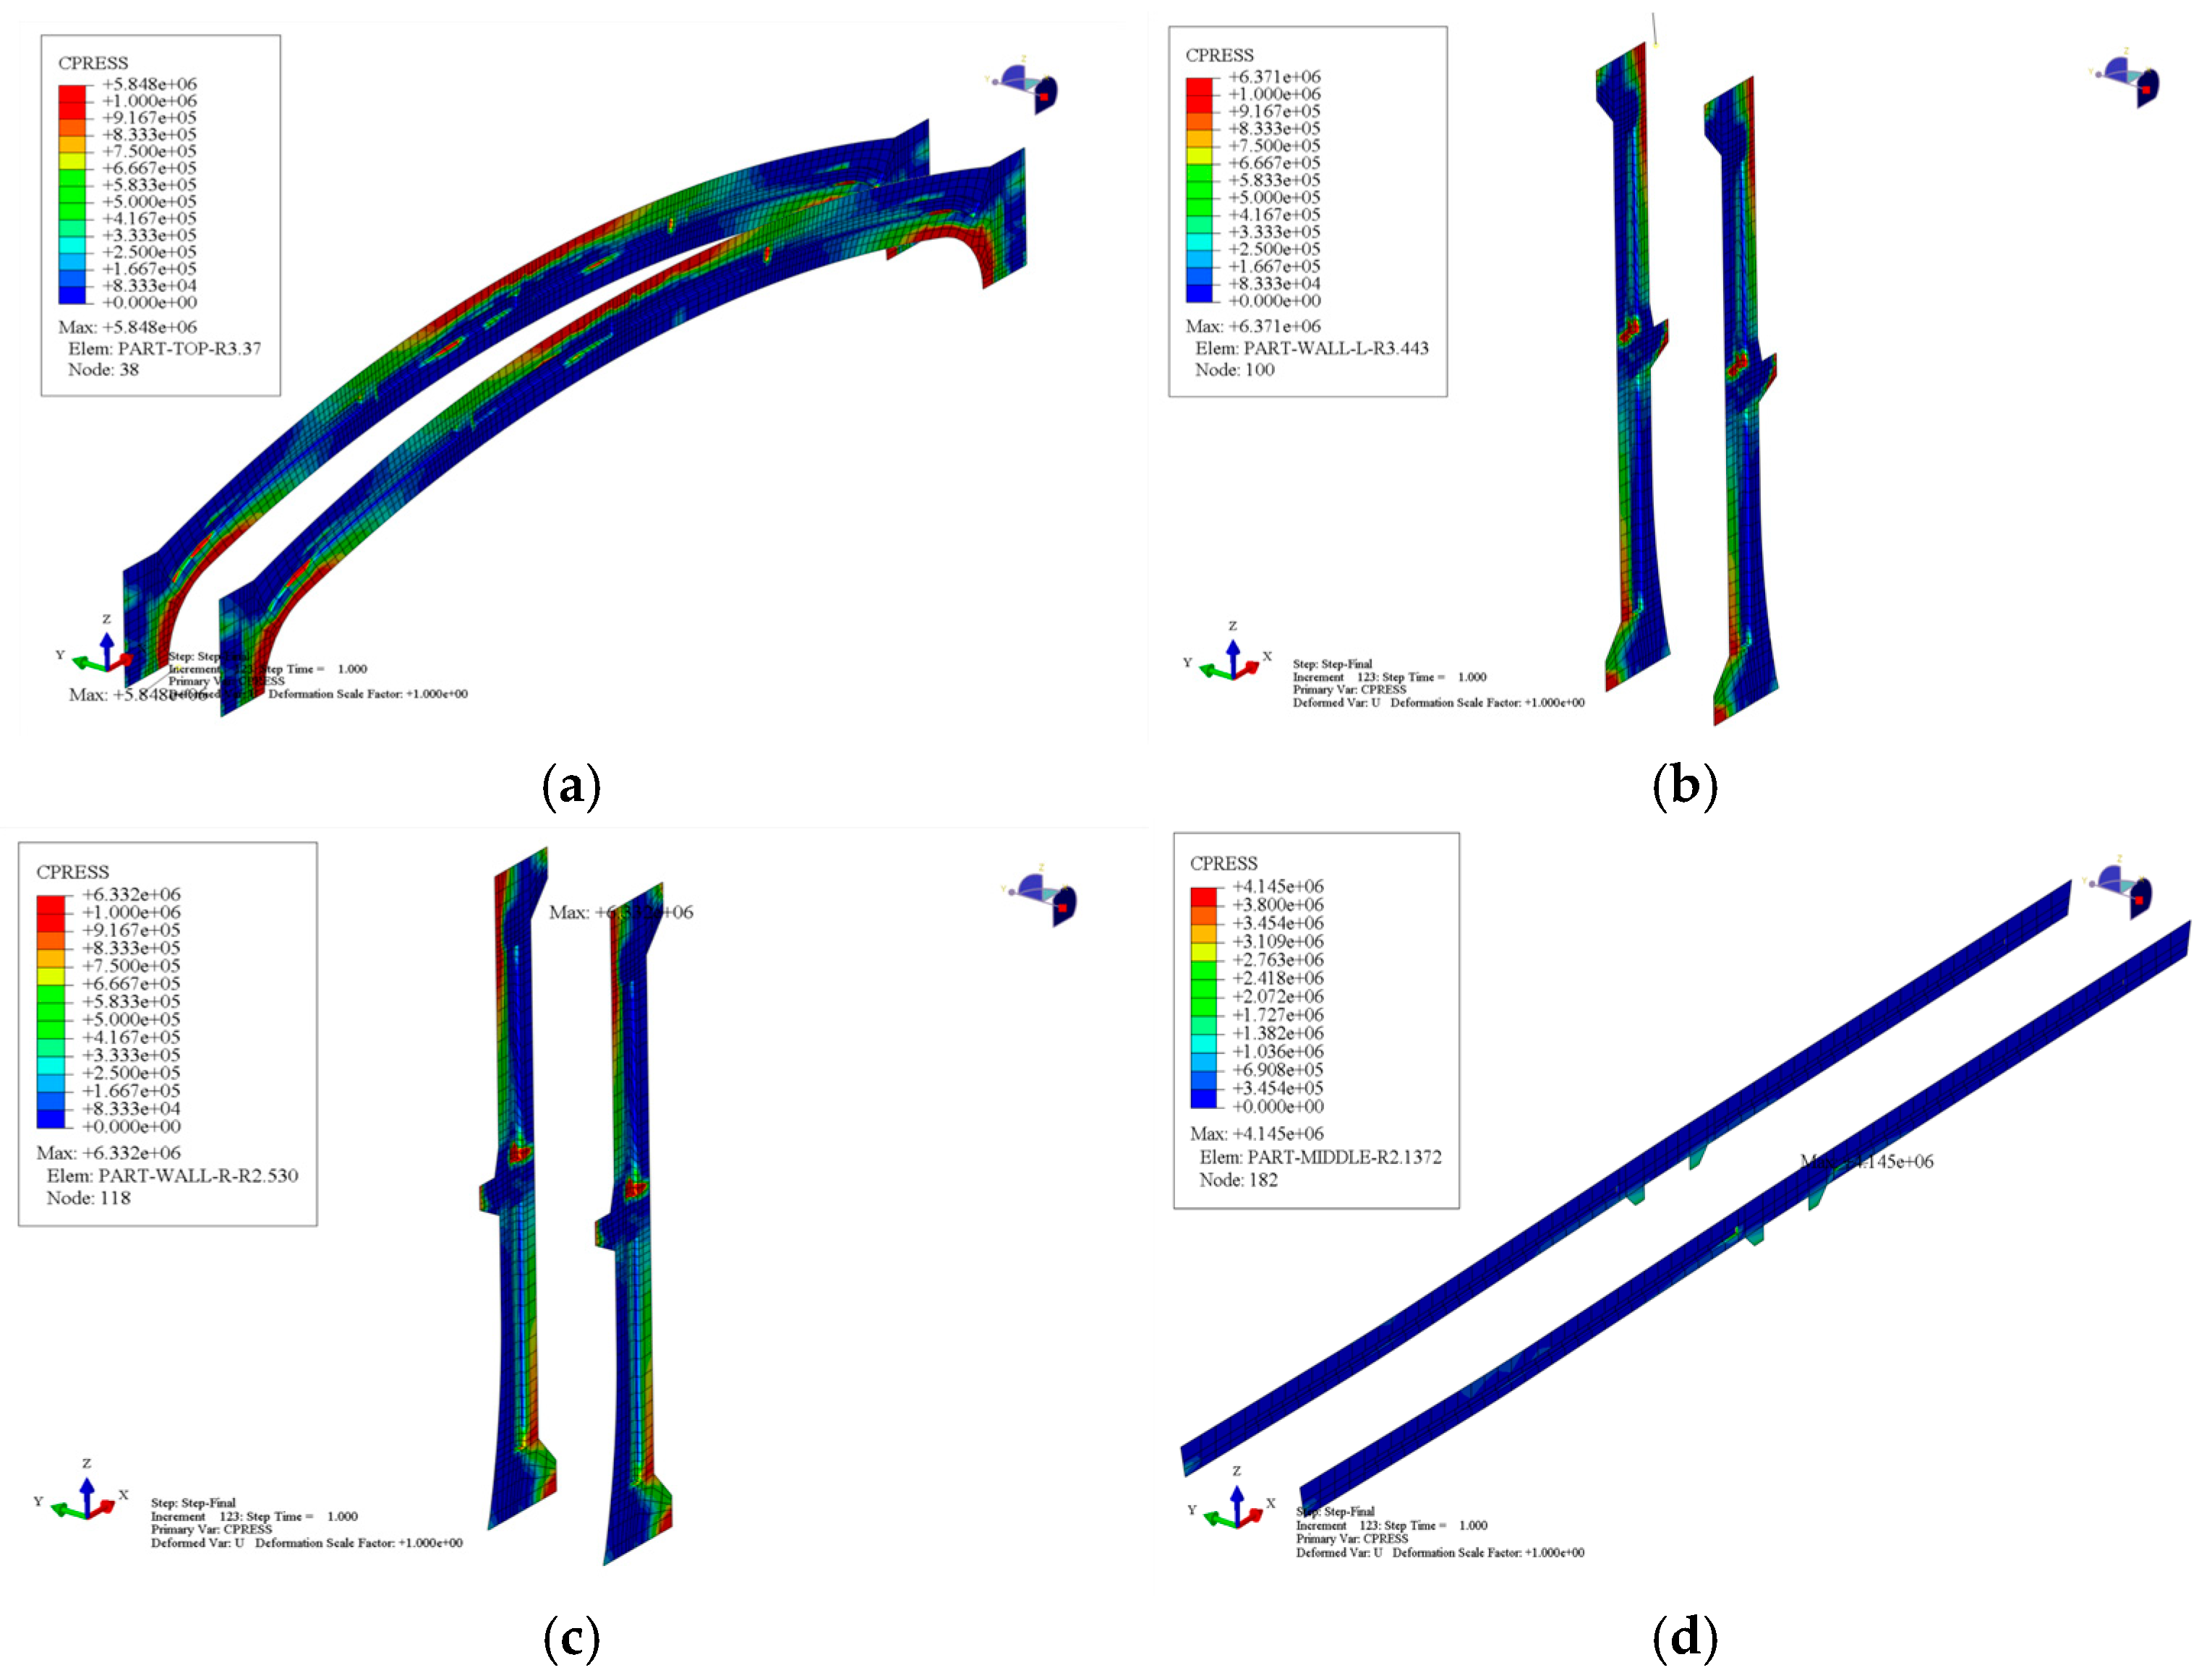
Figure 27a–d present inter-ring contact stress contours for roof, sidewall, intermediate floor, and base slabs of Rings 2–4 post-construction.
Figure 27a reveals a significant redistribution of roof contact stresses post-backfill: vault contact stresses substantially increase with localized concentrations, while spandrels exhibit elevated stresses likely due to longitudinal expansion in compressed zones from the Poisson effect. Notably, mortise groove stress concentrations are significantly alleviated, indicating that assembly-phase localizations minimally impact final service states.
Figure 27b,c demonstrate analogous patterns in sidewalls: elevated contact stresses occur near heavily compressed spandrels and wall bases. Significant concentrations emerge at lower mortise groove regions under increased vertical loads. Conversely, intermediate floor contact stresses remain largely unchanged (Figure 27c).
Figure 27d shows intensified stress concentrations at longitudinal mortise grooves near mid-column slots in base slabs, though confined within narrow edge zones. Additionally, exterior compression substantially increases contact stresses in outer slab regions.
Figure 28a–c present contact stress contours for roof–sidewall, base slab–sidewall, and intermediate floor–corbel interfaces of Rings 2–4 post-construction. Post overburden loading, eccentric distribution intensifies on sidewall–roof/slab interfaces, with peak contact stresses exceeding 100% pre-load values. Compression concentration zones narrow significantly, indicating heightened sidewall outward rotation tendencies. Maximum contact stresses at left/right sidewall corbel–floor interfaces further increase, with left-side escalation far greater than right-side, amplifying structural asymmetry.
Figure 28a displays contact stress contours at mid-column ends post-construction. Under overburden loads, the column–top–girder interface transitions to eccentric compression, with compressive stresses concentrating on the larger-span side (left) of the intermediate floor. Correspondingly, column–base–slab contact stresses shift toward the opposite side within confined zones, peaking above 10 MPa, indicating local failure risks. Synthesizing Figure 28c, the asymmetric floor system induces significant rotations at support nodes, particularly deflection toward the larger-span side at longitudinal girder connections, causing eccentric compression states at column ends.

3.2.4. Process Analysis of Key Mechanical Indicators

(1)
Displacement of the underground continuous wall
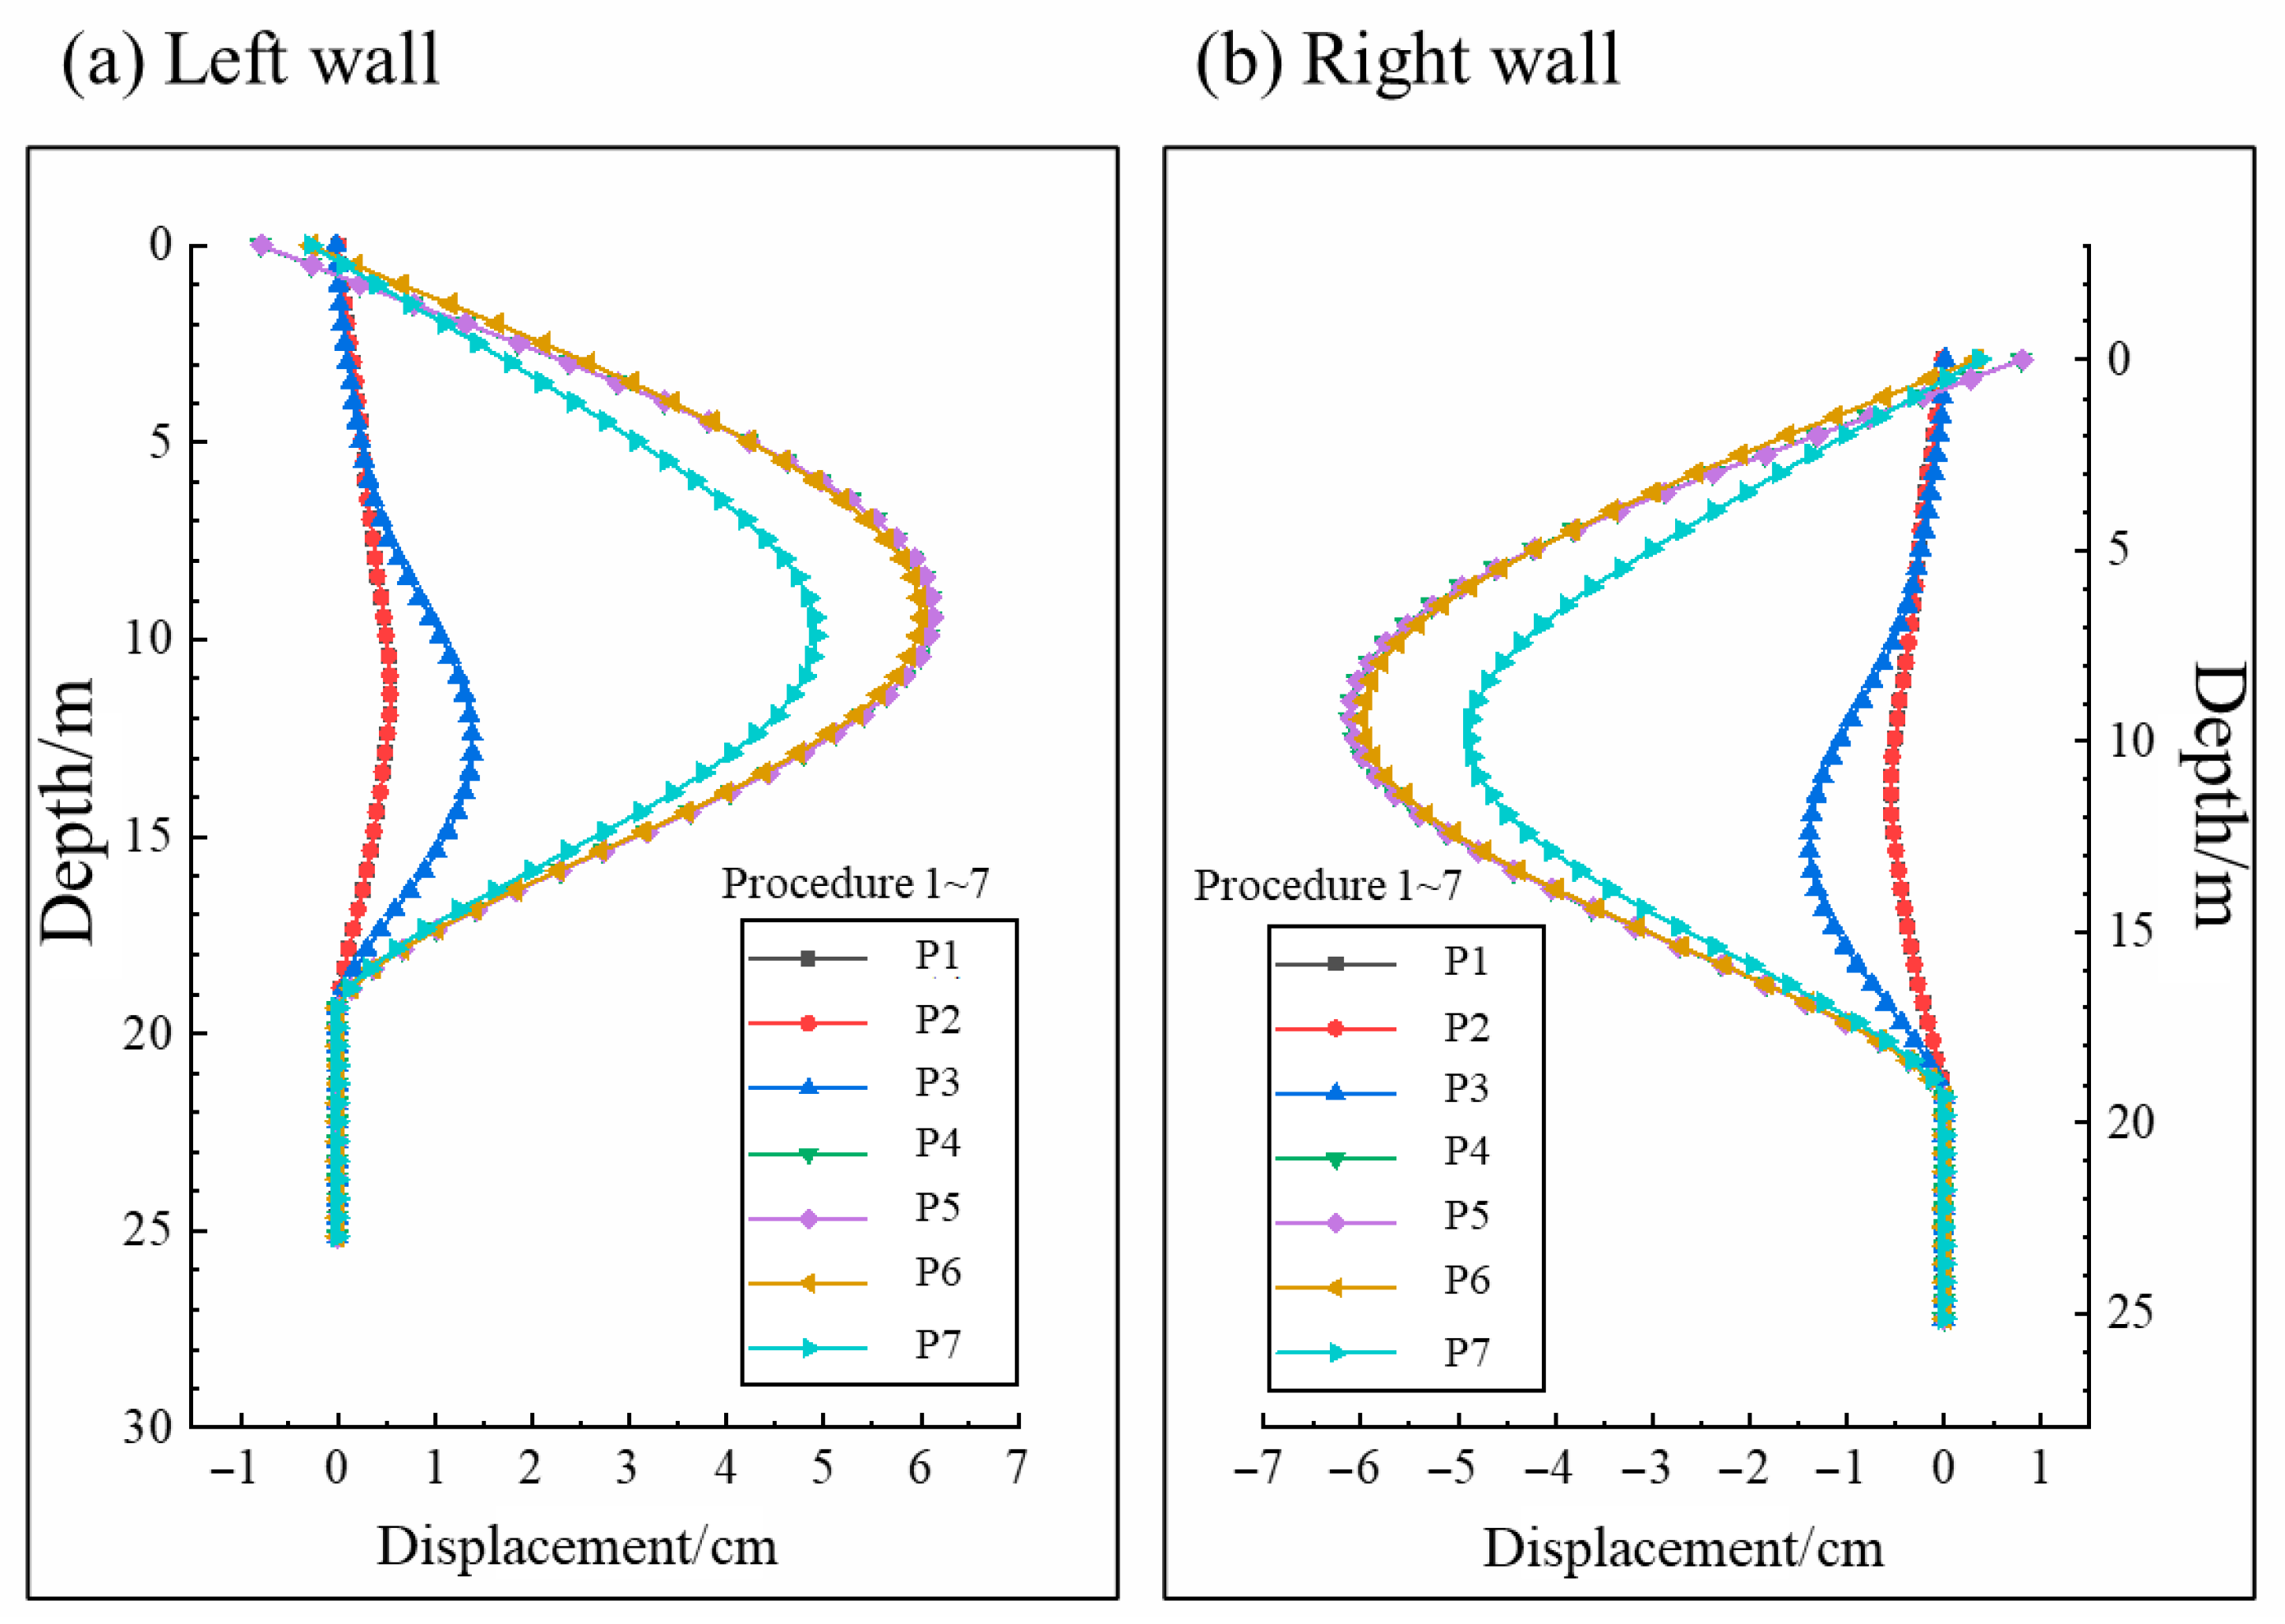
Figure 29 presents horizontal displacement curves of diaphragm walls across construction stages. Per the model coordinate system, positive displacement for left walls indicates movement toward the excavation interior (structure direction), while right walls exhibit the opposite convention. Analysis reveals that diaphragm wall displacements correlate critically with bracing removal. The maximum displacement increment (≈6 cm) occurs during secondary bracing removal (Phase 4: sidewall assembly), with peak displacement located between secondary and tertiary bracing levels. Despite force-transfer keys, minimal outward horizontal resistance from the incomplete main structure results in near-constant displacements from Phase 4 through roof assembly completion.
Following backfill in structure–wall gaps, vertical overburden loads convert to outward horizontal thrust through the roof’s arched configuration. This thrust transfers via backfill to diaphragm walls, inducing rebound displacements. Post construction, maximum horizontal displacement decreases from ≈6 cm to ≈5 cm.
(2)
Contact stress between structural rings
Figure 30 presents evolution curves of maximum contact stresses at the sidewall–base slab and sidewall–roof interfaces throughout construction phases. Curve morphologies distinctly demonstrate direct correlations between peak contact stresses and superstructure loading magnitudes. Maximum contact stresses at left/right sidewall–base slab and sidewall–roof interfaces remain essentially consistent during all phases, indicating that asymmetry in the intermediate floor–longitudinal girder–mid-column system exerts minimal influence on the primary load-bearing mechanism (roof–sidewall–base slab) at the macro level.
(3)
The connection between the middle plate, the middle column, and other parts of the structure
Figure 30c,d present the variation curves of the maximum contact stress on the contact surface between the middle-level floor slab and corbels of sidewalls, as well as the maximum tensile stress in the bolts connecting the middle-level floor slab to the corbels and longitudinal girders, concerning the construction sequence. The figures indicate that before backfilling, the maximum contact stress between both left and right sidewalls and the middle-level floor slab, as well as the maximum bolt tensile stress at the left corbel, right corbel, and central girder, generally change synchronously. However, after applying the overlying backfill load, the stress states in various sections begin to diverge significantly. On the side with the larger span of the middle-level floor slab (left side), both the maximum contact stress between the sidewall corbel and the middle-level floor slab and the maximum tensile stress in the connecting bolts at this location increased markedly by approximately 400%. In contrast, the maximum contact stress between the right sidewall corbel and the middle-level floor slab and the maximum bolt tensile stress increased by only about 60%, resulting in an ultimate difference of approximately 6 MPa in the maximum contact pressure between the corbels on both sides and a difference of about 1.1 GPa in the maximum bolt tensile stress. Simultaneously, the maximum tensile stress in the bolts connecting the central girder to the middle-level floor slab increased by 0.4 GPa, a rise of approximately 500%.
Taken together, the increase in the overlying load highlights significant issues within the asymmetric structural system of the middle-level floor slab, central girder–central column. The deflection of the floor slab on the side with the larger span far exceeds that on the side with the smaller span, causing the floor slab to develop a rotation angle at the central column joint. This induces eccentric compression on the contact surfaces between the floor slab and the girder, as well as at the ends of the central column, imposing considerable stress on the connecting bolts.
Figure 30e,f show the variation curves of the maximum contact stress on the contact surfaces at both ends of the central column and the maximum tensile stress in the bolts connecting the central column to the girders and baseplate slots, concerning the construction sequence. It can be observed that both the maximum contact stress between the central column and the structural baseplate and the maximum tensile stress in the central column connection bolts undergo two distinct stepwise increases. The first increase occurs during the assembly stage of the middle-level floor slab, evidently attributable to the self-weight load of the middle-level floor slab transferred via the central girder. The second increase happens during the final backfilling stage; although the load increment is substantial during this phase, the additional load is primarily borne by the top slab and transferred directly to the baseplate through the sidewalls. The likely cause for the increased stress on the central column is that deformation of the sidewalls induced by the load triggers further deflection of the middle-level floor slab, generating an additional load on the central column and girders that support it.

4. Conclusions

This chapter employs ABAQUS software to simulate the entire construction process of assembling large prefabricated segments for a subway station, conducting a full-section analysis of mechanical performance distribution in both transverse and longitudinal directions. Key conclusions are as follows:
(1) Simulation results indicate that the segmentation of the main structure in the Huaxia Station assembly section is rational, with stable inter-component connections. Throughout the assembly process, the structure consistently exhibits well-defined load transfer paths and adequate bearing capacity, with no identified weak points posing risks to overall structural stability.
(2) The tenon–mortise connection method between components imparts distinct mechanical responses in longitudinal and transverse directions compared to cast in situ station structures. Specifically, when subjected to uneven longitudinal loading, friction resistance on inter-ring contact surfaces alone is insufficient to fully resist the tendency for ring dislocations. This causes localized transition of longitudinal tenon–mortise joints to point contact, resulting in stress concentrations. During structural assembly stages, differences in mass and stiffness distribution between adjacent ring segments may also lead to incompatible tenon–mortise deformations, generating additional stress and deformation. Therefore, balancing mass and stiffness distribution across ring segments via counterweights or local reinforcements should be prioritized in design, while avoiding concentrating substantial loads on a single segment ring.
(3) The inability of tenon–mortise joints within a segment ring to provide tensile resistance at interfaces causes significant pressure concentration on one side of the contact surface under bending moments. Widening member sections at ring joints can partially mitigate this issue, but verification remains necessary to ensure that compressive stresses under worst-case load combinations (assuming no tensile capacity) will not cause local damage on either structural side. In the Huaxia Station assembly section, the central column deviates from the station’s central axis, forming an asymmetric structural configuration for the lower-level column–girder–slab system. Due to the inherent challenge of prefabricated structures to achieve cast in situ-level joint rigidity, the floor slab on the larger span side experiences substantially greater deflection than its counterpart. This induces angular rotation at the central column joint, creating eccentric compression on both the slab–girder and central column end contact surfaces, thereby imposing a significant burden on connecting bolts. Consequently, asymmetric designs should be avoided in prefabricated station planning. Where unavoidable, an alternative solution involves designing left/right span slabs as separate units, connecting them with cast-in-place concrete strips after assembly deformation stabilizes.
(4) Based on the CAE analysis of Shenzhen Huaxia Station, we propose optimizing the stiffness matching of prefabricated members, avoiding asymmetric designs to prevent eccentric loading on mid-columns, and reinforcing mortise–tenon edges to mitigate stress concentrations. The large-segment fully prefabricated approach (monolithic roof/floor slabs replacing segmented prototypes) significantly enhances assembly efficiency and watertightness, while the standardized mortise–tenon joint design ensures structural integrity with roof settlements controlled within 45 mm.

Author Contributions

Conceptualization, Z.T. and Y.L.; methodology, Z.T.; software, Y.L.; validation, J.W. and X.F.; formal analysis, X.F.; investigation, Y.L.; resources, Z.T.; data curation, Y.L.; writing—original draft preparation, Y.L.; writing—review and editing, Z.T.; visualization, Y.L.; supervision, Y.L.; project administration, X.F. and J.W.; funding acquisition, Z.T. All authors have read and agreed to the published version of the manuscript.

Funding

This study is funded by the National Key R&D Program of China (2023YFC3806701).

Institutional Review Board Statement

Not applicable.

Informed Consent Statement

Not applicable.

Data Availability Statement

The original contributions presented in the study are included in the article, further inquiries can be directed to the corresponding author.

Conflicts of Interest

Author Xiaomin Fan was employed by the company China Railway Xi’an Bureau Group Co., Ltd. The remaining authors declare that the research was conducted in the absence of any commercial or financial relationships that could be construed as a potential conflict of interest.

References

  1. Chen, Q.; Luo, X.; Zheng, X.; Deng, C. Shear behavior of the horizontal joint with tooth groove connection and large-diameter steel bar grout lapping in reserved hole. Constr. Build. Mater. 2025, 470, 140593. [Google Scholar] [CrossRef]
  2. Feng, S.; Guo, Z.; Guan, D.; Li, X. Tensile anchorage and seismic performance of U-bar connections between sidewall and bottom slabs for prefabricated subway station structures. Constr. Build. Mater. 2025, 472, 140825. [Google Scholar] [CrossRef]
  3. Wang, X.; Li, L.; Deng, B.; Zhang, Z.; Jia, L. Experimental study on seismic behavior of prefabricated RC frame joints with T-shaped columns. Eng. Struct. 2021, 233, 111912. [Google Scholar] [CrossRef]
  4. Marzouk, M.; Abdelaty, A. BIM-based framework for managing performance of subway stations. Autom. Constr. 2014, 41, 70–77. [Google Scholar] [CrossRef]
  5. Ding, P.; Tao, L.; Yang, X.; Zhao, J.; Shi, C. Three-dimensional dynamic response analysis of a single-ring structure in a prefabricated subway station. Sustain. Cities Soc. 2019, 45, 271–286. [Google Scholar] [CrossRef]
  6. Chen, K.; Chen, X.; Wang, L.; Yang, W.; Qiu, T.; Su, D.; Wu, H. Low-carbon effects of constructing a prefabricated subway station with temporary internal supports: An innovative case of Shenzhen, China. J. Clean. Prod. 2023, 426, 139023. [Google Scholar] [CrossRef]
  7. Gao, S.; Zhao, W.; Zhao, G.; Wang, S.; Xie, K. Numerical study on seismic performance of a prefabricated subway station considering the influence of the construction process. Structures 2024, 69, 107218. [Google Scholar] [CrossRef]
  8. Wu, J.; Ma, S.; Wang, R.; Ou, F.; Liang, Y.; Zhao, W.; Xie, K.; Wang, S. A novel technique for constructing prefabricated subway stations under open excavation Proceedings of the Institution of Civil Engineers-Engineering Sustainability. Proc. Inst. Civ. Eng. Eng. Sustain. 2023, 177, 299–308. [Google Scholar]
  9. Wu, C.; Lu, D.; Ma, C.; El Naggar, M.H.; Du, X. Structural design and seismic performance analysis of partially prefabricated subway station structure. Tunn. Undergr. Space Technol. 2023, 140, 105264. [Google Scholar] [CrossRef]
  10. Chen, J.; Xu, C.; El Naggar, H.M.; Du, X. Seismic response analysis of rectangular prefabricated subway station structure. Tunn. Undergr. Space Technol. 2023, 131, 104795. [Google Scholar] [CrossRef]
  11. Tao, L.; Shi, C.; Ding, P.; Li, S.; Wu, S.; Bao, Y. A study on bearing characteristic and failure mechanism of thin-walled structure of a prefabricated subway station. Front. Struct. Civ. Eng. 2022, 16, 359–377. [Google Scholar] [CrossRef]
  12. Nejat, P.; Jomehzadeh, F.; Taheri, M.M.; Gohari, M.; Majid, M.Z.A. A global review of energy consumption, CO2 emissions and policy in the residential sector (with an overview of the top ten CO2 emitting countries). Renew. Sustain. Energy Rev. 2015, 43, 843–862. [Google Scholar] [CrossRef]
  13. China Association of Building Energy Efficiency. China Building Energy Consumption Annual Report 2020; China Association of Building Energy Efficiency: Shanghai, China, 2020. (In Chinese) [Google Scholar]
  14. Liu, W.; Zhang, H.; Wang, Q.; Hua, T.; Xue, H.; Yao, H. A review and scientometric analysis of global research on prefabricated buildings. Adv. Civ. Eng. 2021, 2021, 8869315. [Google Scholar] [CrossRef]
  15. Yu, S.; Liu, Y.; Wang, D.; Bahaj, A.S.; Wu, Y.; Liu, J. Review of thermal and environmental performance of prefabricated buildings: Implications to emission reductions in China. Renew. Sustain. Energy Rev. 2021, 137, 110472. [Google Scholar] [CrossRef]
  16. Xia, J.; Chen, J.; Shan, K.; Wu, Y.-F. Seismic performance of corroded prefabricated column-footing joint with grouted splice sleeve connection: Experiment and simulation. J. Build. Eng. 2023, 80, 108112. [Google Scholar] [CrossRef]
  17. Qing, Y.; Yuan, Y.; Wang, C.L.; Meng, S.; Zeng, B. Experimental study of precast columns with a hybrid joint incorporating bolted couplers and grouted sleeves. J. Build. Eng. 2023, 74, 106878. [Google Scholar] [CrossRef]
  18. Zhang, P.; Wang, Z.; Ge, J.; Yan, X.; Liu, S. Full-scale experimental study on precast bridge column with grouted sleeve connections and large-diameter reinforcing bars. Eng. Struct. 2023, 294, 116747. [Google Scholar] [CrossRef]
  19. Du, X.L.; Ma, C.; Lu, D.C.; Xu, C.S.; Xu, Z.G. Collapse simulation and failure mechanism analysis of the Daikai subway station under seismic loads. China Civ. Eng. J. 2017, 50, 53–62. [Google Scholar]
  20. Nguyen, V.Q.; Nizamani, Z.A.; Park, D.; Kwon, O.-S. Numerical simulation of damage evolution of Daikai station during the 1995 Kobe earthquake. Eng. Struct. 2020, 206, 110180. [Google Scholar] [CrossRef]
  21. Liu, H.; Wang, Z.; Du, X.; Shen, G.Q. The seismic behaviour of precast concrete interior joints with different connection methods in assembled monolithic subway station. Eng. Struct. 2021, 232, 111799. [Google Scholar] [CrossRef]
  22. GB50010-2010; Code for Design of Concrete Structures. China Architecture & Building Press: Beijing, China, 2010.
  23. GB/T 228.1-2021; Metallic Materials—Tensile Testing—Part 1: Method of Test at Room Temperature. Standards Press of China: Beijing, China, 2021.
Figure 1. Schematic diagram of the location and surrounding environment of Huaxia Station. (A–D in the figure are the four exits specified in the design of the subway station).
Applsci 15 09941 g001
Figure 2. Schematic diagram of the cross-section of the Huaxia Station subway station. ((a) shows the Shenzhen prefabricated station model, while (b,c) show the Changchun station model).
Applsci 15 09941 g002
Figure 3. Design of contact position of structural body.
Applsci 15 09941 g003
Figure 4. Establishment of large block model for prefabricated subway station.
Applsci 15 09941 g004
Figure 5. Stress–strain curve (stress–strain relationships obtained using GB50010-2010). (a) Uniaxial stress–strain curve of concrete (the stress negative axis has been scaled). (b) The relationship between inelastic strain, plastic strain, and damage variables. (c) Uniaxial tensile stress–strain curve of low carbon steel. (The green curve in the figure represents the stress-strain curve without optimization treatment).
Applsci 15 09941 g005
Figure 6. Station structure measurement points and site layout.
Applsci 15 09941 g006
Figure 7. Time-history curve of the main reinforcement force during the assembly stage.
Applsci 15 09941 g007
Figure 8. Numerical simulation verification curve.
Applsci 15 09941 g008
Figure 9. Schematic diagram of connecting components and contact surfaces of the main structure.
Applsci 15 09941 g009
Figure 10. Station structure measurement points and site layout.
Applsci 15 09941 g010
Figure 11. Structural displacement cloud map (unit: m). (a) Cloud map of total displacement of process 2 structure. (b) Vertical displacement cloud map of process 3 structure. (c) Horizontal displacement cloud map of process 4 structure. (d) Horizontal displacement cloud map of process 5 structure. (e) Including middle plate. (f) Hidden middle board (vertical displacement cloud map of process 5 structure). (g) Horizontal displacement. (h) Vertical displacement (structural displacement cloud map of process 6). (i) Horizontal displacement. (j) Vertical displacement (structural displacement cloud map of process 7).
Applsci 15 09941 g011aApplsci 15 09941 g011b
Figure 12. Von Mises equivalent stress cloud map of process 2 bottom plate. (a) Ring 3. (b) Ring 2. (c) Ring 4.
Applsci 15 09941 g012
Figure 13. Cloud diagram of the main stress of the bottom plate in process 2. (a) Ring 3. (b) Ring 2. (c) Ring 4.
Applsci 15 09941 g013
Figure 14. Stress cloud map of the third ring bottom plate in process 3 (unit: Pa). (a) Von Mises equivalent stress cloud map. (b) Large principal stress cloud map.
Applsci 15 09941 g014
Figure 15. Stress cloud map of the third ring side wall in process 4 (unit: Pa). (a) Von Mises equivalent stress cloud map. (b) Large principal stress cloud map.
Applsci 15 09941 g015
Figure 16. Von Mises equivalent stress cloud map of the plate in process 5 (unit: Pa). (a) Ring 3. (b) Ring 2. (c) Ring 4.
Applsci 15 09941 g016
Figure 17. Cloud diagram of the main stress of the plate in process 5 (unit: Pa). (a) Ring 3. (b) Ring 2. (c) Ring 4.
Applsci 15 09941 g017
Figure 18. Stress cloud map of the top plate of the third ring in process 6 (unit: Pa). (a) Von Mises equivalent stress cloud map. (b) Large principal stress cloud map. (c) Concrete tensile damage cloud map.
Applsci 15 09941 g018
Figure 19. Stress cloud map of the third ring structure in process 7 (unit: Pa). (a) Von Mises equivalent stress cloud map. (b) Large principal stress cloud map.
Applsci 15 09941 g019
Figure 20. Stress cloud maps for processes 2 and 3 (Unit: Pa). (a) Process 2 contact stress cloud map between bottom plate rings. (b) Process 3 contact stress cloud map between bottom plate rings.
Applsci 15 09941 g020
Figure 21. Cloud diagram of contact stress at the end of the column in process 3 (unit: Pa). (a) Column top. (b) Column bottom.
Applsci 15 09941 g021
Figure 22. Cloud diagram of major principal stress of column connecting bolts in process 3 (unit: Pa). (a) Column top. (b) Column bottom.
Applsci 15 09941 g022
Figure 23. Process 4 component contact stress cloud map (unit: Pa). (a) Cloud diagram of contact stress between side wall rings in process 4. (b) Cloud diagram of contact stress between bottom plate and side wall in process 4.
Applsci 15 09941 g023
Figure 24. Process 5 component contact stress cloud map (unit: Pa). (a) Cloud map of contact stress between plate and ring in process 5. (b) Cloud map of contact stress between the plate and the side wall bracket in process 5.
Applsci 15 09941 g024
Figure 25. Cloud diagram of contact stress between the bottom plate and side wall in process 5 (unit: Pa). (a) Left wall. (b) Right wall.
Applsci 15 09941 g025
Figure 26. Contact stress contours for construction phase 6 (Unit: Pa). (a) Roof inter-ring contact stress contours. (b) Roof–sidewall contact stress contours. (c) Base slab–sidewall contact stress contours.
Applsci 15 09941 g026
Figure 27. Contact stress contours for construction phase 7 (Unit: Pa). (a) Roof inter-ring contact stress contours. (b) Left sidewall inter-ring contact stress contours. (c) Right sidewall inter-ring contact stress contours. (d) Intermediate floor inter-ring contact stress contours.
Applsci 15 09941 g027
Figure 28. Contact stress contours for construction phase 7 (Unit: Pa). (a) Roof–sidewall contact stress contours. (b) Base slab–sidewall contact stress contours. (c) Intermediate floor–sidewall corbel contact stress contours.
Applsci 15 09941 g028
Figure 29. Horizontal displacement curves of diaphragm walls across construction stages (the manuscript also contains experimental results).
Applsci 15 09941 g029
Figure 30. Stress curves during different construction stages (The manuscript also contains experimental results, (af) respectively represent the contact stress of different structural components under different processes).
Applsci 15 09941 g030
Table 1. Distribution of soil layer conditions at the station location.
Overburden TypeSoil Layer NamePrimary CompositionCharacteristicsLayer ThicknessTop Depth
Holocene Anthropogenic Fill (Q4ml)Plain FillSilty ClayLow strength, High compressibility, Load-sensitive0.80~10.00 m28.63~36.21 m
Fluvial–Pluvial Deposits (Q4al+pl)Mucky ClaySilty ClayLow strength, High compressibility0.50~3.40 m6.50~9.00 m
Silty ClaySilty ClayMedium compressibility1.00~6.70 m2.10~3.00 m
Medium-Coarse SandQuartz, FeldsparPoorly sorted1.40~3.00 m4.00~8.80 m
Residual Deposits (Qel)Sandy Clayey SoilSand ParticlesWater-softening susceptibility0.90~29.80 m0.80~12.40 m
Late Ordovician Caledonian (ηγO1)Completely Weathered GraniteGraniteRelatively intact2.70~22.90 m7.30~35.30 m
Earthy Completely Weathered GraniteGranite FragmentsSandy texture0.90~19.30 m10.10~39.80 m
Highly Weathered GraniteFractured GraniteIntensely jointed/fissured0.30~7.50 m27.00~47.60 m
Moderately Weathered GraniteMedium–Fine-Grained GraniteMassive structure0.80~7.74 m28.20~48.60 m
Slightly Weathered GraniteMedium–Fine–Grained GraniteModerately jointed3.09~8.30 m27.60~47.40 m
Table 2. Mechanical parameters of C50 concrete.
E0 (GPa)fc,r (MPa)εc,r (με)αcft,r (MPa)εt,r (με)αt
34.532.41678.41.49922.64110.082.1908
Table 3. C50 concrete model parameters.
εc (με)εcin (με)dcεt (με)εtin (με)dt
737.3500110.0800
100069.293770.054313331.474940.04426
1333206.45970.13151416781.406940.135283
1678.4395.58480.219248200125.18870.232814
1840495.58070.261288233165.41030.327076
2000599.53780.302682267204.56830.414691
2333826.09090.385948300241.20110.488649
26671060.2650.462966333276.95750.551928
30001295.4610.531609367313.17570.607122
33331529.6430.591717400347.9030.65237
36671762.2280.643803433382.32430.690742
40001991.3490.688326467417.54840.724304
43332217.6510.726365500451.55690.752086
46672441.9450.758924533485.42630.775962
50002663.1190.786653567520.20580.797171
53332882.1020.810398600553.87060.815016
56673099.7920.83085633587.46080.830603
60003315.1160.848423667622.00390.844675
63333528.9340.863632700655.47780.856702
66673742.0640.876883733688.90710.867364
70003953.3880.888407767723.30930.877128
73334163.6850.898502800756.6660.885587
76674373.7010.907406833789.99380.89318
80004582.2810.915241867824.3050.900218
900857.58440.906386
Table 4. Summary of concrete material parameters.
ComponentModelLabelE0 (GPa)fc,r (MPa)εc,r (με)αcft,r (MPa)εt,r (με)αt
Prefabricated componentCDPC5034.532.41678.41.49922.64110.082.1908
Underground continuous wallElasticityC3030
Concrete supportCDPC303020.11471.80.74642.0195.241.264
Fertilizer tank backfillingElasticityC2025.5
Table 5. Summary of steel material parameters.
LabelEs (GPa)νρ (t/m3)fy (MPa)fu (MPa)
Q2352060.317.85279450
Disclaimer/Publisher’s Note: The statements, opinions and data contained in all publications are solely those of the individual author(s) and contributor(s) and not of MDPI and/or the editor(s). MDPI and/or the editor(s) disclaim responsibility for any injury to people or property resulting from any ideas, methods, instructions or products referred to in the content.