Article

Experiment of Suppressing Atmospheric Turbulence by Using Fast-Steering Mirror

1
School of Automation and Information Engineering, Xi’an University of Technology, Xi’an 710048, China
2
Xianyang Key Laboratory of Intelligent Manufacturing Equipment Technology, Xianyang 712000, China
3
Information Engineering Institute, Xi’an University of Arts and Sciences, Xi’an 710065, China
*
Author to whom correspondence should be addressed.
Appl. Sci. 2025, 15(18), 9920; https://doi.org/10.3390/app15189920
Submission received: 24 July 2025 / Revised: 5 September 2025 / Accepted: 9 September 2025 / Published: 10 September 2025

Abstract

With the aim of addressing the problem of spot drift caused by laser transmission in atmospheric turbulence, the effects of different weather conditions such as sunny, cloudy, rainy and sandstorm conditions on spot drift were measured at 0.42 km, 2 km and 10 km transmission distances, and the correction performance of a fast-steering mirror (FSM) was evaluated. The results show that under weak-turbulence conditions such as sunny, cloudy and short-distance conditions, the mean and variance of spot drift are relatively small, and the disturbance is dominated by low frequency. The FSM achieves more effective correction, significantly reduces the drift amplitude and improves the system stability. Under strong-turbulence conditions such as rainy days, dust storms and long distances, the mean and variance of drift increase significantly, and the spot disturbance frequency is higher. The response ability of the FSM to high-frequency disturbance is limited, and the correction effect decreases. In general, the FSM is more suitable for low-intensity disturbance scenarios, and its correction performance has certain limitations under strong-disturbance and long-distance conditions.

1. Introduction

Wireless optical communication combines the advantages of optical fiber communication and radio frequency communication. It has the characteristics of high bandwidth, large capacity, rapid deployment and flexible mobility, and has broad application prospects [1,2]. In the process of a wireless optical communication signal passing through the atmosphere or propagating in the atmosphere, the laser beam will be significantly affected by atmospheric turbulence, which is manifested as light intensity flicker, beam expansion, spot drift and so on [3,4,5]. These phenomena are caused by a variety of factors caused by turbulence. This paper mainly focuses on the spot drift problem.
In order to effectively suppress the spot drift phenomenon, a variety of spot drift correction methods have been proposed, and the dynamic tracking correction technology has been widely used. In recent years, FSMs have been widely used to suppress the influence of atmospheric turbulence due to their advantages of high response speed, high precision, high bandwidth and multi-degree-of-freedom adjustment [6,7]. In 2012, Lixia Zhang used a fast mirror to correct the random deviation of the beam. The results show that this method can effectively control the plane position drift of the transmission system caused by the laser beam drift [8]. In 2016, Wei Liu evaluated the impact of tilt and high-order aberrations on mixing efficiency and bit error rate under various Greenwood frequencies, utilizing an adaptive optics (AO) unit with a two-stage FSM and a 97-element CSDM for experimental validation. Their findings offer valuable design guidance for AO systems in coherent free-space optical communications [9]. In 2018, Poliak demonstrated a record 1.72 Tbit/s optical link over 10.45 km under worst-case atmospheric conditions. Using 40 DWDM channels and advanced tracking, their proof of concept validates Tbit/s-scale throughput for future geostationary satellite communications, overcoming a major capacity bottleneck [10]. Kaymak provides a comprehensive overview of the Acquisition, Tracking and Pointing (ATP) mechanisms critical in free-space optical (FSO) communication. The paper emphasizes that ATP is essential for establishing and maintaining line-of-sight alignment in both mobile and stationary FSO systems, the latter of which are still susceptible to displacement [11]. In 2022, Walsh reported a 100 Gbps coherent optical link that remains robust under pronounced turbulence and while tracking a drone at angular rates comparable to LEO satellites (1.5 deg/s). This was achieved by combining a 10 Hz machine vision tracker with a 200 Hz adaptive optics system to correct both pointing and wavefront distortions, ensuring stable fiber coupling and overcoming a key limitation of coherent detection systems [12]. In 2023, Xingfei Ren constructed a beam directivity deviation correction system for FSMs. The results show that the corrected beam pointing stability is significantly improved [13]. In 2023, in order to solve the problem of beam tracking in long-distance wireless optical communication being susceptible to atmospheric disturbances, Xizheng Ke proposed a dual-FSM configuration combined with frequency disturbance identification and ellipse fitting to separate overlapping spots. The tracking method effectively improves the center positioning accuracy in the case of overlapping spots, and the standard deviation is controlled within 0.5 pixels [14]. Beam wander and jitter caused by atmospheric turbulence are one of the main challenges in wireless optical communication. Studies have shown that turbulence intensity is closely related to transmission distance and weather conditions [15]. The existing research mostly focuses on the performance verification of the FSM in the laboratory or in a short-range stable environment, and there is a lack of systematic research on the correction ability of the FSM under different long-distance transmission and complex weather conditions. Therefore, in this paper, three typical transmission distances of 0.42 km, 2 km and 10 km are used to realize the real-time correction of spot drift by using a fast mirror under sunny, cloudy, rainy and sandstorm weather conditions. The influence of transmission distance and weather factors on the correction accuracy of the fast mirror is quantitatively analyzed, which provides a more comprehensive experimental basis for the adaptive optics design of long-distance laser transmission systems.

2. Theoretical Analysis

2.1. Operating Principle of the FSM

2.1.1. Composition of the FSM

The FSM is mainly composed of two parts: the mechanical structure and the measurement control system. The mechanical structure includes the mirror, flexure-supported hinges, mirror holder and angular position sensors. The measurement and control system comprises a precision measurement module, core control unit, actuators and driver circuits [16,17,18] The schematic diagram of the fast reflector structure of the voice coil motor is shown in Figure 1. The mirror, mirror holder and voice coil actuator coil constitute the moving load. The mirror holder is directly connected to the voice coil actuator, while the permanent magnet and angular sensor are mounted on the base. The load is connected to the base via flexure hinges. The angular deflection of the mirror is induced through Lorentz-force-based push–pull actuation of the voice coil. The angular displacement is measured by an angular position sensor and fed back to the drive control system, thereby enabling closed-loop control of the FSM [19].

2.1.2. Dynamic Analysis of the FSM

A simplified model of the two-axis FSM is established by defining a coordinate system o-xyz, where point o represents the rotation center of the flexure hinge; assume that the translational displacement of the base is (x, y, z), the angular displacement of the base is α i , β i , γ i T , the translational displacement of the mirror assembly at the rotation center of the flexure hinge is x o , y o , z o T and the angular displacement is α o , β o , γ 0 T . The motion of the mirror assembly can be regarded as a composite motion of translational displacement and rotational angular displacement. The angular displacement of the load relative to the base is α , β , α = α o α i , β = β o β i . These relative angles α , β are measurable by the angular sensor. Due to the inherent characteristics of the fast reflector, the load center of mass c will deviate from the rotation center of the flexure hinge. The mirror assembly moves relative to the base, and the elastic force generated by the flexure hinge is
F S = k x 0 0 0 k y 0 0 0 k z x o x i y o y i z o z i + c x 0 0 0 c y 0 0 0 c z x o x i y o y i z o z i
k x , k y and k z represent the translational stiffness along the x, y and z axes, respectively, while c x , c y and c z denote the structural damping coefficients corresponding to each degree of freedom.
When the center of mass of the FSM load deviates from the rotational center, an imbalance-induced torque is generated about the rotation axis:
M S 1 = Δ x Δ y Δ z × F S
The load of the FSM rotates relative to the base, and the rotational torque generated by the flexible hinge is
M S 2 = k α 0 0 0 k β 0 0 0 k γ α o α i β o β i γ o γ i + c α 0 0 0 c β 0 0 0 c γ α o α i β o β i γ o γ i
The voice coil actuator is directly connected to the mirror support structure. The force and torque exerted by the actuator on the mirror load are given by
F V = 0 0 F V 1 + F V 2 + F V 3 + F V 4
M V = b F V 1 + b F V 2 b F V 3 b F V 4 a F V 1 + a F V 2 + a F V 3 a F V 4 0
Fv1, Fv2, Fv3 and Fv4 are the driving forces generated by actuators V1–V4 along the z axis, defined as positive in the z direction. Due to the push–pull configuration, the resultant force along the z axis is zero [20].
Based on the above dynamic analysis, the differential equation governing the translational motion of the FSM load can be derived as follows:
m x o + c x x o + k x x o = c x x i + k x x i m y o + c y y o + k y y o = c y y i + k y y i m z o + c z z o + k z z o = c z x i + k z x i
The equation of motion describing the rotation of the FSM load about point o is given by
I x x α o + c α α o + k α α o = c α α + k α α i k y Δ z y o y i + k z Δ y z o z i + b F V 1 + b F V 2 b F V 3 b F V 4 I y y β o + c β β o + k β β o = c β β i + k β β i + k x Δ z x o x i k z Δ x z o z i a F V 1 + a F V 2 + a F V 3 a F V 4
When the center of mass of the load deviates from the position of the rotation center of the flexible hinge, the differential equation of motion of the rotation is
I x x α o + c α α o + k α α o = c α α i + k α α i + b F V 1 + b F V 2 b F V 3 b F V 4 I y y β o + c β β o + k β β o = c β β i + k β β i a F V 1 + a F V 2 + a F V 3 a F V 4
At this time, the linear motion of the base will not couple with the angular motion of the mirror load [21].
Because the FSM has a symmetrical mechanical structure, the motion characteristics of the x and y axes are similar, and the inter-axis coupling effect can be ignored at low frequencies. Therefore, the system can be decomposed into independent single-axis motions around the x and y axes, and the torque balance equation is
M = J + 2 m l 2 θ .. + 2 c l 2 θ . + K f θ M = 2 F l F = K s i
Here, M is the torque generated by the voice coil motor when driving the mirror body to rotate; J represents the rotational inertia of the mechanical structure of the FSM; m is the mass of the mechanical structure of the FSM; θ is the rotation angle of the mirror; c is the viscous damping coefficient of the voice coil motor; Kf is the torsional stiffness of the rotating shaft of the mirror body; F is the output force of the voice coil motor; and Ks is the force constant of the voice coil motor. The FSM has a small range of motion, and the relative displacement x can be approximated as
x = l θ
Here, l is the distance from the force action point of the voice coil motor to the rotation center of the mirror body; θ is the rotation angle of the mirror. The transfer function G(s) between the output angle and the input voltage of the system can be derived by Laplace transform of the above two equations:
G s = θ s U s = 2 K s l J + 2 m l 2 s 2 + 2 c l 2 s + K f L s + R + 2 K e K s l 2 s
where L is the inductance of the voice coil motor; l is the distance from the action point of the voice coil motor to the rotation center of the mirror body; R is the motor of the voice coil motor; s is the Laplace variable; and Ke is the force constant of the voice coil motor [22].

2.2. Atmospheric Turbulence

2.2.1. The Formation of Turbulence and Its Influence Mechanism on the Beam

The atmosphere is a kind of fluid, which can be divided into laminar flow and turbulent flow. In the laminar flow state, the movement of the fluid is relatively slow and regular and the boundary is clear. When the temperature of the upper air is lower than that of the lower layer, the fluid motion will be accelerated. At this time, the edge of the fluid becomes no longer smooth, and the flow direction also begins to be complex and changeable, thus transforming into a turbulent state. When the light wave propagates in the atmosphere, the amplitude and phase of the light wave will fluctuate randomly due to the influence of atmospheric turbulence, which will further cause a series of turbulence effects, such as light intensity scintillation, beam drift, angle-of-arrival fluctuation and beam expansion. The evolution of turbulence begins with the formation of large-scale vortices. Under the action of external forces such as wind shear, these vortices gradually destabilize and break up, and energy is transferred to smaller-scale vortices, forming a turbulent cascade process until the smallest-scale vortices are annihilated due to viscous dissipation. The size distribution of turbulent eddies is defined by the outer scale (usually tens of meters to hundreds of meters) and the inner scale (usually several millimeters). Vortices of different scales do not exist in isolation, but are nested and interact with each other to form a broad-spectrum, randomly distributed turbulent field, causing continuous random fluctuations in the refractive index, which eventually lead to uncertain changes in the propagation path of the beam. Among the many effects caused by turbulence, beam drift is mainly caused by large-scale vortices larger than the beam diameter, which is manifested as the random offset of the beam on the receiving surface, which is the main factor affecting the pointing stability. In order to suppress this effect, the fast-steering mirror, as a high-bandwidth and high-precision beam pointing control device, achieves effective compensation for drift through real-time closed-loop control [23].

2.2.2. Quantitative Analysis of Turbulence’s Cumulative Effect

Spot drift is mainly caused by large-scale turbulent vortices larger than the beam diameter. These vortices act like lenses and prisms, causing random deflection of the entire beam cross-section.
Its statistical properties (variance) are described by the following classical theoretical formula:
σ 2 = 2.07 C n 2 L 3 W 0 1 / 3
Here, σ 2 is the spot drift variance, which quantitatively describes the amplitude of the spot center’s random shaking on the receiving plane; W0 is the beam width (radius) of the emitted beam.
The beam will encounter a large number of turbulent vortices continuously on the propagation path. Each large vortex will cause it to produce a small random deflection. These deflections accumulate statistically, and the total effect is not linear with the increase in distance, but is amplified in the form of a cubic of L. The final drift of the beam is determined not by the turbulence at a certain point in the path, but by the combined effect of all the turbulence it ‘experiences’. The longer the path (the larger the L), the more turbulence it ‘experiences’ and the naturally stronger the effect. This is the embodiment of the ‘cumulative’ effect. Although the turbulence intensity is constant (even the turbulence intensity of the long path may be smaller), the amplification effect of the third power of L is absolutely dominant, resulting in final system performance degradation (increased drift variance).
In engineering, we often use the concept of ‘path-averaged turbulence intensity’, that is,
< C n 2 > = 1 L 0 L C n 2 l d l
This directly reflects the accumulation of turbulence effects.

2.2.3. Discussion of Factors Affecting the Effectiveness of Drift Suppression

In the experimental study of the fast-steering mirror (FSM) to suppress atmospheric turbulence spot drift, the effectiveness of its suppression is mainly limited by the following factors: First, the system control bandwidth is the core constraint. The response speed of the FSM is limited by sampling frequency, signal processing delay and mechanical response time of the driver, forming a closed-loop control delay. For high-frequency turbulence disturbances, the FSM cannot achieve complete tracking, resulting in residual drift errors. Second, the FSM can only correct the Tip–Tilt aberration and cannot compensate for the high-order wavefront distortion. Under strong-turbulence conditions, there are significant high-order components in the wavefront phase fluctuation, which lead to spot expansion and morphological distortion. Even if the tilt component is suppressed, the spot quality will still degrade, affecting the subsequent optical signal reception efficiency. Third, hardware performance limits its correction capability. The deflection angle of the FSM is limited. Under extreme turbulence intensity or long transmission distance, the instantaneous offset of the spot may exceed its maximum stroke, resulting in saturation distortion. In addition, the mechanical resonance frequency limits further improvement in the control loop gain, and too-high gain will cause system oscillation. Finally, the sensor noise and the non-isoplanatic effect introduce errors. Under the condition of a low signal-to-noise ratio, the detection error of the wavefront sensor will be amplified by the control loop, showing high-frequency jitter. In the extended target or complex turbulent path, the non-conjugation between the probe light and the signal light path will lead to correction deviation. In summary, although the FSM can significantly suppress spot drift, its performance is subject to multiple constraints of control bandwidth, spatial mode limitation, hardware physical limits and measurement noise. In the future, it is necessary to further improve the suppression effect by optimizing the system bandwidth, combining high-order adaptive optics technology and developing predictive control algorithms.

3. Experimental Measurement

3.1. Experiment on FSM Suppressing Atmospheric Turbulence

The laser at the transmitting end uses a light wave with a wavelength of 532 nm, a power of 500 mw and a beam radius of 5 mm. After long-distance transmission, the beam is affected by atmospheric turbulence to produce spot drift at the receiving end. The laser beam is captured by the telescope with an aperture of 105 mm at the receiving end and transmitted to the two-dimensional fast-steering mirror. The two-dimensional fast-steering mirror, the stepper motor controller, the industrial camera and the computer are used to form a feedback loop to adjust the beam direction and compensate for the spot drift. The focusing lens focuses the beam on the CCD2 camera, and the CCD2 camera detects the spot position. The error signal is generated by the target spot and the measured spot, and then the error signal is converted into a control signal, and the control signal is transmitted to the stepper motor controller. The error signal is transmitted to the PID controller algorithm running on the computer for processing. The PID algorithm generates a faster, stable and small-overshoot optimal control signal by calculating and synthesizing the proportional (P), integral (I) and differential (D) parts of the error signal. Then the optimized control signal is transmitted to the stepper motor controller. According to the signal, the stepper motor controller adjusts the deflection angle of the x axis and y axis of the FSM to form closed-loop negative feedback, so that the measured spot gradually approaches and stabilizes at the set target spot position. In this context, CCD1 collects data on the spot before correction, and CCD3 is used to collect data on the corrected spot, which can be used to compare and verify the compensation effect of the PID control algorithm, as shown in Figure 2.

3.2. Field Experiment

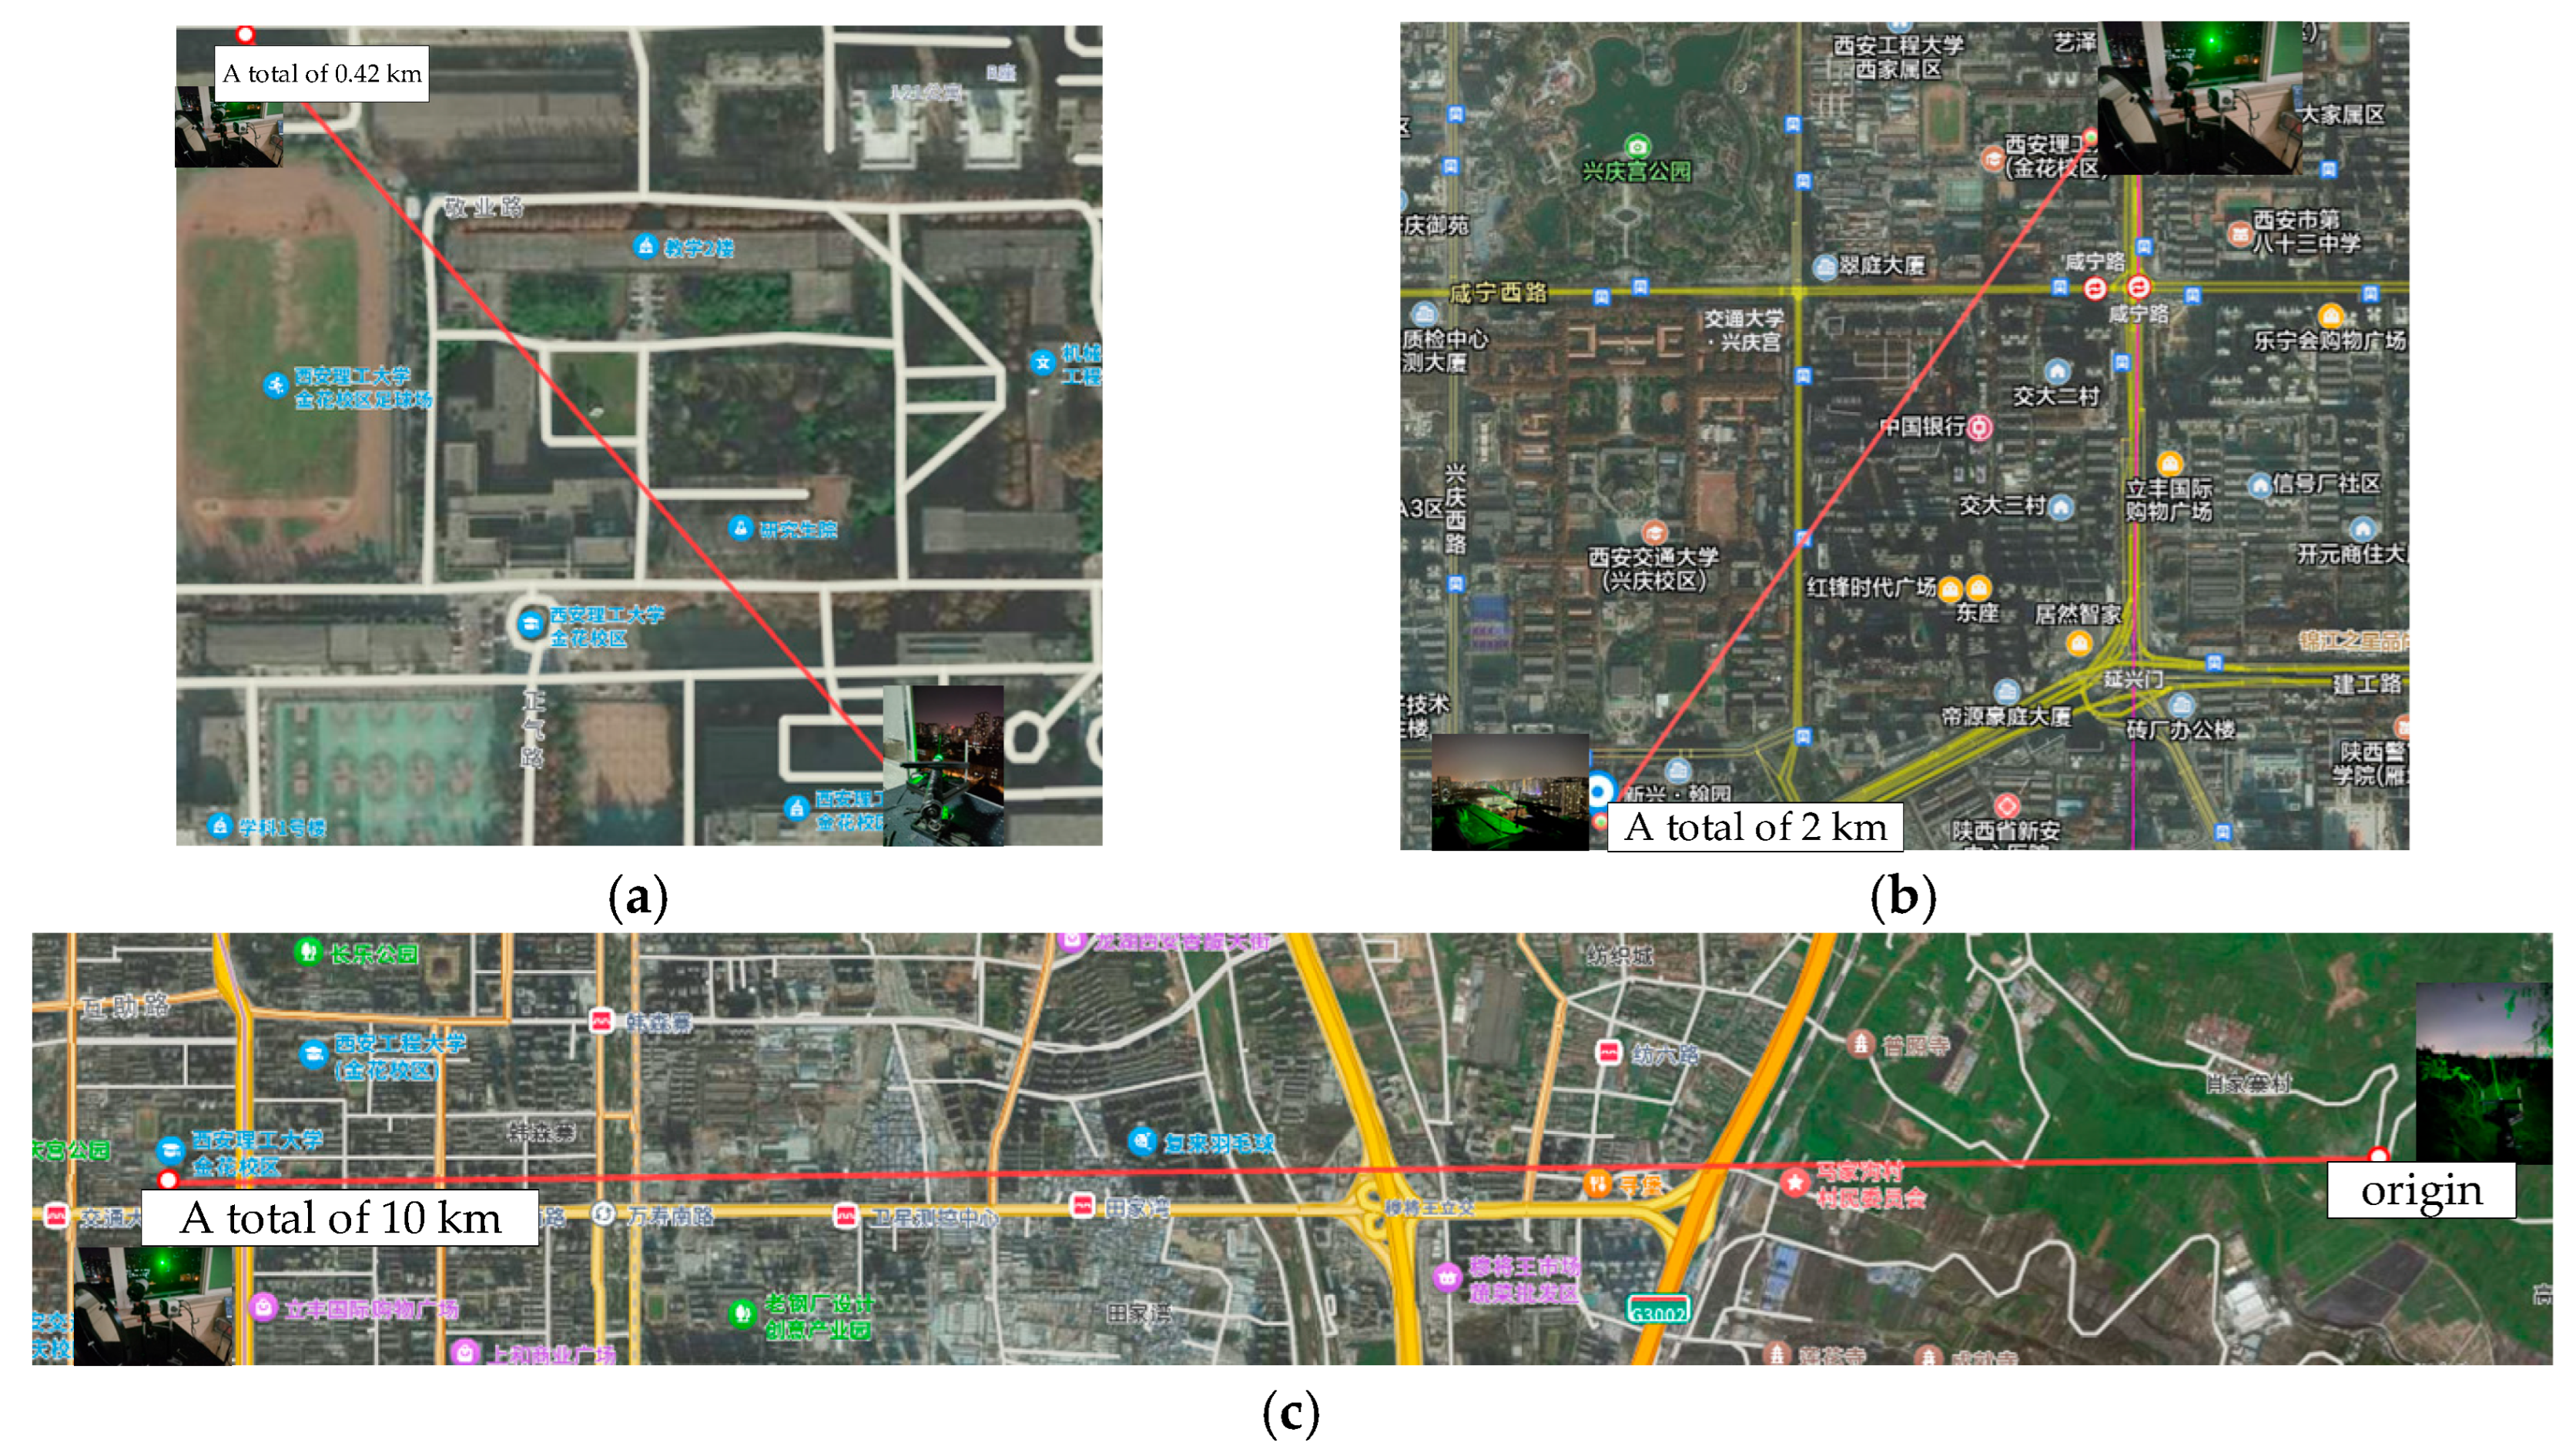
From November 2024 to June 2025, three laser transmission measurement experimental links with different distances were established in Xi’an, Shaanxi Province, and several measurement experiments were carried out. As shown in Figure 3, the three links are as follows:
Link 1: The transmitter is located on the 11th floor of the sixth building of the Jinhua campus of Xi’an University of Technology, and the receiver is located on the 8th floor of the second building of the same campus. The link length is 0.42 km, the link height from the ground is 40 m, and the altitude difference between the transmitter and the receiver is 2 m.
Link 2: The transmitter is located in Xi’an Xinyayuan Community, and the receiver is located on the 8th floor of the sixth building of the Jinhua Campus of Xi’an University of Technology. The link length is 2 km. The height of the link from the ground is about 100 m, and the altitude difference between the sending and receiving ends is 43 m.
Link 3: The transmitter is located in Xiaojiazhai Village, Bailuyuan, Xi’an City. The receiver is located on the 12th floor of the 6th building of the Jinhua Campus of Xi’an University of Technology. The length of the link is 10 km, the height of the link from the ground is 391 m, and the altitude difference between the transmitter and the receiver is 363 m.
Figure 3. Experimental links: (a) link 1; (b) link 2; (c) link 3.
Applsci 15 09920 g003
Table 1, Table 2 and Table 3 show the experimental weather conditions of the three experimental links. Among them, T1–T46 is the experimental measurement sample, AQI is the air quality index, and the temperature is Celsius. Wind speed is the ‘engine’ of atmospheric turbulence. (The temperature and wind speed data are derived from the standard ground observation data provided by the local meteorological station). Wind shear will destroy the stable stratification of the atmosphere and mechanically generate and mix turbulent vortices of different scales. These vortices, especially large-scale vortices, directly lead to random fluctuations in the angle of arrival of the beam, showing severe spot drift. Therefore, there is a strong positive correlation between wind speed and spot drift variance. Temperature is the key answer to explain ‘why the spot drift is still serious in seemingly calm (low wind speed) weather’. It is the core indirect index to evaluate the thermodynamic state of the atmosphere and predict the background intensity of optical turbulence. The AQI cannot be used as an effective parameter to predict or explain the spot drift. It is mainly used to evaluate the attenuation loss of the communication link, rather than the beam pointing stability.

4. Data Analysis

4.1. Mean Beam Drift

When the laser propagates in the atmospheric turbulence medium, the mean spot drift will fluctuate with the change in turbulence intensity due to the influence of turbulence disturbance. In this paper, the mean value of drift is introduced as one of the key performance indicators. The mean value of drift is defined as the average offset of the spot centroid position relative to the reference position in a certain period of time, which can reflect the overall drift trend of the spot in space. The larger the value of the index, the stronger the disturbance to the system and the worse the stability.
Assuming that the offset of the extracted spot centroid in a certain direction is di in the continuously sampled N-frame images, the mean drift is
d ¯ = 1 N i = 1 N d i
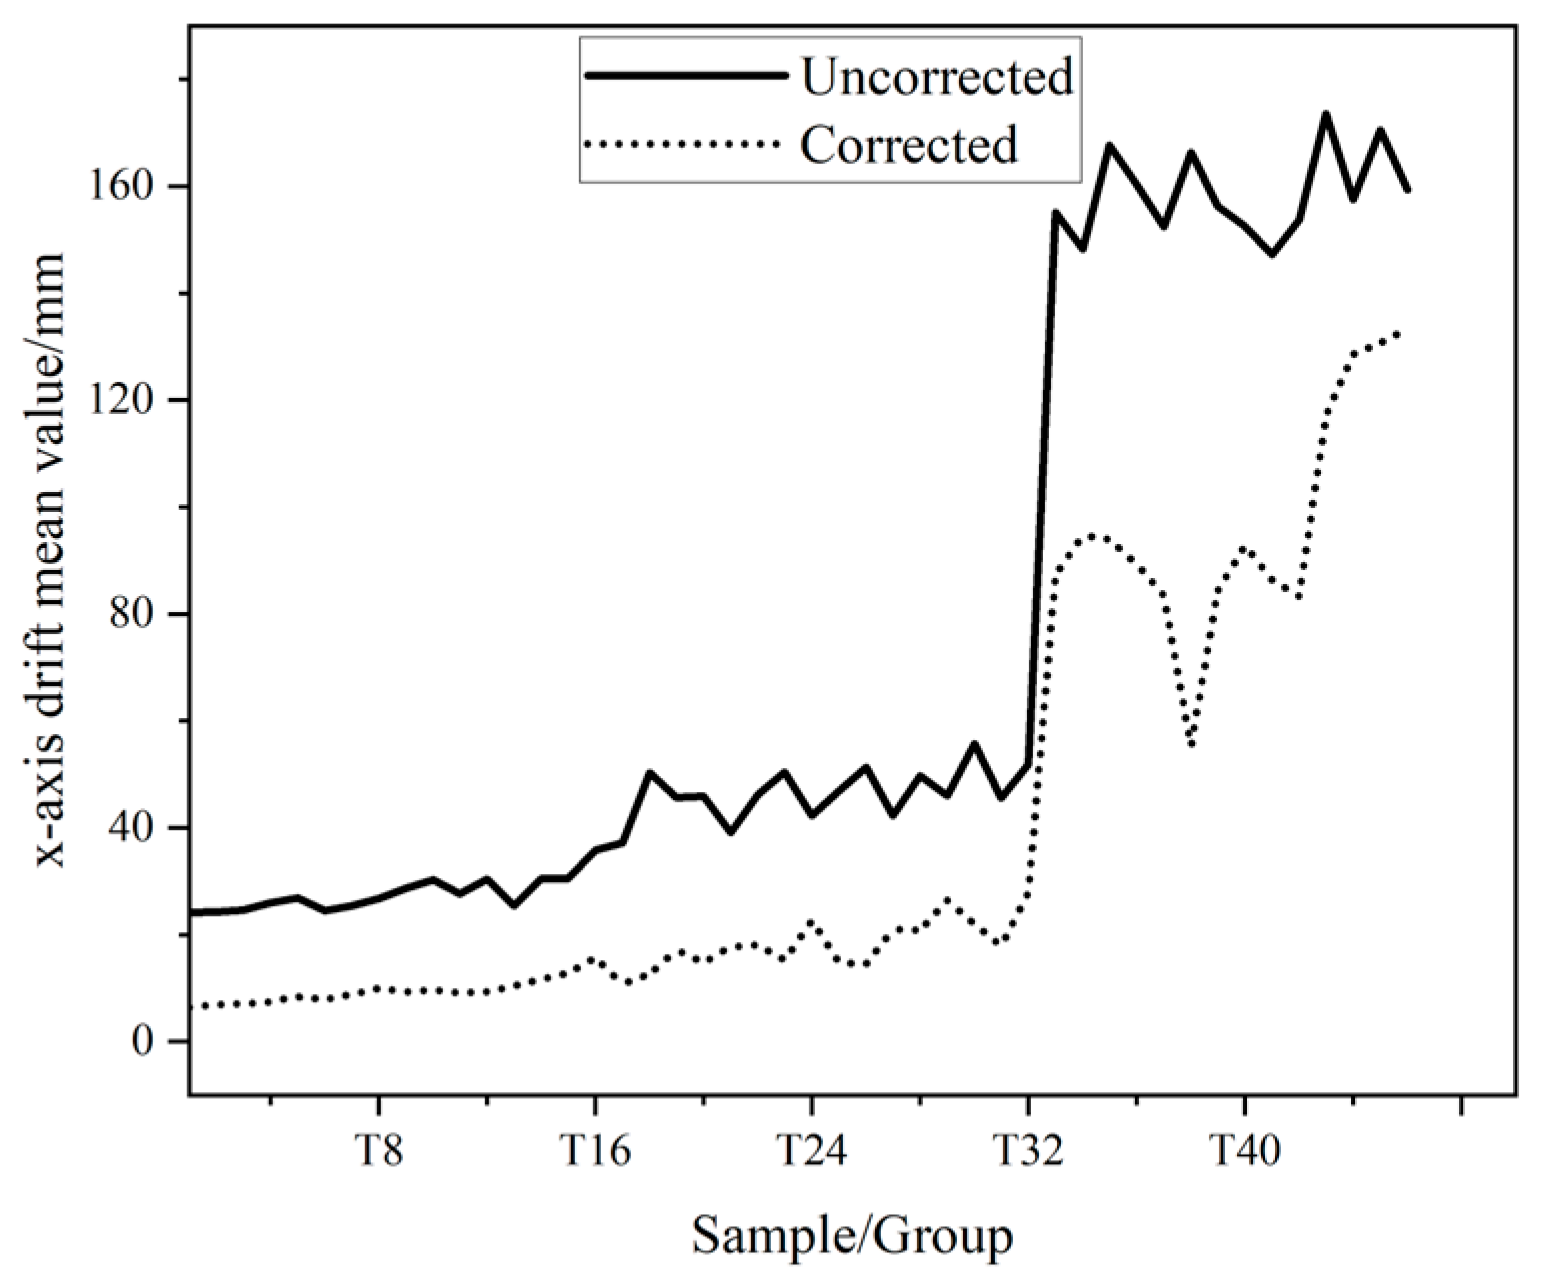
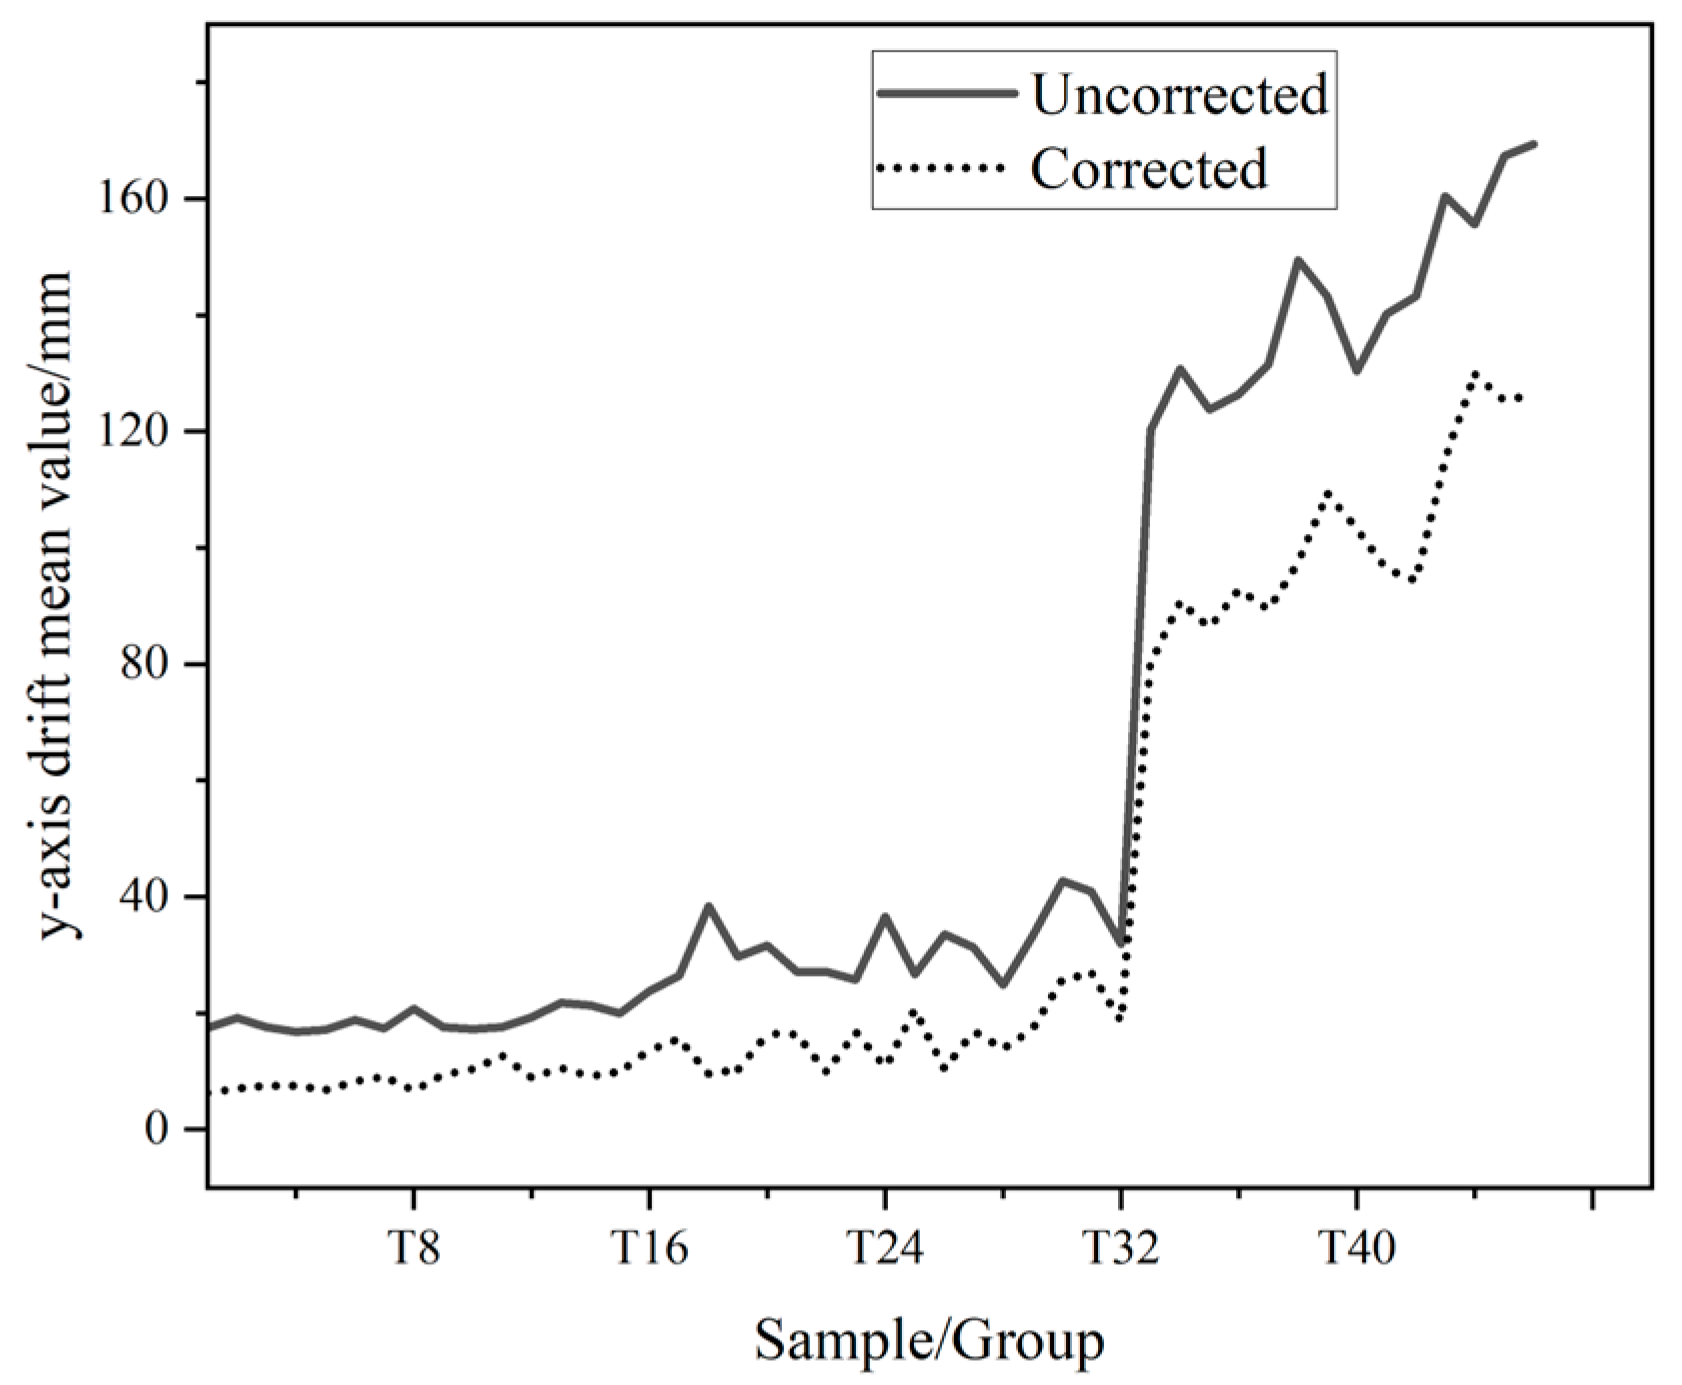
Figure 4 and Figure 5 show the mean drift of 46 groups of measurement samples before and after correction in the x and y directions under different weather and different distances. Table 4, Table 5 and Table 6 list the mean drift data of the spot before and after correction in the x and y directions in the three experimental links, respectively, providing data support for subsequent performance comparison and analysis.
Since the measurement distances of link 1 and link 2 are 0.42 km and 2 km, respectively, the corresponding atmospheric turbulence intensity is in the range of weak-to-moderate turbulence. It can be seen from Figure 4 and Figure 5 and Table 4 and Table 5 that the drift of the spot in the x and y directions in the two links is relatively close, and the overall drift level is small. The measurement distance of link 3 is 10 km, which is much larger than that of link 1 and link 2, and belongs to the medium-to-strong-turbulence region. According to the results of Figure 4 and Figure 5 and Table 6, it can be seen that the drift of the spot in the x and y directions in link 3 is significantly higher than that in the first two links, showing stronger disturbance characteristics, which verifies the trend of atmospheric turbulence intensity increasing with the increase in transmission distance. It can be seen from Table 1, Table 2, Table 3, Table 4, Table 5 and Table 6 that the average drift of the spot in the x and y directions of the samples on sunny and cloudy days is small; for the samples collected under rainy conditions, the average drift of the spot in the x and y directions is slightly larger than that under sunny and cloudy conditions, indicating that the disturbance intensity is more obvious. This phenomenon is consistent with the variation in atmospheric turbulence intensity with weather conditions; that is, the turbulence intensity is usually gradually enhanced in the order of sunny days, cloudy days, rainy days and sandstorms, resulting in a gradual increase in the mean spot drift.
It can be seen from Table 4 and Table 5 and Figure 4 and Figure 5 that the mean drift of the spot in the x and y directions is significantly reduced after the fast mirror correction at the transmission distances of 0.42 km and 2 km, indicating that the fast mirror can effectively suppress the low-frequency and large-scale drift disturbance, thereby significantly reducing the fluctuation range of the spot centroid after correction and improving the overall stability of the system. In the 10 km long-distance link experiment, the spot drift is significantly affected by atmospheric turbulence disturbance, and the FSM still has a certain drift suppression effect. The correction effect is significantly weaker than that of the 2 km and 0.42 km links. This shows that as the transmission distance increases, the atmospheric disturbance increases, and the FSM mainly compensates for the low-frequency drift. For more complex high-frequency disturbances in long-distance links, its correction ability has certain limitations. This conclusion has also been verified under different weather conditions. It can be seen from Table 4, Table 5 and Table 6 that with the gradual increase in turbulence intensity in sunny, cloudy, rainy and sandstorm weather conditions, the correction ability of the FSM for spot drift shows a downward trend.

4.2. Beam Position Drift Variance

Variance is an important index to measure the fluctuation degree of random variables, which is used to describe the dispersion degree of data deviating from its mean. The larger the variance, the more violent the data fluctuation and the more dispersed the distribution; the smaller the variance, the more relatively concentrated and stable the data. For a set of observations, the mean variance is defined as the average of the square of the difference between the data and the mean:
σ 2 = 1 n i = 1 n x i x ¯ 2
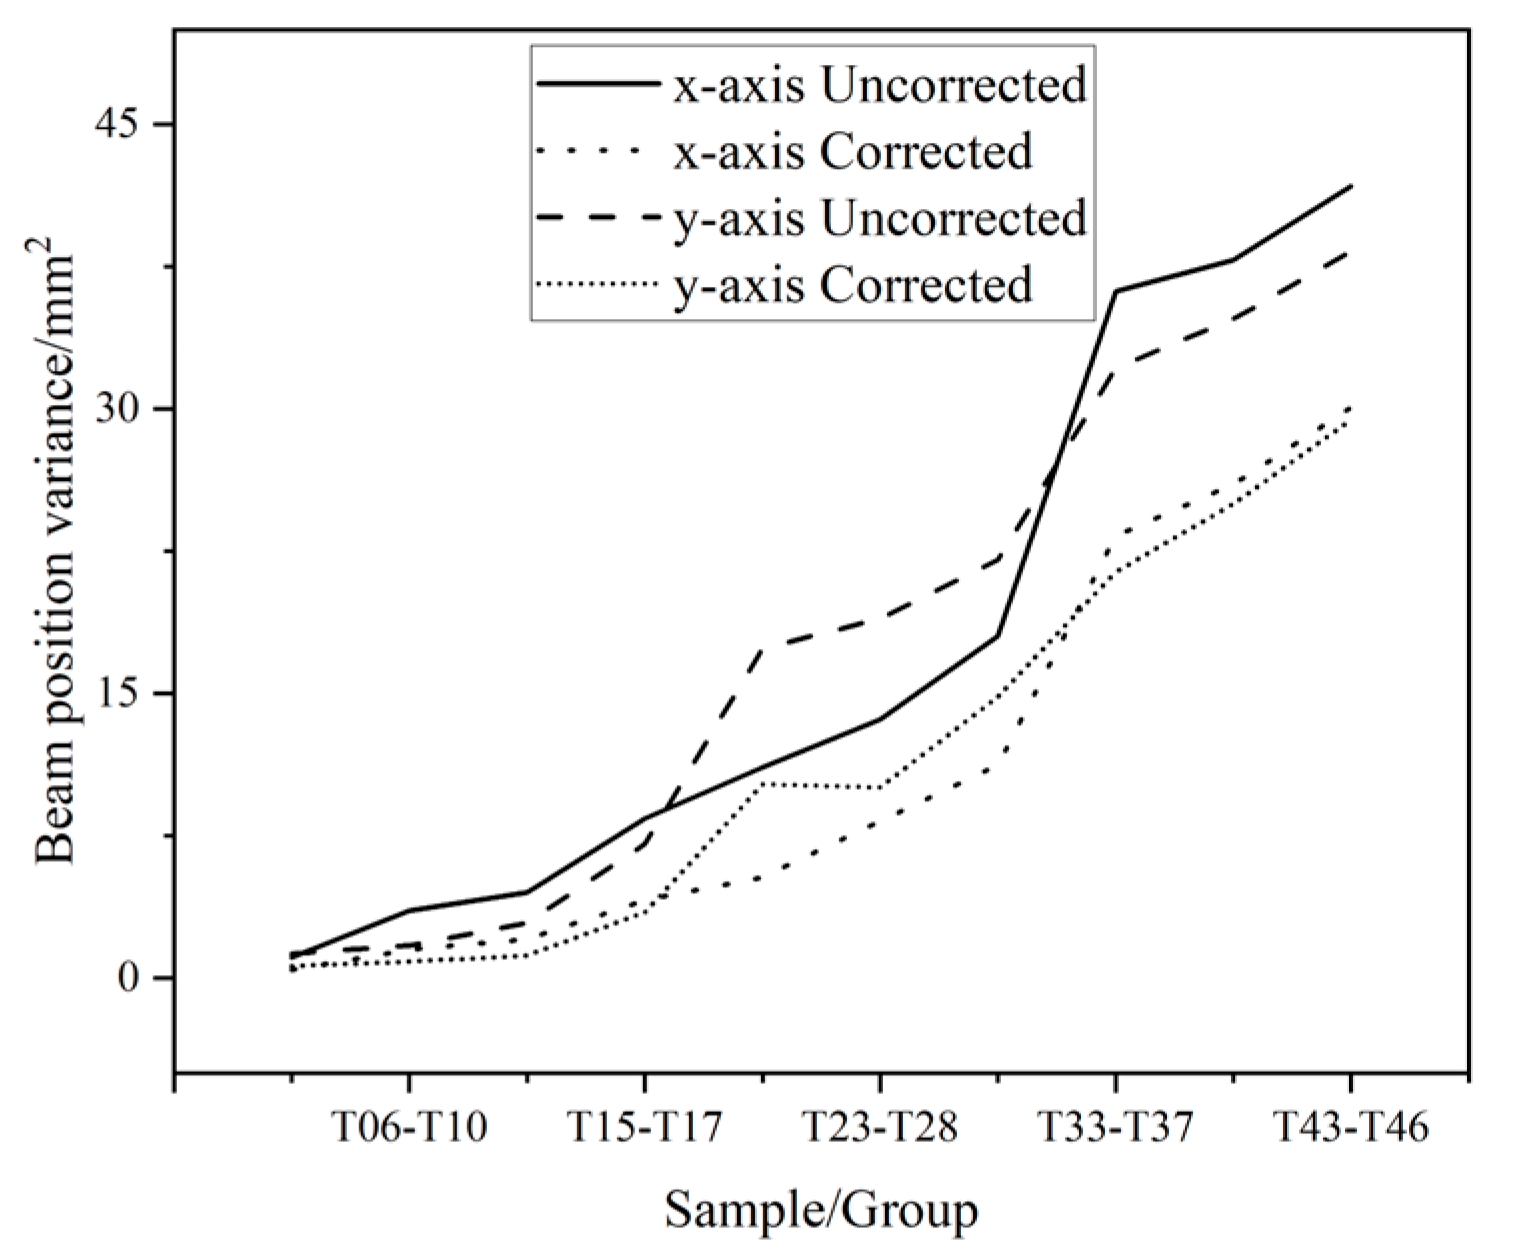
As illustrated in Figure 6, the link distances for segments T1–T5, T18–T22 and T33–T37 are 0.42 km, 2 km and 10 km, respectively. A pronounced increasing trend is observed in the variance of spot drift along both the x and y axes with progressive transmission distance extension. This phenomenon persists under cloudy and rainy conditions, demonstrating that the intensified atmospheric turbulence effect induced by extended propagation paths leads to degraded spot stability and more pronounced drift fluctuations. Comparative analysis of Figure 6 and Table 7 reveals that, at identical transmission distances, the spot drift variance in both axes escalates progressively as weather conditions deteriorate from clear sky to cloudy, rainy and finally dust-storm scenarios. This correlation unequivocally demonstrates the significant impact of meteorological conditions on spot stability, where adverse weather exacerbates atmospheric turbulence disturbances, thereby amplifying spot drift fluctuations.
As evidenced by Figure 6 and Table 7, under weak-turbulence conditions (e.g., clear and cloudy skies), the FSM significantly reduces spot drift variance after correction, markedly improving system stability. In contrast, under strong turbulence (e.g., rain and dust storms), the variance reduction is limited, demonstrating weaker correction efficacy and marginal stability enhancement. This indicates that the FSM effectively suppresses drift and enhances stability in mild-disturbance environments but exhibits constrained performance under severe turbulence. Furthermore, comparative experiments across three link distances (0.42 km, 2 km and 10 km) under identical weather conditions consistently validate this trend.

5. Conclusions

In this paper, three measured links with different lengths are built, and the influence of transmission distance and weather conditions on spot drift is systematically analyzed. Under the three transmission distances of 0.42 km, 2 km and 10 km, the correction performance of the FSM for spot drift under typical weather conditions such as sunny, cloudy, rainy and sandstorm conditions is investigated. The following conclusions are drawn:
(1)
Under the same transmission distance, the samples under sunny, cloudy, rainy and dust-storm weather conditions are analyzed. It is found that with the deterioration of weather conditions, the mean and variance of spot drift gradually increase. This shows that the intensity of atmospheric disturbance increases with the severity of the weather, which has a more significant impact on the stability of the spot.
(2)
Under the same weather conditions, the measurement samples under three transmission distances of 0.42 km, 1.3 km and 10 km are analyzed. It is found that the mean and variance of spot drift increase gradually with the increase in link distance. This shows that the longer the transmission distance, the more significant the disturbance of atmospheric turbulence to the beam, resulting in a decrease in system stability.
(3)
At the same transmission distance, the FSM has a significant effect on the correction of low-frequency spot drift in weakly turbulent environments such as on sunny and cloudy days, which can effectively reduce the mean and variance of drift. Under strong-turbulence conditions such as rainy days and dust storms, the high-frequency disturbance is enhanced, the ability of the FSM to suppress the spot drift of high-frequency rapid change is weakened, and the correction effect is reduced.
(4)
Under the same weather conditions, with the increase in transmission distance, the amplitude and frequency characteristics of spot drift change, and the correction performance of the FSM shows obvious difference. For a short distance, the spot drift is mainly characterized by low-frequency and low-amplitude disturbance. The FSM can effectively compensate and achieve a better correction effect. As the distance increases, the high-frequency and high-amplitude disturbances caused by atmospheric turbulence increase, and the FSM’s ability to suppress these rapidly changing high-frequency components is weakened, resulting in a decrease in the correction effect. In general, the FSM is suitable for compensating for low-frequency drift. The farther the distance is, the more limited its ability to correct high-frequency disturbances is.

Author Contributions

Conceptualization, Y.Y.; methodology, R.W.; software, Y.Y.; validation, Y.Y.; formal analysis, R.W.; investigation, Y.Y.; resources, Y.Y.; data curation, X.K.; writing—original draft preparation, X.K.; writing—review and editing, Y.Y.; visualization, X.K.; supervision, X.K.; project administration, R.W.; funding acquisition, X.K. All authors have read and agreed to the published version of the manuscript.

Funding

This research received no external funding.

Institutional Review Board Statement

Not applicable.

Informed Consent Statement

Not applicable.

Data Availability Statement

The original contributions presented in this study are included in the article. Further inquiries can be directed to the corresponding author.

Conflicts of Interest

The authors declare no conflict of interest.

References

  1. Khalghi, M.A.; Uysal, M. Survey on free space optical communication: A communication theory perspective. IEEE Commun. Surv. Tutor. 2014, 16, 2231–2258. [Google Scholar] [CrossRef]
  2. Li, M.; Wu, Z.; Wang, Y.; Feng, Y.; Zhang, C.; Su, Z.; Feng, Z.; Jiang, Y. BER for a space uplink laser communication system under an actual optical distortion with a cake-cutting method. Opt. Lett. 2023, 48, 5992–5995. [Google Scholar] [CrossRef] [PubMed]
  3. Hayal, M.R.; Yousif, B.B.; Azim, M.A. Performance enhancement of DWDM FSO optical fiber communication systems based on hybrid modulation techniques under atmospheric turbulence channel. Photonics 2021, 8, 464. [Google Scholar] [CrossRef]
  4. Wang, J. Research on Adaptive Receiving Technology of Optical Wireless Communication; Huazhong University of Science and Technology: Wuhan, China, 2006. [Google Scholar]
  5. Ke, X.; Liao, Z.; Liang, J.; Wang, R.; Ding, D. Research on atmospheric turbulence noise measurement in wireless optical communication. J. Radio Wave Sci. 2024, 39, 225–236. [Google Scholar]
  6. Mo, J.; Feng, X.; Pan, X. Research on laser spot position drift correction of stereolithography system. J. Laser 2007, 4, 77–78. [Google Scholar]
  7. Zhang, L.; Lin, W.; Liao, Z.; Wang, R. Research of algorithm to correct direction drifts of laser beam. Laser Technol. 2012, 36, 386–389. [Google Scholar]
  8. Ren, X.; Fan, J.; Pan, R.; Sun, K. Beam Pointing Deviation Correction System Based on FSMs. Chin. J. Lasers 2023, 50, 110–120. [Google Scholar]
  9. Liu, W.; Yao, K.; Huang, D.; Lin, X.; Wang, L.; Lv, Y. Performance evaluation of coherent free space optical communications with a double-stage fast-steering-mirror adaptive optics system depending on the Greenwood frequency. Opt. Express 2016, 24, 13288–13302. [Google Scholar] [CrossRef]
  10. Poliak, J.; Calvo, R.M.; Rein, F. Demonstration of 1.72 Tbit/s Optical Data Transmission Under Worst-Case Turbulence Conditions for Ground-to-Geostationary Satellite Communications. IEEE Commun. Lett. 2018, 22, 1818–1821. [Google Scholar] [CrossRef]
  11. Kaymak, Y.; Rojas-Cessa, R.; Feng, J.H.; Ansari, N.; Zhou, M.C.; Zhang, T. A Survey on Acquisition, Tracking, and Pointing Mechanisms for Mobile Free-Space Optical Communications. IEEE Commun. Surv. Tutor. 2018, 20, 1104–1123. [Google Scholar] [CrossRef]
  12. Walsh, S.M.; Karpathakis, S.F.E.; McCann, A.S.; Dix-Matthews, B.P.; Frost, A.M.; Gozzard, D.R.; Gravestock, C.T.; Schediwy, S.W. Demonstration of 100 Gbps coherent free-space optical communications at LEO tracking rates. Sci. Rep. 2022, 12, 18345. [Google Scholar] [CrossRef] [PubMed]
  13. Ke, X.; Zhao, J. Beam alignment of wireless optical communication using dual-mirror control. J. Opt. Sci. 2023, 43, 169–178. [Google Scholar]
  14. Zhao, Q.; Zhong, M.; Lv, B. Experimental study on atmospheric laser beam drift. Laser Technol. 2010, 34, 532–534. [Google Scholar]
  15. Ai, Z.; Chen, J.; Ji, J. FSM assembly error disturbance rejection method. Prog. Laser Optoelectron. 2024, 61, 283–290. [Google Scholar]
  16. Yang, S.; Ke, X.; Wu, J.; Liu, X. Fast alignment of wireless optical communication using two-dimensional mirrors. China Laser 2022, 49, 101–114. [Google Scholar]
  17. Xie, N.; Du, Y.; Jiang, S.; Gong, Q.; Wang, M.; Xu, F.; Wang, X.; Qi, Y. Theoretical modeling and simulation analysis of FSM. Appl. Opt. 2023, 44, 513–522+585. [Google Scholar]
  18. Kang, D.; Jiang, C.; Liu, L.; Zhao, J.; Yu, B.; Chen, Q.; Wang, S.; Wang, N.; Chen, J.; Zhang, Y.; et al. Design of two-dimensional fast control plane mirror system with large aperture and high precision. Appl. Opt. 2022, 43, 661–668. [Google Scholar]
  19. Jia, G.; Hou, L.; Hong, P. Research on image rotation model of reflective two-dimensional fast control mirror. Opt. Optoelectron. Technol. 2021, 19, 86–92. [Google Scholar]
  20. Huang, Z.; Li, Y.; Xie, H.; Yang, R.; Gu, J.; Xie, X. Fast calculation method of deflection angle of double FSM for beam pointing control. Infrared Laser Eng. 2024, 53, 147–156. [Google Scholar]
  21. Zhang, Q.; Gu, W.; Ming, K. Research on driving characteristics of two-axis reluctance FSM with large rotation angle. Mach. Hydraul. 2025, 53, 190–194+220. [Google Scholar]
  22. Ji, J.; Liu, Y. Bilinear interpolation fitting calibration method for two-dimensional large-angle FSM. Laser Infrared 2024, 54, 1737–1743. [Google Scholar]
  23. Wang, M.; Xi, J.; Wang, W. Analysis of the influence of acoustic wave disturbance on the internal and external scales of atmospheric turbulence and the refractive index power spectrum function. Physics 2023, 72, 165–175. [Google Scholar] [CrossRef]
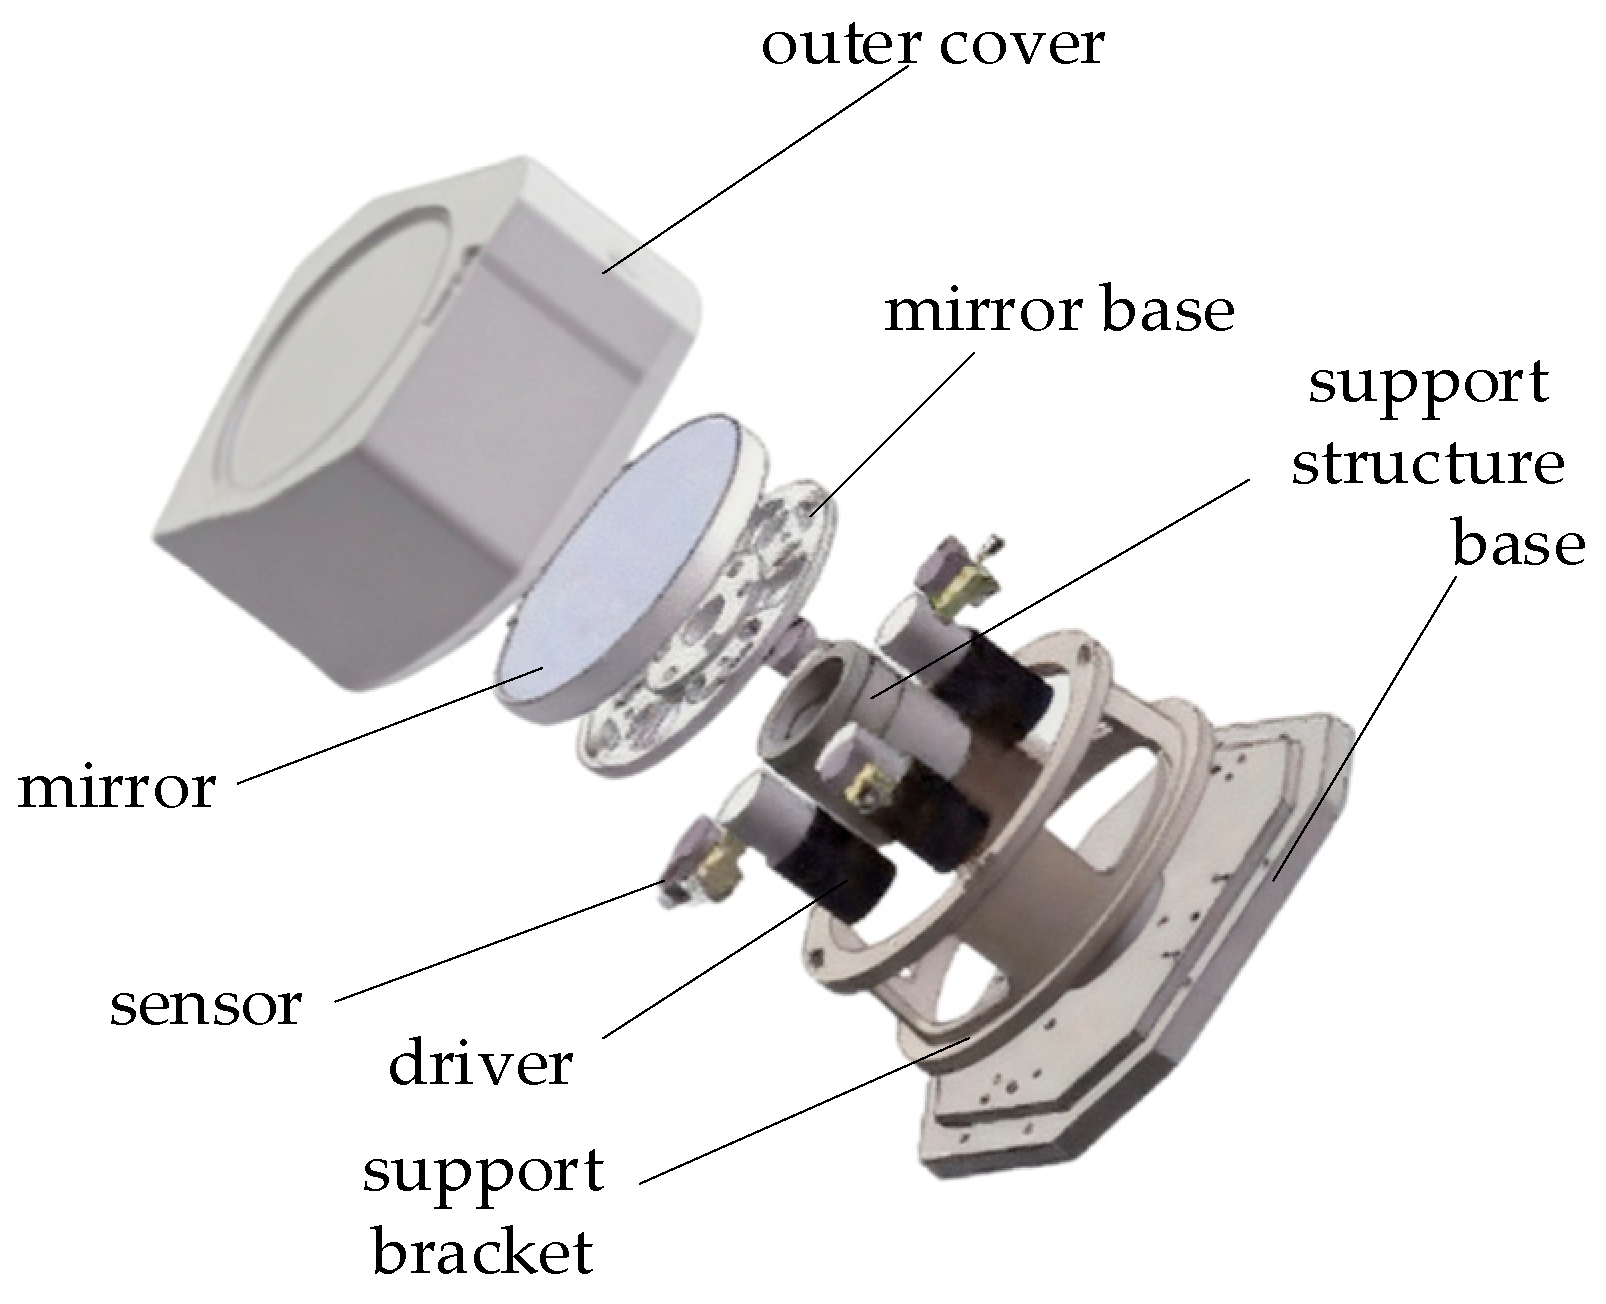
Figure 1. Structural diagram of voice coil motor fast mirror.
Applsci 15 09920 g001
Figure 2. Schematic diagram of the fast reflector system for suppressing atmospheric turbulence.
Applsci 15 09920 g002
Figure 4. Mean drift of spot before and after correction in x direction.
Applsci 15 09920 g004
Figure 5. Mean drift of spot before and after correction in y direction.
Applsci 15 09920 g005
Figure 6. Comparison of drift variance before and after spot correction in x and y directions of links 1–3.
Applsci 15 09920 g006
Table 1. Link 1.
Table 1. Link 1.
WeatherSampleDateTemperatureWindAQI
SunnyT127 November 20241–12West wind level 370
T217 December 2024−2–11Northwest wind level 180
T31 December 20241–17North wind level 172
T421 March 20259–23Northeast wind level 165
T524 March 202512–30Northwest wind level 174
OvercastT612 December 20240–6West wind level 363
T726 December 20240–8Northeast wind level 266
T817 March 20252–15Southwest wind level 352
T928 March 20256–11Northwest wind level 3127
T103 April 202511–18Northeast wind level 292
RainT111 March 20256–15North wind level 2172
T122 March 20256–11Southwest wind level 4 68
T1313 March 202511–20Southeast wind level 490
T1414 March 20259–11West wind level 363
SandstormT1526 March 202514–27West wind level 2185
T1611 April 202510–26Northwest wind level 3117
T1722 March 20259–24Southwest wind level 469
Table 2. Link 2.
Table 2. Link 2.
WeatherSampleDateTemperatureWindAQI
SunnyT185 November 20248–18Northeast wind level 179
T1928 November 20241–13West wind level 172
T2020 December 2024−1–8Northeast wind level 176
T219 March 202505–19Northeast wind level 275
T2210 April 202515–27Northeast wind level 2107
OvercastT2318 December 20240–6Northeast wind level 290
T2413 December 20240–6Northwest wind level 3105
T255 December 20240–10Southwest wind level 198
T2614 December 2024−1–7Southwest wind level 381
T274 April 20259–25Northwest wind level 2107
T287 April 202515–31Southeast wind level 278
RainT2921 April 202511–22Southwest wind level 475
T303 May 202517–25Northeast wind level 377
T317 May 202520–31Northeast wind level 3198
T329 May 202513–25Northwest wind level 585
Table 3. Link 3.
Table 3. Link 3.
WeatherSampleDateTemperatureWindAQI
SunnyT3325 November 2024−2–10West wind level 237
T342 April 20259–18Northwest wind level 298
T3514 April 202412–28Northwest wind level 292
T3611 May 202515–31Northeast wind level 144
T3712 June 202526–39Southeast wind level 148
OvercastT3820 November 20245–14Southwest wind level 149
T395 May 202414–28Southwest wind level 3111
T4018 May 202420–36Southwest wind level 3120
T416 June 202425–35Southwest wind level 244
T4217 June 202527–38Northeast wind level 272
RainT4317 November 20248–10Northeast wind level 123
T4414 May 202516–29Northwest wind level 362
T4525 May 202516–26Northwest wind level 157
T4614 June 202520–31Southwest wind level 347
Table 4. The mean value of 0.42 km spot drift before and after correction in the x and y directions.
Samplex/Uncorrectedx/Correctedy/Uncorrectedy/Corrected
T124.176.346.346.27
T224.286.976.977.06
T324.637.17.17.55
T425.917.57.57.55
T526.878.378.376.79
T624.537.957.958.23
T725.398.858.859.11
T826.739.999.996.63
T928.739.339.339.49
T1030.329.79.710.4
T1127.639.139.1312.63
T1230.399.389.388.9
T1325.3710.4310.4310.61
T1430.4811.7311.739.17
T1530.4412.7912.799.96
T1635.7815.6915.6913.68
T1737.1710.7510.7515.59
Table 5. The mean of 2 km spot drift before and after correction in the x and y directions.
Samplex/Uncorrectedx/Correctedy/Uncorrectedy/Corrected
T1850.2712.6338.399.58
T1945.6817.1829.6610.27
T2045.8414.7831.6116.49
T2139.0917.7827.1116.34
T2246.2318.0627.1029.87
T2350.3615.2525.7516.7
T2442.2922.6536.5810.67
T2546.9314.8126.6120.6
T2651.314.5633.610.45
T2742.2420.9931.2316.86
T2849.6920.7624.8313.87
T2945.9926.4233.3317.3
T3055.732242.725.77
T3145.5517.940.9126.85
T3251.8927.8431.818.6
Table 6. The 10 km spot drift in the x and y directions before and after correction of the drift mean value.
Samplex/Uncorrectedx/Correctedy/Uncorrectedy/Corrected
T33155.0987.29120.2580.17
T34148.1994.63130.890.74
T35167.6393.97123.7786.25
T36160.2989.26126.3992.85
T37152.3783.48131.5489.35
T38166.3355.28149.497.41
T39156.2184.41143.18109.28
T40152.4692.78130.31103.22
T41147.1786.39140.1496.26
T42153.7483.28143.294.35
T43173.53117.25160.43115.39
T44157.49128.54155.57129.84
T45170.56130.65167.39125.32
T46159.35133.28169.38126.3
Table 7. The drift variance of the spot in the x and y directions before and after correction in the experimental links 1–3.
Samplex/Uncorrectedx/Correctedy/Uncorrectedy/Corrected
T01–051.10.451.280.63
T06–103.541.511.720.87
T11–144.512.052.91.19
T15–178.424.117.063.46
T18–2211.135.3217.3710.22
T23–2813.638.2618.9510.05
T29–3218.0311.2422.0414.83
T33–3736.2023.3132.1721.41
T38–4237.8526.0334.7525.01
T43–4641.7530.0738.2929.43
Disclaimer/Publisher’s Note: The statements, opinions and data contained in all publications are solely those of the individual author(s) and contributor(s) and not of MDPI and/or the editor(s). MDPI and/or the editor(s) disclaim responsibility for any injury to people or property resulting from any ideas, methods, instructions or products referred to in the content.