Article

Classification of Climate-Driven Geomorphic Provinces Using Supervised Machine Learning Methods

by
Hasan Burak Özmen
1,2,* and
Emrah Pekkan
2
1
Institute of Graduate School, Department of Remote Sensing and Geographical Information Systems, Eskisehir Technical University, 26555 Eskişehir, Türkiye
2
Institute of Earth and Space Sciences, Eskisehir Technical University, 26555 Eskişehir, Türkiye
*
Author to whom correspondence should be addressed.
Appl. Sci. 2025, 15(18), 9894; https://doi.org/10.3390/app15189894
Submission received: 25 July 2025 / Revised: 30 August 2025 / Accepted: 2 September 2025 / Published: 10 September 2025
(This article belongs to the Section Earth Sciences)

Abstract

Physical and chemical processes related to global and regional climate changes are important factors in shaping the Earth’s surface. These processes form various erosion and deposition landforms on the Earth’s surface. These landforms reflect the traces of past and present climate conditions. This study shows that geomorphometric parameters can effectively distinguish between geomorphometrically and climatically distinct geomorphic provinces. In this context, supervised machine learning models were developed using geomorphometric parameters and the Köppen-Geiger climate classes observed in Türkiye. These models, Random Forest, Support Vector Machines, and K-Nearest Neighbor algorithms, were developed using a training data set. Classification analysis was performed using these models and a test dataset that was independent of the training dataset. According to the classification results, the overall accuracy values for the Random Forest, Support Vector Machines, and K-Nearest Neighbor models were calculated as 99.27%, 99.70%, and 99.30%, respectively. The corresponding kappa values were 0.99, 0.99, and 0.99, respectively. This study shows that among the geomorphometric parameters used in the analyses, maximum altitude, elevation, and valley depth were determined as important parameters in distinguishing geomorphic provinces.

1. Introduction

Both climate conditions and the lithological and structural characteristics of the rocks influence physical and chemical changes in rocks. To evaluate the effects of climate on landforms, climate classes obtained from long-term temperature and precipitation records should be associated with geomorphic provinces shaped by climate-driven processes. This relationship will enable an integrated evaluation of climate and geomorphology, the development of climate classification methods based on landforms, and the creation of new datasets to improve the resolution of climate classes. To better understand this relationship, examining geomorphometric features provides a valuable perspective.
Geomorphometry focuses on identifying, obtaining, and analyzing the morphometric features of the Earth’s surface [1]. Geomorphometric parameters are utilized to assess the geomorphometric properties of landforms and to comprehend regional landform processes [2,3,4,5]. Understanding the processes that shape landforms provides insight into the characteristics and effects of many processes in geomorphology, hydrology, and soil science [5,6,7,8,9,10,11]. Digital Elevation Models (DEM) and topographic analysis methods have been widely applied to investigate these processes, addressing challenges in geomorphology, hydrology, remote sensing (RS), geographic information systems (GIS), geology, climatology, earth sciences, and many other disciplines [5,12,13,14,15,16,17,18,19,20]. The extraction of quantitative features of landforms using digital elevation models will provide a basis for relating landforms to climate conditions.
RS and GIS analysis methods are employed to derive geomorphometric parameters, such as slope, aspect, curvature, topographic wetness index, and topographic position index, using elevation data [5]. These parameters are used in geomorphological studies such as investigating landform processes, analyzing geomorphological landforms formed under different climate conditions, and classifying landforms according to their geomorphometric features [3,21,22,23,24,25,26,27]. However, geomorphometric parameters have not yet been adequately assessed in classifying climate conditions.
Climate classification methods classify regions with similar climate conditions based on meteorological data, typically including long-term temperature and precipitation records [28,29,30,31]. The widely used Köppen-Geiger (K-G) climate classification method, developed by botanist Wladimir Köppen and later updated by Rudolf Geiger, is still in use today [31,32]. Recent studies have used databases created through RS and GIS to produce K-G climate classification maps [33,34,35,36]. In addition to global-scale K-G climate classification studies [34,35,37,38,39,40], studies have also been carried out at various scales [33,36,38,41,42,43] and to develop climate scenarios for future years [34,35,39]. Such limitations increase the importance of geomorphological evidence that more clearly reveals the effects of different climate conditions on landforms.
Various landforms formed under different climate conditions during the Quaternary period in Türkiye. Cold climate conditions led to the formation of landforms such as U-shaped valleys, cirques, cirque lakes, and moraines [44,45,46,47,48,49,50,51,52,53]. Temperate climate conditions caused changes in lake levels, the formation of river terraces [54], increased river erosion, and the development of deltas through sediment accumulation [55]. In subsequent dry periods, lake levels declined, and visible remains of old lake levels and lacustrine terraces formed [56,57]. Additionally, today’s climate conditions are also effective in the development of similar landforms and geological formations. Such landforms and geological formations on Earth serve as important evidence of past and present climate conditions. Similar erosion, deposition, and geological processes occur in regions with similar climate conditions [58,59].
In Türkiye, tectonic uplift, particularly during the Quaternary period, led to the deeper burial of river networks and the deepening of valleys [60,61,62]. The increasing elevation difference, due to the change in precipitation and temperature conditions during the glacial–interglacial periods, led to glaciation, cirques, cirque lakes, and the formation of glacial valleys in high mountain areas [45,63,64,65,66], and to intense river erosion and the formation of extensive alluvial deposits in the lower areas [61,67]. Therefore, present-day landforms may bear traces of past climatic conditions and tectonic uplifts; they continue to be shaped by the influence of present-day climatic conditions through active fluvial erosion, slope processes, and young alluvial deposits [61]. The study assumes that climate is the dominant factor in landform development and that surface formations reflect contemporary shaping processes rather than the entire geological history in the selected areas.
Therefore, the geomorphometric parameters of the Earth’s surface, which are shaped by climate conditions, are related to the climate classes of the regions. These geomorphological parameters show how the past and present effects of climatic conditions have left traces on landforms and thus can serve as natural indicators for use in classifying climate-driven geomorphic regions. Therefore, it is necessary to examine whether geomorphometric parameters can be used systematically in climate classification studies.
Climate classification methods have been applied in previous studies using both meteorological data [28,29,30,31,32,33,68]. In studies based on station data, the details of the classification analyses performed in regions where the number of stations is insufficient or non-existent are reduced. Geomorphometric parameters derived using DEMs represent the Earth’s surface and carry the traces of the climate conditions experienced. In this context, showing a relationship between geomorphometric parameters and climate classes, and classifications of climate-driven geomorphic regions, can provide insights into how climate influences landform evolution across distinct geographical settings.
This study aims to classify climate-driven geomorphic provinces using geomorphometric parameters that represent landforms, and to explore the relationship between these parameters and the associated climate classes. For this purpose, classification analyses were conducted using geomorphometric parameters and K-G climate classes. Random Forest (RF), Support Vector Machines (SVM), and K Nearest Neighbors (KNN) supervised machine learning classification algorithms have been widely used in classification analyses [69,70,71,72,73,74]. In this study, machine learning models were developed using RF [75,76], SVM [77], and KNN [78] algorithms, along with geomorphometric parameters. Classification analyses were performed using the machine learning models developed. Then, the performance metrics of the classification results were evaluated. In this context, the climate classes of sample points selected from areas with different climate conditions were classified. Additionally, geomorphometric parameters important in distinguishing climate classes were identified. This approach contributes to filling the gap between geomorphometric parameters and climate influences on landforms by demonstrating that DEM-derived geomorphometric variables can be used to classify climate-driven geomorphic provinces through supervised learning methods.

2. Materials and Methods

This section is divided into subsections to explain the materials and methods used in this study. The Study Areas subsection describes the characteristics of the study areas, followed by the Data and Data Set Preparation Subsection, which outlines the data collection and dataset preparation process. The Supervised Machine Learning Classification section details model training and optimization, model testing, evaluation of test performance metrics, and determination of geomorphometric parameter feature importance. In this context, K-G climate classes and geomorphometric parameters were used in the supervised machine learning classification analyses (Figure 1).

2.1. Study Areas

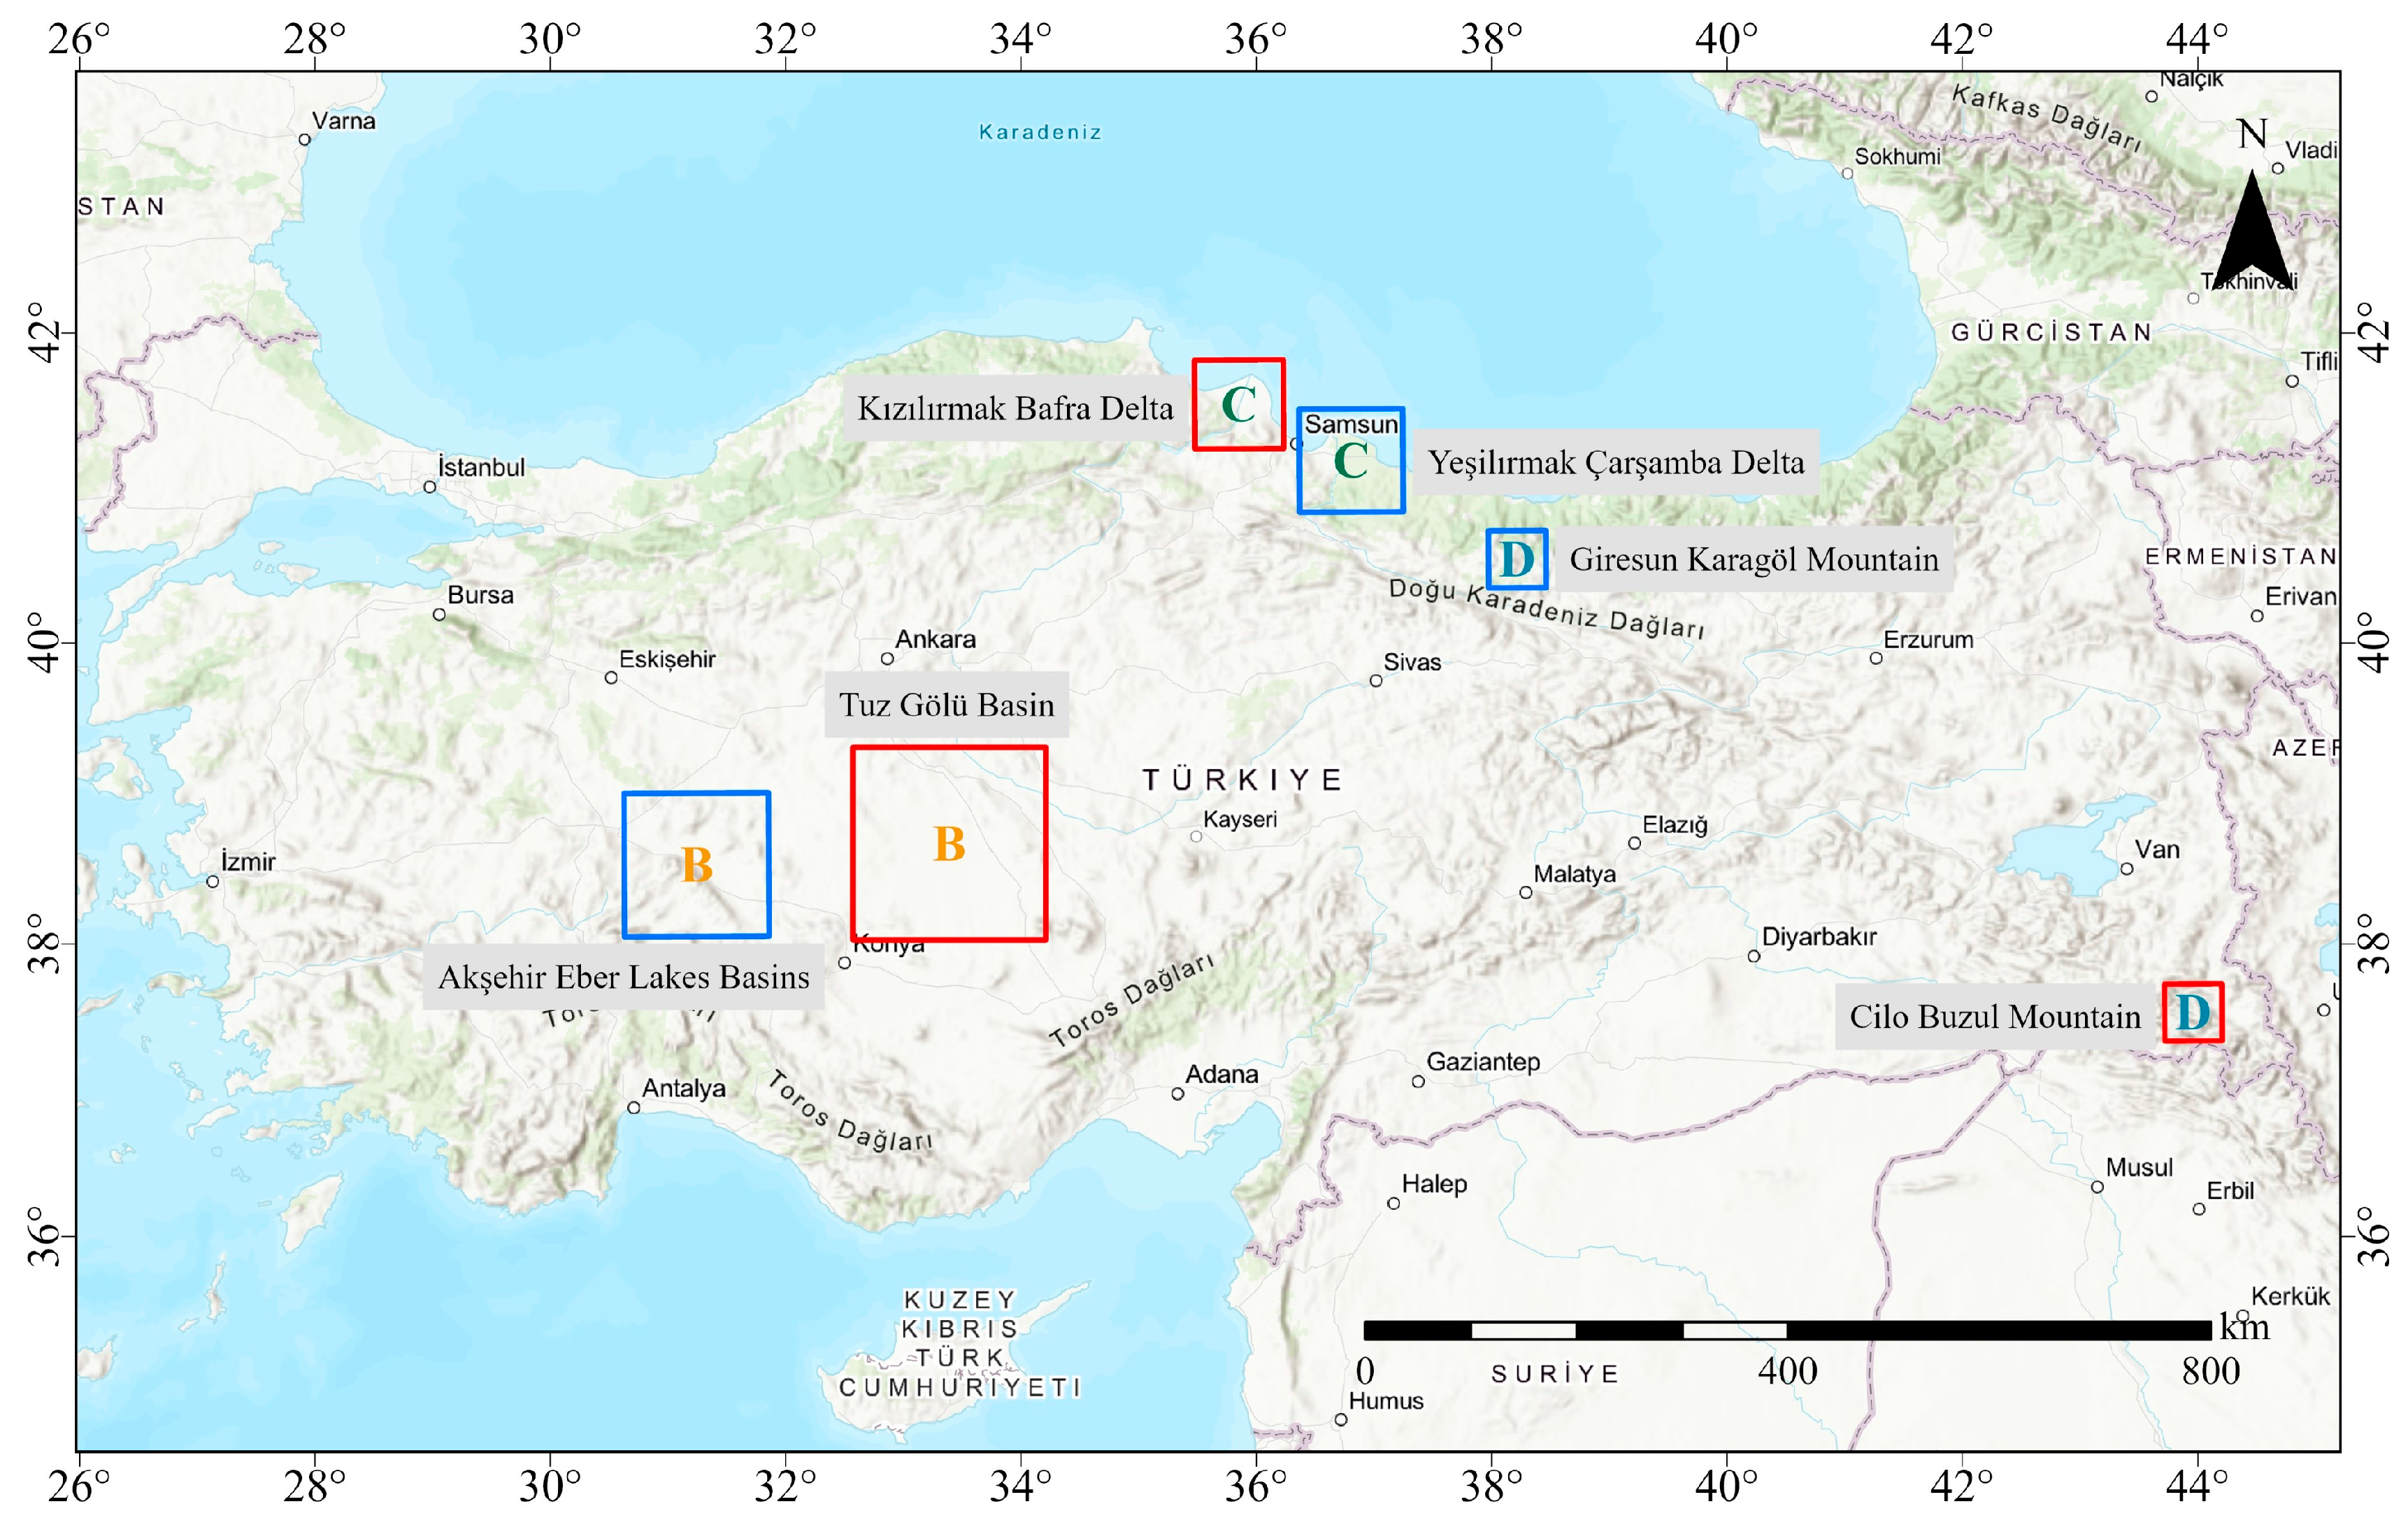
In this study, six areas were selected to reflect Türkiye’s climatic, geomorphological, and topographic diversity. The distinctive features of the K-G climate classes can be clearly observed in these regions. The Tuz Gölü and Akşehir-Eber Basins represent arid climates, the Kızılırmak (Bafra) and Yeşilırmak (Çarşamba) Deltas reflect temperate climates, and the Cilo and Giresun Karagöl Mountains illustrate cold climates. These regions feature diverse landforms, including former lake basins, flat delta plains, cirques, and U-shaped valleys. This geomorphological diversity is essential for training and testing machine learning models under various geomorphological conditions. The Salt Lake Basin, Kızılırmak Delta, and Cilo Mountains were selected as training areas for machine learning models, while the Akşehir-Eber Lakes Basin, Yeşilırmak Delta, and Giresun Karagöl Mountains were selected as test areas for the evaluation of the developed models shown in Figure 2.
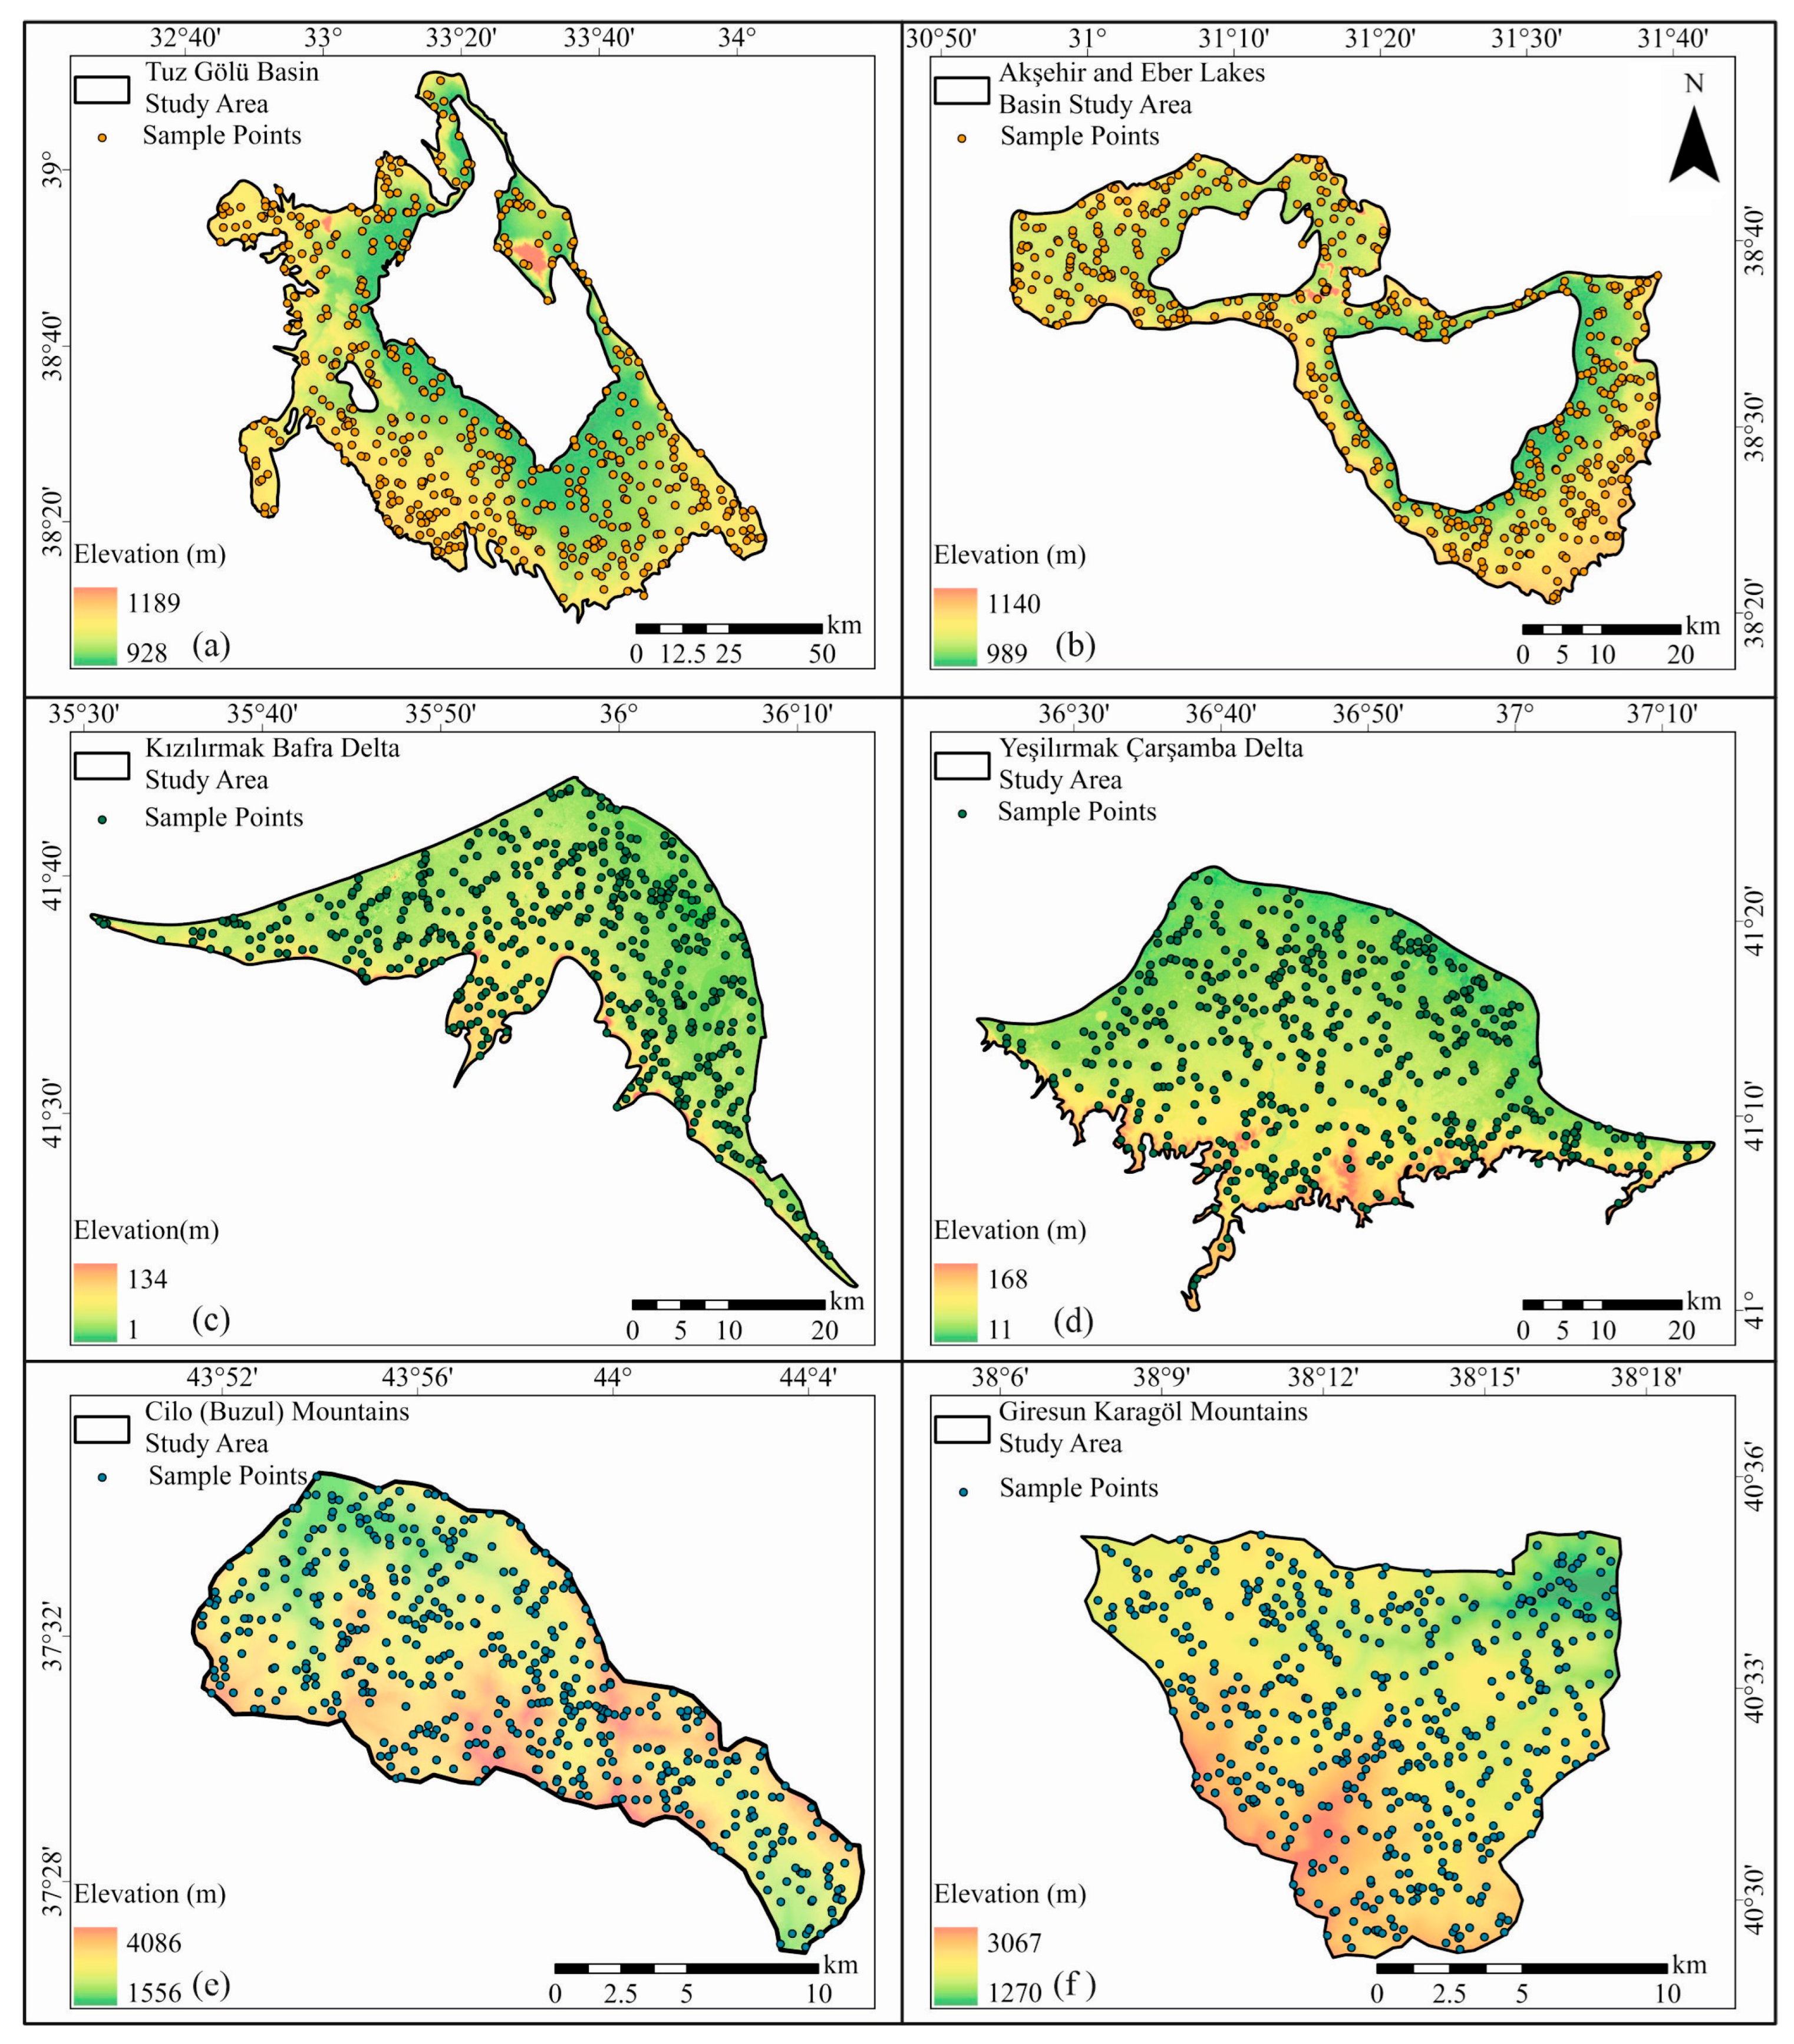
The observation of old lake levels and lacustrine terraces at elevations higher than the current lake level in the Tuz Gölü Basin (Figure 3a) and its surroundings is one of the most important indicators that the region was once influenced by arid climate conditions [79,80]. Another important indicator is the presence of geological units rich in evaporite minerals [80]. The level changes observed in Akşehir and Eber Lakes (Figure 3b) and the terraces belonging to the old lake levels were formed under the influence of climate change [81]. These terraces are located on the southeast, east, northeast, and northwest shores of Akşehir Lake. The terraces and cliffs associated with former lake levels indicate that arid climate conditions influenced the region [81,82].
The Kızılırmak Delta (Figure 3c) was formed by the accumulation of alluvial material carried by the Kızılırmak River, and sediment transport to the delta and delta development continue [55]. The delta begins as terraces in the eastern and western parts, where Old Quaternary alluvial deposits are located. In the southern parts of the delta, younger units lie below the Pliocene sedimentary units. These older deposits date up to the Pleistocene, and the delta formation is generally attributed to the Quaternary period [55,83,84,85]. The Yeşilırmak Delta (Figure 3d) was formed by the accumulation of alluvial material carried by the Yeşilırmak River, a process that continues to this day. The delta has a generally flat and slightly sloping landform structure. The geology of the delta area consists of Upper Cretaceous sedimentary units, Upper Paleocene-Eocene magmatic and sedimentary units, Miocene magmatic units, Pliocene terrestrial deposits, and Quaternary alluvial units [86].
The Pleistocene was a key period in the geological development of the Cilo Mountains (Figure 3e), during which various glacial landforms emerged due to widespread glaciation. This region is recognized as one of Türkiye’s major glaciated areas, where remnants of glaciers still persist today [45,87,88,89]. Features such as large and small glaciers, cirques and glacial lakes, and U-shaped valleys are still present in the region [45,89]. The presence of glacial formations in the Cilo Mountains and their surroundings indicates that cold climate conditions prevailed. Karagöl Mountains (Figure 3f) and their surroundings exhibit significant geomorphological diversity, including glacial lakes, cirques, and U-shaped valleys formed by glaciation and glacial erosion at high elevations. These landforms reflect the cold climate conditions of the Pleistocene period and indicate that the area is an important area for observing glacial surface features in Türkiye [63]. The study areas representing the climate classes used in this study are shown in Figure 3.

2.2. Data and Data Set Preparations

This section outlines the data sources and preparation steps used in this study. It explains the climate classification method adopted, the derivation of geomorphometric parameters, the sampling strategy applied, and the preprocessing steps prior to analysis.
K-G climate classes of the study areas and geomorphometric parameters derived using DEMs constitute the primary data sources in the study. This study employed the widely used K-G climate classes to classify climate conditions. The K-G climate classification method categorizes climate conditions into five main classes and various subclasses [33,34,35,37,38,68,90]. K-G main climate classes observed in Türkiye (Table 1) were utilized within the scope of the study [33,68,90].
The software stack used in this study includes multiple platforms optimized for different stages of the analysis. SAGA GIS v.9.5.1 [91] as employed to derive geomorphometric parameters from DEMs. R was used for machine learning model development, training, and performance evaluation, utilizing the caret, randomForest [92], and e1071 [93], caret [94] packages. ArcGIS Pro v.3.3.0 software was used for spatial data visualization, attribute management, and mapping. This multi-platform workflow ensured consistency in data preparation, processing, and interpretation across stages. All critical analytical procedures, such as geomorphometric parameter extraction and machine learning classification, were performed using open-source software, including SAGA GIS v.9.5.1 and R. v.4.3.2 Consequently, the analytical workflow remains reproducible with alternative open-source geographic information system tools such as QGIS or GRASS GIS for spatial data management.
Within the scope of the study, geomorphometric parameters were used to reveal the relationship between climate classes and landforms. To produce these geomorphometric parameters, ALOS PALSAR HR RTC RT1 DEM data [95], which have a radiometric surface correction, a spatial resolution of 12.5 m, and are in GeoTIFF format, were used. This dataset was preferred due to its higher spatial resolution compared to commonly used DEMs, such as SRTM or ASTER (both approximately 30 m), which may not be sufficient to capture detailed topographic characteristics in complex terrain [96,97]. DEMs were separately downloaded for the study areas selected as test and training areas. These DEMs were used to create numerical data of geomorphometric parameters in the analyses. The geomorphometric parameters used in the study are given in Table 2. The numerical subset of geomorphometric parameters was derived using SAGA (System for Automated Geoscientific Analyses) software, which is open-source and freely available under the GNU Lesser General Public License (LGPL) [91].
Following parameter generation, a sampling method was applied to select representative points for analysis. The Simple Random Sampling (SRS) method [127] was used to create sample points for the analysis within the scope of the study. To convert the numerical data of geomorphometric parameters into a data set of 500 sample points from each training and test area, a total of 3000 sample points were selected using the SRS method (Figure 3). Simple Random Sampling (SRS) was chosen for its ease of implementation and statistical neutrality. In addition, SRS method does not require prior knowledge of the sample set spatially; each selection in the sample set has equal probability of selection and is randomly selected independently of each other [128]. Since each point had an equal probability of being selected, geomorphometric conditions within each climate region were represented without bias. The study areas were geographically independent and included diverse landforms (e.g., deltas, plains, mountains), which helped reduce spatial clustering.
The sampled geomorphometric values were then structured and prepared for classification analysis. The numerical data of the prepared geomorphometric parameters were transferred to ArcGIS Pro v.3.3.0 software. These data were processed as attributes for training and test datasets at each sample point. In the prepared training and test datasets, the data types of the features were converted, with climate classes (arid, temperate, cold) represented as categorical data, and geomorphometric parameters represented as continuous floating-point values. In these datasets, climate classes were treated as categorical variables, whereas geomorphometric parameters were represented as continuous floating-point variables and used as predictors in the modeling process. Descriptive statistical values of the prepared data are given in Table 3.
It is seen that the data of the features to be used in the classification analysis are not on the same scale (Table 3). In machine learning analyses, different data scales can adversely affect the accuracy of classification results. Because the variables differed in scale, normalization was necessary to ensure reliable classification. It is crucial to bring the data to the same scale to ensure that the classification results are not negatively affected and that the analysis results are accurate [129]. The min-max normalization method was employed to standardize the data scale. The data were normalized from −1 to +1 using Equation (1) [129,130]. Descriptive statistical values of the normalized data are shown in Table 3.
x n o r m = 2   ×   x min ( x ) max ( x ) min ( x ) 1
The K-G climate classes in the data sets consist of arid, temperate, and cold climate classes observed in the study areas, and the geomorphometric parameter data comprise the numerical values of each parameter. The dataset used in the analyses are provided in the Supplementary Materials.

2.3. Supervised Machine Learning Classification

In the study, machine learning models were developed using RF, SVM, and KNN classification algorithms, and model training, optimizations, and classification analysis were performed.

2.3.1. Model Training and Optimization

In machine learning analysis, RF, SVM, and KNN algorithms are widely used to solve regression and classification problems [75,76,77,78].
RF is one of the tree-based algorithms that is easy to use due to its structure and is less prone to overfitting. It determines the final class by aggregating the predictions from multiple decision trees, selecting the one with the majority class [75,76,131]. Two parameters are used to optimize the model performance during the training phase of the RF algorithm. One of these parameters is the number of trees used during the classification. The other parameter is the number of features (mtry) considered at each split during the classification [132,133].
SVM algorithm generally creates hyperplanes in a space with different dimensions, which separate classes with distinct class labels in data sets, and these hyperplanes separate the classes from each other [77,131]. This optimal hyperplane is used to classify data by maximizing the margin between different classes. Once the hyperplane is identified, it separates and classifies the data according to their labels [131]. The key parameter affecting the model performance during the SVM algorithm training phase is the C (cost) parameter. The C parameter controls the trade-off between misclassification and margin maximization during training. Only the C value is used during training of the linear SVM model.
The KNN algorithm performs classification by assuming that classes nearby are similar to those in the dataset used to solve the problem [78]. When determining the class of data, this algorithm identifies the class by measuring distances to the k closest labeled data points and assigning the most frequent class among them [131,133,134]. The k value, which determines how many neighbors are considered when classifying a data point, is the parameter that affects the algorithm’s success.
Model development was conducted using the training dataset and the three algorithms, with repeated k-fold cross-validation applied to enhance model reliability [135,136,137]. This method divides the dataset into k parts and uses k − 1 of these parts for training and the remaining for testing. The k-fold cross-validation method is repeated k times. This validation process was used in the analyses, and a separate test dataset, spatially independent of the training data, was used to evaluate the developed models. These approaches were applied to reduce the risk of overfitting and increase the generalization capacity of the models.
The Caret package in R-Studio [138,139], a widely preferred tool in machine learning studies, was employed for model training [94]. Accuracy and kappa values [140] were obtained as a result of the model training process. Higher accuracy and kappa values indicate better classification performance of the models [141,142,143].
Each of the RF, SVM, and KNN algorithms has distinct advantages for classification tasks involving complex geospatial data. RF is robust to overfitting and effective at identifying variable importance across mixed-type features. SVM is suitable for high-dimensional feature spaces and can capture subtle boundaries between classes, while KNN provides a simple, non-parametric baseline for assessing local similarity patterns. These models were selected for their complementary capabilities in analyzing the spatial relationships between geomorphometric characteristics and climate classes.

2.3.2. Testing Models

After the model training phase, the models were tested with the test data set prepared separately from the training data set, and classification results were obtained. The test data set contains different values of the same features used during model training, which ensures its independence from the training data. One of the purposes of model testing is to determine the extent to which the model can classify feature values independently of the training phase after the model has been trained. Trained models were evaluated using this test data set, and performance measures were obtained. The classification success of the model is evaluated based on the obtained model performance metrics [142].

2.3.3. Evaluation of Testing Performance Metrics

Classification performance was evaluated based on the results obtained from the model test analyses, and these results formed the basis for assessing the success of the developed models. The confusion matrix, generated from the classification results of the trained models using test data sets, was used to calculate performance criteria such as accuracy, kappa statistics, precision, sensitivity, specificity, and F1 score [130,142,144,145,146,147].
Within the scope of the study, classification models were developed by training RF, SVM, and KNN algorithms using the training data sets. The developed models were tested through classification analysis using the test dataset. In the testing phase, randomForest [92], e1071 [93], and caret packages [94] were used with the R-Studio [138,139] program. The resulting confusion matrices were then used to derive performance metrics for each model.

2.3.4. Determination of Feature Importance of Geomorphometric Parameters

The RF algorithm was applied to determine the importance of geomorphometric parameters in the classification analysis. Mean Decrease Accuracy (MDA) and Mean Decrease Gini (MDG) values were calculated using the RF algorithm to assess feature importance [75,76,148,149,150]. All geomorphometric parameters were included in the model training phase without any prior feature selection. Specifically, MDA estimates the decrease in model accuracy when the values of a given feature are randomly permuted, while MDG quantifies the reduction in node impurity (based on the Gini index) attributable to each feature across all decision trees [75,76,150]. Features with higher MDA and MDG values represent more important features during model training than others [75,76,150]. These importance values were used after classification to identify which geomorphometric variables contributed most to differentiating between climate classes. This approach enabled the full utilization of input features while enhancing the interpretability of variable influence.
The randomForest [92] package in the R-Studio environment was used to calculate the feature importance values. After model training, MDA and MDG scores were obtained as outputs of the package, and the relative importance of geomorphometric parameters used in the analysis was determined accordingly.
The R code used in the analyses are provided in the Supplementary Materials.

3. Results

3.1. Model Training and Optimization Results

All algorithms were trained using the repeated k-fold cross-validation method, and the number of repetitions was set as 3, with k = 10 during the model training phase. For model optimization, the mtry and ntree values for the RF algorithm, the C value for the SVM algorithm, and the k value for the KNN algorithm were optimized. The hyperparameter values evaluated during model optimization, the optimum parameter values obtained based on these hyperparameter settings, and the accuracy and kappa values of the model’s training performed using the optimum parameter values are summarized in Table 4.
The model training and optimization results shown in Table 5 demonstrate that all three algorithms can classify climate classes with the selected optimal parameters and effectively capture the relationships between geomorphometric parameters and climate classes. Therefore, these findings support the methodological suitability of using geomorphometric parameters for climate classification.

3.2. Model Testing (Classification) and Classification Results

The overall accuracy, kappa statistics, precision, sensitivity, specificity, and F1 score results of the classification analysis using the RF, SVM, and KNN algorithm models developed within the scope of the study are summarized in Table 5.
The performance metrics presented in Table 5 show that the classification analyses conducted with the independent test dataset yielded consistent results across all three models. The classification results obtained for models developed using all three algorithms confirm the robustness and generalizability of the proposed approach. Furthermore, the results obtained across precision, sensitivity, specificity, and F1 score metrics show that all models perform well, without bias towards any particular climate class. These findings confirm the capacity of geomorphometric parameters to reflect climatic changes and demonstrate that these parameters can provide significant classification performance when analyzed with supervised machine learning models.
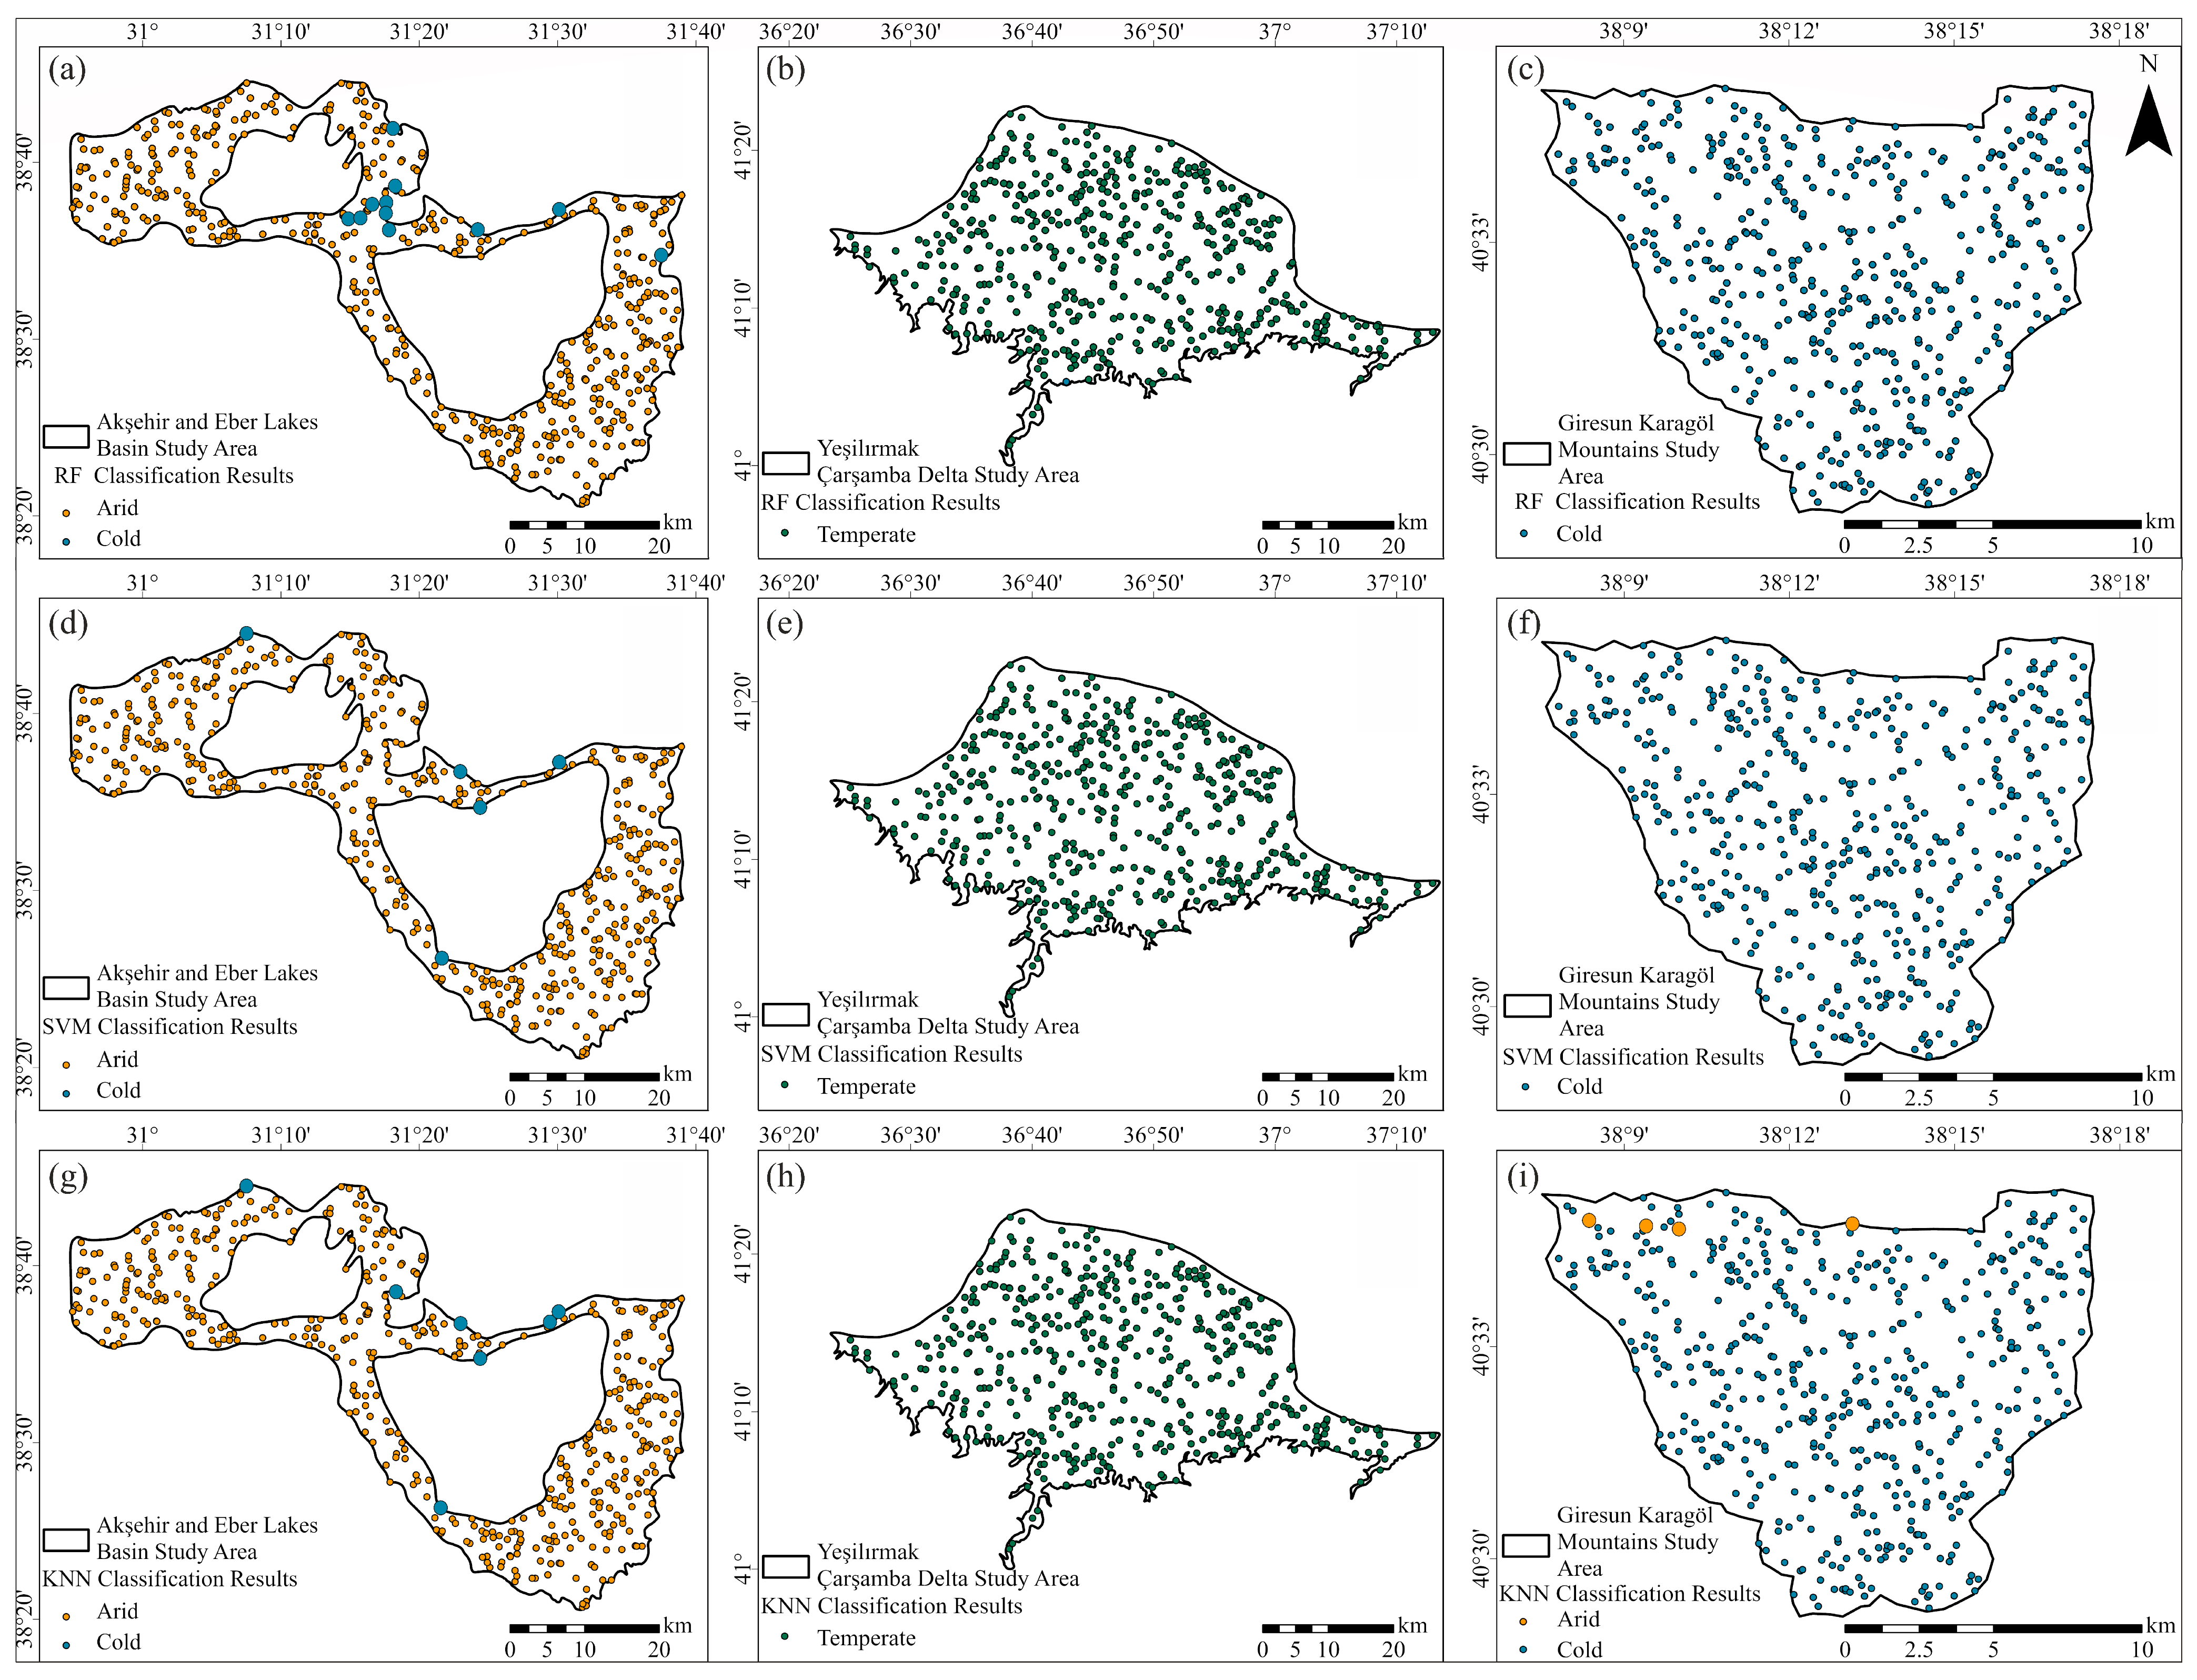
According to the classification analysis results, the distribution of climate classes of the sample points is shown in Figure 4. In the same figure, the classification results of the RF algorithm are shown in Figure 4a–c; SVM results in Figure 4d–f; and KNN results in Figure 4g–i.
The classification results map shows the models’ ability to classify climate-driven geomorphic regions by capturing distinct geomorphometric features shaped by climate conditions. The use of independent training and test sets, each representing distinct climate-driven geomorphological provinces, demonstrates the effectiveness of this classification method based on geomorphometric variables.

3.3. Determination of Feature Importance of Geomorphometric Parameters Results

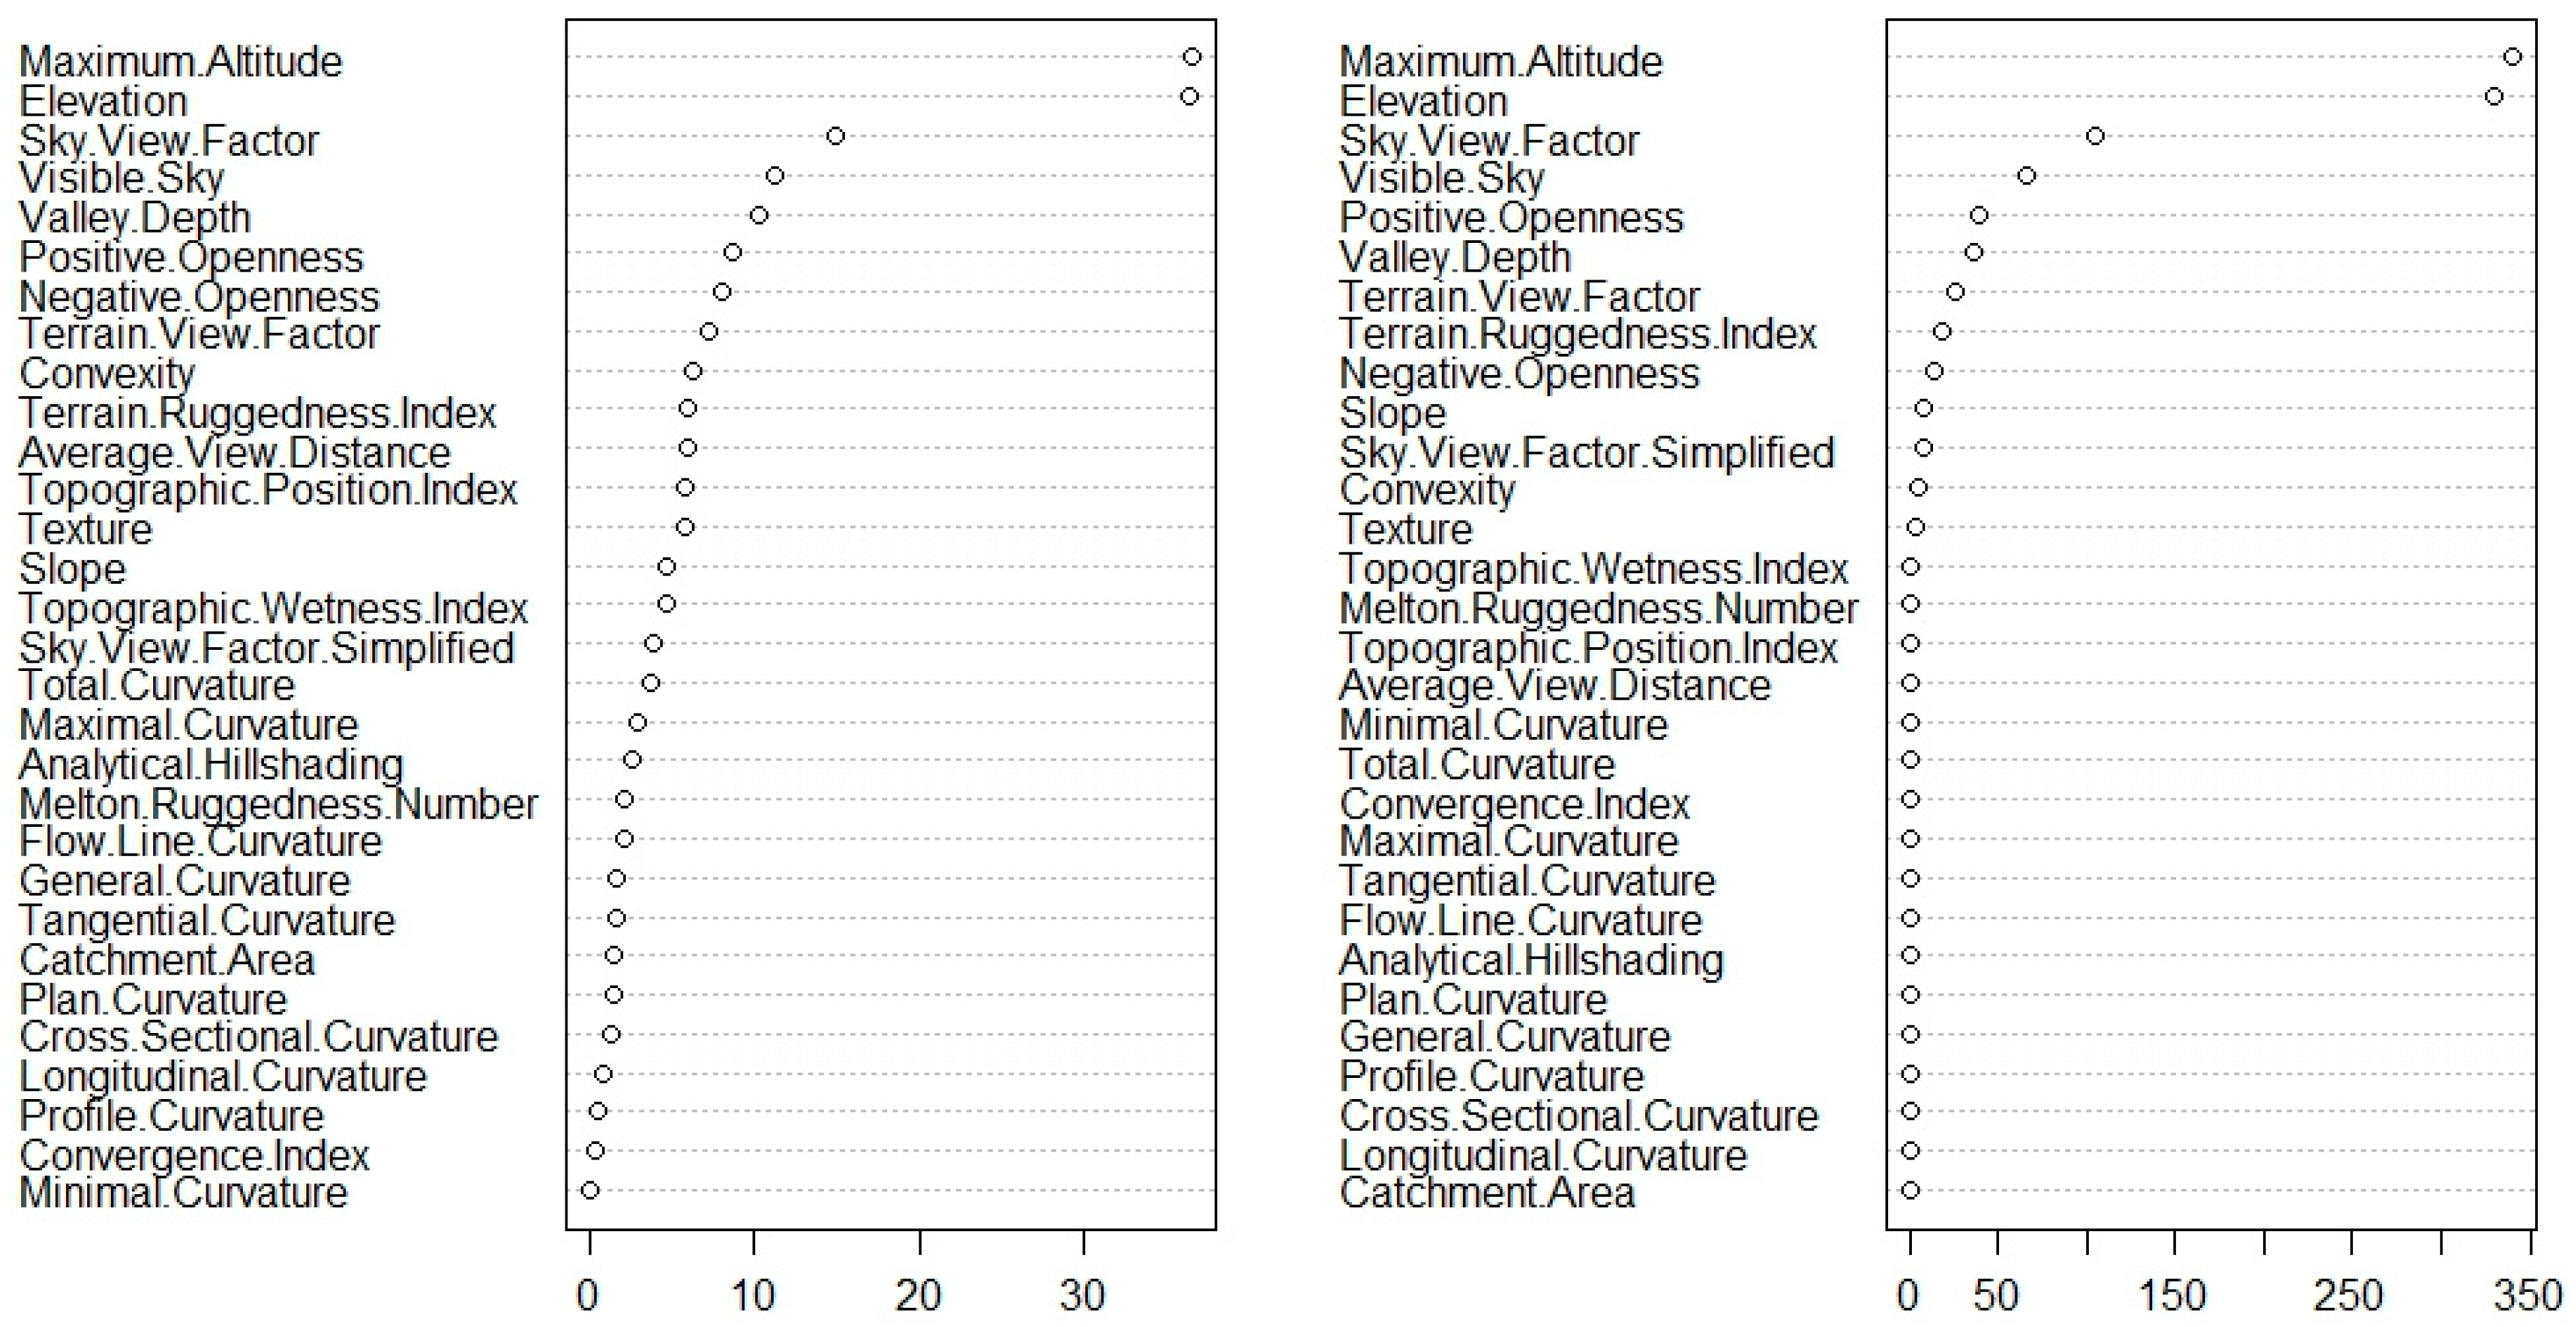
The importance levels of the geomorphometric parameters (features) were evaluated using feature selection analyses with RF algorithm. At this stage, the importance of all features used in the analyses was determined. The importance levels of the parameters, as determined by the MDA and MDG values during model development, are shown in Figure 5.
When the feature importance values are compared, it is observed that the most effective parameters in the classification performance are the maximum altitude and elevation parameters. Following these, the sky view factor, visible sky, valley depth, positive openness, negative openness, and terrain view factor constitute the second important geomorphometric parameter group. As shown in Figure 5, these findings demonstrate that elevation-related parameters play a significant role in distinguishing climatic conditions. Overall, these results confirm that geomorphometric parameters provide the basis for machine learning-based climate classification.

4. Discussion

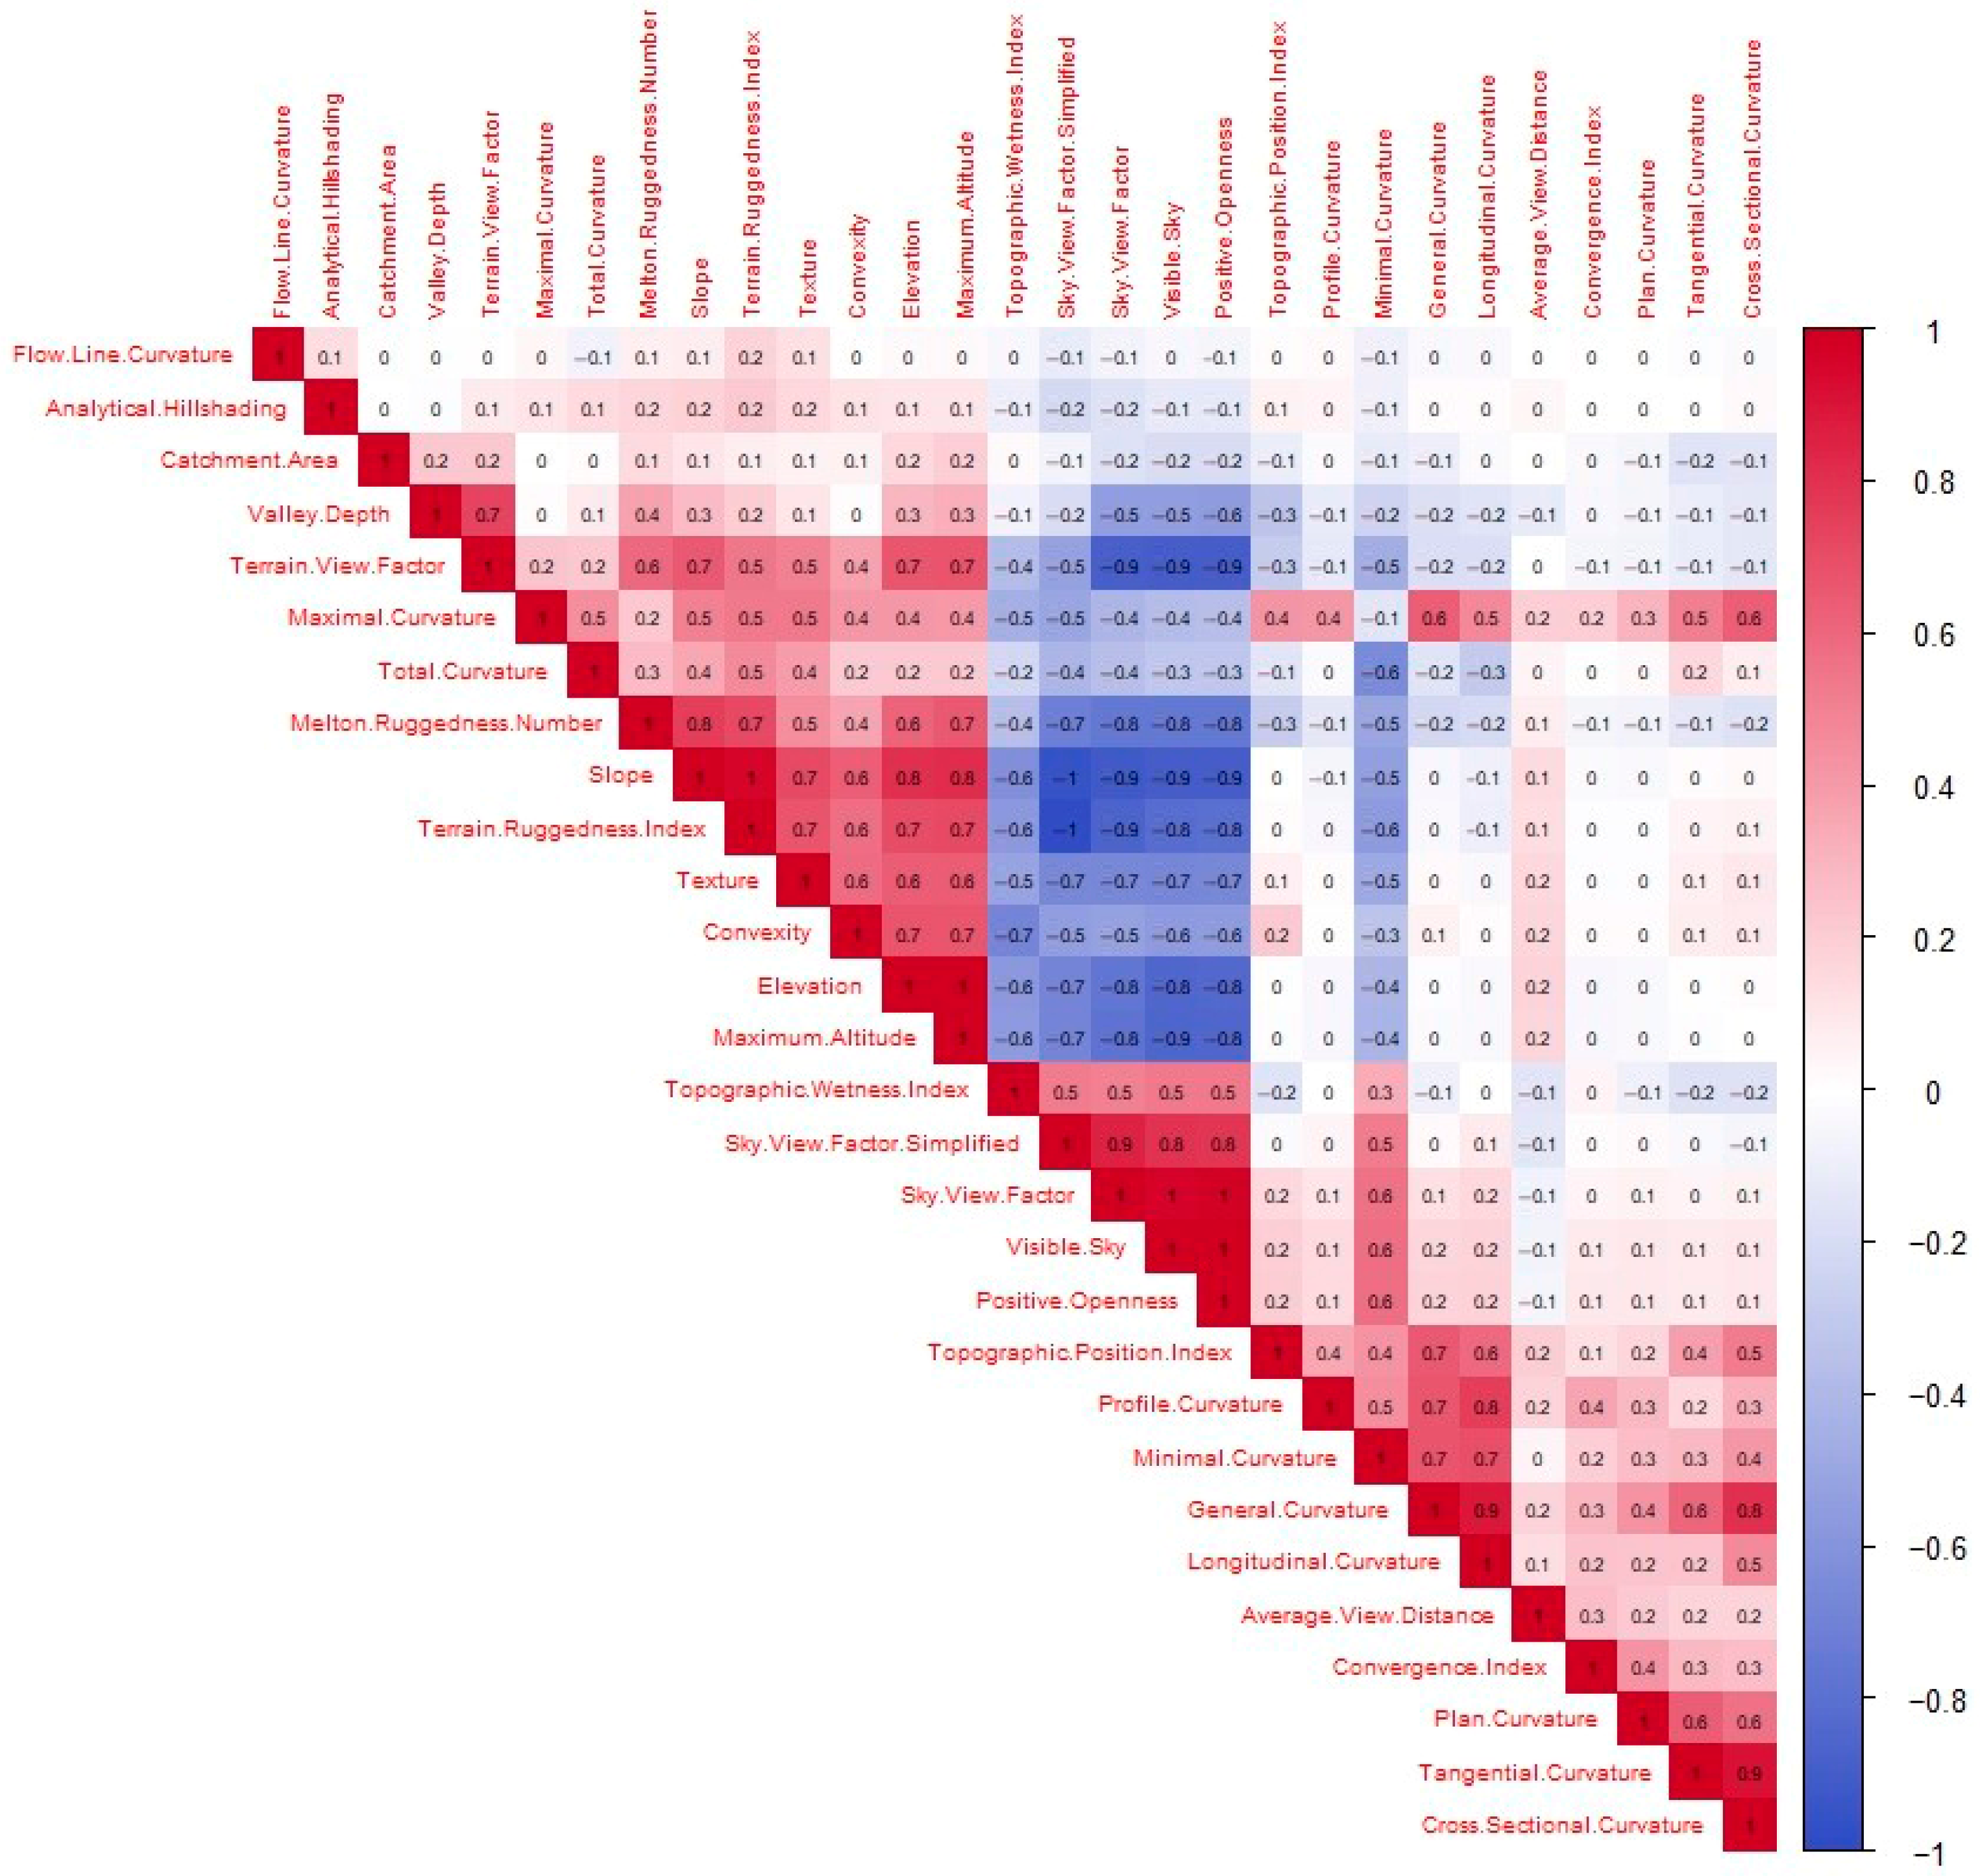
In this section, the classification results are discussed by examining the role of geomorphometric parameters, model performance, spatial generalizability, and differences from conventional climate classification methods. For this purpose, Pearson correlation coefficients among the geomorphometric parameters were investigated in Figure 6. Thirteen of the geomorphometric parameters used in the analyses were determined to be highly correlated. These highly correlated parameters were grouped, and a representative geomorphometric parameter was selected from each group. This selection resulted in data set of 21 geomorphometric parameters.
To evaluate the impact of removing highly correlated geomorphometric parameters on classification performance, classification analyses were carried out using two different feature sets. These included: (1) a reduced set of 21 parameters after removing highly correlated variables (r > 0.80), and (2) a further reduced set of 20 parameters, obtained by excluding elevation from the 21-variable group. Table 6 summarizes the classification performance of the RF, SVM, and KNN algorithms on the analyzed datasets.
Classification results obtained from both the full dataset and the reduced dataset, in which highly correlated variables (including elevation) were retained, showed very similar performance metrics. This indicates that certain highly correlated parameters can be removed without significantly affecting model accuracy. However, when elevation was also excluded from the reduced set of 21 parameters, a decrease was observed in the performance metrics of the RF, SVM, and KNN algorithms. This result suggests that maximum altitude and elevation play a critical role in classification accuracy and highlights their importance as key predictors in classifying climate-driven geomorphic provinces.
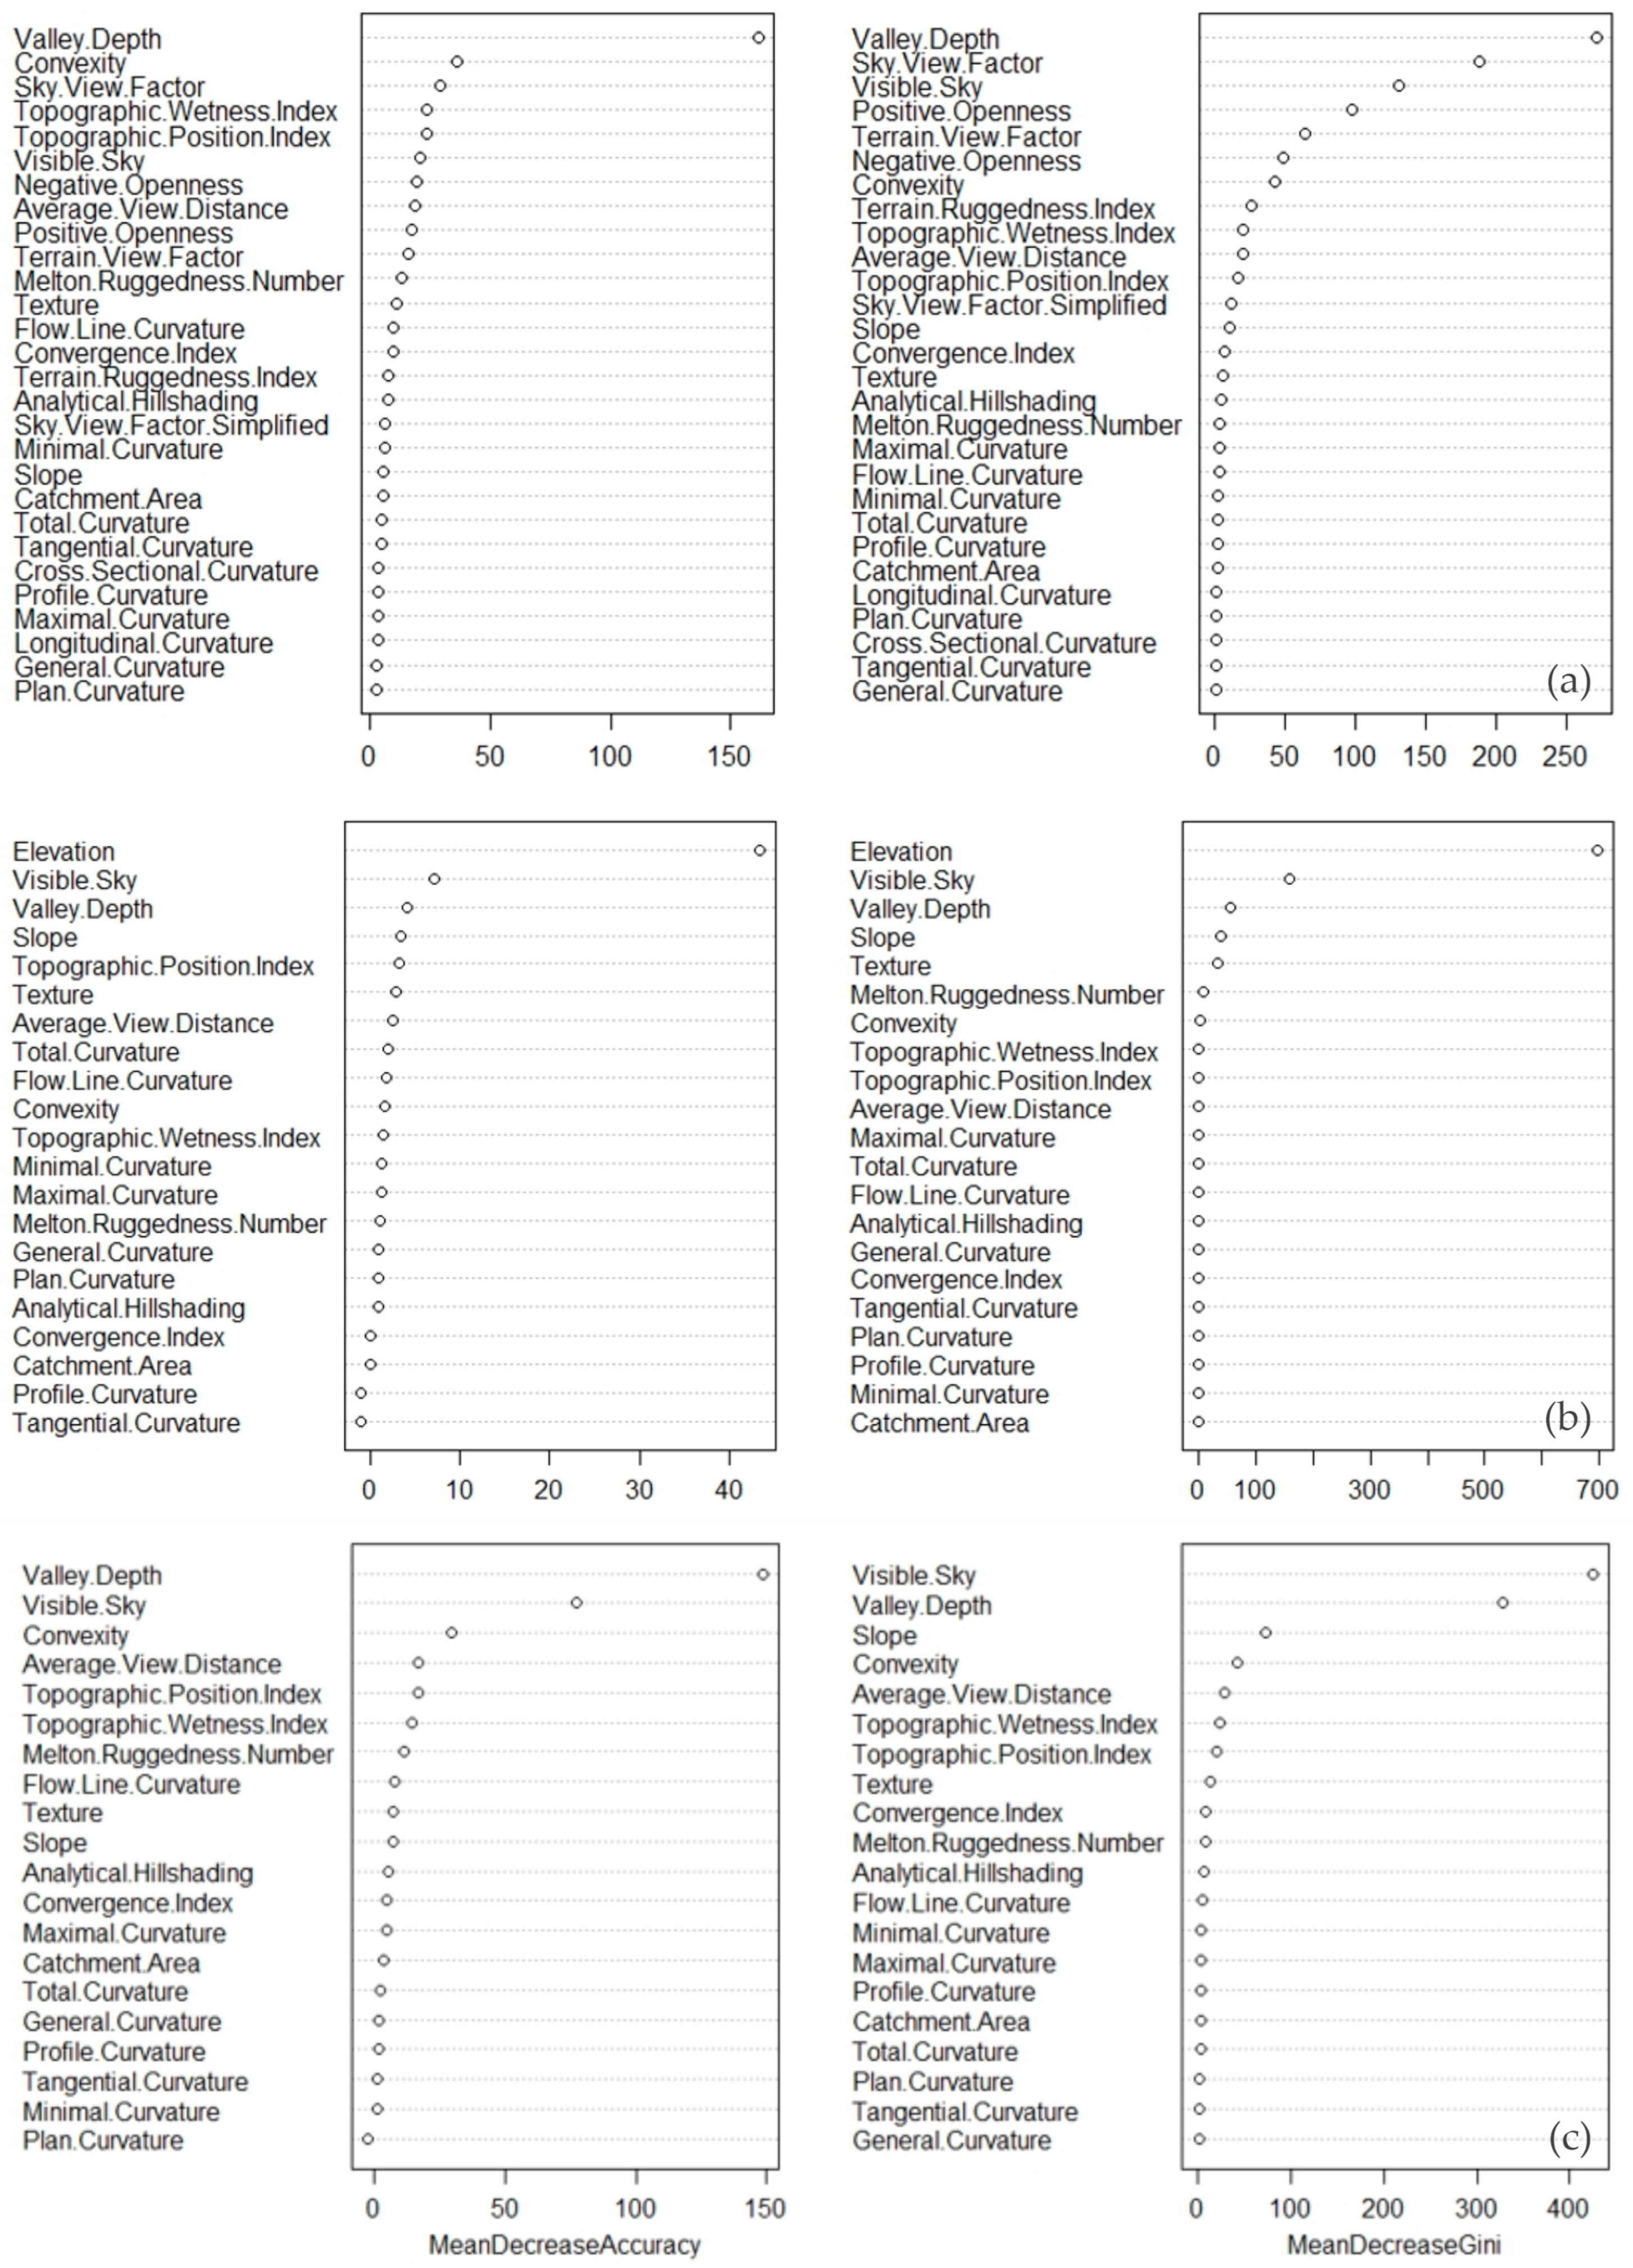
To evaluate the impact of removing highly correlated geomorphometric parameters to better understand the importance of geomorphometric parameters, classification analyses and feature importance assessments were conducted using three different feature sets. These included: (1) a reduced set of 28 parameters obtained by removing maximum altitude and elevation from the 30-variable group, (2) a reduced set of 21 parameters after excluding highly correlated variables (r > 0.80), and (3) a further reduced set of 20 parameters obtained by removing elevation from the 21-variable group. Figure 7 presents the classification performance results of feature importance analyses using the MDA and MDG, showing how geomorphometric parameters’ importances distinguish climate conditions.
Feature importance analysis based on MDA and MDG values revealed consistent but varying patterns across different geomorphometric parameter configurations (Figure 7). After removing maximum altitude and elevation from full dataset (Figure 7a), valley depth, convexity, sky view factor, topographic wetness index, topographic position index, visible sky, negative openness, average view distance, positive openness, terrain view factor, and terrain ruggedness index continued to exhibit relatively higher importance in distinguishing climate classes. In the dataset where highly correlated parameters were excluded (Figure 7b), elevation, visible sky, valley depth, slope, topographic position index, texture, and Melton ruggedness number formed the next most important group. Lastly, when elevation was removed from the reduced 21-parameter set (Figure 7c), valley depth, visible sky, convexity, slope, average view distance, topographic position index, and topographic wetness index became the most sensitive predictors.
The effects of geomorphometric parameters in classifying climate-driven geomorphic provinces may vary depending on factors such as the study area’s scale, geographical distribution, and elevation ranges. Cold climate conditions are usually associated with mountainous regions, where the altitude increases compared to lower elevations. In contrast, temperate or arid climates are generally found at lower elevations. As a result of the classification analyses, determining maximum altitude and elevation parameters as important parameters in distinguishing climate classes is directly related to this situation. Valley areas located in mountainous regions may show unique microclimate characteristics contrary to regional climate conditions. The importance of the valley depth parameter in distinguishing climate classes is related to this issue. Although this study only used geomorphometric variables because of their classification potential, we recognize that environmental factors such as distance to the sea and latitude also directly influence climate. These factors will be considered as additional parameters in future studies. Future studies should investigate climate-landform relationships by examining parameter sensitivity in various geographical areas, taking into account regional differences.
In contrast to geomorphometry-based classification, traditional methods such as the K-G system have several limitations. K-G climate classification method, one of the climate classification methods currently used in the literature, classifies climate conditions using temperature and precipitation data obtained from meteorological stations [33,37,38,68,90] and grid-based data sets [34,35,36]. The spatial locations of meteorological stations do not fully represent the Earth’s surface, and low spatial resolution grid-based data reduces the details of climate classification results. This leads to inaccuracies in climate classification, particularly in underrepresented or complex terrains. This situation causes deficiencies in classification of climate conditions due to the use of regions with no stations, sparse stations [33,37,38,39], and low spatial resolution data [34,35,38,39,40]. Moreover, the disadvantage of studies using point-based station data is that temperature and precipitation values do not fully reflect real conditions because of topography [36]. Another disadvantage of this approach is that the resulting maps are generalized and low-resolution. In global data studies, generalizations and exaggerated values cause errors in distinguishing and classifying climate zones [36]. In this context, it is evident that K-G climate classifications derived from both station data and low-resolution grid data sets have certain limitations.
Although high classification accuracies were achieved in this study, two primary strategies were employed to minimize the risk of overfitting: the use of repeated k-fold cross-validation during model training and the application of an entirely independent test dataset from separate study areas. In order to ensure geographical independence in the analyses, the Salt Lake Basin, Kızılırmak Delta, and Cilo Mountains were used only for training, while Akşehir-Eber Lakes, Yeşilırmak Delta, and Karagöl Mountains were used for testing. In this way, it was ensured that the model was validated with data that were not used in model training and were completely spatially different from the training data. This spatially independent validation strengthens the credibility and generalizability of the model. However, broader spatial evaluations would help to better assess the generalizability of the models.
High-resolution DEMs such as ALOS PALSAR improve the representation of variations in topography. Digital elevation models to be used in analyses have different limitations. In areas with complex geomorphological structures, it may be challenging to associate geomorphometric parameters with climate classes. In addition, as the resolution of the DEMs to be used improves, the requirements for calculating the numerical values of geomorphometric parameters increase. For similar reasons, DEM selection should be based on the scale of the study area and geomorphological detail. For future studies, the choice of DEM to be used in generating geomorphometric parameters should be related to the study’s scale.
Different features, such as temperature, precipitation, and geological rock types, that can be associated with climate classes can be used in conjunction with geomorphometric parameters in future studies. Satellite-based meteorological data (MODIS, CHIRPS, GPM, etc.), such as temperature and precipitation, can be used as feature data to distinguish climate classes. The erosion and deposition processes that occur under the influence of climate conditions on the Earth show similarities in similar geological units. For this reason, it will be important to include geological features such as rock types and lithology maps as feature data in future studies, especially in classification analysis in geologically diverse regions.
This study proposes a new approach that aims to distinguish climate-driven geomorphic provinces based solely on geomorphometric parameters and demonstrates the potential usability of these parameters in landform-based climate analysis. In this study we do not classify climate classes using temperature and precipitation. We are using climate-driven geomorphometric parameters and supervised classification methods to distinguish geomorphic provinces. The results obtained from the study show that climate-driven geomorphic provinces can be effectively distinguished using geomorphometric parameters and machine learning techniques.
Climatic geomorphology is a discipline that investigates the effects of climate conditions on landforms and explains geomorphological processes in relation to climate conditions [151,152]. However, this study takes the reverse approach by trying to estimate the climate class of a given region based on geomorphometric parameters. In this context, the proposed methodology is based on the theoretical framework of climatic geomorphology but offers a numerically driven analytical approach that proceeds in reverse. This inversion of the traditional climatic geomorphology logic presents a novel form of reverse engineering for understanding climate from terrain. Therefore, it can be considered as a kind of reverse engineering in the context of geomorphological analysis.
The high accuracy and kappa values obtained in this study can be explained by both the methodological design and the direct distinguishing characteristics of the selected study areas. The training and test datasets contain sample points representing three different climate classes (arid, temperate, cold), selected from spatially independent areas. Arid regions are represented by former lake basins and terraces representing past lake levels, while temperate climates are represented by flat delta plains, and cold climates by mountainous areas with glacial landforms such as glacial cirque lakes, cirques, and U-shaped valleys. These areas were considered typical geomorphologic areas (type localities). Geomorphometric parameters from these types of localities are clearly distinctive. For this reason, the performance values obtained from machine learning models are very high. This suggests that the generalization capacity of the developed models is high and that high performances can be obtained in this study to show the spatial variation in climate classes at a regional scale in larger areas.
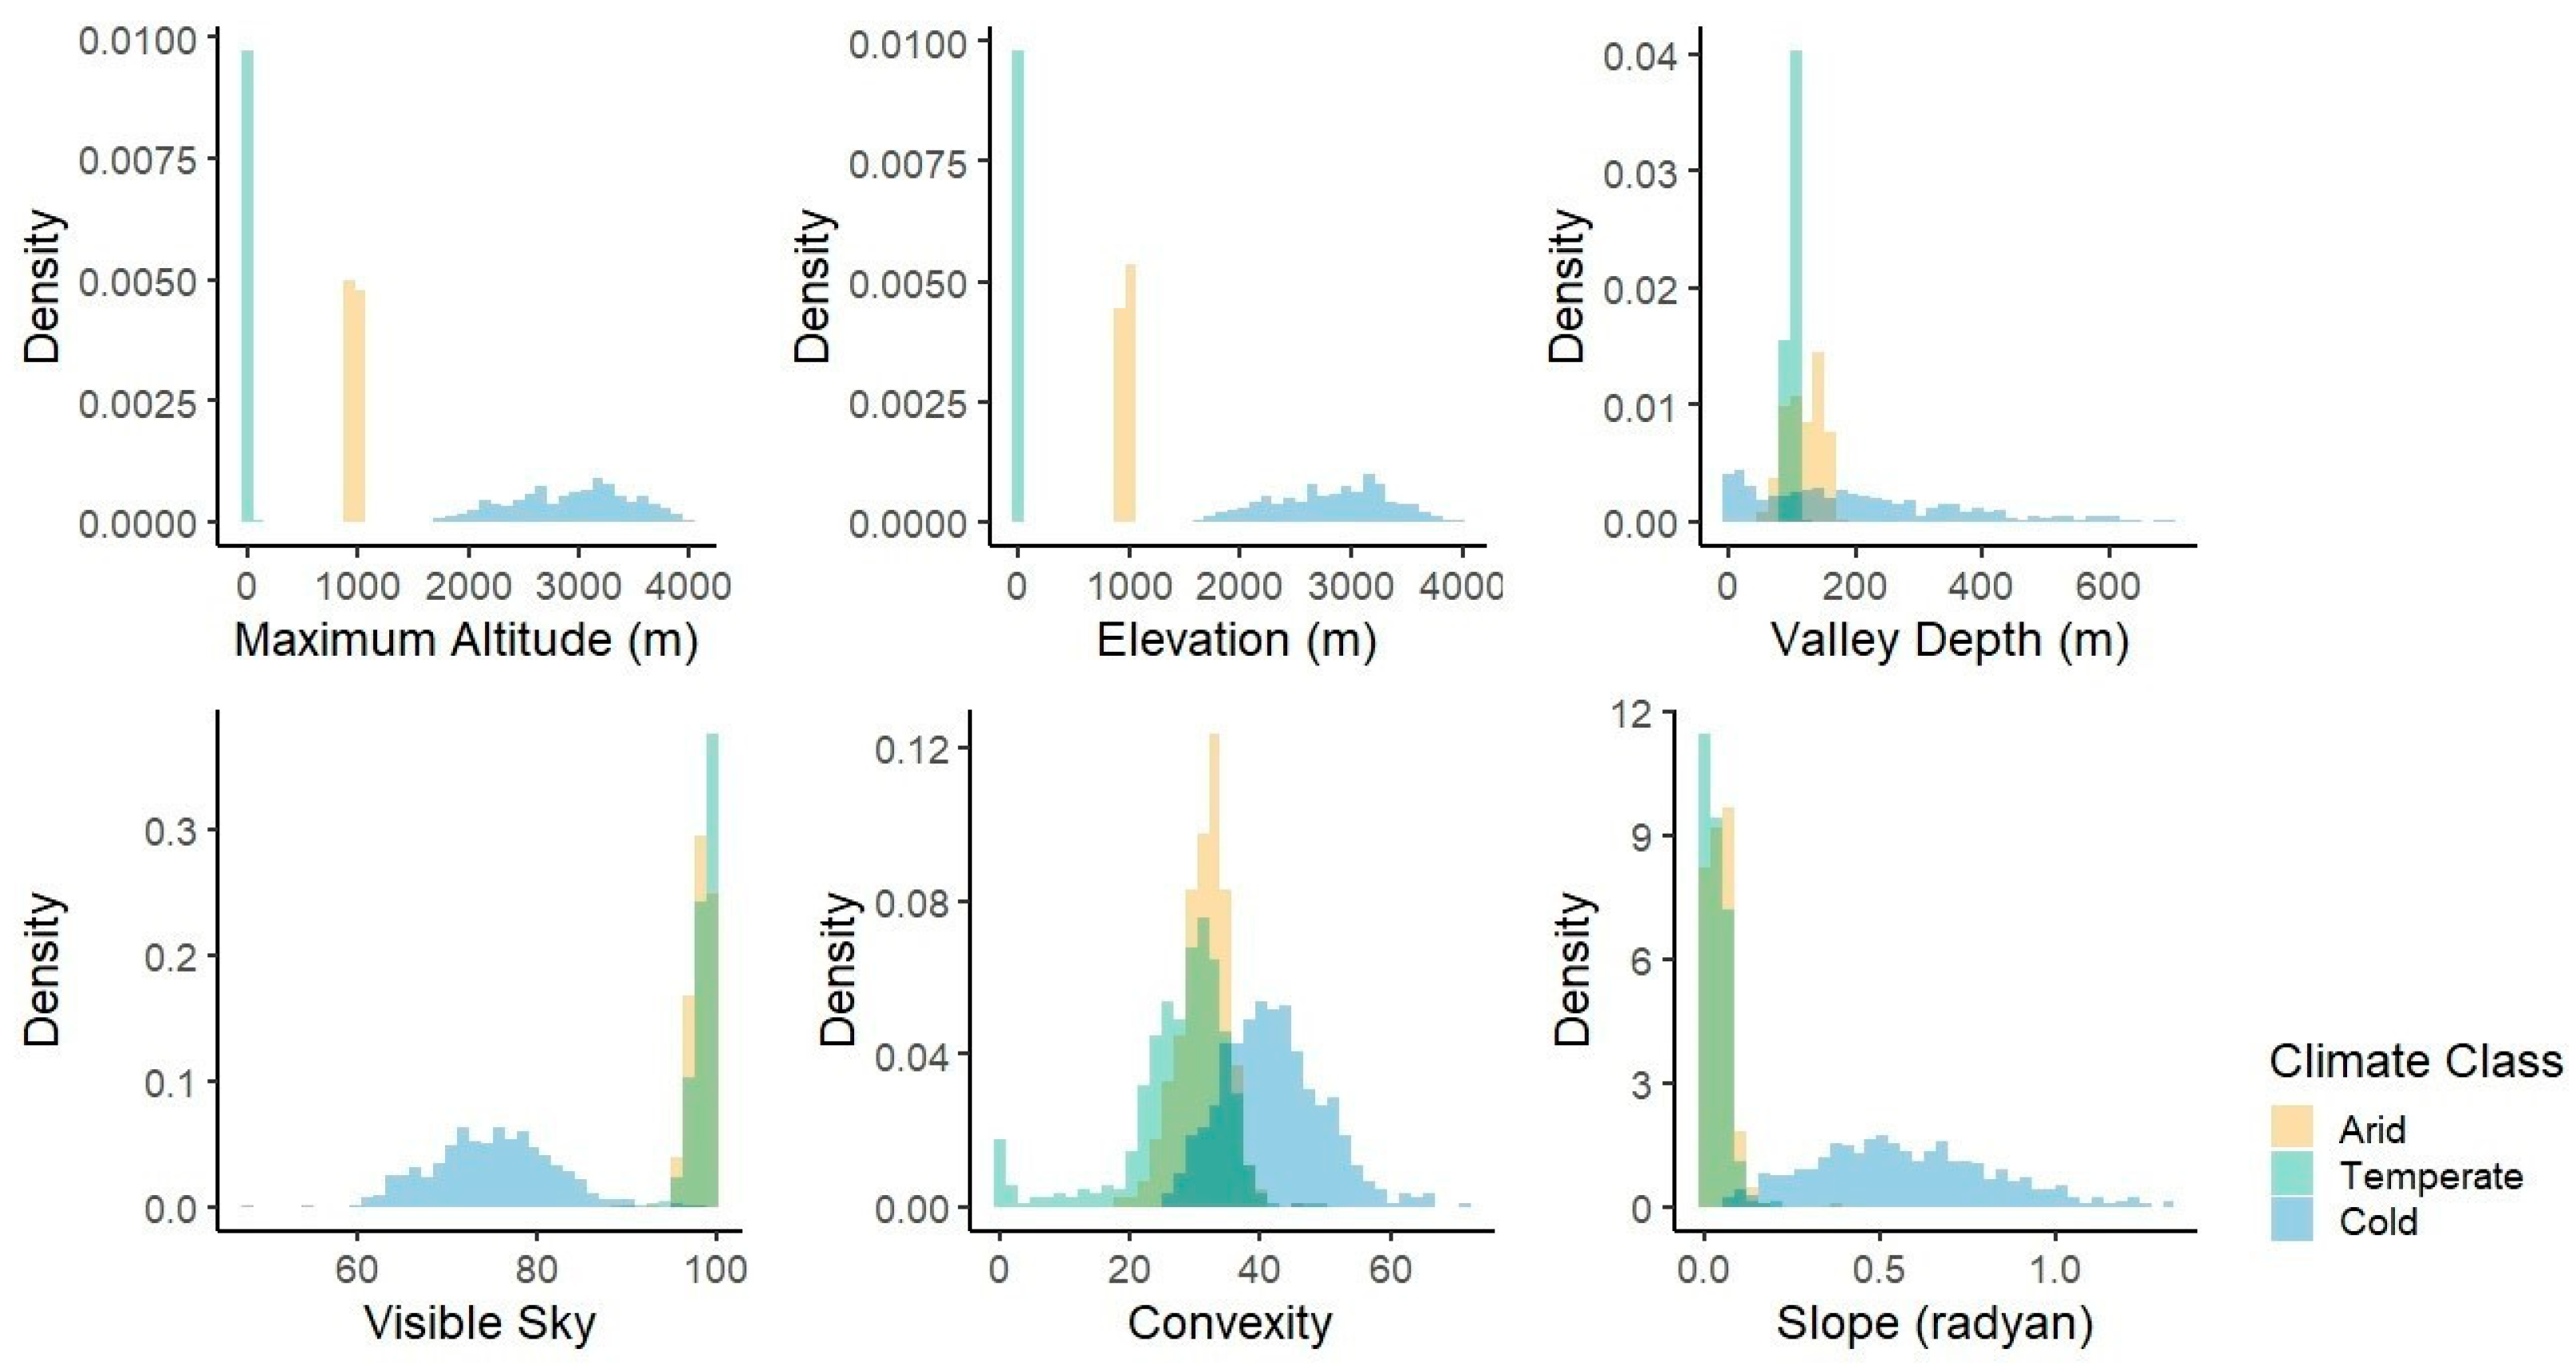
According to the results obtained in the study, the clear distinction between the geomorphic regions used in the analyses can be attributed to geomorphological characteristics specific to climatic conditions. The distribution patterns of maximum altitude, elevation, valley depth, visible sky, convexity, and slope parameters differ for arid, temperate, and cold climate conditions (Figure 8). When the distribution patterns of maximum elevation and elevation parameters were examined, no overlapping was observed for each climatic condition. This explains the high classification performance achieved when maximum elevation and elevation parameters were included. The lower performance values obtained from the classification analyses, excluding these two parameters, are related to the data distributions of other parameters that represent climatic conditions.
This study can be considered a proof of concept developed under ideal geomorphological conditions. The areas used in this study are geomorphic regions characterized by diverse landforms formed under different climatic conditions. In this context, classification models can more easily identify patterns and achieve high-performance results. For this reason, climatic transition zones, complex geomorphologies influenced by tectonic activity and lithologic diversity, will result in less distinguishable class boundaries. Thus, studies in geomorphologically complex areas may cause lower classification results.
However, the relationship between landforms and climate classes may decrease in geomorphologically complex or transitional regions. Therefore, it would be appropriate to evaluate the ability of geomorphometric parameters to distinguish climate classes in more complex regions. The results obtained in this study reflect the climate classification performance for the typical geomorphological regions selected for analysis. Future studies should test this approach by including areas with more heterogeneous landforms. For future studies, this method is planned to be applied to the Anatolian Peninsula (Asia Minor).
While the current study focuses on distinguishing climate-driven geomorphic provinces using geomorphometric parameters, this method contributes to the identification of microclimate conditions in future studies. In geomorphologically complex or transitional regions, geomorphometric parameters alone may not be able to distinguish microclimate conditions. In addition to the geomorphometric parameters used in the method, other variables such as meteorological data, geological data, and remote sensing indices may be necessary to determine microclimate conditions. In this context, the method used in this study may contribute to the determination of climate conditions and microclimates across larger areas, or to the climate of regions experiencing gradual climate transitions.

5. Conclusions

In this study, machine learning based classification analyses were performed by associating the main K-G climate classes observed in Türkiye with geomorphometric parameters bearing traces of climate conditions. In this context, it is concluded that machine learning algorithms can distinguish between climate-driven geomorphic provinces using geomorphometric parameters. These study results refer to the classification of the sample point’s locations only, and no spatial evaluation was performed.
As a result of the feature selection analysis of the geomorphometric parameters used in the study, the maximum altitude, elevation, and valley depth parameters are the parameters of high importance in distinguishing climate classes, although their relative importance may vary depending on regional topographic and climatic characteristics.

Supplementary Materials

The following supporting information can be downloaded at https://www.mdpi.com/article/10.3390/app15189894/s1, TerraClim.R: R code used in the analyses (.R); train.csv: train dataset (.csv); test.csv: testi dataset (.csv).

Author Contributions

Conceptualization, H.B.Ö. and E.P.; data curation, H.B.Ö.; methodology, H.B.Ö. and E.P.; software, H.B.Ö.; formal analysis, H.B.Ö.; visualization, H.B.Ö.; validation, E.P.; writing—original draft preparation, H.B.Ö.; writing—review & editing, H.B.Ö. and E.P.; supervision, E.P. All authors have read and agreed to the published version of the manuscript.

Funding

This research received no external funding.

Data Availability Statement

The data and R code used in this study have been uploaded as Supplementary Materials.

Acknowledgments

This study is derived from Hasan Burak Özmen’s PhD dissertation entitled “Evaluation of Geomorphometric Parameters Produced Using Remote Sensing and Geographic Information Systems in Terms of Climate”, supervised by Emrah Pekkan in the Department of Remote Sensing and Geographical Information Systems, Eskisehir Technical University, Institute of Graduate School. The authors would like to thank Hakan Ahmet Nefeslioglu for his constructive comments on the manuscript.

Conflicts of Interest

The authors declare no conflicts of interest.

Abbreviations

The following abbreviations are used in this manuscript:
DEMDigital Elevation Model
RSRemote Sensing
GISGeographic Information Systems
K-GKöppen-Geiger
RFRandom Forest
SVMSupport Vector Machines
KNNK Nearest Neighbors
SRSSimple Random Sampling
LGPLGNU Lesser General Public License
MDAMean Decrease Accuracy
MDGMean Decrease Gini

References

  1. Evans, I.S. General Geomorphometry, Derivatives of Altitude, and Descriptive Statistics. In Spatial Analysis in Geomorphology; Methuen: London, UK, 1972; pp. 17–90. [Google Scholar]
  2. Hengl, T.; Reuter, H.I. Geomorphometry: Concepts, Software, Applications; Newnes: Oxford, UK, 2008; ISBN 978-0-08-092188-4. [Google Scholar]
  3. Pike, R.J.; Evans, I.S.; Hengl, T. Chapter 1 Geomorphometry: A Brief Guide. In Developments in Soil Science; Hengl, T., Reuter, H.I., Eds.; Geomorphometry; Elsevier: Amsterdam, The Netherlands, 2009; Volume 33, pp. 3–30. [Google Scholar]
  4. Hutchinson, M.F.; Gallant, J.C. Digital Elevation Models and Representation of Terrain Shape. In Terrain Analysis: Principles and Applications; Wiley: Hoboken, NJ, USA, 2000; pp. 29–50. [Google Scholar]
  5. Xiong, L.; Li, S.; Tang, G.; Strobl, J. Geomorphometry and Terrain Analysis: Data, Methods, Platforms and Applications. Earth-Sci. Rev. 2022, 233, 104191. [Google Scholar] [CrossRef]
  6. Bishop, M.P.; James, L.A.; Shroder, J.F.; Walsh, S.J. Geospatial Technologies and Digital Geomorphological Mapping: Concepts, Issues and Research. Geomorphology 2012, 137, 5–26. [Google Scholar] [CrossRef]
  7. Amatulli, G.; McInerney, D.; Sethi, T.; Strobl, P.; Domisch, S. Geomorpho90m, Empirical Evaluation and Accuracy Assessment of Global High-Resolution Geomorphometric Layers. Sci. Data 2020, 7, 162. [Google Scholar] [CrossRef]
  8. Sofia, G. Combining Geomorphometry, Feature Extraction Techniques and Earth-Surface Processes Research: The Way Forward. Geomorphology 2020, 355, 107055. [Google Scholar] [CrossRef]
  9. Borji, M.; Samani, A.N.; Rashidi, S.; Tiefenbacher, J.P. Catchment-Scale Soil Conservation: Using Climate, Vegetation, and Topo-Hydrological Parameters to Support Decision Making and Implementation. Sci. Total Environ. 2020, 712, 136124. [Google Scholar] [CrossRef] [PubMed]
  10. De Caires, S.A.; Keshavarzi, A.; Leonel Bottega, E.; Kaya, F. Towards Site-Specific Management of Soil Organic Carbon: Comparing Support Vector Machine and Ordinary Kriging Approaches Based on Pedo-Geomorphometric Factors. Comput. Electron. Agric. 2024, 216, 108545. [Google Scholar] [CrossRef]
  11. Ke, X.; Wang, W.; Niu, F.; Gao, Z. Investigating Soil Properties and Their Effects on Freeze-Thaw Processes in a Thermokarst Lake Region of Qinghai-Tibet Plateau, China. Eng. Geol. 2024, 342, 107734. [Google Scholar] [CrossRef]
  12. McCullagh, M.J. Terrain and Surface Modelling Systems: Theory and Practice. Photogramm. Rec. 1988, 12, 747–779. [Google Scholar] [CrossRef]
  13. Moore, I.D.; Grayson, R.B.; Ladson, A.R. Digital Terrain Modelling: A Review of Hydrological, Geomorphological, and Biological Applications. Hydrol. Process. 1991, 5, 3–30. [Google Scholar] [CrossRef]
  14. Shary, P.A.; Kuryakova, G.A.; Florinsky, I.V. On the International Experience of Topographic Methods Employment in Landscape Researches (the Concise Review). In The Geometry of the Earth Surface Structures; Pushchino Research Centre Press: Pushchino, Russia, 1991; pp. 15–29. [Google Scholar]
  15. Florinsky, I.V. Combined Analysis of Digital Terrain Models and Remotely Sensed Data in Landscape Investigations. Prog. Phys. Geogr. Earth Environ. 1998, 22, 33–60. [Google Scholar] [CrossRef]
  16. Florinsky, I.V. An Illustrated Introduction to General Geomorphometry. Prog. Phys. Geogr. Earth Environ. 2017, 41, 723–752. [Google Scholar] [CrossRef]
  17. Pike, R.J. Geomorphometry-Diversity in Quantitative Surface Analysis. Prog. Phys. Geogr. Earth Environ. 2000, 24, 1–20. [Google Scholar] [CrossRef]
  18. Pike, R.J. Digital Terrain Modelling and Industrial Surface Metrology—Converging Crafts. Int. J. Mach. Tools Manuf. 2001, 41, 1881–1888. [Google Scholar] [CrossRef]
  19. Li, J.; Zhao, Y.; Bates, P.; Neal, J.; Tooth, S.; Hawker, L.; Maffei, C. Digital Elevation Models for Topographic Characterisation and Flood Flow Modelling along Low-Gradient, Terminal Dryland Rivers: A Comparison of Spaceborne Datasets for the Río Colorado, Bolivia. J. Hydrol. 2020, 591, 125617. [Google Scholar] [CrossRef]
  20. Zandsalimi, Z.; Barbosa, S.A.; Alemazkoor, N.; Goodall, J.L.; Shafiee-Jood, M. Deep Learning-Based Downscaling of Global Digital Elevation Models for Enhanced Urban Flood Modeling. J. Hydrol. 2025, 653, 132687. [Google Scholar] [CrossRef]
  21. Shary, P.A.; Sharaya, L.S.; Mitusov, A.V. Fundamental Quantitative Methods of Land Surface Analysis. Geoderma 2002, 107, 1–32. [Google Scholar] [CrossRef]
  22. Böhner, J.; Antonić, O. Chapter 8 Land-Surface Parameters Specific to Topo-Climatology. In Developments in Soil Science; Hengl, T., Reuter, H.I., Eds.; Geomorphometry; Elsevier: Amsterdam, The Netherlands, 2009; Volume 33, pp. 195–226. [Google Scholar]
  23. Prasicek, G.; Otto, J.-C.; Montgomery, D.R.; Schrott, L. Multi-Scale Curvature for Automated Identification of Glaciated Mountain Landscapes. Geomorphology 2014, 209, 53–65. [Google Scholar] [CrossRef]
  24. Skentos, A. Topographic Position Index Based Landform Analysis of Messaria (Ikaria Island, Greece). Acta Geobalcanica 2018, 4, 7–15. [Google Scholar] [CrossRef]
  25. Kılıç Gül, F. Geomorphometry-Automatic Landform Classification. J. Geogr. 2018, 36, 15–26. [Google Scholar] [CrossRef]
  26. Li, S.; Xiong, L.; Tang, G.; Strobl, J. Deep Learning-Based Approach for Landform Classification from Integrated Data Sources of Digital Elevation Model and Imagery. Geomorphology 2020, 354, 107045. [Google Scholar] [CrossRef]
  27. Dyba, K. Explanation of the Influence of Geomorphometric Variables on the Landform Classification Based on Selected Areas in Poland. Sci. Rep. 2024, 14, 5447. [Google Scholar] [CrossRef] [PubMed]
  28. Martonne, E. de Nouvelle carte mondial de l’indice d’aridité. Ann. Géographie 1942, 51, 241–250. [Google Scholar] [CrossRef]
  29. Thornthwaite, C.W. An Approach toward a Rational Classification of Climate. Geogr. Rev. 1948, 38, 55–94. [Google Scholar] [CrossRef]
  30. Trewartha, G.T.; Horn, L.H.; Sale, R.D. An Introduction to Climate; McGraw-Hill: New York, NY, USA, 1954; Volume 402. [Google Scholar]
  31. Köppen, W.; Geiger, R. Klima Der Erde (Climate of the Earth) Wall Map; Klett-Perthes: Gotha, FL, USA, 1954. [Google Scholar]
  32. Köppen, W. Klassifikation Der Klimate Nach Temperatur, Niederschlag. Jahreslauf. Pet. Mitt. 1918, 64, 243. [Google Scholar]
  33. Öztürk, M.Z.; Çetinkaya, G.; Aydın, S. Climate Types of Turkey According to Köppen-Geiger Climate Classification. J. Geogr. 2017, 35, 17–27. [Google Scholar]
  34. Beck, H.E.; Zimmermann, N.E.; McVicar, T.R.; Vergopolan, N.; Berg, A.; Wood, E.F. Present and Future Köppen-Geiger Climate Classification Maps at 1-Km Resolution. Sci. Data 2018, 5, 180214. [Google Scholar] [CrossRef]
  35. Beck, H.E.; McVicar, T.R.; Vergopolan, N.; Berg, A.; Lutsko, N.J.; Dufour, A.; Zeng, Z.; Jiang, X.; Van Dijk, A.I.J.M.; Miralles, D.G. High-Resolution (1 Km) Köppen-Geiger Maps for 1901–2099 Based on Constrained CMIP6 Projections. Sci. Data 2023, 10, 724. [Google Scholar] [CrossRef]
  36. Taşoğlu, E.; Öztürk, M.Z.; Yazıcı, Ö. High Resolution Köppen-Geiger Climate Zones of Türkiye. Int. J. Climatol. 2024, 44, 5248–5265. [Google Scholar] [CrossRef]
  37. Kottek, M.; Grieser, J.; Beck, C.; Rudolf, B.; Rubel, F. World Map of the Köppen-Geiger Climate Classification Updated. Meteorol. Z. 2006, 15, 259–263. [Google Scholar] [CrossRef] [PubMed]
  38. Peel, M.C.; Finlayson, B.L.; McMahon, T.A. Updated World Map of the Köppen-Geiger Climate Classification. Hydrol. Earth Syst. Sci. 2007, 11, 1633–1644. [Google Scholar] [CrossRef]
  39. Rubel, F.; Kottek, M. Observed and Projected Climate Shifts 1901–2100 Depicted by World Maps of the Köppen-Geiger Climate Classification. Meteorol. Z. 2010, 19, 135. [Google Scholar] [CrossRef]
  40. Hobbi, S.; Michael Papalexiou, S.; Rupa Rajulapati, C.; Nerantzaki, S.D.; Markonis, Y.; Tang, G.; Clark, M.P. Detailed Investigation of Discrepancies in Köppen-Geiger Climate Classification Using Seven Global Gridded Products. J. Hydrol. 2022, 612, 128121. [Google Scholar] [CrossRef]
  41. Erinç, S. The Climates of Turkey According to Thornthwaite’s Classifications. Ann. Assoc. Am. Geogr. 1949, 39, 26–46. [Google Scholar] [CrossRef]
  42. Zeroual, A.; Assani, A.A.; Meddi, M.; Alkama, R. Assessment of Climate Change in Algeria from 1951 to 2098 Using the Köppen–Geiger Climate Classification Scheme. Clim. Dyn. 2019, 52, 227–243. [Google Scholar] [CrossRef]
  43. He, H.; Luo, G.; Cai, P.; Hamdi, R.; Termonia, P.; De Maeyer, P.; Kurban, A.; Li, J. Assessment of Climate Change in Central Asia from 1980 to 2100 Using the Köppen-Geiger Climate Classification. Atmosphere 2021, 12, 123. [Google Scholar] [CrossRef]
  44. Akçar, N.; Yavuz, V.; Ivy-Ochs, S.; Kubik, P.W.; Vardar, M.; Schlüchter, C. Paleoglacial Records from Kavron Valley, NE Turkey: Field and Cosmogenic Exposure Dating Evidence. Quat. Int. 2007, 164–165, 170–183. [Google Scholar] [CrossRef]
  45. Sarıkaya, M.A.; Çiner, A.; Zreda, M. Quaternary Glaciations of Turkey. In Developments in Quaternary Sciences; Elsevier: Amsterdam, The Netherlands, 2011; pp. 393–403. [Google Scholar]
  46. Reber, R.; Akçar, N.; Yesilyurt, S.; Yavuz, V.; Tikhomirov, D.; Kubik, P.W.; Schlüchter, C. Glacier Advances in Northeastern Turkey before and during the Global Last Glacial Maximum. Quat. Sci. Rev. 2014, 101, 177–192. [Google Scholar] [CrossRef]
  47. Dede, V.; Çiçek, I.; Sarıkaya, M.A.; Çiner, A.; Uncu, L. First Cosmogenic Geochronology from the Lesser Caucasus: Late Pleistocene Glaciation and Rock Glacier Development in the Karçal Valley, NE Turkey. Quat. Sci. Rev. 2017, 164, 54–67. [Google Scholar] [CrossRef]
  48. Sarikaya, M.A.; Çiner, A. Late Pleistocene Glaciations and Paleoclimate of Turkey. Bull. Miner. Res. Explor. 2015, 151, 107–127. [Google Scholar] [CrossRef]
  49. Kuzucuoğlu, C.; Çiner, A.; Kazancı, N. The Geomorphological Regions of Turkey. In World Geomorphological Landscapes; Springer International Publishing: Cham, Switzerland, 2019; pp. 41–178. ISBN 978-3-030-03513-6. [Google Scholar]
  50. Sarıkaya, M.A.; Çiner, A. Ice in Paradise: Glacial Heritage Landscapes of Anatolia. In World Geomorphological Landscapes; Springer International Publishing: Cham, Switzerland, 2019; pp. 397–411. ISBN 978-3-030-03513-6. [Google Scholar]
  51. Azzoni, R.S.; Bollati, I.M.; Pelfini, M.; Sarıkaya, M.A.; Zerboni, A. Geomorphology of a Recently Deglaciated High Mountain Area in Eastern Anatolia (Turkey). J. Maps 2022, 18, 258–267. [Google Scholar] [CrossRef]
  52. Çılğın, Z.; Evans, I.S.; Keserci, F.; Canpolat, E.; Bayrakdar, C. Morphometric Characteristics of Glacial Cirques and Former Glaciers in the Geyik Mountains, Western Taurus, Türkiye. Geomorphology 2024, 467, 109474. [Google Scholar] [CrossRef]
  53. Bayrakdar, C.; Çılğın, Z.; Sarış, F.; Yeşilyurt, S.; Keserci, F.; Büyükdeniz, Y.; Halis, O.; Vockenhuber, C.; Ivy-Ochs, S.; Akçar, N. Late Pleistocene Glacial History of Mount Karadağ, SW Türkiye. Geomorphology 2024, 467, 109467. [Google Scholar] [CrossRef]
  54. Doğan, U. Climate-Controlled River Terrace Formation in the Kızılırmak Valley, Cappadocia Section, Turkey: Inferred from Ar–Ar Dating of Quaternary Basalts and Terraces Stratigraphy. Geomorphology 2011, 126, 66–81. [Google Scholar] [CrossRef]
  55. Turoğlu, H. Kızılırmak Deltası ve Yakın Çevresinin Jeomorfolojik Özellikleri ve Insan Yaşamındaki Etkileri. Anadolu Araştırmaları 2010, 19, 99–111. [Google Scholar]
  56. Kuzucuoğlu, C. Geomorphological Landscapes in the Konya Plain and Surroundings. In World Geomorphological Landscapes; Springer International Publishing: Cham, Switzerland, 2019; pp. 353–368. ISBN 978-3-030-03513-6. [Google Scholar]
  57. Özsayın, E.; Gürbüz, A.; Kuzucuoğlu, C.; Erdoğu, B. Salted Landscapes in the Tuz Gölü (Central Anatolia): The End Stage of a Tertiary Basin. In World Geomorphological Landscapes; Springer International Publishing: Cham, Switzerland, 2019; pp. 339–351. ISBN 978-3-030-03513-6. [Google Scholar]
  58. Whittaker, A.C. How Do Landscapes Record Tectonics and Climate? Lithosphere 2012, 4, 160–164. [Google Scholar] [CrossRef]
  59. Scheingross, J.S.; Limaye, A.B.; McCoy, S.W.; Whittaker, A.C. The Shaping of Erosional Landscapes by Internal Dynamics. Nat. Rev. Earth Environ. 2020, 1, 661–676. [Google Scholar] [CrossRef]
  60. Westaway, R.; Pringle, M.; Yurtmen, S.; Demir, T.; Bridgland, D.; Rowbotham, G.; Maddy, D. Pliocene and Quaternary Regional Uplift in Western Turkey: The Gediz River Terrace Staircase and the Volcanism at Kula. Tectonophysics 2004, 391, 121–169. [Google Scholar] [CrossRef]
  61. Çiner, A.; Doğan, U.; Yıldırım, C.; Akçar, N.; Ivy-Ochs, S.; Alfimov, V.; Kubik, P.W.; Schlüchter, C. Quaternary Uplift Rates of the Central Anatolian Plateau, Turkey: Insights from Cosmogenic Isochron-Burial Nuclide Dating of the Kızılırmak River Terraces. Quat. Sci. Rev. 2015, 107, 81–97. [Google Scholar] [CrossRef]
  62. Karakoca, E.; Uncu, L.; Sarikaya, M.A.; Şahiner, E.; Köse, O. Geomorphology and Chronology of Late Quaternary Terrace Staircases of the Sakarya River, Northwest Türkiye. J. Quat. Sci. 2025, 40, 386–399. [Google Scholar] [CrossRef]
  63. Çiner, A. Turkish Glaciers and Glacial Deposits. In Developments in Quaternary Sciences; Elsevier: Amsterdam, The Netherlands, 2004; Volume 2, pp. 419–429. ISBN 978-0-444-51462-2. [Google Scholar]
  64. Köse, O.; Sarıkaya, M.A.; Çiner, A.; Candaş, A. Late Quaternary Glaciations and Cosmogenic 36Cl Geochronology of Mount Dedegöl, South-West Turkey. J. Quat. Sci. 2019, 34, 51–63. [Google Scholar] [CrossRef]
  65. Altınay, O.; Sarıkaya, M.A.; Çiner, A. Late-Glacial to Holocene Glaciers in the Turkish Mountains. Med. Geosc. Rev. 2020, 2, 119–133. [Google Scholar] [CrossRef]
  66. Evans, I.S.; Çılğın, Z.; Bayrakdar, C.; Canpolat, E. The Form, Distribution and Palaeoclimatic Implications of Cirques in Southwest Turkey (Western Taurus). Geomorphology 2021, 391, 107885. [Google Scholar] [CrossRef]
  67. Berndt, C.; Frenzel, P.; Çiner, A.; Ertunç, G.; Yıldırım, C. Holocene Marginal Marine Ostracod Successions from the Kızılırmak River Delta; Implications for Depositional Environments and Sea-Level Changes at the Southern Black Sea Coast. Sediment. Geol. 2019, 382, 103–121. [Google Scholar] [CrossRef]
  68. Yılmaz, E.; Çiçek, İ. Detailed Köppen-Geiger Climate Regions of Turkey. J. Hum. Sci. 2018, 15, 225–242. [Google Scholar] [CrossRef]
  69. Chen, R.-C.; Dewi, C.; Huang, S.-W.; Caraka, R.E. Selecting Critical Features for Data Classification Based on Machine Learning Methods. J. Big Data 2020, 7, 52. [Google Scholar] [CrossRef]
  70. Sheykhmousa, M.; Mahdianpari, M.; Ghanbari, H.; Mohammadimanesh, F.; Ghamisi, P.; Homayouni, S. Support Vector Machine Versus Random Forest for Remote Sensing Image Classification: A Meta-Analysis and Systematic Review. IEEE J. Sel. Top. Appl. Earth Obs. Remote Sens. 2020, 13, 6308–6325. [Google Scholar] [CrossRef]
  71. Zafari, A.; Zurita-Milla, R.; Izquierdo-Verdiguier, E. A Multiscale Random Forest Kernel for Land Cover Classification. IEEE J. Sel. Top. Appl. Earth Obs. Remote Sens. 2020, 13, 2842–2852. [Google Scholar] [CrossRef]
  72. Giaccone, E.; Oriani, F.; Tonini, M.; Lambiel, C.; Mariéthoz, G. Using Data-Driven Algorithms for Semi-Automated Geomorphological Mapping. Stoch. Environ. Res. Risk Assess. 2022, 36, 2115–2131. [Google Scholar] [CrossRef] [PubMed]
  73. Xu, J.; Chen, C.; Zhou, S.; Hu, W.; Zhang, W. Land Use Classification in Mine-Agriculture Compound Area Based on Multi-Feature Random Forest: A Case Study of Peixian. Front. Sustain. Food Syst. 2024, 7, 1335292. [Google Scholar] [CrossRef]
  74. Baccari, N.; Hamza, M.H.; Slama, T.; Sebei, A.; Ouerghi, S.; Elsheikh, R.; Rebai, N.; Hasanean, H.; Almazroui, M.; Elhag, M. Assessment of Machine Learning Techniques in Mapping Land Use/Land Cover Changes in a Semi-Arid Environment. Earth Syst. Env. 2025, 9, 519–539. [Google Scholar] [CrossRef]
  75. Breiman, L. Random Forests. Mach. Learn. 2001, 45, 5–32. [Google Scholar] [CrossRef]
  76. Breiman, L. Manual on Setting up, Using, and Understanding Random Forests v3. 1. Stat. Dep. Univ. Calif. Berkeley CA USA 2002, 1, 3–42. [Google Scholar]
  77. Cortes, C.; Vapnik, V. Support-Vector Networks. Mach. Learn. 1995, 20, 273–297. [Google Scholar] [CrossRef]
  78. Cover, T.; Hart, P. Nearest Neighbor Pattern Classification. IEEE Trans. Inform. Theory 1967, 13, 21–27. [Google Scholar] [CrossRef]
  79. Erol, O. Dördüncü Çağ (Kuvaterner) Jeoloji ve Jeomorfolojisinin Ana Çizgileri; Ankara Üniversitesi Dil ve Tarih-Coğrafya Fakültesi Basımevi: Ankara, Turkey, 1979. [Google Scholar]
  80. Varol, B.; Akiska, E. Evaporitler. In Kuvaterner Bilimi; Ankara Üniversitesi: Ankara, Turkey, 2012; pp. 361–388. ISBN 978-605-136-056-0. [Google Scholar]
  81. Bahadır, M. Akşehir Gölü’nde Alansal Değişimlerin Uzaktan Algilama Teknikleri İle Belirlenmesi. Marmara Coğrafya Derg. 2013, 28, 246–275. [Google Scholar]
  82. Atalay, İ. Sultandağları ile Akşehir ve Eber Gölleri Havzalarının Strüktüral, Jeomorfolojik ve Toprak Erozyonu Etüdü. Ph.D. Thesis, Atatürk Üniversitesi Basımevi, Erzurum, Turkey, 1977. [Google Scholar]
  83. İnandık, H. Sinop-Terme Arasındaki Kıyıların Morfolojik Etüdü. Türk Coğrafya Derg. 1957, 17, 51–71. [Google Scholar]
  84. Yalçınlar, İ. Samsun Bölgesinin Neojen ve Kuaterner Kıyı Depoları. İstanbul Üniver. Coğrafya Enstitüsü Derg. 1958, 9, 11–21. [Google Scholar]
  85. Köksal, A. Bafra Ovasının Coğrafya Etüdü; Üniversitesi Basımevi: İstanbul, Turkey, 1972; Volume 220. [Google Scholar]
  86. Atalay Dutucu, A. Yeşilırmak Deltası’nda Jeomorfolojik Değişiklikler ve Gelecek ile Ilgili Öngörüler. Ph.D. Thesis, İstanbul Üniversitesi: Sosyal Bilimler Enstitüsü, İstanbul, Turkey, 2016. [Google Scholar]
  87. Erinç, S. Glacial Evidences of the Climatic Variations in Turkey. Geogr. Ann. 1952, 34, 89–98. [Google Scholar] [CrossRef]
  88. Erinç, S. The Present Day Glaciation in Turkey. In Proceedings of the General assembly and 17th International Congress of the International Geographical Union, 8th Proceedings, Washington, DC, USA, 8–15 August 1952; pp. 326–330. [Google Scholar]
  89. Çiner, A. Recent Glaciers and Late Quaternary Glacial Deposits of Turkey. Geol. Bull. Turk. 2003, 46, 56–78. [Google Scholar]
  90. Yılmaz, E.; Çiçek, İ. Türkiye’de Köppen-Geiger İklim Tiplerindeki Zamanmekansal Değişimler. Ank. Üniver. Tar.-Coğrafya Fakültesi Derg. 2019, 59, 181–202. [Google Scholar] [CrossRef]
  91. Conrad, O.; Bechtel, B.; Bock, M.; Dietrich, H.; Fischer, E.; Gerlitz, L.; Wehberg, J.; Wichmann, V.; Böhner, J. System for Automated Geoscientific Analyses (SAGA) v. 2.1.4. Geosci. Model Dev. 2015, 8, 1991–2007. [Google Scholar] [CrossRef]
  92. Liaw, A.; Wiener, M. Classification and Regression by randomForest. R News 2002, 2, 18–22. [Google Scholar]
  93. Meyer, D.; Dimitriadou, E.; Hornik, K.; Weingessel, A.; Leisch, F.; Chang, C.-C.; Lin, C.-C.; Meyer, M.D. Package ‘E1071’. R J. 2019, 1–67. [Google Scholar]
  94. Kuhn, M. Building Predictive Models in R Using the Caret Package. J. Stat. Softw. 2008, 28, 1–26. [Google Scholar] [CrossRef]
  95. ASF DAAC. ALOS PALSAR High Resolution Radiometric Terrain Corrected Product 2014. [CrossRef]
  96. Weifeng, X.; Jun, L.; Dailiang, P.; Jinge, J.; Hongxuan, X.; Hongyue, Y.; Jun, Y. Multi-source DEM accuracy evaluation based on ICESat-2 in Qinghai-Tibet Plateau, China. Int. J. Digit. Earth 2024, 17, 2297843. [Google Scholar] [CrossRef]
  97. Xu, W.; Li, J.; Peng, D.; Yin, H.; Jiang, J.; Xia, H.; Wen, D. Vertical Accuracy Assessment and Improvement of Five High-Resolution Open-Source Digital Elevation Models Using ICESat-2 Data and Random Forest: Case Study on Chongqing, China. Remote Sens. 2024, 16, 1903. [Google Scholar] [CrossRef]
  98. Travis, M.R. VIEWIT: Computation of Seen Areas, Slope, and Aspect for Land-Use Planning; Pacific Southwest Forest and Range Experiment Station, Forest Service, USA: Berkley, CA, USA, 1975; Volume 11. [Google Scholar]
  99. Tarboton, D.G. A New Method for the Determination of Flow Directions and Upslope Areas in Grid Digital Elevation Models. Water Resour. Res. 1997, 33, 309–319. [Google Scholar] [CrossRef]
  100. Horn, B.K.P. Hill Shading and the Reflectance Map. Proc. IEEE 1981, 69, 14–47. [Google Scholar] [CrossRef]
  101. Costa-Cabral, M.C.; Burges, S.J. Digital Elevation Model Networks (DEMON): A Model of Flow over Hillslopes for Computation of Contributing and Dispersal Areas. Water Resour. Res. 1994, 30, 1681–1692. [Google Scholar] [CrossRef]
  102. Heerdegen, R.G.; Beran, M.A. Quantifying Source Areas through Land Surface Curvature and Shape. J. Hydrol. 1982, 57, 359–373. [Google Scholar] [CrossRef]
  103. Olaya, V. Chapter 6 Basic Land-Surface Parameters. In Developments in Soil Science; Elsevier: Amsterdam, The Netherlands, 2009; pp. 141–169. [Google Scholar] [CrossRef]
  104. Zevenbergen, L.W.; Thorne, C.R. Quantitative Analysis of Land Surface Topography. Earth Surf. Process. Landf. 1987, 12, 47–56. [Google Scholar] [CrossRef]
  105. Haralick, R.M. Ridges and Valleys on Digital Images. Comput. Vision Graph. Image Process. 1983, 22, 28–38. [Google Scholar] [CrossRef]
  106. Florinsky, I.V. Computation of the Third-order Partial Derivatives from a Digital Elevation Model. Int. J. Geogr. Inf. Sci. 2009, 23, 213–231. [Google Scholar] [CrossRef]
  107. Beasley, D.B.; Huggins, L.F. Answers-User’s Manual (EPA-905/9-82-001); Environmental Protection Agency Great Lakes National Program Office: Chicago, IL, USA, 1982.
  108. Evans, I.S. An Integrated System of Terrain Analysis and Slope Mapping: Final Report on Grant DA-ERO-591-73-G0040; Durham University: Durham, UK, 1979. [Google Scholar]
  109. Bauer, J.; Rohdenburg, H.; Bork, H. Ein Digitales Reliefmodell Als Vorraussetzung Für Ein Deterministisches Modell Der Wasser-Und Stoff-Flüsse. Landschaftsgenese Landschaftsökologie 1985, 10, 1–15. [Google Scholar]
  110. Tarini, M.; Cignoni, P.; Montani, C. Ambient Occlusion and Edge Cueing for Enhancing Real Time Molecular Visualization. IEEE Trans. Visual. Comput. Graph. 2006, 12, 1237–1244. [Google Scholar] [CrossRef]
  111. Köthe, R.; Lehmeier, F. SARA-System Zur Automatischen Relief-Analyse. User Man. 2 1996, 2. [Google Scholar]
  112. Marchi, L.; Dalla Fontana, G. GIS Morphometric Indicators for the Analysis of Sediment Dynamics in Mountain Basins. Env. Geol. 2005, 48, 218–228. [Google Scholar] [CrossRef]
  113. Melton, M.A. The Geomorphic and Paleoclimatic Significance of Alluvial Deposits in Southern Arizona. J. Geol. 1965, 73, 1–38. [Google Scholar] [CrossRef]
  114. O’Callaghan, J.F.; Mark, D.M. The Extraction of Drainage Networks from Digital Elevation Data. Comput. Vis. Graph. Image Process. 1984, 28, 323–344. [Google Scholar] [CrossRef]
  115. Böhner, J.; Koethe, R.; Conrad, O.; Gross, J.; Ringeler, A.; Selige, T. Soil Regionalisation by Means of Terrain Analysis and Process Parameterisation. Soil Classif. 2001, 7, 213. [Google Scholar]
  116. Böhner, J.; Selige, T. Spatial Prediction of Soil Attributes Using Terrain Analysis and Climate Regionalisation. Gott. Geogr. Abh. 2006, 115, 13–28. [Google Scholar]
  117. Riley, S.; Degloria, S.; Elliot, S.D. A Terrain Ruggedness Index That Quantifies Topographic Heterogeneity. Int. J. Sci. 1999, 5, 23–27. [Google Scholar]
  118. Iwahashi, J.; Pike, R.J. Automated Classifications of Topography from DEMs by an Unsupervised Nested-Means Algorithm and a Three-Part Geometric Signature. Geomorphology 2007, 86, 409–440. [Google Scholar] [CrossRef]
  119. Guisan, A.; Weiss, S.B.; Weiss, A.D. GLM versus CCA Spatial Modeling of Plant Species Distribution. Plant Ecol. 1999, 143, 107–122. [Google Scholar] [CrossRef]
  120. Weiss, A. Topographic Position and Landforms Analysis. In Proceedings of the Poster Presentation, Esri User Conference, San Diego, CA, USA, 9–13 July 2001; Volume 200. [Google Scholar]
  121. Gallant, J.; Wilson, J. Terrain Analysis: Principles and Applications: Primary Topographic Attributes; John Wiley and Sons: Hoboken, NJ, USA, 2000. [Google Scholar]
  122. Oke, T.R. Boundary Layer Climates, 2nd ed.; Routledge: London, UK, 2002; ISBN 978-0-203-40721-9. [Google Scholar]
  123. Häntzschel, J.; Goldberg, V.; Bernhofer, C. GIS-based Regionalisation of Radiation, Temperature and Coupling Measures in Complex Terrain for Low Mountain Ranges. Meteorol. Appl. 2005, 12, 33–42. [Google Scholar] [CrossRef]
  124. Yokoyama, R.; Shirasawa, M.; Pike, R.J. Visualizing Topography by Openness: A New Application of Image Processing to Digital Elevation Models. Photogramm. Eng. Remote Sens. 2002, 68, 257–266. [Google Scholar]
  125. Prima, O.D.A.; Echigo, A.; Yokoyama, R.; Yoshida, T. Supervised Landform Classification of Northeast Honshu from DEM-Derived Thematic Maps. Geomorphology 2006, 78, 373–386. [Google Scholar] [CrossRef]
  126. Anders, N.; Seijmonsbergen, A.; Bouten, W. Multi-Scale and Object-Oriented Image Analysis of High-Res LiDAR Data for Geomorphological Mapping in Alpine Mountains. Proc. Geomorphometry 2009, 31, 61–63. [Google Scholar]
  127. Lohr, S.L. Sampling: Design and Analysis, 3rd ed.; Chapman and Hall/CRC: New York, NY, USA, 2021; ISBN 978-0-429-29889-9. [Google Scholar]
  128. Wadoux, A.M.J.-C.; Brus, D.J. How to Compare Sampling Designs for Mapping? Eur. J. Soil Sci. 2021, 72, 35–46. [Google Scholar] [CrossRef]
  129. Cabello-Solorzano, K.; Ortigosa de Araujo, I.; Peña, M.; Correia, L.; Tallón-Ballesteros, A.J. The Impact of Data Normalization on the Accuracy of Machine Learning Algorithms: A Comparative Analysis. In Proceedings of the 18th International Conference on Soft Computing Models in Industrial and Environmental Applications (SOCO 2023), Salamanca, Spain, 5–7 September 2023; García Bringas, P., Pérez García, H., Martínez de Pisón, F.J., Martínez Álvarez, F., Troncoso Lora, A., Herrero, Á., Calvo Rolle, J.L., Quintián, H., Corchado, E., Eds.; Springer Nature: Cham, Switzerland, 2023; pp. 344–353. [Google Scholar]
  130. Ou, G.; Zhu, Z.; Dong, B. Introduction to Data Science; World Scientific: Singapore, 2023. [Google Scholar]
  131. Gutierrez, D.D. Machine Learning and Data Science: An Introduction to Statistical Learning Methods with R; Technics Publications: Sedona, AZ, USA, 2015. [Google Scholar]
  132. Nokeri, T.C. Data Science Revealed: With Feature Engineering, Data Visualization, Pipeline Development, and Hyperparameter Tuning; Apress: Berkeley, CA, USA, 2021; ISBN 978-1-4842-6869-8. [Google Scholar] [CrossRef]
  133. Shalev-Shwartz, S.; Ben-David, S. Understanding Machine Learning: From Theory to Algorithms; Cambridge University Press: Cambridge, UK, 2014; ISBN 9781107298019. [Google Scholar] [CrossRef]
  134. Bartz, E.; Bartz-Beielstein, T.; Zaefferer, M.; Mersmann, O. Hyperparameter Tuning for Machine and Deep Learning with R: A Practical Guide; Springer Nature: Singapore, 2023; ISBN 978-981-19-5169-5. [Google Scholar] [CrossRef]
  135. Pham, K.; Kim, D.; Park, S.; Choi, H. Ensemble Learning-Based Classification Models for Slope Stability Analysis. CATENA 2021, 196, 104886. [Google Scholar] [CrossRef]
  136. Zhang, P.; Yin, Z.-Y.; Jin, Y.-F.; Liu, X.-F. Modelling the Mechanical Behaviour of Soils Using Machine Learning Algorithms with Explicit Formulations. Acta Geotech. 2022, 17, 1403–1422. [Google Scholar] [CrossRef]
  137. Ghezelbash, R.; Maghsoudi, A.; Shamekhi, M.; Pradhan, B.; Daviran, M. Genetic Algorithm to Optimize the SVM and K-Means Algorithms for Mapping of Mineral Prospectivity. Neural Comput. Appl. 2023, 35, 719–733. [Google Scholar] [CrossRef]
  138. Team, R.C. R: A Language and Environment for Statistical Computing; Foundation for Statistical Computing: Vienna, Austria, 2013. [Google Scholar]
  139. Team, R.C. R: A Language and Environment for Statistical Computing and Graphics. Found. Stat. Comput. 2022. [Google Scholar]
  140. Cohen, J. A Coefficient of Agreement for Nominal Scales. Educ. Psychol. Meas. 1960, 20, 37–46. [Google Scholar] [CrossRef]
  141. Viera, A.J.; Garrett, J.M. Understanding Interobserver Agreement: The Kappa Statistic. Fam. Med. 2005, 37, 360–363. [Google Scholar]
  142. Bhattacharya, S. A Primer on Machine Learning in Subsurface Geosciences; Springer Briefs in Petroleum Geoscience & Engineering; Springer International Publishing: Cham, Switzerland, 2021; ISBN 978-3-030-71767-4. [Google Scholar]
  143. Lin, Y.; Guo, J. Fuzzy Geospatial Objects—Based Wetland Remote Sensing Image Classification: A Case Study of Tianjin Binhai New Area. Int. J. Appl. Earth Obs. Geoinf. 2024, 132, 104051. [Google Scholar] [CrossRef]
  144. Shah, C. A Hands-On Introduction to Data Science. Available online: https://www.cambridge.org/highereducation/books/a-hands-on-introduction-to-data-science/9D55C29C653872F13289EA7909953842 (accessed on 15 July 2025).
  145. Siqueira, R.G.; Veloso, G.V.; Fernandes-Filho, E.I.; Francelino, M.R.; Schaefer, C.E.G.R.; Corrêa, G.R. Evaluation of Machine Learning Algorithms to Classify and Map Landforms in Antarctica. Earth Surf. Process. Landf. 2022, 47, 367–382. [Google Scholar] [CrossRef]
  146. Rainio, O.; Teuho, J.; Klén, R. Evaluation Metrics and Statistical Tests for Machine Learning. Sci. Rep. 2024, 14, 6086. [Google Scholar] [CrossRef] [PubMed]
  147. Goodling, P.; Belitz, K.; Stackelberg, P.; Fleming, B. A Spatial Machine Learning Model Developed from Noisy Data Requires Multiscale Performance Evaluation: Predicting Depth to Bedrock in the Delaware River Basin, USA. Environ. Model. Softw. 2024, 179, 106124. [Google Scholar] [CrossRef]
  148. Han, H.; Guo, X.; Yu, H. Variable Selection Using Mean Decrease Accuracy and Mean Decrease Gini Based on Random Forest. In Proceedings of the 2016 7th IEEE International Conference on Software Engineering and Service Science (ICSESS), Beijing, China, 26–28 August 2016; IEEE: Beijing, China, 2016; pp. 219–224. [Google Scholar]
  149. Pouyan, S.; Pourghasemi, H.R.; Bordbar, M.; Rahmanian, S.; Clague, J.J. A Multi-Hazard Map-Based Flooding, Gully Erosion, Forest Fires, and Earthquakes in Iran. Sci. Rep. 2021, 11, 14889. [Google Scholar] [CrossRef]
  150. Scornet, E. Trees, Forests, and Impurity-Based Variable Importance in Regression. Ann. Inst. H. Poincaré Probab. Statist. 2023, 59, 21–52. [Google Scholar] [CrossRef]
  151. Derbyshire, E. (Ed.) Climatic Geomorphology; Macmillan Education UK: London, UK, 1973; ISBN 978-0-333-13653-9. [Google Scholar]
  152. Gutierrez, M.; Benito, G. Climatic Geomorphology; Elsevier: Amsterdam, The Netherlands, 2005. [Google Scholar]
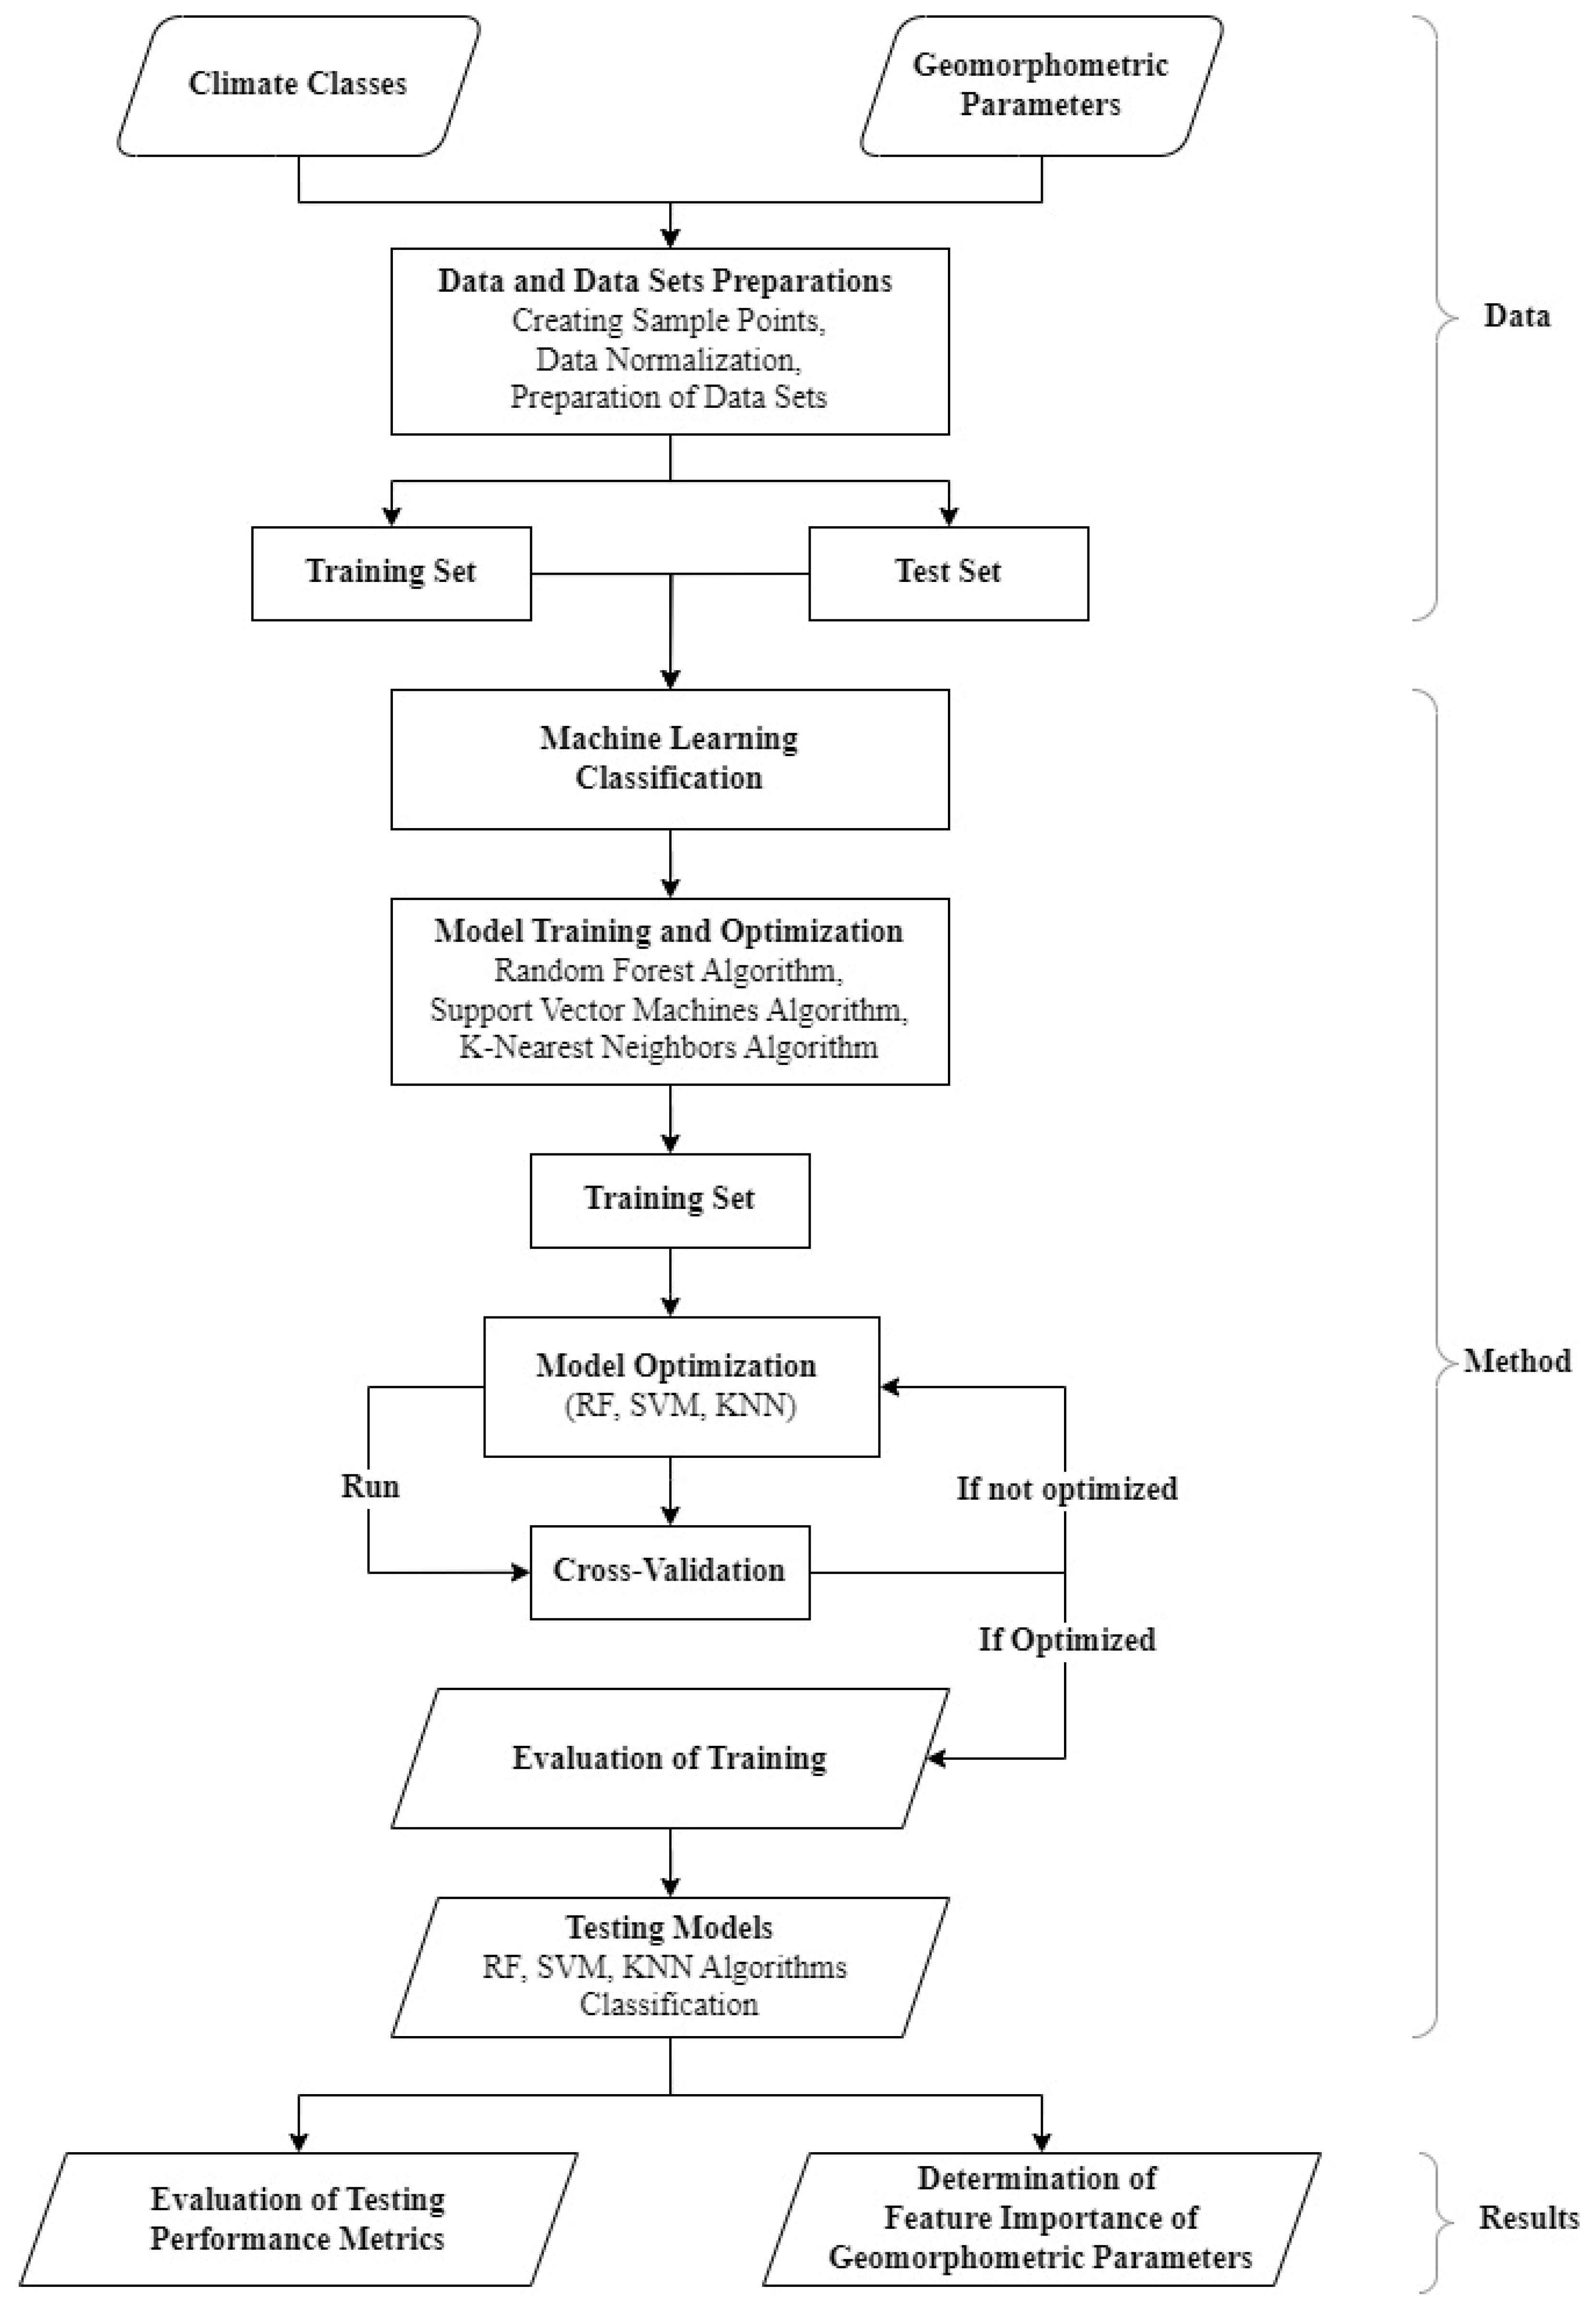
Figure 1. Flow Chart of the Study.
Applsci 15 09894 g001
Figure 2. This figure represents the study areas selected for model training and testing. The red and blue square areas indicate the training and the test areas. Additionally, letters displayed in different colors within the study areas represent distinct climate classes. Orange, green, and blue letters represent arid, temperate, and cold climate classes.
Applsci 15 09894 g002
Figure 3. Study areas selected for different climate conditions and sampling points distributions. These are the study areas representing (a,b) arid; (c,d) temperate; and (e,f) cold climate conditions. The different colored sample points within the study areas represent climate classes. Orange, green, and blue dots represent arid, temperate, and cold climate classes.
Applsci 15 09894 g003
Figure 4. This figure shows the classification results of sample points in the arid, temperate, and cold climate classes of the test area: (ac) RF, (df) SVM and (gi) KNN. Orange points represent arid, green points represent temperate, and blue points represent cold climate classes. Smaller points in the figure represent sample points where the climate classes in the study areas were correctly classified, while larger points represent sample points that were incorrectly classified.
Applsci 15 09894 g004
Figure 5. Feature importance of all geomorphometric parameters according to MDA and MDG.
Applsci 15 09894 g005
Figure 6. Pearson correlation matrix of all geomorphometric parameters.
Applsci 15 09894 g006
Figure 7. Feature importance according to MDA and MDG for different variable configurations: (a) full dataset excluding maximum altitude and elevation; (b) dataset after removing highly correlated variables (r > 0.80); and (c) reduced dataset from (b) with elevation excluded.
Applsci 15 09894 g007
Figure 8. Distribution patterns of maximum altitude, elevation, valley depth, visible sky, convexity, and slope among arid, temperate, and cold climate classes.
Applsci 15 09894 g008
Table 1. Main climate classes according to the K-G climate classification method [33,68,90].
K-G Climate Classes Observed in TürkiyeDescription
BArid
CTemperate
DCold
Table 2. Geomorphometric parameters used in the study.
Geomorphometric ParametersReferences
Height (Elevation)The data source was used to obtain parameters [95].
Slope[98,99,100,101,102,103,104,105,106,107,108,109]
General Curvature
Profile Curvature
Plan Curvature
Tangential Curvature
Longitudinal Curvature
Cross-Sectional Curvature
Minimal Curvature
Maximal Curvature
Total Curvature
Flow Line Curvature
Analytical Hillshading[110]
Convergence Index[111]
Catchment Area[112,113,114]
Maximum Height (Altitude)
Melton Ruggedness Number
Valley Depth
Topographic Wetness Index[115,116]
Terrain Ruggedness Index[117]
Convexity[118]
Texture[118]
Topographic Position Index[119,120,121]
Visible Sky[22,122,123]
Sky View Factor
Sky View Factor Simplified
Terrain View Factor
Average View Distance
Positive Openness[124,125,126]
Negative Openness
Table 3. Descriptive statistical values of geomorphometric parameters.
Geomorphometric ParameternRaw DataNormalized Data
MinMaxMeanMedianMinMaxMeanMedian
Height (Elevation)30001739881185.6174998−11−0.3250−0.4248
Slope300001.32150.17360.0565−11−0.6704−0.8994
General Curvature3000−0.21240.1312−0.00020−110.07020.2000
Profile Curvature3000−0.02180.0195−8.40 × 10−50−110.03580.0563
Plan Curvature3000−0.160.25150.00080−11−0.1074−0.2224
Tangential Curvature3000−0.02420.03205.94 × 10−50−11−0.0394−0.1387
Longitudinal Curvature3000−0.16940.0737−0.00020−110.16530.3425
Cross-Sectional Curvature3000−0.04550.07149.42 × 10−50−11−0.0919−0.2212
Minimal Curvature3000−0.11850.0262−0.0025−0.001−110.42840.5813
Maximal Curvature3000−0.01140.06350.00250.001−11−0.4500−0.5934
Total Curvature300000.01405.28 × 10−51.50 × 10⁻⁵−11−0.9267−0.9971
Flow Line Curvature3000−0.22630.26670.00010−11−0.2877−0.0819
Analytical Hillshading30000.02562.01150.79870.785398−11−0.1058−0.2060
Convergence Index3000−1001000.16260−110.00180
Catchment Area300012.542850223.685312.6513−11−0.9900−1.0000
Maximum Height (Altitude)30002240141213.4611998−11−0.3177−0.4264
Melton Ruggedness Number3000031.14771.54940−11−0.8579−1
Valley Depth30000695.3850100.827182.7508−11−0.6309−0.7124
Topographic Wetness Index30002.798613.32147.65067.2668−11−0.1239−0.3085
Terrain Ruggedness Index3000031.89041.70250.6325−11−0.7839−0.9603
Convexity3000071.382733.636333.0040−110.0767−0.0511
Texture3000020.20320.76420−11−0.9239−1
Topographic Position Index3000−81.445644.4715−0.0796−0.0102−110.12570.2820
Visible Sky300048.208310092.577197.4864−110.61860.9049
Sky View Factor30000.405210.95470.9977−110.79500.9941
Sky View Factor Simplified 30000.623410.97930.9992−110.84680.9947
Terrain View Factor30000.0000010.33350.02450.0015−11−0.8134−0.9943
Average View Distance300020.3125100001820.39221526.6550−11−0.6148−0.6984
Positive Openness30000.75731.59021.45621.5314−110.60120.9166
Negative Openness30000.80341.59291.46521.5327−110.59090.8931
Table 4. Optimum parameters, accuracy, and kappa statistics for RF, SVM, and KNN algorithms.
Model Training/Evaluation Parameters and Training Results
ModelParameterRangesOptimal ValueAccuracy (%)Kappa Value
RFmtry (number of variables tried at each split)1, 2, 3, 4, 5, …, 16101001
RFntree (number of trees)100, 200, 300, …, 1000800
SVMC (regularization parameter)1, 2, 4, 8, 1621001
KNNk (number of neighbors)1, 2, 3, 4, 5, …, 2931001
Table 5. Accuracy, kappa, precision, sensitivity, specificity, and F1 score classification results of all algorithm models.
ModelAccuracy (%)KappaClimate ClassPrecision (%)Sensitivity (%)Specificity (%)F1 Score (%)
RF99.270.99Temperate100.00100.00100.00100.00
Arid100.0097.80100.0098.89
Cold97.85100.0098.9098.91
SVM99.700.99Temperate100.00100.00100.00100.00
Arid100.0099.00100.0099.50
Cold99.01100.0099.5099.50
KNN99.300.99Temperate100.00100.00100.00100.00
Arid99.2098.6099.6098.90
Cold98.6199.2099.3098.90
Table 6. Accuracy, Kappa, precision, sensitivity, specificity, and F1 score classification results of all algorithm models, 21 parameters (after correlation filtering), and 20 parameters (after correlation and elevation removed).
Feature Set
Description
ModelAccuracy (%)KappaClimate ClassPrecision (%)Sensitivity (%)Specificity (%)F1 Score (%)
21 parameters (after correlation filtering)RF98.400.98Temperate100.00100.00100.00100.00
Arid100.0095.20100.0097.54
Cold95.42100.0097.6097.66
SVM99.730.99Temperate100.00100.00100.00100.00
Arid100.0099.20100.0099.60
Cold99.21100.0099.6099.60
KNN99.600.99Temperate100.00100.00100.00100.00
Arid99.6099.2099.8099.40
Cold99.2099.6099.6099.40
20 parameters (after correlation and elevation removed)RF56.070.34Temperate0.700.2086.400.30
Arid40.8468.2050.6051.09
Cold94.5199.8097.1097.08
SVM69.270.53Temperate53.3899.4056.6069.46
Arid100.008.80100.0016.18
Cold94.8699.6097.3097.17
KNN62.130.43Temperate45.8250.4070.2048.00
Arid43.4237.6075.5040.30
Cold95.1698.4097.5095.16
Disclaimer/Publisher’s Note: The statements, opinions and data contained in all publications are solely those of the individual author(s) and contributor(s) and not of MDPI and/or the editor(s). MDPI and/or the editor(s) disclaim responsibility for any injury to people or property resulting from any ideas, methods, instructions or products referred to in the content.