Communication

Simultaneous 4G and 5G EMF Exposure and Field Uniformity in a Reverberation Chamber for Animal Studies

Electronics and Telecommunications Research Institute, 218 Gajeong-ro, Yuseong-gu, Daejeon 34129, Republic of Korea
*
Author to whom correspondence should be addressed.
Appl. Sci. 2025, 15(18), 10286; https://doi.org/10.3390/app151810286
Submission received: 13 August 2025 / Revised: 17 September 2025 / Accepted: 18 September 2025 / Published: 22 September 2025
(This article belongs to the Section Electrical, Electronics and Communications Engineering)

Abstract

The design and validation of a reverberation chamber (RC) specifically constructed for conducting large-scale experimental animal carcinogenicity studies using RF electromagnetic fields (EMF) relevant to contemporary 4G and 5G mobile communication (900 MHz, 2.12 GHz, and 3.65 GHz) is proposed. The RC’s electric field (E-field) uniformity is evaluated under four practical loading conditions: empty, apparatus only, and two apparatus variations with 80 experimental animals (Sprague–Dawley rats) with approximate weights 400 g and 520 g, respectively. Measurement results show E-field uniformity better than 1.36 dB under all test conditions, with frequency-dependent variation becoming negligible once the RC is loaded with cage racks and 80 rats. Additionally, a predictive method is introduced to estimate composite E-field intensities under simultaneous multi-frequency exposures, potentially reducing experimental measurements. These findings confirm that the designed RC is capable of accurately evaluating RF EMF exposure in biological studies.

1. Introduction

Research on cancer associated with RF electromagnetic field (EMF) exposure has attracted public interest and has been designated as one of the priority research subjects by the World Health Organization (WHO) [1]. Previous large-scale animal studies on carcinogenesis—such as those conducted by the National Toxicology Program (NTP) and the Ramazzini Institute—investigated the effects of RF EMF exposure from 2G mobile communication [2,3]. Subsequently, the first international joint animal study was conducted in South Korea and Japan to validate the results of the NTP study [4]. However, 2G mobile communication technologies, such as code division multiple access (CDMA) in the earlier animal studies, are rarely used in modern communication technologies. On the other hand, 5G mobile communication systems operating in the frequency range 1 (FR1) band have spread rapidly. As a result, the EMF exposure environment is predominantly influenced by the simultaneous operation of 4G and 5G mobile communication systems. Such a combined exposure environment has led to increased public interest in carcinogenicity studies under realistic conditions, highlighting the need for research that reflects actual multi-source scenarios.
Therefore, the aim of this study is to develop an RF EMF exposure system that can produce simultaneous exposure to both 4G and 5G modulated signals for use in long-term carcinogenicity studies. This work extends previous research on reverberation chambers (RCs) for animal exposure by evaluating system performance under concurrent 4G and 5G signals exposure conditions [5]. Above all, this is the world-first system specifically designed for large-scale carcinogenicity studies involving simultaneous exposure to multiple frequencies, including 5G FR1 band. The implementation of a multi-frequency RF EMF exposure environment can reflect public concerns by replicating realistic exposure conditions in animal experiments. Based on the measurement result of the downlink EMF exposure collected in 2023 from Seoul [6], we selected 900 MHz, 2.12 GHz, and 3.65 GHz as representative 4G and 5G bands, and using the cumulative distribution function median (50th percentile) downlink electric field (E-field) levels—117.13 dBμV/m, 119.35 dBμV/m, and 117.46 dBμV/m, respectively—derived power-share weights of 27%, 44%, and 29%, which were adopted for the simultaneous exposure condition.
Across recent RC studies, field uniformity has been regarded as a performance indicator and is almost quantified by the standard deviation of the composite E-field over a defined working volume. For example, a novel 3.5 GHz RC design for bioelectromagnetic experiments focusing on uniform field generation is presented [7]. Vibrating intrinsic RCs report standard deviation dropping below 3 dB once the wall-shaking amplitude exceeds about 0.125λ, establishing a practical uniformity target for design and operation [8]. In cylindric RCs, detailed modal analyses near the lowest-usable frequency show typical standard deviation values on the order of 3.6–4.0 dB across the test volume, illustrating the frequency-geometry trade-offs that govern achievable uniformity [9]. Beyond standard deviation analysis, several studies link improved uniformity to design choices, e.g., adequate stirrer rotation volume (about 10% of cavity volume) and statistical goodness-of-fit test to verify a random and isotropic field, both now common practice in RC validation [8,10].
In this paper, we present the design, construction, and comprehensive performance evaluation of the developed RC. To evaluate performance of the animal exposure system, the E-field uniformity inside the RC is assessed at each individual frequency [11,12]. Unlike our previous studies, which were limited to single-frequency exposure at 900 MHz using chamber systems, the proposed study is, to our knowledge, the first worldwide to propose and validate a multi-frequency RC system that incorporates the 5G spectrum for large-scale animal studies. Finally, we discuss the potential utility of a predictive calculation model for estimating E-field intensities and variations in multi-frequency exposure environments, which could reduce the number of repeated E-field measurements and shorten the evaluation time for such complex settings.

2. RC for Multi-Frequency RF Exposure: Design and Installation

2.1. Multi-Frequency RF System

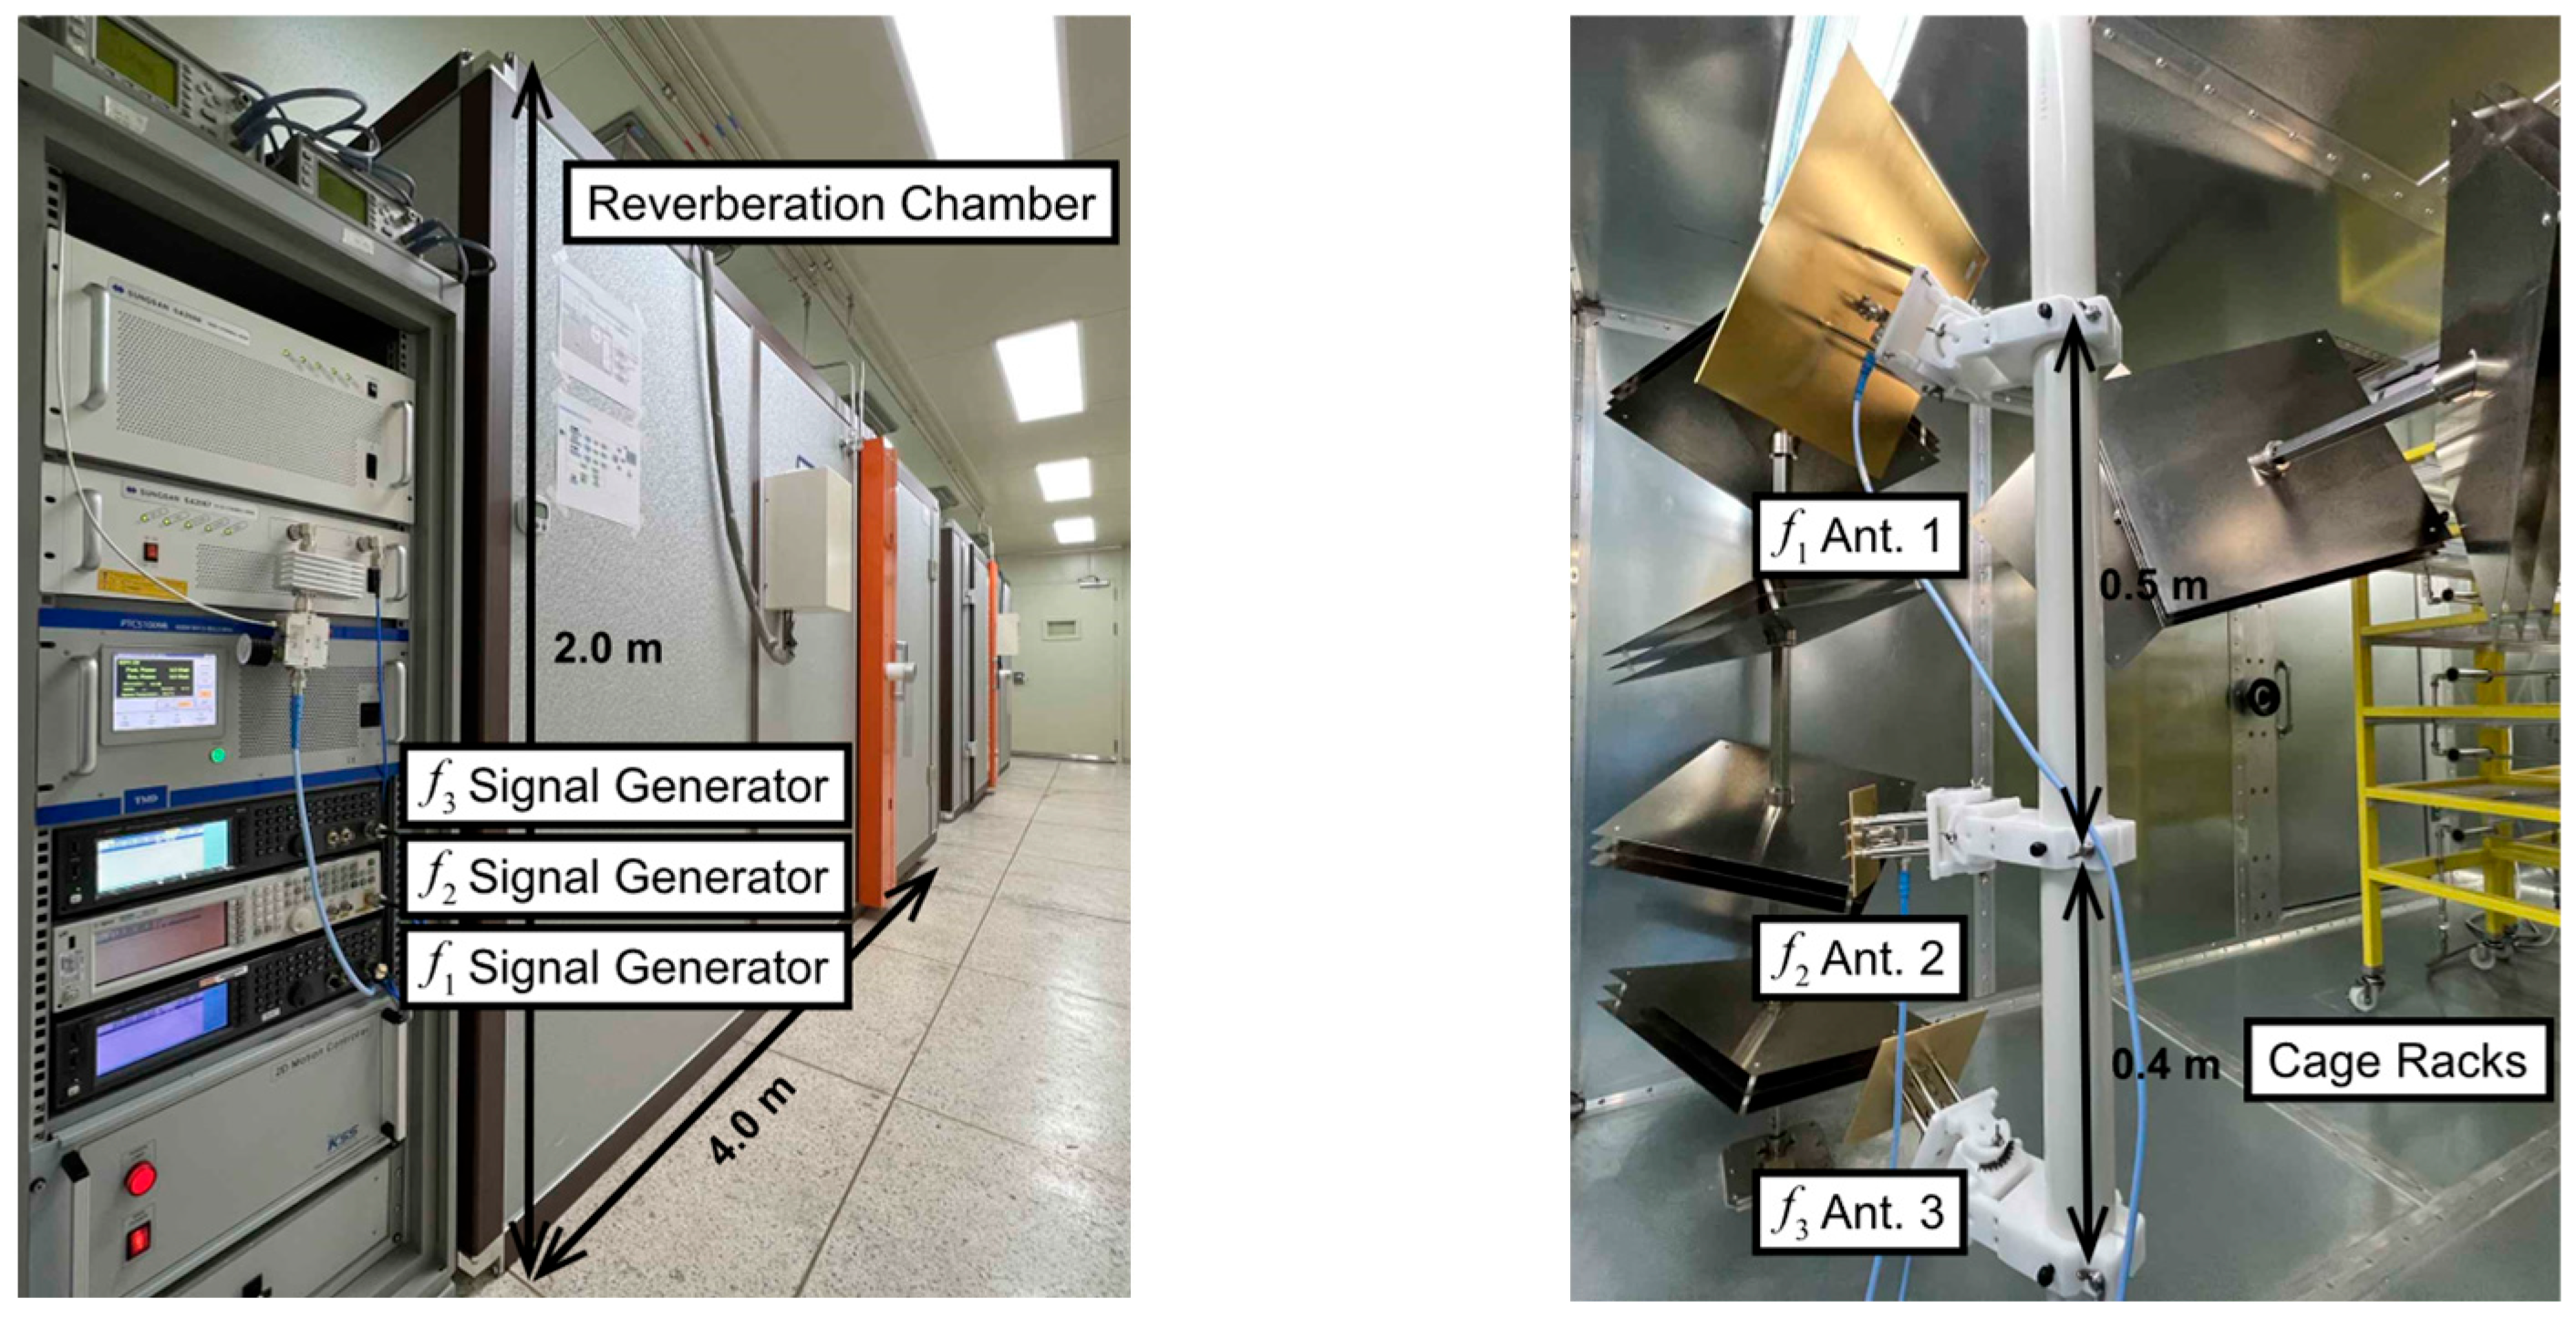
Figure 1 shows both the exterior and interior of the RC developed for RF exposure to experimental animals, with particular emphasis on the EMF exposure environment used in actual long-term rat studies. There are the two stirrers made of several metal plates with different angles, each vertically and horizontally, for uniform scattering of electromagnetic waves inside the RC. The interior walls of the RC are also made of metal to effectively reflect electromagnetic waves.
Three antennas are installed inside the RC, each satisfying the performance requirements of standard gain dipole antenna [13]. The center frequencies are 900 MHz, 2.12 GHz, and 3.65 GHz, respectively. The measured −10 dB bandwidths are 825 MHz to 990 MHz, 1.90 GHz to 2.27 GHz, and 3.44 GHz to 3.87 GHz, with corresponding measured gains of 12.0 dBi, 10.9 dBi, and 10.5 dBi, respectively. The orientation of the three antennas satisfies two conditions: (i) to ensure frequency-independent uniform exposure conditions, and (ii) to prevent direct EM waves from the antennas from propagating straight into the measurement volume where the experimental animals will be placed. To meet these requirements, the antennas are positioned with sufficient separation and appropriate orientation to minimize mutual coupling, thereby reducing the power received by the other antennas from any single transmitting antenna.
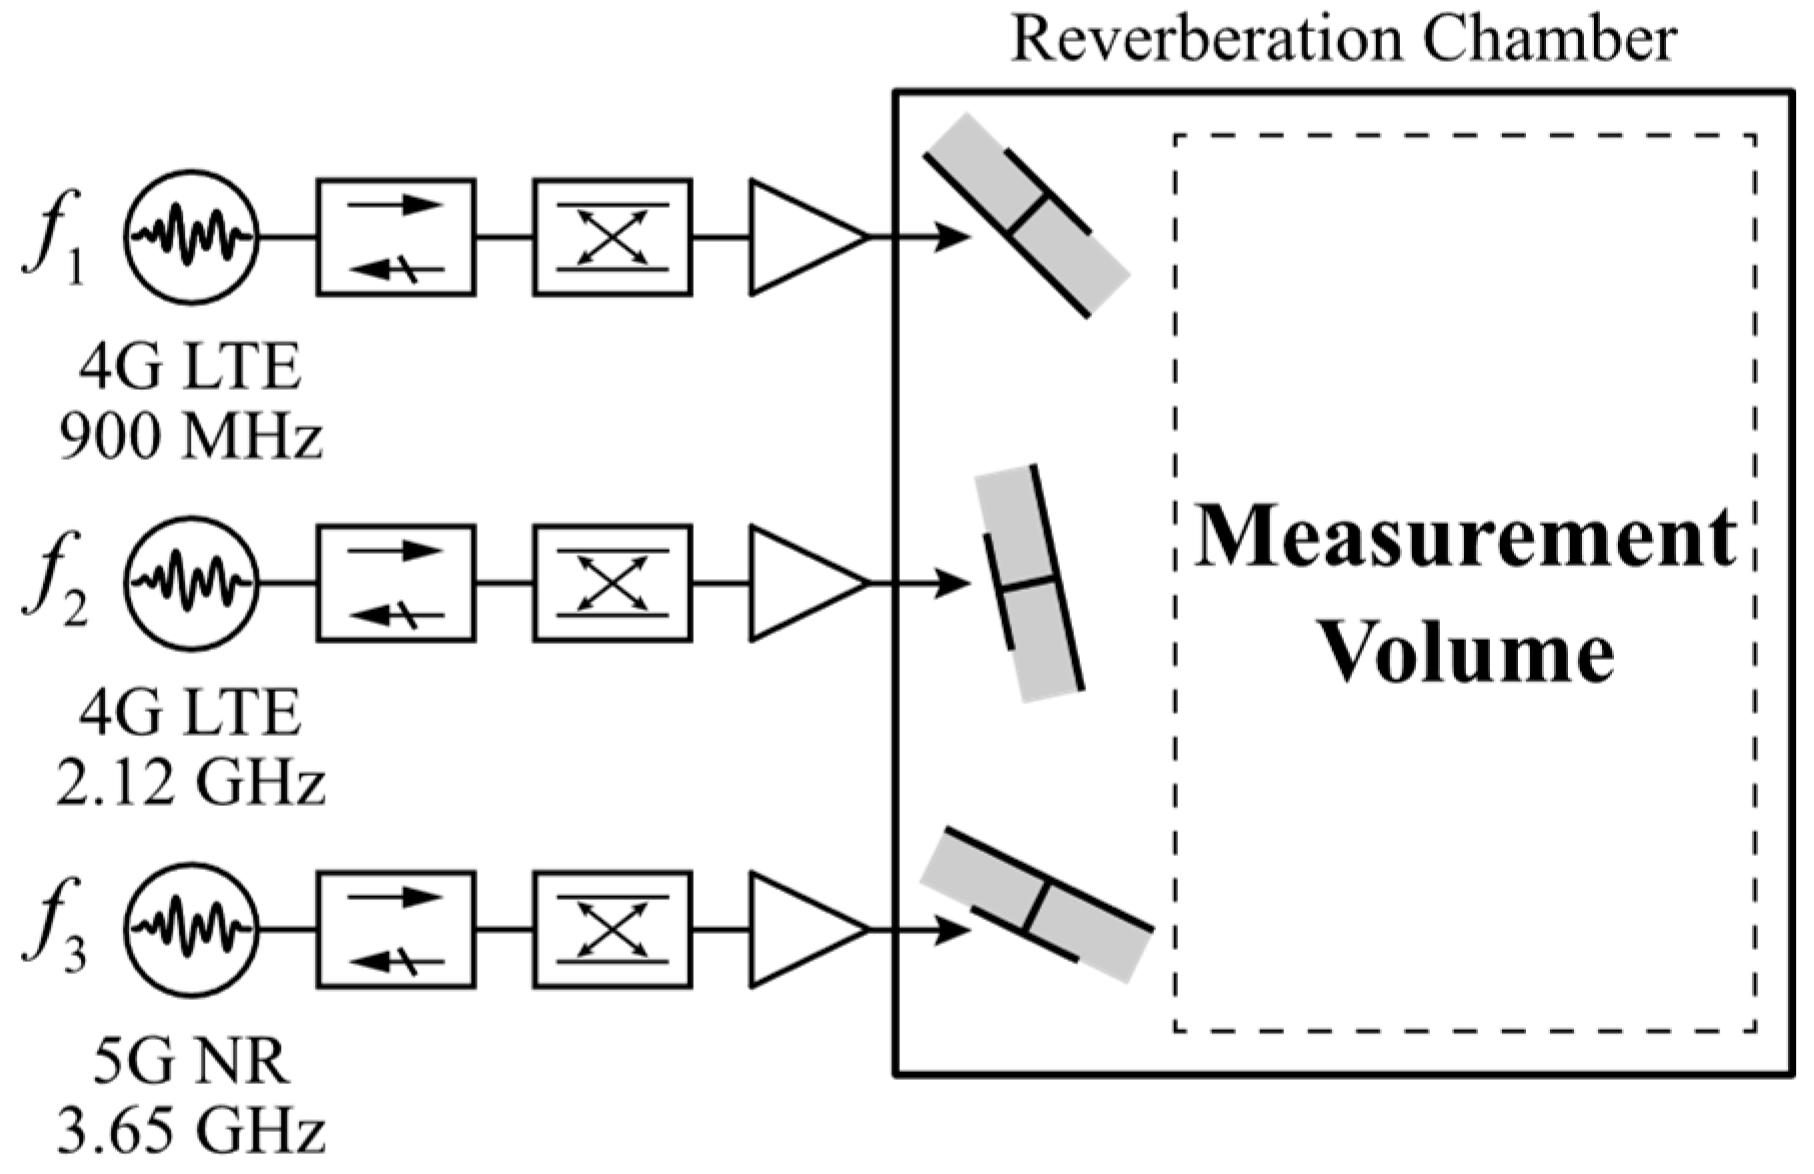
In the RF power distribution section, as shown in Figure 2, each antenna is fed by a high-power RF source through dedicated transmission lines. The system was designed to deliver sufficiently high output power to achieve a specific absorption rate (SAR) of 4 W/kg in the target exposure volume, as required for the experimental protocol. This necessitated the use of high-power amplifiers and precise power control to maintain stable field intensities across all operating frequencies. The RF chain incorporates directional couplers and power meters for real-time monitoring, ensuring both accurate exposure levels and operational safety. As shown in Figure 2, the high-power RF system for each frequency comprises a Keysight signal generator and a power amplifier with a gain of 56 dB and maximum output of 400 W, which amplifies modulated mobile communication signals and feeds them to the corresponding antenna.
Table 1 summarizes the measured RF isolation between antennas when each antenna transmitter delivers its nominal forward power of 53 dBm. Because the maximum reverse power never exceeds 24 dBm, every cross-pair demonstrates at least 29 dB of isolation, with the majority of paths providing 36–46 dB. Such values are well beyond the 20 dB margin generally recommended for electromagnetic compatibility (EMC) testing [14], ensuring that mutual coupling does not perturb the composite field distribution nor bias the SAR dosimetry of experimental animals located in the measurement volume. Consequently, the adopted offset mounting scheme, where each radiator is aimed away from the measurement volume and the other feeds, proves adequate to decouple the three independent exposure antennas for quantitative evidence of antenna-to-antenna isolation.

2.2. Definition of Measurement Volume Size and Exposure Condition Settings

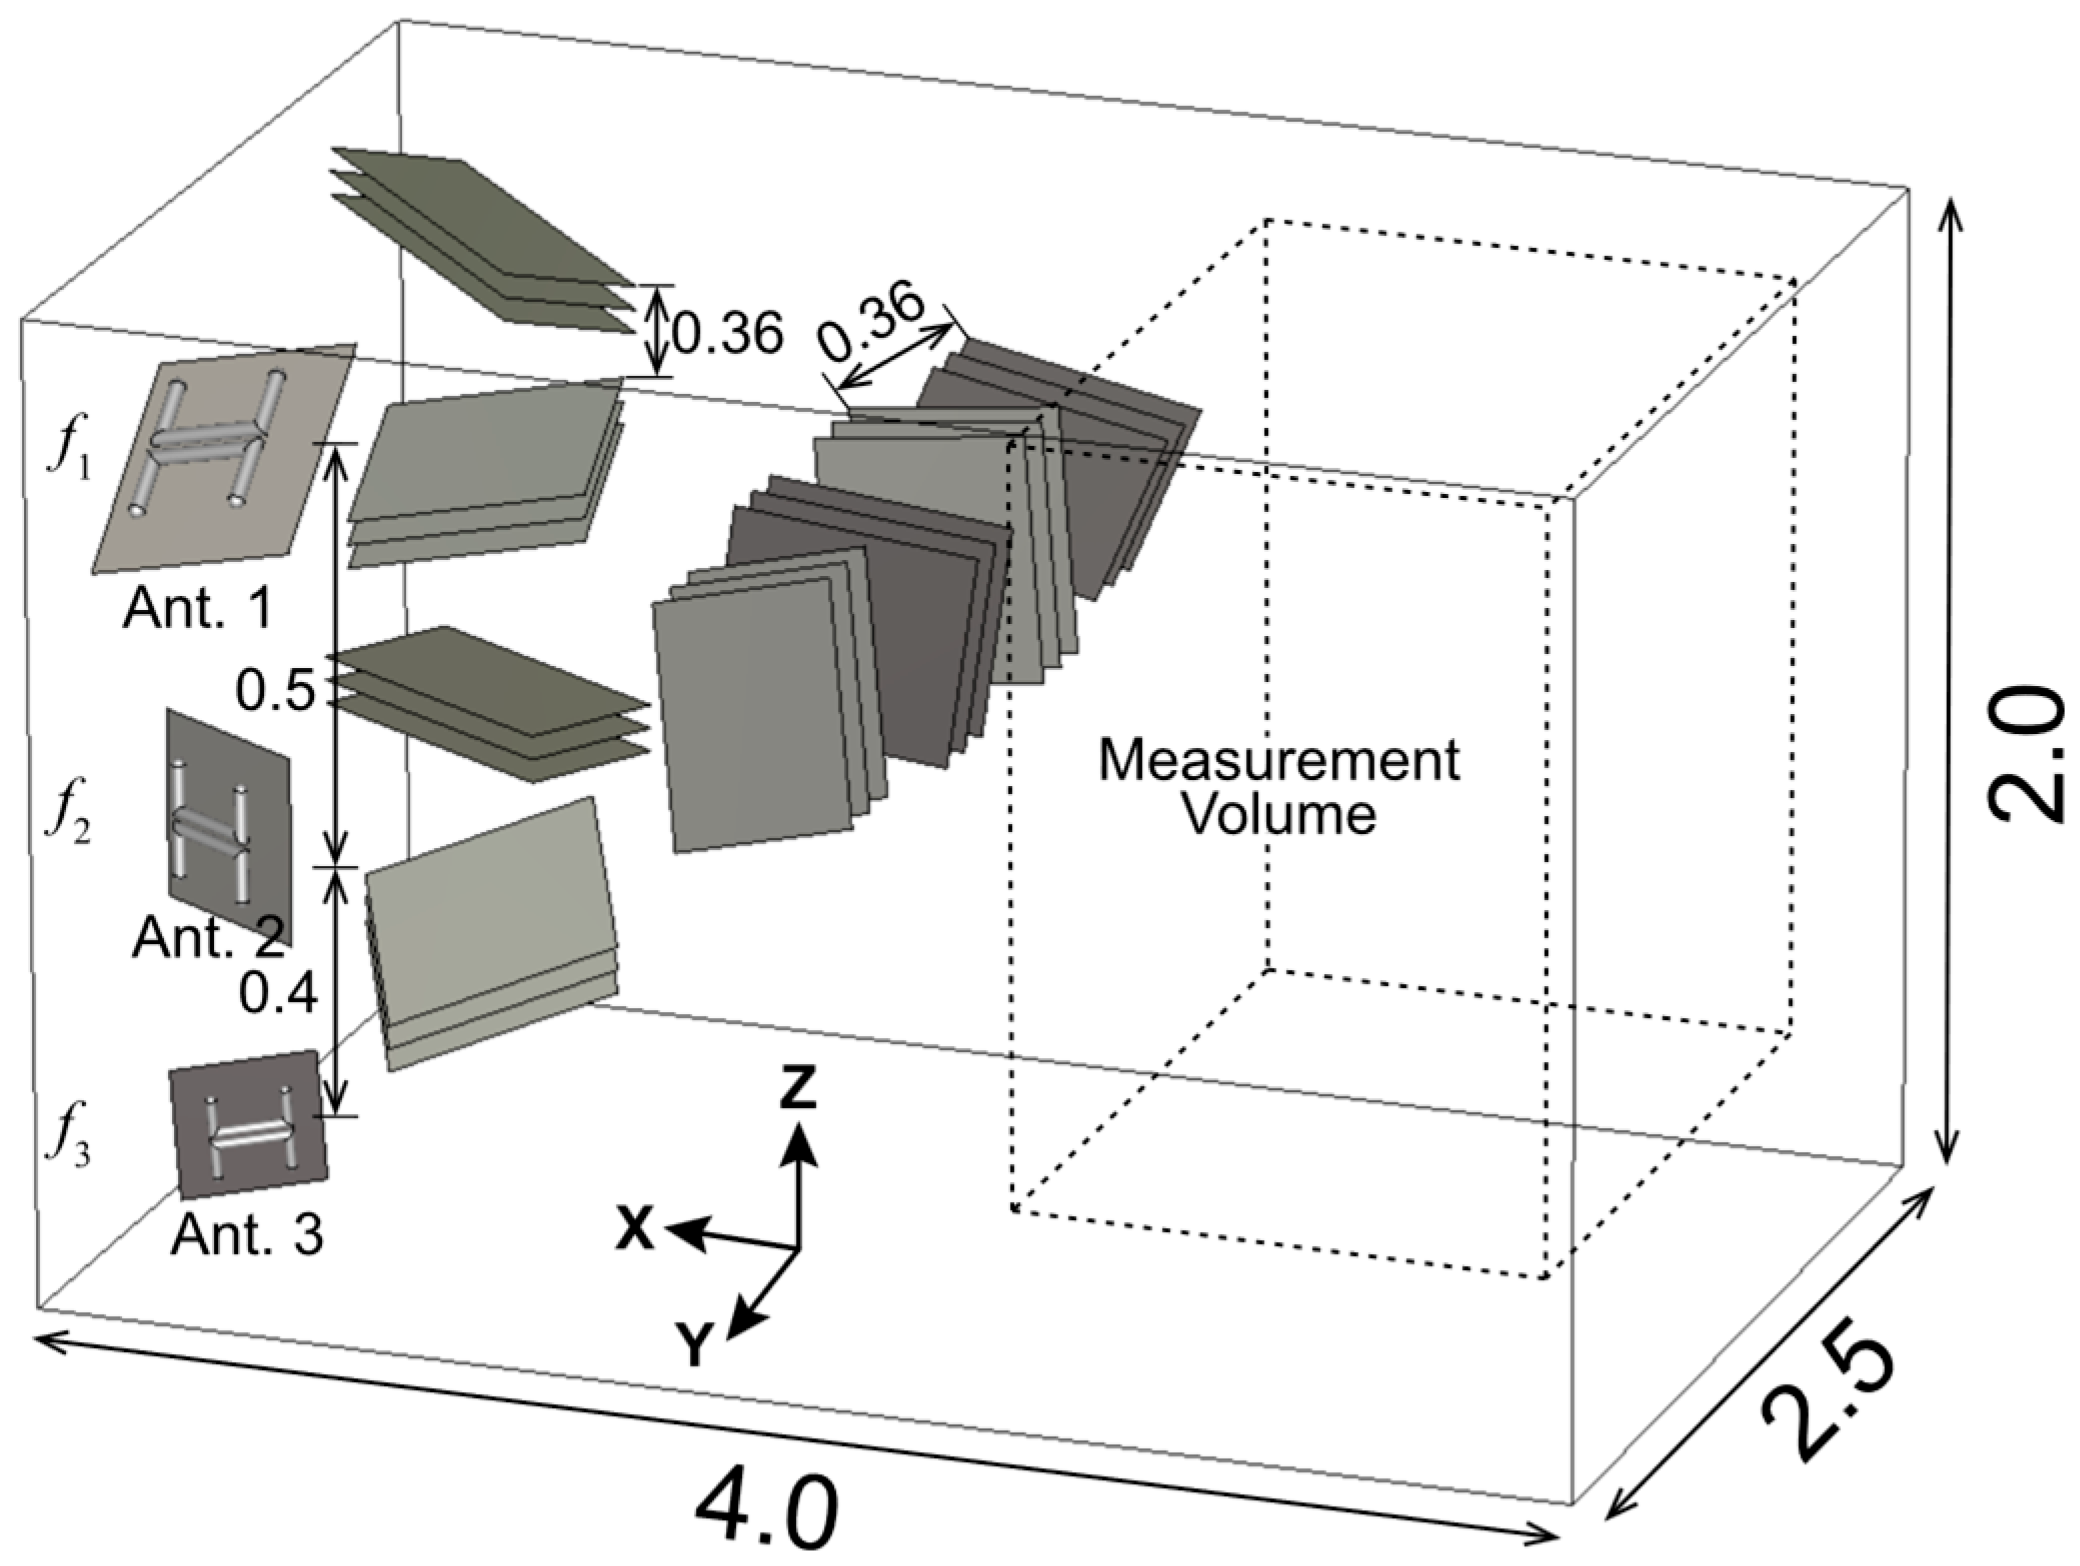
The measurement volume is the space of 1.5 m × 1.5 m × 1.3 m within the RC of 4.0 m × 2.5 m × 2.0 m, where the cage racks will be positioned. Figure 3 shows the proposed RC using two orthogonal mode stirrers, each built from four crossed modules of three staggered metallic plates, the extra plate increases scattering complexity and modal density, thereby improving E-field uniformity across the measurement volume [15]. The measurements were taken under conditions where the stirrer rotated continuously, with vertical and horizontal rotation speeds of 5 rpm (30 deg per second) and 3 rpm (18 deg per second), respectively. E-field uniformity measurements are conducted at 150 points, arranged as a 5 (x-axis) × 5 (y-axis) × 6 (z-axis) grids within the measurement volume, as shown in Figure 4. At our grid spacing (Δx ≈ 0.375 m, Δy ≈ 0.375 m, Δz ≈ 0.26 m), the sampling corresponds to about 3–5 λ at 3.65 GHz (λ ≈ 0.082 m) but only 0.8–1.1 λ at 900 MHz (λ ≈ 0.333 m), implying more spatially uncorrelated samples and tighter statistics at the higher band. Measurement points are sequentially numbered from 1 to 150, progressing horizontally across the X and Y axes, then vertically through the Z-axis from the bottom layer upwards. Unlike conventional RC evaluations, which typically assess field uniformity only at the edges of the working volume, this study includes measurements throughout the interior, enabling a more comprehensive assessment of uniformity within the entire exposure region.
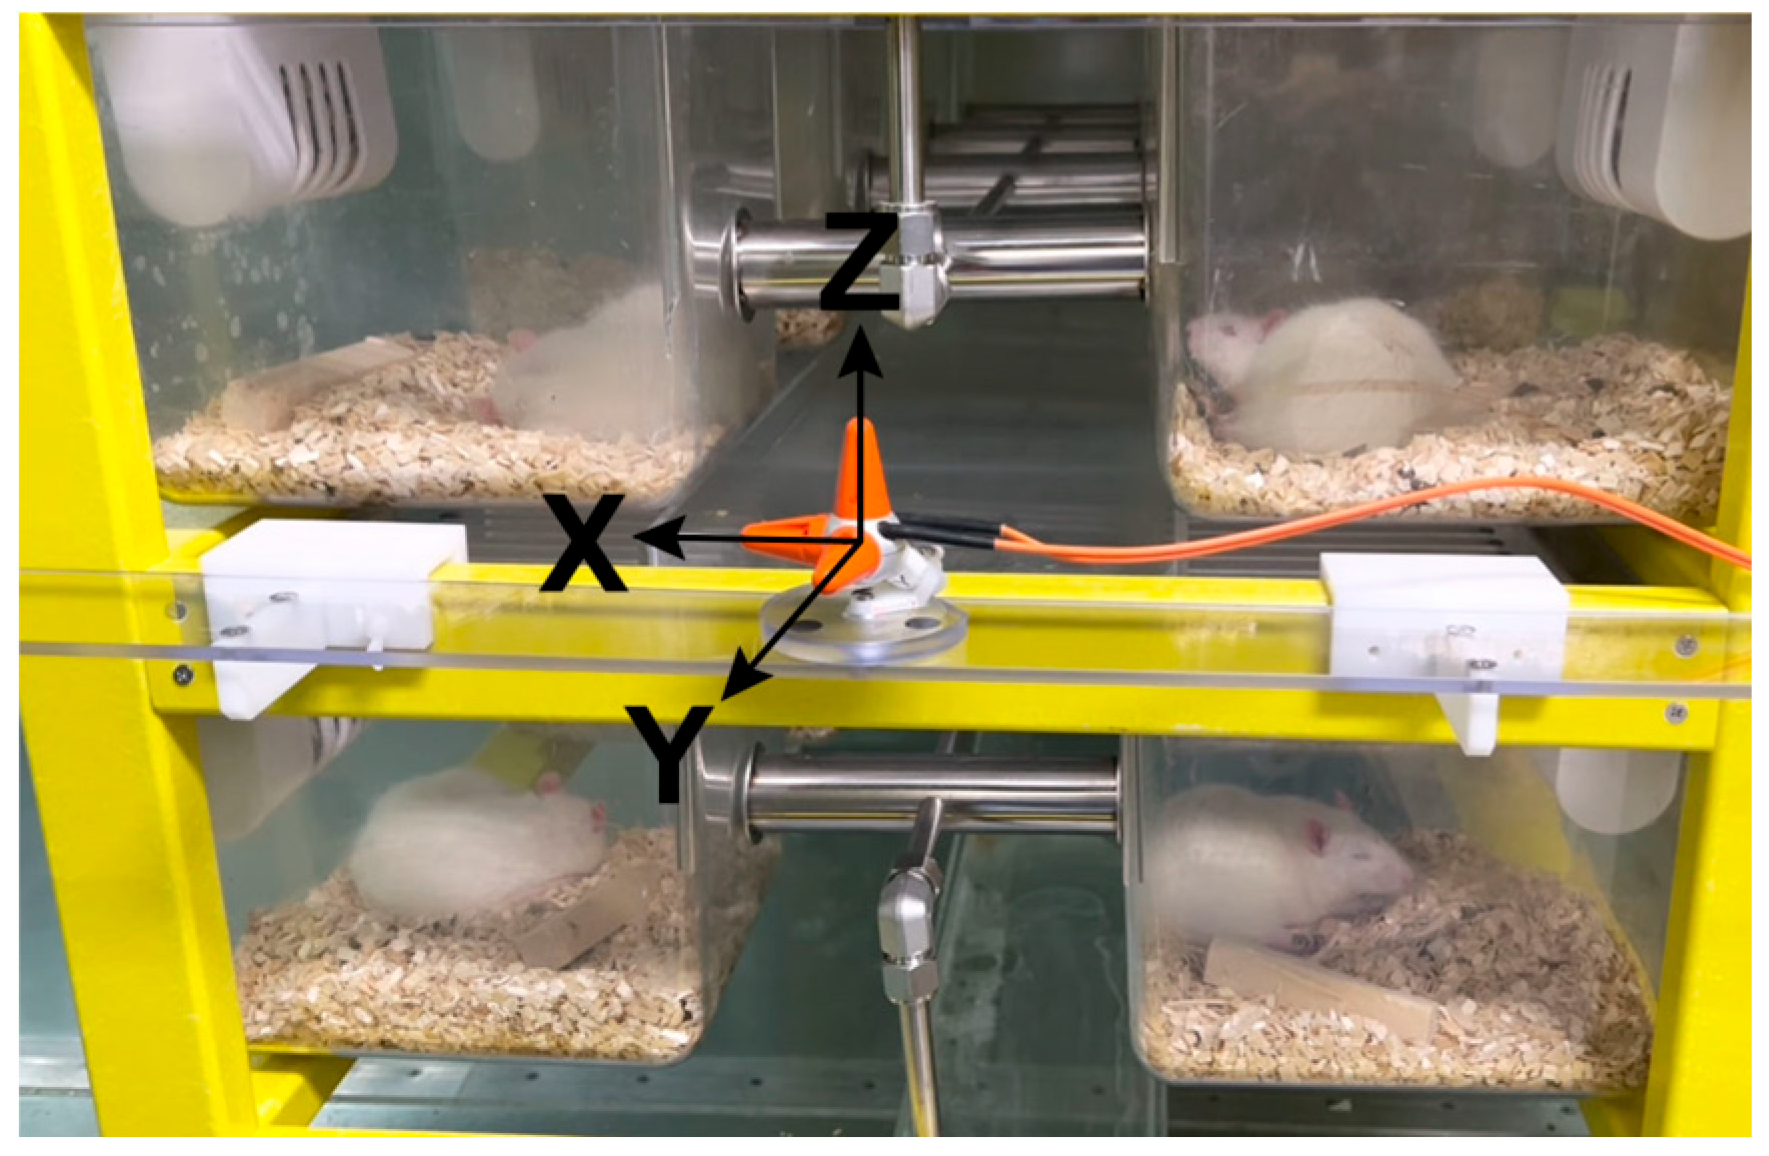
At each measurement point, the E-field intensity is recorded as a 1 min time-averaged value under the specified exposure conditions. A three-axis E-field probe FL7006 manufactured by Amplifier Research is employed to measure the E-field intensity, as shown in Figure 5. The orientation of the probe is that the x-axis pointed toward the stirrer, the y-axis toward the chamber door, and the z-axis toward the ceiling. The measurement volume is determined based on the location and size of the stirrers and the dimensions of the cage racks installable at a minimum distance of a quarter-wavelength from the RC walls [14]. Measurements are conducted under four frequency conditions: 900 MHz, 2.12 GHz, 3.65 GHz, and a simultaneous exposure condition involving all three frequencies. Also, measurements are performed under four distinct loading conditions to reflect realistic exposure scenarios for experimental animals: Empty; Apparatus (including watering systems, animal bedding, cages, and cage racks); Apparatus + Rat 400 g (cage racks loaded with 80 rats, 10 weeks old, weighing approximately 400 g); and Apparatus + Rat 520 g (cage racks loaded with 80 rats, 13 weeks old, weighing approximately 520 g). The number of rats is fixed at the cage rack’s maximum capacity of 80 rats, consistent across both Apparatus + Rat 400 g and Apparatus + Rat 520 g conditions. For more information on the apparatus, please refer to the reference [11].

3. Measurement and Discussion on Single-Frequency Exposure Condition

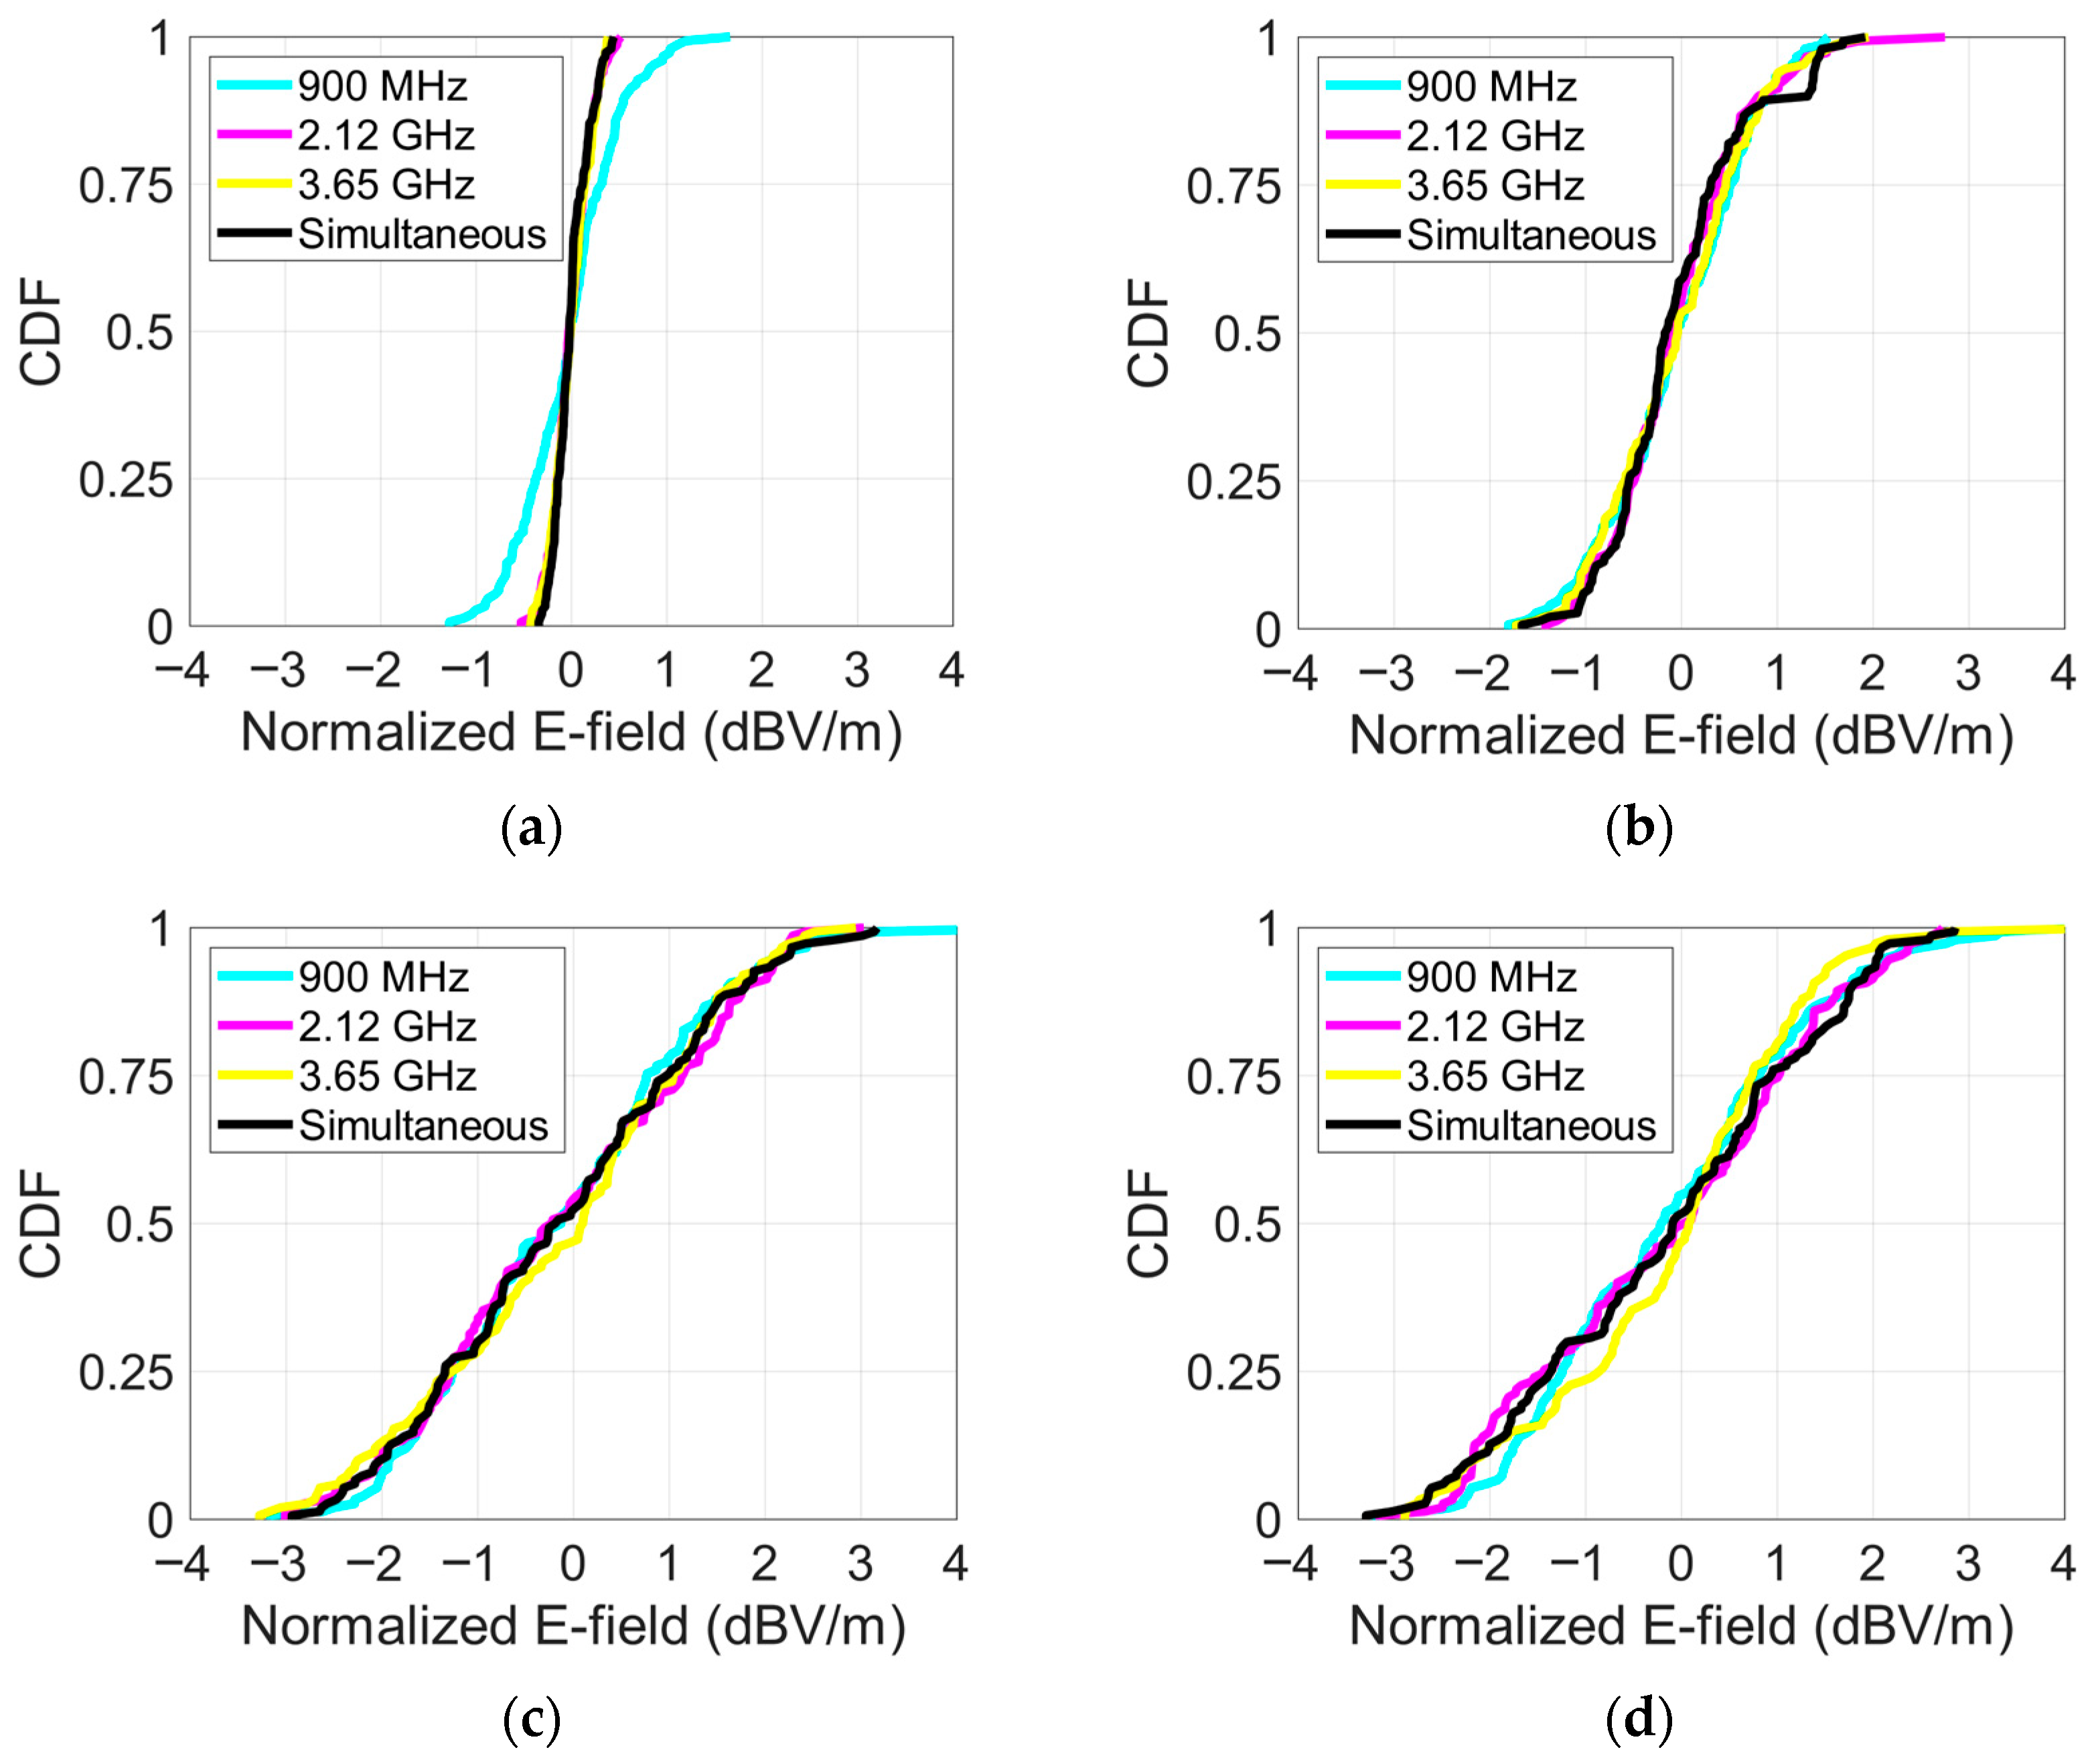
Figure 6 illustrates the cumulative distribution functions (CDFs) of normalized E-field intensities measured at 150 points within the RC under the four loading conditions. Measurements are performed separately at the three frequencies and simultaneous exposure. The CDFs provide insight into the spatial uniformity of the E-field: steeper slopes indicate tighter clustering of E-field intensities around the mean, representing better uniformity, whereas gentler slopes reflect variability. As shown in Figure 6, consistently steep slopes across various loading levels and frequencies demonstrate the RC’s ability to maintain stable and highly uniform E-field distribution, even with the presence of cage racks and rats.
Table 2 presents measured composite E-field intensities averaging 150 measurement points and corresponding uniformity under the four loading conditions across the three individual frequency, f1 (900 MHz), f2 (2.12 GHz), f3 (3.65 GHz) conditions. Table 2 indicates that E-field intensities decrease significantly as loading increases, suggesting the cage racks and rats introduce scattering effects or field absorptions. With greater loading in the RC, inter-frequency differences in E-field uniformity diminish as shown in Table 2, even when the load increases with the increase in animal weight, the loading-induced differences across frequencies remain within the measurement uncertainty. The standard deviation of the measured E-field intensities in Table 2 illustrates variability within the RC. Lower loading (empty condition) shows relatively small variability, indicating the spatial E-field uniformity. However, introducing cage racks and rats increases the variability due to the shadow effect, but reduces differences among frequencies.
The larger variability observed at 900 MHz in the empty loading condition arises from mode density. In a fixed volume RC, the cumulative number of resonant modes increases approximately with fi3 where fi is operating frequency (i = 1, 2, 3); hence higher frequencies provide more independent field realizations per stir interval and tighter spatial statistics. The RC provides an electromagnetic field exposure environment based on its cavity structure, and the number of resonant modes is determined by frequency [16]:
N S f i = 8 π 3 a b c f i 3 ν 3 a + b + c f i ν + 1 2
where ν is the speed of light, and a, b, c is for the dimension of the rectangular cavity. For the designed RC with the dimension of 4.0 m × 2.5 m × 2.0 m, the estimated cumulative mode counts are approximately 4.47 × 10³ at 900 MHz, 5.87 × 10⁴ at 2.12 GHz, and 3.00 × 10⁵ at 3.65 GHz [5]. Under the empty loading condition, as frequency increases, the number of resonant modes grows substantially. This three-order-of-magnitude growth from 900 MHz to 3.65 GHz explains why the empty loading condition standard deviation is largest at 900 MHz and decreases systematically with frequency, consistent with the uniformity values reported in Table 2.
By contrast, 3.65 GHz consistently yields the lowest E-field uniformity across loads because the RC is electrically much larger at higher frequency: the mode count scales approximately as fi3, the stirrers and antennas as electrically larger, and the coherence bandwidth shrinks (BCfi/Q), all of which produce more independent E-field realizations during the same 1 min averaging interval. This frequency-scaling persists under loading: although Q decreases and BC widens with added loss, at 3.65 GHz, the effective number of independent realizations over space and stir time remains larger than at the lower bands, explaining the systematically smaller scatter (lower uniformity value) observed at f3 in Table 2.
‘Uniformity (dB)’ values in Table 2, calculated by the equation B.7 in Annex B of IEC-61000-4-21, which can be obtained as follows [14]:
U n i f o r m i t y   d B = 20 log 10 μ + σ μ
where μ is the normalized 1 min time-averaged E-field intensity averaging 150 measurement points at each loading condition and frequency, i.e., the ‘Average E-field (V/m)’ in Table 2. σ in Equation (2) is the standard deviation of E-field and is the same as the value in the ‘Standard Deviation (V/m)’ column of Table 2. These results show that once the RC experiences a certain degree of loading, additional changes in frequency have only minor effects on uniformity performance. Even under realistic loading conditions involving cage racks and rats, the E-field uniformity of the RC within 1.36 dB. This outcome fully meets the 3 dB uniformity criterion specified by standards. Therefore, the designed RC maintains stable electromagnetic conditions crucial for reproducible large-scale experimental animal study.
The quality factor (Q-factor) is one of performance parameters of an RC. A high Q-factor is associated with enhanced field uniformity and efficient energy storage within the chamber. According to the IEC-61000-4-21 standards [14], an RC’s operational Q-factor should exceed a defined threshold value to ensure satisfactory test conditions. We calculated the Q-factor from the measured E-fields in Table 2 for the proposed RC using the average shielding effectiveness of an electrically large enclosure for the exposure conditions, as shown in Table 3 [17]:
Q = 2 π V μ 2 μ t x Z 0 λ
Q t h r e s h o l d = 4 π 3 2 3 3 V 1 3 2 λ
where V is the physical dimension of the RC, μ is ‘Average E-field (V/m)’ values in Table 2, μtx is the antenna efficiency of each antenna, Z0 is the impedance of free space, λ is the wavelength. The computed Q-factors of the RC exceed the corresponding threshold values for all the measured frequencies and loading conditions. Specifically, even under the highest loading condition (Apparatus + Rat 520 g), the calculated Q-factors surpass their threshold Q-factors, confirming the RC’s good electromagnetic performance for large-scale animal studies.
Across loading conditions, the measured Q-factor spans about 2 × 10² to 1.1 × 10⁴ in Table 3, tracking the increase in ohmic or absorptive loss introduced by cage racks and rats. A lower Q-factor under heavier loading widens the coherence bandwidth and shortens modal dwell time, which reduces frequency selectivity and helps suppress standing wave sensitivity, consistent with the small changes in E-field uniformity under 1.36 dB across loads. Importantly, all Q-factor values exceed the IEC 61000-4-21 standard threshold Qthreshold at each frequency, confirming over a sufficient mode operation adequate for robust stirring and reliable animal dosimetry [14].

4. Discussion on Simultaneous Exposure Condition

4.1. Simultaneous Exposure Measurements

The simultaneous exposure condition is configured with RF power ratios of 27%, 44%, and 29% for 900 MHz, 2.12 GHz, and 3.65 GHz, respectively, reflecting the statistical outdoor proportions of 4G and 5G mobile communication, and ensuring the total combined power matches that of a single-frequency exposure [6]. E-field uniformity evaluation is performed under the simultaneous exposure condition in which three frequencies with 4G and 5G modulated signals were transmitted simultaneously and continuously.

4.2. Proposed Prediction

To predict the mean and variability of the composite field when the three test carriers are applied simultaneously, we treat the individual fields as statistically independent because the center frequencies (f1, f2, f3) are widely separated and the RC guarantees mode-stirred spatial decorrelation. If the total RF power is fixed (normalized to 1 W) and distributed among the carriers as fractions p1, p2, p3 (p1 + p2 + p3 = 1), the root-sum-of-squares (RSS) of the power-weighted single-frequency averages at one of the 150 measurement points under the simultaneous exposure condition provides an unbiased estimate of the E-field.
The simultaneous exposure condition combines the per-band fields under the assumption that the band-limited random fields are mutually uncorrelated. In a well-stirred RC, inter-frequency correlation is governed by the RC’s coherence bandwidth, BCfi/Q, so fields separated by Δfi >> BC are effectively independent [14]. Consistent with this criterion, statistical characterization of RC’s coherence bandwidth shows that BC follows an approximately lognormal distribution with a median that scales as fi/Q; for Q in the 102–104 range from Table 3, BC is orders of magnitude smaller than our inter-band separations, supporting the frequency-independence assumption across all loading conditions [18]. Using the lowest Q-factor observed in our measurements (approximately Q is about 196 at 900 MHz under Apparatus + Rat 400 g loading in Table 3), the coherence bandwidth is BC ≈ 900 MHz/196 ≈ 4.6 MHz; at higher frequencies or lighter loaded Q is larger and BC is even smaller. Our center frequencies (f1, f2, f3) are separated by more than GHz, exceeding BC across all loading conditions and satisfying the sufficiency condition Δfi/fi ≥ 1/Q. Therefore, the independence assumption is well-justified even when modal overlap increases with loading; in practice, mechanical stirring and 1 min time averaging at each point further decorrelate samples within each band. For different bands, a simple applicability check is min(Δfi) >> max(BC). Under these conditions, the composite field at one of the 150 points under the simultaneous exposure condition can be predicted by the following RSS expression ES:
E S = i = 1 3 p i E i 2
where Ei represents the measured average E-field at each frequency f1, f2, and f3, respectively, normalized to an input power of 1 W, and pi denotes the fractional RF power distribution among these frequencies (p1 = 0.27, p2 = 0.44, p3 = 0.29). Equation (5) can predict the composite E-field intensity based solely on independently measured single-frequency data.
For example, in the case of the empty condition, the predicted value of the composite average E-field intensity under the simultaneous exposure condition, calculated from the data in Table 2 using (5), is 57.1 V/m. Propagating first-order uncertainties through the same RSS relationship gives an equally compact expression for the standard deviation σS:
σ S = 1 150 n = 1 150 E S , n 1 150 n = 1 150 E S , n 2
where ES,n represents the RSS Equation (5) at nth measurement point. These two closed-form formulas can apply to every loading condition because they rely only on per-frequency field statistics including loading effects and the chosen power split.

4.3. Measurement-Prediction Comparison

The comparison in Table 4 shows that the variability in E-field uniformity distribution between the measurement and the prediction does not exceed 0.175 dB under any of the four loading scenarios. From a practical point of view, this small difference of 0.175 dB (≈2%) is insignificant compared to the time and effort required for full experimental measurements, and it further supports the utility of the proposed prediction model in large-scale animal exposure studies.
The RSS-based prediction assumes (i) band-to-band field independence, (ii) well-stirred, approximately Rayleigh-distributed fields within the measurement volume, and (iii) stationarity of loading during 1 min averaging interval. These assumptions can be challenged when the chamber Q-factor becomes very low (heavier loading), because the coherence bandwidth BCfi/Q widens; if any band spacing Δfi is not >> BC, residual inter-band correlation may bias the RSS estimate. The model can also degrade when stirring is insufficient (too few uncorrelated samples or poor stirrer movement), when near field effects or strong shadowing from racks or animals violate the diffuse-field assumption, or when inter-antenna coupling rises (reducing effective band independence). Practical non-idealities—probe positioning error, limited probe isotropy, time drift of Tx power, and slow changes in animals or water configurations—propagate to the composite estimate and should be included in the uncertainty budget. Extrapolation to other frequency splits is valid only if (a) the IEC 61000-4-21 uniformity criteria are met for each band, (b) a minimum Q-factor threshold is satisfied, and (c) inter-band isolation and S11 remain acceptable across loads. If any of these checks fail—or if prediction to measurement discrepancies exceed typical experimental uncertainty—the simultaneous case should be fully re-measured, or additional stirring/averaging and load stabilization should be applied before using the prediction model.
Because heavier loading lowers the RC’s Q-factor and increases modal overlap and absorption, the E-field becomes more diffuse and frequency-independent, so the simplified RSS equation of the simultaneous exposure condition better matches reality and decreases the difference between the measurement and the prediction. Although the prediction model does not fully account for the complex interactions introduced by the presence of cage racks and rats under loading conditions, the overall estimation remains within an acceptable margin. Therefore, this predictive calculation method provides a highly practical alternative to exhaustive direct measurements particularly valuable in large-scale experimental animal studies involving numerous simultaneous exposure scenarios, where repeated measurements are often impractical.
5. Conclusions

In conclusion, we present the implementation and validation of an RC designed specifically for large-scale experimental animal carcinogenicity studies using multiple RF frequencies relevant to 4G and 5G mobile communication. Through E-field uniformity measurements under the loading conditions, we verified that the designed RC consistently maintained the E-field uniformity within 1.36 dB across all the tested conditions, demonstrating its robustness and stability as an exposure system. Notably, the impact of frequency variations on E-field uniformity was minimal when a certain loading threshold was exceeded, confirming the RC’s stable electromagnetic environment for large-scale experimental animal studies. Additionally, we introduced a simplified calculation model to estimate the composite E-field intensity under the simultaneous multi-frequency exposure conditions that can replace actual measurement, offering a practical alternative to repetitive measurements. Overall, the proposed study established a validated experimental framework essential for accurately assessing biological impacts associated with RF EMF exposure.

Author Contributions

Conceptualization, S.J. and A.-K.L.; validation, D.K., S.J., and A.-K.L.; investigation, D.K., S.J., A.-K.L., and J.-I.M.; writing—original draft preparation, D.K.; writing—review and editing, S.J., A.-K.L., and J.-I.M.; visualization, D.K.; funding acquisition, H.-D.C. All authors have read and agreed to the published version of the manuscript.

Funding

This work was supported by Institute of Information & communications Technology Planning & Evaluation (IITP) grant funded by the Korea government (MSIT) (No.RS-2024-00466966, A systematic study on health risk of EMF exposure in advanced wireless service environments).

Institutional Review Board Statement

The measurement using live rats was reviewed and approved by the Institutional Animal Care and Use Committee of KIT (Approval No.: 24-01-0287-0236), and the approval date is 26 November 2024.

Data Availability Statement

The data presented in this study are available on request from the corresponding author.

Conflicts of Interest

The authors declare no conflicts of interest.

References

  1. Verbeek, J.; Oftedal, G.; Feychting, M.; van Rongen, E.; Scarfì, M.R.; Mann, S.; Wong, R.; van Deventer, E. Prioritizing health outcomes when assessing the effects of exposure to radiofrequency electromagnetic fields: A survey among experts. Environ. Int. 2021, 146, 106300. [Google Scholar] [CrossRef] [PubMed]
  2. National Toxicology Program. Toxicology and Carcinogenesis Studies in Hsd: Sprague Dawley SD Rats Exposed to Whole-Body Radio Frequency Radiation at a Frequency (900 MHz) and Modulations (GSM and CDMA) Used by Cell Phones; NTP Technical Report 595; National Toxicology Program: Research Triangle Park, NC, USA, 2018. [Google Scholar]
  3. Falcioni, L.; Bua, L.; Tibaldi, E.; Lauriola, M.; De Angelis, L.; Gnudi, F.; Mandrioli, D.; Manservigi, M.; Manservisi, F.; Manzoli, I.; et al. Report of final results regarding brain and heart tumors in Sprague-Dawley rats exposed from prenatal life until natural death to mobile phone radiofrequency field representative of a 1.8 GHz GSM base station environmental emission. Environ. Res. 2018, 165, 496–503. [Google Scholar] [CrossRef] [PubMed]
  4. Ahn, Y.H.; Imaida, K.; Kim, Y.-B.; Han, K.-H.; Pack, J.-K.; Kim, N.; Jeon, S.B.; Lee, A.-K.; Choi, H.D.; Wang, J.; et al. An international collaborative animal study of the carcinogenicity of mobile phone radiofrequency radiation: Considerations for preparation of a global project. Bioelectromagnetics 2022, 43, 218–224. [Google Scholar] [CrossRef] [PubMed]
  5. Jeon, S.; Lee, A.-K.; Choi, H.-D.; Moon, J.-I. Design of animal exposure system for simultaneous exposure to 4G and 5G EMFs. In Proceedings of the 2024 IEEE Asia-Pacific Microwave Conference (APMC), Bali, Indonesia, 17–20 November 2024; pp. 321–323. [Google Scholar]
  6. Lee, A.-K.; Jeon, S.; Wang, S.; Wiart, J.; Choi, H.-D.; Moon, J.I. Population density and DL EMF exposure levels by region in Korea. In Proceedings of the 2024 IEEE Asia-Pacific Microwave Conference (APMC), Bali, Indonesia, 17–20 November 2024; pp. 781–783. [Google Scholar]
  7. Orlacchio, R.; Andrieu, G.; Joushomme, A.; Patrignoni, L.; Hurtier, A.; De Gannes, F.P.; Lagroye, I.; Percherancier, Y.; Arnaud-Cormos, D.; Leveque, P. A novel reverberation chamber for in vitro bioelectromagnetic experiments at 3.5 GHz. IEEE Trans. Electromag. Compat. 2023, 65, 39–50. [Google Scholar] [CrossRef]
  8. Hara, M.; Wang, J.; Leferink, F. Effect of wall shaking amplitude on vibrating intrinsic reverberation chamber characteristics. IEEE Trans. Electromag. Compat. 2024, 66, 29–36. [Google Scholar] [CrossRef]
  9. Li, B.; Wei, G.; Fan, L.; Li, X.; Zhao, Z.; Song, L. Field uniformity analysis in cylindrical reverberation chambers for slender equipment testing. Int. J. RF Microw. Comput.-Aided Eng. 2025, 1, 9969561. [Google Scholar] [CrossRef]
  10. Midori, M.; Nedate, H.; Kurihara, H. A study on reverberation chamber using parallel-plate transverse electromagnetic antenna. IEICE Trans. Commun. 2025, E108–B, 1023–1029. [Google Scholar] [CrossRef]
  11. Jeon, S.; Lee, A.K.; Wang, J.; Pack, J.K.; Kim, Y.B.; Ahn, Y.H.; Imaida, K.; Choi, H.D. Field uniformity assessment of a reverberation chamber for a large-scale animal study. IEEE Access 2021, 9, 146471–146477. [Google Scholar] [CrossRef]
  12. Ito, R.; Jeon, S.; Wang, J.; Lee, A.-K.; Pack, J.-K.; Choi, H.-D.; Ahn, Y.H.; Imaida, K. Quantification of exposure level in a reverberation chamber for a large-scale animal study. IEEE J. Microw. 2022, 2, 522–532. [Google Scholar] [CrossRef]
  13. EIA/TIA Standard. Minimum Standards for Communication Antennas, Part I-Base Station Antennas; Technical Paper EIA/TIA-329-B; Electronic Industries Association, Engineering Dept.: Arlington, VA, USA, 1999. [Google Scholar]
  14. International Electrotechnical Commission Standard IEC61000-4-21; Electromagnetic Compatibility—Part 4–21: Testing and Measurement Techniques—Reverberation Chamber Test Methods. International Electrotechnical Commission: Geneva, Switzerland, 2011.
  15. Sim, D.; Kwak, S.I.; Kwon, J.H.; Park, S. Design of new reverberation chamber for electromagnetic compatibility and wireless device measurement applications and its reproducibility performance validation. Microw. Opt. Technol. Lett. 2019, 61, 801–804. [Google Scholar] [CrossRef]
  16. Liu, B.H.; Chang, D.C.; Ma, M.T. Eigenmodes and the Composite Quality Factor of a Reverberating Chamber; National Bureau of Standards: Washington, DC, USA, 1983; pp. 17–20. [Google Scholar]
  17. Holloway, C.L.; Hill, D.A.; Ladbury, J.M.; Koepke, G. Requirements for an effective reverberation chamber: Unloaded or loaded. IEEE Trans. Electromag. Compat. 2006, 48, 187–194. [Google Scholar] [CrossRef]
  18. Arnaut, L.R.; Gradoni, G. Probability distribution of the coherence bandwidth of a reverberation chamber. IEEE Trans. Antennas Propag. 2015, 63, 2286–2290. [Google Scholar] [CrossRef]
Figure 1. Multi-frequency RF exposure system with the RC for large-scale experimental animal studies.
Applsci 15 10286 g001
Figure 2. Configuration of high-power RF system for multi-frequency exposures.
Applsci 15 10286 g002
Figure 3. Triple-plate dual axis mode stirrers for enhanced E-field uniformity in the RC. Units are meters.
Applsci 15 10286 g003
Figure 4. Measurement volume within the RC (empty loading condition). Units are mm.
Applsci 15 10286 g004
Figure 5. Three-axis probe in the experimental animal exposure environment (Apparatus + Rat 400 g loading condition).
Applsci 15 10286 g005
Figure 6. Cumulative distribution function for E-field depending on loading conditions: (a) Empty; (b) Apparatus; (c) Apparatus + Rat 400 g; (d) Apparatus + Rat 520 g.
Applsci 15 10286 g006
Table 1. Measured RF isolation between antennas (dB) at 53 dBm forward power. The value in parentheses is the reverse power.
Rx900 MHz Rx2.12 GHz Rx3.65 GHz Rx
Tx
900 MHz Tx (53 dBm)-38 dB (15 dBm)46 dB (7 dBm)
2.12 GHz Tx (53 dBm)36 dB (17 dBm)-29 dB (24 dBm)
3.65 GHz Tx (53 dBm)37 dB (16 dBm)37 dB (16 dBm)-
* Isolation (dB) = Forward power (53 dBm) − Reverse power.
Table 2. Average E-fields of 150 points under exposure conditions.
Loading
Condition
FrequencyAverage
E-Field (V/m)
Standard
Deviation (V/m)
Uniformity (dB)
Emptyf141.72.40.494
f267.71.60.204
f351.61.20.196
Apparatusf130.52.50.697
f228.22.30.691
f316.51.40.708
Apparatus + Rat 400 gf114.02.31.345
f217.12.91.340
f311.61.91.313
Apparatus + Rat 520 gf114.42.41.334
f217.32.91.358
f311.51.71.230
* All data are normalized to an input power of 1 W. f1, f2, and f3 are 900 MHz, 2.12 GHz, and 3.65 GHz, respectively.
Table 3. Q-factor of the Proposed RC Under Exposure Conditions.
FrequencyEmptyApparatusApparatus
+ Rat 400 g
Apparatus
+ Rat 520 g
Qthreshold
f1173993019620732
f210,796187368970575
f310,7981104546536129
Table 4. Measured and predicted E-field uniformity under the simultaneous exposure condition.
Loading ConditionMethodAverage
E-Field (V/m)
Standard
Deviation (V/m)
Uniformity (dB)
EmptyMeasurement67.21.40.176
Prediction57.11.00.152
ApparatusMeasurement30.72.60.698
Prediction26.11.60.523
Apparatus + Rat 400 gMeasurement15.52.61.334
Prediction14.92.21.194
Apparatus + Rat 520 gMeasurement15.42.61.351
Prediction15.02.31.214
Disclaimer/Publisher’s Note: The statements, opinions and data contained in all publications are solely those of the individual author(s) and contributor(s) and not of MDPI and/or the editor(s). MDPI and/or the editor(s) disclaim responsibility for any injury to people or property resulting from any ideas, methods, instructions or products referred to in the content.