Abstract
To address the issues of image quality degradation and file size expansion encountered during reversible data hiding (RDH) of JPEG images, a JPEG reversible data hiding algorithm based on block smoothness estimation and optimal zero coefficient selection is proposed. Firstly, a block smoothness estimation strategy is designed based on the number of zero coefficients and non-zero quantisation table values within DCT blocks, prioritising DCT blocks with higher smoothness for information embedding. Subsequently, under a given embedding payload, an optimal zero coefficient selection strategy is introduced. Blocks are partitioned into embedding regions and non-embedding regions based on a preset position threshold T. Within embedding regions, the frequency of zero coefficients at different positions across all blocks is statistically analysed, with embedding prioritised at positions exhibiting the highest zero coefficient frequency to enhance embedding efficiency. Concurrently, by setting positive and negative displacement gaps to constrain the modification range of non-zero coefficients, invalid shifts are minimised. This further enhances visual quality while controlling file expansion. Experimental results demonstrate that, compared to existing algorithms, the proposed method achieves a peak signal-to-noise ratio improvement of 0.75 to 3.62 dB under fixed embedding capacity. File expansion is reduced by 1038 to 2243 bits, whilst enabling fully reversible image restoration.
1. Introduction
With the continuous development of social network and multimedia technology, JPEG compressed images have gradually become the mainstream image type due to their advantages in transmission bandwidth and storage space. After JPEG compression, the redundant information is greatly reduced, and the spatial domain algorithms cannot be directly applied to JPEG compression, so it is important to study the reversible algorithms that take into account the compression performance and embedding performance of the image. JPEG image processing usually includes the Discrete Cosine Transform (DCT), quantisation, and entropy coding, resulting in the loss of correlation between pixels. As a result, JPEG images usually exhibit lower redundancy compared to spatial domain images. Currently, there are three main reversible data hiding (RDH) methods for JPEG images: methods based on quantisation table modification [1,2,3,4], methods based on Huffman coding modification [5,6,7,8,9,10,11], and methods based on quantised DCT coefficient modification [12,13,14,15,16,17,18,19,20,21,22,23,24,25,26]. Currently, there are relatively few reversible information hiding algorithms based on the JPEG compression domain, and although they have high image quality, their embedding capacity is generally low, so they are only suitable for occasions such as image authentication that do not require high embedding capacity.
Methods based on quantisation table modification are used to embed data by modifying the quantisation table. Fridrich et al. [1] proposed dividing the quantised values in the quantisation table by two and multiplying the corresponding quantised AC factor by two to embed the secret data. Wang et al. [2] built on [1] by extending the scaling factor to an integer greater than two, and determined the quantisation table based on the distortion of the units at different locations within the 8 × 8 block range of the modification. However, the scheme based on quantisation table modification always tends to disturb the balance between visual quality and file size, resulting in a significant increase in file size and a decrease in the efficiency of Huffman coding compression. Huffman coding modification-based approaches modify the Huffman table by exploiting the fact that only a portion of the variable length codes (VLCs) are used during image compression. Mobasseri et al. [5] proposed to map the used VLCs to one or more unused VLCs for data embedding. Qian et al. [6] and Hu et al. [7] further proposed measures to make full use of these unused VLCs, thus reducing the file size increment. Although the methods based on Huffman table modification can achieve lossless compression and a controllable file size, they can only achieve relatively low embedding capacity. The method based on quantised DCT coefficient modification embeds the data by modifying the quantised DCT coefficients, and is currently a mainstream method in RDH research for JPEG images. This method uses the idea of histogram panning to generate a histogram of coefficients based on the DCT coefficients, and then uses the peak points to embed the data, while the frequency points outside the peak points are extended outward to make space to ensure reversibility. Huang et al. [12] proposed preferentially selecting DCT coefficient blocks with more zero coefficients for data embedding, and embedding the data into AC coefficients of 1 and −1, while expanding outward to the other non-zero AC coefficients to make room. Hou et al. [13] improved [12] by proposing a band selection strategy due to different quantisation steps corresponding to different frequency bands resulting in different distortions caused by modifying different bands. Wedaj et al. [14] calculated the proportion of peak points in the bands, which also affects the estimation of the band embedding performance. He et al. [15] proposed a method to balance the visual quality and file growth of a JPEG image RDH scheme that can change the optimisation weights for visual quality and file size growth by adjusting the weight factors. He et al. [16] proposed a band coefficient distribution estimation strategy that selects the frequency bands and DCT blocks by estimating the distribution probabilities of the coefficients. Yin et al. [15,17] make a similar point and proposed a multi-objective optimisation strategy that considers both image visual quality and file size increment. Xiao et al. [18] proposed a JPEG image RDH method combining multiple histogram modification (MHM) and rate distortion optimisation. Xiao et al. [19] combined 2D histograms and multi-histograms into a JPEG image RDH method. Yang et al. [20] proposed a coefficient selection strategy for a JPEG image RDH method; instead of selecting bands, the distortion value of each AC coefficient is calculated and the AC coefficients with smaller distortion values are preferred for data embedding. Li-N et al. [21], inspired by Ou et al. [22], combined non-zero AC coefficients into pairs and designed a series of 2D histogram mappings, which can achieve a smaller unit distortion than the 1D scheme. Li-F et al. [23] proposed that keeping the AC coefficients at the diagonal constant is an effective measure to reduce the file extension size, and further proposed a dynamic distortion optimisation and frequency priority reallocation JPEG RDH scheme [24] to adaptively select partially sorted blocks to measure the unit band distortion and assign the embedding priority. Li-F et al. [25] also designed a progressive two-dimensional histogram mapping which can be given capacity to adaptively generate optimal 2D histogram mappings. Di et al. [26] proposed information embedding in zero coefficients and improved the distortion cost function to more accurately select frequency bands for information embedding. Subsequently, Yin et al. [27] proposed a JPEG document image RDH method based on zero AC coefficient embedding. By modifying only zero coefficients at positions with smaller quantisation steps for information embedding, they achieved favourable image quality. Van et al. [28] refined Yin et al.’s [27] approach, noting that the number of zero coefficients within small quantisation steps is not invariably higher than in other quantisation steps. Consequently, they proposed an optimal zero coefficient selection strategy: counting zero coefficients at each position within DCT blocks and prioritising embedding at locations with higher zero frequency. However, this approach disregarded block ordering. To address these limitations, this paper presents a JPEG reversible information hiding algorithm based on block smoothness estimation and optimal zero coefficient selection. The principal contributions are as follows:
- Propose a block smoothness estimation strategy. By evaluating the smoothness of all quantised DCT coefficient blocks and sorting them in descending order of estimated values, blocks with higher smoothness are prioritised for information embedding to enhance embedding efficiency and visual quality.
- Propose an optimal zero coefficient selection strategy. Each DCT block undergoes a zig-zag scan and is divided into embedding regions (containing low-frequency coefficients) and non-embedding regions (containing mid-to-high-frequency coefficients) based on a preset position threshold T. Non-embedding regions remain unchanged to preserve image quality and control file size growth. Within embedding regions, the frequency of zero coefficients at each position across all blocks is counted. Prioritising positions with the highest zero coefficient frequency for information embedding is performed, subject to embedding payload constraints.
- To minimise the ineffective displacement of non-zero coefficients during embedding, positive and negative displacement gaps, Gp and Gn, are established. Displacement adjustments are applied only to non-zero coefficients within the interval (Gn, Gp), thereby significantly reducing unnecessary modifications and preserving high image reconstruction quality.
2. Related Work
JPEG Image Analysis
As illustrated in Figure 1, the JPEG compression process primarily comprises three key stages: the Discrete Cosine Transform (DCT), quantisation, and entropy coding. Following DCT transformation and quantisation, the resulting coefficients are termed DCT quantisation coefficients, stored in 8 × 8 coefficient blocks. The objectives of DCT transformation and quantisation are to maximise the number of zero coefficients (coefficients with a value of zero) while minimising non-zero coefficients. A higher proportion of zero coefficients enhances entropy coding efficiency, ultimately improving the compression quality of the final JPEG image. Currently, the most effective and mainstream approach in the field of JPEG reversible steganography is based on modifying the DCT quantisation coefficients. This involves altering the coefficients obtained after quantisation before applying entropy encoding to create the steganographic image. Consequently, the reversible steganography algorithm need not consider the entropy encoding stage depicted in Figure 1; analysis should focus solely on the DCT transformation and quantiser.
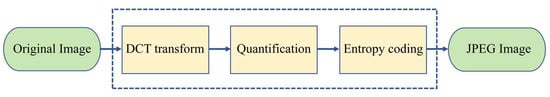
Figure 1.
JPEG image compression process.
3. The Proposed Scheme
For JPEG images, this paper proposes a reversible information hiding algorithm based on block smoothness estimation and optimal zero coefficient selection, with its overall framework illustrated in Figure 2. First, the original JPEG image is decoded to obtain quantised DCT coefficient blocks. Subsequently, all blocks are sorted according to the proposed block smoothness estimation strategy, prioritising blocks with higher smoothness for information embedding. Each block is then scanned in a zig-zag sequence. A preset position threshold T divides each block into two regions: an embedding region containing low-frequency DCT coefficients for information insertion, and a non-embedding region containing mid-to-high-frequency coefficients, which remains unchanged to preserve image quality and control file size growth. To achieve good imperceptibility under a given payload, the algorithm introduces an optimal zero coefficient selection strategy within the embedding region. This strategy counts the number of zero coefficients at different positions across all blocks. Subject to load constraints, it prioritises embedding locations where zero coefficients occur most frequently. Concurrently, to minimise the unnecessary displacement of non-zero coefficients during embedding, positive and negative displacement gaps, Gp and Gn, are defined. Displacement adjustments are applied only to non-zero coefficients within the (Gn, Gp) range, thereby effectively reducing superfluous modifications and preserving high image reconstruction quality.
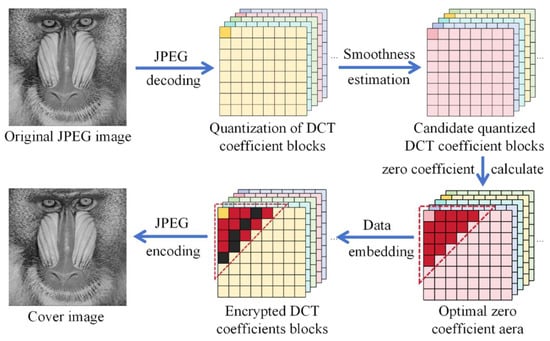
Figure 2.
Algorithm design framework.
3.1. Block Smoothness Estimation Strategy
Usually, histogram-based embedding schemes determine the order of embeddable DCT blocks based on the number of zero coefficients. This is because, in most cases, small coefficient values predominantly occur in blocks with numerous zero coefficients, and these are generally concentrated in frequency bands with smaller quantisation coefficients. Consequently, embedding secret information into such DCT blocks naturally minimises distortion. However, this block ordering strategy has limitations: DCT blocks with identical zero coefficient counts may exhibit differing distributions of non-zero coefficients. To minimise distortion, we further optimise the block ordering strategy by introducing smoothness estimation for DCT blocks with equal zero coefficient counts. This enables more precise calculation of the textural complexity within DCT blocks.
where Sk denotes the smoothness estimate, zk represents the number of zero coefficients in the kth DCT block, and Ɛk measures the relationship between DCT coefficients.
where Qk(s, w) and T(s, w) denote the DCT coefficient value and quantisation table value, respectively, corresponding to the position (s, w) within the k-th DCT block.
Sort several 8 × 8 quantised DCT coefficient blocks in descending order based on their smoothness estimation values, Sk, prioritising blocks with higher smoothness scores for information embedding. The effectiveness of the proposed smoothness estimation strategy is demonstrated using the following example: As shown in Figure 3, a baboon image with a quality factor (QF) = 50 is selected as the test image. Two DCT coefficient blocks, namely blocks 1109 and 1448, are analysed. If blocks are sorted based on the number of zero coefficients, as depicted in Figure 3b,c, the block in Figure 3b would typically be prioritised for secret embedding due to its higher ranking. However, block 1109 is not the optimal choice among these embeddable blocks. This is because block 1109 can embed only one bit of secret data (embedding information only at ±1), whereas block 1448 can embed up to seven bits. Calculating smoothness using Equation (1), block 1109 yields a smoothness score of 56.0471, while block 1448 yields 56.0499. This demonstrates that Equation (1) effectively distinguishes the priority order of different embeddable DCT blocks. It should be emphasised that the Sk values calculated by Equations (1) and (2) represent approximate distortion values, with the primary objective being to identify the optimal DCT block sequence for information embedding.
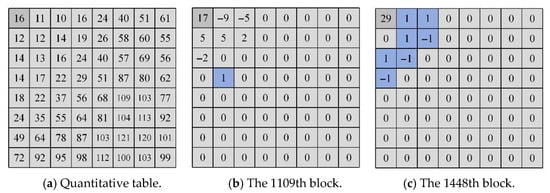
Figure 3.
Comparison of standard quantisation tables and two quantised DCT blocks possessing an identical number of zero coefficients.
3.2. Optimal Zero Coefficient Selection Strategy
Usually, in the JPEG RDH scheme, employing larger quantisation steps to modify AC coefficients introduces greater image distortion. This degradation is particularly pronounced when embedding DCT coefficients with high magnitudes, resulting in a more significant decline in the quality of the steganographic image. Figure 4a illustrates a quantisation representation example at a quality factor (QF) of 70. The region marked by blue dashed triangles corresponds to smaller quantisation steps, situated within the low-frequency domain. Consequently, the low-frequency region is selected as the candidate embedding area. Experimental results indicate that modifying zero coefficients within this region contributes to achieving superior image quality.
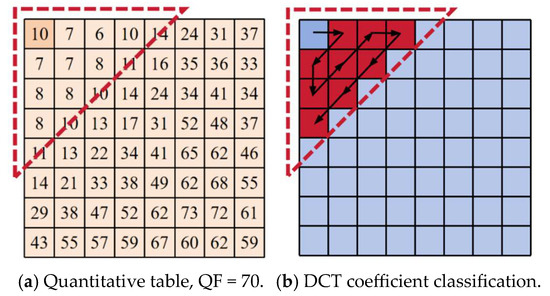
Figure 4.
Quantification table and example distribution of “small” quantified DCT coefficients.
Furthermore, to enhance embedding capacity, priority is given to selecting locations with the highest number of zero coefficients across all DCT blocks in the image for information embedding. Existing approaches focus on modifying zero coefficients with minimal quantisation steps to control distortion during embedding. However, these coefficients typically do not correspond to the maximum number of zero coefficients across all images, thereby limiting embedding capacity. Furthermore, non-zero coefficients are prone to invalid shifts during embedding, further compromising image quality. To address these issues, an optimal zero coefficient selection strategy is proposed, with the following steps:
First, a JPEG image of dimensions M × N is decoded to yield multiple 8 × 8 blocks of quantised DCT coefficients, as illustrated in Figure 4b. Each block is scanned in a zig-zag sequence and divided into two frequency regions. The region containing low-frequency coefficients constitutes the embedding region, represented by red blocks, while the region containing medium-to-high-frequency coefficients is termed the non-embedding region, depicted by blocks of other colours.
Secondly, within the embedding region of each block, for a given position threshold T, the number of zero coefficients at each position α (2 ≤ α ≤ T + 1) across all blocks of the M × N image is counted using Equation (3):
where Bi[α] denotes the α-th AC coefficient in block i, arranged in a zig-zag order. Equation (3) is an indicator function that returns 1 if the condition is true (i.e., the AC coefficient is zero), and 0 otherwise. Subsequently, ZeroCount is sorted in descending order based on the number of zero coefficients, yielding sZeroCount. Given a load, P, the optimal threshold, τ, for the selected position with the highest number of zero coefficients can be determined using Equation (4):
where sZeroCount(k) denotes the number of zero coefficients at position k, L is the length of sZeroCount(k), and P is the given load. The optimal threshold, τ, satisfies the condition that the sum of zero coefficients from position 1 to τ is greater than or equal to P.
As shown in Figure 5, when the optimal threshold τ = 5, the DCT coefficients for each quantised DCT coefficient block are rearranged to form a reordered coefficient vector denoted as {D(1,1), D(1,2), …, D(8,8)}. The first τ coefficients of each vector constitute the embedding region for information embedding, while the remaining coefficients form the non-embedding region, which remains unchanged to preserve visual quality and minimise file expansion.
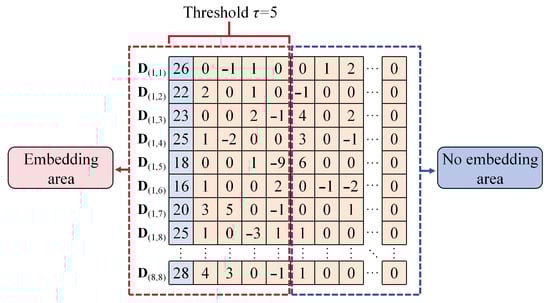
Figure 5.
Embedded and non-embedded region classification (τ = 5).
To prevent conspicuous invalid shifts of non-zero coefficients within the embedding region, this method selects two specific coefficients: one designated Gn for negative shift gaps, and another designated Gp for positive shift gaps, thereby reducing shift operations on non-informative embedding coefficients. This strategy effectively minimises unnecessary modifications, thus preserving high image quality. Figure 6 illustrates the local histogram distribution of quantised DCT coefficients at the ninth position across all DCT blocks in the Boat image. Coefficients with values of −15 and 10 both occur with zero frequency; hence, the negative shift gap is set to Gn = −15 and the positive shift gap to Gp = 10. These two gaps govern the range of coefficients requiring shifting during embedding: only coefficients between Gn and Gp undergo shifting to create the embedding space, while coefficients outside this range remain unchanged, thereby minimising distortion. Furthermore, zero coefficients with large quantisation steps in non-embedded regions also remain unmodified. This approach not only enhances the quality of the steganographic image but also effectively suppresses the growth of the JPEG file size.
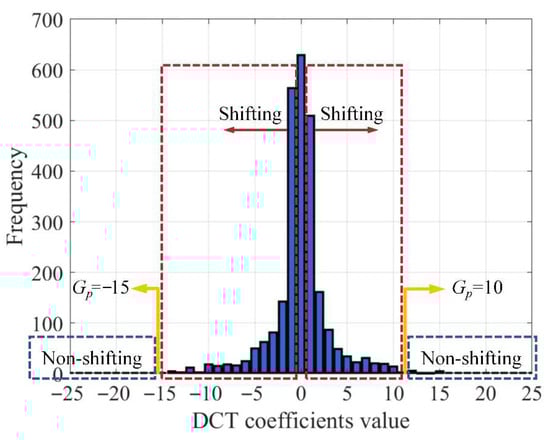
Figure 6.
Example partial histogram of the ninth DCT coefficient block in the “Boat” image (QF = 70).
Usually, we employ two effective metrics, Peak Signal-to-Noise Ratio (PSNR) and Structural Similarity Index Measurement (SSIM), to evaluate visual quality. The PSNR can be calculated as follows:
where X and Y denote the original JPEG image and the annotated JPEG image respectively, while represents the maximum possible pixel value for the image, typically 255. MSE(X, Y) denotes the mean squared error between the two images, calculated using the following formula:
where M × N denotes the image dimensions, and X(i, j) and Y(i, j) represent the pixel values at position (i, j) in the original image and the image containing the secret, respectively. SSIM quantifies the correlation between the original image and the marked image, and is calculated using the following formula:
where (µx, µy) and (σx, σy) denote the mean and standard deviation of X and Y, respectively. σxy represents the covariance between X and Y, while c1 and c2 are two constants. SSIM typically ranges between 0 and 1, with higher values indicating greater similarity between X and Y.
3.3. Data Embedding
For a 512 × 512 greyscale JPEG image, where S denotes the encrypted 0/1 bitstream of the secret message, the detailed embedding process is as follows:
Step 1: Decode the original JPEG image to obtain multiple non-overlapping 8 × 8 quantised DCT coefficient blocks, {B1, B2, …, BN}, where N represents the number of coefficient blocks.
Step 2: Estimate the smoothness of each block. Sort the blocks in descending order based on their smoothness scores to obtain candidate quantised DCT coefficient blocks. Prioritise blocks with higher smoothness scores for information embedding.
Step 3: Using a predefined quantisation table and preset T value, perform zig-zag scanning on all quantised DCT coefficient blocks according to their indices α (α = 2, 3, ..., T + 1) to compute the zero coefficient count, ZeroCount, at each position.
Step 4: Sort the zero coefficient counts in descending order, sZeroCount(k). Sum the zero coefficients within the T value range for each block according to this sort order, ensuring that the sum of zero coefficients from position 1 to τ is greater than or equal to the given payload, P. This yields the optimal threshold, τ, defining the embedding region.
Step 5: Define two displacement gaps within the embedding region: the negative displacement gap Gn and the positive displacement gap Gp. Shift non-zero coefficients falling within (Gn, Gp), excluding zero coefficients, while leaving all other coefficients unchanged. This minimises the ineffective translation of non-zero coefficients not utilised for information embedding. The information embedding sequence follows the order of the candidate coefficient vectors. Assuming the candidate coefficients are {I1, I2, …, In} and the secret information, S, is an encrypted 0/1 bitstream, the information embedding is performed using the following formula:
where S ϵ {0,1} denotes the secret information bits to be embedded, while represents the embedded DCT coefficient values containing the secret information.
Step 6: Generate auxiliary information comprising T, τ, Gn, and Gp, which is essential for extracting the secret message and ensuring image reversibility. Encrypt this auxiliary information using a secure key pre-shared with the recipient, and then embed it at predetermined locations agreed upon by both parties.
Step 7: JPEG encode the DCT coefficients carrying the secret message to produce the embedded image, which is then transmitted to the recipient.
3.4. Data Extraction and Image Recovery
The process of algorithmic information extraction and image restoration corresponds to the information embedding procedure, utilising a pre-shared secure key to retrieve and decrypt auxiliary information: T, τ, Gn, and Gp. The specific methodological steps are as follows:
Step 1: Decode the JPEG-formatted image containing the secret, yielding the secret-embedded quantised DCT coefficients and the unmodified quantisation table. The quantisation coefficient matrix is partitioned into non-overlapping 8 × 8 coefficient blocks.
Step 2: Estimate the smoothness of each block and reorder all DCT blocks based on smoothness. As the embedding mechanism does not affect smoothness calculations, the receiver can accurately obtain the identical block reordering sequence.
Step 3: Within the embedding region, reverse-extract the secret information using auxiliary data. Shift non-zero coefficients falling within the range (Gn, Gp) to restore the original quantised DCT coefficients. Let S* denote the extracted secret information bits and Ri denote the recovered original quantised coefficients. The specific calculation method is as follows:
Step 4: Apply JPEG encoding to the recovered quantised DCT coefficients to reconstruct the original JPEG image.
4. Experiment and Result Analysis
This section conducts experimental comparisons of the proposed algorithm’s performance. The experimental setup comprises a Lenovo YOGA 14s laptop running Windows 10, equipped with an AMD Ryzen 75800H CPU operating at 3.20 GHz and 16.00 GB of memory. The simulation software employed was MATLAB R2016a (version 9.0). Test images were sourced from the BOSSbass image database [29] and the USC-SIPI image database [30]. All images underwent JPEG compression, utilising the IJG toolbox 2014 version [31] with an optimal Huffman coding table for the entropy coding stage. Experiments were conducted using varying quality factors. Four test images, “Barbara”, “F16”, “Baboon”, and “Boat”, are used for result presentation, as shown in Figure 7.
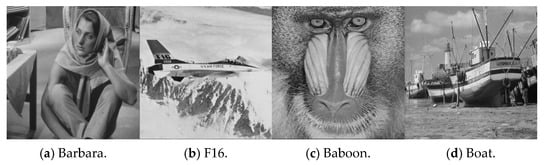
Figure 7.
Test images.
4.1. Embedded Capacity
To evaluate the embedded capacity (EC) of the proposed algorithm, test images from Figure 7 were selected for experimentation. The quality factor was set to six values: QF = 50, 60, 70, 80, 90, and 100. The position threshold T was fixed at 15, meaning a maximum of 15 AC coefficients were selected for embedding. The experimental results are presented in Table 1. At low QF values, the embedded capacity of the proposed algorithm significantly outperforms the methods proposed by Huang and Hou et al. This is primarily because the proposed method bases its information embedding on zero coefficients, and at low QF values the number of zero coefficients is substantial. Consequently, it is particularly well-suited for highly compressed JPEG images. As QF increases, the number of zero coefficients diminishes, leading to a corresponding decrease in embedding capacity. Compared to methods such as those by Yin and Huynh, the proposed algorithm still exhibits higher embedding capacity. This is attributed to the introduced block smoothness estimation strategy, which prioritises selecting more suitable image blocks for secret information embedding, thereby enhancing overall embedding performance.

Table 1.
Comparison of embedding capacity with different quality factors (T = 15).
4.2. Visual Quality
Visual quality is typically quantified using PSNR and SSIM metrics. Higher PSNR and SSIM values indicate superior concealment, signifying that the steganographic image remains visually closer to the original. Experiments compared the proposed algorithm against existing schemes by Huang et al., Hou et al., Yin et al., and Huynh et al. under four quality factor conditions: QF = 50, 70, 80, and 90. Randomly generated binary bitstreams were employed as secret information, with the ‘Baboon’ and ‘Barbara’ images serving as test cases. The comparative results are presented in Figure 8 and Figure 9. Experimental findings demonstrate that, under identical embedding payloads, the proposed algorithm achieves superior PSNR and SSIM values compared to existing approaches, exhibiting enhanced image quality performance.
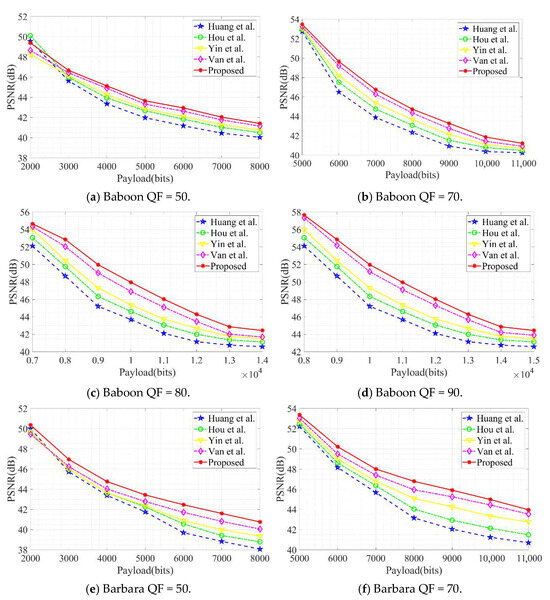
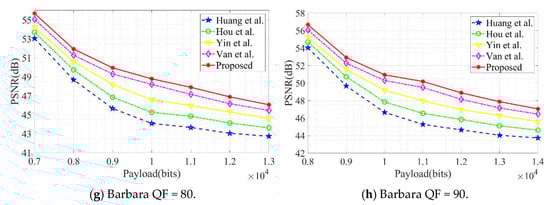
Figure 8.
Comparison of PSNR values under different quality factors (QFs).
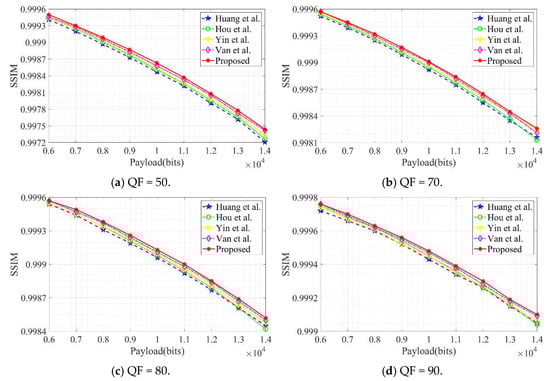
Figure 9.
Comparison of SSIM values under different quality factors (QFs).
4.3. File Extension
File expansion performance is typically evaluated using the File Size Increase (FSI) metric, which quantifies changes in file volume by calculating the storage size difference between the marked image after steganography and the original JPEG image. A lower FSI value indicates better preservation of image compression efficiency when embedding the same payload of secret information, suggesting the steganography scheme has a smaller impact on file size expansion and thus superior overall performance. Experiments comparing the proposed algorithm with existing schemes by Huang et al., Hou et al., Yin et al., and Huynh et al. were conducted under four quality factor conditions: QF = 50, 70, 80, and 90. The comparative results are presented in Figure 10. Results demonstrate that, under identical payload embedding conditions, the proposed algorithm consistently achieves lower FSI values than the comparison algorithms, exhibiting superior file size preservation capability.
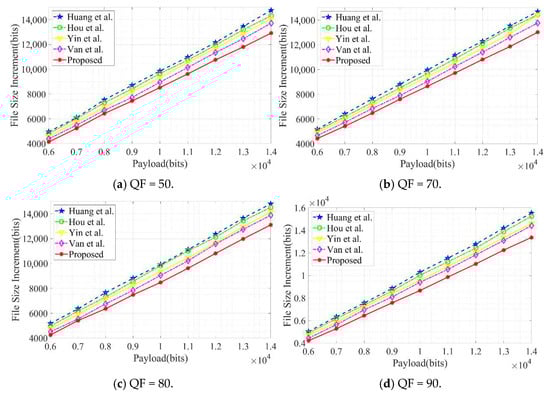
Figure 10.
Comparison of FSI values under different quality factors (QFs).
4.4. Time Complexity
To evaluate the computational efficiency of the proposed algorithm, a comparative experiment on time complexity was conducted using the four test images from Figure 7 under the conditions of a quality factor (QF) of 70 and an embedding payload of 10,000 bits. The running time was measured in seconds, and the results are summarised in Table 2. The experimental results indicate that the average running time of the proposed algorithm is 5.51 s. This is 5.16 s longer than that of Huang et al.’s method, but 12.93 s shorter than that of Hou et al.’s method and 1.64 s shorter than that of Yin et al.’s method. The algorithm by Yin et al. is more suitable for document images with simple structures and exhibits longer running times when processing grayscale images commonly used in reversible data hiding. The average running time of the proposed algorithm is similar to that of Van et al.’s method. This can be attributed to the fact that both algorithms employ a positive-and-negative shift gap strategy, which avoids modifying large DCT coefficients and thereby reduces computational overhead.
Table 2.
Comparison of time complexity.
5. Conclusions
This paper proposes a reversible data hiding algorithm for JPEG images based on block smoothness estimation and optimal zero coefficient selection. It effectively enhances embedding performance while preserving image quality and controlling file size. The algorithm first decodes the JPEG image to obtain quantised DCT coefficient blocks. A block smoothness estimation strategy then sorts these blocks, prioritising those with higher smoothness for embedding. Subsequently, blocks are scanned in a zig-zag sequence. Each block is divided into embeddable and non-embeddable regions based on a preset position threshold T. Low-frequency coefficient regions are utilised for information embedding, while mid-to-high-frequency regions remain unchanged to preserve visual quality and limit file bloat. To further optimise embedding efficiency, the algorithm introduces an optimal zero coefficient selection strategy within embedding regions. By statistically analysing zero coefficient distributions, it prioritises embedding at positions with the highest zero occurrence frequency, thereby enhancing embedding efficiency while meeting payload requirements. Concurrently, by setting positive and negative displacement gaps, Gp and Gn, the modification range of non-zero coefficients is constrained, effectively reducing invalid shifts and preserving high reconstructed image quality. Experimental results demonstrate that, compared to existing algorithms, the proposed method achieves a peak signal-to-noise ratio improvement of 0.75 to 3.62 dB at a fixed embedding capacity. File expansion is reduced by 1038 to 2243 bits, whilst enabling fully reversible image restoration.
Author Contributions
Conceptualization, Y.Y., M.Z. and F.D.; methodology, Y.Y. and M.Z.; validation, Y.Y. and P.L.; formal analysis, Y.Y., M.Z. and F.D.; investigation, Y.Y. and P.L.; data curation, Y.Y.; writing—original draft preparation, Y.Y.; writing—review and editing, Y.Y., M.Z. and F.D.; visualization, M.Z.; supervision, M.Z.; project administration, M.Z. and F.D.; funding acquisition, M.Z. and F.D. All authors have read and agreed to the published version of the manuscript.
Funding
This research was funded by the National Natural Science Foundation of China, grant numbers 62272478, 62102450, 61872384, 62102451, and 62202496; the National Social Science Funds 367 of China, grant number 2022-SKJJ-C-091; and the National Defense Science and Technology Independent Research Project, grant number ZZKY20243127.
Data Availability Statement
The data that support the findings of this study are available from the corresponding author upon reasonable request.
Acknowledgments
The authors would like to thank the editor and anonymous reviewers for their valuable comments which helped to improve this paper.
Conflicts of Interest
The authors declare no conflicts of interest.
References
- Fridrich, J.; Goljan, M.; Chen, Q.; Pathak, V. Lossless data embedding with file size preservation. In Proceedings of the Security, Steganography, and Watermarking of Multimedia Contents VI, San Jose, CA, USA, 19–22 January 2004; SPIE: Bellingham, WA, USA, 2004; Volume 5306, pp. 354–365. [Google Scholar]
- Wang, K.; Lu, Z.M.; Hu, Y.J. A high capacity lossless data hiding scheme for JPEG images. J. Syst. Softw. 2013, 86, 1965–1975. [Google Scholar] [CrossRef]
- Fridrich, A.J.; Goljan, M.; Du, R. Lossless data embedding for all image formats. Proc. SPIE 2002, 4675, 572–583. [Google Scholar]
- Chang, C.-C.; Lin, C.-C.; Tseng, C.-S.; Tai, W.-L. Reversible hiding in DCT-based compressed images. Inf. Sci. 2007, 177, 2768–2786. [Google Scholar] [CrossRef]
- Mobasseri, B.G.; Berger, I.R.J.; Marcinak, M.P.; NaikRaikar, Y.J. Data Embedding in JPEG Bitstream by Code Mapping. IEEE Trans. Image Process. 2010, 19, 958–966. [Google Scholar] [CrossRef] [PubMed]
- Qian, Z.; Zhang, X. Lossless data hiding in JPEG bitstream. J. Syst. Softw. 2012, 85, 309–313. [Google Scholar] [CrossRef]
- Hu, Y.; Wang, K.; Lu, Z.M. An improved VLC-based lossless data hiding scheme for JPEG images. J. Syst. Softw. 2013, 86, 2166–2173. [Google Scholar] [CrossRef]
- Qiu, Y.; He, H.; Qian, Z.; Li, S.; Zhang, X. Lossless data hiding in JPEG bitstream using alternative embedding. J. Vis. Commun. Image Represent. 2018, 52, 86–91. [Google Scholar] [CrossRef]
- Wu, Y.; Deng, R.H. Zero-error watermarking on jpeg images by shuffling Huffman tree nodes. In Proceedings of the 2011 Visual Communications and Image Processing (VCIP), Tainan, Taiwan, 6–9 November 2011; IEEE: New York, NY, USA, 2011; pp. 1–4. [Google Scholar]
- Xiong, W.; Cao, C.; Wang, X.; Shao, Y.; Zhou, M. Reversible data hiding in JPEG images based on improved frequency selection and mapping strategy. Digit. Signal Process. 2025, 156, 104754. [Google Scholar] [CrossRef]
- Du, Y.; Yin, Z.; Zhang, X. High capacity lossless data hiding in JPEG bitstream based on general VLC mapping. IEEE Trans. Dependable Secur. Comput. 2020, 19, 1420–1433. [Google Scholar] [CrossRef]
- Huang, F.; Qu, X.; Kim, H.J.; Huang, J. Reversible data hiding in JPEG images. IEEE Trans. Circuits Syst. Video Technol. 2016, 26, 1610–1621. [Google Scholar] [CrossRef]
- Hou, D.; Wang, H.; Zhang, W.; Yu, N. Reversible data hiding in JPEG image based on DCT frequency and block selection. Signal Process. 2018, 148, 41–47. [Google Scholar] [CrossRef]
- Wedaj, F.T.; Kim, S.; Kim, H.J.; Huang, F. Improved reversible data hiding in JPEG images based on new coefficient selection strategy. EURASIP J. Image Video Process. 2017, 2017, 63. [Google Scholar] [CrossRef]
- He, J.; Chen, J.; Tang, S. Reversible data hiding in JPEG images based on negative influence models. IEEE Trans. Inf. Forensics Secur. 2019, 15, 2121–2133. [Google Scholar] [CrossRef]
- He, J.; Pan, X.; Wu, H.-T.; Tang, S. Improved block ordering and frequency selection for reversible data hiding in JPEG images. Signal Process. 2020, 175, 107647. [Google Scholar] [CrossRef]
- Yin, Z.; Ji, Y.; Luo, B. Reversible data hiding in JPEG images with multi-objective optimization. IEEE Trans. Circuits Syst. Video Technol. 2020, 30, 2343–2352. [Google Scholar] [CrossRef]
- Xiao, M.; Li, X.; Ma, B.; Zhang, X.; Zhao, Y. Efficient reversible data hiding for JPEG images with multiple histograms modification. IEEE Trans. Circuits Syst. Video Technol. 2020, 31, 2535–2546. [Google Scholar] [CrossRef]
- Xiao, M.; Li, X.; Zhao, Y. Reversible data hiding for JPEG images based on multiple two-dimensional histograms. IEEE Signal Process. Lett. 2021, 28, 1620–1624. [Google Scholar] [CrossRef]
- Yang, X.; Wu, T.; Huang, F. Reversible data hiding in JPEG images based on coefficient-first selection. Signal Process. 2022, 200, 108639. [Google Scholar] [CrossRef]
- Li, N.; Huang, F. Reversible data hiding for JPEG images based on pairwise nonzero AC coefficient expansion. Signal Process. 2020, 171, 107476. [Google Scholar] [CrossRef]
- Ou, B.; Li, X.; Zhao, Y.; Ni, R.; Shi, Y.-Q. Pairwise prediction-error expansion for efficient reversible data hiding. IEEE Trans. Image Process. 2013, 22, 5010–5021. [Google Scholar] [CrossRef] [PubMed]
- Li, F.; Zhang, L.; Qin, C.; Wu, K. Reversible data hiding for JPEG images with minimum additive distortion. Inf. Sci. 2022, 595, 142–158. [Google Scholar] [CrossRef]
- Li, F.; Qi, Z.; Zhang, X.; Qin, C. JPEG reversible data hiding using dynamic distortion optimizing with frequency priority reassignment. IEEE Trans. Circuits Syst. Video Technol. 2022, 32, 8849–8863. [Google Scholar] [CrossRef]
- Li, F.; Qi, Z.; Zhang, X.; Qin, C. Progressive histogram modification for JPEG reversible data hiding. IEEE Trans. Circuits Syst. Video Technol. 2023, 34, 1241–1254. [Google Scholar] [CrossRef]
- Di, F.; Zhang, M.; Huang, F.; Liu, J.; Kong, Y. Reversible data hiding in JPEG images based on zero coefficients and distortion cost function. Multimed. Tools Appl. 2019, 78, 34541–34561. [Google Scholar] [CrossRef]
- Yin, X.; Wu, S.; Chen, B.; Wang, K.; Lu, W. Reversible data hiding in JPEG document images based on zero coefficients embedding. Signal Process. 2023, 206, 108917. [Google Scholar] [CrossRef]
- Huynh, V.T.; Vo, P.H.; Nguyen, T.S. A Novel Reversible Data Hiding for JPEG Images Based on Zero AC Coefficients Shifting. In Proceedings of the International Symposium on Information and Communication Technology, Danang, Vietnam, 13–15 December 2024; Springer Nature: Singapore, 2024; pp. 353–363. [Google Scholar]
- Image Database of BOSSbase 1.01. Available online: http://dde.binghamton.edu/download/ (accessed on 15 July 2024).
- Anon. The USC-SIPI Image Database [EB/OL]. Available online: https://www.doc88.com/p-694588069958.html (accessed on 12 September 2012).
- Woods, L. Website of the independent JPEG group. J. Physiol. 1988, 393, 213–231. [Google Scholar]
Disclaimer/Publisher’s Note: The statements, opinions and data contained in all publications are solely those of the individual author(s) and contributor(s) and not of MDPI and/or the editor(s). MDPI and/or the editor(s) disclaim responsibility for any injury to people or property resulting from any ideas, methods, instructions or products referred to in the content. |
© 2025 by the authors. Licensee MDPI, Basel, Switzerland. This article is an open access article distributed under the terms and conditions of the Creative Commons Attribution (CC BY) license (https://creativecommons.org/licenses/by/4.0/).