Abstract
Traffic simulation is essential for evaluating transportation policies, infrastructure changes, and mixed traffic scenarios with human-driven and autonomous vehicles, yet its reliability critically depends on accurate calibration of origin–destination (OD) traffic demand. Traditional calibration workflows rely on trial-and-error adjustments and static numerical outputs, making it difficult for analysts to interpret error patterns, understand OD-to-link relationships, and efficiently refine traffic demand in complex urban networks. To address these challenges, we conducted a design study with transportation simulation experts to characterize the OD calibration workflow and derive key analytical tasks, which informed the development of ODCalibrator, an interactive visualization system that supports human-in-the-loop calibration through coordinated views, visual diagnostics, and iterative adjustment capabilities. We demonstrate its utility via a narrative usage scenario and domain expert feedback, showing that the system enables analysts to quickly identify error-prone regions, explore the effects of OD adjustments, and leverage domain expertise to produce more efficient and interpretable calibration outcomes for urban traffic simulations.
1. Introduction
Traffic simulation is a cornerstone of modern transportation analysis enabling researchers to evaluate the impact of new policies, infrastructure changes, and emerging technologies such as autonomous vehicles. In autonomous driving environments, simulation allows analysts to assess how different scenarios affect road networks [1], considering that autonomous vehicles can employ diverse operational strategies, including optimal route selection, lane changing, and speed regulation [2].
The reliability of traffic simulation critically depends on how well its input data and assumptions represent real-world conditions. A key step in this process is the calibration of the origin–destination (OD) matrix, which specifies how traffic demand is distributed across the network [3]. Accurate OD calibration ensures that simulated traffic patterns align with observed conditions, directly impacting the validity of downstream analyses. If the OD matrix is poorly calibrated, simulations may produce unrealistic flows and misrepresent congestion hotspots, ultimately leading to misguided planning or policy decisions. This challenge is amplified in complex urban networks and mixed-traffic environments where human-driven and autonomous vehicles interact [4]. Unlike continuous-flow highways, urban networks with frequent intersections and diverse routing behaviors demand calibration at the zone or even link level to achieve realistic results [5].
A road network consists of links, representing individual road segments, and nodes, which connect these links. Traffic flow, however, is not confined to individual links but emerges from continuous movement across the network. In practice, OD calibration often relies on traffic volumes aggregated at the Traffic Analysis Zone (TAZ) level, which analysts define according to the study’s objectives. Throughout this process, human expertise plays an unavoidable role: analysts iteratively adjust traffic demand and interpret results based on experience and domain knowledge [6,7]. As a result, outcomes may vary depending on the analyst’s interpretation or research context, and purely algorithmic approaches are often insufficient. These characteristics highlight the need for tools that allow analysts to verify calibration outcomes visually, understand how OD adjustments propagate through the network, and interactively refine their decisions.
Various traffic simulation platforms, such as Simulation of Urban Mobility (SUMO) [8,9], PTV VISSIM [10], MATSim [11], and TRANSIMS [12], provide analysts with the ability to model urban mobility and obtain detailed link-level traffic outputs. While these tools are effective for generating and simulating traffic flows, their support for OD calibration workflows remains limited. They typically produce numerical outputs or static visualizations, offering little guidance on how individual OD pairs contribute to link-level mismatches or how local adjustments affect the broader network. As a result, analysts often rely on time-consuming trial-and-error processes without sufficient interactive support.
Existing traffic simulation platforms provide powerful modeling and computation capabilities, but they offer limited support for exploring OD-to-link relationships or leveraging domain expertise to guide the calibration process. Because OD calibration often relies on expert intuition and involves complex interactions across the network, visualization can provide helpful cues, enabling analysts to better interpret traffic patterns, identify regions of interest, and iteratively refine OD traffic demand more effectively.
In this study, we address the challenges of OD traffic calibration in complex urban networks and introduce an interactive visualization system, ODCalibrator, designed to support analysts in exploring OD-to-link relationships and refining traffic demand iteratively. In summary, we make the following key contributions:
- We provide a systematic characterization of the OD traffic calibration workflow, conducted in collaboration with transportation simulation experts, which identifies domain-specific challenges and formalizes key analytical tasks that were previously underexplored.
- We introduce ODCalibrator, an interactive visualization system designed around these analytical needs, which integrates coordinated views, diagnostic metrics, and iterative adjustment features that extend beyond conventional calibration approaches.
- We illustrate how ODCalibrator facilitates the calibration process through a narrative usage scenario and collected feedback from domain experts demonstrating its potential to improve both efficiency and insight generation in real-world workflows.
The remainder of the paper is organized as follows. Section 2 reviews related work and clarifies the relative positioning of our research. Section 3 describes our methodology, covering the domain situation analysis, the dual-mode calibration method, and the overall system architecture and design. Section 4 then presents the visualization design goals and their implementation, followed by a system evaluation that combines a usage scenario with domain expert feedback. Section 5 discusses limitations and future directions, and Section 6 concludes the paper.
2. Related Work
In the traffic simulation literature, the term “calibration” has often been used to denote the adjustment of microscopic driver behavior parameters, such as desired time headway, acceleration, or minimum gap, frequently accompanied by sensitivity analyses to identify the most influential parameters [9,13,14]. Such principles of traffic microsimulation calibration have been comprehensively discussed by Hollander and Liu [15], while the reliability and uncertainty of trajectory-based parameter calibration have also been critically examined [16]. In contrast, our study employs the term specifically in the context of OD flow calibration, where the objective is to adjust OD matrices so that simulated link flows match observed traffic counts. While behavioral parameter calibration and its associated sensitivity analysis play a vital role in microscopic model validation, they are beyond the scope of this study. Our contribution is focused on enhancing OD flow calibration through interactive visualization and analyst support.
The calibration of OD traffic flow has been studied from two complementary perspectives: (1) algorithmic approaches for simulation-based OD calibration and (2) visualization techniques that can assist analysts in interpreting calibration outcomes. Most prior research has focused on the first aspect, seeking to improve the accuracy and efficiency of traffic simulation and OD estimation through statistical, machine learning, and metaheuristic methods [17,18,19]. By contrast, visualization and interaction support for calibration has remained limited, with many representative simulation platforms and tools often providing only tabular reports, static plots, or predefined GUI displays rather than enabling analysts to explore network behaviors, detect mismatches, and iteratively adjust OD flows [8,9,10,11,12]. In the following subsections, we review these two strands of work to position our approach in the context of existing methods.
2.1. Automated OD Calibration Approaches
The calibration of OD traffic demand has been extensively studied in the context of simulation-based traffic analysis. Early methods primarily focused on static or aggregate network representations using approaches such as the Generalized Least Squares (GLS) [17] and state-space models [20]. While these methods provided a theoretical foundation for OD estimation, they often struggled to capture the complex dynamics of urban networks, where frequent intersections and heterogeneous driving behaviors are prevalent [1]. Consequently, practical calibration has long relied on trial-and-error adjustments and the engineering judgment of experienced analysts [21], although more structured multi-stage procedures have also been proposed to enhance reproducibility [22]. Lin [23] further demonstrated a system-level approach by calibrating the DynasTIM framework with dynamic OD flow estimation and surveillance-based traffic counts, showing improved correspondence between simulated and observed flows.
Microscopic traffic simulation has enabled more precise modeling of vehicle movements by representing individual drivers as agents [24]. Car-following models such as the Intelligent Driver Model (IDM), Optimal Velocity Model (OVM), and Gipp’s Model have been widely analyzed in simulation tools like NETSIM and CARSIM [25], with the IDM in particular forming the basis for numerous studies on congested traffic states and empirical validation [26]. These studies reveal that model performance can vary significantly as network conditions or driver behaviors change, highlighting the importance of accurate calibration to reflect real-world traffic dynamics. Li et al. [27] further demonstrated this by proposing a procedure that integrates OD demand estimation with driver behavior parameter calibration in microscopic models.
A crucial component of simulation-based calibration is the choice of objective function, which may include speed, traffic volume, travel cost, or acceleration/deceleration profiles. Zhou et al. [28] analyzed car-following models to simulate traffic oscillations and predict driver travel behavior. Their study revealed that accurately capturing oscillations is subject to multiple constraints, and they demonstrated how improper selection of objective functions can introduce significant discrepancies, which they addressed using a neural network-based model. Similarly, Daguano et al. [14] applied artificial neural networks (ANNs) in the calibration process to minimize errors in traffic volume and average speed while improving the correlation between simulation results and observed traffic conditions. Along similar lines, recent studies have also leveraged real-time video analysis with machine learning to calibrate macroscopic traffic models, substantially improving correspondence with observed conditions [29].
Beyond neural network approaches, recent studies have also explored metaheuristic algorithms to improve calibration efficiency. Omrani and Kattan [18] developed a genetic-algorithm-based framework that jointly estimates OD flows and calibrates behavioral parameters in a high-performance computing environment. Lidbe et al. [19] conducted a comparative evaluation of multiple metaheuristic methods, including genetic algorithms (GAs), Simulated Annealing (SA), and Tabu Search (TS), with the goal of minimizing objective function errors, demonstrating statistical goodness of fit, and assessing performance in calibration that relies on simulation. These efforts reflect ongoing attempts to reduce the complexity of calibration and improve adaptability in traffic systems that are becoming increasingly complex. More advanced statistical methods, such as enhanced simultaneous perturbation stochastic approximation (E-SPSA), have also been introduced to incorporate demand variability and distributional characteristics into the calibration process [30].
While these algorithmic approaches have advanced the accuracy and efficiency of OD calibration, they primarily focus on producing optimized OD estimates rather than supporting analysts in understanding or iteratively refining their calibration decisions. In practice, analysts often face challenges in diagnosing why certain OD pairs cause mismatches or in tracing how adjustments propagate through the network. Therefore, visualization and interactive support can be seen as a natural extension of simulation-based calibration, providing analysts with tools for diagnosing mismatches and refining decisions. Building on this perspective, our work introduces an interactive visualization system that enables users to explore OD-to-link relationships, interpret discrepancies, and guide human-in-the-loop calibration.
2.2. Human-in-the-Loop Visualization for Calibration
Despite the technical advances in simulation-based calibration, the resulting models and numerical outputs remain difficult for analysts, especially those without deep technical expertise, to interpret and apply effectively. Calibration often involves understanding how adjustments to OD flows affect traffic conditions at the level of individual links across the network. However, conventional tools primarily provide tabular or static outputs with limited guidance for exploration. Xu et al. [31] emphasized the need for more intuitive, web-based visualization interfaces that allow analysts to interact with simulation results, perform comparative analyses, and identify spatial patterns of mismatch. However, the limitations of parameter-focused calibration methods also highlight that uncertainty can remain even with detailed trajectory data [16], reinforcing the need for interactive analyst support.
These studies underscore a critical gap: While existing methods can generate accurate traffic simulations, they provide limited support for leveraging domain expertise or guiding iterative OD calibration in practice. To the best of our knowledge, no existing interactive visualization tool has been specifically designed to directly support the OD traffic flow calibration process. Our work addresses this gap by introducing a web-based interactive visualization system that supports analysts in exploring OD-to-link relationships, interpreting calibration outcomes, and refining traffic demand through human-in-the-loop workflows. Unlike the automated simulation-based approaches described in Section 2.1, our system is not intended to replace optimization algorithms but to complement them by enhancing interpretability and providing interactive guidance for adjustment.
Importantly, ODCalibrator is designed to work in conjunction with existing simulators such as SUMO (Figure 1). The system receives link-level traffic outputs from SUMO, enables analysts to diagnose discrepancies and refine OD flows through the web-based visualization interface, and then sends updated OD sets back to SUMO for re-simulation. In practice, SUMO runs on a server, while the web front-end communicates with the server to exchange simulation results and new OD inputs. In this way, ODCalibrator complements simulation-based calibration methods by placing analysts directly in the loop of the calibration process.
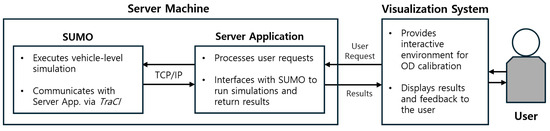
Figure 1.
Integration of ODCalibrator with SUMO. The server application receives user requests from the visualization system, invokes SUMO to perform vehicle-level simulations through TraCI, and returns the results. The visualization system provides an interactive environment for OD calibration and communicates the results and feedback to the user.
2.3. Visualization Approaches in Traffic and Autonomous Driving Research
While the preceding subsections focused on algorithmic and visualization methods directly related to OD calibration, it is also important to situate our work within broader visualization efforts in traffic and autonomous driving research. Recent advances in this area highlight the essential role of visualization in bridging simulation outputs and human interpretation, extending beyond calibration to applications in traffic management and intelligent vehicle systems. Visualization not only complements algorithmic approaches by enabling analysts and decision-makers to interact with complex data but also supports the observation of dynamic behaviors and the validation of model reliability.
Several studies have demonstrated how visualization enhances the credibility and applicability of simulation. Shi et al. [32] proposed an integrated co-simulation framework linking SUMO with CARLA, providing not only high-fidelity traffic dynamics but also realistic 3D visualization for autonomous vehicle testing. Similarly, Sun et al. [33] introduced an automatic calibration method that exploits vehicle trajectory data, where interactive visualization supports analysts in validating demand and behavioral parameters. Beyond calibration, the emergence of digital twin concepts has further advanced visualization. Kusić et al. [34] presented a continuously synchronized digital twin of the Geneva motorway, in which real-time traffic sensor data are fused with microscopic simulation, enabling dynamic visualization and predictive analytics for traffic management. Jin et al. [35] also emphasized the importance of high-resolution 3D data in constructing digital twins for smart mobility, underscoring the convergence of simulation, visualization, and intelligent transport applications.
Collectively, these works indicate that visualization is not a mere add-on but a methodological component that supports transparency, trust, and interactive analysis. This perspective is consistent with established visualization design models that emphasize multi-level task abstraction and validation [36,37]. Building on this body of work, our study incorporates visualization as a fundamental layer of OD calibration, allowing users not only to obtain optimized results but also to visually inspect calibration processes and outcomes in real time. This approach positions visualization as a core enabler of interpretability and decision support within simulation-based calibration systems.
3. Methods
The purpose of Section 3 is to describe how we grounded our system design in the practical needs of domain experts and structured our methodology accordingly. To this end, we conducted biweekly meetings over an eight-month period with two experts (P1 and P2) specializing in traffic simulation and OD calibration. Both have more than five years of experience working with SUMO to model urban traffic flows and iteratively adjust OD matrices based on observed traffic data. Their insights into the calibration workflow provided us with a concrete understanding of the challenges in aligning simulation outputs with real-world traffic conditions.
This section is organized to reflect that understanding. We first describe the domain situation in which our collaborators operate, including their goals and constraints. We then characterize the data involved in the calibration process and abstract the essential tasks analysts perform during iterative adjustments of OD inputs. Finally, we present the dual-mode calibration method and the overall system architecture that build on this problem analysis.
3.1. Domain Situation Analysis
Through our collaboration with two traffic simulation experts, we observed that their OD traffic flow calibration workflow, although complex and iterative, could be conceptually organized into three high-level stages: (1) simulation preparation, (2) result inspection and comparison, and (3) OD matrix adjustment and refinement (Figure 2). While the domain experts did not initially describe their work in such terms, they strongly agreed with this framing once we introduced it. To structure our domain situation analysis, we describe this workflow in terms of a user persona, the underlying data, and the analytical tasks involved.
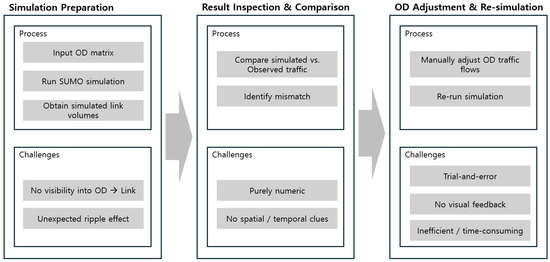
Figure 2.
Three-stage workflow of OD traffic flow calibration and associated challenges, based on expert observations.
3.1.1. User Persona
As the first perspective, we introduce a fictional but representative user persona, Jenny, a transportation analyst tasked with improving the fidelity of traffic simulations via OD flow calibration. Jenny is a transportation analyst working for a municipal planning office. Her primary responsibility is to calibrate traffic simulations to better match observed traffic conditions. She uses SUMO to run simulations based on OD matrices that describe travel demand across different regions in the city.
Each day, Jenny begins by preparing a candidate OD matrix, running it through SUMO, and obtaining the simulation output in the form of CSV files that record link-based traffic volumes across the network. She compares these simulated volumes with observed data collected from traffic sensors installed throughout the city. When discrepancies (i.e., error) arise, she attempts to manually modify traffic demand between specific origin–destination pairs—often based on experience and intuition—and reruns the simulation to evaluate whether the mismatch improves.
This process, however, is tedious and opaque. Jenny lacks visibility into how individual OD pairs affect specific links, and she often finds that small adjustments lead to unexpected or network-wide ripple effects. Since the output is purely numerical, it is difficult for her to identify spatial or temporal patterns in the mismatch, or to understand why certain areas are consistently misrepresented. While she does use existing visualization tools, such as basic traffic heatmaps or network plots, these tools offer limited interactivity and often lack direct linkage between OD input changes and their localized impact on traffic volumes. As a result, it remains difficult for her to pinpoint which OD adjustments lead to improvements and which do not.
As a result, much of Jenny’s work relies on trial and error, with limited visual feedback or guidance. This makes the calibration process time-consuming, inefficient, and error-prone, especially in large-scale networks with complex traffic dynamics. These challenges highlight the need for an interactive visualization system that supports Jenny and other analysts in exploring OD-to-link relationships, diagnosing sources of mismatch, and making more informed calibration decisions.
3.1.2. Data Abstraction
In OD traffic calibration, a wide range of data entities are involved across the simulation pipeline and user interface. These data abstractions serve as the foundation for both algorithmic processing (e.g., routing or simulation) and interactive analysis (e.g., error exploration or OD editing). Below, we describe how raw simulation inputs are transformed and how these are restructured within the system into key visual units of analysis.
As illustrated in Figure 3, the calibration process begins with an OD matrix (.od file), which specifies travel demand between origin–destination pairs of road links. Given the road network definition (.net.xml), the OD matrix is used to generate a trip file (.odtrips.xml), listing individual vehicle departures. A routing step then produces a route file (.rou.xml), which determines each vehicle’s path through the network. These components are integrated through a SUMO configuration file (.sumocfg), specifying simulation time spans and additional features such as traffic signals. During simulation, SUMO records vehicle movements and traffic flow statistics, from which link-level traffic volumes can be extracted and compared against observed sensor data to assess mismatches.
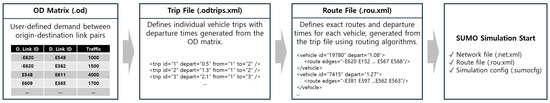
Figure 3.
Overview of data processing steps from OD matrix to SUMO simulation execution.
To support interactive calibration, our system reorganizes the underlying simulation data into four key abstractions that serve as the basis for visual reasoning and user operations:
- Link: A directed segment in the road network, representing the unit at which traffic is measured and compared. Simulated and observed traffic volumes are aggregated per link, and error metrics, such as Mean Absolute Error (MAE) and Mean Absolute Percentage Error (MAPE), are computed at this level.
- OD Pair: A combination of an origin link and a destination link that defines a directional travel demand. Each OD pair holds a numeric traffic value indicating the number of trips to be generated from the origin to the destination. During calibration, these values are adjusted to reduce mismatch against observed traffic. OD pairs are also associated with contribution scores that quantify their relative impact on overall traffic mismatches across the network, helping analysts prioritize which OD pairs to refine.
- Focus Links: A user-defined subset of links that reflect the analyst’s domain-specific interests—such as critical intersections, arterial roads, or areas involved in active planning. While network-wide error patterns are useful for global assessment, calibration efforts often concentrate on these high-priority segments. Focus links enable localized error evaluation and targeted refinement, allowing users to restrict metrics and analysis to the parts of the network most relevant to their goals.
- OD Set: A versioned snapshot of the entire OD matrix, generated each time the user makes changes. Each OD set maintains simulation or estimation results and corresponding error metrics, enabling comparison across multiple calibration attempts.
Together, these abstractions allow the system to translate raw simulation inputs into interactive views that support diagnosis, iteration, and visual reasoning throughout the calibration workflow.
3.1.3. Task Abstraction
From the current practice of domain experts, we have established the following key tasks involved in OD traffic calibration. These tasks were identified and iteratively refined through close collaboration with the domain experts over the course of our design study. To characterize the analytical goals and operations, we follow the task abstraction framework proposed by Brehmer and Munzner [36,37] and describe each task in the form of [Action → Target].
- Task 1: Produce Initial or Refined OD Matrices[Produce → OD Pair Traffic Values]Analysts manually assign or adjust traffic volumes between origin–destination pairs to define travel demand. This process is repeated iteratively during calibration, often informed by discrepancies identified in previous estimation or simulation results.
- Task 2: Execute Simulation Based on Updated OD Matrix[Produce → Simulated Traffic Volume (Link Level)]Analysts initiate a traffic simulation to generate simulated traffic volume at the link level, based on the current OD matrix. This simulation output serves as the basis for subsequent error analysis and guides further calibration decisions.
- Task 3: Examine Discrepancies Between Simulated and Observed Traffic[Identify → Error Metrics (Link- and Network-Level)]Using the simulation results, analysts evaluate discrepancies between simulated and observed traffic volumes. They examine both link-level and network-level error metrics to identify areas with significant mismatches, which informs the next round of OD matrix refinement.
- Task 4: Define a Set of Focus Links for Localized Evaluation[Browse → Domain-Relevant Link Subset]Rather than evaluating all links uniformly, analysts define a focus link set by browsing the network for segments that align with their domain interests, such as key intersections or problematic areas. This enables more targeted error analysis and reflects realistic analyst behavior, where only a subset of links typically guides decision making.
- Task 5: Explore OD Pairs Likely to Cause Link Mismatches[Discover → OD-to-Link Relationship]Analysts explore OD pairs that are suspected to contribute to mismatches by investigating how their traffic is distributed across the network. This task involves identifying OD pairs whose flow patterns may affect high-error links, helping analysts select promising candidates for adjustment.
- Task 6: Compare Calibration Outcomes Across Different OD Configurations[Compare → Error Metrics Across Calibration Attempts]To evaluate the effectiveness of multiple calibration attempts, analysts compare simulation results generated from different OD configurations. By reviewing error metrics at both link and network levels, they determine which configurations produce more accurate traffic estimates.
These tasks form a feedback loop, where insights gained from evaluating the simulation guide further modifications of the OD matrix. Our visualization system was designed to explicitly support each of these tasks through targeted visual encodings and interactions.
3.2. Dual-Mode Calibration Method
We propose a dual-mode calibration method designed to address a central challenge in OD flow calibration: the need to repeatedly adjust OD matrices and assess their effects through simulation. As defined in our task abstraction (Section 3.1.3), this process involves a sequence of tightly connected tasks—modifying OD values (Task 1), running simulations (Task 2), identifying mismatches (Task 3), identifying candidate OD pairs for adjustment based on their contribution to observed mismatches (Task 5), and comparing calibration outcomes (Task 6). However, in practice, full traffic simulation can take considerable time. For instance, simulating one hour of traffic in SUMO may take approximately 10 min or more, with the runtime largely depending on the amount of input OD demand. This makes frequent iterations impractical, particularly when analysts need to explore the effects of small, incremental adjustments to the OD matrix.
To address this challenge, our system adopts a dual-mode calibration method, which separates rapid early-stage exploration from computationally intensive final validation. As illustrated in Figure 4, users can choose between two evaluation modes after each OD modification:
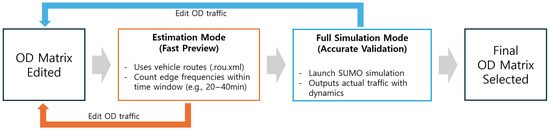
Figure 4.
A dual-mode OD calibration method supported by our system. Users can iteratively refine the OD matrix using a fast, estimation-based preview or validate the results through a full SUMO simulation. The estimation mode enables quick feedback by counting edge (i.e., link) traversals from pre-generated vehicle routes, while the simulation mode captures dynamic traffic behaviors for final verification.
- Estimation mode, which provides a fast but approximate traffic preview based on pre-simulation vehicle route data.
- Simulation mode, which runs a full SUMO simulation to obtain accurate but computationally expensive traffic outputs.
According to domain experts, traffic volumes are typically not measured immediately at the start of a simulation. Instead, a warm-up period of around 20 min is allowed for the network to stabilize, after which traffic on each link is counted, usually until the 40 min mark, depending on the scenario. This window ensures that transient conditions do not skew the measured traffic volumes, leading to more reliable estimates. The resulting link-level traffic volumes are then compared against observed data to compute error metrics, forming the basis for evaluating calibration quality.
In estimation mode, the system bypasses full simulation and instead derives lightweight traffic counts directly from the pre-generated vehicle route file (.rou.xml), which specifies each vehicle’s departure time and complete path through the network. Vehicles scheduled to depart within the target window are scanned, and the count on each traversed link is incremented accordingly. These aggregated counts provide a fast approximation for comparing against observed traffic data. This approach does not account for congestion effects or detailed driving dynamics and therefore cannot guarantee the same accuracy as full simulation. However, its purpose is not to deliver precise traffic forecasts but to support rapid, exploratory calibration. In practice, we found that estimation outcomes tend to resemble those of full simulation at an aggregate level, which makes this mode effective for quick hypothesis testing. This trade-off reflects the overall focus of our work on visualization and interactive refinement rather than on developing new traffic models.
Both modes share a unified visualization interface, allowing users to explore mismatches, trace contributing OD pairs, and iteratively refine traffic demand. Estimation mode supports rapid hypothesis testing and early-stage calibration, while simulation mode serves as a final validation step once an acceptable OD traffic configuration has been reached.
This dual-mode method was informed by discussions with domain experts, who emphasized the importance of responsiveness during exploratory analysis. By separating fast preview from slow validation, the system helps users iteratively reduce mismatches without incurring unnecessary simulation costs at every step.
3.3. System Architecture and Design
The architecture of our system is designed to support iterative, exploratory calibration of OD traffic flows while balancing computational efficiency and analytical flexibility. To achieve this, the system adopts a modular client–server architecture that separates simulation, estimation, data management, and visualization responsibilities (Figure 5).
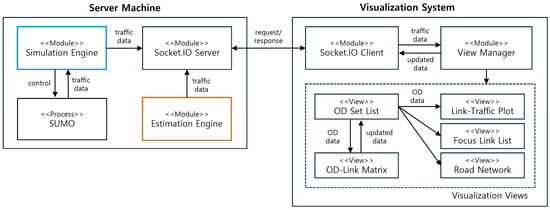
Figure 5.
System diagram of ODCalibrator. The server machine hosts estimation and simulation engines behind a Socket.IO gateway, with the simulation engine controlling SUMO through the TraCI interface. On the client side, a view manager coordinates multiple visualization views. Arrows indicate data flows such as OD data, traffic data, and updated data, illustrating how estimation, simulation, and visualization components interact to support calibration tasks.
At the core of the architecture is the dual-mode calibration method described in the previous subsection. This method requires two distinct modes of traffic analysis: estimation and simulation, which differ significantly in computational cost and data source. To accommodate this, the server hosts dedicated estimation and simulation engines; manages OD matrices, vehicle route files, and simulation outputs; and communicates with the SUMO process via the TraCI interface. A centralized server design ensures consistency across calibration attempts and enables asynchronous task execution without blocking the client interface.
On the client side, the system provides an interactive visualization environment organized around a view manager and multiple coordinated visualization views [38]. These views enable users to inspect traffic mismatches, trace their sources, modify OD traffic values, and track the progression of calibration over time. Importantly, both estimation and simulation results are rendered through the same visual interface, promoting seamless comparison between fast approximations and validated outputs.
This architectural design constitutes a key part of our overall method: By decoupling computationally intensive estimation and simulation tasks from the interaction-heavy visualization components, the system enables analysts to iteratively refine OD flows with limited resources while maintaining a responsive interface. The visualization design discussed in the following section directly builds on this architecture, translating its modular structure and data flows into coordinated visual interactions.
4. Results
In this section, we present the outcomes of our work in terms of visualization design and evaluation. We first outline the visualization design goals that guided our development. We then describe the resulting implementation, including the main visualization components, their interactions, and technical details of the system realization. Finally, we report on the evaluation of the system, consisting of a usage scenario and feedback from domain experts.
4.1. Visualization Design Goals
Building on the tasks outlined in Section 3.1.3 and the dual-mode calibration method introduced in Section 3.2, we summarize the key visualization design goals for our system. These goals reflect practical needs identified through close collaboration with domain experts and address core requirements for supporting OD traffic calibration through interactive visual analysis.
- Goal 1: Allow Direct Editing of OD Pair Traffic Values[Supports Task 1] The system should provide an intuitive interface for assigning or adjusting traffic values between OD pairs. Analysts need to iteratively refine these values during calibration via simulation and error evaluation results.
- Goal 2: Support Execution of Traffic Simulation from Modified OD Matrix[Supports Task 2] Users should be able to trigger traffic simulations using the modified OD matrix and generate updated link-level traffic volumes, which serve as the foundation for subsequent error evaluation.
- Goal 3: Visualize Mismatches Between Simulated and Observed Traffic[Supports Task 3] The system should clearly present where simulated traffic deviates from observed traffic. Both link-level and network-wide error metrics must be visualized to help analysts identify problematic areas that require further refinement.
- Goal 4: Support Focused Evaluation via User-Defined Link Subsets[Supports Task 4] To reflect realistic workflows where analysts concentrate on specific network regions, the system should allow users to define and manage focus link sets. These subsets guide localized error analysis, enabling users to filter visualizations and metrics around domain-relevant areas such as key intersections or bottlenecks.
- Goal 5: Reveal OD-to-Link Flow Relationships for Diagnostic Reasoning[Supports Task 5] To support the selection of OD pairs for adjustment, the system should enable users to explore how individual OD pairs contribute to traffic on specific links. By tracing these relationships, users can investigate potential candidates for modification based on how their flows influence link-level mismatches.
- Goal 6: Enable Comparison Across Calibration Attempts[Supports Task 6] The system should support comparative analysis of simulation results across different OD configurations, grounded in the history of calibration attempts. By maintaining a structured record of previous modifications and their outcomes, the system enables users to track progress, revisit past decisions, and identify which adjustments led to improved accuracy.
- Goal 7: Maintain Interface Consistency Across Modes[Supports cross-task usability across both estimation and simulation modes] The system should preserve a consistent interface and interaction model regardless of whether the user is in estimation or simulation mode. By maintaining shared visual structures and control mechanisms, the system reduces cognitive overhead and allows users to seamlessly transition between rapid exploration and final validation phases.
4.2. Visualization Implementation
Following the visualization design goals, we implemented an interface that integrates multiple coordinated views for OD traffic calibration. These views are designed to support analysts in visually exploring traffic flows, diagnosing errors, and iteratively refining OD values. An overview of the interface is shown in Figure 6. The views are tightly linked: selections and changes in one view propagate across others, enabling users to iteratively refine OD values based on visual feedback and maintain situational awareness throughout the calibration workflow. In the following subsections, we describe the design rationale and role of each view in detail.
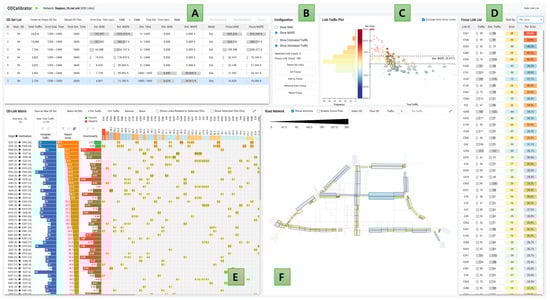
Figure 6.
The main interface of ODCalibrator consists of six coordinated views: (A) OD Set List that tracks calibration iterations and associated error metrics; (B) configuration panel that allows switching between estimation and simulation modes and managing focus sets; (C) Link-Traffic Plot that visualizes link-level error distributions; (D) focus link list that displays detailed metrics for individual links in a ranked list; (E) OD-Link Matrix that supports OD-to-link reasoning and interactive OD value editing; and (F) road network view that provides a spatial overview of traffic patterns and mismatches.
4.2.1. OD Set List
The OD Set List (Figure 7) displays all OD configurations generated throughout the calibration process in a structured, scrollable table. Each row corresponds to a complete OD set, which is a collection of OD pairs and their assigned traffic values. The table includes metadata such as the number of OD pairs, total traffic volume, and the associated evaluation time range, offering a compact summary of each calibration attempt.
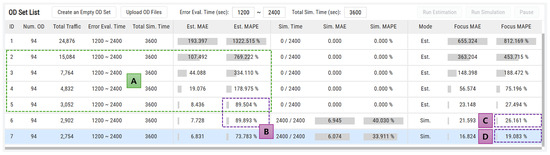
Figure 7.
OD Set List summarizing each calibration iteration, enabling comparison of traffic totals, error metrics, and modes to track calibration progress. (A) Global scaling and quick estimation iterations, showing errors becoming more balanced. (B) MAPE rises slightly despite lower MAE. (C) Simulation-based MAPE closely aligns with estimation mode. (D) MAPE drops below 20%, marking successful calibration.
When a user clicks on a row, the corresponding OD set becomes active (highlighted with a light blue background in Figure 7), and all other views in the interface are automatically updated to reflect this selection. Users can then perform a quick estimation of errors by clicking the Run Estimation button in the view header, or initiate a full simulation using the Run Simulation button to obtain more accurate error metrics based on actual simulation results (Goal 2). This interaction enables seamless transitions between configurations and modes of analysis without the need for manual file handling or reloading. Through these interactions, users can freely branch from an existing OD configuration, explore the effects of different adjustments, and later return to earlier versions for comparison. This supports an iterative and flexible approach to calibration that aligns with how domain experts typically work in practice.
To support both estimation and simulation modes, the view displays associated error metrics, including MAE and MAPE, for each mode. These metrics are computed over both the entire network and the user-defined focus link set. The Mode column indicates which mode (estimation or simulation) was used to compute the error metrics for the current focus link set, helping users interpret the displayed values in context. These error values are shown both as precise text and as horizontal bars whose lengths encode the corresponding magnitudes. This dual representation leverages position along a common scale, which is known to support highly accurate perceptual comparisons [39], helping users quickly assess relative performance across OD sets.
By maintaining this evolving record, the OD Set List helps users revisit previous decisions and track the effect of incremental changes over time. In doing so, it reinforces a history-aware workflow, which domain experts have identified as essential for building confidence in calibration outcomes.
4.2.2. Link-Traffic Plot
The Link-Traffic Plot (Figure 8A) provides a dual-view summary of link-level error patterns to support localized error analysis (Goal 3). The right-hand scatterplot encodes each link as a point, plotting true traffic volume on the x-axis and the corresponding error, defined as simulated minus observed, on the y-axis. Users can switch between MAE and MAPE, and between results from estimation and simulation modes, via the configuration panel. These selections dynamically update the visualization while maintaining a consistent visual layout, allowing analysts to switch between modes and metrics without cognitive overhead. This consistency helps users focus on analytical comparison rather than relearning the view structure, thereby facilitating efficient performance evaluation across different calibration conditions (Goal 7).
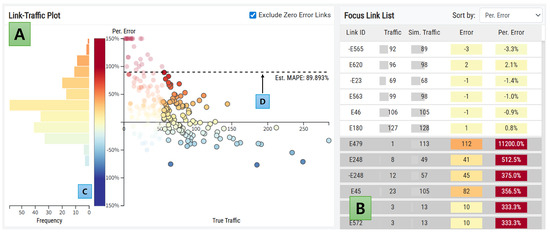
Figure 8.
(A) Link-Traffic Plot where only links with true traffic above approximately 50 have been designated as focus links by the user; non-focus links are shown in a semi-transparent style. (B) Focus link list displaying the same set of focus links, while non-focus links are rendered with a gray background. (C) Diverging color scheme centered at zero, showing both magnitude and direction of errors. (D) Horizontal reference line indicating the network-wide average error.
Each point’s color encodes the value of the selected error metric, using a diverging color scheme centered at zero (Figure 8C). Errors with increasingly positive values are shaded in deeper red, while increasingly negative values are shown in deeper blue. This color encoding not only reveals the magnitude of error but also its directionality, indicating whether traffic is overestimated or underestimated. A horizontal reference line (Figure 8D) marks the network-wide average error, computed based on the selected mode. This reference aids rapid identification of outliers relative to the overall distribution.
To complement the scatterplot, the left-hand histogram visualizes the global distribution of the selected error metric across all links. Histogram bars are shaded consistently with the scatterplot’s color scale, promoting visual continuity and helping users detect skewed or multi-modal distributions that may suggest underlying patterns or irregularities in calibration. This color scheme also functions as the global legend for the entire system. It is applied consistently to encode per-link error in the road network, the OD-Link Matrix, and the focus link list, thereby supporting a coherent visual language across multiple views.
To help users focus on meaningful discrepancies, links with zero error can be optionally excluded from the plot using the checkbox at the top right. This feature is particularly useful because a large proportion of links often exhibit zero error, which, while common, provides little actionable insight for calibration. Without filtering these links, the histogram may become visually dominated by zero-error bars, reducing contrast in the more relevant error ranges. Additionally, the y-axis range for error is capped at 1.5 times the maximum observed traffic volume. This threshold was chosen to balance detail and interpretability: beyond a certain magnitude, excessively large errors, often caused by low observed volumes, are less informative in fine-grained calibration decisions and can skew the overall distribution. By bounding the visualized error range, the system ensures that moderate yet impactful discrepancies remain legible and analytically useful.
Together, the scatterplot and histogram provide both granular and aggregate insights into link-level error characteristics. These allow users to identify mismatched links, evaluate the effectiveness of calibration, and select candidate links for more focused refinement. User interactions supported by this view, such as brushing, are described in detail in Section 4.2.6.
4.2.3. Focus Link List
The Focus Link List (Figure 8B) presents a ranked tabular view that displays detailed error metrics for all links in the network, with a special emphasis on those marked as focus links. Each link is represented as a row, enabling per-link inspection of traffic statistics such as observed traffic volume, estimated or simulated volume (depending on the selected mode), signed error, and percentage error. To support flexible data exploration, a combo box embedded in the view header allows users to sort the view in descending order based on any selected column. This tabular encoding provides a precise numerical complement to the more spatial or aggregate visualizations in the system.
To align with analysts’ workflows, links identified as part of the focus set are grouped and placed at the top of the table. These rows are shown with a standard white background to highlight their relevance, while the remaining non-focus links are pushed to the bottom and rendered with a gray background. This ordering and styling strategy reinforces a sense of prioritization and encourages attention toward actively calibrated links (Goal 4).
The Error and Per. Error columns are visualized using color bars (Goal 3), where each bar fills the full width of the cell and encodes the signed magnitude of error via a diverging color scale centered at zero. Positive errors are shown in red hues, negative errors in blue, and near-zero errors in neutral shades. Because errors can be both positive and negative, bar length is not used, and color alone communicates both magnitude and direction effectively. The third column dynamically updates to show either estimated or simulated traffic volumes, depending on the currently selected mode, reflecting consistent interface behavior across modes (Goal 7).
The diverging color scheme is reused from the Link-Traffic Plot and applied consistently across other views such as the OD-Link Matrix and road network, promoting coherent visual interpretation throughout the system. By tightly integrating numerical precision with visual encodings and view coordination, the focus link list allows users to diagnose problematic links, assess calibration progress, and determine which segments should be refined next.
4.2.4. Road Network
The road network (Figure 9) provides a spatial representation of simulation error across the entire network. Each link is drawn with directional geometry and colored according to the selected error metric, using the same diverging color scale as in the Link-Traffic Plot. This consistent encoding helps users interpret under- and overestimation spatially, revealing where calibration is needed most (Goal 3).
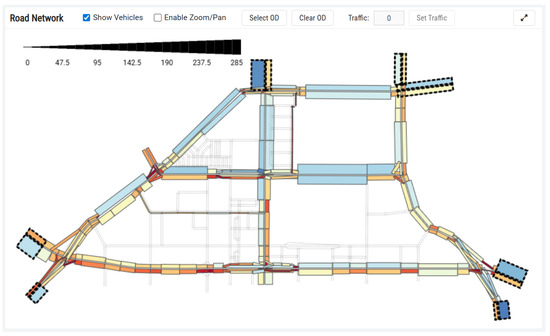
Figure 9.
Road network providing a spatial overview of the simulated area, where link thickness encodes traffic volume and link color encodes the selected error measure. This view preserves geographic context, allowing users to visually inspect and interactively select links on the map.
To support this spatial visualization, we preprocessed the raw SUMO network data to construct a simplified, analysis-ready representation (Figure 10). In the original SUMO output (leftmost panel), road geometry includes detailed multi-lane structures and junction topologies, which, while realistic, introduce visual complexity that hinders OD-level reasoning. Since our system focuses on traffic flow between origin–destination zones rather than per-lane behavior, we abstract this geometry by extracting a single centerline per link and reducing junctions to points (second panel). This step clarifies the logical connectivity of the network while omitting low-level traffic dynamics irrelevant to our calibration tasks.
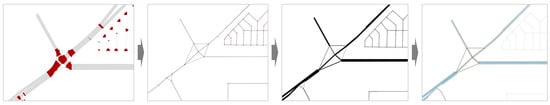
Figure 10.
Transformation of raw SUMO network into a simplified, link-based representation used in our system. From left to right: (1) original multi-lane geometry with detailed junctions, (2) centerline extraction and junction simplification, (3) traffic magnitude encoding via link thickness, (4) final representation with directional offset, error-based color encoding, and visual border enhancements.
To visualize traffic volume and simulation error on each link, we further enhanced the simplified network by encoding traffic magnitude as link thickness (third panel). In the final representation (fourth panel), We addressed the visual overlap between forward and reverse links, which are often rendered in close proximity, by applying a small directional offset. This helps preserve link directionality and avoids ambiguity. Additionally, we encoded error magnitude using a diverging color scale that is consistent with the one used in the Link-Traffic Plot, where stronger hues indicate larger errors. Subtle borders were added to each shape to improve visual separation between adjacent links. These enhancements result in a visually clean and information-rich network diagram that supports both overview and detailed inspection of link-level discrepancies.
By grounding the system in a semantically meaningful and visually coherent network structure, this view enables users to quickly detect problematic regions, interpret spatial patterns in the calibration results, and align them with domain knowledge such as key intersections or arterial roads.
4.2.5. OD-Link Matrix
The OD-Link Matrix (Figure 11) provides a matrix-based interface for analyzing how individual OD pairs impact traffic conditions across the network. Each row (Figure 11A) corresponds to an OD pair and each column (Figure 11B) to a focus link selected by the user. The length of each column’s bar is proportional to the absolute value of the user-selected error measure, which is redundantly encoded in the bar’s color. Matrix cell values (Figure 11C) encode the proportion of traffic on a given focus link that originates from the associated OD pair. These values are computed based on vehicle-level routing information, whether estimated in fast mode or generated from full simulation. This structure allows users to investigate how OD-level demand patterns propagate through the network and influence localized traffic errors.
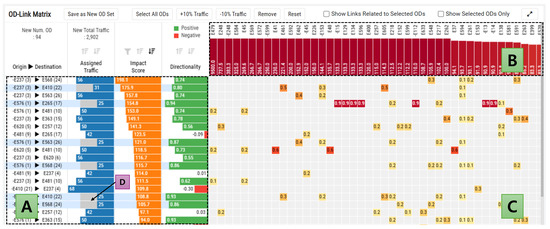
Figure 11.
OD-Link Matrix showing how OD-level traffic demand relates to link-level conditions: (A) rows represent individual OD pairs, (B) columns correspond to links in the focus set, and (C) cells encode the ratio of traffic on a given link that originates from the associated OD pair. This structure allows users to identify which OD pairs contribute most to traffic on specific links. (D) Gray bars show original traffic values, while blue bars indicate adjusted values.
Unlike conventional OD matrix representations that place origins and destinations along the rows and columns, respectively, our OD-Link Matrix maps each row directly to an active OD pair. This design choice is motivated by both the sparsity of real-world OD assignments and the structure of the encoded information. In practice, only a small fraction of all possible OD pairs carry non-zero traffic demand, resulting in a highly sparse matrix if visualized in the traditional origin-by-destination format. Moreover, since our system encodes link-level contributions for each OD pair, the amount of associated information per OD is substantial, often spanning many columns. Representing only the OD pairs with assigned traffic as rows not only improves space efficiency but also aligns with the user’s mental model, which is centered on editing and analyzing meaningful OD flows rather than navigating a sea of empty entries.
To support diagnostic reasoning, we introduce two summary metrics, impact score and directionality, that characterize how each OD pair relates to link-level errors. These metrics are computed with respect to the current set of focus links and are designed to help users prioritize which OD pairs to refine by quantifying their influence on mismatched links and capturing the directional nature of that influence (Goal 5).
The impact score quantifies how strongly an OD pair is connected to erroneous links. It is defined as
where represents the fraction of traffic on link l that can be attributed to vehicles traveling from the origin to the destination in OD pair , based on their assigned routes. The is the signed error on link l, defined as
where the predicted volume refers to either the simulated or estimated result, depending on the selected mode. High-impact OD pairs are those that significantly overlap with large-magnitude error regions, regardless of whether those errors result from overestimation or underestimation. These OD pairs are prioritized as candidates for adjustment due to their strong association with problematic areas.
While the impact score quantifies how strongly an OD pair is associated with high-error links, the directionality metric characterizes the directional nature of those errors, indicating whether they are predominantly overestimations or underestimations. Importantly, this metric is computed without incorporating OD-level traffic weights, focusing solely on the magnitude and sign of link-level errors.
We define directionality for each OD pair as
where denotes the set of links traversed by the OD pair, and represents the signed error on link l. The resulting value ranges from (connected only to underestimated links) to (connected only to overestimated links), with 0 indicating a balanced mix.
This formulation allows users to assess the overall error directionality associated with each OD pair, independent of how much traffic the OD contributes to each link. It is particularly useful for revealing whether an OD is structurally connected to problematic areas in the network, even if its current traffic volume is low. In practice, both metrics are updated throughout the simulation as link-level errors evolve, while the values shown in Figure 11 correspond to the final state after the simulation has completed.
In the matrix interface, both impact score and directionality are presented as color-coded bars next to the origin–destination link ID label, serving as row-level attributes. Impact scores are visualized using orange bars, where longer bars indicate stronger association with high-error links. Directionality values are shown using a diverging color bar: green bars represent OD pairs associated primarily with overestimated links (), while red bars indicate underestimation. These encodings provide an at-a-glance overview of which OD pairs are most involved in network mismatches and in which direction.
To support analysis, OD rows in the matrix can be sorted by either metric using the sort icons in the column headers. Analysts may use the impact score to prioritize OD pairs that influence large-magnitude errors and refer to directionality to understand whether those errors stem from over- or underestimation. Together, these metrics enable users to identify meaningful candidates for adjustment and determine how changes to OD values may affect calibration outcomes.
Users can select one or more OD pair rows (highlighted with a light blue background in Figure 11) and apply uniform adjustments to their traffic values using batch control buttons located in the header, such as +10% Traffic, Remove, or Reset. The original traffic values before adjustment remain visible as gray bars for reference, while the currently adjusted traffic values are shown as blue bars (Figure 11D). This capability streamlines the process of refining traffic allocations by allowing simultaneous edits across multiple OD pairs, rather than adjusting them individually. Once the desired modifications are made, users can click Save as New OD Set to preserve the updated configuration as a distinct version for subsequent evaluation (Goal 1).
To assist interpretation, the matrix includes a toggle option labeled Show Links Affected by Selected ODs, available as a checkbox on the right side of the header. When enabled, it highlights columns corresponding to links that receive non-zero traffic from any selected OD pair. In other words, the matrix is temporarily filtered to retain only the cells with non-zero values for the selected rows. This feature helps users anticipate where changes to selected OD pairs may influence downstream traffic patterns and simulation errors. Since the network may contain hundreds or thousands of links, it can be difficult to visually isolate which ones are meaningfully impacted by a specific OD pair. By automatically narrowing the view to relevant columns, this toggle allows users to focus their attention on affected regions, reducing visual clutter and reinforcing a cause–effect understanding essential for effective calibration decisions.
4.2.6. Interaction Design
To support coordinated exploration and iterative analysis, our system implements two key interaction techniques—brushing and linking [40]—across multiple views. These interactions allow users to seamlessly transition between different representations and maintain context while analyzing OD calibration results.
Brushing enables users to interactively select one or more visual elements through direct manipulation. In our system, both single-click selection and range-based brushing are supported. For example, users can click on a single link circle in the Link-Traffic Plot to select it, or drag over multiple elements to select a group. Similar rectangular brushing is available in the road network to select spatial clusters of links.
Brushed elements do not automatically become focus links. Instead, selected items can be optionally promoted to focus links via the configuration panel, giving users control over which selections are used for in-depth comparison or filtering (Goal 4). This two-step process supports exploratory workflows by decoupling initial selection from committed focus.
Linking ensures that hover or selection actions in one view trigger corresponding highlights in others. When a user hovers over a link in the road network, the associated entries in the Link-Traffic Plot, focus link list, and OD-Link Matrix are all highlighted. Likewise, hovering over a row in the OD-Link Matrix, which represents an OD pair (origin link and destination link), highlights the corresponding origin and destination links in the road network, with an arrow drawn between them to indicate travel direction. This coordinated highlighting allows users to examine the same OD pair or link from multiple perspectives across views, facilitating a richer understanding of its role in the network.
Together, brushing and linking promote fluid cross-view analysis and support diagnostic reasoning in the OD traffic calibration process.
4.2.7. Development Details
The system was implemented as a web-based client–server application. The server-side components were developed in Python (version 3.8), utilizing a Socket.IO server for real-time bidirectional communication. On the client side, we used the Angular framework for application logic and interface structure. Visualization components were implemented using a combination of HTML Canvas and D3.js [41], enabling interactive and high-performance rendering of traffic data. Communication between the server and client was handled via Socket.IO to support responsive, event-driven updates. For traffic simulation, we integrated SUMO, version 1.21, which provided the simulation engine for generating link-level traffic volumes based on the input OD matrices.
4.3. System Evaluation
To assess the practical utility of our system, we conducted a qualitative evaluation focusing on two complementary aspects: (1) a usage scenario that demonstrates how a transportation analyst might perform OD traffic calibration with our tool and (2) informal feedback collected from domain experts who reviewed the system after a guided walkthrough. Rather than a formal user study, this evaluation is intended to illustrate how our system supports real-world calibration workflows and to gather insights for future refinement.
4.3.1. Usage Scenario
To illustrate how our system supports OD traffic calibration in practice, we revisit the fictional persona Jenny, introduced in Section 3.1.1. Jenny is a transportation analyst working at a municipal planning office, where she is responsible for aligning simulated traffic volumes with real-world observations gathered from traffic sensors across the city.
Jenny begins by loading the OD matrix that has been previously used in her simulation study. Before making any changes, she first performs an estimation to obtain a fast, approximate assessment of the current network-level error. The result shows an estimated MAPE exceeding 1300%, indicating a highly significant error (the first row in Figure 7, corresponding to the initial OD set). To investigate this further, Jenny decides to examine the Link-Traffic Plot.
In the Link-Traffic Plot, she observes that the histogram shows a strong concentration of links near the upper end of the error axis, with many points forming a dense cluster around the maximum positive error range (Figure 12A). This indicates that the current OD matrix substantially overestimates traffic on multiple links, resulting in extreme positive discrepancies across the network (Task 3). Jenny switches to the focus link list to inspect exact error values for the most problematic links. She sorts the links in descending order by percentage error and observes a highly skewed distribution, with many links exceeding 1000% (Figure 12B).
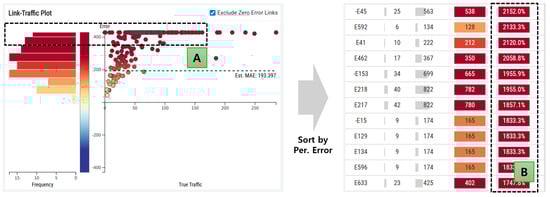
Figure 12.
Concentrated cluster of links near the maximum positive error range in the Link-Traffic Plot (A), and corresponding focus link list entries revealing extreme percentage errors exceeding 1000% (B).
To address this issue, Jenny decides to apply a global adjustment to the OD matrix. She selects all OD pairs with assigned traffic in the OD-Link Matrix and reduces the traffic for each by roughly half, adding the result as a new OD set (Task 1). As before, she runs an estimation to quickly assess the effect of her modification (Task 2). The Link-Traffic Plot now shows a modest improvement: the number of links with extreme errors has decreased, and the estimation MAE is roughly half of its previous value. However, the overall error distribution remains alarmingly high, with many links still experiencing large positive discrepancies. Recognizing that the network-wide demand is still likely overestimated, Jenny decides to repeat the same adjustment, further reducing traffic volumes across all OD pairs.
Through several iterations of global scaling and quick estimation checks (Figure 7A), Jenny observes the error distribution becoming more balanced (Task 6). This gives her confidence that the OD matrix is reaching a reasonable baseline from which she can proceed with targeted refinements.
She then shifts to selective adjustments (Task 5). By sorting the OD-Link Matrix by impact score and directionality, she identifies OD pairs strongly associated with overestimation and reduces their traffic (Figure 11). The result is mixed: the MAE decreases from 8.4 to 7.7, but the MAPE rises slightly from 89.5% to 89.8% (Figure 7B), a consequence of low-volume links where small differences inflate percentage errors.
To investigate further, Jenny explores the road network to identify the types of links producing these inflated MAPE values. She observes that they are mostly minor roads or short connector segments leading to intersections. Reasoning that such links have minimal practical impact, Jenny decides to focus her evaluation on the more significant links. Using a simple brushing interaction in the Link-Traffic Plot, she selects only links with observed traffic above 50 and sets them as focus links through the configuration panel (Task 4, Figure 8A).
By inspecting the network structure, Jenny notices that many peripheral links act mainly as origin-only points. She excludes these from the focus link selection (Figure 9, dashed strokes) as they can distort error metrics. Once recalculated, the OD Set List shows the MAPE dropping to about 27.0%, confirming that the previously high values were driven by low-volume links. This demonstrates how simple interactions such as brushing and focus selection help refine the analysis and yield more meaningful calibration metrics.
Encouraged by the improvements observed through estimation, Jenny decides to run a full simulation to verify the accuracy of her adjustments. Given that the total assigned traffic has been dramatically reduced, from 24,876 in the original OD matrix to just 2902, the simulation is expected to complete much faster than before. This makes it a practical time point to perform a high-fidelity validation using actual simulation outputs.
Upon completion, the results are promising: the simulation-based MAPE is approximately 26.1% (Figure 7C), closely aligning with the 27.0% observed in the estimation mode. This outcome confirms that the estimation provides a reliable preview of overall error trends, allowing Jenny to use it confidently during early-stage calibration without always resorting to costly full simulations.
Finally, Jenny focuses on a small number of high-impact OD pairs that exhibit strong directional overestimation and appear to contribute heavily to the most error-prone links (Task 5). While inspecting the OD-Link Matrix, she notices a recurring pattern: certain OD pairs consistently correspond to links with high positive errors (Figure 13B). These visual patterns guide her decision to reduce the traffic volumes of those OD pairs, highlighting the utility of the OD-Link Matrix as a diagnostic tool for identifying problematic demand sources. After halving the traffic for the selected OD pairs (Figure 13A) and adding the result as a new OD set, she runs another estimation.
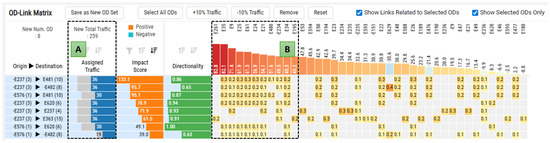
Figure 13.
OD-Link Matrix showing (A) assigned traffic after halving the volumes of selected high-impact OD pairs and (B) recurring high positive errors across specific links.
The result is a major improvement: the MAPE drops below Jenny’s target threshold of 20% (Figure 7D), signaling the successful completion of the calibration process. This final step demonstrates how visual patterns in the OD-Link Matrix can support informed, selective adjustments that yield meaningful improvements in simulation accuracy.
4.3.2. Domain Expert Feedback
We collected qualitative feedback from the two domain experts introduced in Section 3. To contextualize the system’s functionalities and supported tasks, we first presented them with the narrative usage scenario described in the previous section. They then participated in a guided walkthrough of the tool, directly interacting with the interface to explore the calibration workflow. This hands-on experience allowed them to engage in OD matrix adjustment, traffic error assessment, and OD-to-link analysis using ODCalibrator. Their feedback highlighted the system’s practicality and usefulness, particularly in making the calibration process more transparent, interactive, and aligned with their real-world workflow.
Both experts appreciated the system’s ability to make intermediate calibration steps more transparent and interactive. Traditionally, much of the calibration work has been conducted through cumbersome scripts or manual inspection of spreadsheet-style outputs, which often obscure the reasoning behind decisions made at the OD level. In contrast, the visual interface of our system enabled them to directly observe how specific OD pair adjustments influenced link-level discrepancies. P1 highlighted this benefit by stating that “being able to visualize the impact of each OD pair without diving into CSV files or writing ad hoc scripts is a real advantage”, emphasizing how this reduced the cognitive load and streamlined the exploratory process. P2 echoed this sentiment, noting that “the OD-Link Matrix, in particular, helped clarify which OD pairs to prioritize for adjustment; it made the debugging process more data-driven than usual”. Both participants found that being able to trace mismatches back to their originating OD pairs helped uncover previously unnoticed issues and led to more confident and targeted adjustments.
The experts also commented positively on the system’s dual-mode method. P1 described the separation between estimation and simulation as “practical and aligned with how we actually work; we do not want to run a full simulation every time we make a small tweak”. They emphasized that in real-world settings, analysts often need to test a variety of hypotheses quickly before deciding which are worth the computational cost of a full simulation. P2 similarly remarked that “the estimation mode feels accurate enough to catch major issues early on”, suggesting that it provides a trustworthy proxy for early-stage diagnostics. Both experts agreed that this flexible calibration loop allowed them to iterate more freely and efficiently than with traditional workflows that rely solely on full simulations.
However, both experts also identified areas for future improvement. P2 pointed out that “some error metrics could be more customizable, depending on the specific goals of the calibration”, suggesting that metrics more explicitly reflecting causal relationships between OD adjustments and link-level changes would be valuable. P1 similarly mentioned that “understanding not just where the error is, but why it happens, would help guide adjustments more effectively”.
Overall, both experts agreed that the system encourages a more iterative and informed approach to OD calibration, while also suggesting that additional automation and advanced diagnostics could further improve efficiency for large-scale scenarios.
5. Discussion
While our system effectively supports visual analysis of OD traffic calibration through coordinated views and summary metrics, several limitations and opportunities for further improvement remain. In this section, we reflect on the current design choices, discuss the limitations of our proposed metrics, and outline directions for future extensions.
5.1. Beyond Impact: Toward Causal Diagnostics
The impact score and directionality metrics provide useful heuristics for identifying OD pairs that are structurally linked to error-prone regions. However, these metrics are fundamentally associative rather than causal. A high impact score does not necessarily imply that the OD pair is the root cause of a traffic mismatch; it merely indicates overlap with problematic areas. In particular, OD pairs that contribute significantly to underestimated links may in fact be alleviating the error rather than causing it. While the directionality metric helps disambiguate the nature of associated errors, it still lacks a mechanism to distinguish between contributing and compensating OD traffic. This should be regarded as a limitation of the current work since it creates a gap between the diagnostic insights provided and the ability to identify true causal sources of mismatch.
This limitation points to a need for more refined diagnostic indicators that can isolate true sources of mismatch. One possible direction is to incorporate counterfactual simulation [42], where the effect of perturbing a single OD pair is simulated to observe resulting changes in link-level errors. Alternatively, statistical techniques such as influence functions or Shapley value approximations [43] could be explored to estimate the marginal contribution of each OD pair to global error.
5.2. Visualizing OD-Level Traffic Changes
Another limitation in the current system is the lack of explicit support for visualizing how OD-level traffic values change across calibration iterations. While the OD Set List tracks overall progress, users may benefit from a finer-grained comparison of individual OD pairs. A potential extension would be to provide an OD traffic difference matrix that highlights increases or decreases in traffic values relative to a baseline. Combined with error overlays, such a view could help users correlate traffic adjustments with calibration outcomes and identify adjustment patterns that consistently improve accuracy.
5.3. Enhancing Efficiency Through Initialization and Surrogate Models
We found that starting calibration from a zero-traffic OD matrix is inefficient as manually adding OD pairs is both time-consuming and cognitively demanding. This bottom-up approach, while flexible, can hinder productivity and discourage exploratory calibration in larger networks.
To address this, a more effective strategy would initialize tentative traffic values for OD pairs related to high-error links or key regions, shifting the task from construction to refinement. Beyond initialization, efficiency could also be improved through surrogate or learning-based models trained on simulation data. Such models could approximate calibration outcomes without running a full simulation, allowing analysts to rapidly test adjustments and compare surrogate estimates against simulation results. Importantly, these approaches could offer higher accuracy than our lightweight estimation method while still being faster than full simulation, striking a useful balance between speed and fidelity. Together, these strategies point to future directions for reducing overhead and making calibration workflows more practical in larger networks.
5.4. Expanding Accessibility for Non-Expert Users
ODCalibrator was intentionally designed with domain experts in mind as calibration decisions in practice often require detailed knowledge of traffic dynamics and simulation outputs. This focus allows the system to offer diagnostic depth and flexibility that align with expert workflows. At the same time, we recognize that such richness can pose a learning curve for users less familiar with simulation environments such as SUMO. To broaden accessibility, future deployments of the system could be accompanied by guided tutorials, example-driven workflows, and contextual tooltips that lower the entry barrier. In addition, a simplified visualization mode tailored for users with traffic engineering knowledge but limited simulation expertise represents a promising direction for future work, allowing the system to reach a wider audience while retaining its analytical capabilities.
5.5. Toward Real-World Deployment and Evaluation
The added value of ODCalibrator lies in producing well-calibrated OD matrices that can be reused across different traffic analyses once established. This enhances the long-term utility of the system beyond a single calibration task. At the same time, several limitations remain. The dataset used in this study cannot be publicly released due to security restrictions, which constrains reproducibility. In addition, our evaluation relied on expert feedback and a usage scenario rather than controlled experiments. Future work should therefore include systematic user studies that measure, for example, the time needed to reach a given calibration accuracy and the frequency of meaningful insights. Such studies would provide stronger evidence of utility and guide further refinement of the system for broader deployment.
6. Conclusions
We presented ODCalibrator, an interactive visual analytics system designed to support the iterative calibration of OD traffic flows in simulation-based transportation modeling. By combining estimation and simulation modes with coordinated visualizations, the system helps users identify mismatches, explore OD-to-link relationships, and refine demand patterns through informed adjustments. Our design introduces metrics such as impact score and directionality to guide diagnostic reasoning, while interaction techniques like brushing and linking enable flexible, multi-perspective exploration. Together, these components facilitate a more transparent and controllable calibration process, offering a foundation for future enhancements in interpretable traffic simulation analysis.
Author Contributions
Conceptualization, J.-W.J. and D.S.; methodology, D.S.; software, D.S.; writing—original draft preparation, J.-W.J. and D.S.; writing—review and editing, H.-C.P.; visualization, D.S.; supervision, H.-C.P.; project administration, H.-C.P. All authors have read and agreed to the published version of the manuscript.
Funding
This work was supported by Korea Institute of Police Technology (KIPoT) grant funded by the 559 Korea government (KNPA) (No. 092021C28S02000).
Institutional Review Board Statement
Not applicable.
Informed Consent Statement
Not applicable.
Data Availability Statement
The data presented in this study are unavailable on request from the corresponding author due to data security.
Conflicts of Interest
The authors declare no conflicts of interest.
References
- Alghodhaifi, H.; Lakshmanan, S. Autonomous vehicle evaluation: A comprehensive survey on modeling and simulation approaches. IEEE Access 2021, 9, 151531–151566. [Google Scholar] [CrossRef]
- Zhang, P.; Zhu, B.; Zhao, J.; Fan, T.; Sun, Y. Performance evaluation method for automated driving system in logical scenario. Automot. Innov. 2022, 5, 299–310. [Google Scholar] [CrossRef]
- Huo, J.; Liu, C.; Chen, J.; Meng, Q.; Wang, J.; Liu, Z. Simulation-based dynamic origin–destination matrix estimation on freeways: A Bayesian optimization approach. Transp. Res. Part E Logist. Transp. Rev. 2023, 173, 103108. [Google Scholar] [CrossRef]
- Calvert, S.C.; van Arem, B. A generic multi-level framework for microscopic traffic simulation with automated vehicles in mixed traffic. Transp. Res. Part C Emerg. Technol. 2020, 110, 291–311. [Google Scholar] [CrossRef]
- Li, J.; Deng, W.; Wang, Y.; Wang, J.; Ding, J. Modeling of Complex Traffic Interaction Under Uncontrolled Intersection Scenario. IEEE Trans. Intell. Veh. 2024, 9, 8154–8165. [Google Scholar] [CrossRef]
- Yuan, X.; Deng, F.; Yao, X.; Wu, Y. Driving Behaviour Research for Autonomous Vehicle Interaction Design: A Comprehensive Review and Future Directions. Int. J. Hum.–Comput. Interact. 2024, 41, 10245–10265. [Google Scholar] [CrossRef]
- Miller, L.; Kraus, J.; Koniakowsky, I.; Pichen, J.; Baumann, M. Learning in mixed traffic: Drivers’ adaptation to ambiguous communication depending on their expectations toward automated and manual vehicles. Int. J. Hum.–Comput. Interact. 2023, 39, 3268–3287. [Google Scholar] [CrossRef]
- Raju, N.; Farah, H. Evolution of traffic microsimulation and its use for modeling connected and automated vehicles. J. Adv. Transp. 2021, 2021, 2444363. [Google Scholar] [CrossRef]
- Sadid, H.; Antoniou, C. A simulation-based impact assessment of autonomous vehicles in urban networks. IET Intell. Transp. Syst. 2024, 18, 1677–1696. [Google Scholar] [CrossRef]
- Fellendorf, M. VISSIM: A microscopic simulation tool to evaluate actuated signal control including bus priority. In Proceedings of the 64th Institute of Transportation Engineers Annual Meeting, Dallas, TX, USA, 16–19 October 1994; Springer: Berlin/Heidelberg, Germany, 1994; Volume 32, pp. 1–9. [Google Scholar]
- W Axhausen, K.; Horni, A.; Nagel, K. The Multi-Agent Transport Simulation MATSim; Ubiquity Press: London, UK, 2016. [Google Scholar]
- Smith, L.; Beckman, R.; Baggerly, K. TRANSIMS: Transportation Analysis and Simulation System; Technical Report; Los Alamos National Lab. (LANL): Los Alamos, NM, USA, 1995. [Google Scholar]
- Golias, M.M.; Mishra, S.; Dey, K.; Samani, A.R.; Ashraf, M.T.; Khan, I.; Prakash, J.; Kar, P. Identification of Simulation Calibration Parameters Using Urban Freeway Data; Technical Report; Tennessee Department of Transportation: Nashville, TN, USA, 2024.
- Daguano, R.F.; Yoshioka, L.R.; Netto, M.L.; Marte, C.L.; Isler, C.A.; Santos, M.M.D.; Justo, J.F. Automatic calibration of microscopic traffic simulation models using artificial neural networks. Sensors 2023, 23, 8798. [Google Scholar] [CrossRef]
- Hollander, Y.; Liu, R. The principles of calibrating traffic microsimulation models. Transportation 2008, 35, 347–362. [Google Scholar] [CrossRef]
- Punzo, V.; Ciuffo, B.; Montanino, M. Can results of car-following model calibration based on trajectory data be trusted? Transp. Res. Rec. 2012, 2315, 11–24. [Google Scholar] [CrossRef]
- Cascetta, E.; Inaudi, D.; Marquis, G. Dynamic estimators of origin-destination matrices using traffic counts. Transp. Sci. 1993, 27, 363–373. [Google Scholar] [CrossRef]
- Omrani, R.; Kattan, L. Simultaneous calibration of microscopic traffic simulation model and estimation of origin/destination (OD) flows based on genetic algorithms in a high-performance computer. In Proceedings of the 16th International IEEE Conference on Intelligent Transportation Systems (ITSC 2013), The Hague, The Netherlands, 6–9 October 2013; pp. 2316–2321. [Google Scholar]
- Lidbe, A.D.; Hainen, A.M.; Jones, S.L. Comparative study of simulated annealing, tabu search, and the genetic algorithm for calibration of the microsimulation model. Simulation 2017, 93, 21–33. [Google Scholar] [CrossRef]
- Miao, Y.; Kowal, D.R.; Panchal, N.; Vila, J.; Vannucci, M. Nonlinear state-space modeling approaches to real-time autonomous geosteering. J. Pet. Sci. Eng. 2020, 189, 107025. [Google Scholar] [CrossRef]
- Ma, J.; Dong, H.; Zhang, H.M. Calibration of microsimulation with heuristic optimization methods. Transp. Res. Rec. 2007, 1999, 208–217. [Google Scholar] [CrossRef]
- Park, B.; Qi, H. Development and Evaluation of a Procedure for the Calibration of Simulation Models. Transp. Res. Rec. 2005, 1934, 208–217. [Google Scholar] [CrossRef][Green Version]
- Lin, Y. Models, algorithms and applications of DynasTIM real-time traffic simulation system. Sustainability 2023, 15, 1707. [Google Scholar] [CrossRef]
- Rahman, M.; Chowdhury, M.; Khan, T.; Bhavsar, P. Improving the efficacy of car-following models with a new stochastic parameter estimation and calibration method. IEEE Trans. Intell. Transp. Syst. 2015, 16, 2687–2699. [Google Scholar] [CrossRef]
- Aycin, M.; Benekohal, R. Comparison of car-following models for simulation. Transp. Res. Rec. 1999, 1678, 116–127. [Google Scholar] [CrossRef]
- Treiber, M.; Hennecke, A.; Helbing, D. Congested traffic states in empirical observations and microscopic simulations. Phys. Rev. E 2000, 62, 1805. [Google Scholar] [CrossRef]
- Li, Z.; Liu, H.; Li, J. A calibration and validation procedure for microscopic simulation model. In Proceedings of the 13th International IEEE Conference on Intelligent Transportation Systems, Funchal, Portugal, 19–22 September 2010; pp. 563–568. [Google Scholar]
- Zhou, M.; Qu, X.; Li, X. A recurrent neural network based microscopic car following model to predict traffic oscillation. Transp. Res. Part C Emerg. Technol. 2017, 84, 245–264. [Google Scholar] [CrossRef]
- Lopukhova, E.; Abdulnagimov, A.; Voronkov, G.; Grakhova, E. Machine Learning-Driven Calibration of Traffic Models Based on a Real-Time Video Analysis. Appl. Sci. 2024, 14, 4864. [Google Scholar] [CrossRef]
- Lee, J.B.; Ozbay, K. New calibration methodology for microscopic traffic simulation using enhanced simultaneous perturbation stochastic approximation approach. Transp. Res. Rec. 2009, 2124, 233–240. [Google Scholar] [CrossRef]
- Xu, H.; Wang, C.; Berres, A.; LaClair, T.; Sanyal, J. Interactive web application for traffic simulation data management and visualization. Transp. Res. Rec. 2022, 2676, 274–292. [Google Scholar] [CrossRef]
- Shi, Y.; Liu, Z.; Wang, Z.; Ye, J.; Tong, W.; Liu, Z. An integrated traffic and vehicle co-simulation testing framework for connected and autonomous vehicles. IEEE Intell. Transp. Syst. Mag. 2022, 14, 26–40. [Google Scholar] [CrossRef]
- Sun, R.; Wang, Z.; Wang, X.; Liu, H.X. Automatic Calibration of Mesoscopic Traffic Simulation Using Vehicle Trajectory Data. arXiv 2025, arXiv:2501.10934. [Google Scholar]
- Kušić, K.; Schumann, R.; Ivanjko, E. A digital twin in transportation: Real-time synergy of traffic data streams and simulation for virtualizing motorway dynamics. Adv. Eng. Inform. 2023, 55, 101858. [Google Scholar] [CrossRef]
- Jin, P.J.; Wang, Y.; Zhang, T.; Ge, Y.; Gong, J.; Chen, A.; Ahmad, N.S.; Geng, B. The Development of the Digital Twin Platform for Smart Mobility Systems with High-Resolution 3D Data; Technical Report; Center for Advanced Infrastructure and Transportation, Rutgers University: New Brunswick, NJ, USA, 2021. [Google Scholar]
- Brehmer, M.; Munzner, T. A multi-level typology of abstract visualization tasks. IEEE Trans. Vis. Comput. Graph. 2013, 19, 2376–2385. [Google Scholar] [CrossRef]
- Munzner, T. A nested model for visualization design and validation. IEEE Trans. Vis. Comput. Graph. 2009, 15, 921–928. [Google Scholar] [CrossRef]
- Roberts, J.C. State of the art: Coordinated & multiple views in exploratory visualization. In Proceedings of the Fifth International Conference on Coordinated and Multiple Views in Exploratory Visualization (CMV 2007), Zurich, Switzerland, 2 July 2007; pp. 61–71. [Google Scholar]
- Cleveland, W.S.; McGill, R. Graphical perception: Theory, experimentation, and application to the development of graphical methods. J. Am. Stat. Assoc. 1984, 79, 531–554. [Google Scholar] [CrossRef]
- Keim, D.A. Information visualization and visual data mining. IEEE Trans. Vis. Comput. Graph. 2002, 8, 1–8. [Google Scholar] [CrossRef]
- Bostock, M.; Ogievetsky, V.; Heer, J. D3 data-driven documents. IEEE Trans. Vis. Comput. Graph. 2011, 17, 2301–2309. [Google Scholar] [CrossRef] [PubMed]
- Baron, S. Explainable AI and causal understanding: Counterfactual approaches considered. Minds Mach. 2023, 33, 347–377. [Google Scholar] [CrossRef]
- Roth, A.E. The Shapley Value: Essays in Honor of Lloyd S. Shapley; Cambridge University Press: Cambridge, UK, 1988. [Google Scholar]
Disclaimer/Publisher’s Note: The statements, opinions and data contained in all publications are solely those of the individual author(s) and contributor(s) and not of MDPI and/or the editor(s). MDPI and/or the editor(s) disclaim responsibility for any injury to people or property resulting from any ideas, methods, instructions or products referred to in the content. |
© 2025 by the authors. Licensee MDPI, Basel, Switzerland. This article is an open access article distributed under the terms and conditions of the Creative Commons Attribution (CC BY) license (https://creativecommons.org/licenses/by/4.0/).