1. Introduction
The persistence of plastic waste, particularly polyethylene-based polymers, has become one of the most pressing environmental challenges of the 21st century. Among these, linear low-density polyethylene (LLDPE) is widely used in flexible packaging, agricultural films, and consumer products due to its mechanical properties and chemical resistance. However, this same resistance renders it highly recalcitrant in natural environments, with degradation timelines that span centuries [
1].
Conventional disposal strategies—including landfilling, incineration, and mechanical recycling—have proven insufficient to address the escalating accumulation of polyethylene-based plastics. Consequently, alternative biodegradation pathways are under active investigation. In recent years, particular interest has focused on the capacity of invertebrates to ingest and potentially transform synthetic polymers, a phenomenon initially observed in larvae of
Tenebrio molitor (mealworms) and other insects [
2,
3].
Several studies have reported that mealworms can fragment and partially mineralize polystyrene (PS) and low-density polyethylene (LDPE), likely through the combined action of gut microbiota and endogenous enzymatic activity [
2,
3]. However, the biodegradation of LLDPE, which exhibits a higher degree of crystallinity and thermal stability than LDPE, remains far less understood and it has been scarcely studied in the context of insect frass. In particular, the extent to which ingested LLDPE is chemically transformed, metabolized, or excreted intact is still under debate. Addressing this gap, the present study applies solid-state
13C CP-MAS NMR combined with iPLS chemometrics for the quantitative detection of LLDPE residues in
T. molitor frass.
Frass—the excrement produced by insects—offers a unique matrix to assess the fate of ingested plastics. It may contain unaltered polymer residues, degradation byproducts, or even biotransformed compounds, as demonstrated in insect-mediated plastic degradation studies [
2,
3]. Therefore, accurately quantifying the amount of residual plastic in frass is essential for evaluating the efficacy of insect-mediated plastic degradation. This requires highly sensitive and selective analytical techniques capable of resolving polymer signals within a complex organic background.
Several analytical strategies have been proposed for the detection of plastics in biological and environmental matrices. Pyrolysis–GC/MS provides high chemical specificity but often requires laborious sample preparation and is strongly affected by organic matrix components [
4,
5,
6]. However, it is destructive, requires labor-intensive sample preparation, and suffers from interference caused by organic-rich substrates such as frass. Spectroscopic approaches such as FTIR and Raman are commonly used, yet their performance is limited when dealing with complex, heterogeneous substrates like insect frass, particularly for polyethylene [
2,
3]. In contrast, solid-state
13C nuclear magnetic resonance (NMR) spectroscopy with cross-polarization and magic angle spinning (
13C CP-MAS NMR) enables direct detection of aliphatic carbons, offering matrix-independent, non-destructive detection with high sensitivity [
7,
8].
13C CP-MAS NMR has recently emerged as a promising method for analyzing synthetic polymers in environmental samples [
9]. It allows for non-destructive, label-free detection of characteristic aliphatic carbon signals and can differentiate between synthetic and biogenic carbon structures. When combined with chemometric modeling, such as interval partial least squares (iPLS), this technique enables precise quantification of plastic residues even at trace levels [
10,
11].
In this study, we present a multitechnique analytical strategy to detect and quantify LLDPE in frass samples from
T. molitor. Artificial mixtures of frass and cryogenically milled LLDPE were analyzed using thermal analysis (under both oxidizing and inert atmospheres), coupled FTIR and mass spectrometry, and solid-state CP-MAS
13C NMR. iPLS-based chemometric models were applied to improve sensitivity and predictive accuracy. CP-MAS NMR successfully detected polyethylene at the lowest concentration tested (0.096%
w/
w). However, this value corresponds to the minimum experimental level, whereas the calculated LOD and LOQ were 0.173% and 0.525%
w/
w, respectively, confirming that the method is applicable to biologically relevant ingestion ranges (0.8–3.2%
w/
w in frass [
3,
12]. Our goal is to establish a robust analytical framework for future in vivo experiments investigating the fate of plastic polymers in insect digestion systems and to evaluate the biochemical impact of plastic ingestion in
T. molitor. To the best of our knowledge, this is the first study applying solid-state
13C CP-MAS NMR combined with iPLS chemometric modeling to quantify LLDPE residues in
Tenebrio molitor frass.
3. Results
3.1. Thermal Analysis Coupled with FTIR and MS in Oxidant Atmosphere
Thermal analysis coupled with mass spectrometry (MS) and Fourier-transform infrared spectroscopy (FTIR) was initially employed to investigate the thermal decomposition profiles of frass samples containing linear low-density polyethylene (LLDPE). Samples were artificially prepared by mixing oat bran-based frass from Tenebrio molitor with cryogenically milled LLDPE in proportions ranging from 0.096% to 10% w/w.
The FTIR and MS signals revealed distinct decomposition profiles for frass and LLDPE, particularly at elevated temperatures. LLDPE exhibited thermal degradation at significantly higher temperatures compared to frass, which allowed for differentiation based on specific vibrational bands and ion fragmentation patterns (
Figure 1). Notably, strong absorbance bands at 2928 and 2855 cm
−1—corresponding to C–H stretching in methyl and methylene groups of aliphatic chains—were observed during the thermal degradation of pure LLDPE and in the 10% LLDPE-frass blend, particularly at 483 °C (
Figure 1a–c). These bands were absent in frass-only samples and in mixtures with lower LLDPE content, indicating a detection limit based on FTIR signal intensity. The persistence of these bands in an oxidizing atmosphere suggests incomplete combustion of LLDPE and the release of unoxidized volatile aliphatic fragments.
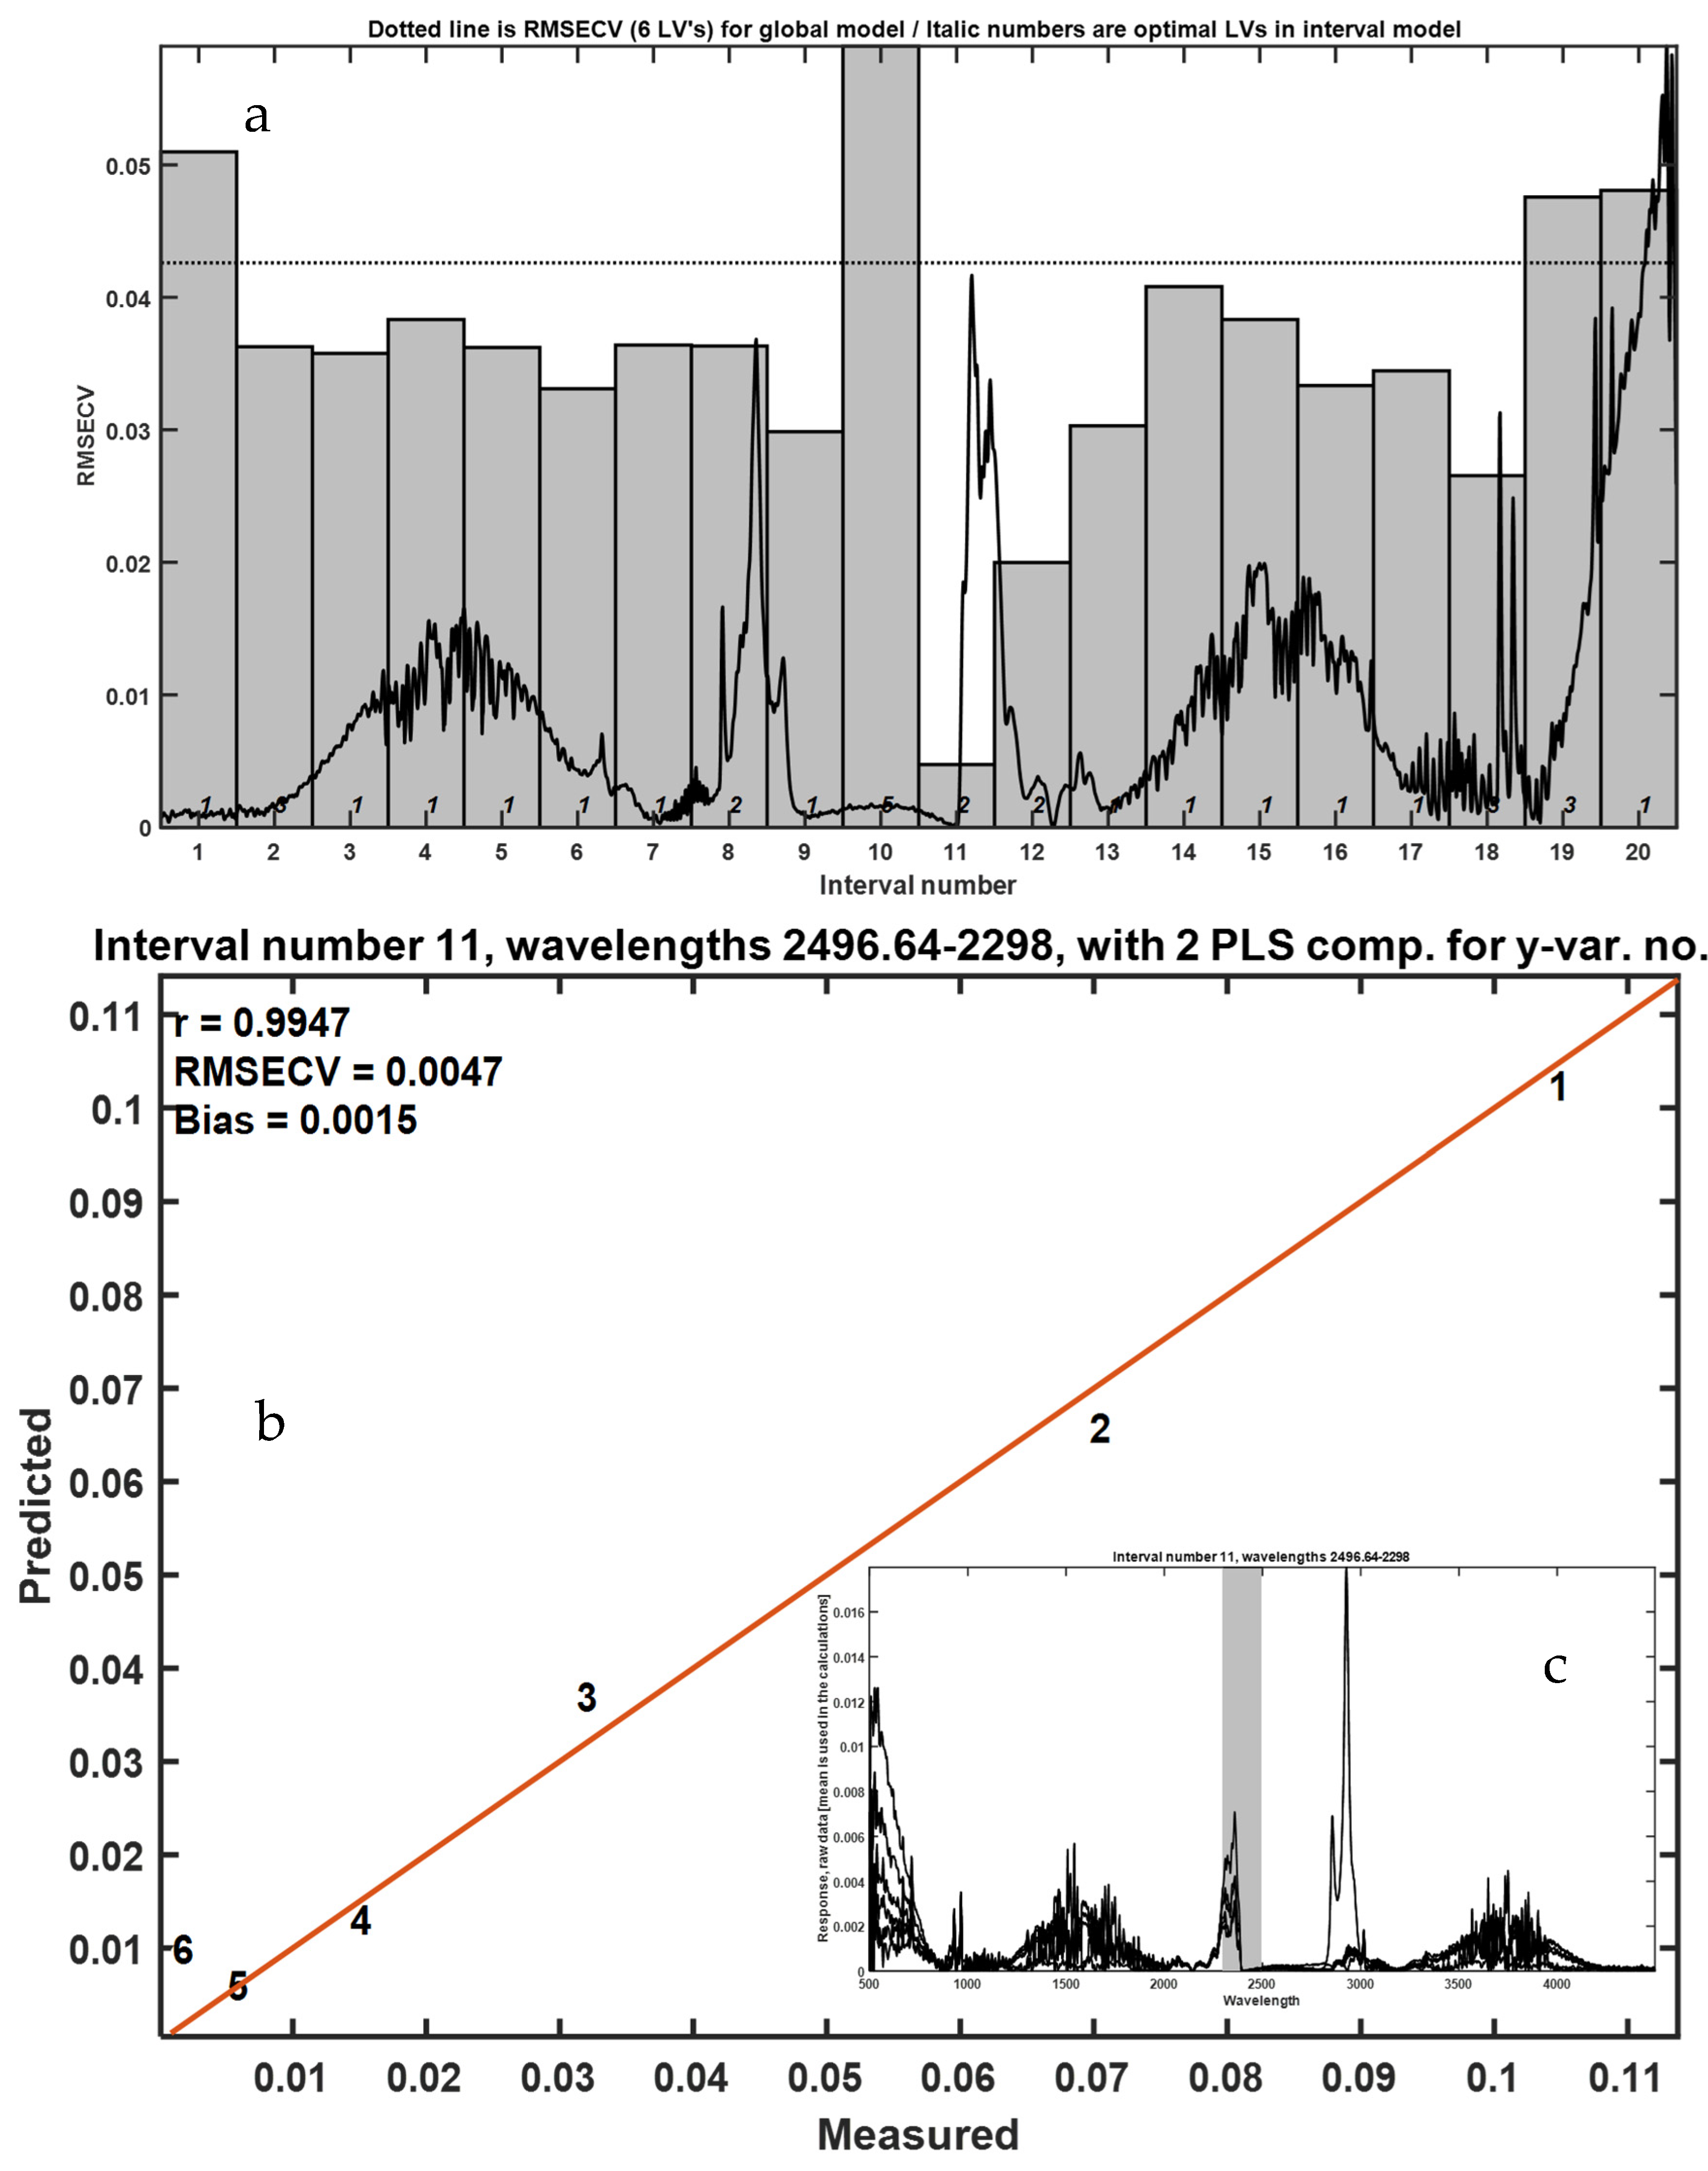
To assess the potential of FTIR spectra for quantifying LLDPE, interval partial least squares (iPLS) models were constructed using spectra collected at 483 °C. Among 20 tested intervals, a single predictive region yielded a reliable model with good fit and minimal cross-validation error, as shown in
Figure 2. This supports the utility of FTIR-based chemometrics for semi-quantitative analysis of LLDPE in complex organic matrices, though sensitivity is limited at lower concentrations.
Mass spectrometry further supported these findings by identifying specific decomposition products in the evolved gas phase (
Figure 3). The total ion chromatogram (TIC) showed characteristic ion fragments, and the ion with
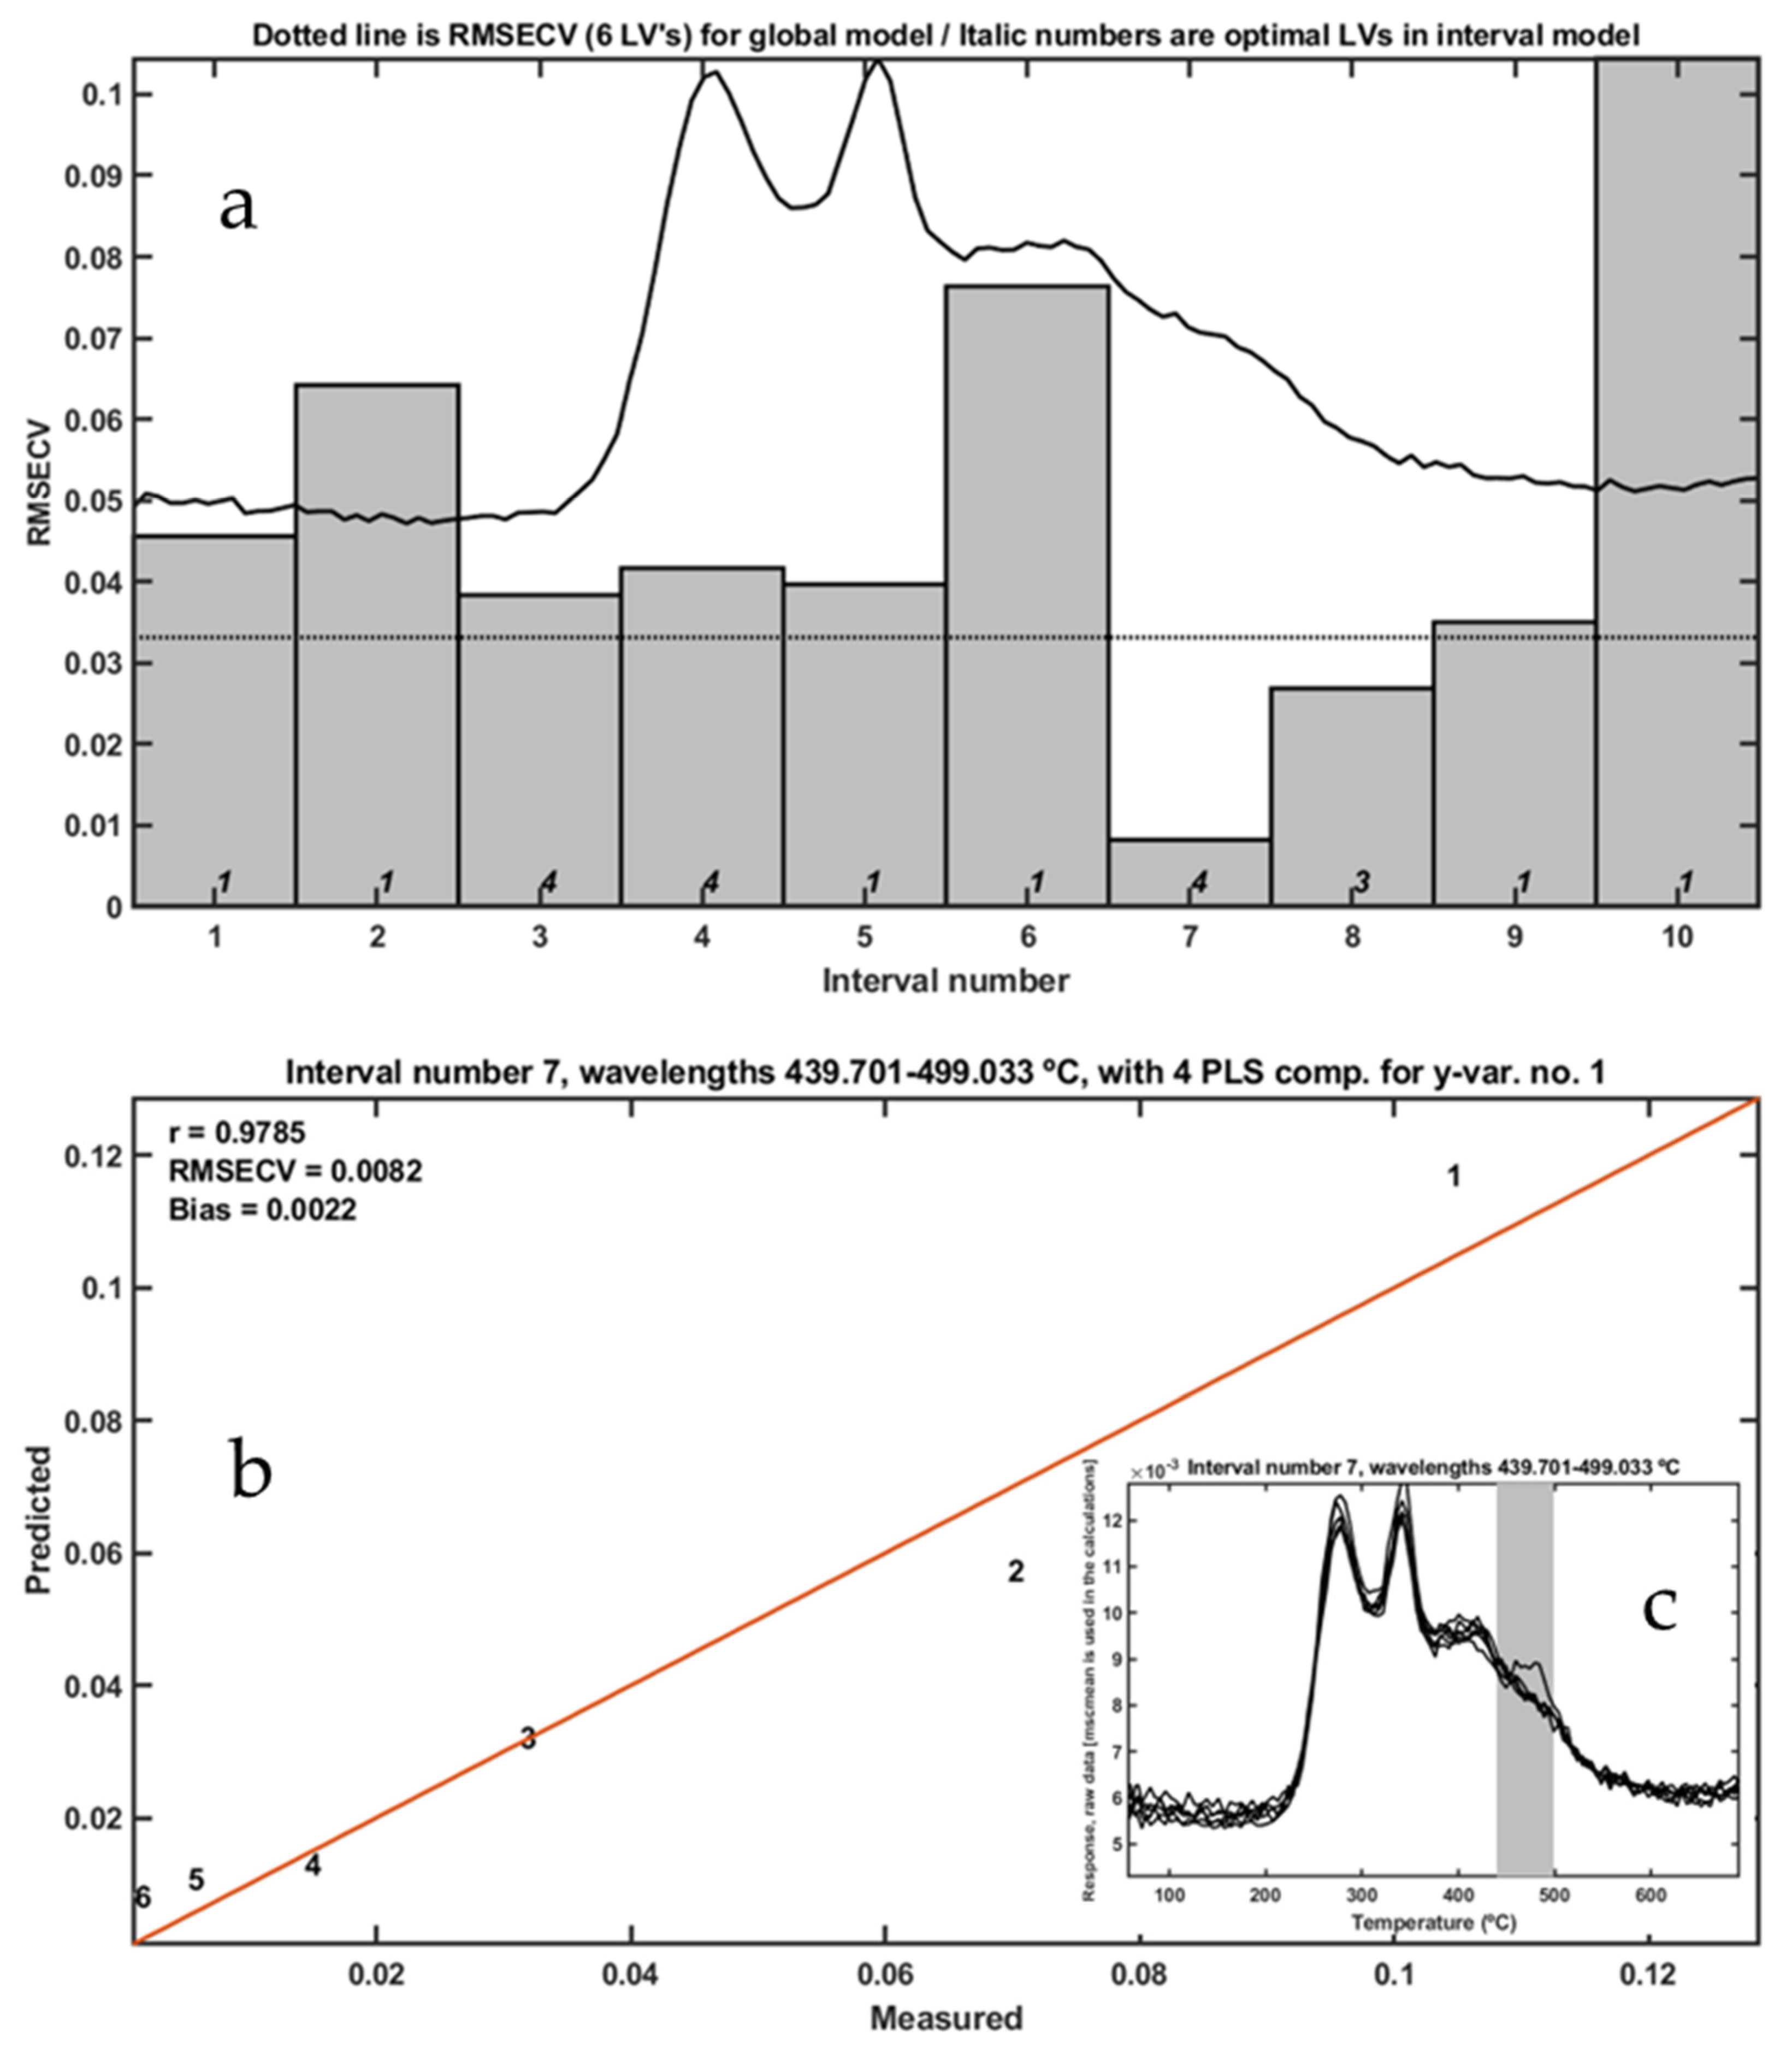
m/
z = 28 provided a strong correlation with LLDPE concentration in the temperature range of 439.7–499.0 °C (R = 0.9785,
Figure 4). Similarly,
m/
z = 44 yielded a higher correlation (R = 0.9864), although the relevant thermal window (607.35–632.0 °C) exceeded the expected decomposition range for LLDPE, suggesting the formation of CO
2 from secondary reactions or matrix combustion.
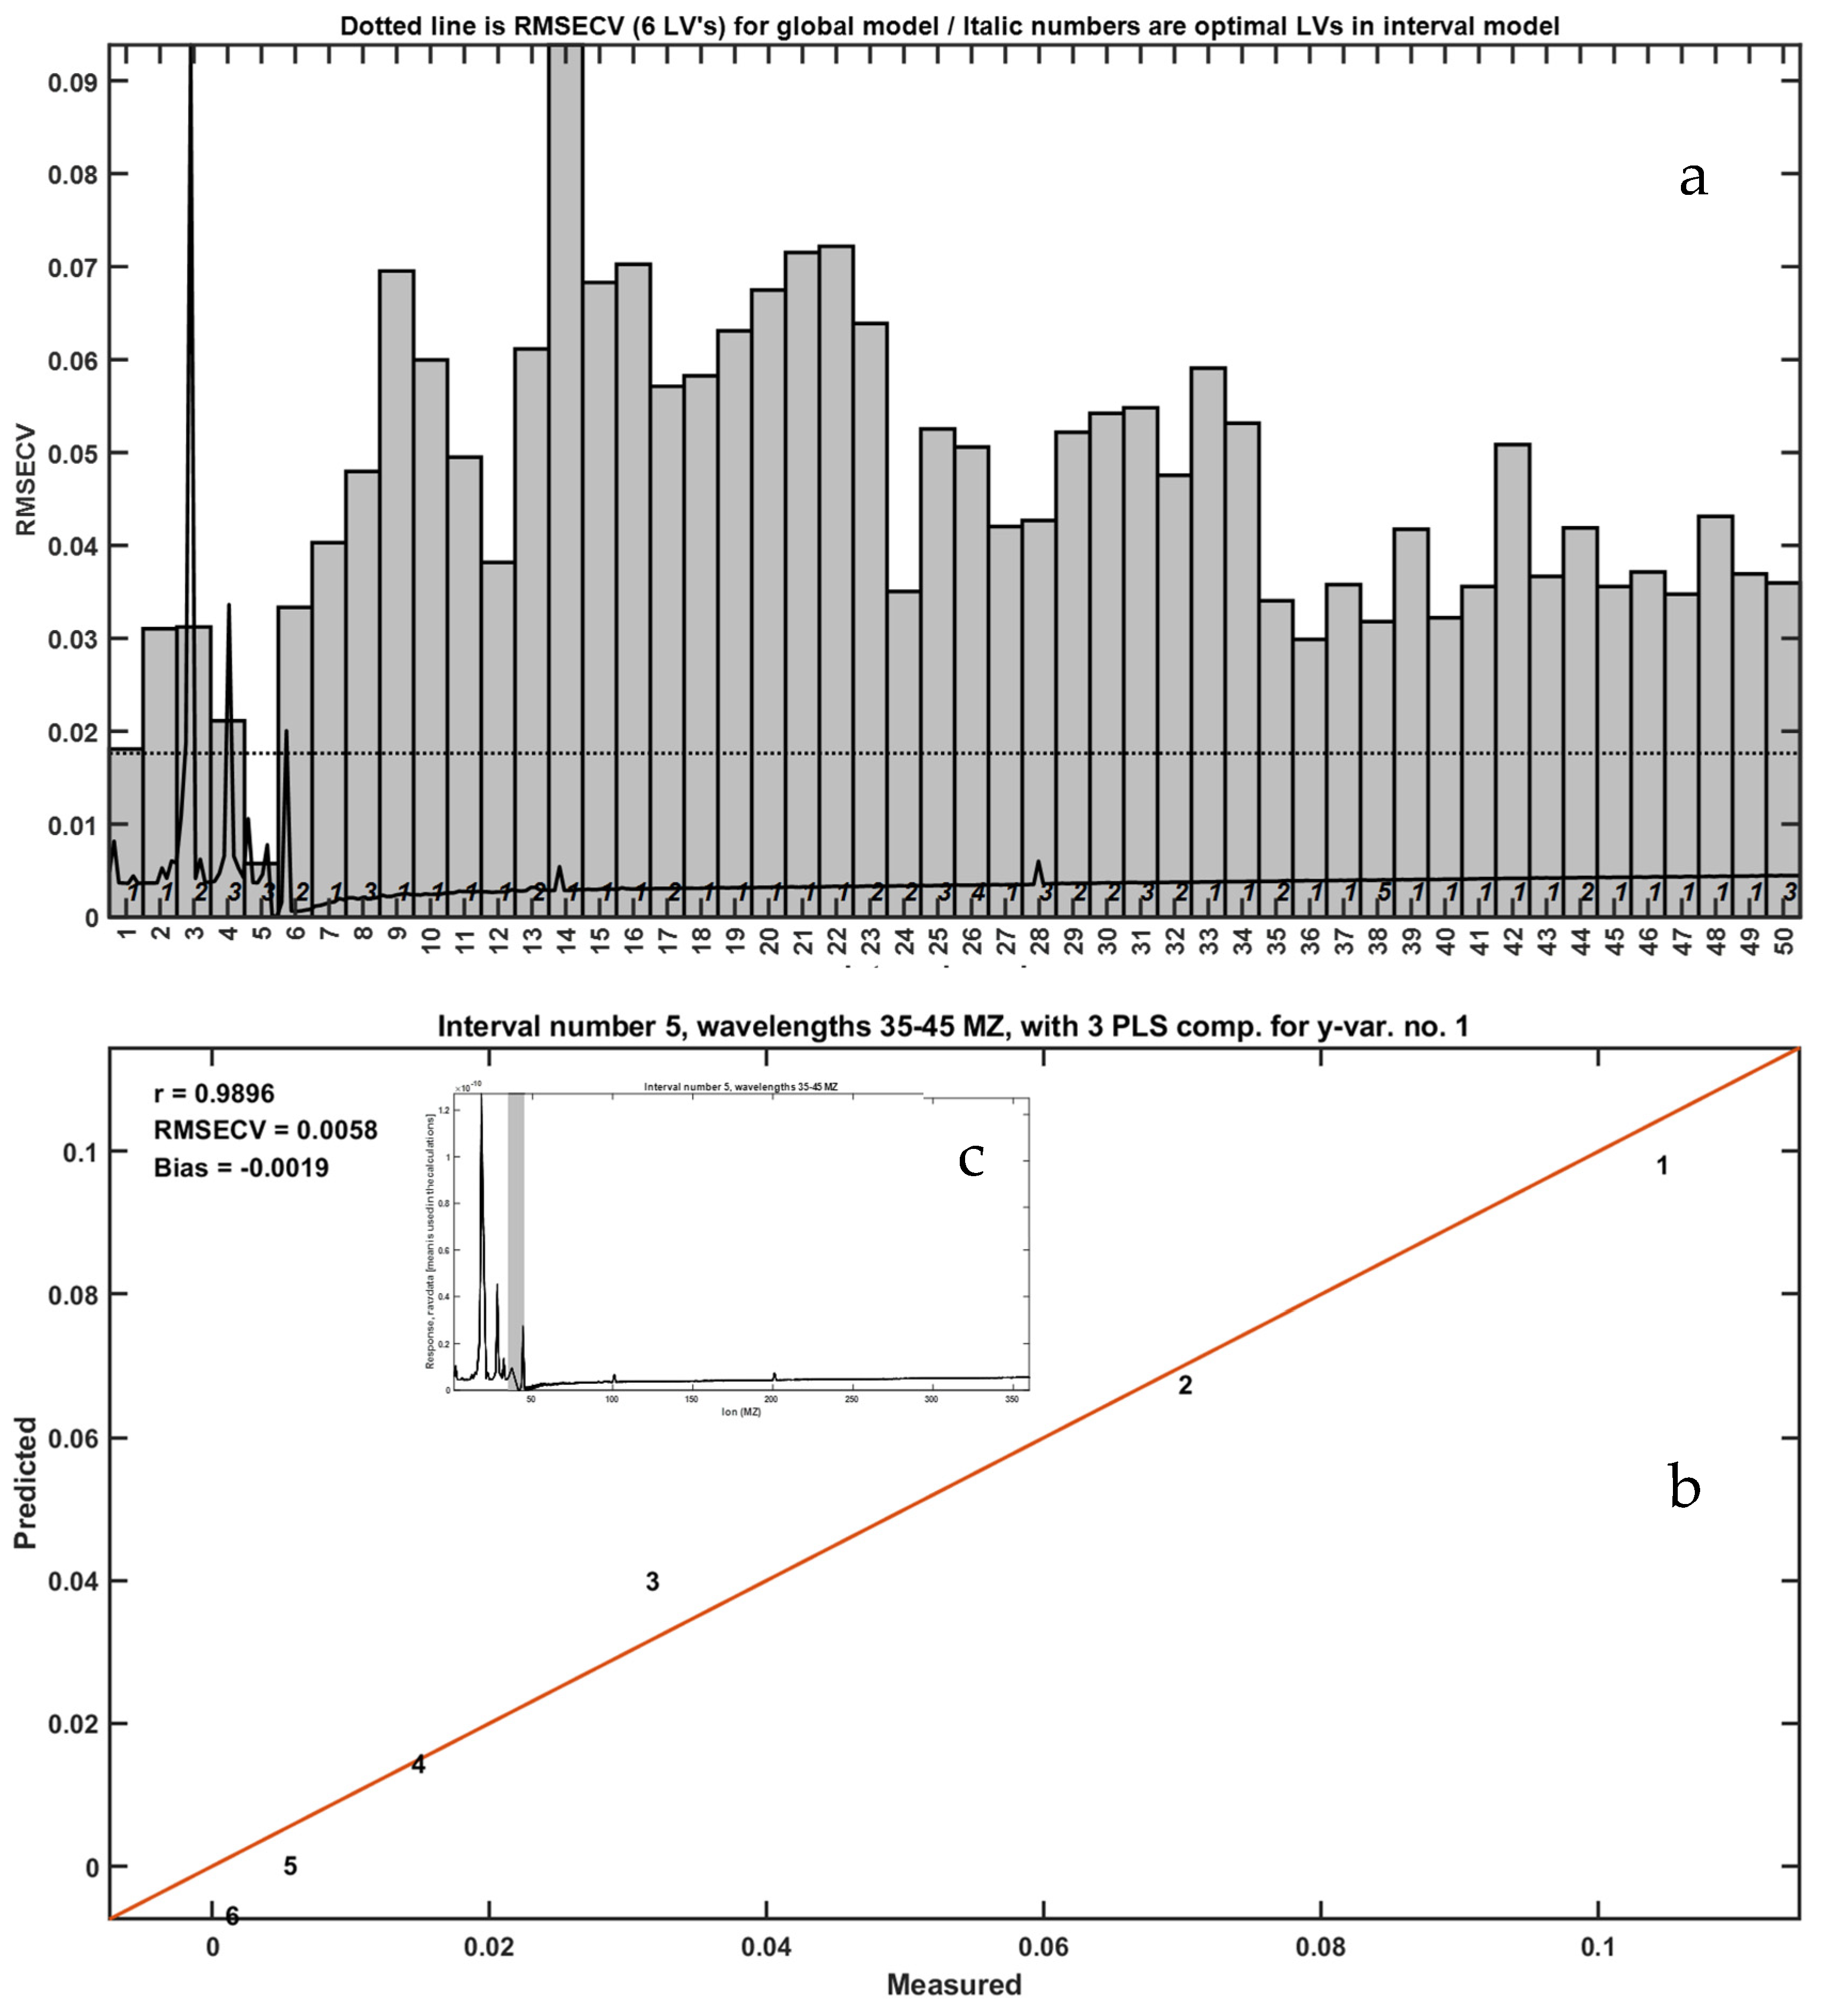
A comprehensive TIC-based iPLS analysis demonstrated the highest correlation (R = 0.9896) when summing ion signals in the
m/
z 35–45 range (
Figure 5). This finding indicates that, despite the complexity of combustion products, specific ion clusters can serve as proxies for LLDPE quantification.
Overall, the combination of thermal analysis, FTIR, and MS proved capable of identifying LLDPE in frass samples with reasonable precision at high concentrations. The iPLS approach allowed for selection of optimal spectral or mass regions most correlated with plastic content. However, at concentrations below 1%, the sensitivity of this method decreased substantially, limiting its utility for detecting trace amounts of LLDPE. Moreover, the requirement for advanced instrumentation and multi-modal coupling presents a barrier to broader application in routine analysis.
Therefore, while the oxidative TGA–FTIR–MS approach offers valuable insights into decomposition behavior and volatile profiles, further analytical refinement or alternative techniques are needed for more accurate quantification of low-level LLDPE residues in biological matrices.
3.2. Thermal Analysis with Inert Atmosphere
Thermal analysis under inert conditions (N2 atmosphere) was carried out to evaluate whether the absence of oxidative reactions enhances the detection and quantification of LLDPE in frass mixtures. Thermogravimetric (TG) and derivative thermogravimetric (DTG) profiles were obtained for mixtures containing 0.096% to 10% w/w LLDPE using a METTLER TOLEDO TGA/SDTA851e system, as described in Materials and Method Section.
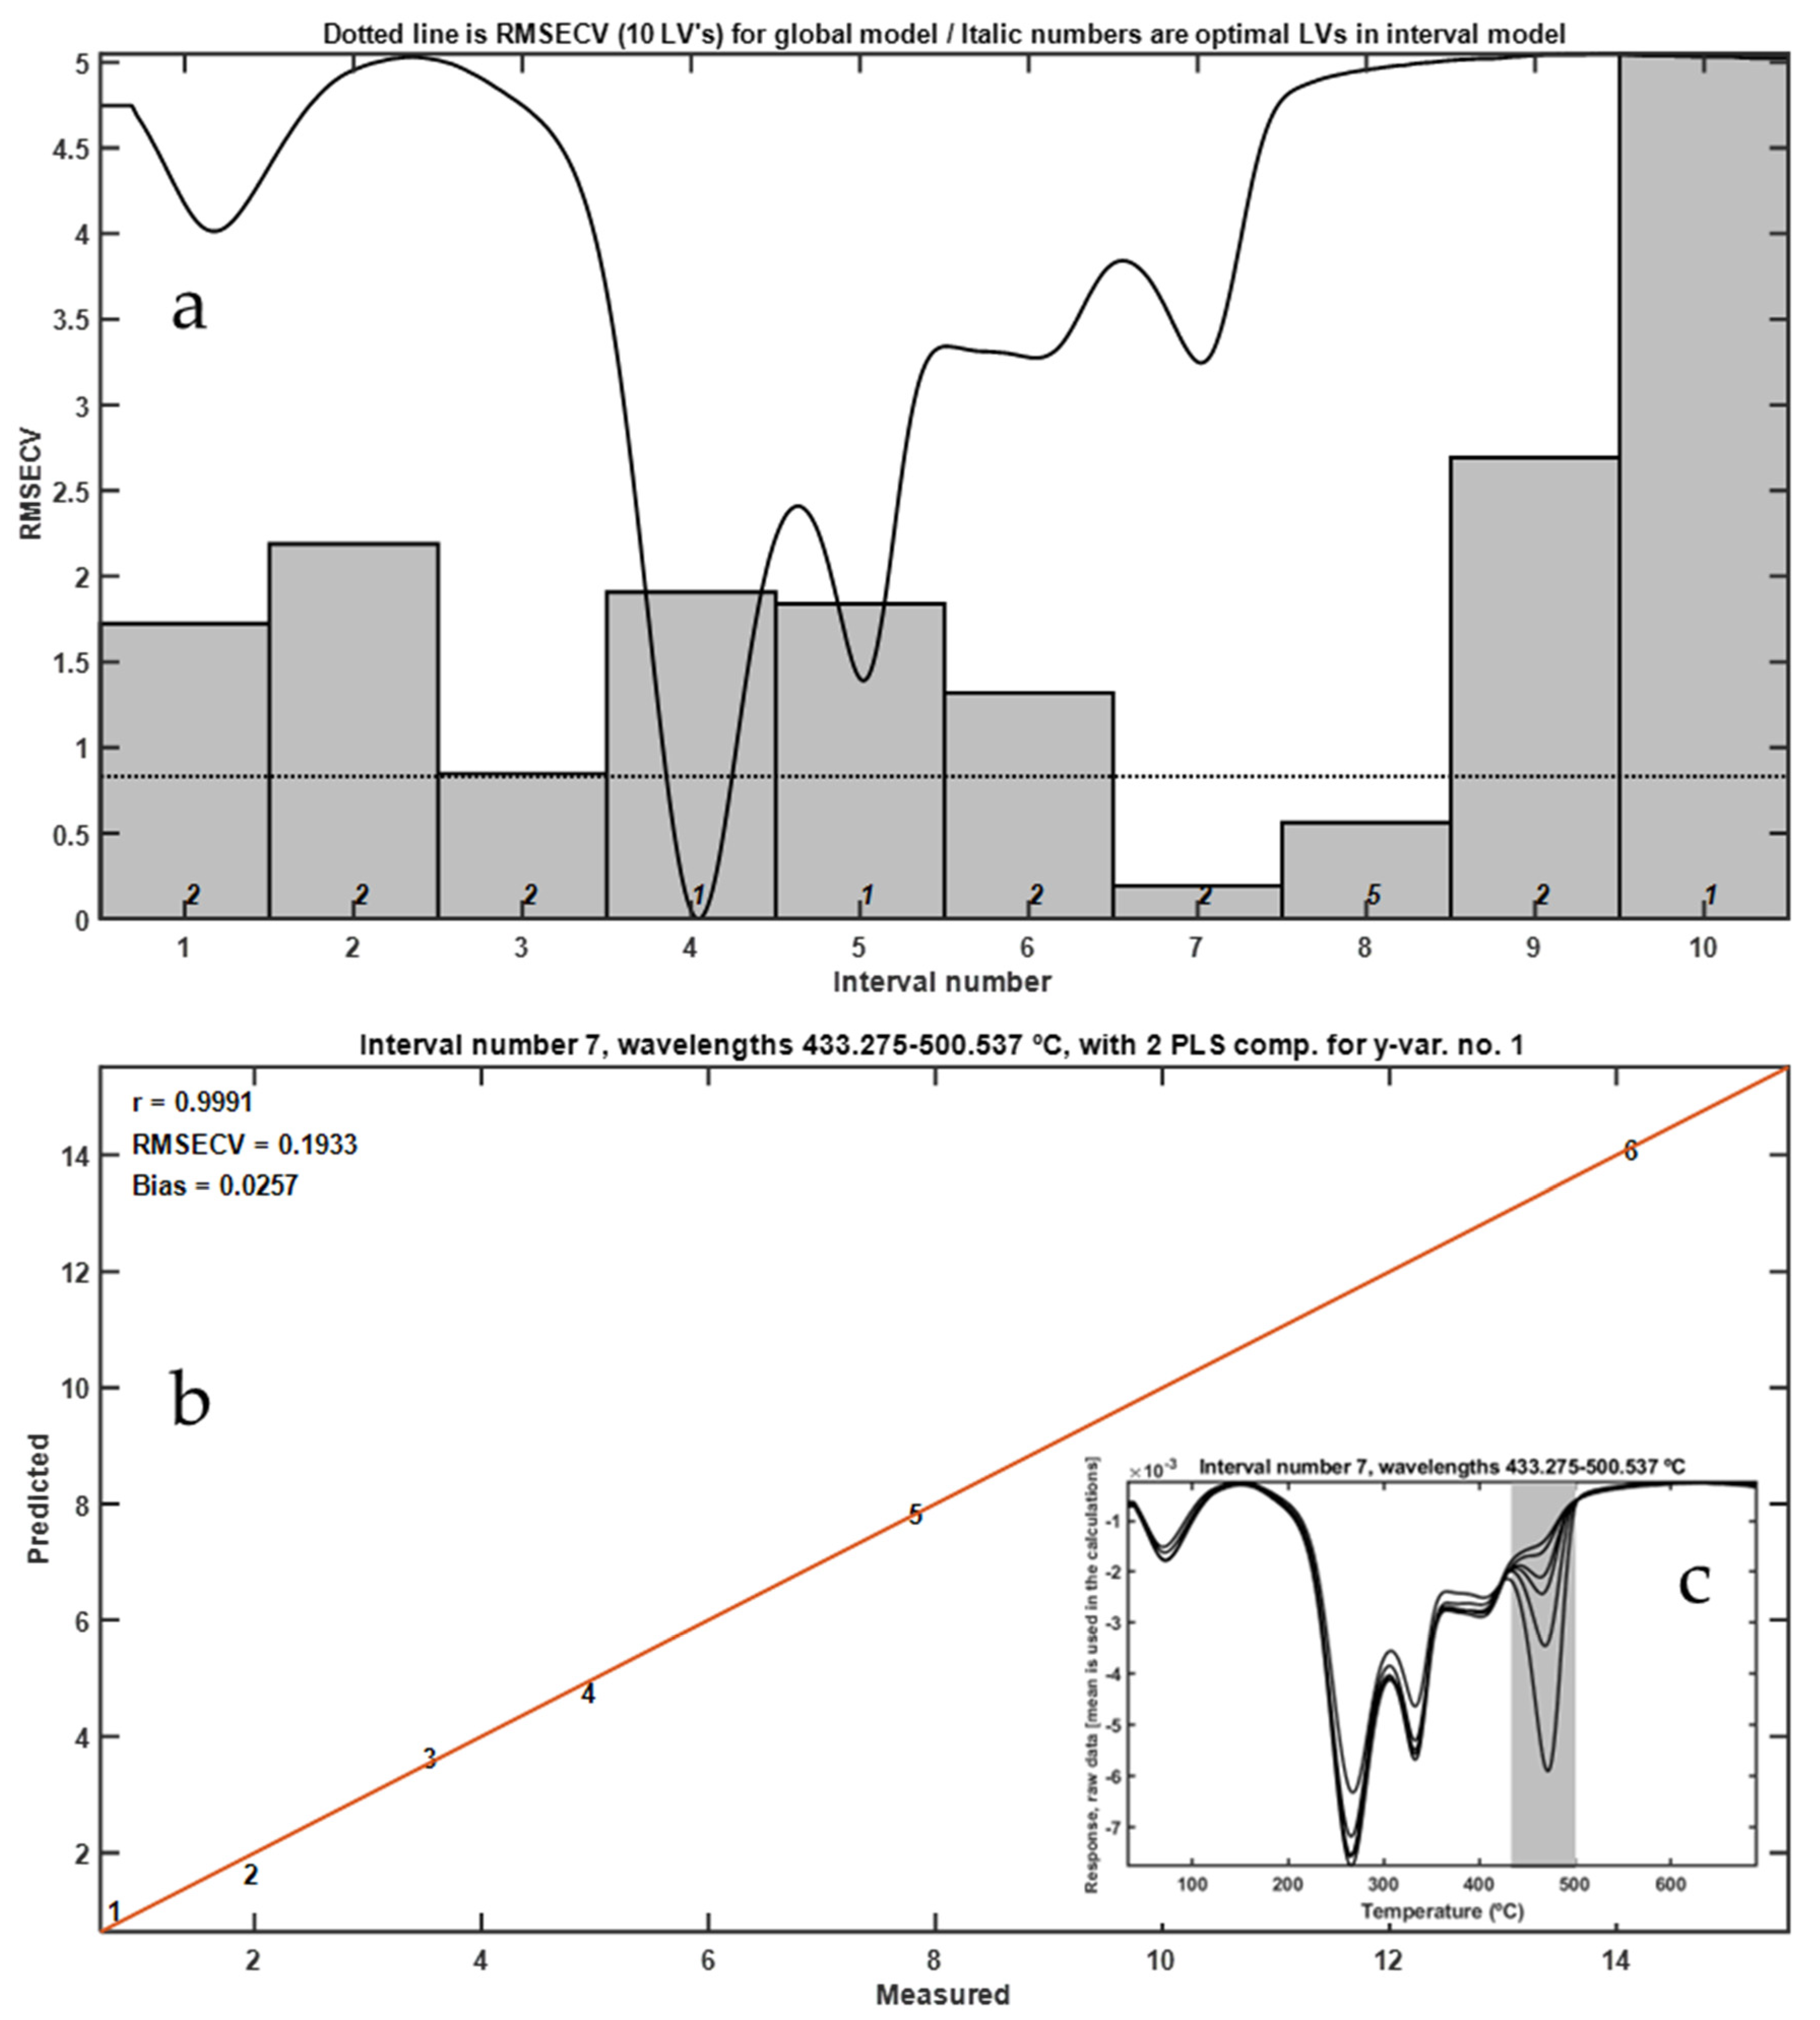
DTG curves revealed a distinct peak corresponding to the thermal degradation of LLDPE, with a maximum at 472 °C (
Figure 6). This peak was well separated from the broader degradation events associated with the frass matrix (
Figure 6a), which occurred at lower temperatures. Application of interval partial least squares (iPLS) regression to the DTG data enabled the identification of the most predictive thermal regions for quantifying LLDPE content. The most informative temperature interval was 433.27–500.54 °C, which corresponds precisely to the onset and peak of LLDPE decomposition (
Figure 6c).
The iPLS calibration model based on DTG curves achieved an excellent correlation coefficient (R = 0.9991), with minimal cross-validation error, indicating a highly accurate predictive model. The lowest detectable concentration using this method was approximately 0.096% w/w.
The use of an inert atmosphere provided several analytical advantages. First, it avoided complications arising from exothermic oxidative reactions that may obscure or shift the thermal signature of LLDPE. Second, the high thermal stability of LLDPE in nitrogen allowed for clear discrimination from the more labile organic components of frass. These findings are consistent with prior studies that highlight the utility of inert-atmosphere TGA for polymer quantification in heterogeneous matrices, particularly for polyethylene derivatives [
4,
5].
In addition, the high sensitivity of the TGA instrument used enabled the generation of well-defined DTG curves, further enhancing model performance. Overall, thermal analysis under inert conditions emerged as a robust and accessible method for quantifying LLDPE in complex biological samples, especially when high concentrations or rapid screening are required.
3.3. Solid-State CP-MAS 13C NMR Spectroscopy
To enhance the sensitivity and selectivity in detecting residual LLDPE within frass matrices, we employed solid-state 13C nuclear magnetic resonance (NMR) spectroscopy with cross-polarization and magic angle spinning (CP-MAS). Samples of frass mixed with cryogenically milled LLDPE were prepared in concentrations ranging from 0.96% to 10% w/w. Spectra were acquired for each mixture and compared with those of pure frass and pure LLDPE under identical acquisition parameters.
The CP-MAS
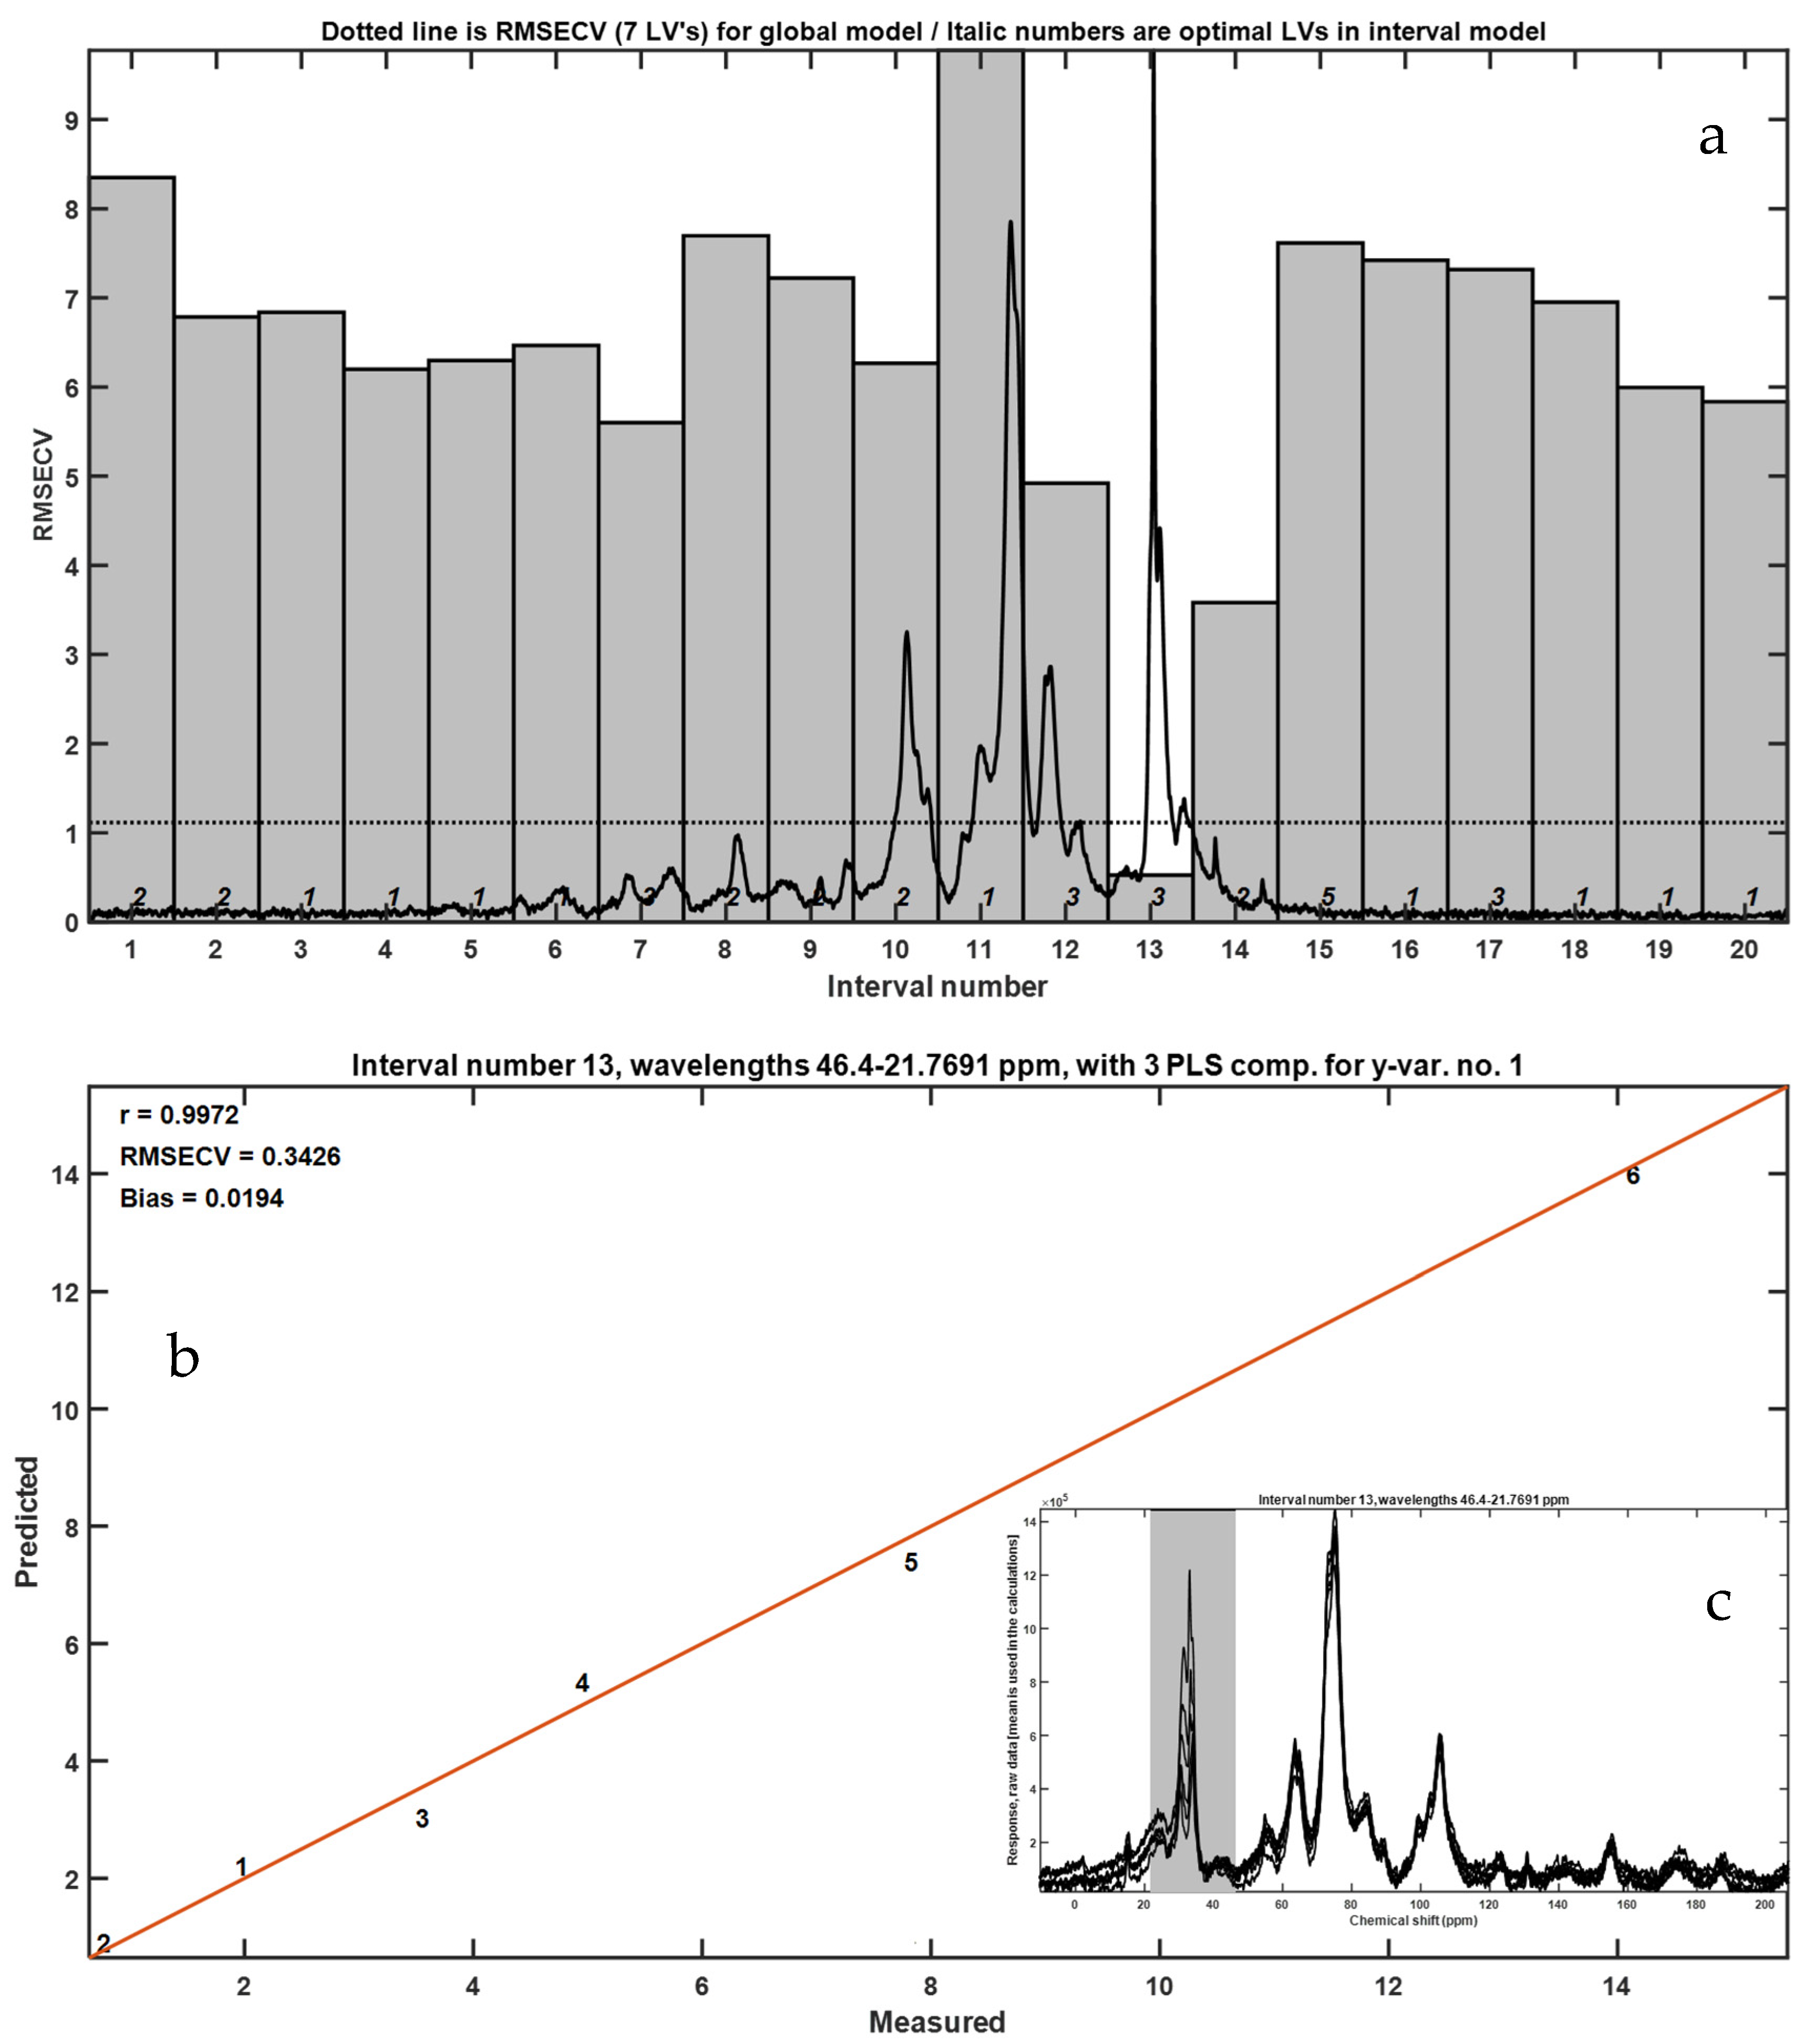
13C NMR spectra (
Figure 7) revealed characteristic resonances between 10 and 45 ppm, attributed to aliphatic methylene and methyl groups (–CH
2– and –CH
3–) that are typical of polyethylene chains. These signals were clearly identifiable even at the lowest LLDPE concentration tested (0.096%
w/
w), demonstrating the high sensitivity of this technique. However, 0.096%
w/
w was the lowest tested concentration, and that the true LOD/LOQ values for CP-MAS NMR are 0.173% and 0.525%
w/
w. The 10–45 ppm region is exclusive to the methylene carbons of polyethylene, providing a selective fingerprint for detection in complex organic matrices. Within this region, HDPE typically exhibits sharp peaks (~30–34 ppm) corresponding to extended linear chains, while LDPE and LLDPE display broader signals due to chemical shift dispersion introduced by short-chain branching (
Figure 7a). This selectivity strengthens the reliability of CP-MAS NMR for monitoring polyethylene residues. In contrast, spectra from frass alone were dominated by broader peaks centered near 72 ppm, corresponding to O-alkyl carbons in polysaccharides such as cellulose and hemicellulose, consistent with the insect’s oat bran-based diet.
Chemometric analysis using interval partial least squares (iPLS) confirmed that the most predictive spectral region for LLDPE quantification was the aliphatic zone (10–45 ppm). The optimized model showed excellent linear correlation (R = 0.9972) with low cross-validation error (RMSECV = 0.3426), indicating robust predictive performance across the tested concentration range. The observed calibration performance highlights the technique’s potential not only for qualitative detection but also for precise quantification of microplastic residues in biological matrices.
Importantly, CP-MAS 13C NMR offers additional advantages over thermal methods. It is non-destructive, requires minimal sample preparation, and provides direct molecular-level information without chemical derivatization or pyrolysis. Moreover, the spectral resolution achieved under MAS conditions enables discrimination between polyethylene signals and other organic components of frass, even in complex mixtures.
Beyond quantification, the spectral data also revealed compositional shifts in frass with increasing LLDPE content. Notably, the intensity of carbohydrate-associated signals decreased in parallel with an increase in peaks around 45–55 ppm, which may correspond to proteinaceous or lipid-related carbon environments. These shifts could reflect metabolic changes, altered digestion, or microbial colonization induced by LLDPE ingestion, warranting further biochemical investigation. The 10–45 ppm region is exclusive to the methylene carbons of polyethylene, providing a selective fingerprint for detection in complex organic matrices. Within this region, HDPE typically exhibits sharp peaks (~30–34 ppm) corresponding to extended linear chains, while LDPE and LLDPE display broader signals due to chemical shift dispersion introduced by short-chain branching. This selectivity strengthens the reliability of CP-MAS NMR for monitoring polyethylene residues.
3.4. LOD and LOQ Values
The calculated LOD and LOQ values revealed important differences among the tested analytical techniques [
19]. TG-FTIR under oxidizing atmosphere provided the lowest detection threshold (LOD = 0.0168%
w/
w; LOQ = 0.0510%
w/
w), followed by TG-MS based on the total ion chromatogram (LOD = 0.0192%
w/
w; LOQ = 0.0581%
w/
w) and TG-MS using the characteristic fragment
m/
z 28 (LOD = 0.0270%
w/
w; LOQ = 0.0819%
w/
w). In contrast, TGA performed under inert atmosphere showed markedly higher values (LOD = 0.347%
w/
w; LOQ = 1.051%
w/
w), confirming its lower sensitivity for low-level detection. Solid-state
13C CP-MAS NMR yielded intermediate values (LOD = 0.173%
w/
w; LOQ = 0.525%
w/
w), but with superior reproducibility and robustness against matrix interferences. Together, these results demonstrate that although thermal decomposition coupled with FTIR or MS can achieve very low instrumental LODs, CP-MAS NMR remains the most reliable technique for quantitative applications in heterogeneous biological matrices such as insect frass.
Taken together, CP-MAS 13C NMR emerges as a powerful analytical tool for detecting and quantifying polyethylene-based microplastics in insect-derived matrices, with clear advantages in resolution, sensitivity, and mechanistic insight compared to thermal or spectroscopic methods alone.
4. Discussion
This study evaluated and compared three complementary analytical techniques—thermal analysis coupled with FTIR and MS under oxidizing atmosphere, thermal analysis under inert atmosphere, and solid-state CP-MAS 13C NMR spectroscopy—to determine their efficacy in detecting and quantifying linear low-density polyethylene (LLDPE) in complex biological matrices derived from Tenebrio molitor frass.
The thermal analysis coupled with FTIR and MS offered valuable initial insights into the decomposition pathways of frass–LLDPE mixtures. Specific FTIR bands associated with aliphatic C–H stretching vibrations (2928 and 2855 cm
−1), as well as mass spectral fragments (e.g.,
m/
z 28 and 44), enabled partial discrimination between organic and plastic components. However, the method exhibited significant limitations at low LLDPE concentrations (<1%), primarily due to spectral overlap and the influence of matrix background signals. The high complexity and cost of the coupled instrumentation further reduce its practicality for routine quantification, particularly when high-throughput or field-relevant analysis is required. Similar limitations have been reported in other studies using evolved gas analysis for microplastic detection in organic-rich matrices [
4,
5].
In contrast, thermogravimetric analysis under an inert atmosphere provided more robust and interpretable data. The DTG profiles clearly separated the degradation events of frass from those of LLDPE, with the latter showing a well-defined thermal event at ~472 °C. Application of iPLS modeling enabled accurate calibration, with high correlation (R = 0.9991) and low RMSECV. The reduced interference from oxidative reactions simplified spectral interpretation and improved sensitivity. This method requires less specialized instrumentation than the FTIR–MS setup, making it more accessible. These findings are in line with previous studies highlighting the advantages of inert-atmosphere TGA for polymer analysis in heterogeneous samples [
5,
6].
Among the techniques tested, solid-state CP-MAS
13C NMR proved to be the most sensitive and informative. Characteristic aliphatic carbon signals (10–45 ppm) associated with polyethylene chains were clearly detected even at the lowest tested concentration (0.096%
w/
w). It should be noted that this corresponds to the minimum experimental level tested, whereas the calculated LOD and LOQ were 0.173% and 0.525%
w/
w, respectively. Chemometric modeling based on iPLS provided excellent quantitative performance (R = 0.9972; RMSECV = 0.3426), and the method also revealed compositional shifts in the frass matrix potentially linked to metabolic responses. The LOQ of CP-MAS NMR (0.525%
w/
w) is well within the range of polyethylene ingestion levels reported for
T. molitor (0.8–3.2%
w/
w in frass). This confirms the applicability of the method to real feeding scenarios, while thermal methods, although more instrumentally sensitive, remain less reliable in complex matrices. Unlike thermal methods, CP-MAS NMR is non-destructive and provides direct molecular-level insight, with minimal sample preparation. Its capability to distinguish between overlapping organic and synthetic signals without chemical pretreatment underscores its analytical strength [
9,
10,
11].
Although TG-FTIR-MS and TGA-MS offer valuable insights into the thermal degradation behavior of polymer–matrix mixtures, their application to complex biological substrates is limited. Insect frass contains high levels of proteins, polysaccharides, and lipids, which generate abundant CO2, H2O, and other volatiles upon heating. These products overlap with polyethylene-derived signals, thereby reducing both sensitivity and specificity. At concentrations below 1% w/w, interference from the matrix obscures polymer-related markers, complicating quantitative analysis. Moreover, signal deconvolution requires extensive calibration, which may underestimate polymer content. By contrast, CP-MAS 13C NMR directly targets the aliphatic carbons of polyethylene, enabling matrix-independent quantification and superior detection limits. Nevertheless, thermal methods remain valuable as complementary tools for characterizing degradation pathways and identifying secondary products.
Overall, while all three techniques provide complementary information, CP-MAS
13C NMR offers the most reliable and precise quantification of LLDPE in frass. Thermal methods remain valuable for rapid screening or high-temperature behavior analysis, but they lack the specificity and resolution required for low-concentration detection. Combining these analytical approaches with chemometric tools like iPLS significantly enhances interpretability and predictive accuracy, particularly in heterogeneous biological systems [
15,
16,
17].
These results lay the foundation for future experiments aimed at evaluating LLDPE degradation in vivo. By establishing baseline quantification techniques, it becomes possible to assess whether ingested plastic is excreted unchanged, partially depolymerized, or metabolically transformed. This analytical framework also opens the door to broader applications in environmental monitoring, biodegradation research, and insect-based plastic valorization.
It is important to note that the enriched frass–LLDPE blends employed in this study do not fully reproduce the complexity of frass derived from larvae fed with polyethylene [
4]. Our approach was intended to provide well-defined calibration samples for evaluating analytical sensitivity and robustness. Future studies will focus on applying CP-MAS NMR directly to frass from polyethylene-fed larvae, thereby allowing the quantification of both residual polymer and potential degradation products within a true biodegradation context.
Pyrolysis–GC/MS is widely regarded as the gold standard for microplastic identification, due to its ability to provide polymer-specific fragmentation fingerprints. However, it is destructive, requires extensive sample preparation, and is highly susceptible to interference from organic-rich substrates such as insect frass [
4,
6]. In contrast, CP-MAS
13C NMR combined with iPLS offers matrix-independent quantification, minimal sample handling, and good sensitivity for polyethylene residues. Although it lacks the molecular specificity of Py-GC/MS, the NMR-based approach is well suited for quantitative monitoring in biodegradation studies, and both methods may be viewed as complementary rather than competing strategies.
The comparative evaluation of detection and quantification limits highlights the complementary nature of thermal and spectroscopic approaches, while also exposing their intrinsic limitations. Thermal decomposition methods coupled with FTIR or MS achieved the lowest instrumental detection thresholds, reflecting their high sensitivity to volatile fragments generated during polymer degradation. However, this apparent sensitivity is strongly compromised by the complexity of the biological matrix: frass contains proteins, polysaccharides, and lipids that release abundant volatiles upon heating, which overlap with the characteristic signals of polyethylene and reduce both specificity and reproducibility. In contrast, TGA under inert atmosphere provided more interpretable thermogravimetric profiles and a clear separation of degradation events, but its practical sensitivity remained limited to relatively high concentrations, reducing its suitability for monitoring biologically realistic ingestion levels. CP-MAS 13C NMR offered intermediate numerical LOD and LOQ values, yet outperformed thermal techniques in terms of robustness, linearity, and independence from matrix interferences. Importantly, NMR directly probes the polyethylene backbone at the molecular level, enabling selective quantification even within a heterogeneous and signal-rich background. These advantages position CP-MAS NMR not only as the most reliable tool for quantitative assessment of polyethylene residues in insect frass, but also as the technique with the highest potential for transferability to real feeding experiments and environmental applications.
The methodological framework presented here has implications beyond proof-of-concept validation. The demonstrated sensitivity and robustness of CP-MAS NMR make it applicable to environmental monitoring of plastic residues in organic-rich matrices such as soils and composts. Moreover, the method provides a reliable basis for in vivo biodegradation studies, where quantifying both residual polymers and degradation products is essential. Finally, these analytical capabilities support the evaluation of insect-mediated strategies for plastic waste valorization, linking laboratory studies with potential biotechnological applications.
A limitation of the present chemometric analysis is the relatively small number of calibration mixtures available (
n = 6 concentration levels), which precluded partitioning the dataset into independent calibration and external validation sets without compromising statistical power. In such cases, segmented cross-validation strategies, such as the 5-fold Venetian blinds approach implemented here, are widely recognized as the most appropriate means to obtain an unbiased estimate of predictive error while maximizing use of all available data [
15,
17]. This approach ensured that each sample was predicted by a model not built on that sample, providing a reliable validation of model performance. Although future studies with larger datasets will benefit from independent external validation, the present workflow adheres to established best practices in chemometric modeling for spectroscopic data.
This work should be regarded as a methodological proof of concept, providing a validated analytical framework for the quantification of LLDPE in insect frass under controlled conditions. The next step will involve applying the workflow to frass obtained from T. molitor fed with polyethylene, enabling a realistic assessment of biodegradation efficiency and polymer transformation pathways.
5. Conclusions
This study demonstrates the utility of a multitechnique analytical approach for detecting and quantifying linear low-density polyethylene (LLDPE) in insect-derived frass. Among the techniques evaluated, solid-state CP-MAS 13C NMR provided the most accurate and sensitive quantification of LLDPE, detecting characteristic aliphatic carbon signals even at low concentrations (LOD = 0.173% w/w and LOQ = 0.525% w/w). The chemometric modeling using interval partial least squares (iPLS) further enhanced the precision of the calibration, enabling reliable quantification in complex organic matrices.
Thermal analysis under inert atmosphere also showed strong potential for LLDPE quantification, with DTG profiles offering clear thermal discrimination and robust regression models. In contrast, thermal analysis coupled with FTIR and MS under oxidizing conditions, while informative in characterizing evolved gases, was less sensitive at low plastic concentrations and required complex instrumentation.
Our findings establish CP-MAS NMR combined with iPLS as a sensitive and matrix-independent approach, directly relevant for environmental monitoring, biodegradation research, and the development of sustainable plastic waste valorization strategies.
Taken together, these findings provide a validated analytical framework to quantify synthetic polymer residues in insect frass. This is a critical step toward assessing the biodegradation potential of insects such as Tenebrio molitor when fed plastic-containing diets. Furthermore, the combination of spectroscopy and chemometrics opens avenues for high-resolution analysis of polymer–biomass interactions and supports the development of bio-based microplastic monitoring strategies.
Looking forward, methodological advances such as dynamic nuclear polarization (DNP)-enhanced NMR may further increase sensitivity, enabling detection of trace levels of polyethylene in frass and environmental samples [
20]. Likewise, miniaturized TGA systems offer opportunities for rapid, high-throughput analysis with minimal sample requirements [
21]. These innovations could extend the applicability of the present framework to broader biodegradation and environmental monitoring contexts.
In summary, this study establishes a proof-of-concept framework; future in vivo feeding experiments will extend its application to real biological samples, bridging methodological development with ecological and biotechnological relevance.

