1. Introduction
The shock wave generated by the dynamic physical and chemical reaction process is the main load on the technical infrastructure and people located near the epicenter (EM). When predicting the fatigue strength of a material under impact loads generated by a blast wave phenomenon, it is important to consider the load on the material caused by the pressure pulse or the pressure of the shock wave front (shock) [
1,
2]. Based on research [
3,
4], a shock wave and rapidly spreading gases are generated near the EM source. This phenomenon is accompanied by high temperatures.
Three types of blast phenomena can be distinguished: free-air blast (in open air) [
5,
6], confined blast (in a closed environment) [
7,
8], and contact blast, where the explosive charge is placed directly against a structural surface [
5,
9,
10]. However, a common feature of a confined blast phenomenon and a blast phenomenon of material attached to an object is the formation of strong stress waves in the material, which causes its destruction in the form of crushing [
3]. Therefore, in order to estimate the effects of a shock wave impact, it is necessary to know the pressure generated by the wave at its front and the phenomena associated with its amplification. This amplification is the result of the action of incident and reflected waves, as described, among others, in [
3,
4,
11].
The literature on this subject is quite extensive. In the works of Baker [
12], Bulson [
13], Henrych [
14], and Wlodarczyk [
15], as well as other authors, analytical methods for determining blast phenomenon loads were presented. These works show that the most common are the relationships obtained from the approximation of experimental data for energy material charges for free blast phenomenon and contact blast (phenomenon on the earth’s surface or adjacent to a structure). The impact of a shock wave generated by a point pressure wave can be reduced to a moving normal load as a circular surface in which the radius increases over time at a variable speed [
16]. Various researchers have investigated the effects of local blast wave loading on various structural forms and material systems. In the work by Wierzbicki and Nurick [
17], steel plates were considered as the central membrane impact of the EM, where the deflection profile of the plates was analyzed by developing a simple analytical technique for calculating the transition and final states. They also found two different mechanisms of destruction of the loaded structure. The first concerns a deformation slightly larger than the diameter of the centrally placed load. This damage concerns the so-called “discing”. The second failure mode concerns tensile/shear tearing fracture at the clamped edge. The relationship between these failure modes depends on the load radius. Florence [
18] presented the response of circular steel plates subjected to uniform local loads. In subsequent studies by Lee and Wierzbicki [
19,
20], individual forms of damage in steel plates were presented for local conditions exposed to blast phenomenon. Many problem aspects are discussed, including plasticity and fracture calibration, and a detailed description of the three stages of dynamic response, i.e., dishing, discing, and petalling. Metal sandwich and truss structures were the subject of analysis in the works [
21,
22]. In the works [
23,
24,
25,
26], the destruction on uniformly impulsively loaded beams and slabs was considered, in which the destruction method was presented in the form of three models, namely, large inelastic deformations (Mode I), partial tearing (Mode II), and complete rupture and shear failure (Mode III). Particular attention was focused on the response of mild steel plates to air loading, taking into account various parameters such as high-energy, mass and shape, and plate geometry and boundary conditions. The analysis was based on the introduction of a single undersized pressure pulse parameter.
An alternative method for determining high-energy loads is to use numerical procedures based on continuum mechanics equations expressed by the laws of conservation of mass, momentum, or energy, supplemented by constitutive relationships describing individual materials. For this purpose, an explicit implementation of the finite element method is used. For this purpose, models are created that must take into account the following elements: soil, air, high-energy material and the structural material under consideration. Three main methods are used to model blast phenomena and shock wave propagation, namely, conventional weapons (ConWep), the arbitrary Lagrange–Euler method (ALE) together with fluid-structure interaction (FSI), and smooth particle hydrodynamics (SPH). The detonation process is primarily described using classical gas dynamics equations and semi-empirical equations of state, e.g., JWL (Johnson–Wilkins–Lee) [
2,
27,
28,
29]. Interesting numerical and experimental studies are presented in [
10], where pressures and pressure impulses on structural steel were analyzed by changing the distance, and the loads applied were characterized by low masses (4–15 g). However, the works of Nuberger et al. [
30,
31] presented the scaling of numerical models with results obtained for large high-energy charges loading armor steel with a pressure impulse. The general influence of sensitivity to deformation rate and variability of material properties depending on sheet thickness in response to the scaled model was presented.
Several previous studies have analyzed the effect of explosive or impact loading on the evolution of steel microstructure. For example, [
32] found that explosive loading induced complex microstructural changes—including increased material strength and grain refinement—in ASS 316 L steel [
33]. Similarly, it has been shown that local explosive loading of high-strength steel increases deformation and reduces grain size, which has a clear relationship with the observed deformation distribution [
34]. However, these studies were mainly limited to experimental observations or numerical models alone. The originality of this work lies in the combination of computed tomography and metallographic studies with hybrid FEM/SPH/CEL simulations, which allows for a direct comparison of numerical deformation/damage fields with experimentally observed fracture mechanisms.
Previous studies have shown that numerical methods such as FEM, SPH, and CEL are powerful tools for predicting global stress and strain fields under explosive or impact loading. However, they are unable to fully describe the mechanisms of crack initiation and propagation, which are controlled by the microstructure of the material. Microstructural inhomogeneities, such as MnS inclusions and alternating bands of ferrite and pearlite, play a decisive role in damage evolution. For this reason, metallographic analysis and computed tomography (CT) were included in this study, providing complementary data that allow direct correlation of numerical predictions with actual fracture mechanisms. This integrated approach provides a more complete description and validation of the damage processes in structural steel.
The authors of this study focused on metallographic analysis supported by computed tomography methods of material subjected to an EM detonation wave. In this way, attention should be paid to the mechanisms determining the destruction of materials at the microscopic level. To this end, at the laboratory level, the impact resistance of a commonly used material, EN C45 steel samples, was evaluated as a result of a pressure pulse of 75 g of high-energy material. The research was enriched with numerical analyses using the finite element method (FEM) in ABAQUS 6.14 software. An important contribution of the authors to the development of numerical methods for the analysis of high-energy processes is the enrichment of the analysis with three different approaches and the use of different modeling methods: FEM (finite element method), SPH (smoothed particles hydrodynamics), and CEL (coupled Eulerian–Lagrangian), which is an important step in the development of computer methods in pressure wave analysis. The aim of this work is not only to describe the dynamic behavior of C45 structural steel under impulse loading, but also to compare different hybrid modeling methods (FEM, SPH, CEL) and validate them based on experimental observations obtained through computed tomography (CT) and metallographic analysis.
2. Analytical Description of the Blast Load of the Tested Material
Shock waves play an important role in the course of detonation. There are two phases during this phenomenon: the phase of maximum pressure (overpressure) at the moment of detonation, which, after a certain time, transitions into a negative phase (underpressure) (
Figure 1) [
35,
36].
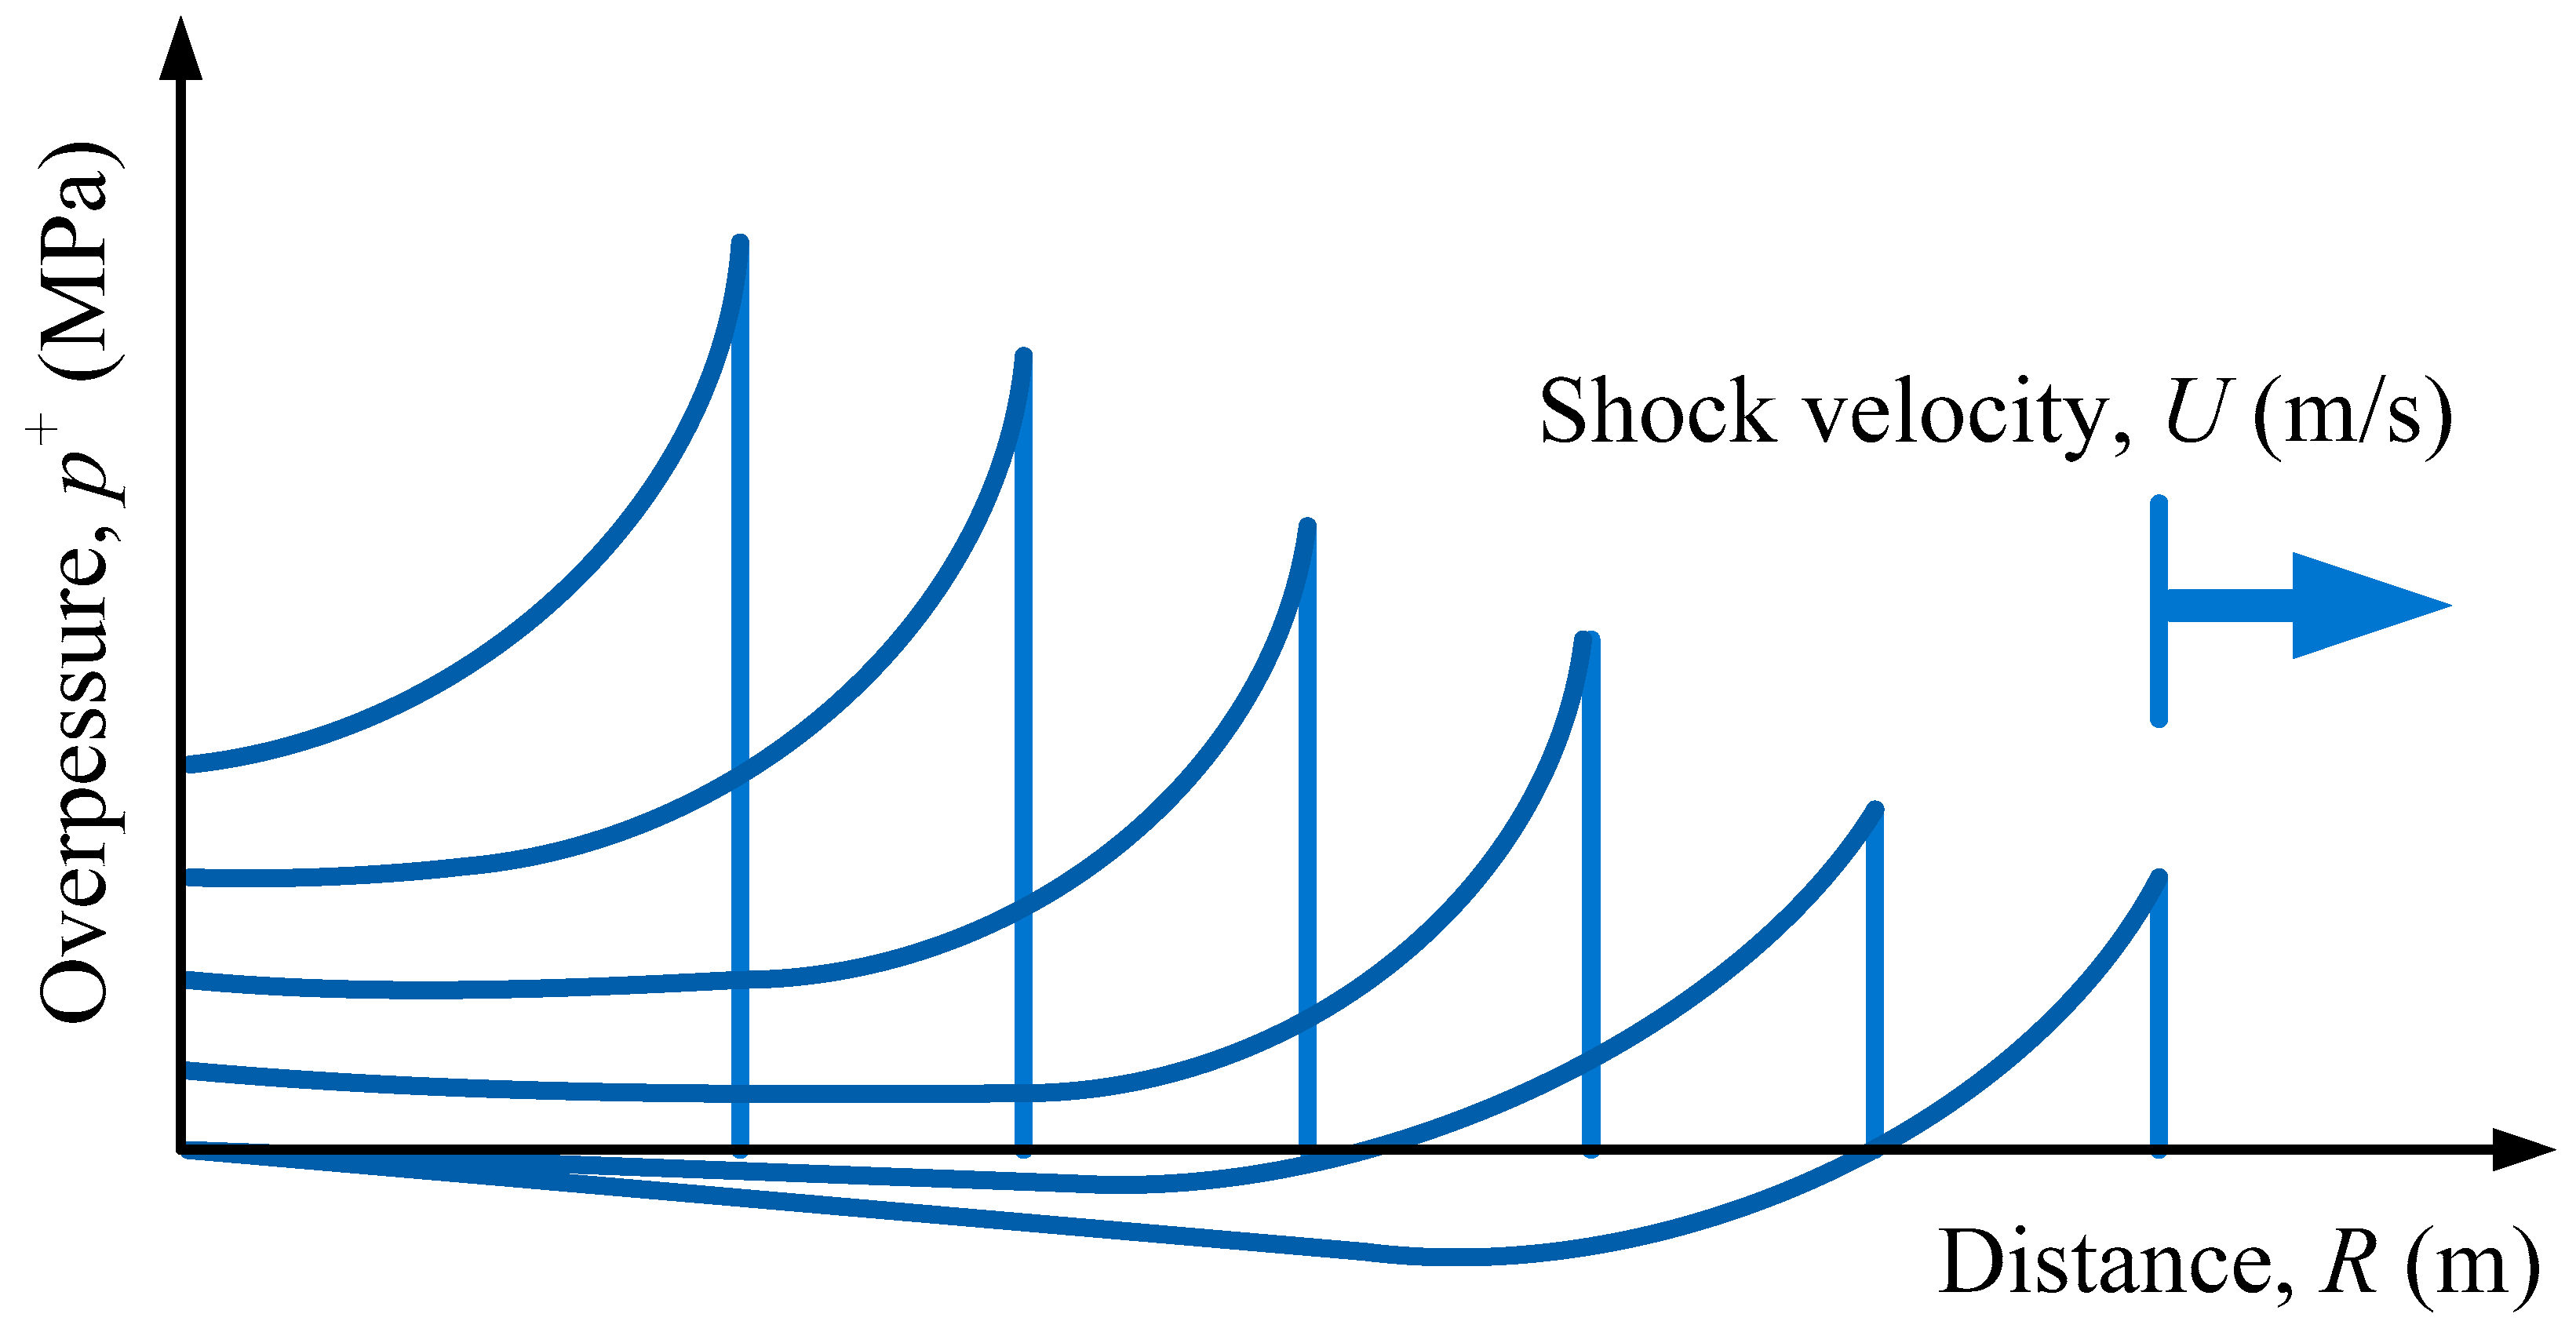
These waves have large amplitudes of shifts of particles of the surrounding environment, caused by changes in air pressure and density. The impact of high-energy materials on the surrounding environment depends on the distance between the detonating charge and the tested object, the schematic effect of the object’s distance from the blast phenomenon epicenter, and the influence of the pressure, as shown below (
Figure 2). According to [
37,
38], polynomial relations can be quickly used to calculate the amplitude, impulse, and other parameters of the blast wave for the contact blast phenomenon of a hemispherical charge.
During the initial, positive pressure phase (
Figure 1), this impulse can be calculated as an integral over the pressure value (1).
where Δ
p—is the maximum overpressure on the shock wave front (
,
t0—is the initial time of overpressure, and
t1—is the final time of overpressure.
By selecting appropriate parameters [
39,
40,
41], it is possible to estimate the pressure acting on the analyzed material. Starting from a simple relationship, the stress acting on the material can be written as (2)
where
F is the axial force [N], and
A is the surface area of the analyzed cross section (mm
2).
We will define force as the product of the pressure acting on the surface of the material, as follows (3):
where
P is pressure [MPa], and
A is the area of the acting pressure (mm
2).
Stress conventions are assumed to be positive when tension occurs, and pressures are positive when they act compressively on the surface. When an object is loaded, its reaction causes an increase in stress. Increasing stress causes the object to deform. Strain can be assumed to be a measure of how much an object bends in response to applied stresses. For a cube with side length that is stretched along its total length u under a tensile stress, the tensile strength can be defined as (4)
where
u is the final length of the sample after the tensile test (mm), and
l is the initial length of the sample (mm).
Unlike the impact along the tested object, during the blast phenomenon, there are also shear loads—acting perpendicularly to the material surfaces of the unit cells and causing them to shear. Similarly, analysis can be made for shear and transverse stresses, as follows (5):
where
F is the force acting perpendicularly on the surface (N), and
A is the surface area of the analyzed cross section (mm
2).
These relationships were used to calculate local shear strains and equivalent plastic strains in EN C45 specimens based on CT sections and microscopic observations. For example, in the Series II specimens, the γ and ε values confirmed the presence of local shear zones, consistent with the elongated and rotated grains observed near the edges of the specimens. For example, in one of the Series II samples, the average shear strain γ was estimated at approximately 0.25 in the plastic deformation zone, which corresponded to grain deformation and the formation of microcracks. The calculated values correlated well with microstructural changes, such as shear deformation of ferrite grains and initiation of microcracks along MnS inclusions.
The analysis of shear deformation is related to the displacement of the sheared surface relative to the reference surface. The effect of shear is to change the shape of the body without any change in its volume. This is related to the representation of the deformation in the following form (6) [
42,
43]:
where Δ
x is the surface displacement in relation to the neutral axis (mm), and
L0 is the value of the length of the hypotenuse resulting from the shift by value Δ
x (mm).
From the point of view of research into energy materials, it is also important to introduce the concept of scaling values. For different high-energy materials, the same pressure values will be achieved, but for different distances from the epicenter of the blast phenomenon and the mass of the charge. For this purpose, a scaled distance Z is used, which is related to the radius from the center of the blast and the equivalent mass, as follows (7) [
44,
45]:
where
R is the distance between the dummy and the center of spherical charge (m), and
W is the mass of the charge (kg).
This parameter is further used in the analysis of the experimental series and numerical simulations, allowing direct comparison between different loading configurations.
This makes it possible to scale between different high-energy materials for different values of radii from the center of the blast phenomenon, as well as different masses of high-energy charges using the following relation (8) [
44,
45]:
where
Rn is the distance between the dummy and the center of individual charge (kg), and
Wn is the mass of the individual charge (kg).
3. Materials and Methods
This subchapter presents a description of the tested material and prepared samples (
Section 3.1), as well as a description of the prepared station and the analyzed variants of sample placement (
Section 3.2) and also the preparation of a numerical model (
Section 3.3).
3.1. Tested Samples
The subject of the research was samples made of EN C45 (1.0503) structural steel (Murray Steel Products, Sheffield, South Yorkshire, UK), which is mainly used for the production of medium-duty machine and equipment components in the automotive industry, as well as for die forging and hot rolling of products such as bars, sheets, and wires. The samples were made in the form of cylinders with a diameter of 25 mm and a height of 30 mm. All samples were cut from EN C45 steel bars and then ground and polished to obtain a uniform surface. Prior to testing, the sample surfaces were cleaned and degreased with technical alcohol to minimize the influence of surface defects on crack initiation and propagation. Two series of samples were made, with 5 pieces in each (
Figure 3).
Before conducting basic tests regarding resistance to the impact of the blast phenomenon shock wave, the material from the samples was analyzed in terms of mechanical properties and metallographic structure. The optimal mechanical values of this steel, including strength, are obtained by hardening and then tempering. Below (
Table 1) are presented the mechanical properties of steel as declared by manufacturers [
46,
47].
Below (
Table 2) is also shown a comparison of the chemical composition of steel as declared by manufacturers with tests performed using the GDS-750 glow discharge spectrometer from LECO (St. Joseph, MI, USA). The chemical composition analysis carried out indicates that the chemical composition of the steel is consistent with the composition declared by the manufacturers [
47,
48].
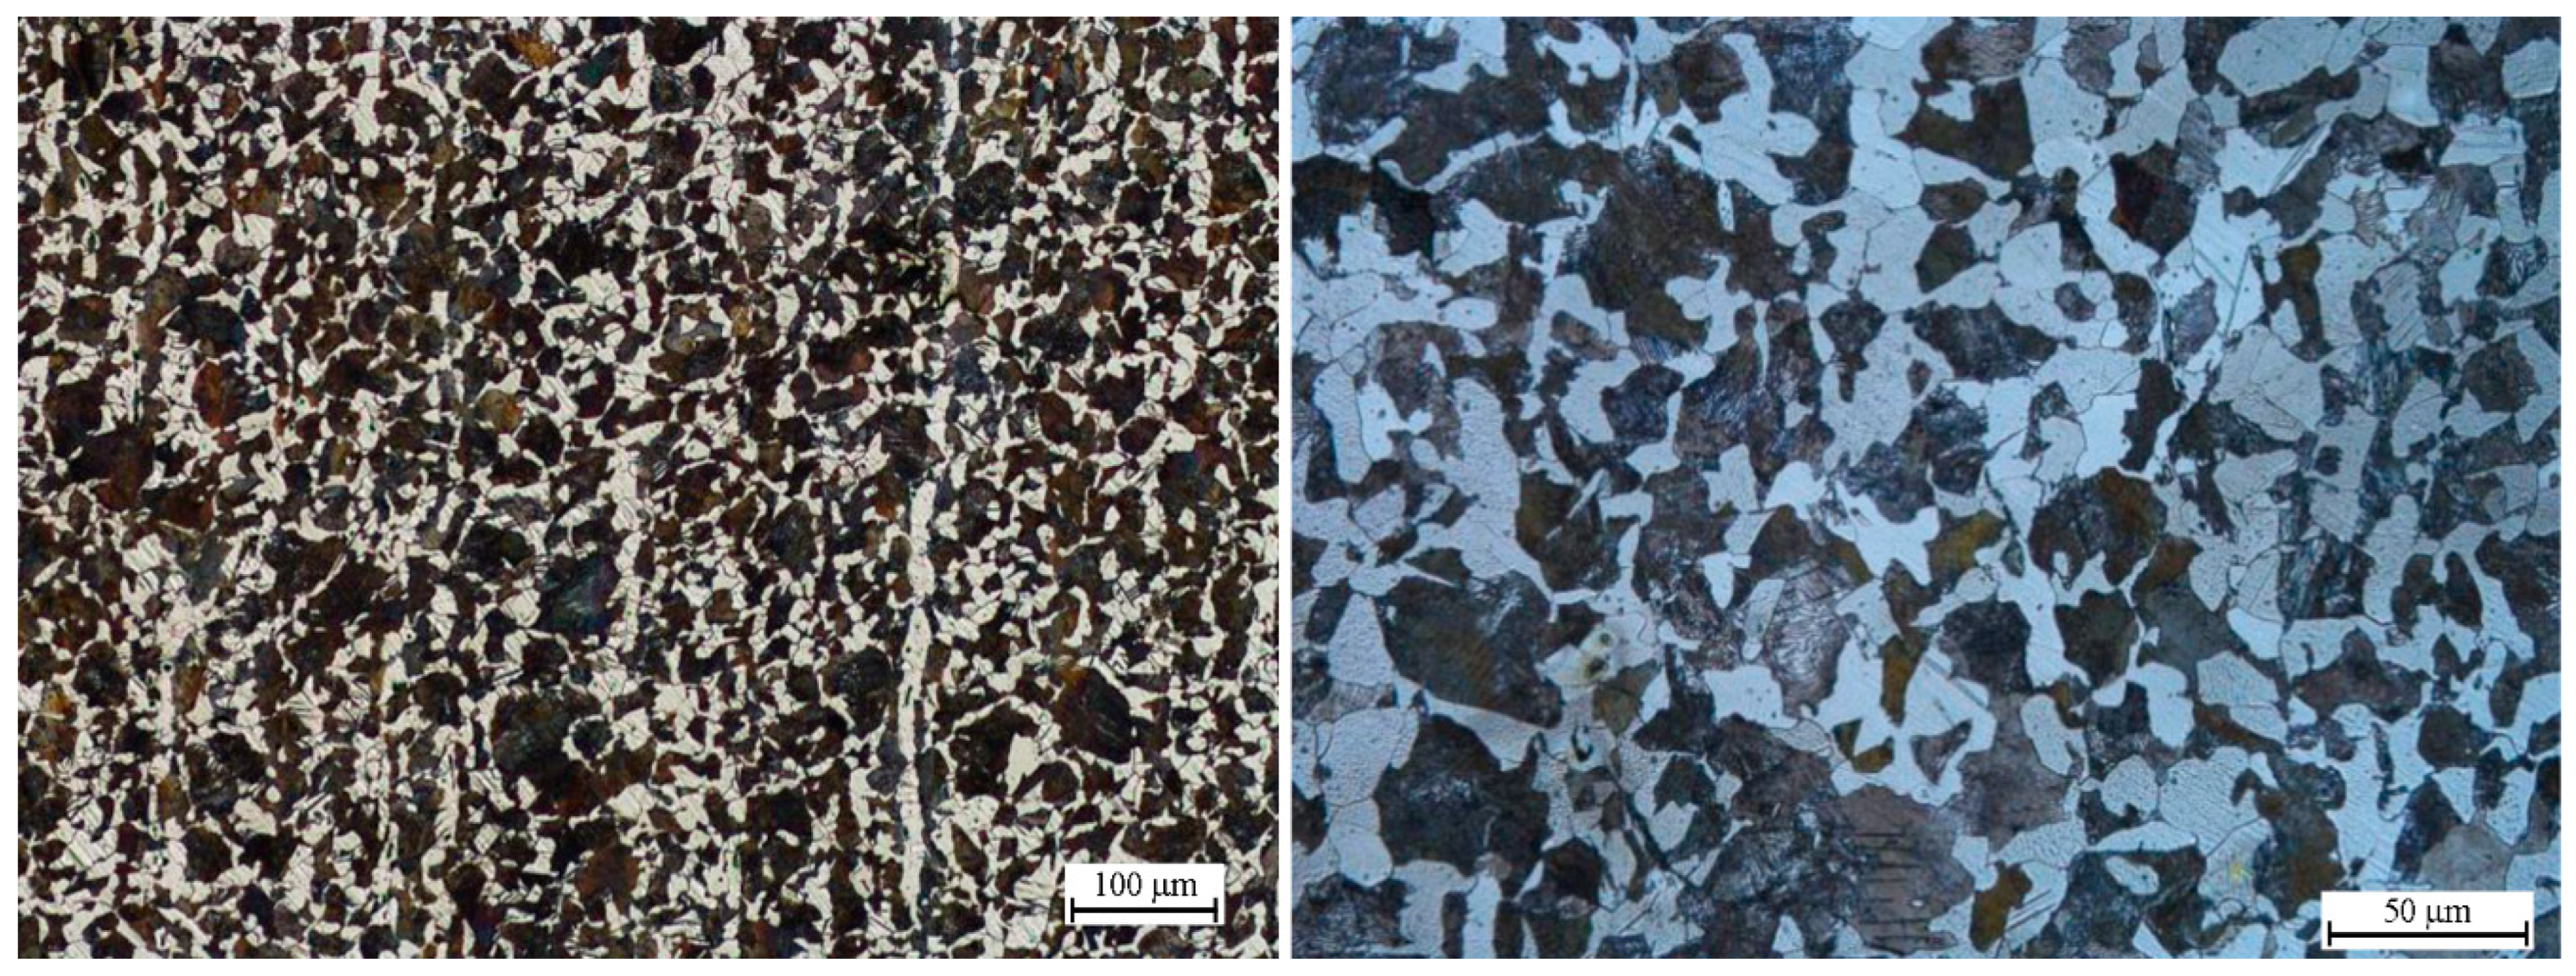
Below (
Figure 4) is shown the microstructure of the material, which was also examined with the use of light microscopy.
As noted (
Figure 4), the material contains a banded ferrite–pearlite structure, characteristic of structural steel in its normalized state. The arrangement of individual grains is striped. The banding of the structure is the result of crystallization with a local excess or deficiency of alloying elements. Areas with low manganese content turn into ferrite earlier. Due to the limited solubility of carbon in ferrite (up to 0.0218%), the excess of this element is pushed into the austenite until it is transformed into pearlite (temp. A1) [
49,
50].
3.2. Station for the Test of High-Energy Resistance of the Material
High-energy resistance tests on C45 samples were performed in the military training ground laboratory, where a test stand was designed for this purpose (
Figure 5). The research material in the form of samples (cylinders with dimensions
d = 25 mm,
h = 30 mm) was tested in two series.
Two loading configurations were tested, as follows (
Figure 5a):
Variant I (contact detonation): The high-energy charge (75 g, cylindrical cartridge, diameter 30 mm, length 70 mm) was placed directly in contact with the front face of the steel sample (dimension d).
Variant II (standoff detonation): The same high-energy charge was positioned 30 mm away from the sample face.
In both cases, the samples were oriented vertically, with their height dimension (h) resting on the soil surface. Detonation was initiated using ERG electric detonators connected via an electronic capacitor exploder. For each variant, five blast loading tests were carried out, with the high-energy charge location shifted each time to maintain comparable ground conditions.
Prior to testing, all explosive charges were stabilized under ambient training ground conditions for approximately 72 h (average temperature 24 °C, pressure 1010 hPa, humidity 43%, wind ~15 km/h).
To record the blast parameters, a PCB Piezotronics 137A23 free-wave pressure sensor was placed at a horizontal distance of 5 m from the charge and at a height of 0.1 m above the ground (
Figure 5b).
After completing the field experiments, the samples were subjected to computed tomography (CT), metallographic examination, and numerical simulations in order to analyze damage mechanisms and validate the hybrid FEM/SPH/CEL models.
3.3. Preparation of Numerical Model
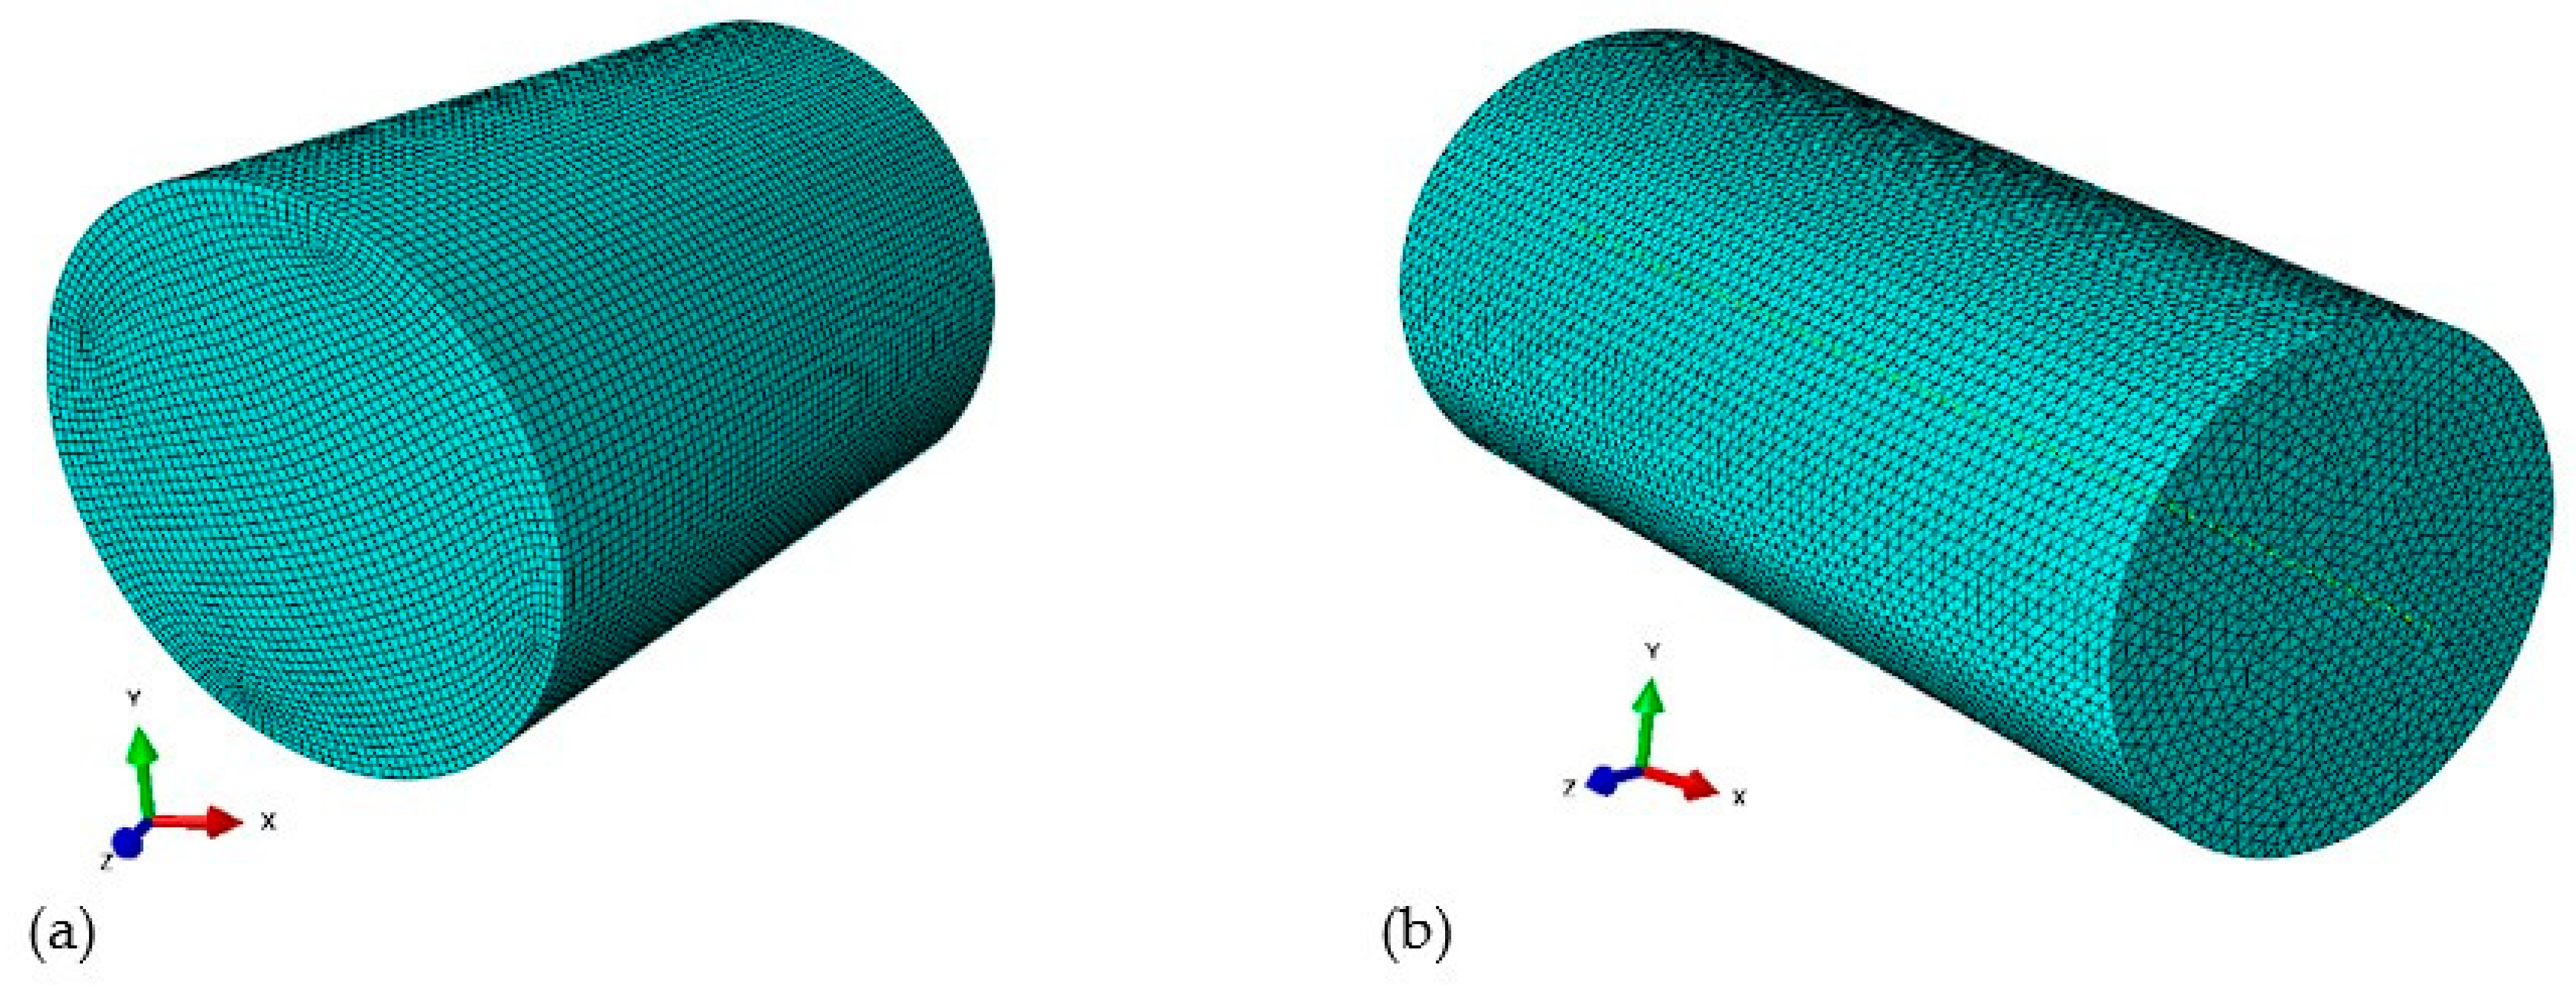
The numerical analysis was performed in the ABAQUS/Explicit program. The tested system was modeled as volume elements. Three methods for modeling a high-energy were used. The first one is standard FEM, the second one is SPH (smoothed particles hydrodynamics), and CEL (coupled Eulerian–Lagrangian)—a method combining Euler’s and Lagrange’s descriptions. The table below lists the elements used in the simulations and presents the type of elements used in the discretization process (
Table 3). Below (
Figure 6) are shown the discretized roller and materials in an ABAQUS computing environment.
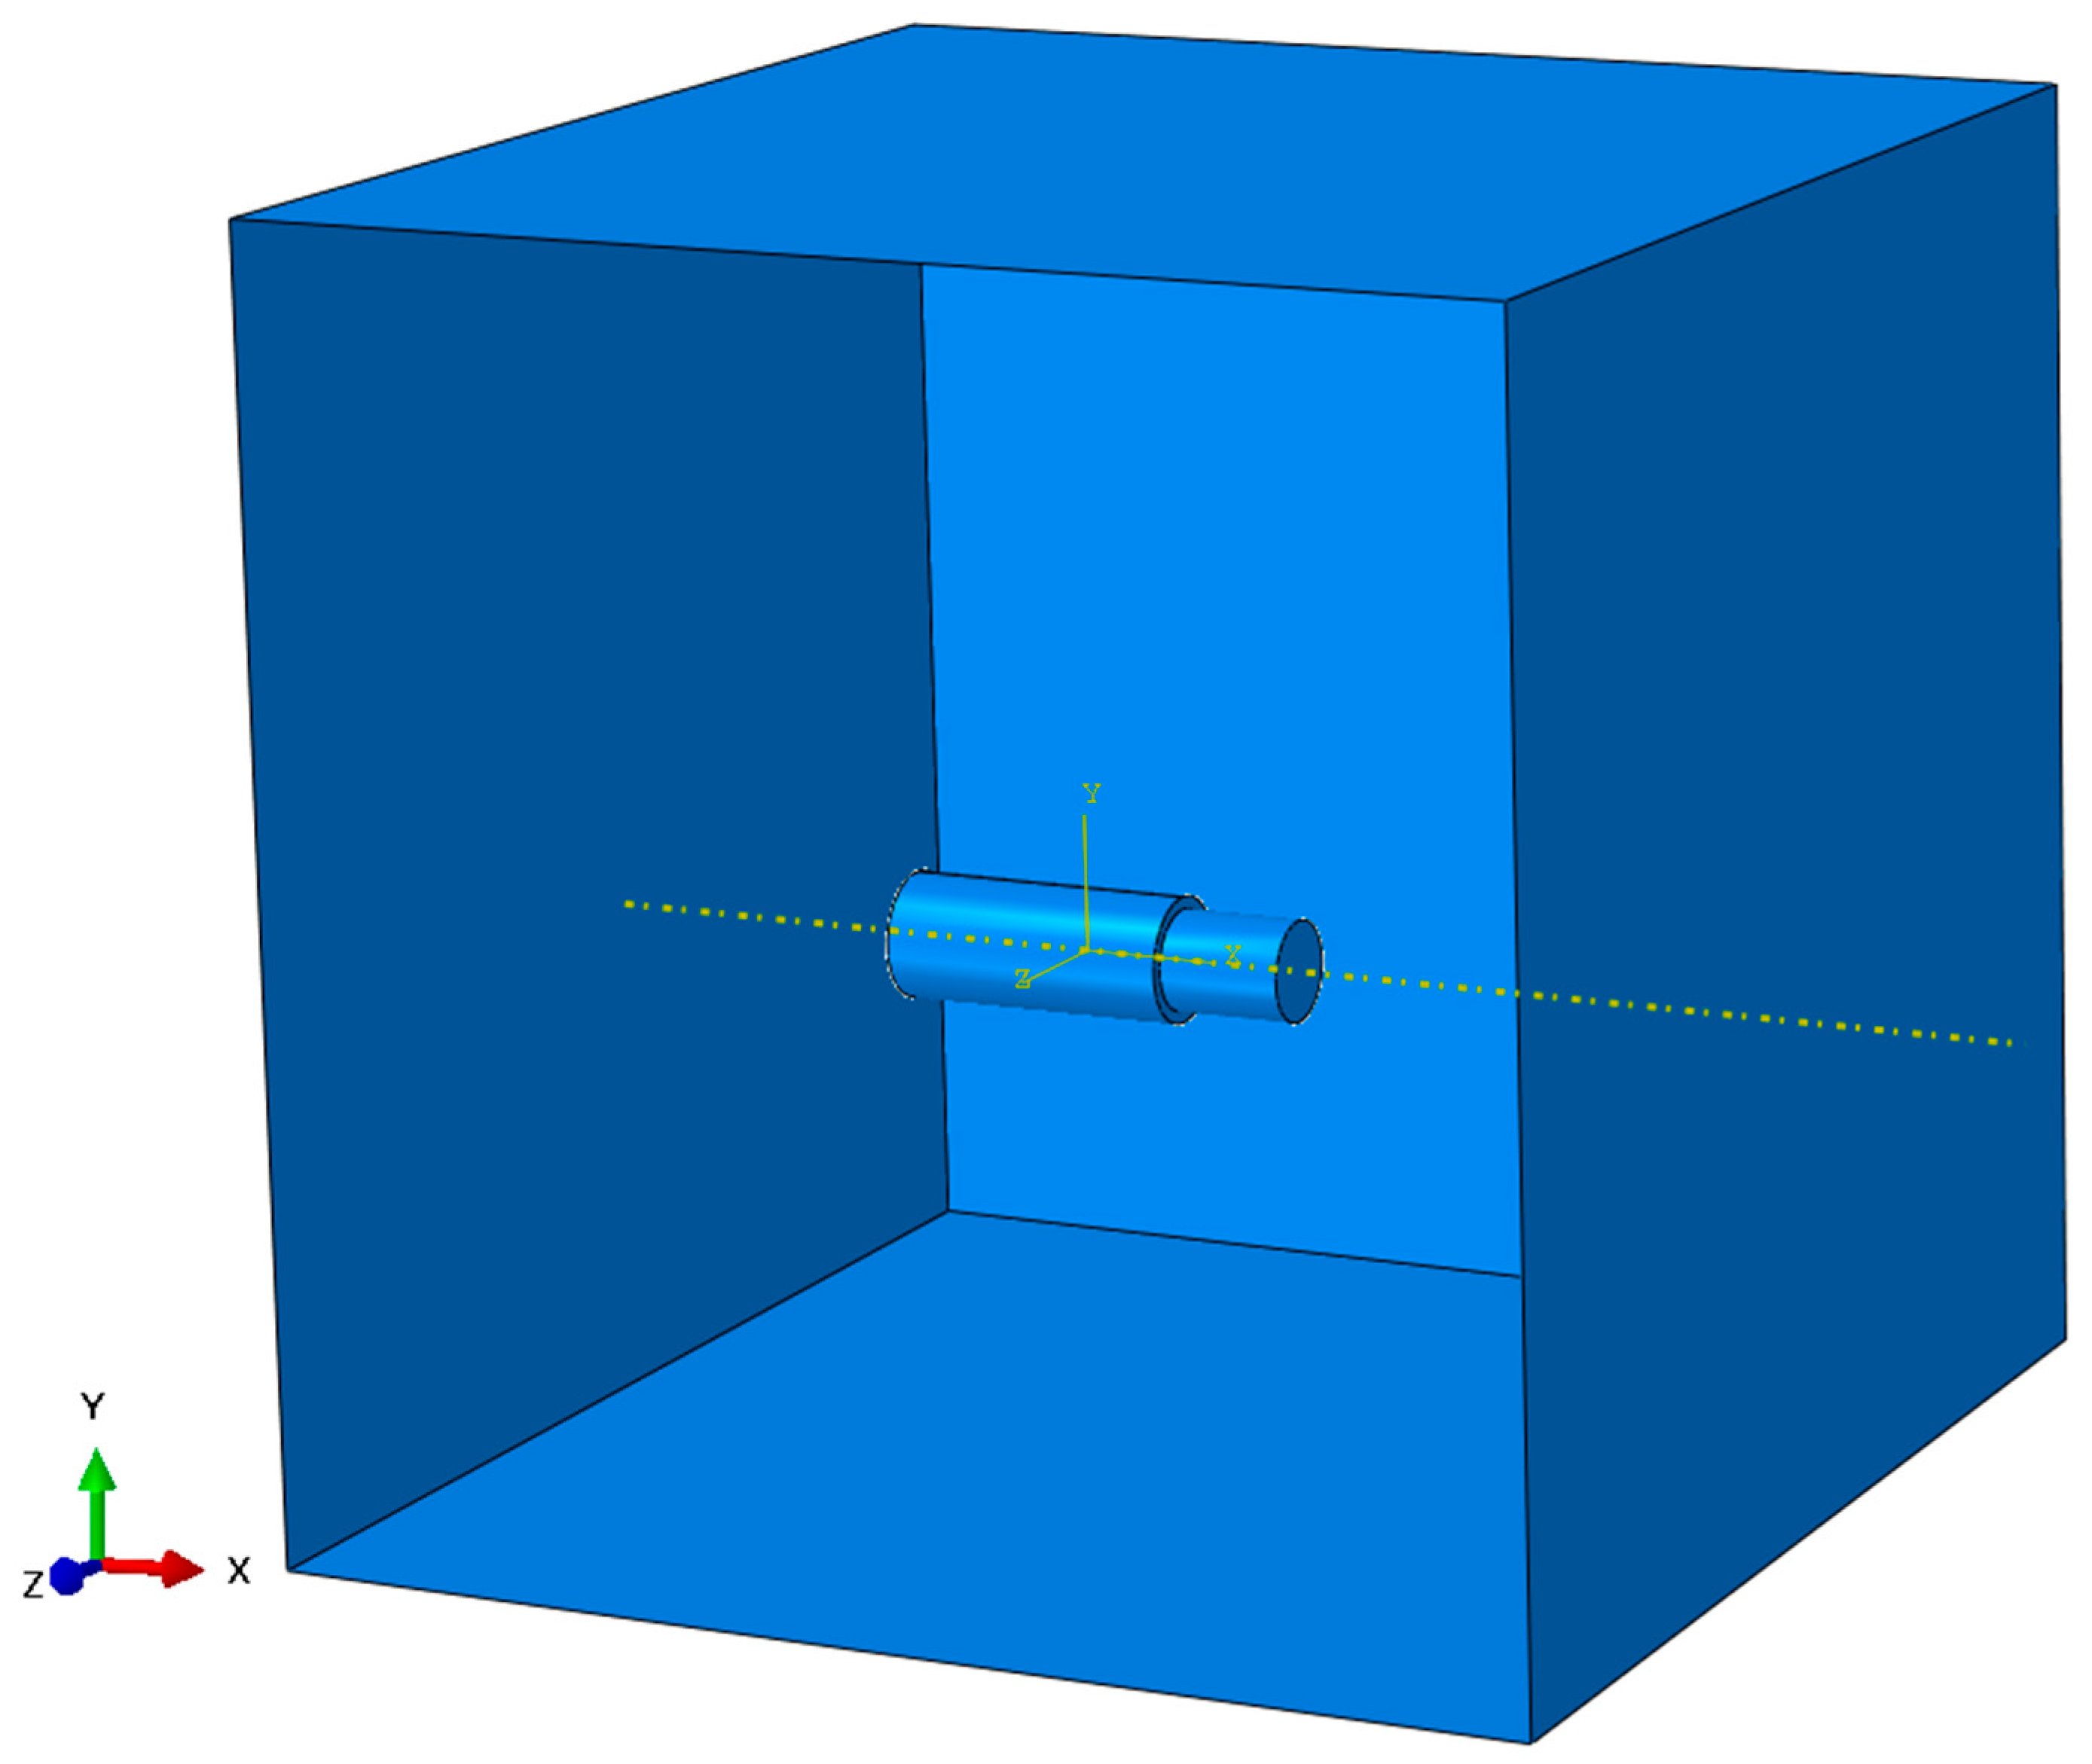
The initial setup of the simulation components is shown below (
Figure 7). The detonation point was defined as (0.0,0.0,0.0) for the X, Y, Z axes, respectively, for time t = 0 s.
One of the most important equations currently used to represent the strength model of metallic materials is the Johnson–Cook model (9), which is a special type of Mises plasticity model containing analytical forms of the hardening and softening laws of the material under the influence of temperature [
51,
52,
53]. The J–C constitutive equation is suitable for computational purposes due to its simplicity and the use of parameters that are relatively easy to determine. It is widely used in CAE (Computer-Aided Engineering) programs such as ABAQUS and LS-Dyna. In the study, this model was used to describe the behavior of C45 steel. The Johnson–Cook damage model [
32,
54,
55] was used to describe the damage to the steel material. In this case, the deformation occurring at the moment of damage is described by the following Equation (10):
where
is the plastic strain;
is the plastic strain rate;
is the reference strain rate;
T is the current temperature;
T0 is the room temperature;
Tm is the melting temperature,
A,
B,
C,
n, and
m are the J–C material behavior coefficients;
is the plastic strain to fracture;
is the equivalent stress; and
D1,
D2,
D3,
D4, and
D5 are the input constants determined empirically.
To describe the material damage when the plastic strain
εc(
) exceeds the dynamic strain limit, we introduce the Heaviside function
H(
x), where (10)
The Johnson–Cook strength and damage parameters for C45 steel were adopted from previous experimental and numerical studies [
51,
52,
53,
56,
57], in which this constitutive model was successfully applied to medium-carbon steels subjected to dynamic loads. The EOS (Equation of State) parameters for air (Mie–Gruneisen) and explosive (JWL) were taken from standard sources [
58,
59,
60,
61,
62,
63]. These sources ensured consistency with the established values used in explosion and impact modeling. The selected constants can therefore be considered representative and reliable for the load conditions under investigation.
To describe the material damage when the plastic strain
εc(
) exceeds the dynamic strain limit, we introduce the Heaviside function
H(
x), where
To improve the description of dynamic damage, a user-defined VUMAT subroutine has been implemented. The modification introduces the Heaviside step function as an erosion criterion when the cumulative plastic strain exceeds the dynamic limit. This approach allows for gradual stress degradation and better agreement with experimental observations of fragmentation. A Fortran subroutine (VUMAT for Abaqus), based on a modified Johnson–Cook model, is used to simulate the hydrodynamic penetration of a plate by an explosively formed projectile (EFP). It includes a dynamic deformation limit dependent on the deformation rate and a degradation mechanism based on the Heaviside step function. The model uses the classic Johnson–Cook parameters
A,
B,
n, and
0. Additionally, it introduces dynamic limit parameters: the initial
εc0 and sensitivity coefficient
D. The value of
εc is determined as a logarithmic function
. When the cumulative plastic strain
εplastic exceeds
εc, the deviatoric part of the stress tensor is set to zero (damage). Otherwise, the stresses are calculated according to the following Equation (13):
where H is the Heaviside function.
The subprogram uses state variables (STATEV) to record the cumulative plastic strain value, which is updated in real time during each calculation iteration. This allows it to take into account both the effects of dynamic plasticity and the material degradation process, enabling it to accurately reproduce its hydrodynamic response under very high strain rates.
Material equations of state determine the hydrostatic or volumetric behavior of a material by calculating pressure as a function of density, energy, and/or temperature. Simulations requiring the use of EOS are characterized by very high strain rates, stresses significantly exceeding the yield point and the propagation of shock waves. The air properties were described using the Mie–Gruneisen equation [
58,
59] in accordance with the following relation (14):
where
p0 is the initial air pressure,
γ is the Gruneisen coefficient,
ρa is the density of air, and
E0 is the initial internal energy.
The JWL mathematical model [
2,
27,
60,
61] was assigned, as it allows for determining the pressure according to the following relation (15):
where
η is the ratio of the density (
ρ) of detonation products to the initial density (
ρ0) of the original high energy;
κpd is the pre-detonation bulk modulus; and
A*,
B*,
R1,
R2, and
ω are the fitting coefficients obtained from experiments.
The table below (
Table 4) lists the material constants. C45 steel was described in the plastic range using the Johnson–Cook (J–C) model. At the same time, the destruction parameter J–C was adopted. The effect of temperature was neglected. The high energy is described by the JWL equation of state.
After preparing the numerical model, numerical simulations were performed for three different variants.
4. Results
This chapter presents the results of the conducted research. First, the results of the field tests are presented (
Section 4.1). In the next subsection (
Section 4.2), these are analyses using a tomograph, thanks to which the material loss was observed. The following sections (
Section 4.3) present the results of microscopic analysis of the material. At the very end (
Section 4.4), a comparison of the results of the numerical simulations is presented. In series I, the load in direct contact with the sample corresponds to a very small scaled distance (Z → 0), which explains the observed immediate fragmentation. In contrast, samples from series II tested at a scaled distance of approximately Z ≈ 1.2 did not fragment, but internal cracks and shear deformations formed in them, which is consistent with the lower pulse intensity predicted for this range.
4.1. Field Test Results
Preliminary inspection of the analyzed research material confirmed damage in each of the cylindrical samples, both series I and series II (
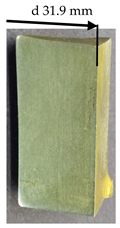
Figure 8).
As a result of detonation, the samples from series I were completely fragmented, with cracks concentrated in the sample axis and their propagation along planes extending radially from the interior to the external surfaces. After this plane, the samples were separated into three to five separate fragments. In samples of series II, as a result of the lower energy of the shock wave caused by the distance of the charge from the front of the samples, their deformation occurred mainly with a significant increase in the diameter of the sample front on the detonation side. No cracks were observed on the external surfaces of the samples. As a result of detonation, the samples swelled permanently, as a result of which their height decreased by 14–17% in samples of series I and by 7–8% in samples of series II. The pressure that affected the sample material due to different distances of the samples from the high energy (
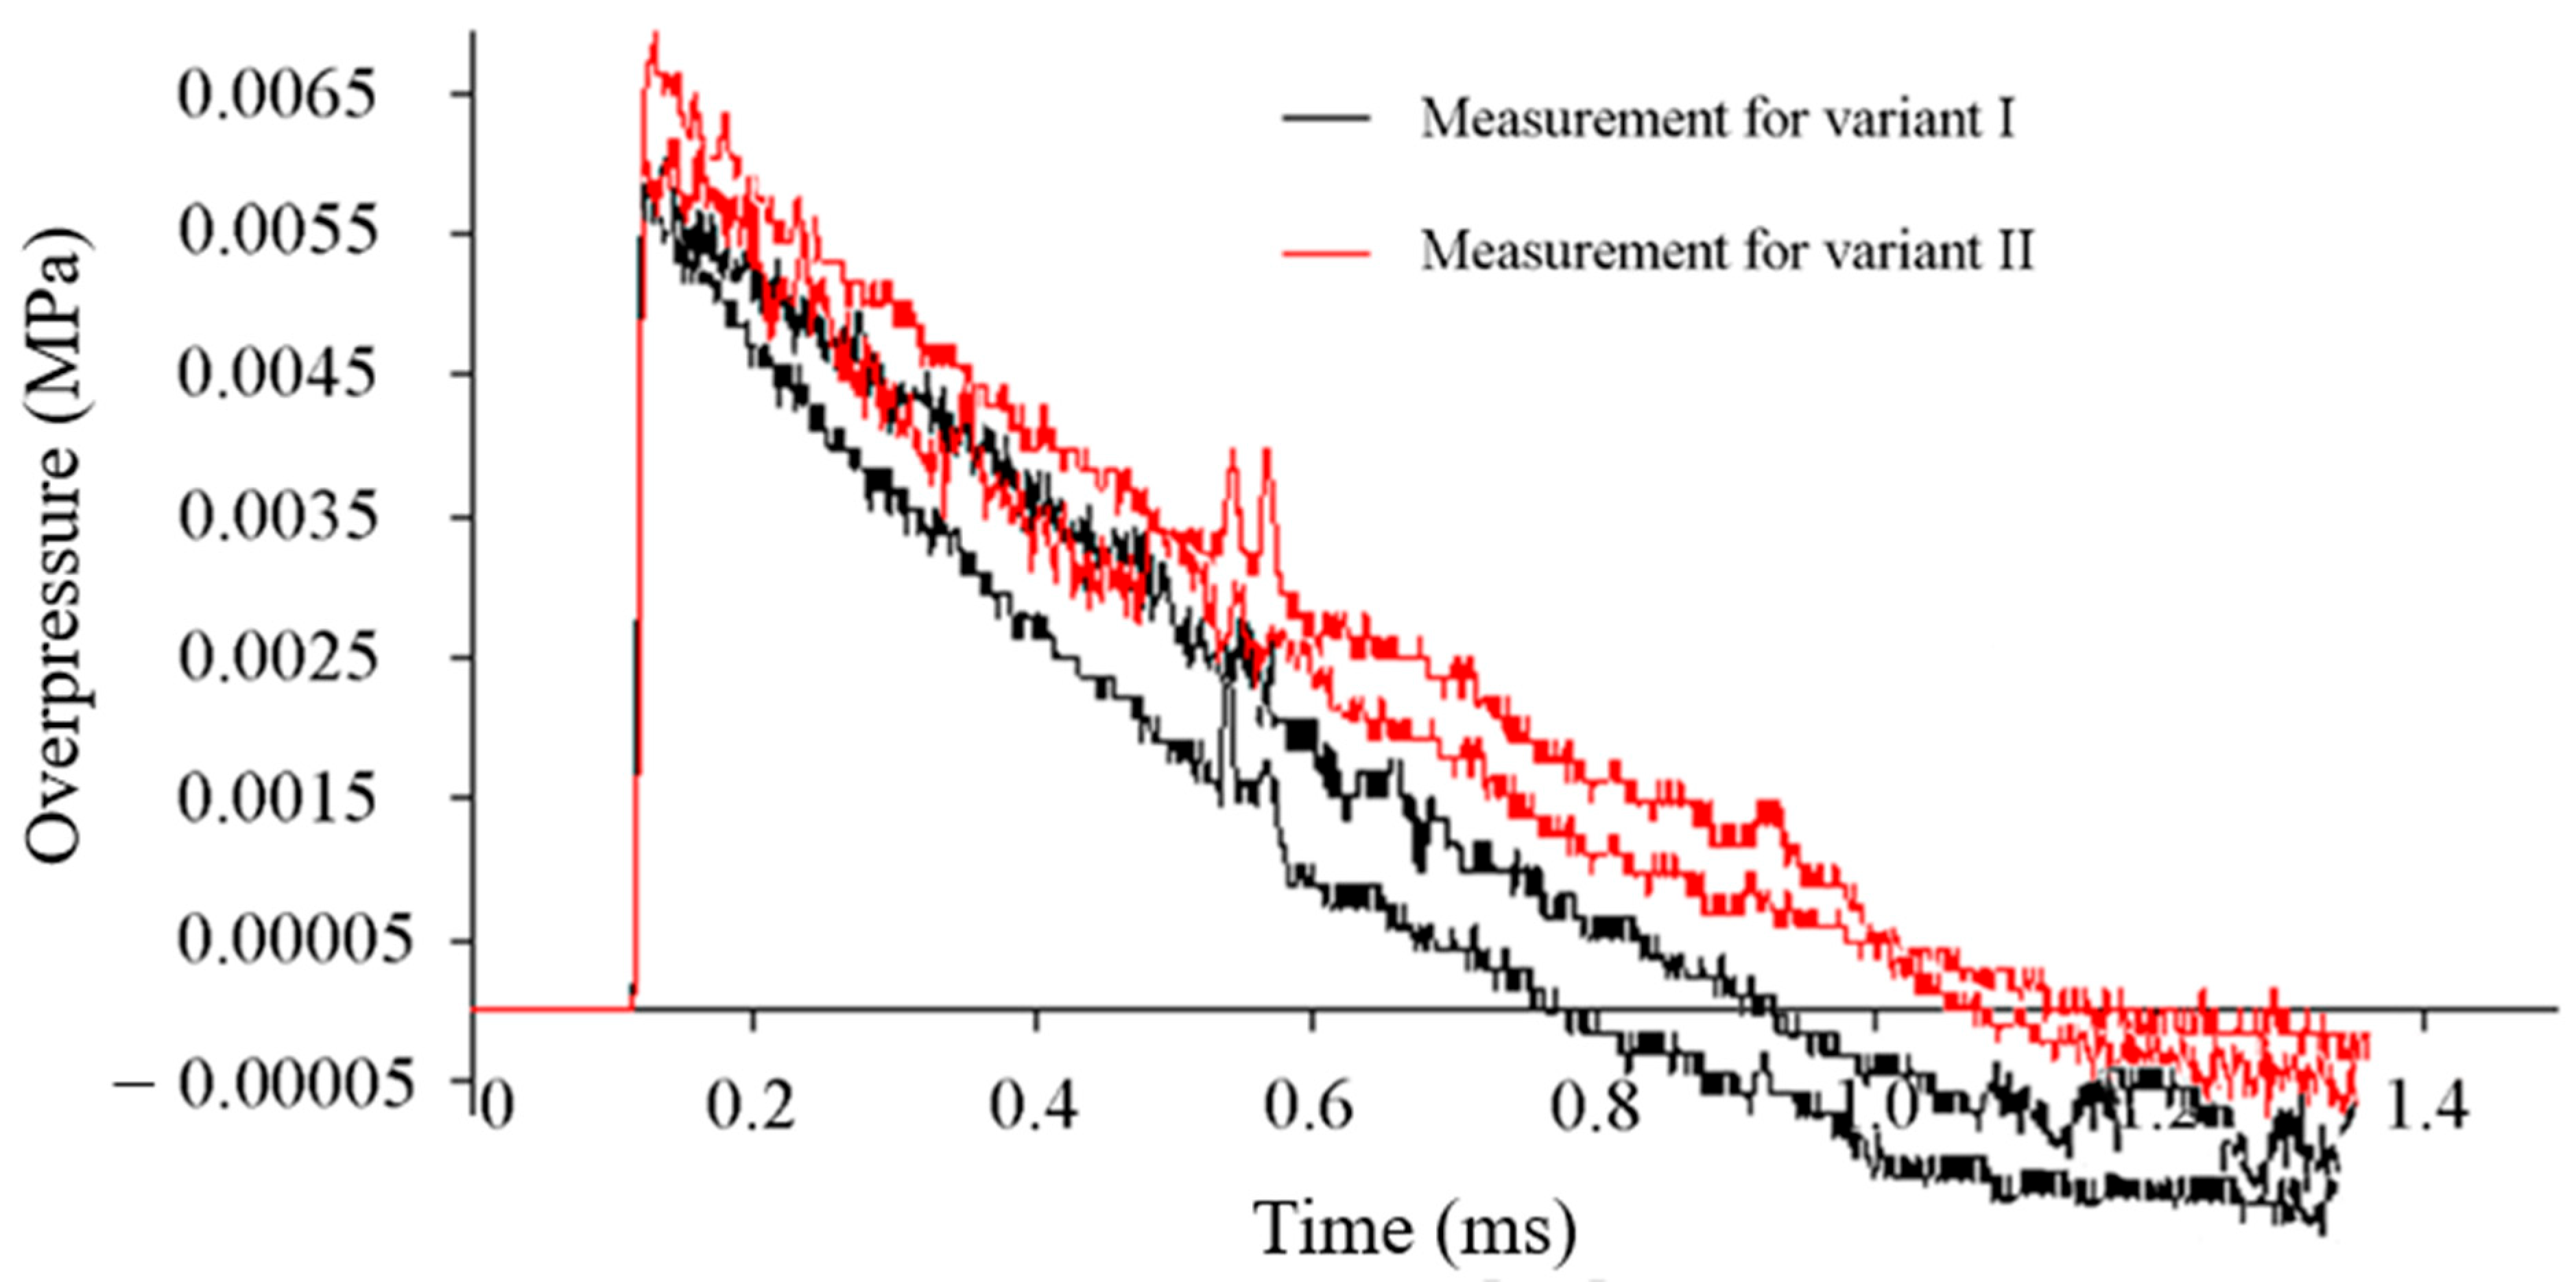
Figure 5a) had a significant impact on the destruction of the material. Based on the recorded overpressure curves of the free blast phenomenon wave (
Figure 9), it is noted that, in the case of direct contact of the analyzed EN C45 steel sample, the pressure decreases significantly after approximately 0.4 ms, which proves that part of the pressure was used up the work that was needed to destroy the sample (black course). For the sample that was characterized only by barreling (red color course), the pressure waveform values are higher.
Additionally, from the estimated values of the waveforms of the generated blast phenomenon wave, it is noted that the recorded characteristics are regular values without any significant jumps in the further course of the recorded parameters of this wave, which proves that the assumptions made for the ground are correct. Therefore, the ground turned out to be hard, so a stably hard substrate was assumed in further numerical analysis [
64].
4.2. Tomographic Analysis Results
Reconstruction tests were performed on one of the fragments of the sample from series I. The reconstruction was performed using the technical method of computed tomography (CT), which allows for the creation of a three-dimensional model of the distribution of discontinuities [
65]. The reconstruction was performed using a CT system equipped with a focused microbeam X-ray tube with a tungsten target, a maximum acceleration voltage of 225 kV, and a minimum focal spot of 7 µm. A flat 16-bit detector with a 1024 × 1024 pixel matrix and a single pixel size of 400 µm was used. The X-ray tube generates a conical beam with a beam angle of 15.5°, and the distance from the radiation source to the detector is 1501 mm. The reconstruction was performed with a voxel size (resolution) of 35 µm. The parameters used in the examination of sample I are presented below (
Table 5).
Due to the high density of the reconstructed sample, BHC [
65] measurement artifacts related to the Beam Hardening Effect were corrected after the reconstruction. As a result of the reconstruction, high-quality cross sections of the examined object were obtained, saved in gray scale (
Figure 10).
Further analysis was performed using VG Studio MAX 2.0 Volume Graphics GmbH software [
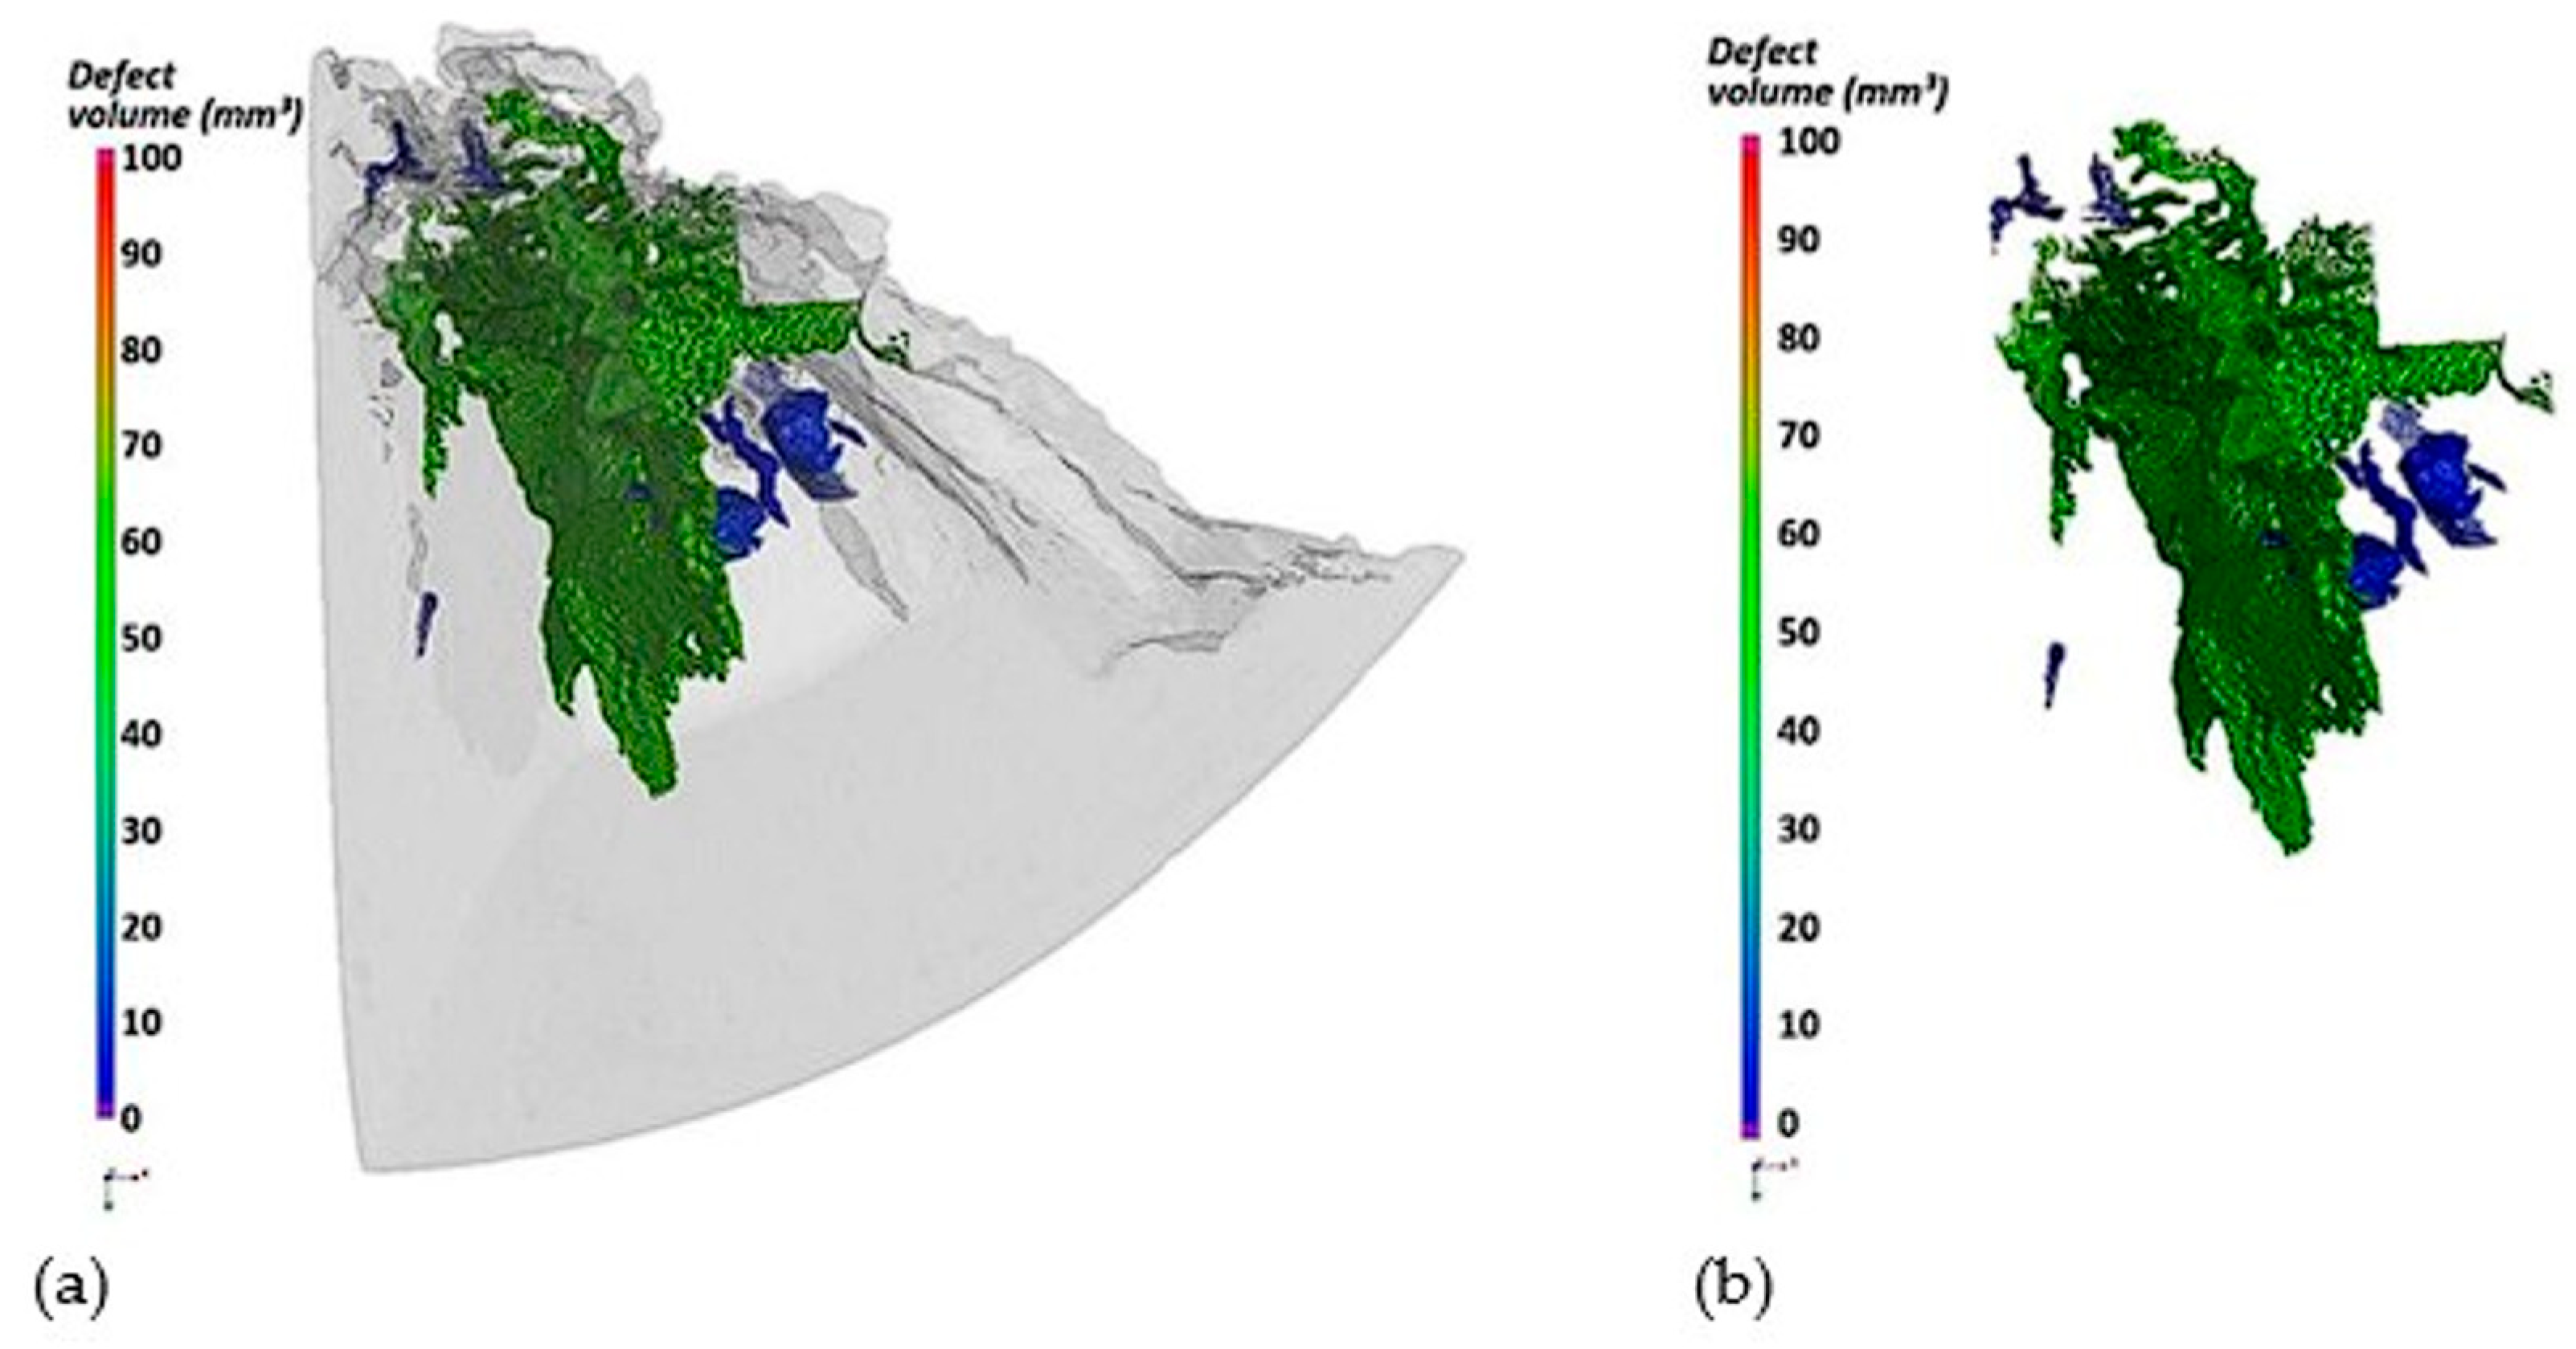
67]. In order to obtain the three-dimensional geometry of the analyzed fragment, the grayscale data were thresholded, separating the grayscale recorded for the background from the grayscale for the material. The thresholding result in the form of a reconstructed volume is shown in
Figure 11a. In order to determine the geometry of the cracks, a defect analysis was performed, allowing for the determination of the volume of discontinuities inside the reconstructed fragment (
Figure 11b and
Figure 12a,b).
Most of the discontinuity inside the sample is occupied by one extensive crack with a volume of approximately 60 mm3. In addition, several smaller cracks with volumes below 10 mm3 were recorded. The registered cracks spread from the axis of the cylinder and are concentrated in one fragment of the sample.
4.3. Microscopical Observations
After the blast resistance test, the samples were also subjected to microstructure analysis using light microscopy using a Nikon Eclipse MA200 microscope (Tokyo, Japan) and scanning microscopy using a Hitachi TM3000 microscope (Tokyo, Japan). The preliminary microscopic examinations confirmed the occurrence of microstructure changes in various areas of the samples. In order to accurately interpret the failure mechanisms of the samples, microstructure analysis was performed in the most significant areas. For this purpose, the areas subjected to detailed analysis are marked with symbols: A, B, and C (
Figure 13).
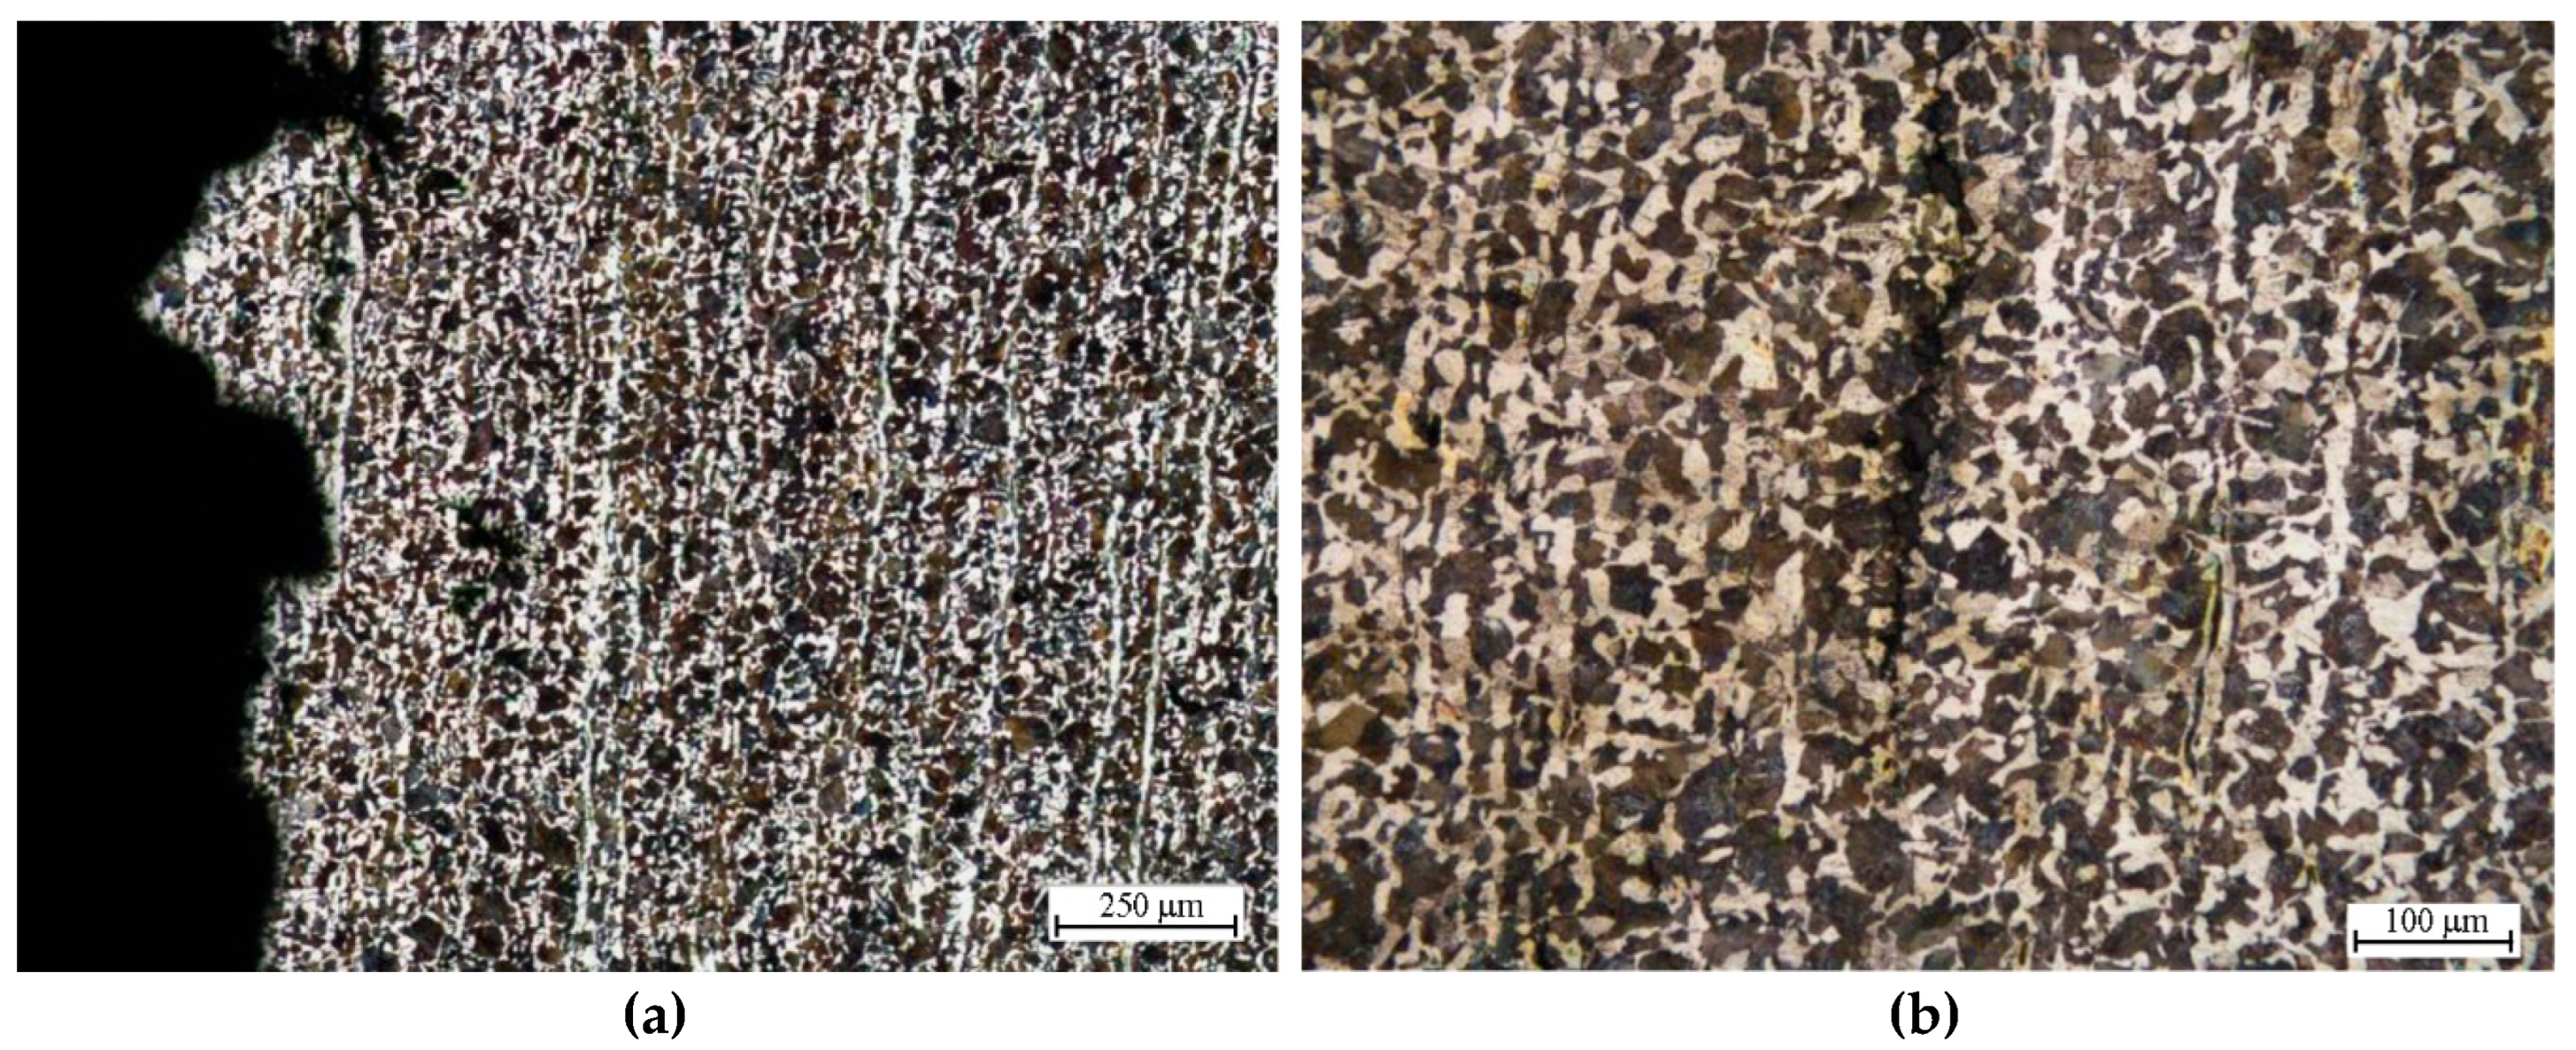
Detailed microscopic examinations also confirmed significant structural changes in the areas of dynamic impact. In the area marked with the symbol A, immediately near the surface of the sample adjacent to the high-energy charge (series I) or closest to the charge (series II), cracks are initiated, causing delamination and fragmentation of the samples. The cracks propagate in a direction parallel to the sample axis parallel to the orientation of the ferrite and pearlite bands (
Figure 14). The strongest concentration of cracks occurs in the axis of the samples and its vicinity.
In both series I and series II samples, extensive delamination of a similar brittle fracture nature is observed in this area. From the axis towards the outer surface of the samples, the number of cracks and delamination and their sizes decrease. In this area, observations confirm the occurrence of plastic shear with clear microstructure deformation (
Figure 15). In the shear plane, local crushing of the material occurs, which manifests itself in grain deformation.
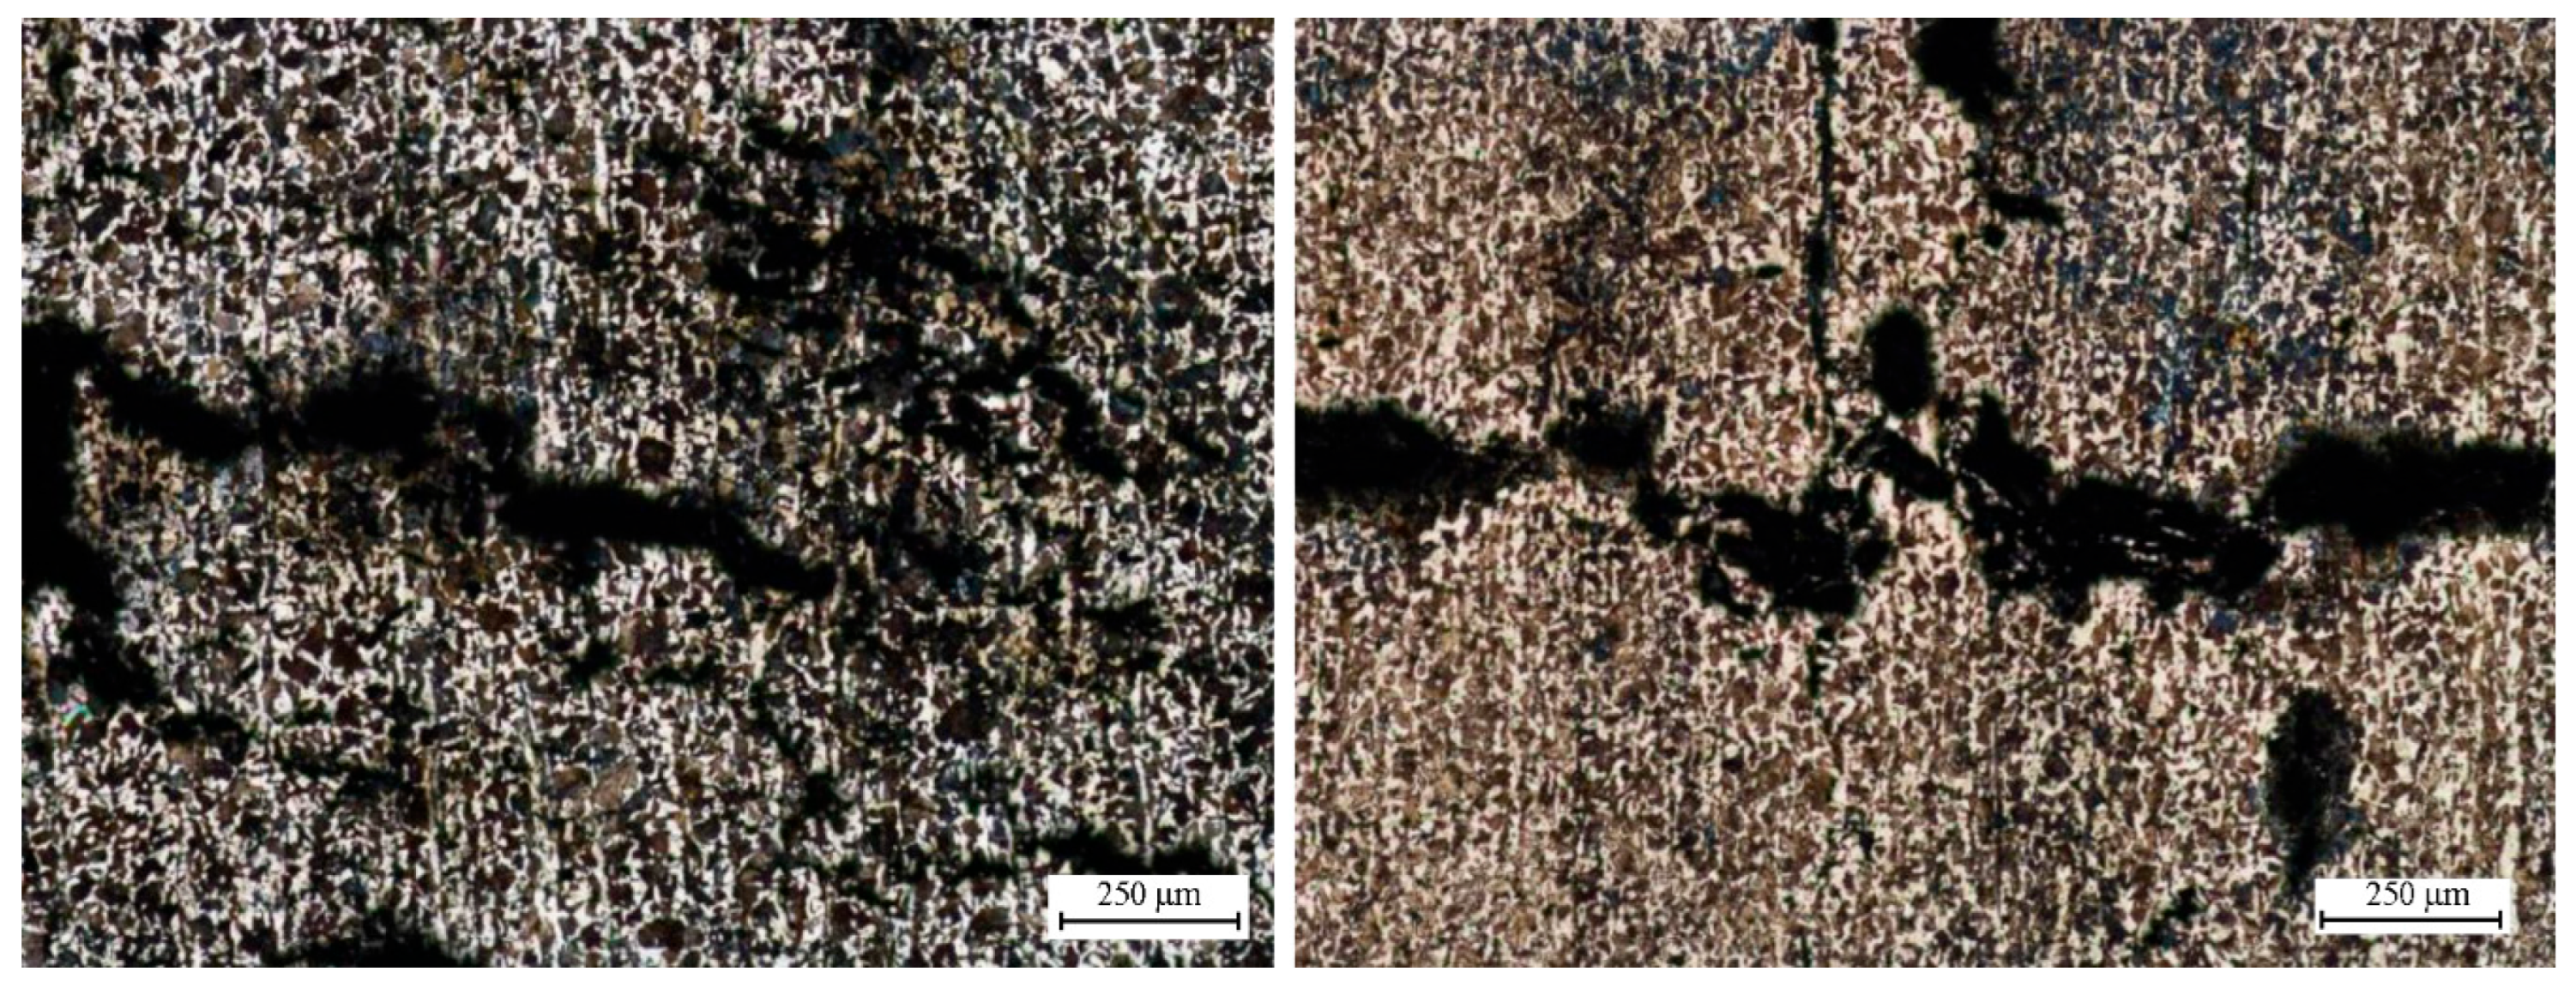
In area B, which falls near the center of the longitudinal section of the samples, in samples I, the propagating cracks have a direction consistent with the band-like arrangement of the structure (
Figure 16).
Cracks in this area are brittle in nature and do not show visible plastic deformation of the structure in the immediate vicinity of the cracks. The propagation of cracks in this area occurs repeatedly in a stepped manner (
Figure 17a), leading to the effect of cracks merging near their leading edges (
Figure 17b). During consolidation, the grains undergo slight deformation and cracking at the phase boundary, as well as intercrystalline cracking and fragmentation.
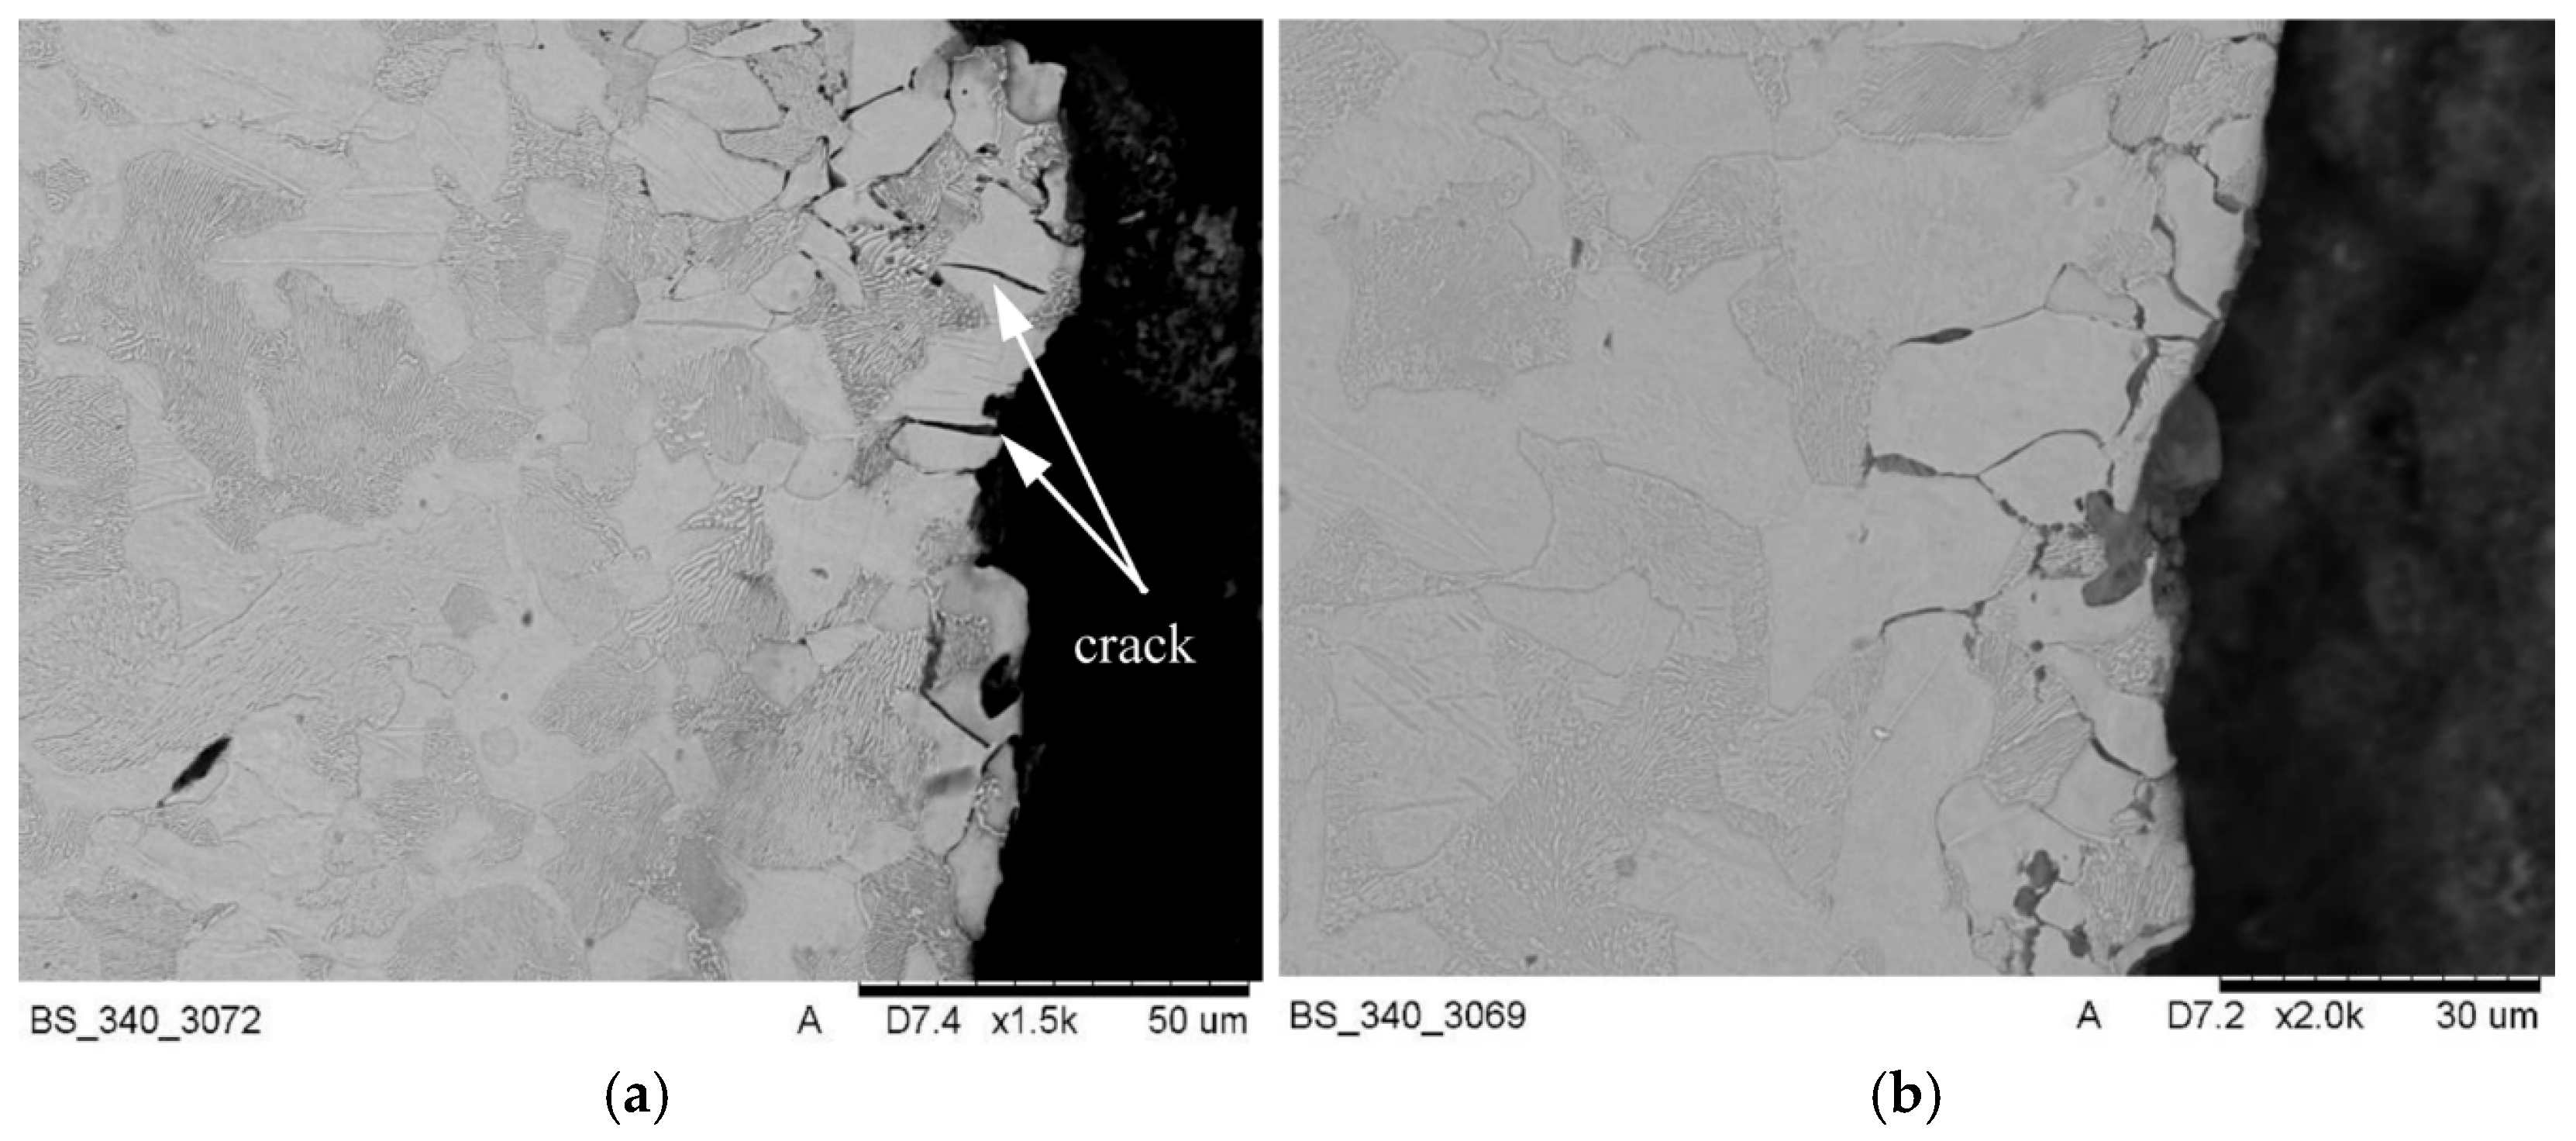
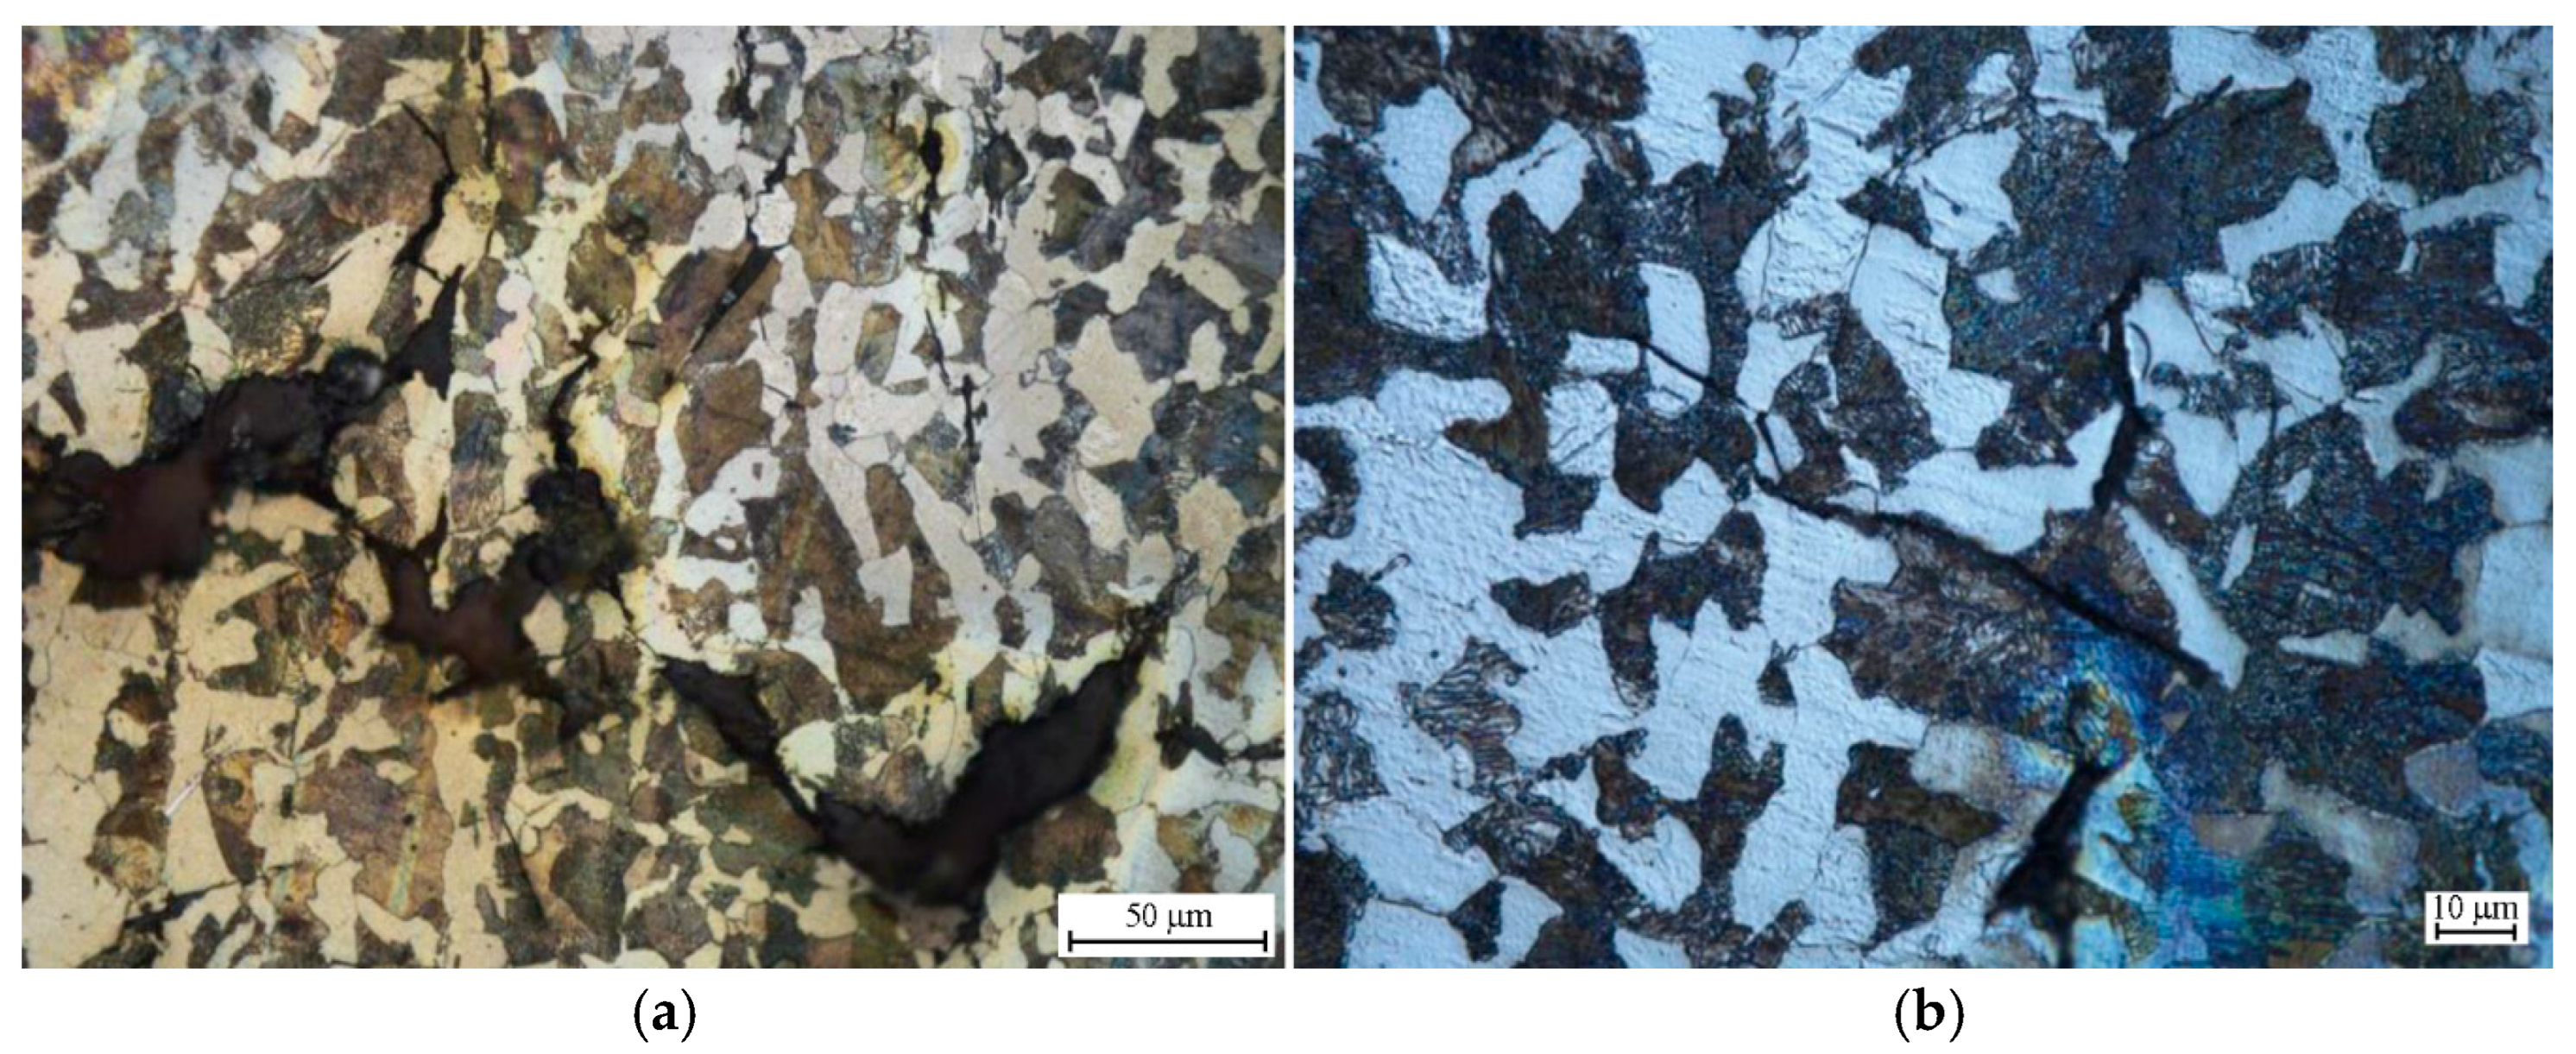
Microscopic analysis of the scrap edge confirms the intergranular mechanism of longitudinal crack formation. The microstructure of the grains at the edge indicates that the crack is formed as a result of shearing in a plane parallel to the sample axis. The main longitudinal cracks propagate through the grains, and the nature of the cracks is usually brittle. Brittle, fractured grains, mainly in the α phase, are visible at the edges of the cracks, with fragments breaking off under the influence of shear forces (
Figure 18a). In the immediate vicinity of the edges, grain delamination occurs deep into the material, caused by intergranular microcracks (
Figure 18b).
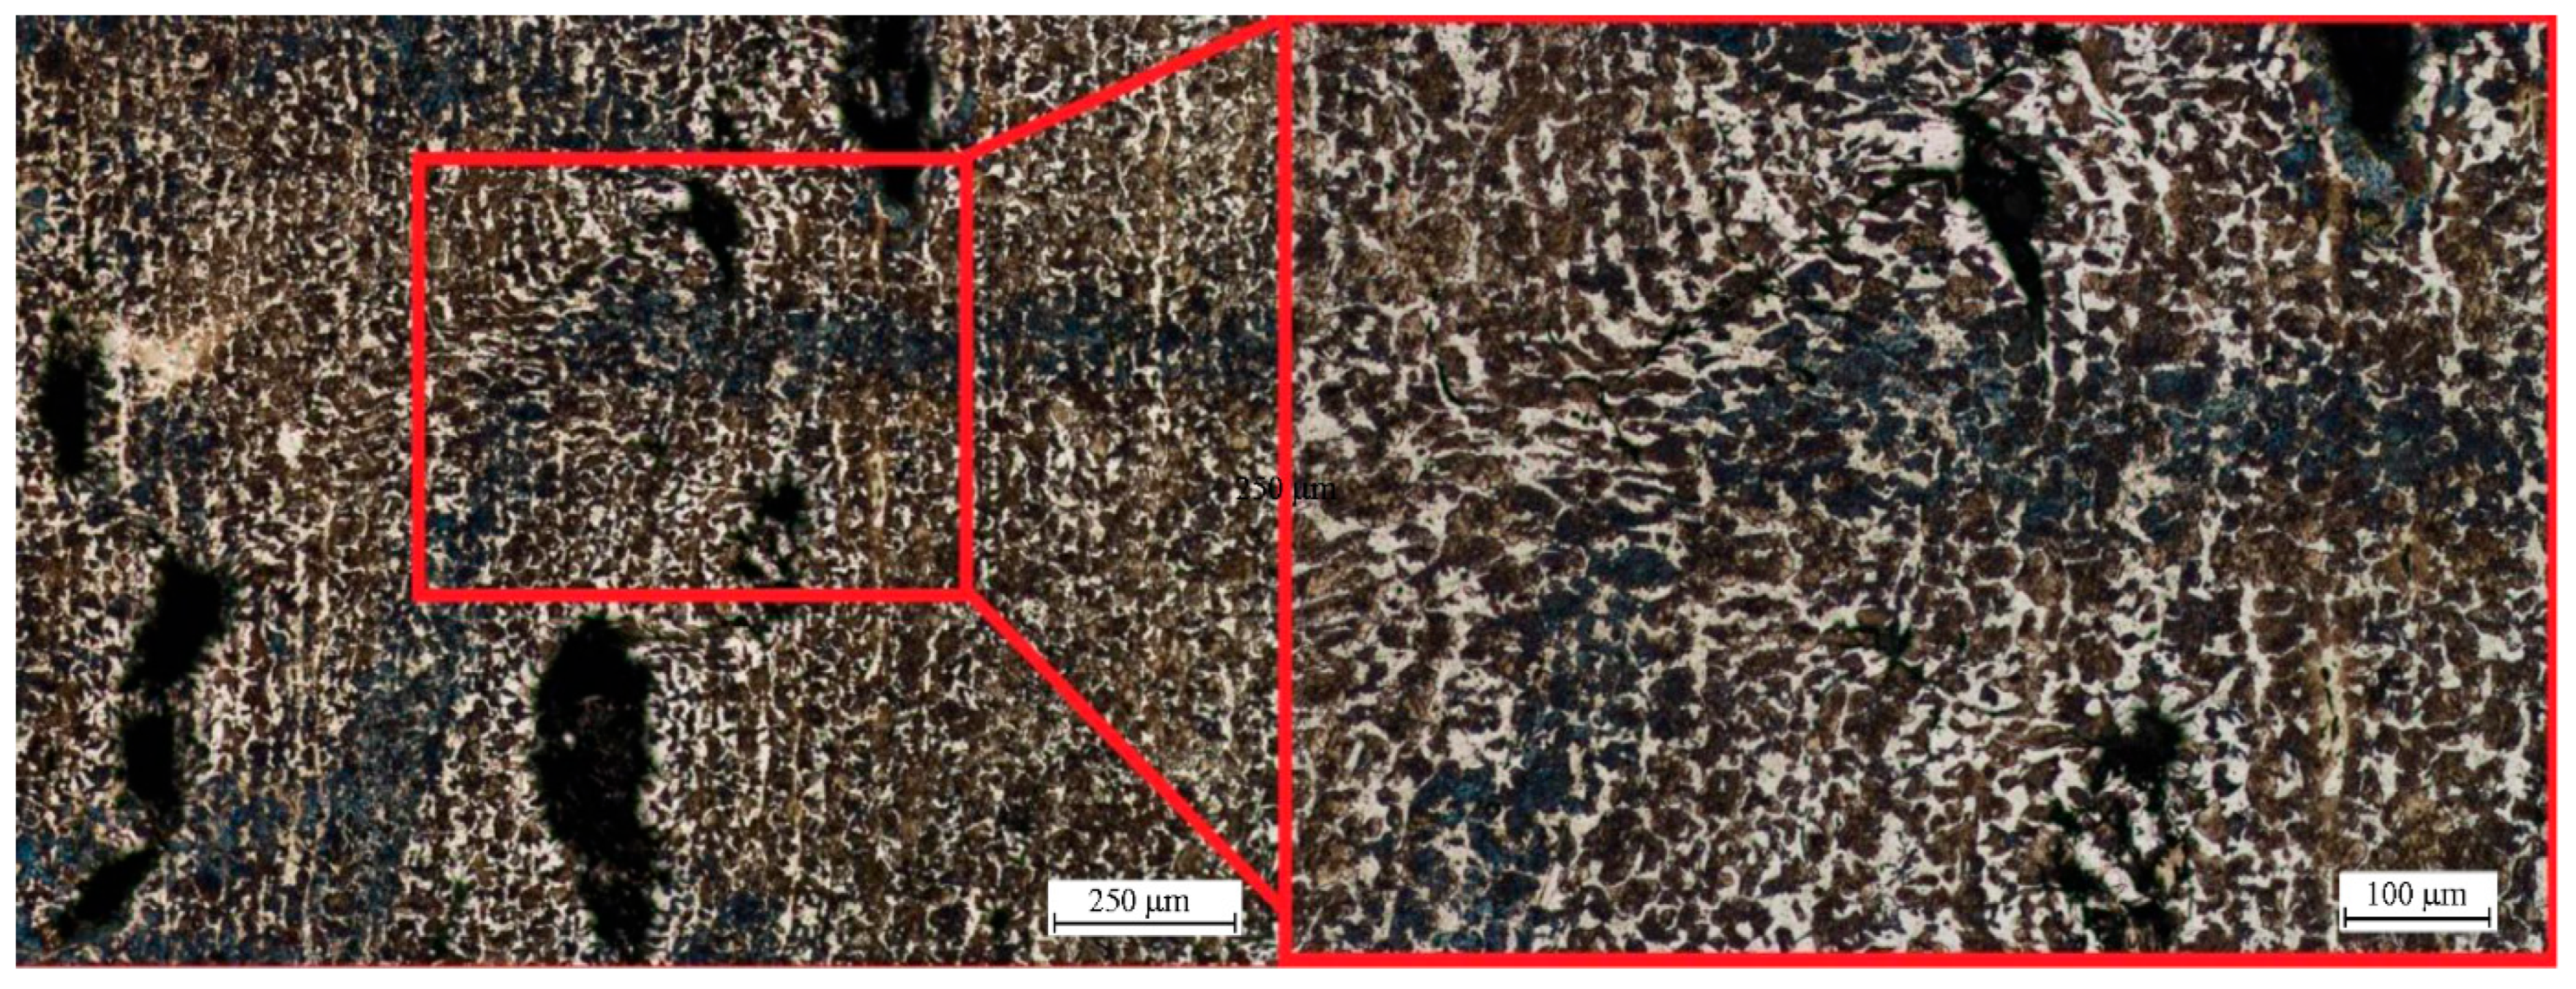
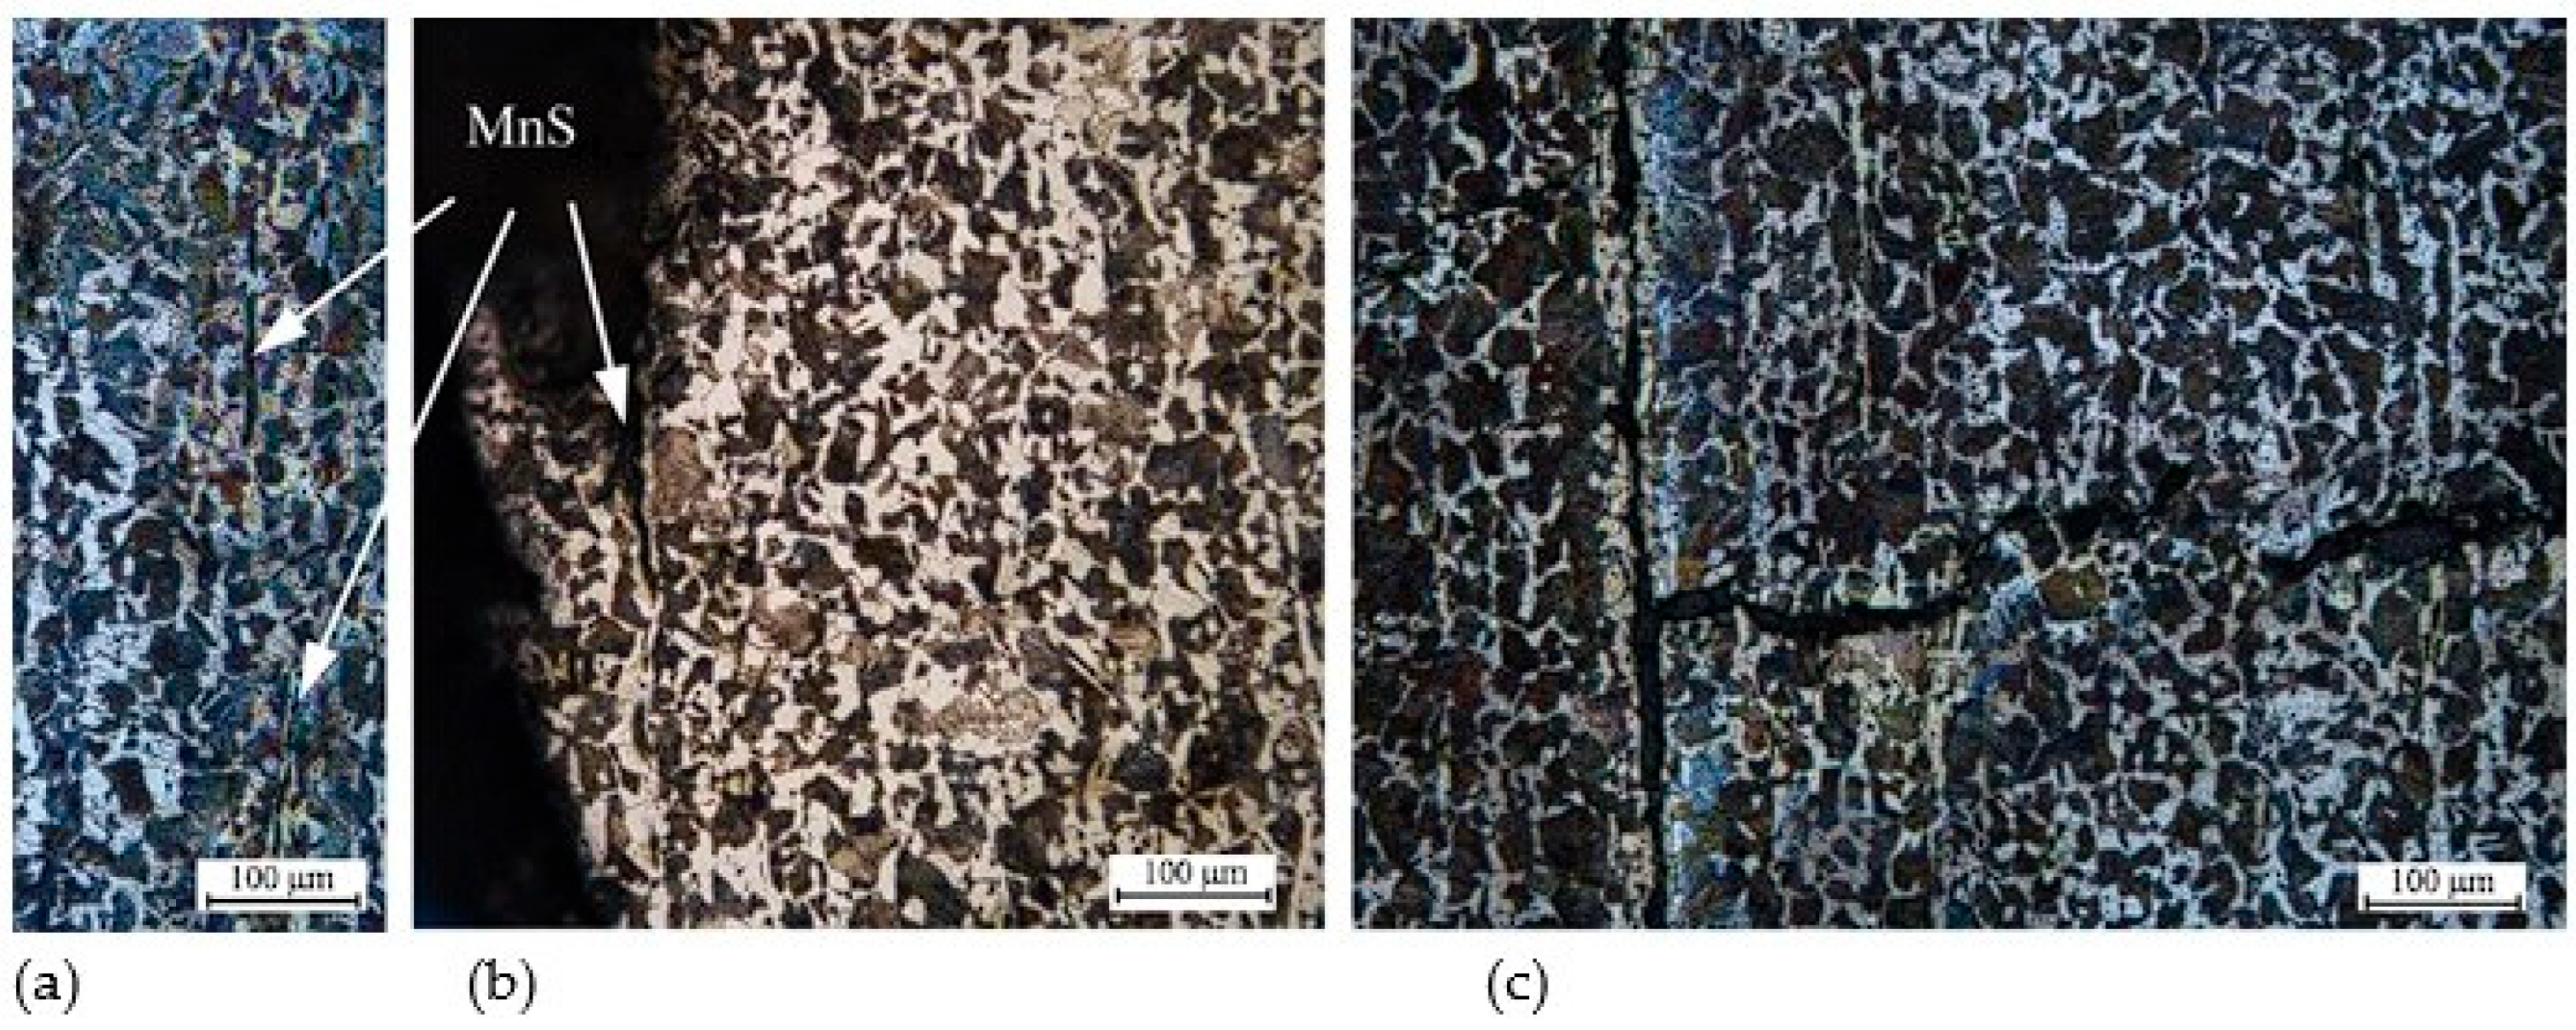
Observations of the locations of longitudinal cracks confirmed that the preferred place for their initiation and subsequent propagation are the precipitates of manganese sulfides (MnS) occurring in the ferrite bands (
Figure 19).
The chemical composition of the precipitates was confirmed by EDS analysis, the results of which are shown below (
Figure 20).
EDS spectra (
Figure 20) confirm the presence of Mn and S in localized inclusions, indicating the formation of MnS precipitates. These inclusions act as stress concentration points and have been identified as the main crack initiation points in the tested samples. Quantitative analysis revealed locally increased concentrations of Mn (~1.5% wt.) and S (~0.25% wt.) that exceed the average mass composition. Such enrichment in MnS inclusions confirms their role as preferential crack initiation sites. This finding correlates with numerical predictions, in which the highest values of plastic deformation were concentrated near the same areas. The agreement between the EDS observations and the simulation results further confirms the validity of the proposed modeling approach.
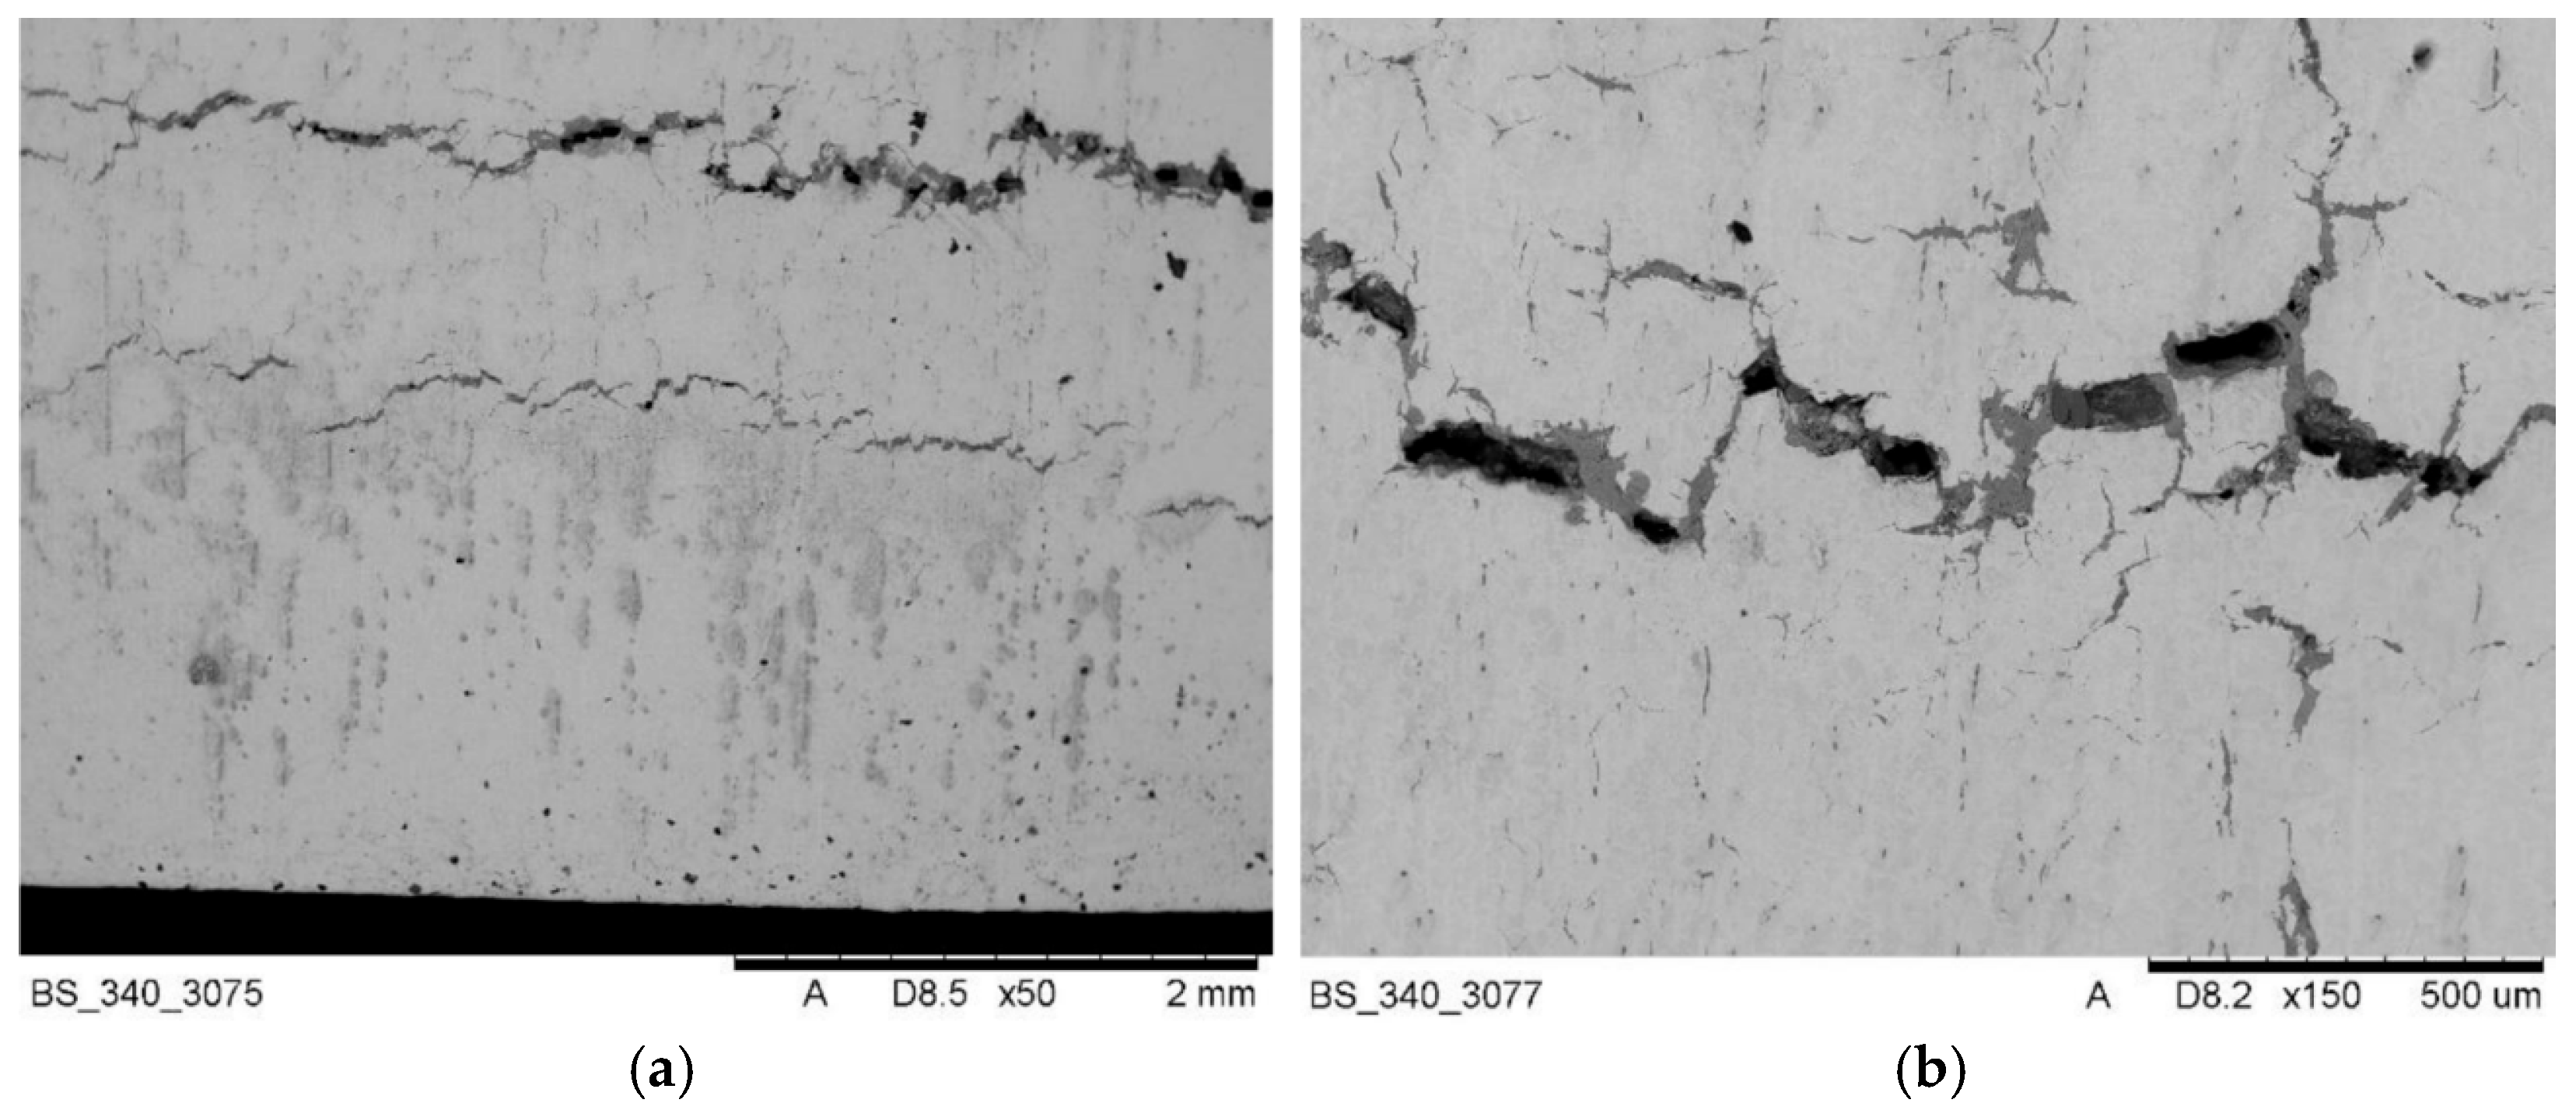
In area C, at a distance of 1.5 mm to 6 mm from the outer front surface, transverse cracks occur as a result of the blast phenomenon. The cracks propagate in a stepped manner from the axis of the samples towards the outer edges of the cylindrical samples (
Figure 21). In the case of series I samples, the effect of detachment of the “bottom” was observed along the plane formed by transverse cracks. In series II samples, however, this effect did not occur in the immediate vicinity of the axis—observations confirmed strong delaminations with numerous additional microcracks running unevenly in the vicinity of transverse cracks.
Investigations of the microstructure of the edges and the material within the cracks in area C confirm that the dominant mechanism in this area is brittle cracking propagating transcrystalline through both the main cracks and microcracks observed in large numbers in the vicinity of the main cracks (
Figure 22). Due to numerous microcracks in this area, strong delaminations occur in the structure of the material.
The propagation of transverse cracks tends to create a fracture with a stepped topography along privileged planes (
Figure 23a). The network of microcracks formed within the transverse cracks shows a predominant tendency to propagate transcrystalline, but less numerous microcracks propagating along the grain boundaries are also visible (
Figure 23b).
In summary, microscopic analyses confirmed the heterogeneous fracture mechanisms depending on the loading zone. In zone A, brittle longitudinal cracks and delaminations initiated along ferrite–pearlite bands were predominant. In zone B, cracks developed from MnS inclusions, consistent with previous findings [
68], identifying non-metallic inclusions as local stress concentrators. In zone C, numerous transverse and stepwise cracks were observed, which, as reported in [
69,
70], increase fracture surface area and contribute to additional energy absorption. Similar delamination and splitting phenomena were also reported in X80 pipeline steels [
71], where multiple delaminations significantly influenced the scatter of impact energy values. In our case, the observed stepwise and delamination cracks can be interpreted as energy-dissipating mechanisms that limit catastrophic fragmentation and correlate with the lower blast intensity recorded for series II.
4.4. Results of Numerical Simulation
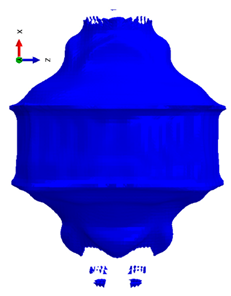
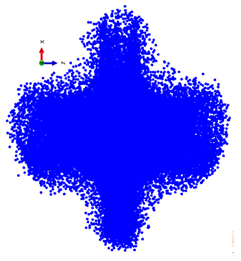
The formation of the high energy using various computational methods is presented below (
Table 6). Individual figures were presented to the appropriate time steps.
Table 7 summarizes the velocities (in mm/s) obtained for individual numerical methods, which clearly illustrates the differences resulting from the modeling method used. For the SPH method, a difference of 29% was observed compared with the classic FEM approach.
Below (
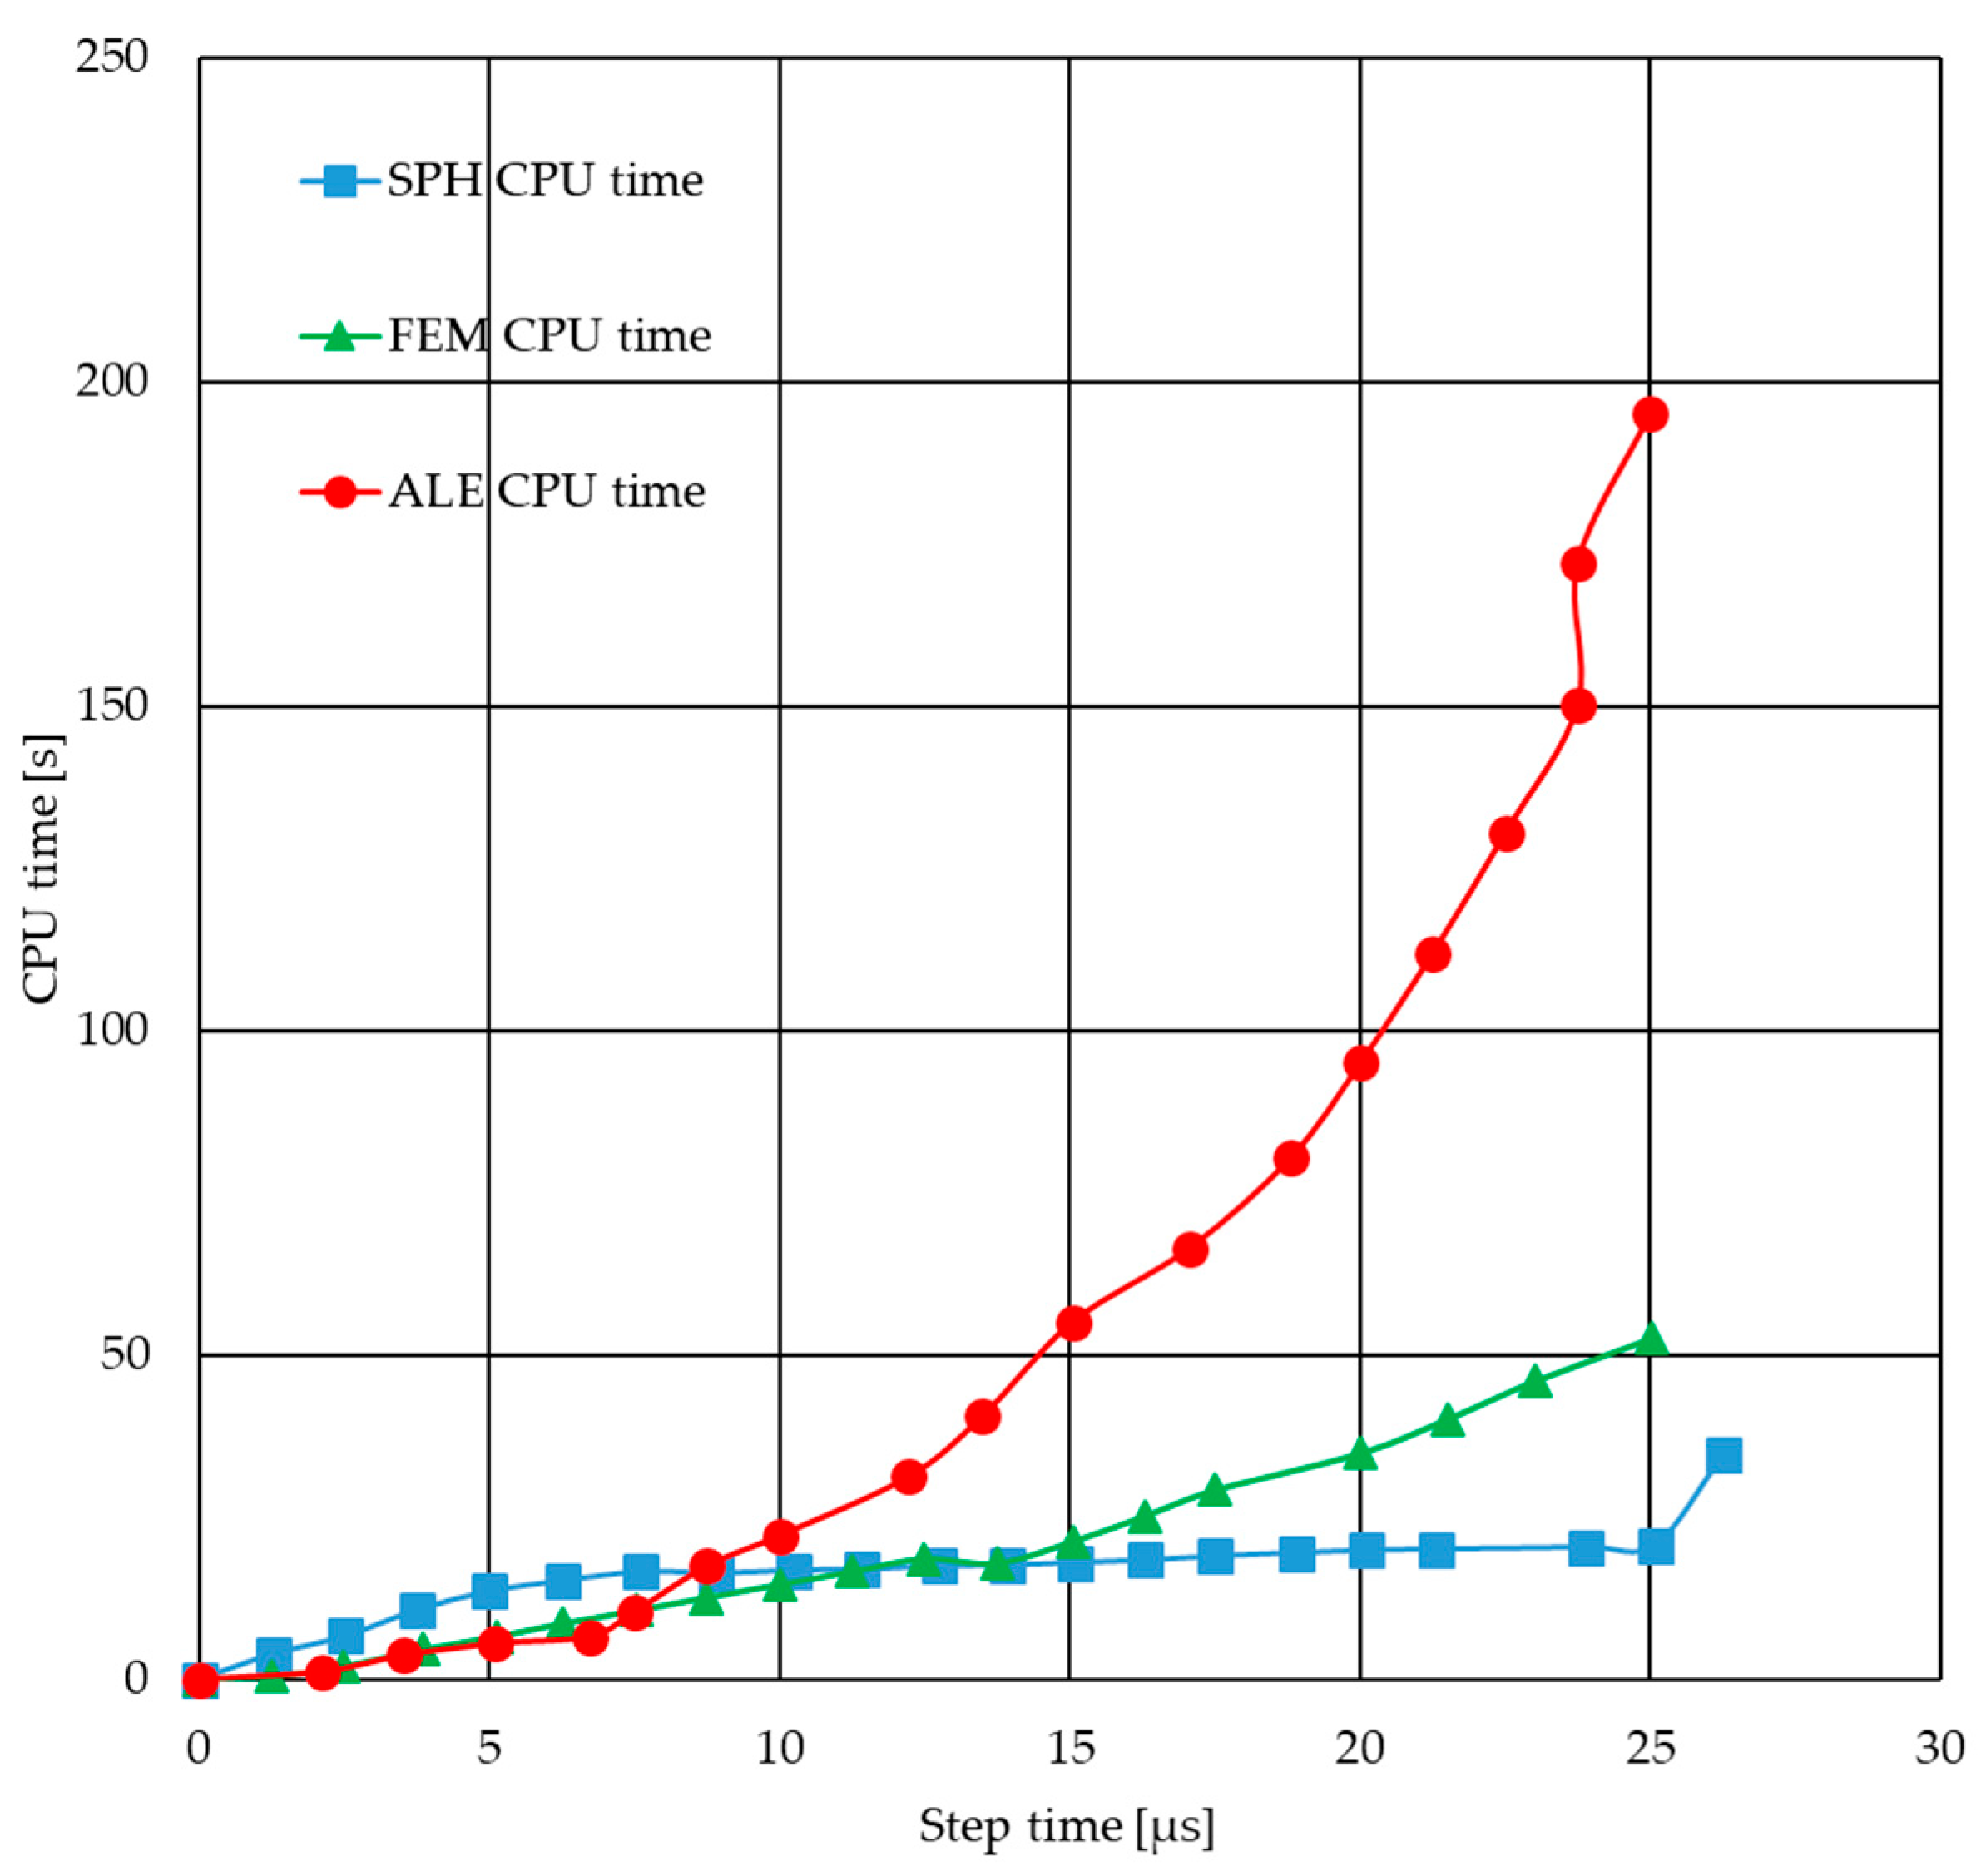
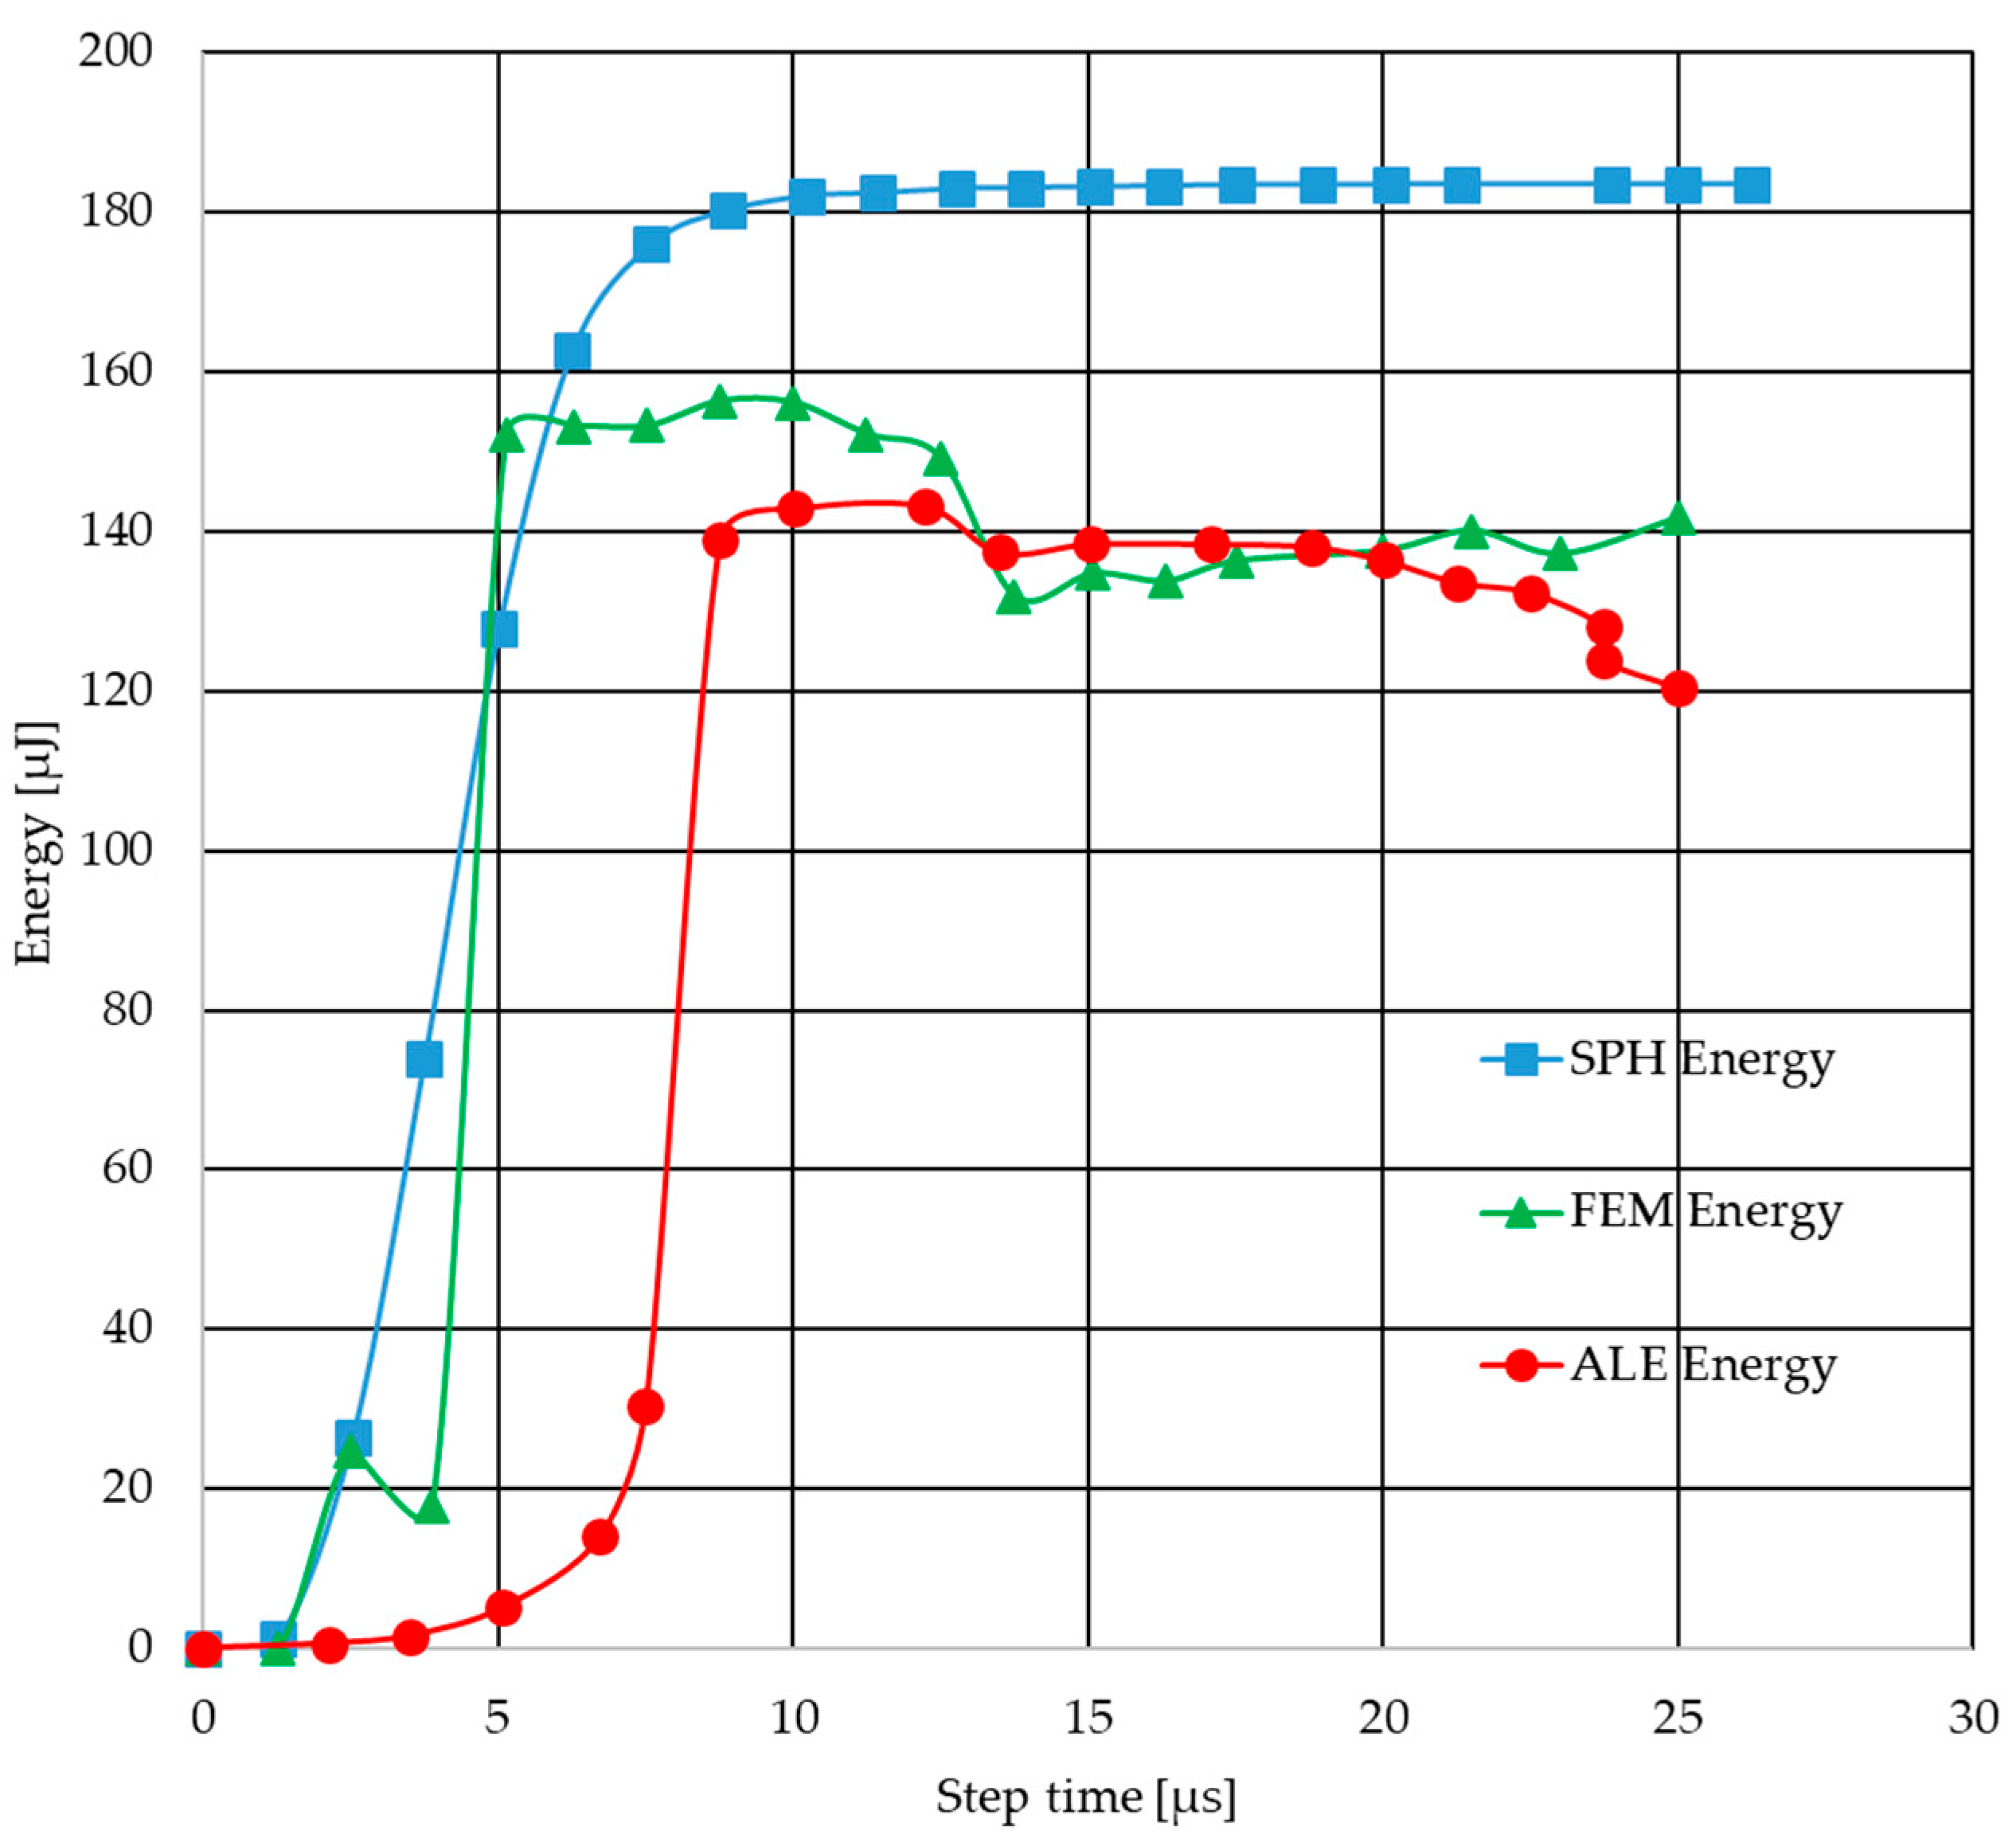
Figure 24) are the results of a comparison of numerical simulations performed using different methods, where the basic evaluation criterion was computation time. All calculations were performed under identical conditions—on the same computing machine and using a single thread—which ensures the comparability of the results. In addition, the kinetic energy curve was analyzed, which allows for the assessment of numerical stability and physical correctness of the methods. The results obtained enable the simultaneous assessment of the computational efficiency and physical accuracy of the tested algorithms, which is important when selecting the optimal simulation technique.
The figures show a comparison of the results of modeling a cylindrical TNT explosion using three calculation methods: SPH, FEM, and ALE. The energy analysis (
Figure 24) shows that the SPH method predicts the highest energy values, stabilizing at around 180 µJ. In the case of FEM, lower values (approx. 130–140 µJ) were obtained with slight fluctuations, while the ALE method showed the lowest energy level (approx. 120 µJ) with a downward trend. In turn, a comparison of CPU time (
Figure 25) shows that the SPH method has the lowest computational costs (approx. 40 s), FEM requires more effort (approx. 60 s), and ALE is by far the most time-consuming method, reaching nearly 200 s. These results confirm significant differences in both computational efficiency and energy prediction between the analyzed methods.
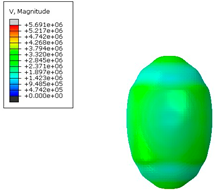
Visible differences are observed in the simulation of the blast phenomenon only above the second time step. In the case of FEM simulation, large deformations of the elements are visible. The finite element method (FEM) does not work well in modeling an energy release rate due to the large deformations of the mesh—the displacements of individual nodes of a given element reach over 100%. The possibility of using “delete element” above a value of 1 eliminates this effect, but unfortunately, it does not ensure continuity and stability of mechanical energy in the system by deleting perceived elements. In the case of blast phenomenon, intense deformations lead to significant displacements (Tx,y,z) and rotations (αx,y,z) of individual mesh elements, which causes degeneration of the elements and loss of calculation accuracy. These distortion problems limit the effectiveness of FEM in accurately reproducing the dynamic and extreme phenomena associated with the blast phenomenon.
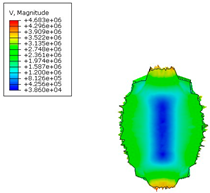
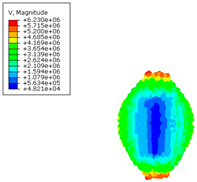
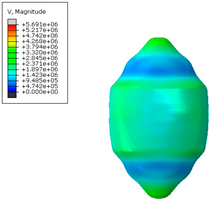
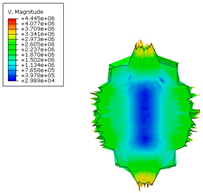
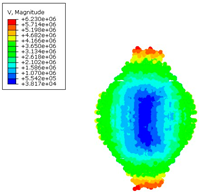
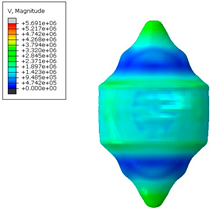
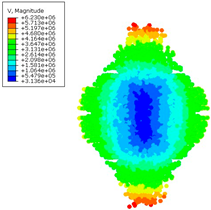
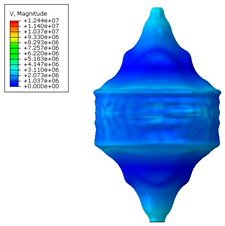
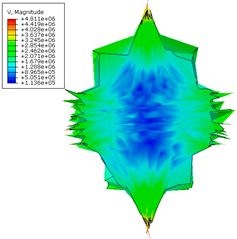
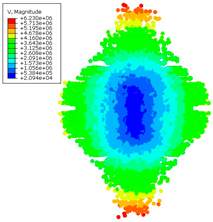
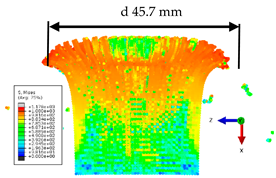
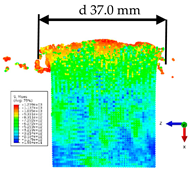
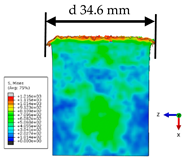
As a reference point, three variants of hybrid modeling were performed: (1) Euler high energy, FEM sample; (2) FEM high energy, SPH sample; and (3) SPH high energy, FEM sample. The results for individual combinations of hybrid methods for modeling the high-energy-sample system are presented below (
Table 8).
The best fit of the deformation of the deformed steel cylinder element was observed for the Euler/FEM modeling method. SPH modeling of a high energy reflects very well the mechanics of the blast phenomenon itself, while contact with the element is point-like due to the nature of the SPH particles.
The smooth particle hydrodynamics (SPH) method is more suitable for modeling the blast phenomenon mechanics of high-energy materials because it precisely reproduces the phenomena of shock waves and blast dynamics. However, in the case of contact with materials, this method is less effective due to the point nature of SPH particles—contact of a single SPH particle and FEM, which leads to difficulties in accurately mapping the interactions at the boundary of given materials. This limitation significantly affects the precision of results in models where reproduction of contact phenomena is crucial.
The Euler method is an effective tool for modeling the mechanics of energetic materials during blast due to its ability to accurately reproduce the shock wave phenomena, energy propagation, and blast dynamics. One of the main advantages of this method is its effectiveness in modeling material contact, because the Eulerian mesh allows for accurate mapping of interactions, while this method requires more effort in the initial phase and precise definition of the scope of the phenomenon by imposing an external discretization area. In this way, the Euler method provides very accurate results in models where the correct representation of contact and adhesion phenomena between materials is crucial.
4.5. Correlation of Numerical and Experimental Observations
The Euler/FEM approach provided the best agreement with experiments, as it ensured stable pressure wave propagation and accurate energy balance. The SPH–FEM interaction was defined using a standard penalized contact algorithm, enabling realistic force transfer between SPH particles and FEM elements. The Johnson–Cook parameters had a strong influence on the fracture patterns: brittle fractures formed near the axis under high triaxial stresses, while shear deformation zones formed at larger radii due to softening and accumulated plastic deformation. Numerical distributions of strain and damage correlated well with CT and metallographic observations. Crack initiation in MnS inclusions, brittle fractures near the axis, and shear deformation away from the axis were consistently reproduced in both experiments and simulations. This confirms the ability of the hybrid FEM/SPH/CEL approach to capture not only global deformations but also microstructural fracture mechanisms.
5. Conclusions
By analyzing the distribution of cracks in the samples for two cases of high-energy material distance, it is possible to determine the impact of detonation on the structure of the material. Metallographic tests showed how the structure degraded, while X-ray tomography showed a map of the distribution of cracks in the material and allowed us to estimate their volume.
The introduction of a scaled Z distance also allows current results to be compared with previous explosion studies, providing a consistent parameter for correlating experimental observations and numerical predictions under different loading conditions.
The following conclusions can be drawn from the structure tests carried out in samples made of ferritic–pearlitic steel:
Both series of samples showed a similar damage mechanism caused by the dynamic impact of the high-energy material. In series I, the direct load led to immediate breakage, while in series II, the samples remained intact but showed numerous internal cracks and deformations. Microscopic observations confirmed that these damages would ultimately lead to complete breakage under higher impulse loads, which is consistent with the behavior observed in series I.
The destruction of the samples varied depending on the region. Near the front surface, the direct load caused severe fragmentation concentrated in the central part. Cracks propagated mainly along planes parallel to the sample axis due to the banded structure of ferrite and pearlite, while shear deformation led to plastic deformation of the grains and brittle intergranular fracture. Numerous cracks were associated with MnS inclusions and ferrite bands, showing gradual propagation and grain delamination. At higher impulse loads (series I), these mechanisms led to complete fragmentation along the identified planes.
Numerical simulations showed clear differences between the methods. The standard FEM method performed worst due to severe mesh distortion under dynamic loading. The Euler/FEM approach provided the best agreement with experiments, while the SPH method also showed good potential, provided that the element size and contact algorithms were carefully defined. The particle-based nature of the SPH method provided advantages in modeling load formation.
The introduction of limit deformation parameters as a criterion for destruction in the subroutine allows for a better fit of the numerical model results to actual samples, especially when using the FEM–SPH hybrid model.
The scientific novelty of this work lies in the development of a comprehensive methodology combining experimental observations (computed tomography and metallographic analysis) with advanced hybrid numerical modeling (FEM/SPH/CEL) to investigate the dynamic mechanisms of damage and fracture in structural steel under explosive loading. Unlike previous studies, which typically focused exclusively on either an experimental or numerical approach, this study combines both perspectives, enabling a direct correlation between the formation of microstructural cracks (e.g., in MnS inclusions) and predicted damage areas. This combined approach allows for a more accurate description and validation of dynamic fracture mechanisms in structural steels and can serve as a basis for future analyses of other metallic materials subjected to extreme dynamic loads.


