Article

Optimization Study on Key Parameters for Mechanical Excavation of Deep-Buried Large-Section Metro Station

1
School of Civil Engineering, Henan Polytechnic University, Jiaozuo 454003, China
2
Key Laboratory of Intelligent Construction and Safety Operation and Maintenance of Underground Engineering in Henan Province, Jiaozuo 454003, China
3
CCCC-SHB Fourth Engineering Co., Ltd., Luoyang 471013, China
*
Author to whom correspondence should be addressed.
Appl. Sci. 2025, 15(18), 10218; https://doi.org/10.3390/app151810218
Submission received: 16 August 2025 / Revised: 16 September 2025 / Accepted: 17 September 2025 / Published: 19 September 2025
(This article belongs to the Section Civil Engineering)

Abstract

When mechanically excavating deep-buried large-section metro stations, stringent deformation control requirements for the surrounding rock must be adhered to. Calculations indicate that horizontal convergence in certain areas of the station exceeds acceptable limits, necessitating adjustments to construction parameters to comply with these requirements. This study, based on a project for the Chongqing Metro Line 18, establishes a three-dimensional numerical analysis model for an underground excavation station by utilizing the characteristics of the stratum-structure model. A comprehensive 3D numerical simulation was conducted to evaluate the deformation characteristics of the stratum and surrounding rock resulting from excavation, and to determine optimal excavation parameters based on deformation control. The key findings are as follows: (1) Under the original excavation design parameters, the horizontal convergence displacement at the arch foot met specification requirements and was smaller than that at the sidewall. However, the horizontal convergence displacement at the sidewall exceeded the 20 mm limit specified by the relevant codes, failing to satisfy deformation control standards. (2) The deformation of the surrounding rock increased with factors such as the distance between the excavation face and the initial support, as well as the length of the excavation step. While the spacing between adjacent pilot tunnels had a relatively minor impact on overall station deformation, the number of pilot tunnels, in conjunction with other parameters, proved beneficial for controlling surrounding rock deformation. (3) Among the parameters examined, the distance between the excavation face and the initial support, along with the excavation step length, exerted the greatest influence on deformation. Based on deformation control criteria, the optimal excavation parameters were determined as follows: the distance between the excavation face and the initial support should not exceed 6 m; the excavation step length is set to 1.5 m; the number of pilot tunnels is established at 11; and the spacing between adjacent pilot tunnels is set at 10.5 m. (4) Field monitoring data closely corresponded with the effects observed from implementing the optimized parameters, thus validating the reliability of the optimization scheme. The results of this study provide a valuable reference for the excavation of metro stations under similar conditions in the future.

1. Introduction

With the implementation of China’s new round of the “Western Development” strategy and the “Transportation Powerhouse” initiative, the construction of transportation infrastructure in the southwest region has advanced rapidly, leading to an increased focus on urban infrastructure development in underground spaces. The construction of large-section tunnels in complex environments has become an essential component of many projects, albeit with significant engineering challenges. On one hand, the busy surface traffic and densely packed buildings make traditional blasting techniques likely to induce ground vibrations, collapses, and other safety incidents, thereby necessitating the adoption of non-blasting construction technologies [1,2]. On the other hand, the construction of large-section tunnels using underground excavation methods presents inherent technical challenges, such as the complex distribution of surrounding rock stress and the uneven loading of support structures. Ensuring the safe and efficient completion of tunnel construction is a critical issue that engineers must address.
At present, many scholars at home and abroad have achieved fruitful research results in the construction of metro stations. Some scholars believe that the cut-and-cover method and the cover-and-excavate method are the most widely used construction methods in metro station construction [3,4,5]. However, with the progression of urbanization and the increasing difficulty of ignoring the impact of the surrounding environment, underground excavation techniques for metro stations are expected to develop and be applied rapidly [6]. Wei Xu et al. [7], through analyzing various station structures in terms of evacuation convenience, construction safety, and cost rationality, explored the reasonable excavation methods for deep-buried stations in loess regions. Guojun Diao et al. [8], based on a cut-and-cover metro station in Chengdu, proposed a scientific method for determining the boundary between cut-and-cover and underground excavation methods and conducted an in-depth study on key construction parameters such as settlement control and initial support for underground excavation. Zhiren Dai et al. [9] investigated the issues related to the construction of shallow-buried metro stations in water-rich strata using the underground excavation method. They identified key processes such as the arrangement and excavation sequence of pilot tunnels, pre-reinforcement methods for strata, initial support types, combined steel pipe columns, and arched cover plates.
Some scholars believe that research on the construction of subway stations primarily focuses on the control of surrounding rock deformation. One of the most critical tasks in urban deep excavation is to control the deformation of surrounding rock and surface settlement caused by excavation, so as to avoid potential damage to adjacent facilities [10,11,12,13]. Liu et al. [14] studied the interaction between a newly constructed station on Beijing Metro Line 12 and the existing Metro Line 5. They analyzed the construction parameters affecting the internal forces of the existing tunnel, including the distance between the excavation face and the existing tunnel, the face area, and the number of excavation steps in the pilot tunnel. Liu et al. [15] proposed a simplified method for evaluating tunnel heave, which was compared with traditional modeling methods based on field measurements of longitudinal deformation in subway tunnels. The results showed little difference between the two approaches. Wang et al. [16], using a station on the Nanjing Metro as a case study, conducted inverse analysis with the finite element method to determine key parameters of the excavation model. The displacement distribution of the model matched well with field measurements. Li et al. [17] analyzed the settlement characteristics of corner buildings near Daliang Station in Foshan, China, and proposed that partition walls can significantly reduce the horizontal deformation of diaphragm walls and the settlement of corner buildings. Giardina et al. [18] evaluated the effectiveness of tunnel excavation models under varying levels of geological complexity in predicting surface displacement and building deformation during tunnel construction. Xu et al. [19], based on the foundation excavation of a subway station in Fuzhou, proposed a new method for assessing the reliability of support structure deformation, which was successfully applied for the reliability evaluation of support structures. Chen et al. [20] argued that surface settlement is one of the primary concerns in deep excavation design and construction. They proposed a new least-squares-based algorithm to convert scattered data of sidewall displacement into a continuous function and studied the displacement response of tunnel excavation. Morovatdar et al. [21] used finite element software to model the tunnel excavation process and calculated the settlement induced by excavation. Their post-processing results confirmed that the deployment of pipe roofing could reduce the settlement of the tunnel crown and the ground surface by 76% and 42%, respectively. Some scholars believe that in urban environments, predicting potential damage factors to existing structures induced by subway station excavation is critical. This should be followed by the optimization of support parameters and subsequent inverse analysis for verification [22,23,24]. Other scholars have proposed that for large-span subway stations in urban areas, it is essential to innovate excavation methods by developing new tunneling approaches compatible with local conditions and large-scale machinery. This is necessary to meet the complex demands of urban rail transit construction in challenging environments [25,26,27]. Yeow et al. [28] argued that temporary supports are not always essential during excavation. They conducted a 13 m unsupported excavation at the bottom of a 30 m deep foundation pit. Zeng et al. [29] proposed the use of buttressed retaining walls to limit wall movements and associated ground settlement caused by earthworks. They noted that the efficiency of deformation constraints decreases as the length of the buttress increases. Zhang et al. [30] proposed a hybrid simulation method to further analyze the impact of station foundation excavation on the surrounding environment, taking the Wuhan Metro Line 2 as an example. They also provided relevant control measures. Guo et al. [31], based on the underground space development of Shenzhen Metro’s Dayun Hub, addressed the technical challenges of ultra-deep foundation pit excavation and top-down construction with traffic cover. By adopting grouting reinforcement and top-down methods, they achieved effective deformation control of the existing station structure. Li et al. [32] proposed and applied the 0-theta method for the first time, addressing key technologies such as tunneling mode switching and tunnel process control in complex construction environments.
In summary, open-cut construction methods still account for a large proportion of subway station construction, while studies on the construction of mined subway stations primarily focus on shallow-buried stations. The construction methods most frequently employed on-site are the pile-beam-arch (PBA) method or the pipe-jacking method. Thus, research on the construction of deep-buried, large-section mined subway stations remains relatively limited, with more attention given to the optimization of support structures rather than excavation parameters. This is particularly true for large-span subway stations with significant burial depths, for which there are few relevant references available either domestically or internationally. In particular, studies on the optimization of mechanical excavation parameters for such stations are evidently insufficient. Although the enlarged footing bench method, as a highly adaptable mined construction technique, can effectively control surrounding rock deformation and surface settlement to a certain extent, its application in complex urban environments still faces many technical challenges, such as the rational design and optimization of excavation parameters. This paper aims to address the optimization of key technical parameters for mechanical excavation in large-section mined subway stations under complex urban conditions. Through numerical simulation analysis of various working conditions and the integration of advanced automated monitoring technologies in the field, we achieved an accurate analysis of the rock mass deformation process. We determined the safety of the structure based on whether the convergence values of the surrounding rock’s horizontal displacement exceeded the regulatory limits, ultimately identifying the optimal key construction parameters. This study holds significant reference value for the construction of deep-buried, large-section subway stations in the southwestern region of China.
2. Project Overview

2.1. Introduction to Metro Station

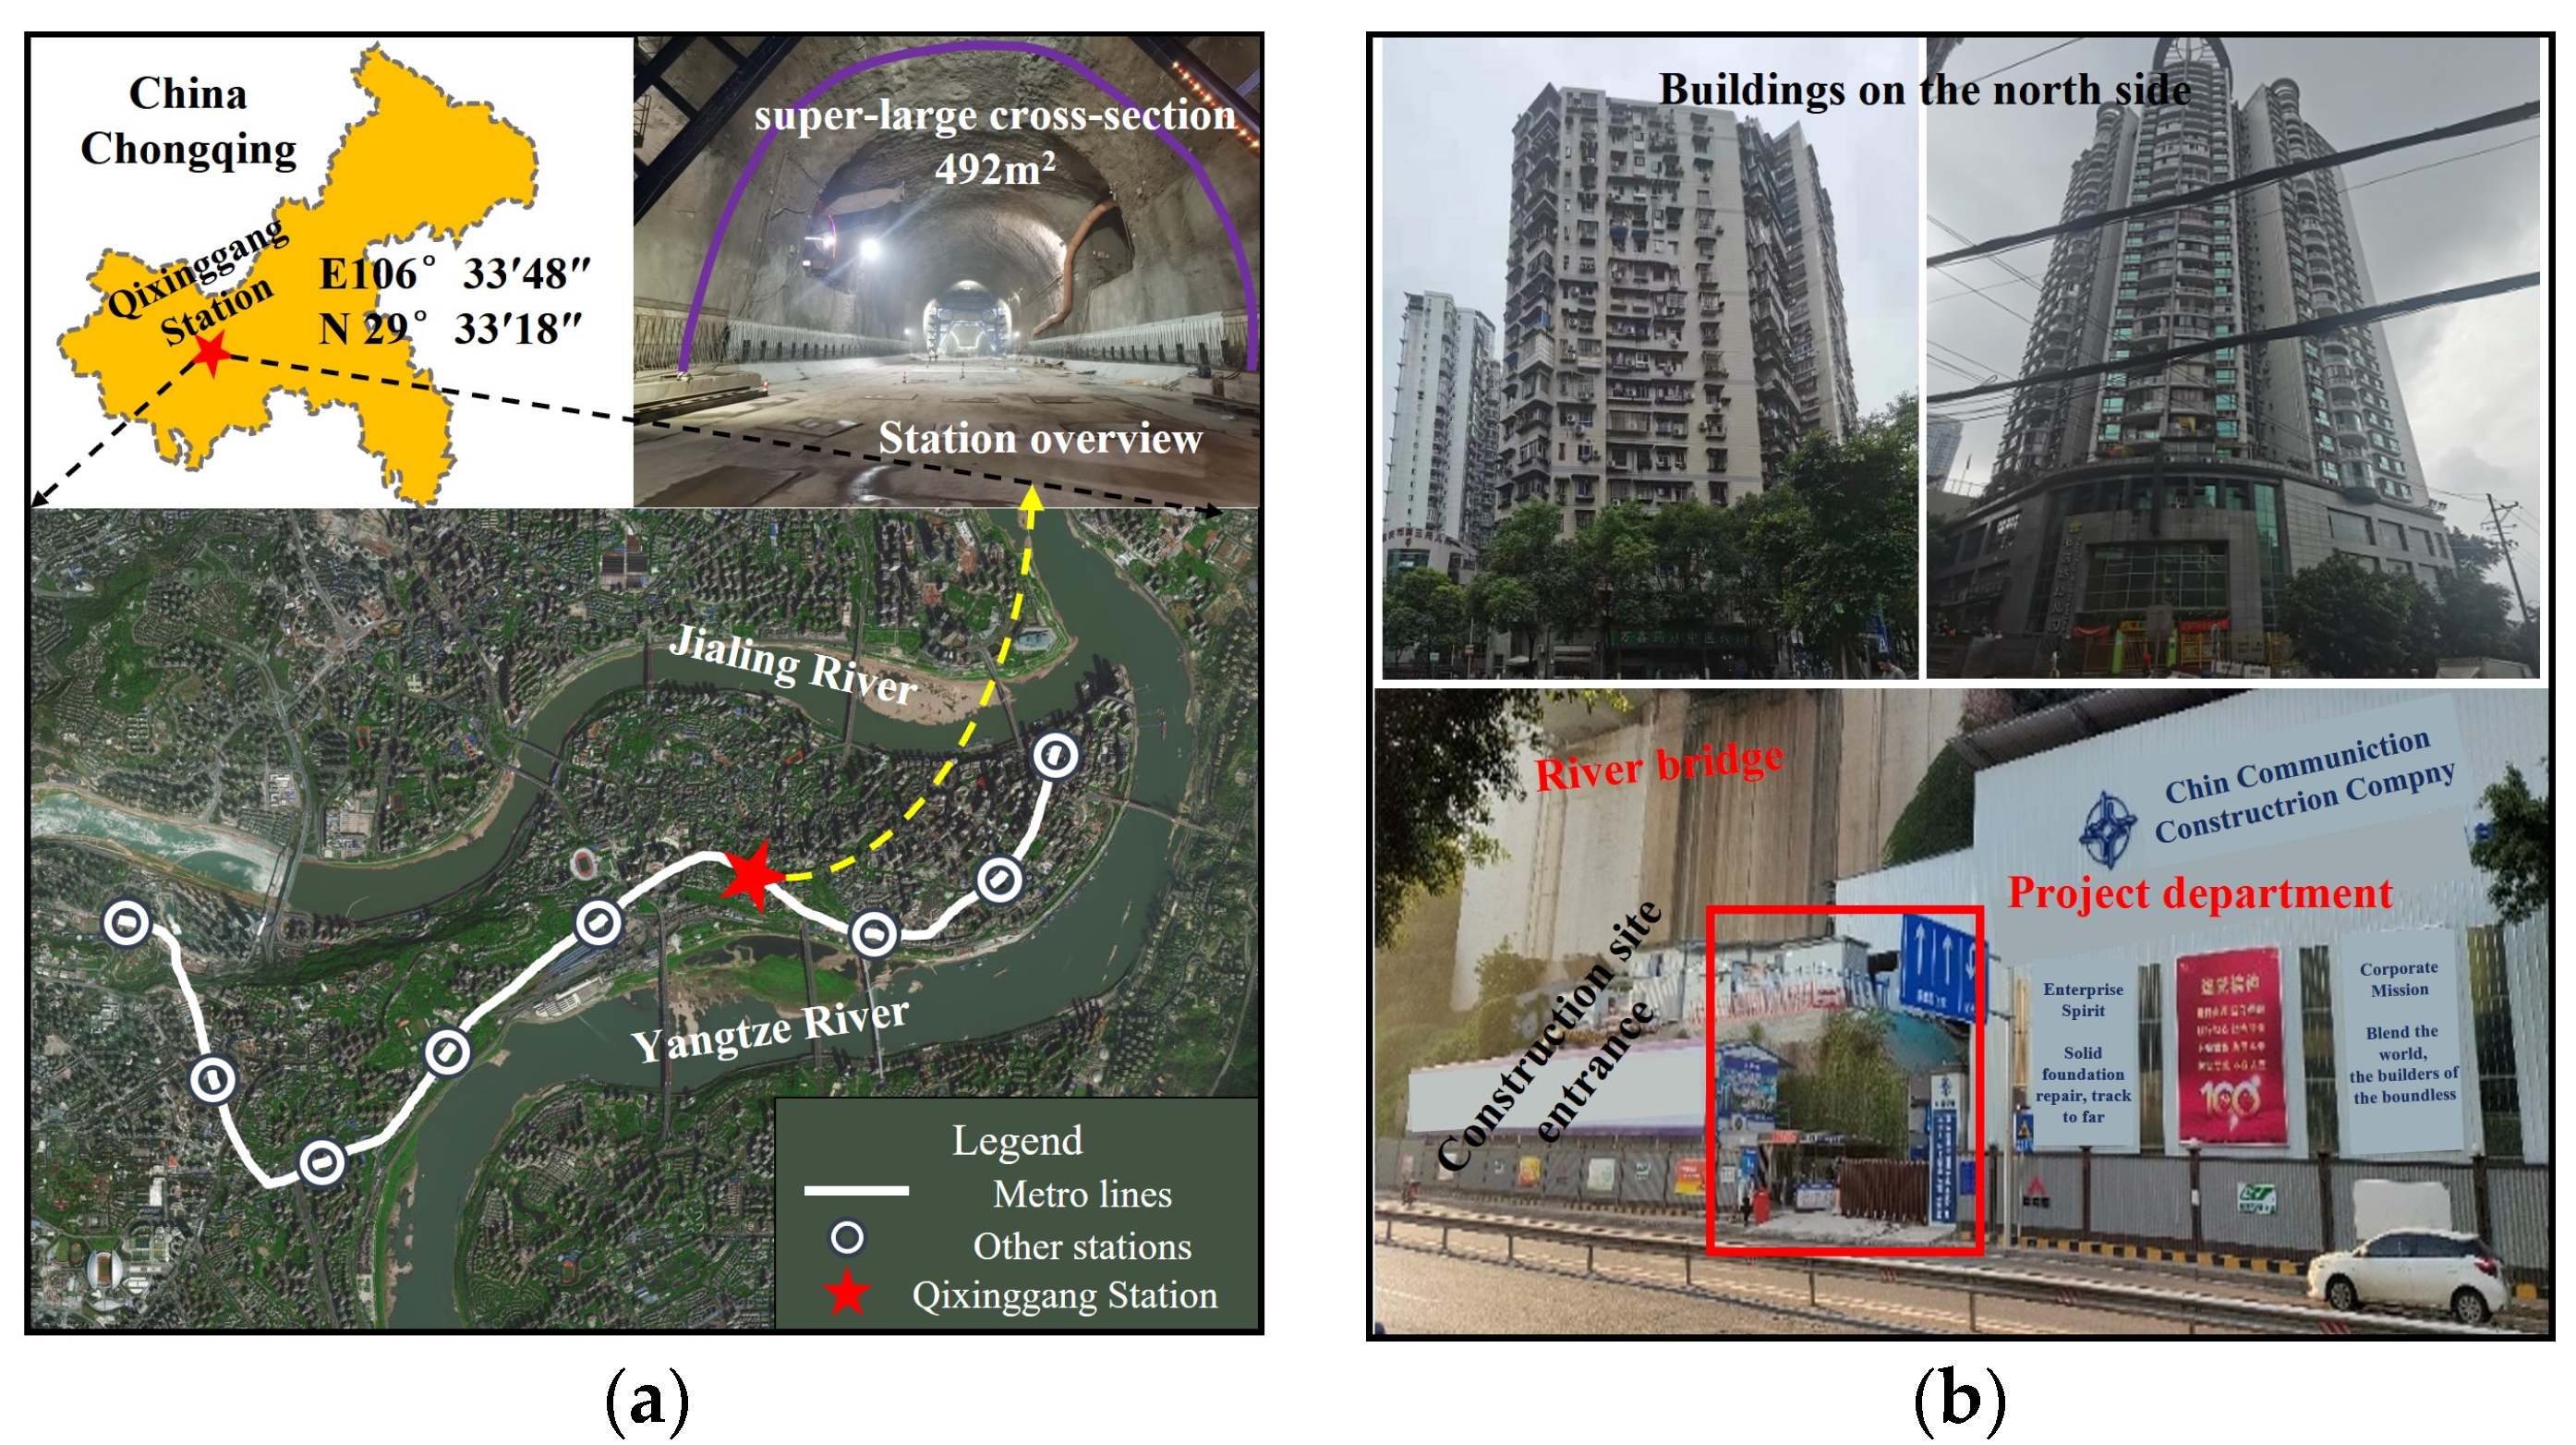
The Qixinggang Station of the Chongqing Metro Line 18 North Extension Project is located beneath Pipashan Street in the Yuzhong District. The station adopts a two-level underground structure and is oriented approximately in a northwest-southeast direction. The total length of the station is 223 m, with an excavation width of 25.9 m, an excavation height of 22.3 m, and a cross-sectional excavation area of 492.5 m2, classifying it as an ultra-large section underground excavation station. The eastern side of the station is currently a construction site for a plaza, the western side is adjacent to the Jingangta residential area, the southern side neighbors the project department of Metro Line 10, and the northern side is bordered by high-rise residential buildings. The tunnel crown is covered by a layer of overburden with a thickness ranging from approximately 54.4 m to 83.3 m, of which the rock overburden thickness is about 52.4 m to 80.3 m. The station is categorized as a deeply buried tunnel, with the surrounding rock classified as Grade IV. The construction method employed is the enlarged footing bench method. The general layout of the station is shown in Figure 1.

2.2. Engineering Geological and Hydrogeological Conditions

Qixinggang Station is situated in the southeastern Sichuan arcuate zone, where the macro-geomorphology exhibits deeply incised hilly landforms. The structural lines align with the ridge lines, extending in a north-northeast to south-southwest direction. Anticlines form strip-like low mountains, while synclines result in broad, gentle hills. The structural framework was formed during the late Yanshanian folding movement. The exposed strata along the alignment mainly include the Quaternary Holocene artificial fill (Q4ml), residual slope deposits (Q4el+dl), alluvial-pluvial deposits (Q4al+pl), and the Middle Jurassic Shaximiao Formation (J2s). The dip of the rock strata ranges from 89° to 120°∠5–10°, with a dominant dip of 120°∠10°. The surrounding rock of the station comprises interbedded sandstone and mudstone, with mudstone being the predominant lithology. The moderately weathered rock mass has poorly developed fractures, is relatively intact, and exhibits soft rock properties. Overall, structural fractures within the rock layers are underdeveloped. No unfavorable geological phenomena such as faults, dangerous rock formations, landslides, collapses, or debris flows were identified along the alignment. Additionally, no issues such as mining voids, karst formations, ground fissures, or harmful gases were detected. The geological longitudinal section of the station is shown in Figure 2, and the physical and mechanical parameters of the surrounding rock at the project site are listed in Table 1.
The station is located in a narrow strip at the confluence of the Yangtze River and Jialing River, where groundwater recharge and water abundance are influenced by topography, lithology, and the degree of fracture development. The main sources of groundwater replenishment include atmospheric precipitation and leakage from urban underground drainage pipelines. Based on the hydrogeological conditions, hydrodynamic properties, and hydraulic characteristics along the alignment, the groundwater is divided into Quaternary loose layer pore water and bedrock fissure water. The surface coverage in the project area is poor, and the exposed strata primarily receive recharge from atmospheric precipitation. The shallow strata act as a recharge pathway, resulting in groundwater within the area having a single recharge mechanism, short flow paths, and localized discharge. Due to the lack of well-developed structural fractures in the rock layers, groundwater storage and replenishment are limited.

3. Construction of the Numerical Model

3.1. Model Establishment and Boundary Conditions

During the actual excavation process of the station, considering factors such as excavation footage, the distance between adjacent pilot tunnels, and the distance from the working faces of each pilot tunnel to the initial support (timing for initial support installation), a three-dimensional model is proposed to simulate the entire process of tunnel excavation and support. The section at station mileage DK3 + 092 (buried depth of 70 m) is selected as the research focus, and a 3D finite element model is established based on the stratum structure method. The Midas GTS NX (v 2022) software is used to simulate the excavation and support behaviors during the construction process by activating and deactivating elements. The initial support is simulated using plate elements, the anchor bolts are simulated using embedded truss elements, and the secondary lining and temporary supports are simulated using solid elements. A mixed hexahedral mesh is used for grid generation, with the mesh size ranging from 2 to 5 m.
According to Saint-Venant’s principle, the influence range of boundary effects in underground excavation is considered. The numerical model adopts the Mohr-Coulomb strength yield criterion. The left and right boundaries of the model are set to three times the excavation section width, with a horizontal boundary value of 129.5 m. The upper buried depth is set at 70 m, and the distance to the bottom boundary is 3.5 times the total height of the excavation section. The vertical height of the numerical model is 150 m. The station adopts a construction sequence that progresses from the center to both ends. For this study, a longitudinal length of 45 m is selected. Horizontal constraints are applied to the left, right, front, and rear boundaries of the model, while constraints in all three directions are applied to the bottom boundary. The effects of surface loads and groundwater seepage are temporarily excluded from the working conditions. The model dimensions, mesh division, and monitoring section are shown in Figure 3.

3.2. Parameter Selection and Research Scheme Design

The physical and mechanical parameters of rock and soil are derived from field tests and geotechnical engineering manuals, while the supporting structure parameters refer to the Code for Design of Railway Tunnels (TB10003-2016). Meanwhile, according to the principle of equivalence [33], the reinforcement effect of the grid steel frame in the support is converted into the strength of the shotcrete. The parameters of the supporting structure during the tunnel excavation process are shown in Table 2.
The construction of the station’s main tunnel begins with the installation of the initial supporting arch structure at the upper bench of the station cross-section, which bears the load from the tunnel crown. Once the excavation is completed and the initial support is fully closed, secondary lining is carried out. Due to the large cross-section and multi-step excavation in underground construction, the supporting structure primarily bears compressive stress during construction, and the compressive stress at the widened arch foot area may be significant. To release stress effectively, eight, nine, ten, and eleven pilot tunnels are planned for bench-by-bench excavation. Excavation begins with the pilot tunnels in the upper bench. After these upper bench pilot tunnels advance a certain distance (e.g., 3 to 5 m, determined based on the surrounding rock conditions), excavation of the middle and lower bench pilot tunnels is carried out sequentially. This approach minimizes the mutual disturbance caused by simultaneous excavation of adjacent pilot tunnels. For the lower bench construction, a layered sequential excavation method is adopted. Excavation begins with the middle pilot tunnel, followed by the side pilot tunnels. After a certain length of excavation and support is completed in the upper layer pilot tunnels, the lower layer pilot tunnels are excavated. The construction of adjacent pilot tunnels in both horizontal and vertical layers is staggered. This excavation sequence effectively reduces the concentration of surrounding rock stress during construction, improves the stability of the surrounding rock, and facilitates construction management.
This optimization plan aims to comprehensively consider factors such as the geological environment of the tunnel, structural characteristics of the project, and construction conditions. Numerical simulation technology and on-site monitoring are employed to conduct a thorough and systematic evaluation and improvement of the original tunnel construction support plan. By optimizing the number of pilot tunnels, excavation advance distance, distance between adjacent pilot tunnel faces, and the distance between the tunnel face and the initial support, this plan seeks to maximize excavation efficiency while ensuring construction safety and surrounding rock stability. The goal is to achieve high-quality, efficient, economical, and environmentally friendly tunnel construction. Specific key excavation parameter optimization measures are detailed in Table 3, with parameter selection based on the actual on-site construction plan.

4. Original Excavation Scheme and Analysis of Surrounding Rock Deformation and Mechanical Characteristics

4.1. Original Design Excavation Scheme of the Station

The metro station adopts the construction method of a cantilever roadheader, with the original design of the main tunnel divided into 9 pilot headings. The cross-sectional excavation area of each pilot heading face is approximately 55 m2 on average, and the main structure construction is planned to be completed in 11 sequential excavation steps. The excavation sequence of each pilot heading is shown in Figure 4. The original excavation parameters of the station are detailed in Table 4. This study focuses on the optimization of the excavation parameters for the station, while the support systems, including rock bolts, steel ribs, shotcrete, and temporary steel supports, are strictly implemented in accordance with the predefined construction scheme without any alterations.

4.2. Analysis of Surrounding Rock Deformation and Mechanical Response Characteristics

According to the geotechnical and support parameters provided by the project engineering department, a numerical model was established under the initial excavation scheme. After solving and calculating, the displacement and stress variation characteristics of the surrounding rock with different construction steps were obtained. The displacement and stress variation curves of the surrounding rock under the original plan are shown in Figure 5. From Figure 5a, it can be observed that the crown settlement exhibits a trend of slow increase followed by rapid increase and finally stabilizes as the construction progresses. The observed crown settlement values at the three monitoring sections are 25.5 mm, 25.1 mm, and 24.6 mm, respectively. The closer the section is to the excavation face, the more significant the settlement changes, indicating that the region near the excavation face is subjected to disturbance for a longer duration. Figure 5b shows the surface settlement curve at mileage DK3 + 092. The maximum cumulative settlement of 10.54 mm occurs on the ground surface above the centerline of the station. At the same location, the cumulative settlement increases as it gets closer to the station roof (with increasing depth). This is because the closer the location is to the disturbed area, the more pronounced the deformation effect becomes.
Figure 5c illustrates the cumulative horizontal displacement convergence values at different sections. The horizontal displacement at the foot of the arch is 12.4 mm, 13.8 mm, and 16.1 mm, respectively, while the convergence values at the side wall are 23.4 mm, 24.7 mm, and 26.6 mm, respectively. The horizontal displacement at the arch foot is consistently smaller than the cumulative horizontal displacement at the lower side walls. This indicates that the arch structure has excellent mechanical properties, effectively distributing stress and limiting significant horizontal deformation. Conversely, the side walls exhibit weaker resistance to horizontal loads, resulting in more pronounced horizontal displacement. Figure 5d depicts the stress distribution of the surrounding rock. The maximum principal stress at the arch crown is 0.58 MPa, while the stress at the arch shoulder is 0.31 MPa, and at the arch foot is −0.4 MPa. The arch crown bears the primary vertical load and exhibits the highest stress, while the arch shoulder, as a transitional area, experiences relatively uniform stress. However, tensile stress occurs at the arch crown, potentially due to the combined effects of support reaction, stress relief, and geometric effects, making the crown a sensitive structural location. The compressive stress observed at the arch foot is a normal phenomenon that can be mitigated by optimizing construction techniques or enhancing support measures to ensure the overall safety and stability of the tunnel.
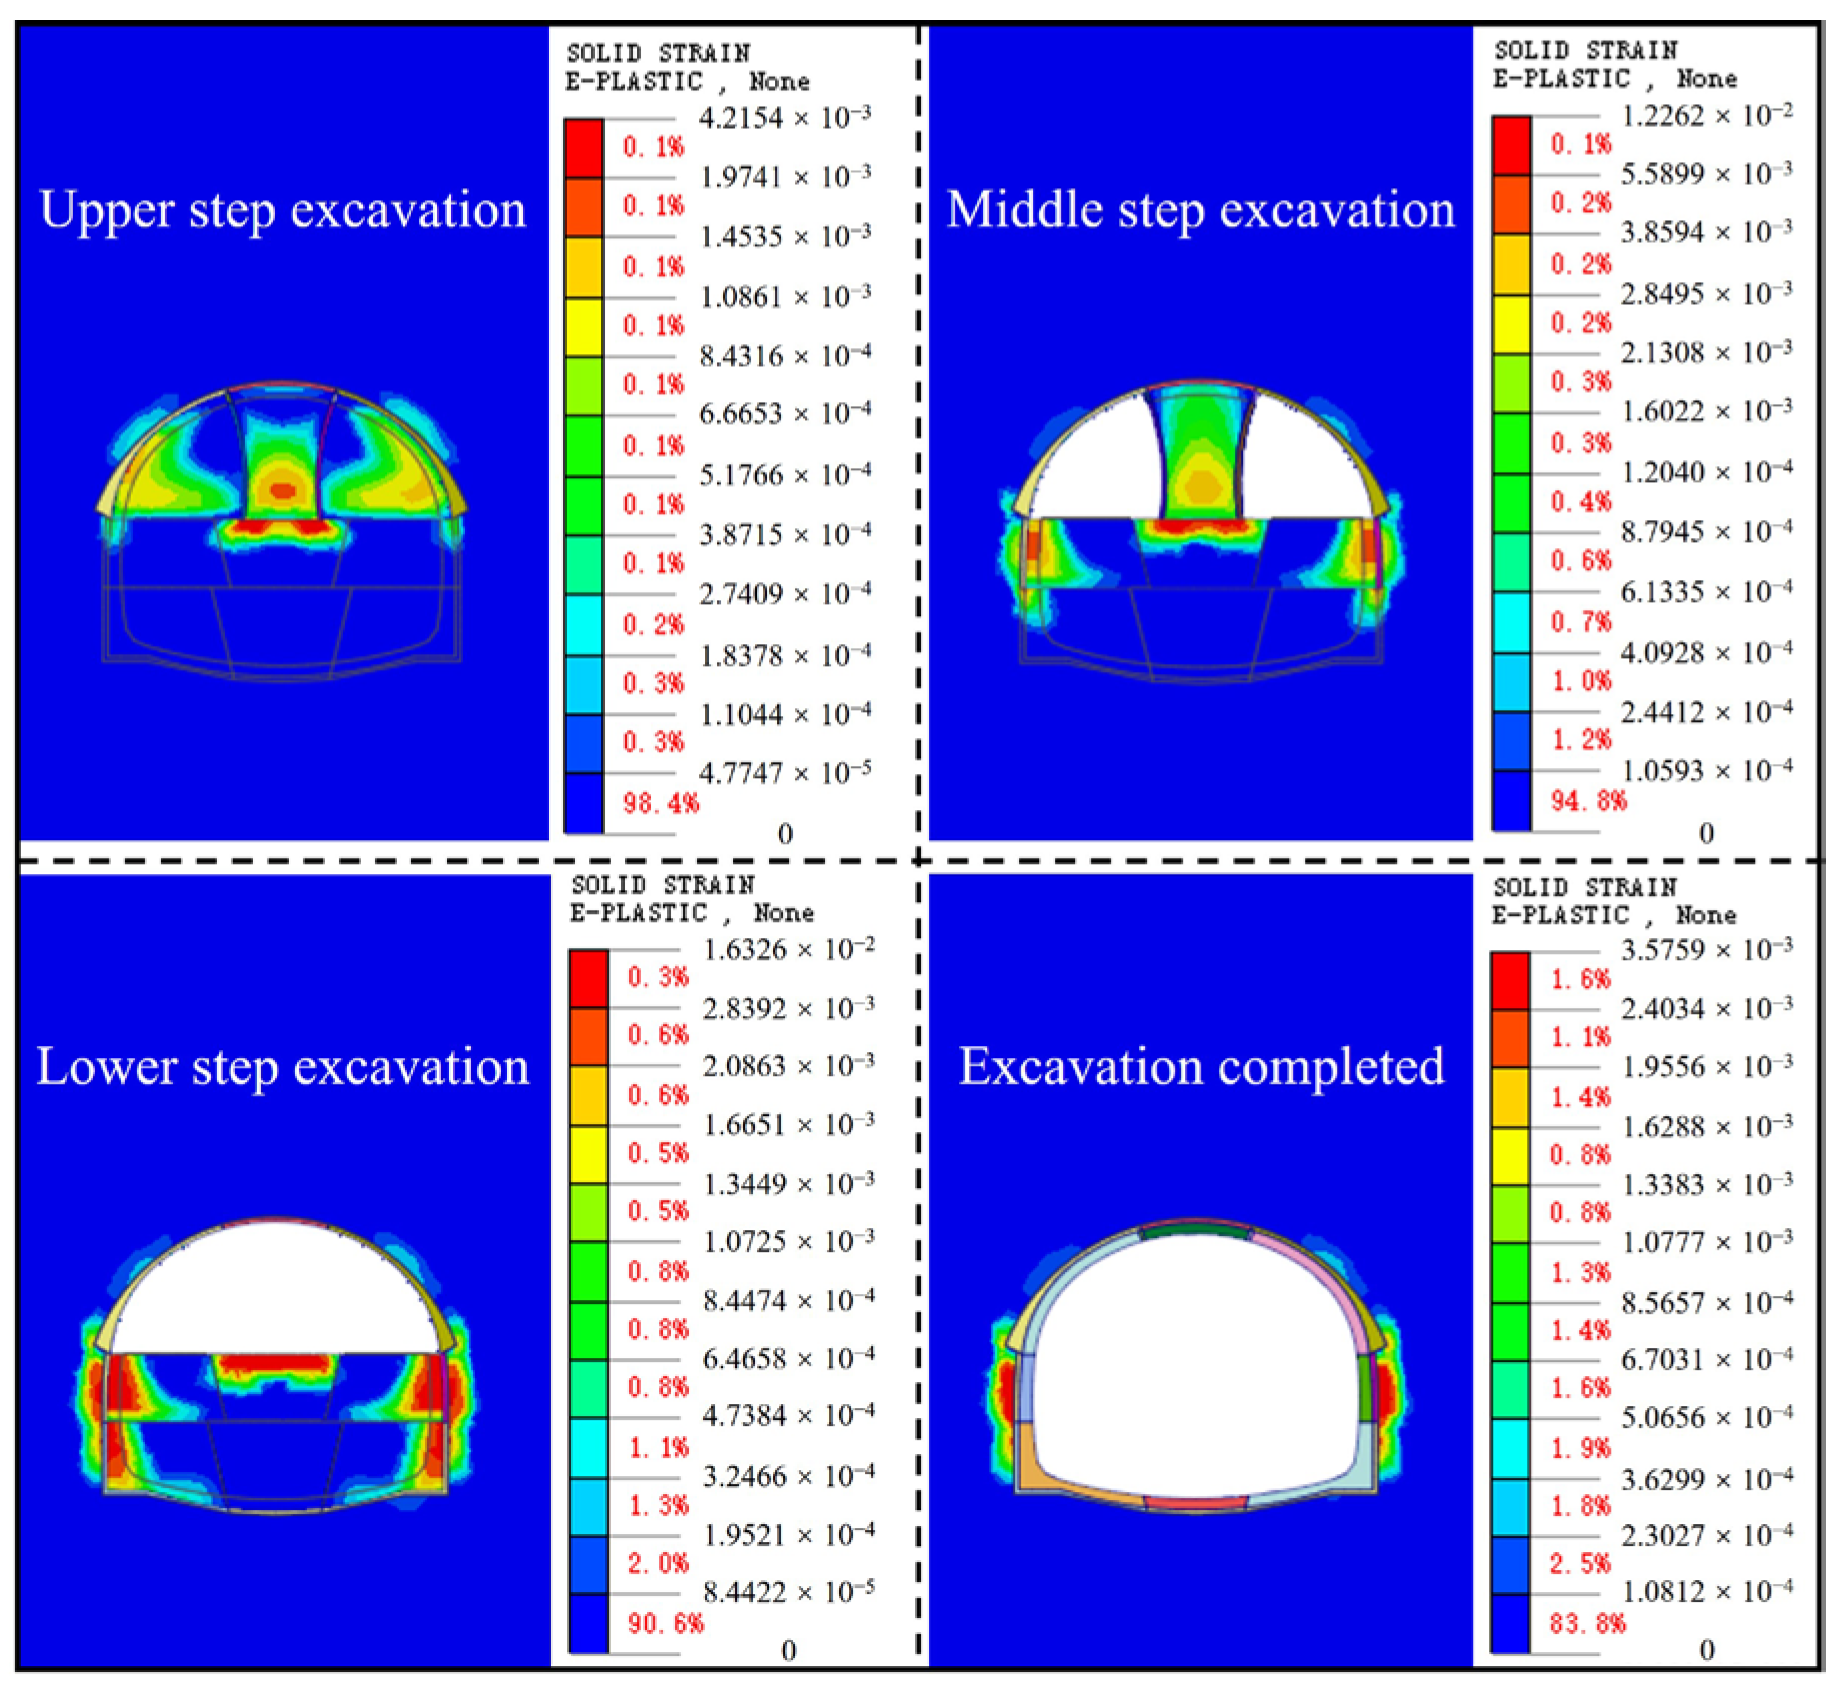
The distribution of the plastic zones of the surrounding rock at different stages, including upper bench excavation, middle bench excavation, lower bench excavation, and post-excavation completion, is shown in Figure 6. Due to the large cross-section of the station excavation and the multiple pilot tunnels involved, the plastic zone expands from the local area of the upper bench to the overall area upon excavation completion. The extent of the plastic zone increases from 1.6% to 16.2%, with significant expansion particularly observed at the sidewalls and arch foot locations. The arch shoulder, sidewalls, and arch foot are weak points in the surrounding rock that require special attention.
Based on the development trend of the plastic zones under this scheme, optimizing the support design or construction methods is key to ensuring the stability of the surrounding rock. Therefore, optimizing the excavation process is essential to control the stress redistribution in the surrounding rock and to prevent the rapid expansion of the plastic zone. During the lower bench excavation stage, it is recommended to minimize the excavation span and adopt a layered excavation approach to better control the plastic zones at the sidewalls and arch foot.
In summary, based on the analysis of surrounding rock displacement, stress, and plastic zone distribution, deficiencies in the excavation process under the current scheme have been identified. In particular, the horizontal convergence value exceeds the safety threshold stipulated in the “Technical Code for Monitoring Urban Rail Transit Engineering” (GB50911-2013), which requires the horizontal convergence value to be less than 20 mm. To address this issue, it is necessary to optimize key excavation technical parameters to meet the requirements of the code.

5. Rational Design of Key Technical Parameters for Station Excavation

5.1. Analysis of Displacement Response Characteristics Under Key Parameters

5.1.1. Influence of Pilot Tunnel Quantity on Surrounding Rock Deformation

As shown in Figure 7, the influence of the number of pilot tunnels on the displacement of surrounding rock at the station is analyzed. Figure 7a illustrates the variation curves of crown settlement with construction steps under different numbers of pilot tunnels. When the number of pilot tunnels is set to 8, 19, 10, and 11, the crown settlements are 28.93 mm, 26.27 mm, 25.17 mm, and 18.23 mm, respectively. With an increasing number of pilot tunnels, the vertical displacement shows a gradually decreasing trend.
Figure 7b depicts the horizontal convergence values at the arch foot and the sidewall positions under different numbers of pilot tunnels. As the number of pilot tunnels increases, the horizontal convergence values are 17.88 mm, 8.64 mm, 7.11 mm, and 5.72 mm, respectively, while the horizontal displacement convergence values at the sidewalls are 30.96 mm, 23.50 mm, 22.10 mm, and 16.77 mm, respectively. Compared with the case of 8 pilot tunnels, the sidewall horizontal displacement decreases by 24%, 28.6%, and 45.8%, respectively. The larger number of pilot tunnels reduces the disturbance to the surrounding rock, thereby decreasing the horizontal displacement of the surrounding rock toward the centerline direction. Therefore, a reasonable increase in the number of pilot tunnels is conducive to controlling horizontal displacement deformation.
In conclusion, as the number of pilot tunnels increases, the effect of controlling disturbances to the surrounding rock during construction is improved, leading to a reduction in surrounding rock deformation. Therefore, selecting 11 pilot tunnels provides relatively better deformation control for the station’s surrounding rock.

5.1.2. Impact of Excavation Footage on Surrounding Rock Deformation

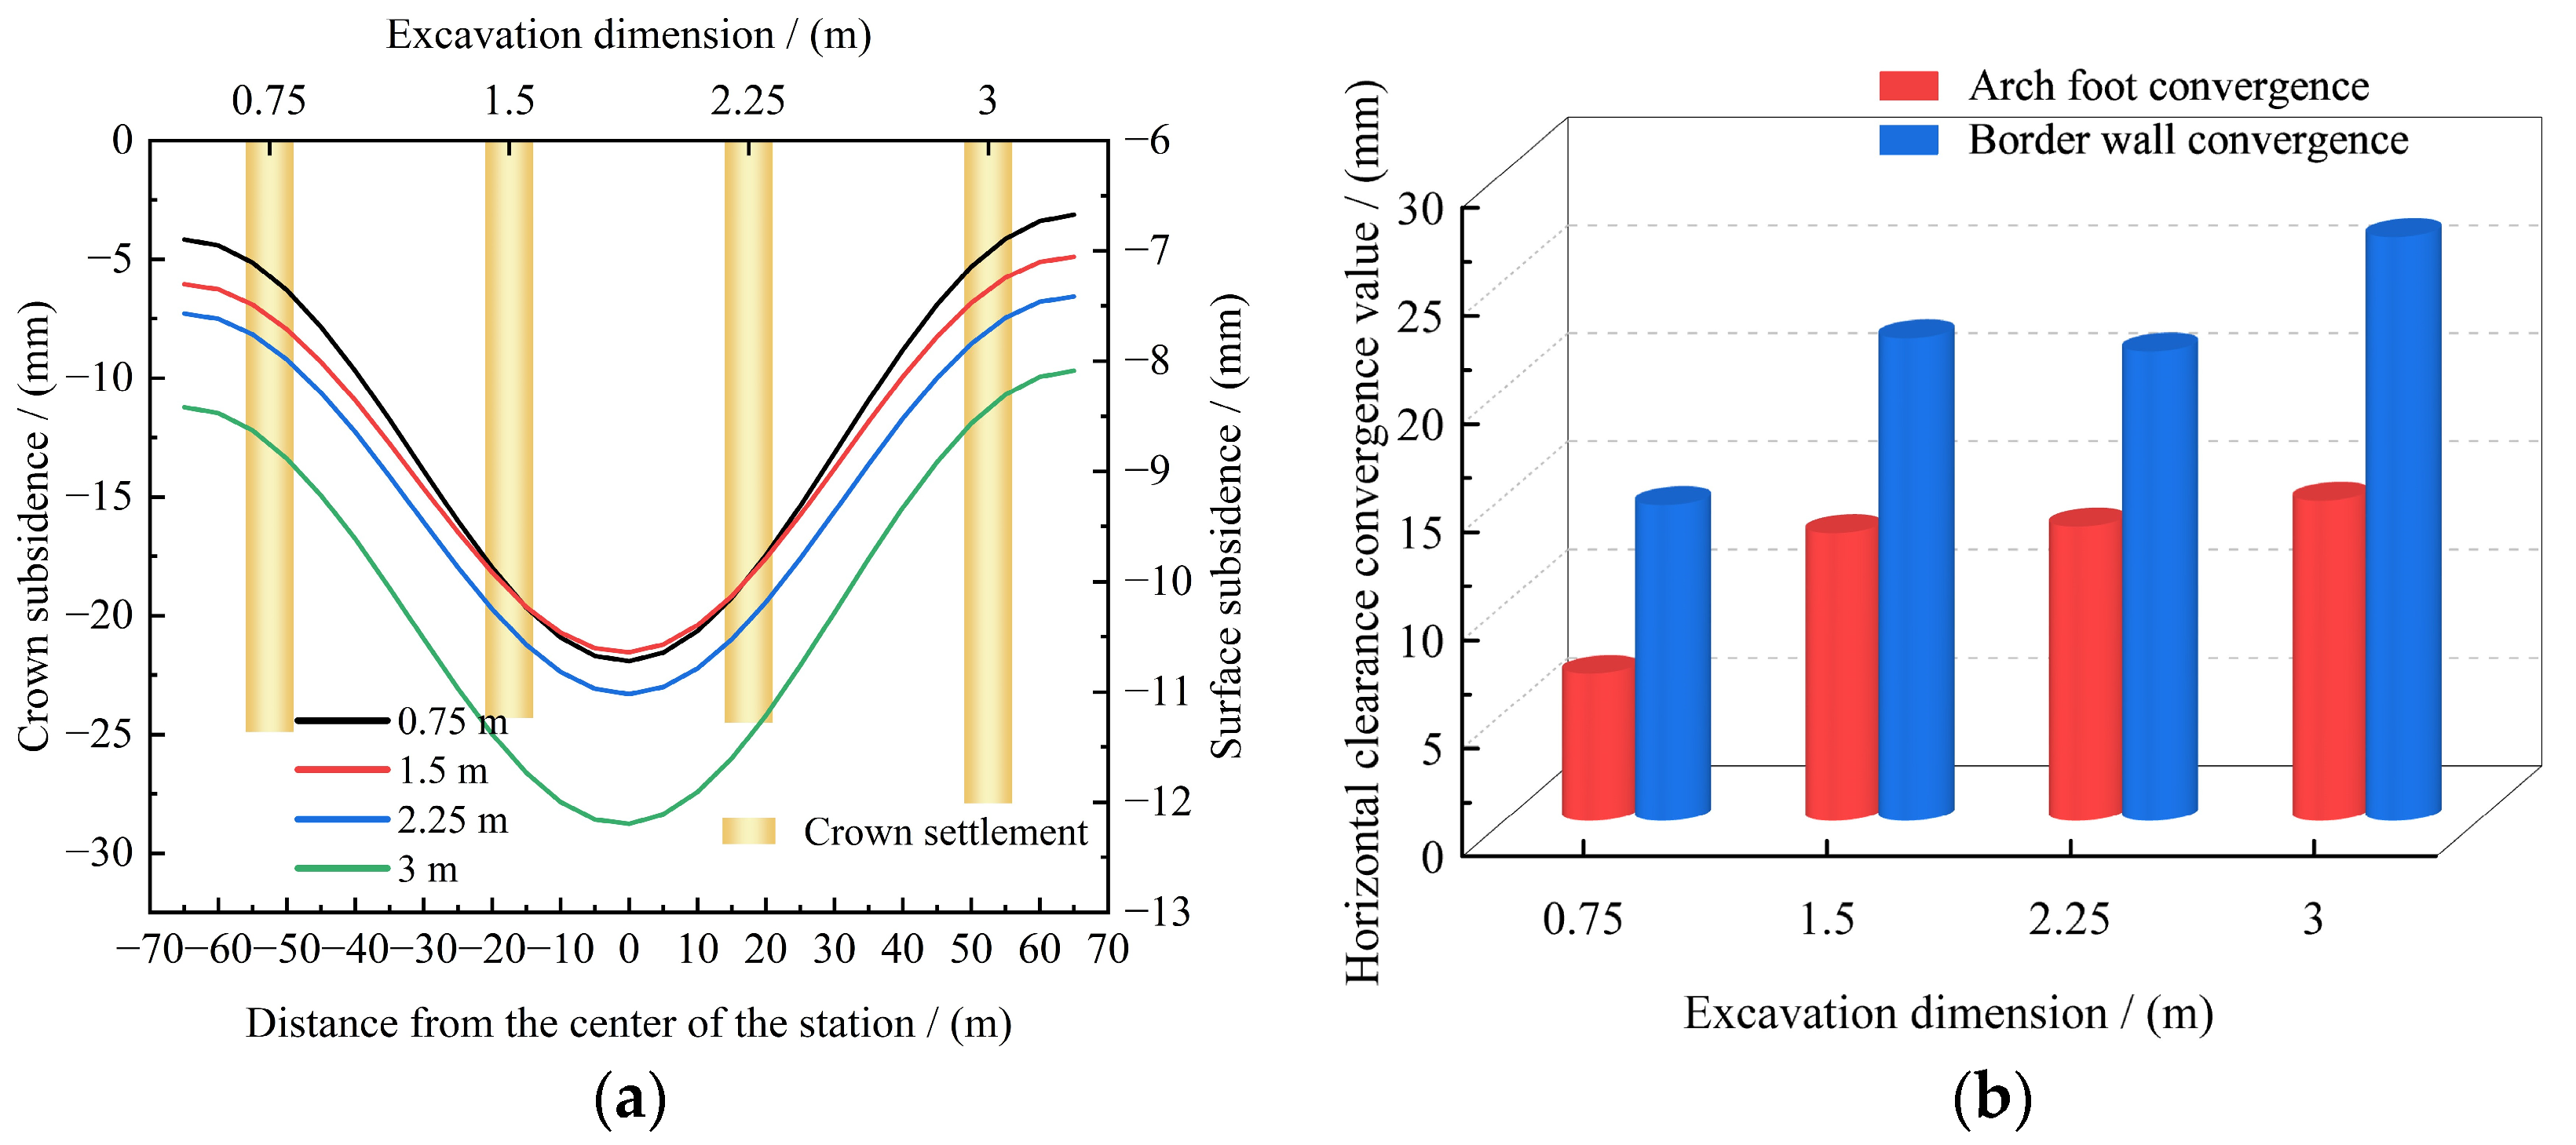
The influence of excavation advance on the displacement of surrounding rock at the station is shown in Figure 8. Figure 8a illustrates the variation characteristics of crown settlement and surface settlement under different excavation advances. By controlling other excavation factors unchanged, when the excavation advances are 0.75 m, 1.5 m, 2.25 m, and 3 m, the cumulative crown settlement values are 24.9 mm, 24.4 mm, 24.5 mm, and 27.9 mm, respectively, and the surface settlement values are 10.72 mm, 10.64 mm, 11.08 mm, and 12.19 mm, respectively. As the excavation advance increases, the vertical displacement shows a gradually increasing trend.
Figure 8b shows the variation characteristics of horizontal convergence values at the arch foot and sidewall positions under different excavation advances. With the increase in excavation advance, the horizontal convergence values at the arch foot are 6.80 mm, 13.31 mm, 13.57 mm, and 14.79 mm, respectively, while the horizontal convergence values at the sidewall are 14.61 mm, 22.34 mm, 21.69 mm, and 26.99 mm, respectively. Compared with the excavation advance of 3 m, the horizontal displacement at the sidewall decreases by 45.9%, 17.2%, and 19.6%, respectively. Increasing the excavation advance intensifies the disturbance to the surrounding rock, making it difficult to effectively limit the horizontal displacement of the surrounding rock.
In conclusion, as the excavation advance increases, the deformation of the surrounding rock gradually becomes larger, and the overall stability of the station weakens. However, with the increase in excavation advance, the construction progress accelerates, enabling earlier completion of support and saving part of the economic cost. Therefore, selecting an excavation advance of 1.5 m achieves relatively better control of surrounding rock deformation and economic benefits for the station.

5.1.3. Influence of Adjacent Pilot Tunnel Excavation Spacing on Surrounding Rock Deformation

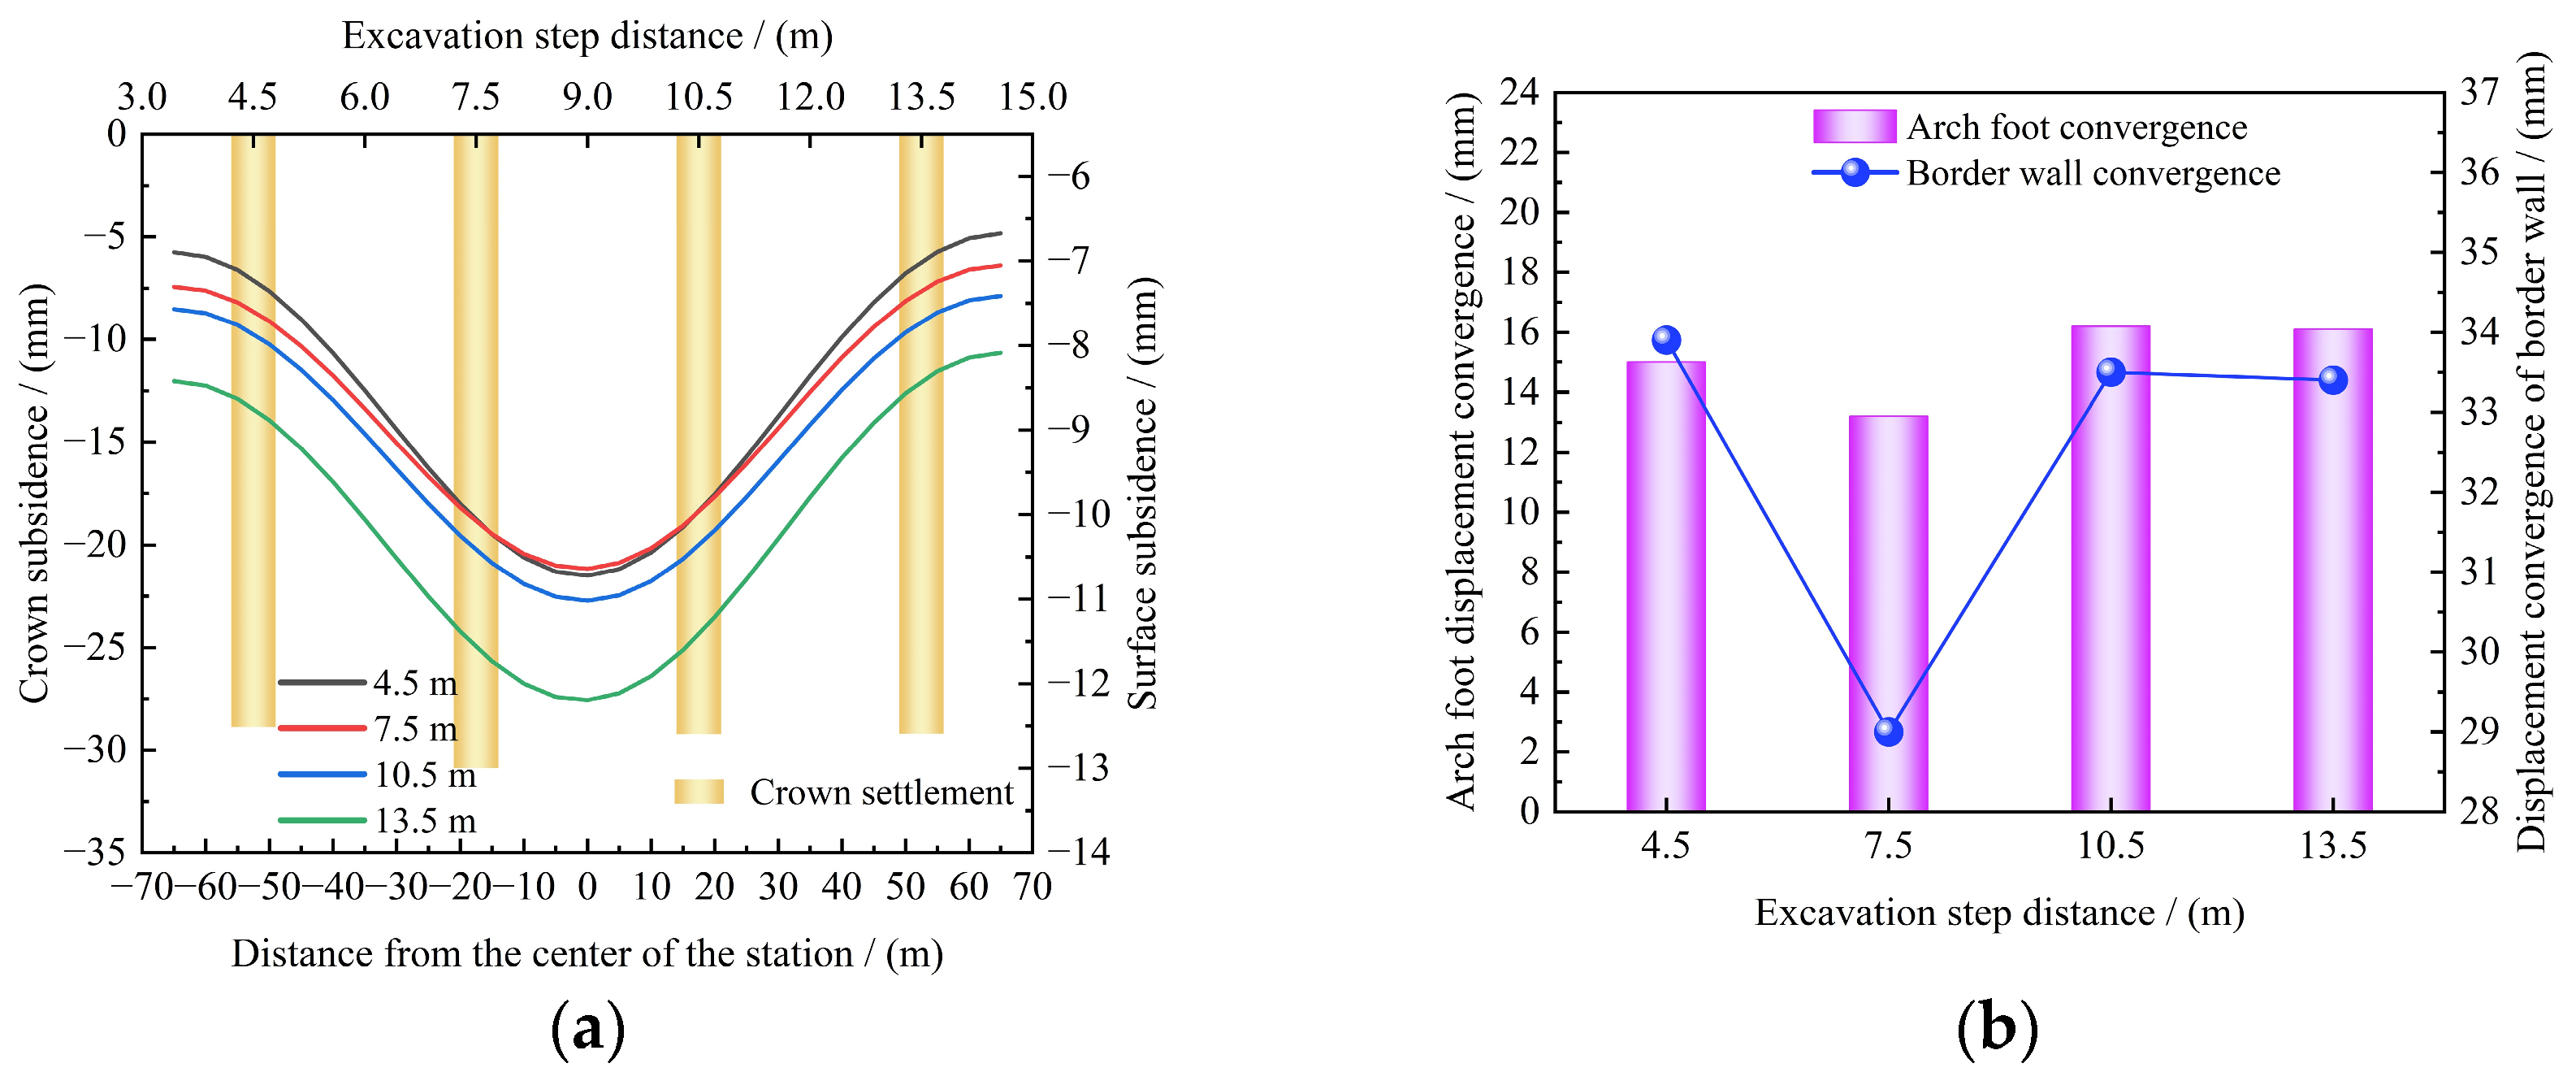
The influence of the excavation spacing of adjacent pilot tunnels on the displacement of the surrounding rock at the station is shown in Figure 9. Figure 9a illustrates the variation characteristics of crown settlement and surface settlement under different excavation spacings. By keeping other excavation factors constant, when the excavation spacings are 4.5 m, 7.5 m, 10.5 m, and 13.5 m, the cumulative crown settlement values are 28.88 mm, 30.87 mm, 29.23 mm, and 29.21 mm, respectively, while the surface settlement values are 9.37 mm, 12.14 mm, 11.94 mm, and 12.60 mm, respectively. As the excavation spacing increases, the vertical displacement exhibits a trend of first increasing and then decreasing.
Figure 9b shows the variation characteristics of horizontal convergence values at the arch foot and sidewall positions under different excavation spacings. As the excavation spacing increases, the horizontal convergence values at the arch foot are 15.04 mm, 13.22 mm, 16.17 mm, and 16.08 mm, respectively, while those at the sidewall are 33.86 mm, 29.02 mm, 33.52 mm, and 33.41 mm, respectively. Horizontal displacement shows a trend of first decreasing and then increasing. Compared with the excavation spacing of 4.5 m, the sidewall horizontal displacement decreases by 14.3%, 1.0%, and 1.3%, respectively, as the excavation spacing increases. Increasing the excavation spacing can reduce the horizontal deformation of the surrounding rock to a certain extent, thereby reducing horizontal convergence. Therefore, increasing the excavation spacing is also beneficial for controlling horizontal displacement changes.
In conclusion, increasing the excavation spacing of adjacent pilot tunnels reduces the range of mutual disturbance between multiple pilot tunnels, promotes the stability of the surrounding rock, and reduces deformation and stress concentration distributions. Therefore, considering all factors, an excavation spacing of 10.5 m is deemed more appropriate for controlling the deformation of the surrounding rock at the station.

5.1.4. Influence of Support Distance on Surrounding Rock Deformation

Figure 10a illustrates the variation characteristics of crown settlement, invert heave, and surface settlement under different support distances. Keeping the bolt spacing constant, when the support distances are 3 m, 4.5 m, 6 m, and 7.5 m, the crown settlements are 29.23 mm, 30.15 mm, 29.95 mm, and 31.85 mm, respectively, while the surface settlements are 11.31 mm, 12.55 mm, 12.86 mm, and 13.23 mm, respectively. As the support distance increases, vertical displacements show a gradually increasing trend.
The variation curves of horizontal convergence with construction progress are shown in Figure 10b. Taking the horizontal convergence displacement at the sidewall as the research object, as the support distance increases, the horizontal convergence values at the arch foot are 16.17 mm, 18.42 mm, 20.02 mm, and 22.29 mm, respectively, while the horizontal convergence values at the sidewall are 33.52 mm, 43.83 mm, 47.55 mm, and 51.55 mm, respectively. As the support distance increases, horizontal displacements also exhibit a gradually increasing trend. An increase in the distance from the tunnel face to the initial support weakens the stability of the surrounding rock support structure, thereby increasing both horizontal and vertical deformations. Therefore, increasing the support distance is not conducive to controlling changes in horizontal displacement.
In summary, with the widespread application of the “New Austrian Tunneling Method” (NATM) in the construction of large-span soft rock tunnels, the choice of support distance is particularly critical. Increasing the support distance contradicts the “early support” concept of NATM and is detrimental to promoting the stability of surrounding rock. However, the impact of onsite operation equipment must also be considered. Therefore, selecting a support distance of 6 m is relatively favorable for controlling the deformation of the surrounding rock at the station.
In this section, the control variable method is mainly used to study the parameter selection under different excavation factors, and the change rule of station surrounding rock displacement under different excavation parameters is explored. Since the control effect under the mutual coupling effect of multiple parameters is not considered, the influence of different factors on the stability of the station is analyzed in order to achieve the purpose of selecting the optimal excavation parameters.

5.2. Sensitivity Analysis of Key Excavation Factors

In order to study the effect of parameters under different factors on the displacement of surrounding rock when interacting with each other, it is proposed to further study the deformation of surrounding rock in the station by carrying out orthogonal tests and to explore the relationship between the excavation factors and parameter changes. Four factors are selected, including the number of guide holes, the excavation footage of guide holes, the working distance of neighboring guide holes, and the distance from the palisade surface to the initial support surface (support distance), and four parameter levels are set for each factor. The excavation parameter levels and the parameter selection of different influencing factors are shown in Table 5.
The influencing factors A, B, C and D were combined at the corresponding levels of 1, 2, 3 and 4, respectively. Using the modeling method and physical parameters mentioned above, the numerical simulation calculation is carried out in turn according to the scheme number. It is found that the horizontal clearance convergence value is easy to exceed the threshold, which will lead to a large deformation risk in the station. Therefore, the sensitivity analysis of excavation parameters takes the horizontal displacement convergence value as the assessment target. The numerical simulation orthogonal test scheme and displacement results are shown in Table 6.
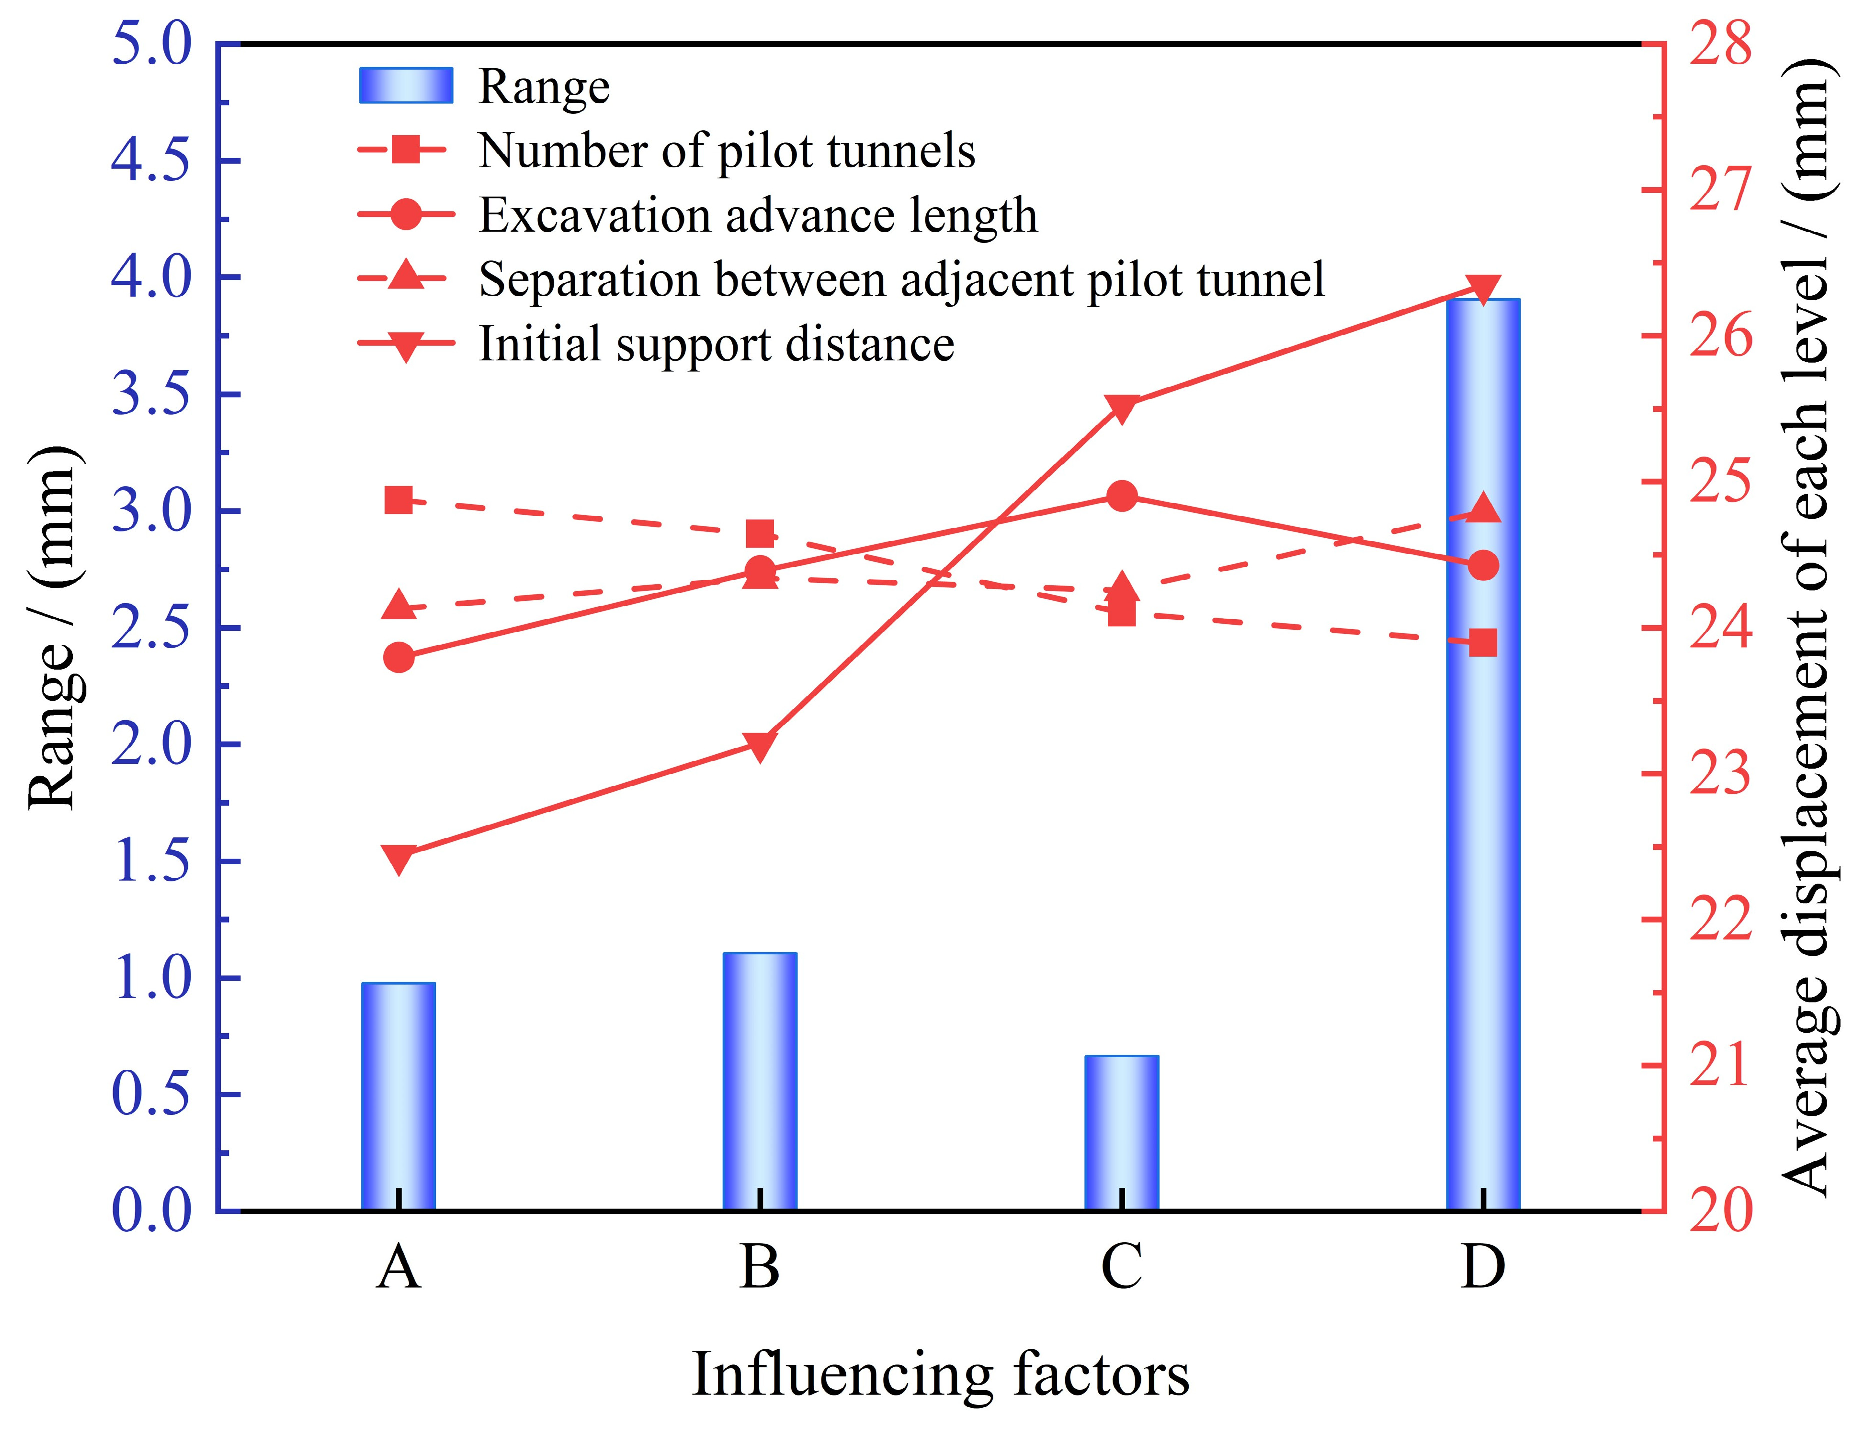
After post-processing the results of the numerical model, the different factor levels’ mean values and ranges are shown in Figure 11. As can be seen from Figure 11, the range of horizontal convergence displacement is the largest under the influence of the factor “distance from the tunnel face to the initial support.” This indicates that an excessively large lag distance will lead to prolonged exposure of the surrounding rock, excessive stress release, expansion of the plastic zone, and even instability. Under such conditions, construction operations must promptly apply support to avoid significant displacements in the surrounding rock.
The second most influential factor is the excavation advance length, which directly affects the exposure length of the surrounding rock. Tunnel excavation causes a redistribution of stress in the surrounding rock, and excessive advance length will result in the surrounding rock bearing more stress release before the support is in place, leading to rapid deformation development. This is particularly critical in soft rock environments, where excessive advance lengths exacerbate the instability of the surrounding rock.
Next is the number of pilot tunnels. Multi-pilot tunnel excavation may slightly reinforce the relaxation state of the surrounding rock under the coupling effect of different parameters, altering stress distribution and potentially causing stress concentration and minor displacement changes. However, the influence of the number of pilot tunnels is often optimized through construction design, such as using the “pilot first, main later” method to reduce the impact of pilot tunnels on surrounding rock deformation. As a result, the effect of the number of pilot tunnels on station deformation is generally less significant than that of the support lag distance and advance length.
Finally, the range of horizontal convergence displacement caused by the excavation spacing of adjacent pilot tunnels is the smallest. The spacing between adjacent pilot tunnels mainly affects the stress concentration degree of the surrounding rock between them, thus having the least impact on surrounding rock displacement.
Therefore, for station excavation and construction under this geological environment, priority should be given to optimizing the distance from the tunnel face to the initial support and the excavation advance length. In contrast, the number of pilot tunnels and the excavation spacing of adjacent pilot tunnels have a relatively minor effect on controlling deformation.

5.3. Optimization Scheme for Key Excavation Parameters of the Station

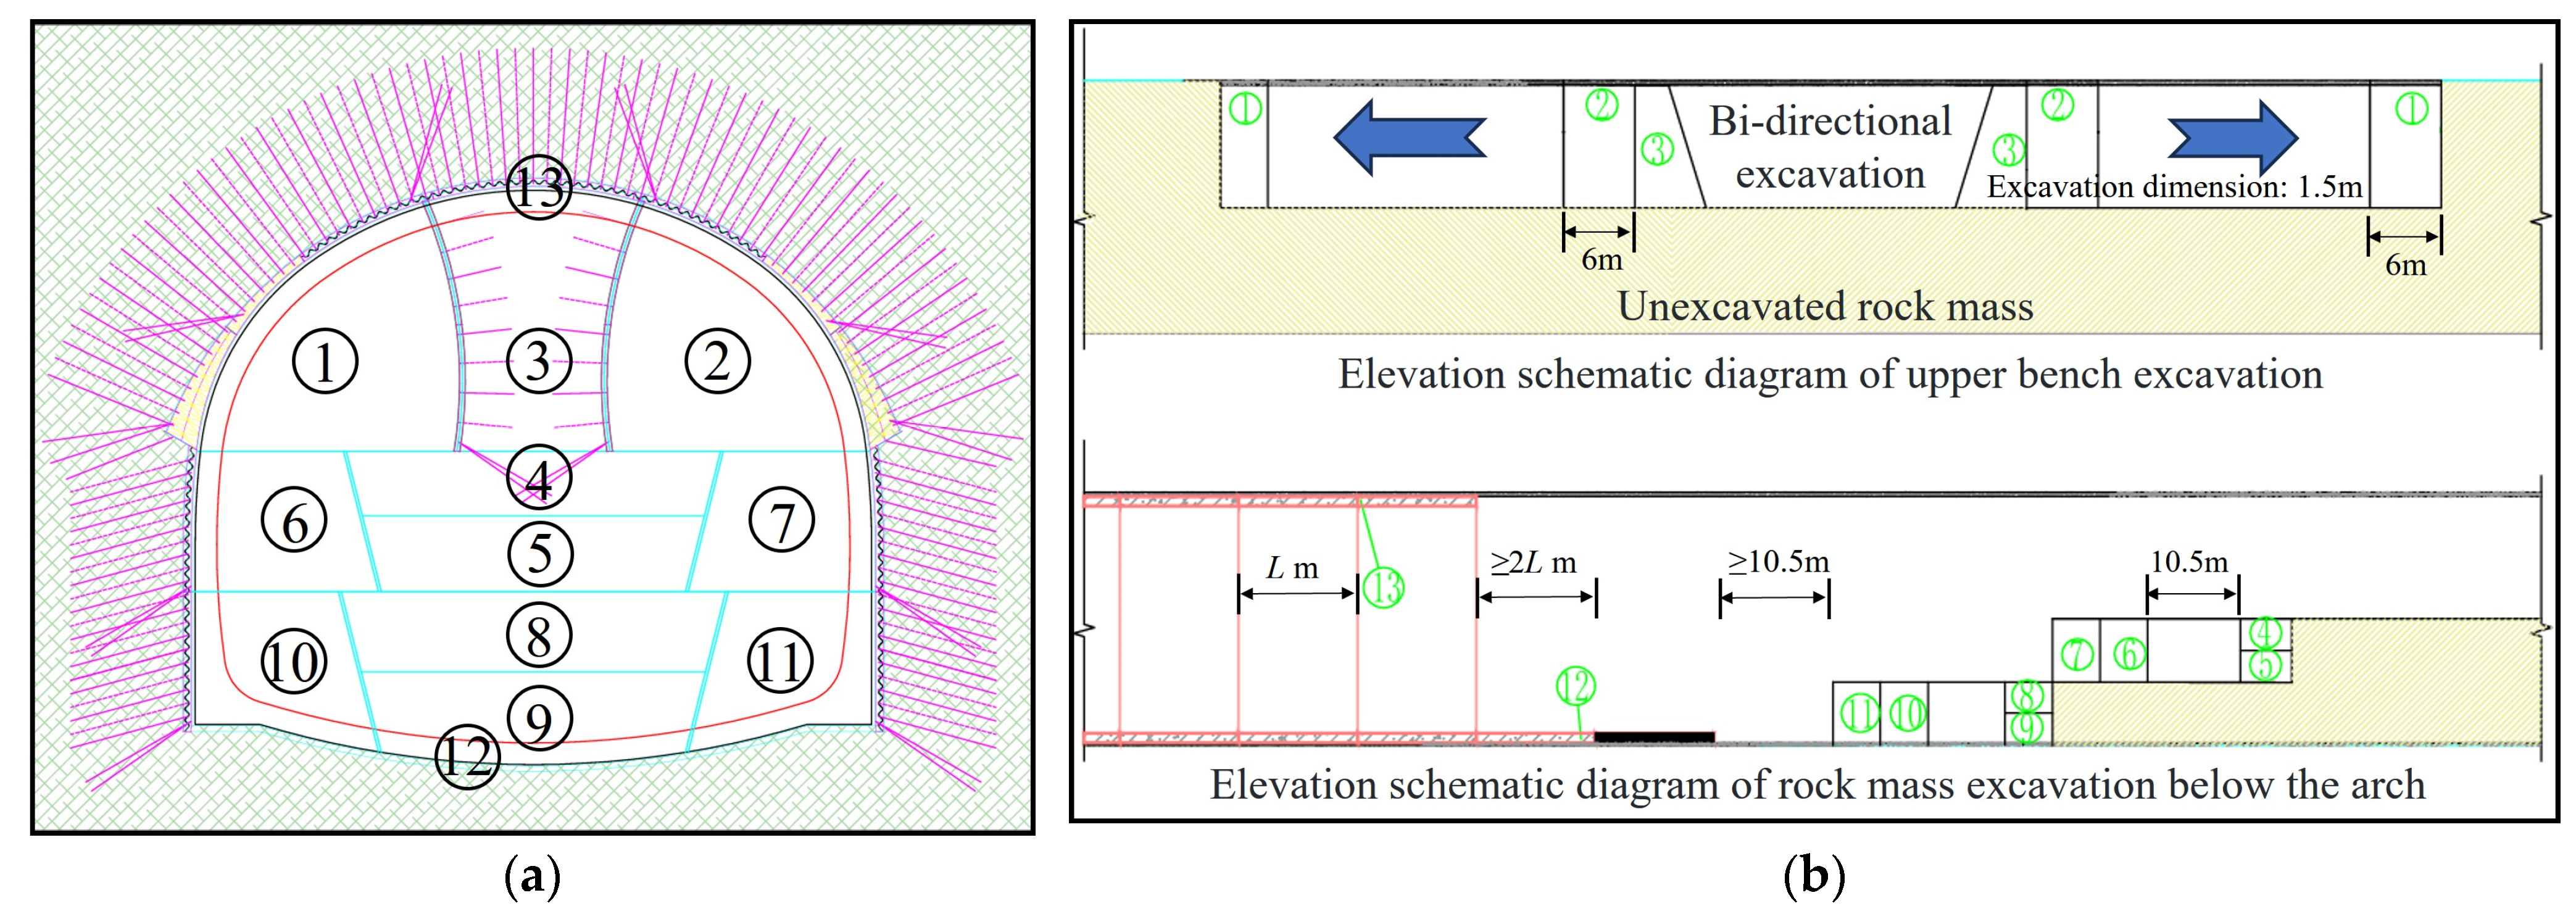
By using the control variable method to analyze the impact of single parameter variations, and then conducting parameter sensitivity analysis through orthogonal tests, the key excavation parameter scheme was determined based on the engineering site conditions and station construction modulus. The optimized construction process is shown in Figure 12, and the optimized excavation parameters for the subway station are shown in Table 7.

6. Field Application and Validation

6.1. Application Effect of the Optimized Excavation Scheme

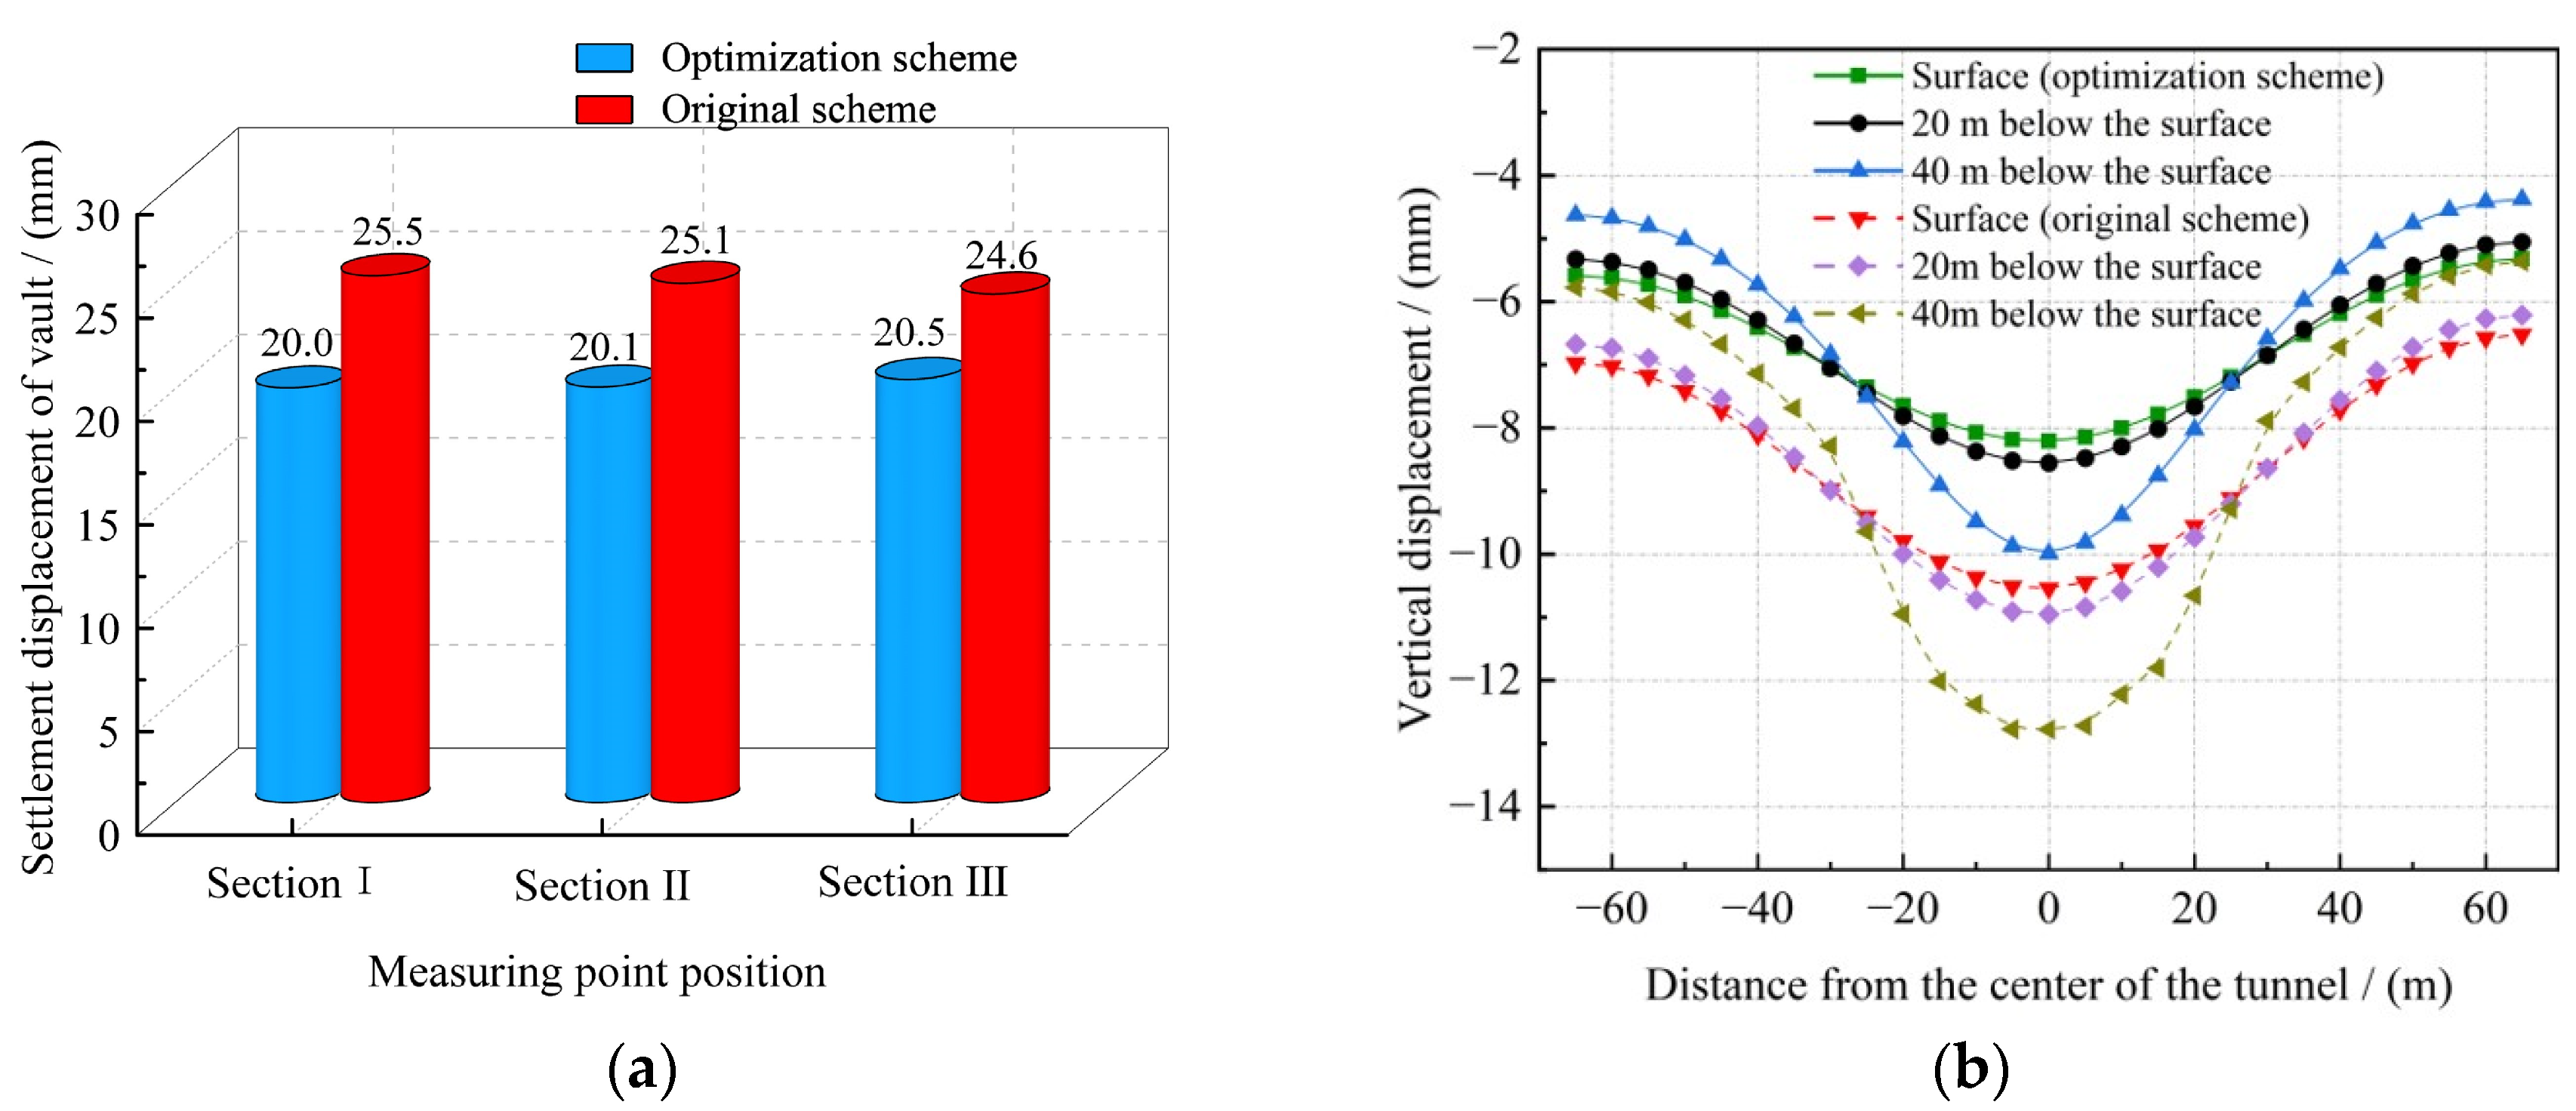
To verify whether the optimized parameters are reasonable, finite element software is proposed to conduct numerical simulations of the station after the excavation scheme adjustments. Displacement and stress analyses are performed on the results, and the geotechnical and support parameters of the model are consistent with those mentioned earlier. The numerical simulation results of the original design and the optimized excavation scheme are compared in Figure 13.
From Figure 13a, it can be observed that the vault settlement values of the monitoring sections under the optimized excavation scheme are 20.0 mm, 20.1 mm, and 20.5 mm, respectively. These values are significantly smaller than the settlement values under the original excavation scheme. The figure shows a trend where the closer the location is to the excavation face, the more significant the settlement changes, indicating prolonged disturbance in the excavation region over time. Figure 13b presents the surface settlement variation curve before and after excavation scheme optimization at mileage DK3 + 092. The cumulative maximum ground settlement at the location above the station’s central axis is 8.1 mm, which is smaller than the 10.4 mm observed in the original design scheme.
Figure 13c shows the cumulative horizontal displacement convergence values at different sections before and after excavation optimization. After optimization, the horizontal displacements at the arch foot locations are 9.7 mm, 9.0 mm, and 8.0 mm, respectively. Meanwhile, the convergence values at the sidewall locations are 19.8 mm, 18.4 mm, and 15.8 mm, respectively. The horizontal displacement convergence values at the arch foot are consistently smaller than the cumulative horizontal displacement at the lower sidewall locations. This indicates that the arched structure at the vault exhibits excellent mechanical properties, effectively dispersing stress and limiting large horizontal deformations. Figure 13d illustrates the stress distribution in the surrounding rock. The maximum principal stress at the vault is −0.27 MPa, the stress at the arch shoulder is −0.13 MPa, and the stress at the arch foot is −0.58 MPa. The figure shows that the stress gradually decreases from the arch top downward, with the arch shoulder acting as a transitional region where the stress is relatively uniformly distributed. This effectively reduces stress concentration values.
Comparison of surrounding rock displacement and plastic zone changes is shown in Figure 14. Figure 14a presents the displacement contour maps of the surrounding rock under the original design and the optimized scheme. The horizontal displacement exhibits a symmetrical distribution on both sides of the tunnel, showing distinct “red” and “blue” regions, indicating significant horizontal deformation of the surrounding rock under stress. The maximum horizontal displacement occurs near the sidewalls of the tunnel, with a peak value reaching 13.7 mm on one side. The vertical displacement is more apparent in the vault and the invert areas, with the maximum vertical displacement observed at the vault, approximately 24.6 mm. The displacement distribution demonstrates a typical “vault settlement + invert heave” pattern, indicating substantial vertical deformation of the surrounding rock. The displacement distribution at the arch shoulder is symmetrical, but the displacement range at the arch foot is broader, suggesting significant stress release at the bottom, posing a potential risk of instability.
Under the optimized scheme, the horizontal displacement is significantly reduced, the displacement range at the sidewalls is narrowed, and the “red” high-displacement regions are diminished. The maximum horizontal displacement decreases to approximately 10 mm, meeting the requirements of relevant standards. The vertical displacement under the optimized scheme is also significantly reduced, with the maximum displacement at the vault reduced to 20.8 mm, and deformation at the arch foot notably alleviated. Both the vault settlement and the arch foot heave are diminished, and the displacement distribution is more uniform, indicating an improvement in the overall stability of the surrounding rock.
Figure 14b shows the comparison of plastic zone contour maps of the surrounding rock before and after optimization. From Figure 14b, it can be seen that the optimized scheme significantly improves the plastic zone in the vault and arch shoulder areas during the upper bench excavation stage, enhancing the stability of the surrounding rock. The original scheme may have issues with delayed support, leading to an expansion of the plastic zone in the vault and arch shoulder areas. In the original scheme, the plastic zone area at the arch shoulders and the upper sidewalls is relatively large, and the surrounding rock is in a clear yield state, potentially causing local instability problems. The optimized scheme successfully reduces the plastic zone by adopting a more reasonable excavation sequence or adjusting the number of excavation benches, effectively controlling surrounding rock deformation.
During the lower bench excavation stage in the original scheme, the plastic zone range at the sidewalls and arch foot is relatively large, possibly
In summary: Through comparison, it can be seen that the optimized scheme has a significant effect on controlling the stability of the station compared to the original scheme. The optimized scheme reduces the horizontal and vertical displacements of the surrounding rock by 18.3% and 28%, respectively, and the displacement distribution becomes more uniform. The deformation on both sides and the top and bottom of the tunnel tends to be symmetrical, indicating that the optimized scheme has a good regulatory effect on the stress redistribution of the surrounding rock. The range of the plastic zone in the surrounding rock is reduced, especially in the sidewall and arch footing areas, effectively controlling the deformation of the surrounding rock. The optimized scheme alters the stress distribution pattern of the surrounding rock, avoids the phenomenon of plastic zone penetration, and significantly enhances the overall stability of the surrounding rock.

6.2. Field Monitoring Plan and Layout

During the station construction process, timely feedback on information is achieved through on-site monitoring of the surrounding rock data. This helps engineers determine whether corresponding measures need to be taken during construction to ensure the safe progress of the station. Before the secondary lining construction, the main monitoring items include the settlement of the station arch crown, horizontal convergence of the clear space, and surface settlement. At the same time, the station is equipped with automated monitoring systems for surrounding rock pressure and the stress of reinforcement in the initial support. The on-site monitoring plan and layout are shown in Figure 15, while the control values for the station monitoring and measurement items are provided in Table 8.
The station site utilizes earth pressure cells (HC-TY600) for monitoring the surrounding rock pressure. These are installed by pre-embedding the sensors before the target structure is formed. The sensor is a steel-string type designed for measuring earth pressure and can be connected to a remote wireless automated data acquisition system for long-term automatic data collection. The monitoring frequency is set to collect data once every 2 h.
For monitoring the arch crown settlement, horizontal clearance convergence, and surface settlement of the station’s excavated main body, manual measurements are employed to obtain monitoring data. The instruments used include Leica Total Station (TS09Plus) and Trimble Level (Trimble-DiNi03). A monitoring cross-section is set at DK3 + 092, with leveling observation points arranged at the surrounding rock positions of the tunnel, to regularly measure the displacement changes in the surrounding rock during construction. The monitoring frequency is set to measure three times every 7 days.

6.3. Analysis of Monitoring Data

Considering that some monitoring points were subjected to compression or damage during construction, this article selects effective points within the monitoring section with relatively complete data for analysis. The collected data on surface settlement, surrounding rock deformation, and surrounding rock pressure changes are as follows:
By extracting the monitoring data from the 24th to 28th week after the station construction commenced and referencing the existing meeting report records, variation curves of surface settlement at the monitoring cross-section, settlement monitoring point A, and the horizontal clearance convergence monitoring lines DE and FG were plotted. The displacement variation curves of the on-site monitoring points are shown in Figure 16. The actual cumulative horizontal clearance convergence value at the arch foot measured by the survey engineer was 12 mm, the cumulative maximum horizontal clearance convergence value at the side wall was 16.6 mm, the cumulative maximum settlement value at the arch crown was 9.6 mm, and the cumulative maximum surface settlement value was 8.9 mm.
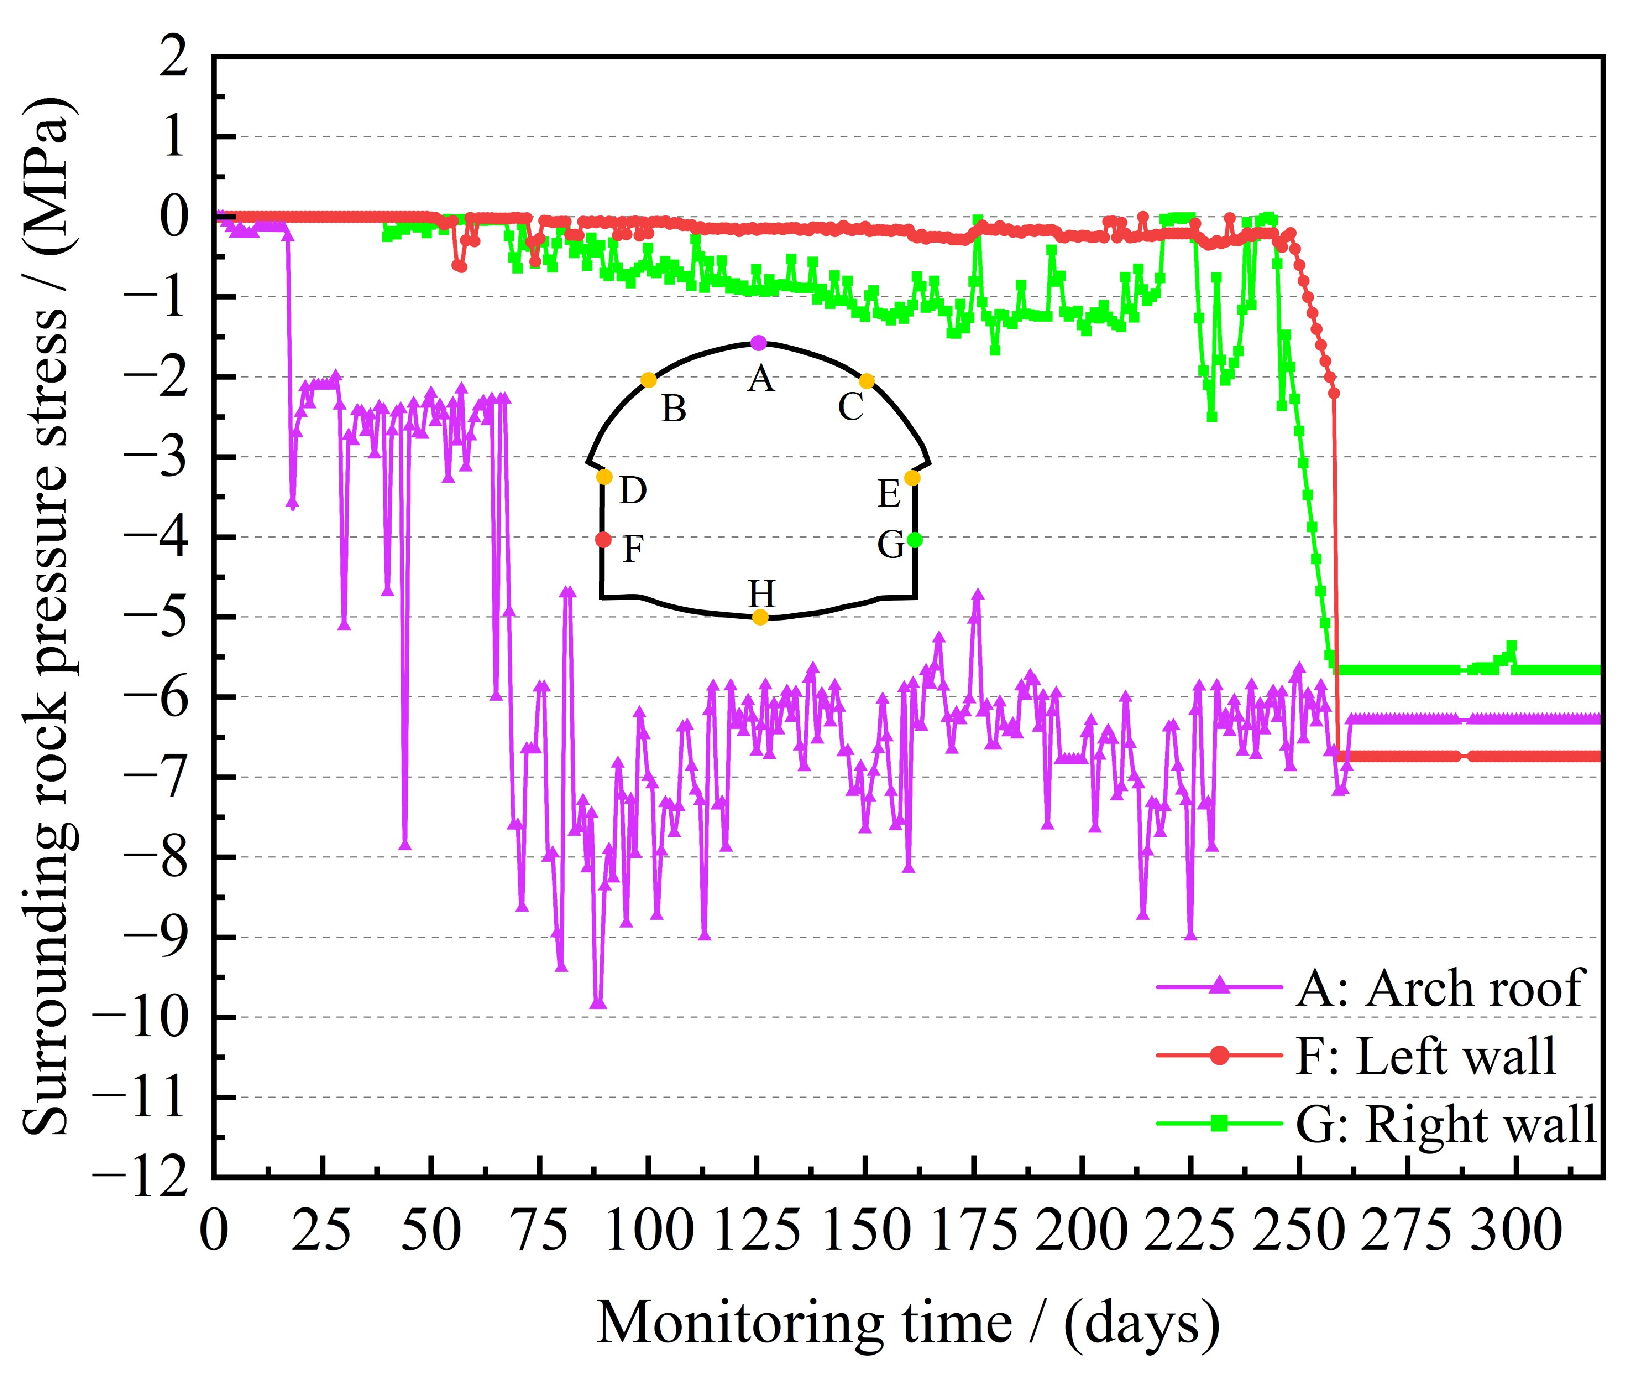
The surrounding rock pressure monitoring results at the arch crown and the left and right side walls of the monitoring section were selected for analysis. The monitoring period was 320 days, and the variation curves of surrounding rock pressure monitoring on-site are shown in Figure 17. The maximum stress value of the surrounding rock pressure at the arch crown was −9.8 MPa, and the stabilized stress at the left side wall was −6.8 MPa. The on-site construction environment and other human factors had a certain impact on the monitoring data. The monitored earth pressure values were generally higher than the numerical simulation results but were still lower than the warning values of the automated monitoring system. Since the monitoring data tended to stabilize, the safety risks were entirely within a controllable range.

7. Discussion

7.1. Limitations of the Research

The initial intention of this research is to optimize key parameters for the construction of subway stations in the Chongqing area and summarize applicable rules for similar geological environments. However, we acknowledge that the results have certain limitations, as geological conditions can vary significantly between different regions. Directly applying the “optimal parameters” from our study to other areas may lead to unsafe or uneconomical designs. Therefore, we recommend that users conduct on-site geological surveys and parameter calibrations when adopting our research scheme. In different geological environments, the physical properties of the rock mass and hydrological conditions can impact the deformation characteristics and structural safety during construction. Thus, when applying our optimized parameters to other projects, it is essential to make necessary adjustments and verifications based on the specific geological conditions of the local area. Additionally, this method is more applicable to the type of rock layers (such as sandstone and sandy mudstone at depths of 70–100 m, or interbedded sandstone and sandy mudstone). There may be limitations in different depths or other types of rock layers that could lead to deformations of surrounding rock not meeting regulatory requirements and potentially result in significant accidents.
Finally, the data and experiences accumulated during our research can provide a reference framework for construction in similar geological and environmental conditions. We believe that establishing a parameter database based on experiences from the Chongqing area could assist future researchers in more efficiently addressing construction challenges in other regions. Furthermore, we recommend that future research conduct comparative analyses to explore the impact of different geological conditions on the key parameters for station excavation, thereby enriching the current knowledge system.

7.2. Future Research Directions

In the future, we will further study the application of optimization algorithms in the design of construction parameter optimization [34,35]. With the continuous advancement of technology, integrating advanced optimization algorithms can significantly improve construction efficiency and safety. Researchers may consider developing more intelligent optimization tools that not only provide decision support for engineers but also have the ability to self-learn and improve through methods like machine learning, thus more effectively adapting to complex engineering environments. Additionally, it is worthwhile exploring the application of optimization algorithms in this field, such as genetic algorithms, particle swarm optimization, decision trees (DT), random forests (RF), extreme gradient boosting (XG Boost), and adaptive boosting (AdaBoost), to meet the needs of different engineering projects. Future research can provide more comprehensive theoretical support and practical experience for the actual application of optimization algorithms, promoting continuous innovation and development in the engineering field.

8. Conclusions

To ensure the safety of metro stations during excavation, this study employs a combination of finite element numerical simulation and on-site measurements. A numerical model was established to simulate the entire excavation and support process under various working conditions, analyzing the effects of different excavation factors on surrounding rock deformation. Based on actual field conditions, appropriate excavation parameters were selected. The main conclusions are as follows:
(1)
Through simulation analysis, it was found that the horizontal displacement convergence value at the sidewalls exceeded 20 mm, indicating that the deformation results under the original excavation scheme might not fully satisfy the specification requirements. The deformation of the surrounding rock increased with the distance between the tunnel face and the initial support, as well as with the excavation step size. However, the number of pilot tunnels, after considering the interactions among different parameters, was found to help effectively control surrounding rock deformation. In contrast, the spacing between adjacent pilot tunnels had a relatively minor impact on station deformation.
(2)
Since the distance to the support and the excavation step size significantly influence deformation, the optimal excavation parameters were determined based on deformation control and the station’s construction modulus. The distance between the tunnel face and the initial support should not exceed 6 m, the excavation step size should be 1.5 m, the number of pilot tunnels should be 11, and the spacing between adjacent pilot tunnels should be 10.5 m. With these optimized parameters, the station’s horizontal convergence displacement essentially meets the requirements.
(3)
By comparing the on-site monitoring data with the simulation results, it was observed that the trends of the monitoring data during the actual construction process closely matched the predictions obtained from the optimized excavation parameters. Moreover, the numerical values showed a high degree of consistency, validating the reliability and feasibility of the proposed optimization scheme. These findings not only confirm the effectiveness of the implemented methodology but also provide valuable insights for software developers aiming to improve simulation tools and algorithms. Additionally, the research offers practical guidance for practicing engineers by highlighting the importance of integrating real-time monitoring data with predictive analysis to enhance decision-making and ensure construction safety.
(4)
In the future, related parameter optimization research could incorporate a combination of numerical simulation and artificial intelligence methods. The simultaneous optimization of excavation and support parameters should be explored to address the limitations in performance under multi-factor coupling effects.

Author Contributions

C.Z.: Conceptualization, Software, Investigation, Data Curation and Writing—Original Draft. X.H.: Investigation, Writing—Original Draft and Methodology. F.W.: Validation, Resources, and Writing—Review and Editing. M.H.: Visualization, Writing—Review and Editing, and Methodology. C.H.: Conceptualization, Formal Analysis and Visualization. J.G.: Validation, Resources, Supervision and Project Administration. All authors have read and agreed to the published version of the manuscript.

Funding

The authors acknowledge the University Science and Technology Innovation Team of Henan (No. 25IRTSTHN006), Cultivation project of “Double first-class” creation of safety discipline (No. AQ20240725), Enterprise Commissioned Project (No. H23-543), and Distinguished Young Scientists of Henan Polytechnic University (No. J2025-8) for financial support.

Data Availability Statement

The data that support the findings of this study are available from the corresponding author upon reasonable request.

Acknowledgments

The author is very grateful to the teachers for their help, to the financial support of the funding agencies, and to the reviewers for their valuable comments and suggestions to improve the quality of the papers.

Conflicts of Interest

Authors Fei Wang and Chanlong He were employed by the company CCCC-SHB Fourth Engineering Co., Ltd. The remaining authors declare that the research was conducted in the absence of any commercial or financial relationships that could be construed as a potential conflict of interest.

References

  1. Zheng, X.Q.; Xu, K.; Zhang, Y.F.; Yu, G.T.; Peng, W.B.; Chen, C.; Liu, D.X. Investigating the impact of blasting operations on dynamic disturbances in existing tunnels during additional tunnel construction. J. Saf. Environ. 2025, 25, 1789–1796. [Google Scholar]
  2. Wang, Z.; Wang, M.; Zhang, X.; Tong, J.J.; Liu, D.G.; Ma, Z.Z. Study on mechanical behaviors and spatiotemporal effects in mechanized large-section tunnelling. Mod. Tunn. Technol. 2025, 62, 229–239. [Google Scholar]
  3. Wang, S.; Wang, B.; He, W. Mechanical characteristics of special-shaped structure during construction process of cut-and-cover four-line tunnel. J. Cent. South Univ. Sci. Technol. 2023, 54, 1426–1437. [Google Scholar]
  4. Jiang, H.; Huang, W. Study on construction control scheme of new open-cut tunnel over existing metro tunnel. J. Railw. Sci. Eng. 2021, 18, 1231–1239. [Google Scholar]
  5. Liu, L.; Xue, F.; Liu, C. Three-lane super large section rectangular pipe-jacking tunnel underpassing Nanhu Avenue in Jiaxing, China. Tunn. Constr. 2021, 41, 1612–1625. [Google Scholar]
  6. Song, Z.; Li, X.; Zhang, Y.; Zhong, S.; Shi, W. Review and prospect of the mining construction methods for subway stations in China. Mod. Tunn. Technol. 2025, 62, 1–15. [Google Scholar]
  7. Wei, X.; Fan, Z. Discussion on the design of deep-buried metro stations in loess strata. Build. Struct. 2022, 52, 303–307. [Google Scholar]
  8. Diao, G.; He, X. Key technology of local underground and enlarged excavation construction of subway open-cut station underpassing existing buildings. J. Jilin Univ. Earth Sci. Ed. 2025, 55, 536–549. [Google Scholar]
  9. Dai, Z.; Hu, R.; Yang, Z.; Li, X. Key technologies for shallow-buried metro station construction using the NATM method in sandy-gravel strata. J. Railw. Eng. 2024, 41, 83–89. [Google Scholar]
  10. Zhou, X.J.; Pan, Y.; Qin, J.J.; Gardoni, P. Spatio-temporal prediction of deep excavation-induced ground settlement: A hybrid graphical network approach considering causality. Tunn. Undergr. Space Technol. 2024, 146, 105605. [Google Scholar] [CrossRef]
  11. Tabaroei, A.; Sarfarazi, V.; Moaveni, M.; Vakili, A.H.; Pham, T. Deep excavation–induced stability evaluation of a triple tunnel using discrete and continuum numerical modeling. Int. J. Geomech. 2025, 25, 04024299. [Google Scholar] [CrossRef]
  12. Islam, M.S.; Iskander, M. Ground settlement caused by perpendicularly crossing twin tunnels: A parametric study. Tunn. Undergr. Space Technol. 2024, 146, 105657. [Google Scholar] [CrossRef]
  13. Kim, D.; Jeong, S. Estimation of the excavation damage zone in TBM tunnel using large deformation FE analysis. Geomech. Eng. 2021, 24, 323–335. [Google Scholar] [CrossRef]
  14. Liu, B.; Li, T.; Chang, W.; Han, Y.; Fu, C.; Yu, Z. Mechanical response of horseshoe-shaped tunnel lining to undercrossing construction of a new subway station. Tunn. Undergr. Space Technol. 2022, 128, 104652. [Google Scholar] [CrossRef]
  15. Liu, B.; Yu, Z.; Han, Y.; Wang, Z.; Yang, S.; Liu, H. A simplified combined analytical method for evaluating the effect of deep surface excavations on the shield metro tunnels. Geomech. Eng. 2020, 23, 405–418. [Google Scholar] [CrossRef]
  16. Wang, T.; Deng, T.; Deng, Y.; Yu, X.; Zou, P.; Deng, Z. Numerical simulation of deep excavation considering strain-dependent behavior of soil: A case study of Tangluo Street Station of Nanjing Metro. Int. J. Civ. Eng. 2023, 21, 541–550. [Google Scholar] [CrossRef]
  17. Li, Z.; Han, M.; Liu, L.; Li, Y.; Yan, S. Corner and partition wall effects on the settlement of a historical building near a supported subway excavation in soft soil. Comput. Geotech. 2020, 128, 103805. [Google Scholar] [CrossRef]
  18. Giardina, G.; Losacco, N.; De Jong, M.J.; Viggiani, G.M.; Mair, R.J. Effect of soil models on the prediction of tunnelling-induced deformations of structures. Proc. Inst. Civ. Eng.-Geotech. Eng. 2020, 173, 379–397. [Google Scholar] [CrossRef]
  19. Xu, L.; Xu, Y.; Wang, C.; Feng, K. Data-driven deformation reliability of retaining structures in deep excavations considering measurement error. Appl. Sci. 2019, 9, 5466. [Google Scholar] [CrossRef]
  20. Chen, H.; Li, J.; Yang, C.; Feng, C. A theoretical study on ground surface settlement induced by a braced deep excavation. Eur. J. Environ. Civ. Eng. 2022, 26, 1897–1916. [Google Scholar] [CrossRef]
  21. Morovatdar, A.; Palassi, M.; Ashtiani, R.S. Effect of pipe characteristics in umbrella arch method on controlling tunnelling-induced settlements in soft grounds. J. Rock Mech. Geotech. Eng. 2020, 12, 984–1000. [Google Scholar] [CrossRef]
  22. Pedro, A.M.G.; Zdravković, L.; Potts, D.; Sousa, J.A. Derivation of model parameters for numerical analysis of the Ivens shaft excavation. Eng. Geol. 2017, 217, 49–60. [Google Scholar] [CrossRef]
  23. Clayton, C.R.I.; Van Der Berg, J.P.; Thomas, A.H. Monitoring and displacements at Heathrow Express Terminal 4 station tunnels. Géotechnique 2006, 56, 323–334. [Google Scholar] [CrossRef]
  24. Whittle, A.J.; Corral, G.; Jen, L.C.; Rawnsley, R.P. Prediction and performance of deep excavations for Courthouse Station, Boston. J. Geotech. Geoenvironmental Eng. 2015, 141, 04014123. [Google Scholar] [CrossRef]
  25. Wang, X.; Wang, C. Exploration and practice of a new NATM construction method for large-span metro stations in urban areas. Urban Rail Transit Res. 2025, 28, 66–71+79. [Google Scholar]
  26. Cheng, M. Study on construction methods and mechanical characteristics of large metro stations in expansive soil strata in Chengdu. Urban Rail Transit Res. 2024, 27, 155–160. [Google Scholar]
  27. Liu, X.; Wang, G.; Sun, D.; Liu, C.; Zhang, N. Analysis of deformation patterns during excavation using the top-down method for deep foundation pits of metro stations in sandy soil areas. Urban Rail Transit Res. 2024, 27, 91–96. [Google Scholar]
  28. Yeow, H.C.; Nicholson, D.; Man, C.L.; Ringer, A.; Glass, P.; Black, M. Application of observational method at Crossrail Tottenham Court Road station, UK. Proc. Inst. Civ. Eng.-Geotech. Eng. 2014, 167, 182–193. [Google Scholar] [CrossRef]
  29. Zeng, C.F.; Song, W.W.; Xue, X.L.; Li, M.K.; Bai, N.; Mei, G. Construction dewatering in a metro station incorporating buttress retaining wall to limit ground settlement: Insights from experimental modelling. Tunn. Undergr. Space Technol. 2021, 116, 104124. [Google Scholar] [CrossRef]
  30. Zhang, L.; Liu, W.; Wu, X.; Skibniewski, M.J. Simulation-hybrid approach to protecting aging bridges against nearby tunnel excavation. J. Perform. Constr. Facil. 2018, 32, 04018052. [Google Scholar] [CrossRef]
  31. Zeng, C.F.; Powrie, W.; Chen, H.B.; Wang, S.; Diao, Y.; Xue, X.L. Ground behavior due to dewatering inside a foundation pit considering the barrier effect of preexisting building piles on aquifer flow. J. Geotech. Geoenvironmental Eng. 2024, 150, 05024004. [Google Scholar] [CrossRef]
  32. Li, P.; Liu, X.; Jiang, X. Investigation of the first quasi-rectangular metro tunnel constructed by the 0-θ method. Front. Struct. Civ. Eng. 2023, 17, 1707–1722. [Google Scholar] [CrossRef]
  33. Lin, B.; Xie, W.; Liu, L.; Xu, X. Study on the stability of surrounding rock and initial support structure of plane crossing tunnel. Highway Transp. Sci. Technol. 2022, 39, 115–122. [Google Scholar] [CrossRef]
  34. Yari, M.; Armaghani, D.J.; Maraveas, C.; Ejlali, A.N.; Mohamad, E.T.; Asteris, P.G. Several tree-based solutions for predicting flyrock distance due to mine blasting. Appl. Sci. 2023, 13, 1345. [Google Scholar] [CrossRef]
  35. Maraveas, C.; Asteris, P.G.; Arvanitis, K.G.; Bartzanas, T.; Loukatos, D. Application of bio and nature-inspired algorithms in agricultural engineering. Arch. Comput. Methods Eng. 2023, 30, 1979–2012. [Google Scholar] [CrossRef]
Figure 1. Overview of Qixinggang station: (a) General description of the station; (b) Surrounding environment of the project.
Applsci 15 10218 g001
Figure 2. Engineering site geological profile schematic diagram.
Applsci 15 10218 g002
Figure 3. Three-dimensional model size and section monitoring point layout.
Applsci 15 10218 g003
Figure 4. Illustration of subway station excavation process.
Applsci 15 10218 g004
Figure 5. Displacement and stress characteristics of surrounding rock under the original excavation scheme: (a) Crown settlement; (b) Surface settlement; (c) Horizontal convergence; (d) Surrounding rock stress.
Applsci 15 10218 g005
Figure 6. Schematic diagram of plastic zone changes in surrounding rock at Key construction stages.
Applsci 15 10218 g006
Figure 7. The influence of the number of pilot tunnels on the displacement of the surrounding rock at the station: (a) Crown settlement; (b) Horizontal convergence.
Applsci 15 10218 g007
Figure 8. The influence of excavation advances on the displacement of surrounding rock at the station: (a) Crown and surface settlement; (b) Horizontal convergence.
Applsci 15 10218 g008
Figure 9. Influence of excavation spacing of adjacent pilot tunnels on the displacement of surrounding rock at the station: (a) Crown settlement and surface settlement; (b) Horizontal convergence.
Applsci 15 10218 g009
Figure 10. Influence of the distance from the tunnel face to the initial support on the displacement of surrounding rock at the station: (a) Crown settlement and surface settlement; (b) Horizontal convergence.
Applsci 15 10218 g010
Figure 11. The mean values and ranges under different levels of each factor.
Applsci 15 10218 g011
Figure 12. Optimized excavation scheme for the subway station: (a) Cross-sectional excavation diagram; (b) Longitudinal excavation diagram.
Applsci 15 10218 g012
Figure 13. Comparison of numerical simulation results between the original design and the optimized scheme: (a) Vault settlement; (b) Ground surface settlement; (c) Horizontal clearance convergence; (d) Surrounding rock stress distribution.
Applsci 15 10218 g013aApplsci 15 10218 g013b
Figure 14. Comparison of surrounding rock displacement and plastic zone change: (a) displacement change; (b) Plastic zone change.
Applsci 15 10218 g014
Figure 15. On-site monitoring layout method.
Applsci 15 10218 g015
Figure 16. On-site displacement monitoring curves: (a) Vertical displacement monitoring; (b) Horizontal clearance convergence displacement monitoring.
Applsci 15 10218 g016
Figure 17. On-site surrounding rock pressure variation monitoring curves.
Applsci 15 10218 g017
Table 1. Physical and mechanical parameters of field surrounding rock.
StratumThickness/mElastic Modulus/MPaPoisson RatioVolumetric Weight/kN/m3Force of Cohesion/kPaInternal Friction Angle/°
Plain fill6350.320525
Mid-weathering sandstone1835500.1225.1185043.6
Mid-weathered sandy mudstone1917500.3725.650033.3
Mid-weathering sandstone735500.1225.1185043.6
Mid-weathered sandy mudstone10017500.3725.650033.3
Table 2. The physical and mechanical parameters of the station’s supporting structure.
Support CategorySupporting FormsLayout SpecificationsElastic Modulus/GPaPoisson RatioVolumetric Weight/kN/m3
Initial supportAnchor barФ25 mm; circumferential directions: 1 m; radial direction: 1 m; length 3 m2060.2578.5
Mat ReinforcementDouble layer steel mesh: Ф8 mm; distance: 200 × 200 mm; Thickness: 0.35 m20678.5
Sprayed ConcreteThickness: 0.35 m28.50.224
Grid steel frameH280 × H240; distance: 1 m2100.378.5
Secondary liningModel-building ConcreteThickness: 0.8 m33.50.2526
Steel barФ22 mm2060.33
Table 3. Optimization design of key technical parameters of station excavation.
NumberNumber of Pilot Tunnel Excavation/UnitsExcavation Footage of Each Pilot Tunnel/mAdjacent Pilot Tunnel Construction Distance/mInitial Support Distance/m
180.754.53
291.57.54.5
3102.2510.56
411313.57.5
Table 4. Original excavation parameters of the metro station.
Excavation ParameterNumber of Pilot Tunnel Excavation/UnitsExcavation Footage of Each Pilot Tunnel/mAdjacent Pilot Tunnel Construction Distance/mInitial Support Distance/mNote
Value91.569Original scheme
Table 5. Influencing factors and excavation parameter level setting.
Excavation Parameter LevelInfluencing Factor
A: Number of Pilot Tunnel Excavation/UnitsB: Excavation Footage of Each Pilot Tunnel/mC: Adjacent Pilot Tunnel Construction Distance/mD: Initial Support Distance/m
180.754.53
291.57.54.5
3102.2510.56
411313.57.5
Table 6. Numerical simulation orthogonal test scheme and displacement results.
NumberInfluencing FactorHorizontal Convergence Displacement/mm
ABCD
a111124.56
b122229.16
c133332.33
d144444.31
e212324.70
f221428.64
g234121.03
h243222.85
i313426.24
j324331.32
k331231.59
l342132.52
m414235.84
n423133.52
o432441.40
p441338.22
Table 7. Optimized excavation parameters for the subway station.
Excavation ParameterNumber of Pilot Tunnel Excavation/UnitsExcavation Footage of Each Pilot Tunnel/mAdjacent Pilot Tunnel Construction Distance/mInitial Support Distance/mNote
Value111.510.56Optimization scheme
Table 8. Station monitoring measurement project control value.
NumberMonitoring ProgramControlled ValueThreshold
Integrated TotalRate of Change
1Crown settlement±30 mm±3 mm/d27 mm
2Horizontal clearance convergence±20 mm±2 mm/d18 mm
3Surface settlement±40 mm±4 mm/d36 mm
4Surrounding rock stress15.6 MPa0.8 fc
Disclaimer/Publisher’s Note: The statements, opinions and data contained in all publications are solely those of the individual author(s) and contributor(s) and not of MDPI and/or the editor(s). MDPI and/or the editor(s) disclaim responsibility for any injury to people or property resulting from any ideas, methods, instructions or products referred to in the content.