Abstract
Wine lees is a semi-solid suspension rich in yeast cells, representing a winemaking by-product that is rarely valorized after distillation. This study focuses on the exploitation of yeast-containing vinasse resulting after wine lees distillation by proposing optimized thermal extractions that can be potentially integrated with the current wine lees distillation workflow. Vinasse with different solids concentrations (10, 30, 50%) were treated at different temperatures (104, 108, 112 °C) and durations (20, 40, 60 min) using a pressure cooker device. The release of proteins, polysaccharides, and oligosaccharides from these pressure-assisted lab extractions were compared with that in untreated vinasse and vinasse treated with a previously proposed autoclave method. The resulting extraction appears to be generally preferable to the autoclave, which would require higher costs for energy and equipment. The obtained extraction process significantly enhanced the recovery of total proteins, oligosaccharides, and medium- to low-molecular-weight polysaccharides. Conversely, all heat treatments reduced the extraction of high-molecular-weight polysaccharides, indicating that these compounds should be directly extracted from untreated vinasse. These outcomes, along with the study of samples’ viscosity, density, and specific heat, allowed us to propose an integrated extraction plant set up that includes a crossflow filter and an industrial cooker. This set up aims to maximize the extraction of each valuable fraction, thereby better exploiting vinasse following a biorefinery approach.
1. Introduction
Wine production yields vast amounts of by-products, such as grape skins, seeds, stalks, and wine lees, which account for almost half of the processed grapes [1]. According to Commission Regulation (EC) No 555/2008 and Council Regulation (EC) No 491/2009 [2,3], these by-products must be collected and processed by distilleries to recover ethanol. Additionally, grape pomace (skins and seeds) is sold to other companies as a source of polyphenols, oil, and fibers [4,5,6]. The recovery of these fractions allows distilleries to increase their environmental and economical sustainability by acting as biorefineries [7]. The second most abundant by-product after grape pomace is wine lees, a viscous suspension mainly composed of yeast cells collected at the end of alcoholic fermentation and subsequent racking [8]. In Italy, one of the top wine-producing countries, accounting for almost 20% of the global production [9], about 300,000 t of lees are produced annually, leading to an estimated CO2eq emission of about 270,000 t [10]. After distillation to recover ethanol, wine lees are referred to as vinasse, a secondary by-product that still contains the yeast biomass that is originally present in the wine lees. Despite the potential value of vinasse’s solid fraction, the suspension is typically discarded without valorization, representing both a cost [11] and a loss of potentially valuable biomass as well as natural and human resources [12].
Being a yeast suspension, vinasse can potentially be exploited to produce valuable yeast extracts similar to the ones currently used as food additives and dietary supplements, usually made by pure yeast biomasses produced in bioreactors [8,13]. Previous studies have only explored the potential of wine lees prior to distillation (before becoming vinasse) as a source of yeast proteins and polysaccharides. The obtained extracts have been tested as potential food ingredients, displaying emulsifying, foaming, antioxidant, and wine stabilizing activities comparable to commercial or lab-made pure yeast extracts [8,14,15,16]. However, this approach has never been applied on vinasse which would represent the real waste for distillers. In vinasses, the removed ethanol is replaced by excess water, yielding a more diluted suspension with lower solids and reduced microbiological stability, thus requiring rapid stabilization or processing [17]. In the above-mentioned studies focusing on wine lees, the best-performing extracts were obtained through physical treatments (high pressure and temperature) using lab-scale equipment such as autoclaves and centrifuges. Despite being conventional technologies, these methods are not directly reproducible in an industrial context. This issue is common to many other laboratory-scale procedures aimed at demonstrating the feasibility of obtaining valuable extracts from specific by-products. However, the transition from laboratory to industrial scale poses an important challenge for the practical implementation of developed methods [18]. In many cases, trials typically conclude at a Technology Readiness Level (TRL) between three and four, according to the ISO 16290 [19] classification, with only a fraction of proven concepts successfully transitioning to industrial applicability, leading to what is commonly referred to as the “valley of death” [20,21]. To progress through these stages towards a rational industrial production process, further information and efforts are essential.
Hence, the objective of this study is to provide the knowledge and technical foundation for transitioning the physical extraction of yeast-derived compounds from vinasse from laboratory to industrial scale. Specifically, the study seeks to identify optimal operational conditions by evaluating the influence of key process parameters—temperature, time, and solids concentration—on extraction efficiency. Using the response surface methodology (RSM), the recovery of target compounds (proteins and different fractions of polysaccharides and oligosaccharides) will be modeled to define process conditions that are compatible with industrial-scale, cost-effective heating systems as alternatives to autoclave-based extraction, which serves as the benchmark. Additionally, the study aims to characterize the physical properties of vinasse before and after extraction to inform the design of suitable transport and thermal exchange systems. Ultimately, the goal is to propose a potential plant configuration that can be integrated into current distillery workflows, leveraging existing infrastructure to enable an efficient and sustainable scale-up of this valorization strategy.
2. Materials and Methods
2.1. Chemicals
Unless otherwise specified, all reagents were purchased from Merck (Darmstadt, Germany) and had a purity > 99%. Ethanol and hydrochloric acid (37%) were obtained from Carlo Erba Reagents (Val-de-Reuil, France). Ammonium formate was provided by VWR International (Radnor, PA, USA). Pullulans of different molecular weights (342–805,000 Da), as well as pectin and dextran standards, were obtained from Agilent Technologies (Santa Clara, CA, USA). Bovine serum albumin (BSA) standard was purchased from Pierce Biotechnology (Waltham, MA, USA). All solutions and dilutions were prepared using ultrapure water (Milli-Q, Millipore, Burlington, MA, USA).
2.2. Experimental Design and Statistical Analyses
Two separate trials were carried out to determinate the effect of the proposed extraction method. In the first trial, 3 different methods were compared: t0 (untreated vinasse), pressure-assisted lab extraction (PALE) using 108 °C, 40 min, 30% solids concentration, and the previously validated Autoclave extraction (121 °C, 20 min, 10% solids concentration) [15]. Each extraction was performed in triplicate, and differences among treatments were assessed by ANOVA followed by Tukey’s post hoc test (p < 0.05).
Then, after temperature and initial vinasse concentration, a second trial was performed by repeating the PALE at different temperatures (104 °C, 108 °C, and 112 °C), duration (20 min, 40 min, and 60 min), and solids concentration (10%, 30%, and 50%).
The tested temperatures were selected to exceed 100 °C, which in previous studies was poorly efficient in destabilizing the yeast cell wall [22], but to remain below 121 °C, to propose conditions that could outperform the previously developed autoclave-based extraction [15] and be achievable with less expensive industrial equipment and fewer regulatory constraints (i.e., regarding UE Directive 2014/68; [23]). Extraction times started from 20 min, corresponding to the of the autoclave method [15], and were then doubled and tripled (40 and 60 min) to compensate for the lower temperatures of the PALE compared to autoclaving; longer durations were not considered due to potential energy costs. The 10% solids content was representative of vinasse directly exiting the distillation column (as in the untreated reference sample), whereas 30% and 50% were chosen to balance the benefits of reduced processing volumes, which could lower plant size and costs, as well as the need to maintain a sufficient liquid phase to ensure solubilization of yeast-derived compounds.
The experimental design followed a Box–Behnken approach comprising three factors, each tested with three replications of the central point. Data analysis was conducted using the response surface methodology (RSM) in accordance with guidelines outlined in the NIST handbook of statistical methods [24]. Full second-order polynomial models were fitted, including first order (linear) terms, two-way interactions and pure quadratic terms for the three factors. ANOVA for each fitted model used sequential (Type I) sums-of-squares to partition total variability into first-order, two-way interaction and pure quadratic components, plus residual error. The residual sum-of-squares was further partitioned into lack-of-fit and pure-error components by exploiting the replicated central points; the lack-of-fit F-test therefore compares the model residual mean square to the pure-error mean square. Model as-assumptions (normality of residuals, homoscedasticity and independence) were checked by an inspection of diagnostic plots. Term selection followed a backward-elimination strategy at α = 0.05 while preserving effect hierarchy; non-significant terms were pooled into the residual, and the reduced model was refitted for inferential reporting. Model adequacy was assessed reporting the overall F statistic and p-value, R2 and adjusted R2. Stationary points and eigen analysis of the quadratic form were computed to characterize the nature (maximum/minimum/saddle) of any stationary response. All extractions conducted in this study are reported in Table 1.

Table 1.
Different extraction conditions applied. “t0” refers to the vinasse collected right after the distillation (untreated); “Autoclave” refers to the autoclave-based method applied in a previous study [15]; “PALE 1st trial” and “PALE 2nd trial” extractions refer to the different time/temperature/solids concentration tested.
2.3. Vinasse Recovery and Microscopy Analysis
Vinasse obtained from the distillation of wine lees originating from both red and white vinifications, collected from different wineries, were supplied by the Acquavite distillery (Vazzola, Italy) and kept at 4 °C until use. The vinasse had an initial concentration of 10% in solids. This concentration remained approximately constant over different batches sampled between November and December 2023, as observed during the preliminary trials conducted to set up this work (CV = 3.36 %). A microscopic analysis was performed on untreated vinasse using an optical microscope (Leica DM2000 LED; Leica Microsystems, Wetzlar, Germany) set at magnification 40× to observe the presence of yeasts and to provide an indication of particle size by comparison with the dimension scale bar added using the LAS X software (version 4.8.0; Leica Microsystems, Wetzlar, Germany).
2.4. Extraction Methods
The t0 extraction consisted of sampling the vinasse suspensions immediately after they exited the distillation column. The Autoclave extraction, a previous protocol developed on wine lees (before distillation) was conducted according to the reference [15,16], just replacing wine lees with the same untreated vinasse of t0. Pressure-assisted lab extractions were conducted using a commercial cooker (CY505E10 Cooker, Tefal, Rumilly, France), which facilitated precise control over both temperature and extraction time. Temperature regulation of the aqueous solutions utilized was achieved by adjusting the extraction pressure, a function performed automatically by the cooker. Specifically, temperatures of 104 °C, 108 °C, and 112 °C corresponded to absolute pressures of 1.17 bar, 1.34 bar, and 1.53 bar, respectively, as determined from the saturated vapor table [25]. This information aligns with the pressure settings outlined in the cooker’s user manual provided by the manufacturer. The cooker was loaded with 1.2 L of vinasse suspension. Solids concentrations exceeding 10% were attained using a laboratory centrifuge (Hermle Z326K, Wehingen, Germany) operating with 221.12 V03 rotor and 1 L batches at 3350× g for 15 min at 18 °C. The required volume of 1.2 L at the desired concentration was achieved through successive centrifugations.
2.5. Determination of Viscosity, Density, and Specific Heat
Viscosity was measured on the different vinasse suspensions with the ViscoQC 300 viscosimeter (Anton Paar GmbH, Graz, Austria). Vinasse was first vigorously shaken for 1 min to ensure that residue was uniformly distributed within the container. For each sample, 500 mL were filled into a 600 mL beaker. To determine the rheological behavior of the vinasse, three samples were selected before extraction as representatives of the three different concentrations (10%, 30%, 50%). On each of these samples, viscosity measurements were repeated 8 times, on a speed ramp between 150 and 220 rpm with a 10 rpm increase. Then, to determinate the viscosity of all the samples, measurements were performed at 200 rpm for 1 min. Spindles L1 and L2 were used based on the sample type. The L1 cylinder spindle (2 cm diameter; 6.5 cm height) was used for most samples, while the L2 disk spindle (2 cm diameter; 0.7 cm height) was chosen for higher viscosity materials. Temperature was monitored with a PT100 probe.
Density was calculated based on the ratio of mass to volume of the substance. For each sample, a 100 mL volumetric flask was filled with the substance and weighed by means of a BIL 6 scale, with 0.1 g division. Density values were computed by dividing the weight of the sample by the fixed volume of 100 mL.
Specific heat of vinasse (CL) was measured using a mixtures calorimeter. The apparatus consisted of an insulated container of 500 mL capacity, equipped with a PT100 temperature probe. A stainless-steel cylinder with a mass of 300 g was used as reference material, previously heated to 40 °C. Stainless steel specific heat (CS) was 502 J·kg−1·K−1. Measurements were performed for each sample, applying the following standard procedure. After pouring the vinasse in the calorimeter, starting temperature and weight were noted. Then, the stainless-steel cylinder was placed inside the calorimeter and the system was closed. Temperature was then monitored until the system reached thermal equilibrium. Specific heat of the vinasse (CL) was calculated according to Equation (1).
where Cs is the specific heat of the stainless-steel cylinder expressed in kJ·kg−1·°C−1, MS is the mass of the stainless-steel cylinder, TS is the initial temperature of the stainless-steel cylinder, TE is the equilibrium temperature, Mv is the mass of the vinasse, and Tv is the initial temperature of the vinasse. Masses were expressed in kg, while temperatures were in °C.
2.6. Saccharides Quantification
Vinasse (2 mL) were centrifuged using a Universal 320 R Centrifuge (Andreas Hettich GmbH, Tuttlingen, Germany) equipped with swing-out rotor n.1617 (3857× g, 15 min, 4 °C), and 1 mL of supernatant was collected and freeze-dried. The so-obtained powder was then solubilized in 0.2 mL of ultrapure water and 1 mL of cold acidified ethanol (0.3 M HCl). This suspension was then refrigerated overnight at 4 °C. Subsequently, the precipitated polysaccharides were separated via centrifugation using a Universal 320 R Centrifuge (Andreas Hettich GmbH, Tuttlingen, Germany) equipped with angle rotor n. 1552 (19,065× g, 10 min, 4 °C), washed one time with pure ethanol, and centrifuged again. The washed pellet was then solubilized in 1 mL of 50 mM ammonium formate and transferred into an HPLC vial. Quantification and characterization of polysaccharides were performed using high-resolution size-exclusion chromatography (HR-SEC) employing an Agilent 1260 series II quaternary pump LC system (Agilent Technologies, Santa Clara, CA, USA), following a previously established protocol [15,16,26]. Briefly, 10 μL of the sample were injected and separated isocratically (0.6 mL/min for 36 min, RID temperature 35 °C) using a PL-Aquagel-OH 50 gel permeation column (Agilent Technologies, Santa Clara, CA, USA). Pullulans with different dimensions (342–805,000 Da) (Merck, Darmstadt, Germany) were employed as MW standards, while polysaccharide quantification was accomplished through a calibration curve built with pectin and dextran (0–2 g/L).
2.7. Protein Quantification
Total soluble proteins were quantified with the Bicinchoninic acid (BCA) assay by using a specific kit (Pierce Biotechnology, Waltham, MA, USA), following the procedure indicated by the producer without modifications and conducted in triplicate. Prior to the analysis, samples were prepared by centrifuging (3857× g, 15 min, 4 °C) each vinasse suspension and by diluting the supernatants 20 times with ultrapure water. The calibration curve was built using the BSA standard (Pierce Biotechnology, Waltham, MA, USA), also diluted with ultrapure water covering the range of 0–2 µg/mL.
3. Results and Discussion
3.1. Density, Specific Heat, and Viscosity of the Extracted Suspension
Vinasse’s physical properties (density, specific heat, and viscosity) were measured as key parameters to consider for scaling up the tested extraction to pilot- and industrial-scale processing systems. These properties influence heat transfer efficiency, fluid flow behavior, pumping requirements, and overall energy consumption in processes such as heat exchangers and fluid transport pipelines [27]. Therefore, understanding how extraction methods and conditions affect these properties is an essential step in scaling up the proposed valorization strategy.
Regarding density, no significant differences in density were found between the extractions conducted using the three methods tested, namely PALE, t0, and Autoclave. Similarly, variations in temperature, time, and initial concentration within the experimental plan did not lead to significant changes in density. The average density value across all the PALEs was 1026 ± 4 kg/m3. The density of the vinasse suspension before treatment (t0) was 1022 ± 5 kg/m3, while the suspension extracted using the Autoclave method had a density of 1024 ± 5 kg/m3. Additionally, no significant differences in specific heat were observed within the experimental plan extractions or between the experimental plan extractions and the t0. The average specific heat value was 4.307 ± 0.214 kJ kg−1K−1.
The RSM model for viscosity was found to be statistically significant for the first-order terms (p = 0.02), while the lack-of-fit probability exceeded the 0.05 significance threshold. Therefore, we obtained a statistically valid model with model significance p = 0.02.
Supplementary Figure S1 depicts the change in viscosity according to extraction time, extraction temperature, and vinasse concentration. Among these variables, temperature and time did not significantly impact viscosity. As expected, the strongest impact on viscosity was provided by the vinasse’s solids concentration (p < 0.01). From the literature [28], two different models can be applied: the Einstein relation (Equation (2)) and a generic exponential relation (Equation (3)).
where µ is the viscosity of the suspension, c is the concentration of the suspension, µ0 is the viscosity of the solution, and a, α, and β are characteristic coefficients. Testing the Einstein relation resulted in a statistically significant model (p < 0.01) with a reasonable coefficient of determination (R2 = 0.53). However, the predicted intercept µ0 of the model is −12.5 mPa·s, which is a meaningless result (i.e., a negative viscosity of the solution). The Einstein relation is based on three assumptions, the third being a low concentration where particles do not interact with each other. Results suggest that our samples may have violated this assumption. The generic exponential relation showed a higher coefficient of determination (R2 = 0.66) and a statistically significant model (p < 0.001). The estimated coefficients were α = 4.336 ± 1.345 mPa·s, representing the viscosity at a concentration equal to zero, and β = 4.61 × 10⁻² %−1, the sensitivity of viscosity to an increase in concentration.
The viscosity values observed in our vinasse samples (≈40 mPa·s) are within the broad range reported for similar fermentation by-products. For example, Lachman and colleagues reported viscosities around 100 mPa·s for wine lees with higher solids content, while [29,30] indicated a range between 1 and 100 mPa·s for wine vinasse depending on concentration and processing stage. Such differences are largely attributable to compositional parameters including solids content, pH, and ionic strength, which influence water structuring and intermolecular interactions. These observations align with our data, where vinasse samples with elevated soluble solids and electrical conductivity displayed higher viscosity at constant temperature.
It is also known that highly concentrated suspensions change their rheological behavior from Newtonian to non-Newtonian (e.g., Herschel–Bulkley in the case of high concentrations of wine lees [29,31]), and understanding the rheological behavior of the suspension is necessary for designing industrial processing equipment. In our experimental conditions, the most concentrated suspension contained 9.03% dry matter—below the approximate 10% threshold indicated by Friso as a rule of thumb for Newtonian behavior [28]. Moreover, when tested at different rotational speeds, no significant deviations from linearity were observed, and the viscosity remained essentially constant across the tested range. The Newtonian models provided an excellent fit to the data, with coefficients of determination of 0.9993, 0.9975, and 0.9987 for 10%, 30%, and 50% volumetric concentrations of solids, respectively. Therefore, for the purposes of our study and within the tested experimental range, the fluids can be reasonably approximated as Newtonian, avoiding the need for more complex constitutive models.
3.2. Characterization of the Extracts
3.2.1. Saccharides
Being the principal component of the yeast cell, saccharides are the main class of compounds extractable from yeast by-products as vinasse [32]. This fraction is expected to be essentially composed of β-glucans and mannoproteins, the two main components in the yeast cell wall which can be applied as high-value additives in different industrial sectors [8,14]. Indeed, β-glucans, a dietary fiber, can be used to enrich foodstuffs by increasing their fiber content or as thickeners and fat replacers in low-calorie products. These compounds are also known to have multiple bioactive properties that make them valuable when sold as dietary supplements or within pharmaceutical products [33]. On the other hand, mannoproteins (10% protein; 90% mannose) are commonly applied to wine as stabilizers, foam and mouthfeel enhancers [34], but also studied for their possible application as emulsifiers and foaming agents in vegan foods [35,36]. Both these polysaccharides are expected to be included in the here-obtained extracts at different molecular weights. Therefore, saccharides, intended as polysaccharides (1100–7.5 kDa) and oligosaccharides (7.5 kDa–1 kDa), fractions have been studied by analyzing their different MW fractions.
Firstly, the efficacy of the two extraction methods (PALE and Autoclave) against the untreated control (t0) was assessed using one-way ANOVA followed by Tukey’s HSD test, which showed that both methods significantly increased (p = 0.02) the extraction of total saccharides from 26.49 g/L in the control (t0) to 28.15 g/L with the Autoclave method and 29.79 g/L with the PALE method.
To study the impact of the various conditions in the PALEs, RSM was applied on the PALE second trial samples. The model was valid (insignificant lack of fit), but the tested variables were not statistically significant. Therefore, for saccharides extraction, the most efficient combination requiring the least time, energy, and amount of vinasse involves an initial concentration of 10%, a temperature of 104 °C, and an extraction duration of 20 min.
Focusing only on the polysaccharides (PS, 1100–7.5 kDa), the RSM revealed a significant effect of the first-order terms (p = 0.04). This significance is attributed to the initial concentration of vinasse in the suspension (p = 0.01). The model is depicted in Figure 1, where the initial concentration is plotted against temperature (Figure 1a) and time (Figure 1b). The increase in the initial concentration resulted in a higher PS after extraction, as shown in Figure 1c. Furthermore, Figure 1c shows that the treatment in the cooker significantly improved the PS values compared to both t0 and the Autoclave method, irrespective of the choice of time, temperature, and vinasse initial concentration.
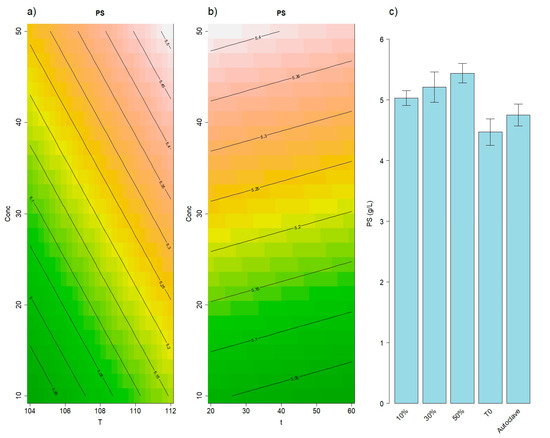
Figure 1.
Results of the RSM model for polysaccharides (1100–7.5 kDa). Panel (a) illustrates the effects of concentration and temperature, while panel (b) displays the effects of concentration and time. Panel (c) shows the average polysaccharides concentrations of various PALEs alongside the 2 reference methods: namely t0 and Autoclave. Error bars represent the standard deviations.
The RSM also successfully modeled the high-molecular-weight polysaccharides fraction (HMW, 1100–180 kDa), as shown in Figure 2a,b. This fraction is expected to be the one possessing the highest emulsifying and wine-stabilizing potential due to the presence of long-chain yeast mannoproteins, amphiphilic molecules that can act as surfactants [15,16]. The lack of fit was not statistically significant, while the first-order terms of the model were statistically significant (p = 0.002). An increase in initial vinasse concentration was found to significantly elevate (p = 4.4 × 10⁻⁴) the HMW content after extraction. However, the t0 sample (untreated, with vinasse at 10% concentration) exhibited the same HMW concentration as the samples with 50% vinasse. Attempting to elucidate these results, it is noteworthy that vinasse exits from the distillation column at high temperatures (approx. 90 °C). A subsequent thermal treatment, regardless of temperature (p = 0.79 for the temperature coefficient in the developed model), may lead to HMW fraction degradation, a factor that may prevail over the release of new HMW polysaccharides from the cell wall. This hypothesis seems to be confirmed by results of the Autoclave extraction which, being the treatment applying the highest temperature, shows the lowest HMW content (Figure 2c). The limited extraction of polysaccharides such as yeast β-glucans under Autoclave conditions is consistent with previous findings, where milder techniques like accelerated yeast autolysis allowed for the recovery of higher amounts of β-glucans compared to autoclaving or other physical methods that may induce degradation [37]. Even if the effect of treatment time is less evident, the time coefficient in the RSM model displayed a negative slope (p = 0.08), suggesting that longer thermal treatments may also result in increased HMW degradation. The thermal sensitivity of β-glucans has also been documented in other studies, which reported a significant reduction—up to 50%—in the high-molecular-weight fraction following cooking [38].
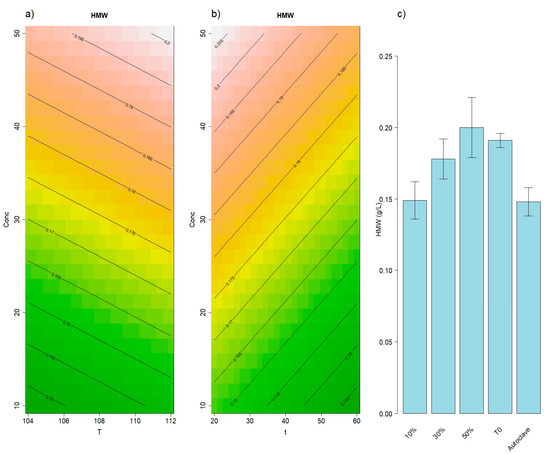
Figure 2.
Results of the RSM model for high MW polysaccharides (1100–180 kDa). Panel (a) illustrates the effects of concentration and temperature, while panel (b) displays the effects of concentration and time. In panel (c), average high MW concentrations of different PALEs alongside the 2 reference methods: t0 and Autoclave. Error bars represent the standard deviations.
Therefore, to maximize the recovery of the HMW fraction, the most efficient and pragmatic approach appears to be separation of vinasse from the solution at the distillation column exit (t0). The fact that this fraction is both the richest in surface-active and stabilizing mannoproteins and the most easily recoverable—being already extracted during distillation—is particularly relevant in view of a potential scale-up. If the valorization target is this fraction, lower investment requirements and strong synergies with the current distillation workflow can be envisioned in line with the integrated biorefinery concept [39].
Conversely, the release of medium-molecular-weight polysaccharides (MMW, 180–40 kDa) was significantly affected (p = 0.01) by the thermal extraction. Also, this fraction is expected to be rich in mannoproteins with tensioactive properties as indicated in previous studies obtaining this fraction from wine lees and wine [15,40,41]. At the Tukey HSD post hoc test, the PALE method was found to significantly improve the MMW content compared to the t0 and Autoclave methods. The RSM model did not exhibit a statistically significant lack of fit and the first-order terms for time (p = 0.02) and initial concentration (p = 0.01) were statistically significant.
Figure 3 reported the obtained RSM for medium MW polysaccharides. The estimated time coefficient was negative (p = 0.02), resulting in a lower extraction of MMW fraction as the extraction time increased, suggesting that as HMW, this fraction is also exposed to degradation when treatment conditions become more severe. The initial concentration coefficient was positive (p = 0.04), resulting in a higher extraction when the vinasse’s solids content was higher than 10%. For the MMW fraction, the best results were obtained at short time and higher solids concentration. Since temperature did not significantly impact the release of MMW, it is recommended to apply 104 °C, the lowest temperature studied here, as this would reduce the overall energy consumption of the process. Selecting the lowest effective temperature is a key strategy for improving the economic and environmental sustainability of industrial processes, aligning with principles of energy efficiency and cost reduction.
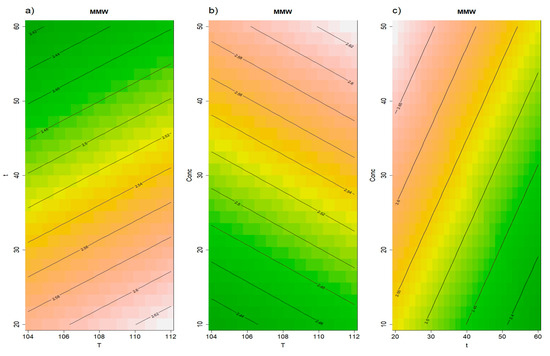
Figure 3.
Results of the RSM model for medium MW polysaccharides (180–40 kDa). Panel (a) illustrates the effects of time and temperature, panel (b) displays the effects of concentration and temperature, while panel (c) shows the effects of concentration and time.
The low-molecular-weight yeast polysaccharides fraction (LMW, 40–7.5 kDa) is particularly interesting, as it is expected to contain soluble β-glucans which have been associated with immunomodulatory activity [42,43], as well as small mannoproteins previously indicated as promising foaming agents [15,44] and additives able to hinder wine polyphenol aggregation [45,46]. The release of this fraction from the yeast cells significantly increased (p = 0.002), with the extractions compared to the t0. In fact, after the distillation column (t0) 1.925 ± 0.106 g/L of LMW were present in the vinasse’s supernatant, while this concentration increased to 2.399 ± 0.132 g/L after Autoclave extraction and to 2.438 ± 0.090 g/L after PALE. The RSM model was valid, with not significant lack of fit and a significant first order model (p = 0.02). Temperature (p = 0.04), time (p = 0.07), and initial concentration (p = 0.04) coefficients were positive, indicating that the higher the setting for each condition, the higher the extraction of LMW polysaccharides in the solution (Figure 4).
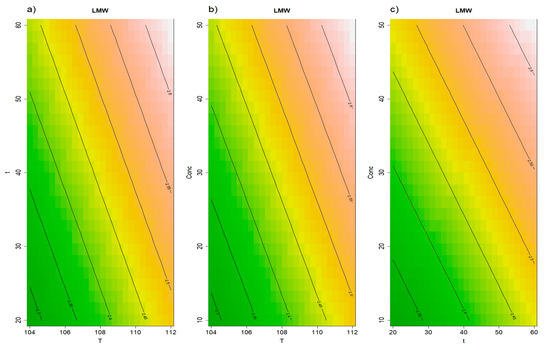
Figure 4.
Results of the RSM model for low MW polysaccharides (40–7.5 kDa). Panel (a) illustrates the effects of time and temperature, panel (b) displays the effects of concentration and temperature, while panel (c) shows the effects of concentration and time.
Finally, the release of the oligosaccharides fraction (7.5–1 kDa) resulted in significantly increased (p = 0.03) with the PALE (19.35 ± 0.40 g L−1) than in t0 (17.38 ± 0.66 g L−1). On the other hand, no significant difference was found between PALE and Autoclave (18.47 ± 0.85 g L−1) and between Autoclave and t0. The RSM model was valid, but the terms were not significant. Hence, in the tested range, neither time, temperature, nor initial concentration was found to affect the oligosaccharide content in the extracted solution. This fraction is expected to contain short chain mannoproteins and β-glucans which, in previous study, have been indicated to be bioactive supplements in animal feed [47,48].
3.2.2. Proteins
Yeast by-products are also known to be a good source of proteins with high biological value, to be used in food and feed supplements or as taste enhancers [49,50,51]. Maximizing their solubilization would also be important to enhance the purity of the different polysaccharides extracts: an aspect that, in previous studies, has been addressed by applying an enzymatic hydrolysis to ensure the removal of proteins from extracted β-glucans [52,53]. In this case, the PALE method provided a significantly higher recovery in proteins (14.26 ± 0.39 g/L), followed by the Autoclave method (12.39 ± 0.89 g/L), and by the t0 (7.15 ± 0.70 g/L). The RSM model was valid (insignificant lack of fit), and the second order terms of the model were statistically significant (see Supplementary Text S1 for the model equation). Hence, the maximum protein extraction (15.07 ± 0.15 g/L) was achieved at 110 °C, 29.6 min, and 18.2% concentration (Figure 5). Lower temperatures and times probably led to a lesser yeast cell degradation and so a lower proteins release, while conditions more severe than the optimal may have induced the denaturation and consequent removal of proteins from the liquid extract, as noted in previous studies [52,53].
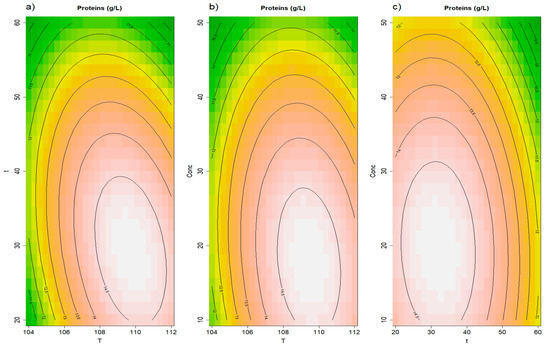
Figure 5.
Results of the RSM model for total proteins. Panel (a) illustrates the effects of time and temperature, panel (b) displays the effects of concentration and temperature, while panel (c) shows the effects of concentration and time.
4. Considerations for Scaling Up the Process
The results indicate that longer extraction times and higher temperatures promote the degradation of HMW and MMW polysaccharides, leading to an increased formation of LMW polysaccharides. This trend can be quantified by constructing a molecular weight index (MWI), which represents the change in polysaccharides’ molecular weight during extraction:
The MWI has been tested in a linear model with temperature and time, resulting in the model shown in Figure 6. The model has an R2 of 0.893, and both time and temperature show a positive angular coefficient, 3.0 × 10⁻³ (p < 0.001), and 6.5 × 10⁻³ (p = 0.004) for time and temperature, respectively, accounting for the shift in the extracted polysaccharides molecular weight due to temperature and time. To the best of our knowledge, changes in the MW of yeast polysaccharides at the here-tested times and temperatures have never been investigated. However, it seems plausible to think that, by increasing the treatment conditions, the already extracted polysaccharides are exposed to hydrolytic degradation. Indeed, the breaking of glucan chains in the cell wall is precisely the principle upon which the thermal extraction of yeast cell wall polysaccharides is based [37,54]. Therefore, it appears that the application of severe treatment conditions may increase the cell wall destabilization and the release of yeast polysaccharides, but also the partial degradation of their biggest fraction into low-molecular-weight compounds (Figure 6).
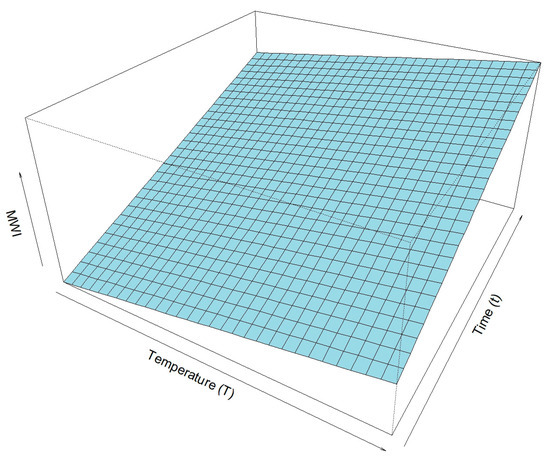
Figure 6.
Modeled effect of extraction temperature and time on the ratio between Low MW polysaccharides and Medium + High MW polysaccharides during the PALEs.
Furthermore, according to the obtained results, it is possible to design a plant layout suitable for the extraction of all the discussed fractions. A simplified schematic representation is shown in Figure 7.
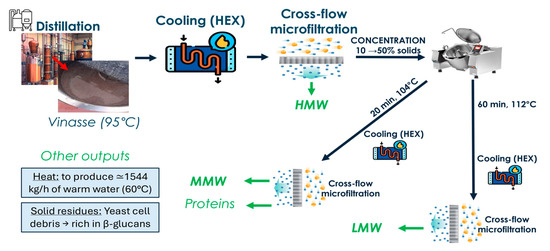
Figure 7.
Proposed plant layout for the simultaneous recovery of multiple valuable fractions from distillery vinasse. HMW: high-molecular-weight polysaccharides (1100–180 kDa); MMW: medium-molecular-weight polysaccharides (180–40 kDa); LMW: low-molecular-weight polysaccharides (40–7.5 kDa).
For HMW, the most suitable approach appears to be the recovery of the liquid fraction directly from the distillation column (t0). However, considering the limited number of separation systems suitable for use at 95 °C, and given our findings that increasing temperatures decrease the concentration of these substances, the vinasse needs to be cooled to near-ambient levels either by natural cooling or by using a heat exchanger. The latter option could standardize the cooling process, ensuring consistent cooling times and thereby improving the standardization of the recovered products, an essential feature for their commercial exploitation. Furthermore, the use of a heat exchanger allows for heat recovery. With the measured physical properties, and using 1000 kg/h of vinasse at 90 °C from the distillation column, while considering water to be heated at 15 °C, it is possible to produce up to 1544 kg/h of warm water at 60 °C. Regarding the choice of the heat exchanger type, the presence of 10% solids restricts the available options. However, a simple concentric tube heat exchanger could be employed for this purpose.
Regarding the solid/liquid separation system crossflow micro-filtration appears to be the most spread, controllable and flexible solution. Moreover, before thermal extraction, it would be necessary to concentrate the solids from 10% up to 50% (for MMW and LMW) or 18% (for proteins). Crossflow microfiltration offers the advantage of performing both water removal and component fractionation in a single operation, making it a promising choice for this step, given that vinasse solids are predominantly yeast cells (~5 µm) (Figure 8). Consequently, it appears as a first choice for future testing. Crossflow microfiltration is one of the most widespread, controllable, and flexible solid–liquid separation methods used in wineries and distilleries, where trained personnel and infrastructure are often already in place. For wine lees suspensions, intact yeast cells (~5 µm) and coarse fines are efficiently retained by membranes with nominal cut-offs between 0.2 and 1 µm, while most dissolved polysaccharides (e.g., mannoproteins and soluble β-glucans) are below the nominal pore size and would pass to the permeate in the absence of secondary fouling layers. Under these conditions, before the extraction, the permeate stream would be enriched in high-molecular-weight polysaccharides (HMW), while the retentate could be directed to subsequent thermal extraction to recover medium-(MMW) and low-molecular-weight (LMW) polysaccharides, oligosaccharides, and proteins.
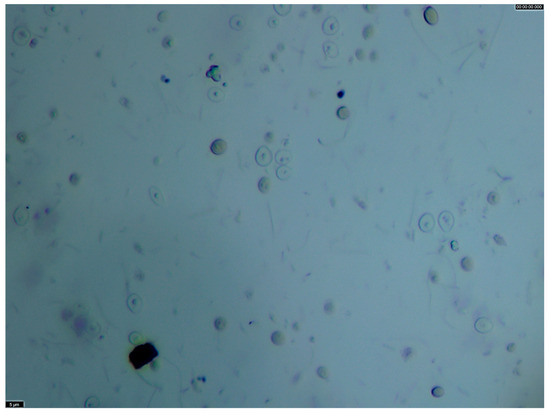
Figure 8.
Microscope capture (40×) of t0 vinasse sample.
In practice, however, colloidal material such as pectins and polyphenol–polysaccharide aggregates can form compressible cakes or gel layers that depress flux and cause “apparent” retention of macromolecules smaller than the membrane pores. On ceramic 0.2 µm modules, fouling propensity has been reported as pectins > tannins > mannoproteins, with mannoproteins showing a threshold-type fouling effect at higher concentrations [55]. Given the complexity of wine lees matrices and the known fouling mechanisms, dedicated pilot trials will be required to define the optimal separation conditions. Such tests should explore different membrane configurations, with a focus on ceramic (tubular or multichannel) modules that can withstand aggressive cleaning-in-place and backflushing. Future work should also address fouling control strategies, for example, by determining the critical flux through stepwise or permeate-flux methods and by evaluating the effect of high wall shear rates on limiting concentration polarization. Additionally, lightweight pretreatment options—such as sedimentation or centrifugation to remove coarse lees, or targeted pectinolytic/fining treatments when pectin/protein loads are high—should be assessed for their ability to improve flux and selectivity in crossflow microfiltration of wine lees streams [55,56].
To enhance the release of proteins and MMW and LMW polysaccharides, concentrated vinasse needs to be treated with temperature > 100 °C, thus requiring a device achieving overpressure. Since our trials showed no significant performance decrease between 112 °C and 121 °C, common devices such as industrial pressure cookers can appear to be suitable equipment for this operation. European Parliament’s Directive 2014/68/EU [23], known as the Pressure Equipment Directive (PED), regulates the construction of pressure equipment and applies when the working pressure exceeds 0.5 bar (50 kPa). Therefore, at temperatures slightly below 112 °C, the PED does not apply, whereas it is required for higher temperatures. Equipment certified for PED compliance has several requirements, resulting in increased costs. Since no significant difference was found for our purposes, the decision to slightly decrease the temperature to reduce equipment costs appears reasonable.
The cooker should be sized according to the concentration provided by the cross-flow filter. The extent of the concentration depends on the extraction purpose. For the highest yield of MMW and LMW, the best results were obtained at an initial concentration of 50%. Thus, 1000 kg/h at 10% should be separated into 800 kg/h of permeate and 200 kg/h of retentate at 50%. The cooker has to be consequently sized to treat this mass flow rate hourly.
In this set up, heat transfer occurs by convection. The convection coefficient depends on fluid speed, density, viscosity, conductivity, specific heat, and the geometry of the cooker. These variables are encapsulated in three dimensionless numbers: Prandtl, Nusselt, and Reynolds or Grashof (the first is used for forced convection, while the latter is used for natural convection). An increase in both Reynolds and Grashof numbers enhances the convection coefficient, and both numbers include viscosity in their denominator (squared in Grashof) [28]. Therefore, a solution with high viscosity, as in our case (between 40 and 45 mPa·s), results in a decreased convection coefficient and consequently reduced heat transfer within the fluid. These viscosity data directly informed our choice of direct steam injection over wall heating, even with agitation. Moreover, under these conditions, there is a risk of thermal inhomogeneity within the fluid and burning of the solid parts of the suspension. Thus, the cooker should be equipped with an agitator. Due to this poor heat conduction, the most reasonable way to heat the suspension is by direct injection of steam. In fact, heating the suspension from the cooker walls should be avoided due to the high viscosity, as this can increase the laminar flow thickness of the boundary layer near the wall, causing the adjacent solids to burn despite the presence of an agitator.
Finally, the treatment time–temperature settings were derived from our experimental degradation considerations: for maximum LMW yield, use the highest achievable cooker temperature with the longer extraction time (i.e., time and temperature had a significant positive coefficient in the developed RSM models—Figure 4); for MMW preservation (and maximum protein release), limit to the minimum time (i.e., time coefficient of the model was negative and significant—Figure 3). Oligosaccharides can be efficiently extracted under both regimes. In fact, as indicated by the experimental results, treatment time/temperature variables should be adjusted depending on whether the main target is the extraction of MMW or LMW polysaccharides. In the latter case, the highest temperature achievable with the cooker should be applied, with an extraction time of at least 60 min. Conversely, if the aim is to recover MMW, which can degrade into LMW during prolonged treatments (see Figure 3 and Figure 7), the extraction time should be reduced to approximately 20 min. This latter condition is also close to the combination that ensures the maximum release of proteins. As for oligosaccharides, they can be efficiently extracted under both treatment regimes.
Following the thermal treatment, standard techniques for cooling using a heat exchanger and solid–liquid separation by cross-flow microfiltration can be implemented. These operations can be carried out using the same equipment employed during the pre-heating phases. In this configuration—beyond the previously discussed heat recovery—it is also possible to recover the insoluble fraction retained by the cross-flow microfiltration. This fraction, primarily composed of yeast cell wall residues, represents a potential source of insoluble β-glucans, a type of dietary fiber that is already commercialized [57]. As shown in other studies, such material, derived from thermally treated yeast as in the present case, can be effectively purified from residual proteins through sequential washing and proteolytic enzyme treatment [52,53].
5. Conclusions
The valorization of post-distillation wine lees (vinasse) is a growing issue for many distilleries, where this by-product is primarily associated with a disposal cost. In this study, a previously developed lab-scale method for the autoclave extraction of yeast-derived polysaccharides and proteins was adapted with the aim of identifying parameters and design elements that could inform, rather than immediately define, an industrial process. Data modeling highlights the importance of tailored extraction conditions to selectively maximize the recovery of different yeast saccharides and protein fractions from vinasse. The results showed that, due to the high temperatures already reached during distillation, additional heat application is not required to recover the high-molecular-weight yeast polysaccharides, previously described as rich in foaming, emulsifying, and wine-stabilizing molecules. In fact, this fraction was found to be most abundant in untreated vinasse and decreased when additional thermal treatment was applied. On the other hand, moderate thermal treatments (below autoclave conditions) proved effective for extracting lower-molecular-weight polysaccharides and proteins with yields higher than the ones achieved by applying the autoclave treatment on the same matrix.
While these results informed a conceptual process line potentially compatible with existing distillery infrastructure, its actual scalability requires further tests. In particular, pilot-scale trials will be needed to assess membrane performance, fouling behavior, and overall process integration under real operating conditions. Additional trials should also be undertaken to optimize the cooking phase for different vinasse compositions and to define process parameters that ensure consistent product quality and standardization across batches. However, these findings should be considered as a preliminary design framework rather than a ready-to-implement industrial solution.
These findings, along with the study of vinasses’ physicochemical properties, provide a basis for equipment selection and process conceptualization, aiming for compatibility with current distillation workflows and minimal infrastructural modifications. Further investigations should focus on the economic assessment of the process and on the downstream purification and characterization of the separated fractions, particularly as a source of mannoproteins and dietary β-glucans.
Supplementary Materials
The following supporting information can be downloaded at: https://www.mdpi.com/article/10.3390/app151810192/s1, Figure S1: Results of the RSM model for viscosity; Text S1: RSM equations.
Author Contributions
Conceptualization, A.D.I., M.M., A.C. and L.G.; Methodology, A.D.I., A.Z. and L.G.; Software, A.P., A.Z. and L.G.; Formal analysis, A.D.I. and A.P.; Investigation, A.D.I.; Resources, M.M. and A.C.; Data curation, A.Z. and L.G.; Writing—original draft, A.D.I., M.M. and L.G.; Writing—review and editing, A.D.I. and L.G. All authors have read and agreed to the published version of the manuscript.
Funding
This research was funded by European Union Next-GenerationEU (PIANO NAZIONALE DI RIPRESA E RESILIENZA (PNRR)–MISSIONE 4 COMPONENTE 2, INVESTIMENTO 1.5–D.D. 1058 23 June 2022, ECS00000043).
Institutional Review Board Statement
Not applicable.
Informed Consent Statement
Not applicable.
Data Availability Statement
Due to privacy reasons, the data presented in this study are available on request from the authors.
Acknowledgments
The authors gratefully acknowledge Enrico Verno, Roberto Sonego, Roberto Castagner from Acquavite-Castagner Distillery (Vazzola, TV, Italy) for supplying the vinasse, as well as Alessandro Benincà, and Simone Vincenzi for technical support. This study was carried out within the Spoke 7 (RT 3.1 and 2.5) of the Interconnected Nord-Est Innovation Ecosystem (iNEST). This manuscript reflects only the authors’ views and opinions, neither the European Union nor the European Commission can be considered responsible for them.
Conflicts of Interest
The authors declare no conflicts of interest.
References
- Galanakis, C.M. Handbook of Grape Processing By-Products: Sustainable Solutions; Academic Press: Cambridge, MA, USA, 2017; p. 309. ISBN 978-0-12-809871-4. [Google Scholar]
- Eurpean Commission. Commission Regulation (EC) No 555/2008 of 27 June 2008 Laying Down Detailed Rules for Implementing Council Regulation (EC) No 479/2008 on the Common Organisation of the Market in Wine as Regards Support Programmes, Trade with Third Countries, Production Potential and on Controls in the Wine Sector; Eurpean Commission: Brussels, Belgium, 2018.
- Council of the European Union. Council Regulation (EC) No 491/2009 of 25 May 2009 Amending Regulation (EC) No 1234/2007 Establishing a Common Organisation of Agricultural Markets and on Specific Provisions for Certain Agricultural Products (Single CMO Regulation); Council of the European Union: Brussels, Belgium, 2009.
- Constantin, O.E.; Stoica, F.; Rațu, R.N.; Stănciuc, N.; Bahrim, G.E.; Râpeanu, G. Bioactive Components, Applications, Extractions, and Health Benefits of Winery By-Products from a Circular Bioeconomy Perspective: A Review. Antioxidants 2024, 13, 100. [Google Scholar] [CrossRef]
- Hoxha, L.; Taherzadeh, M.J.; Marangon, M. Sustainable Repurposing of Grape Marc: Potential for Bio-Based Innovations. Waste Manag. 2025, 203, 114871. [Google Scholar] [CrossRef]
- White, J.S. Sustainable Distilling: CO2 Emissions, Energy Decarbonization, and by-Products. In Distilled Spirits; Hill, A., Jack, F., Eds.; Academic Press: Cambridge, MA, USA, 2023; pp. 299–332. ISBN 978-0-12-822443-4. [Google Scholar]
- Ahmad, B.; Yadav, V.; Yadav, A.; Rahman, M.U.; Yuan, W.Z.; Li, Z.; Wang, X. Integrated Biorefinery Approach to Valorize Winery Waste: A Review from Waste to Energy Perspectives. Sci. Total Environ. 2020, 719, 137315. [Google Scholar] [CrossRef] [PubMed]
- De Iseppi, A.; Lomolino, G.; Marangon, M.; Curioni, A. Current and Future Strategies for Wine Yeast Lees Valorization. Food Res. Int. 2020, 137, 109352. [Google Scholar] [CrossRef] [PubMed]
- OIV-International Organisation of Vine and Wine. State of the World Vine and Wine Sector in 2022; OIV-International Organisation of Vine and Wine: Dijon, France, 2023.
- Bevilacqua, N.; Morassut, M.; Serra, M.C.; Cecchini, F. Determinazione dell’impronta carbonica dei sottoprodotti della vinificazione e loro valenza biologica. Ing. Dell’ambiente 2017, 4, 3. [Google Scholar] [CrossRef]
- Devesa-Rey, R.; Vecino, X.; Varela-Alende, J.L.; Barral, M.T.; Cruz, J.M.; Moldes, A.B. Valorization of Winery Waste vs. the Costs of Not Recycling. Waste Manag. 2011, 31, 2327–2335. [Google Scholar] [CrossRef]
- Zacharof, M.P. Grape Winery Waste as Feedstock for Bioconversions: Applying the Biorefinery Concept. Waste Biomass Valorization 2017, 8, 1011–1025. [Google Scholar] [CrossRef]
- Tao, Z.; Yuan, H.; Liu, M.; Liu, Q.; Zhang, S.; Liu, H.; Jiang, Y.; Huang, D.; Wang, T. Yeast Extract: Characteristics, Production, Applications and Future Perspectives. J. Microbiol. Biotechnol. 2023, 33, 151–166. [Google Scholar] [CrossRef]
- Balmaseda, A.; Rozès, N.; Lisanti, M.T.; Reguant, C.; Nioi, C. from Waste to Worth: Wine Lees Composition and Applications in Research and Industry. Crit. Rev. Food Sci. Nutr. 2025, 1–23. [Google Scholar] [CrossRef]
- De Iseppi, A.; Marangon, M.; Lomolino, G.; Crapisi, A.; Curioni, A. Red and White Wine Lees as a Novel Source of Emulsifiers and Foaming Agents. LWT 2021, 152, 112273. [Google Scholar] [CrossRef]
- De Iseppi, A.; Marangon, M.; Vincenzi, S.; Lomolino, G.; Curioni, A.; Divol, B. A Novel Approach for the Valorization of Wine Lees as a Source of Compounds Able to Modify Wine Properties. LWT 2021, 136, 110274. [Google Scholar] [CrossRef]
- Mandade, P.; Gnansounou, E. Chapter NINETEEN-Potential Value-Added Products from Wineries Residues. In Biomass, Biofuels, Biochemicals; Murthy, G.S., Gnansounou, E., Khanal, S.K., Pandey, A., Eds.; Elsevier: Amsterdam, The Netherlands, 2022; pp. 371–396. ISBN 978-0-12-819242-9. [Google Scholar]
- Bhatia, L.; Bachheti, R.K.; Garlapati, V.K.; Chandel, A.K. Third-Generation Biorefineries: A Sustainable Platform for Food, Clean Energy, and Nutraceuticals Production. Biomass Conv. Bioref. 2022, 12, 4215–4230. [Google Scholar] [CrossRef]
- ISO 16290:2013; Space Systems—Definition of the Technology Readiness Levels (TRLs) and Their Criteria of Assessment. ISO-International Organization for Standardization: Geneva, Switzerland, 2023.
- Ellwood, P.; Williams, C.; Egan, J. Crossing the Valley of Death: Five Underlying Innovation Processes. Technovation 2022, 109, 102162. [Google Scholar] [CrossRef]
- Gbadegeshin, S.A.; Natsheh, A.A.; Ghafel, K.; Mohammed, O.; Koskela, A.; Rimpiläinen, A.; Tikkanen, J.; Kuoppala, A. Overcoming the Valley of Death: A New Model for High Technology Startups. Sustain. Futures 2022, 4, 100077. [Google Scholar] [CrossRef]
- De Iseppi, A.; Curioni, A.; Marangon, M.; Vincenzi, S.; Kantureeva, G.; Lomolino, G. Characterization and Emulsifying Properties of Extracts Obtained by Physical and Enzymatic Methods from an Oenological Yeast Strain. J. Sci. Food Agric. 2019, 99, 5702–5710. [Google Scholar] [CrossRef]
- Council of the European Union. Directive 2014/68/EU of the European Parliament and of the Council of 15 May 2014 on the Harmonisation of the Laws of the Member States Relating to the Making Available on the Market of Pressure Equipment (Recast) (Text with EEA Relevance); European Parliament: Strasbourg, France, 2014.
- National Institute of Standards and Technology-NIST. NIST/SEMATECH e-Handbook of Statistical Methods; National Institute of Standards and Technology: Gaithersburg, MD, USA, 2020.
- National Institute of Standards and Technology NIST WebBook. Available online: https://webbook.nist.gov/ (accessed on 8 August 2025).
- González-Royo, E.; Esteruelas, M.; Kontoudakis, N.; Fort, F.; Canals, J.M.; Zamora, F. The Effect of Supplementation with Three Commercial Inactive Dry Yeasts on the Colour, Phenolic Compounds, Polysaccharides and Astringency of a Model Wine Solution and Red Wine. J. Sci. Food Agric. 2017, 97, 172–181. [Google Scholar] [CrossRef]
- Elson, T. Scale-Up in Chemical Engineering, 2nd ed.; The Royal Society of Chemistry: London, UK, 2016. [Google Scholar]
- Friso, D. Ingegneria Dell’industria Agroalimentare; CLEUP: Padua, Italy, 2022; ISBN 978-88-5495-520-2. [Google Scholar]
- Lachman, J.; Rutkowski, K.; Travnicek, P.; Vitez, T.; Burg, P.; Turan, J.; Junga, P.; Visacki, V. Determination of Rheological Behaviour of Wine Lees. Int. Agrophys. 2015, 29, 307–311. [Google Scholar] [CrossRef]
- Larsson, E.; Tengberg, T. Evaporation of Vinasse-Pilot Plant Investigation and Preliminary Process Design. Master’s Thesis, Chalmers University of Technology, Gothenburg, Sweden, 2014. [Google Scholar]
- Chioru, A.; Chirsanova, A.; Dabija, A.; Avrămia, I.; Boiştean, A.; Chetrariu, A. Extraction Methods and Characterization of β-Glucans from Yeast Lees of Wines Produced Using Different Technologies. Foods 2024, 13, 3982. [Google Scholar] [CrossRef]
- Varelas, V.; Tataridis, P.; Liouni, M.; Nerantzis, E.T. Valorization of Winery Spent Yeast Waste Biomass as a New Source for the Production of β-Glucan. Waste Biomass Valoriz. 2016, 7, 807–817. [Google Scholar] [CrossRef]
- Caruso, M.A.; Piermaria, J.A.; Abraham, A.G.; Medrano, M. β-Glucans Obtained from Beer Spent Yeasts as Functional Food Grade Additive: Focus on Biological Activity. Food Hydrocoll. 2022, 133, 107963. [Google Scholar] [CrossRef]
- Li, S.; Zhai, H.; Ma, W.; Duan, C.; Yi, L. Yeast Mannoproteins: Organoleptic Modulating Functions, Mechanisms, and Product Development Trends in Winemaking. Food Front. 2023, 4, 1091–1126. [Google Scholar] [CrossRef]
- de Melo, A.N.F.; de Souza, E.L.; da Silva Araujo, V.B.; Magnani, M. Stability, Nutritional and Sensory Characteristics of French Salad Dressing Made with Mannoprotein from Spent Brewer’s Yeast. LWT-Food Sci. Technol. 2015, 62, 771–774. [Google Scholar] [CrossRef]
- Silva Araújo, V.B.D.; Melo, A.N.F.D.; Costa, A.G.; Castro-Gomez, R.H.; Madruga, M.S.; Souza, E.L.D.; Magnani, M. Followed Extraction of β-Glucan and Mannoprotein from Spent Brewer’s Yeast (Saccharomyces Uvarum) and Application of the Obtained Mannoprotein as a Stabilizer in Mayonnaise. Innov. Food Sci. Emerg. Technol. 2014, 23, 164–170. [Google Scholar] [CrossRef]
- Bzducha-Wróbel, A.; Błażejak, S.; Kawarska, A.; Stasiak-Różańska, L.; Gientka, I.; Majewska, E. Evaluation of the Efficiency of Different Disruption Methods on Yeast Cell Wall Preparation for β-Glucan Isolation. Molecules 2014, 19, 20941–20961. [Google Scholar] [CrossRef] [PubMed]
- Tiwari, U.; Cummins, E. Factors Influencing β-Glucan Levels and Molecular Weight in Cereal-Based Products. Cereal Chem. 2009, 86, 290–301. [Google Scholar] [CrossRef]
- Cherubini, F. The Biorefinery Concept: Using Biomass Instead of Oil for Producing Energy and Chemicals. Energy Convers. Manag. 2010, 51, 1412–1421. [Google Scholar] [CrossRef]
- Vincenzi, S.; Crapisi, A.; Curioni, A. Foamability of Prosecco Wine: Cooperative Effects of High Molecular Weight Glycocompounds and Wine PR-Proteins. Food Hydrocoll. 2014, 34, 202–207. [Google Scholar] [CrossRef]
- Lomolino, G.; Vincenzi, S.; Zannoni, S.; Vegro, M.; De Iseppi, A. White Sparkling Wine Proteins and Glycoproteins and Their Behavior in Foam Expansion and Stability. Beverages 2024, 10, 21. [Google Scholar] [CrossRef]
- Lehne, G.; Haneberg, B.; Gaustad, P.; Johansen, P.W.; Preus, H.; Abrahamsen, T.G. Oral Administration of a New Soluble Branched β-1,3-D-Glucan Is Well Tolerated and Can Lead to Increased Salivary Concentrations of Immunoglobulin A in Healthy Volunteers. Clin. Exp. Immunol. 2006, 143, 65–69. [Google Scholar] [CrossRef]
- Lei, N.; Wang, M.; Zhang, L.; Xiao, S.; Fei, C.; Wang, X.; Zhang, K.; Zheng, W.; Wang, C.; Yang, R.; et al. Effects of Low Molecular Weight Yeast β-Glucan on Antioxidant and Immunological Activities in Mice. Int. J. Mol. Sci. 2015, 16, 21575–21590. [Google Scholar] [CrossRef]
- Nunez, Y.P.; Carrascosa, A.V.; González, R.; Polo, M.C.; Martínez-Rodríguez, A.J. Effect of Accelerated Autolysis of Yeast on the Composition and Foaming Properties of Sparkling Wines Elaborated by a Champenoise Method. J. Agric. Food Chem. 2005, 53, 7232–7237. [Google Scholar] [CrossRef] [PubMed]
- Rodrigues, A.; Ricardo-Da-Silva, J.M.; Lucas, C.; Laureano, O. Effect of Commercial Mannoproteins on Wine Colour and Tannins Stability. Food Chem. 2012, 131, 907–914. [Google Scholar] [CrossRef]
- Snyman, C.; Mekoue Nguela, J.; Sieczkowski, N.; Divol, B.; Marangon, M. Characterization of Mannoprotein Structural Diversity in Wine Yeast Species. J. Agric. Food Chem. 2023, 71, 19727–19738. [Google Scholar] [CrossRef]
- Andrino, K.G.S.; Apines-Amar, M.J.S.; Janeo, R.L.; Corre, V.L., Jr. Effects of Dietary Mannan Oligosaccharide (MOS) and β-Glucan on Growth, Immune Response and Survival against White Spot Syndrome Virus (WSSV) Infection of Juvenile Tiger Shrimp Penaeus Monodon. AACL Bioflux 2014, 7, 321–332. [Google Scholar]
- Kovitvadhi, A.; Chundang, P.; Tirawattanawanich, C.; Prathumpai, W.; Methacanon, P.; Chokpipatpol, K. Effects of Dietary Supplementation with Different Levels and Molecular Weights of Fungal β-Glucan on Performances, Health and Meat Quality in Broilers. Asian-Australas. J. Anim. Sci. 2019, 32, 1548–1557. [Google Scholar] [CrossRef]
- Berzosa, A.; Marín-Sánchez, J.; Delso, C.; Sanz, J.; Álvarez, I.; Sánchez-Gimeno, C.; Raso, J. Sequential Extraction Optimization of Compounds of Interest from Spent Brewer’s Yeast Biomass Treated by Pulsed Electric Fields. Innov. Food Sci. Emerg. Technol. 2024, 94, 103705. [Google Scholar] [CrossRef]
- Oliveira, A.S.; Ferreira, C.; Pereira, J.O.; Pintado, M.E.; Carvalho, A.P. Valorisation of Protein-Rich Extracts from Spent Brewer’s Yeast (Saccharomyces Cerevisiae): An Overview. Biomass Conv. Bioref. 2022, 15, 1771–1793. [Google Scholar] [CrossRef]
- Øverland, M.; Skrede, A. Yeast Derived from Lignocellulosic Biomass as a Sustainable Feed Resource for Use in Aquaculture. J. Sci. Food Agric. 2017, 97, 733–742. [Google Scholar] [CrossRef] [PubMed]
- Freimund, S.; Sauter, M.; Käppeli, O.; Dutler, H. A New Non-Degrading Isolation Process for 1,3-β-D-Glucan of High Purity from Baker’s Yeast Saccharomyces Cerevisiae. Carbohydr. Polym. 2003, 54, 159–171. [Google Scholar] [CrossRef]
- Liu, X.Y.; Wang, Q.; Cui, S.W.; Liu, H.Z. A New Isolation Method of β-d-Glucans from Spent Yeast Saccharomyces Cerevisiae. Food Hydrocoll. 2008, 22, 239–247. [Google Scholar] [CrossRef]
- Faustino, M.; Durão, J.; Pereira, C.F.; Oliveira, A.S.; Pereira, J.O.; Pereira, A.M.; Ferreira, C.; Pintado, M.E.; Carvalho, A.P. Comparative Analysis of Mannans Extraction Processes from Spent Yeast Saccharomyces Cerevisiae. Foods 2022, 11, 3753. [Google Scholar] [CrossRef] [PubMed]
- El Rayess, Y.; Albasi, C.; Bacchin, P.; Taillandier, P.; Mietton-Peuchot, M.; Devatine, A. Analysis of Membrane Fouling during Cross-Flow Microfiltration of Wine. Innov. Food Sci. Emerg. Technol. 2012, 16, 398–408. [Google Scholar] [CrossRef]
- Czekaj, P.; López, F.; Güell, C. Membrane Fouling by Turbidity Constituents of Beer and Wine: Characterization and Prevention by Means of Infrasonic Pulsing. J. Food Eng. 2001, 49, 25–36. [Google Scholar] [CrossRef]
- Raikos, V.; Grant, S.B.; Hayes, H.; Ranawana, V. Use of β-Glucan from Spent Brewer’s Yeast as a Thickener in Skimmed Yogurt: Physicochemical, Textural, and Structural Properties Related to Sensory Perception. J. Dairy Sci. 2018, 101, 5821–5831. [Google Scholar] [CrossRef] [PubMed]
Disclaimer/Publisher’s Note: The statements, opinions and data contained in all publications are solely those of the individual author(s) and contributor(s) and not of MDPI and/or the editor(s). MDPI and/or the editor(s) disclaim responsibility for any injury to people or property resulting from any ideas, methods, instructions or products referred to in the content. |
© 2025 by the authors. Licensee MDPI, Basel, Switzerland. This article is an open access article distributed under the terms and conditions of the Creative Commons Attribution (CC BY) license (https://creativecommons.org/licenses/by/4.0/).