Article

Web-Based Platform for Quantitative Depression Risk Prediction via VAD Regression on Korean Text and Multi-Anchor Distance Scoring

by
Dongha Lim
,
Kangwon Lee
,
Junhui Jo
,
Hyeonji Lim
,
Hyeongchan Bae
and
Changgu Kang
*
Department of Computer Science and Engineering, Gyeongsang National University, Jinju-si 52828, Republic of Korea
*
Author to whom correspondence should be addressed.
Appl. Sci. 2025, 15(18), 10170; https://doi.org/10.3390/app151810170
Submission received: 22 August 2025 / Revised: 13 September 2025 / Accepted: 16 September 2025 / Published: 18 September 2025

Abstract

Depression risk prediction benefits from approaches that go beyond binary labels by offering interpretable, quantitative views of affective states. This study presents a web-based platform that estimates depression risk by combining Korean Valence–Arousal–Dominance (VAD) regression with a structured, multi-anchor distance scoring method. We construct a Korean VAD–labeled resource by integrating the NRC-VAD Lexicon, the AI Hub emotional dialogue corpus, and translated EmoBank entries, and fine-tune a KLUE-RoBERTa regression model to predict sentence-level VAD vectors. Depression risk is then derived as the mean Euclidean distance from the predicted VAD vector to depressive anchor vectors and normalized into an interpretable risk index. In evaluation, the approach shows strong agreement with ground truth (Pearson’s r = 0.87 ) and supports accurate risk screening when thresholded. The platform provides intuitive visual feedback for end users and monitoring tools for professionals, highlighting the practicality of integrating interpretable VAD modeling with lightweight scoring in real-world, web-based mental health support.

1. Introduction

In recent years, growing attention has been paid to the emotional well-being of young people (e.g., ages 19–34 in [1]) and, more broadly, individuals across age groups facing increasing social isolation. Factors such as economic uncertainty, employment difficulties, the prolonged impact of the COVID-19 pandemic, and the rise of single-person households have contributed to the weakening of social networks. Among the most extreme manifestations of this phenomenon is hikikomori, a condition in which individuals remain confined to their homes for extended periods, completely cutting off contact with society—a serious public health concern in countries such as South Korea and Japan [1,2,3,4].
Individuals in such extreme isolation often remain outside the reach of conventional social support systems [5,6,7]. Their tendency to avoid interpersonal contact and their limited self-awareness make early detection of mental health deterioration challenging, leading to missed opportunities for timely intervention. Although the COVID-19 pandemic has accelerated the development of remote mental health services, including online counseling platforms such as Zoom, these systems still rely on users to recognize their own emotional distress and voluntarily seek help [8,9,10]—a limitation that reduces their effectiveness for socially withdrawn individuals. These barriers span the lifespan—affecting adolescents, young and middle-aged adults, and older adults alike—and are especially acute among those in prolonged social withdrawal.
To address these challenges, this study proposes a web-based platform for quantitative depression risk prediction via VAD regression on Korean text and multi-anchor distance scoring. The platform predicts depression risk directly from user-generated diary text, quantifies it on a continuous scale, and visualizes temporal trends to support both user self-reflection and professional monitoring. Although motivated by youth-focused phenomena such as hikikomori, the platform is designed to facilitate mental health improvement for socially isolated people across age groups by lowering the threshold for self-reflection and enabling professional follow-up. Consistent with this lifespan perspective, empirical work has documented social isolation and well-being challenges among families of middle-aged and older hikikomori [11].
The proposed approach leverages a Korean Valence–Arousal–Dominance (VAD) regression model combined with a multi-anchor distance scoring method based on depressive anchor vectors determined in accordance with PAD/VAD theory [12]. VAD is a dimensional affective model that represents affective states in a continuous three-dimensional space: valence (pleasure–displeasure), arousal (activation–deactivation), and dominance (control–submissiveness). Compared to categorical affect labels, VAD provides a more fine-grained and interpretable representation of affective states, enabling quantitative tracking of subtle affective variations. In our framework, a KLUE-RoBERTa-based regression model predicts VAD scores from diary text, and depression scores are computed by measuring the average L2 distance to multiple depressive anchor vectors, followed by reverse scaling for intuitive interpretation.
Through this platform, users can submit diary entries and receive visualized depression risk trends, while professionals can monitor high-risk individuals and plan timely interventions. This paper presents the platform architecture, VAD regression and scoring methodology, and user interfaces, and discusses the system’s potential as a practical tool for early-stage mental health support and continuous affective self-awareness.
This paper is organized as follows. Section 2 reviews related work in affective computing and mental health technologies. Section 3 describes the proposed platform, including its architecture, dataset construction, VAD regression framework, and training setup. Section 4 presents the experimental results, covering regression performance across the VAD dimensions, depression score estimation using the multi-anchor distance approach, and comparisons with baseline methods. Finally, Section 5 summarizes the conclusions, discusses limitations, and outlines directions for future research.

2. Related Works

This section surveys prior work along two strands and frames the methodological gap our platform addresses. Section 2.1 reviews language-based mental health detection using clinical and non-clinical text—including recent LLM-driven approaches—and summarizes their strengths and limits with respect to actionability and linkage to expert intervention. Section 2.2 covers multimodal and quantitative emotion analysis (e.g., VAD-based methods), highlighting English-centric data dependencies and the scarcity of Korean-language VAD resources. Together, these observations motivate the Korean-text VAD regression and multi-anchor scoring introduced in Section 3.

2.1. Language-Based Mental Health Detection Studies

With recent advances in artificial intelligence (AI) and natural language processing (NLP), detecting mental health conditions through text analysis has become an active area of research [13,14]. In particular, various studies have attempted to identify depression, anxiety, and other mental health issues at an early stage using both clinical and non-clinical textual data.
For clinical and non-clinical text, Nag et al. [15] compared various NLP and deep learning models to extract emotional information from clinical narratives and medical records, verifying their potential for early mental health screening in real-world settings. T. Zhang et al. [16] conducted a comprehensive review of mental illness detection methods applied to non-clinical text such as social media posts, blogs, and forums, demonstrating the feasibility of detecting depression, anxiety, and PTSD from unstructured everyday language. Z. Zhang et al. [17] collected over 520,000 social media posts, analyzed linguistic differences between users with self-declared depression and the general population, and trained a hierarchical transformer model that achieved high accuracy (0.95) and recall (0.95) in depression classification.
Mansoor et al. [18] proposed an AI-based approach that analyzes posts from Twitter, Reddit, and Facebook to predict mental health crises. By combining time-series analysis with NLP, their deep learning model could predict crises such as depression, bipolar disorder, suicidal ideation, and anxiety an average of 7.2 days earlier than human experts, achieving an accuracy of approximately 89.3% and an F1-score between 0.83 and 0.87. Gavalan et al. [19] pre-summarized the DAIC-WOZ dialogue data and fed it into a BERT-based classifier, improving depression detection performance (F1-score 0.67) while enhancing explainability via a depression-related lexicon. Saffar et al. [20] analyzed the evolution of emotion recognition techniques in medical and health text, from lexicon-based approaches to state-of-the-art pretrained language models. Teferra et al. [21] evaluated the accuracy and feasibility of text-based depression screening systems and discussed ethical issues such as privacy protection and the risk of misdiagnosis.
Recently, large language models (LLMs) and conversational systems have been actively explored for mental health support. Zhong et al. [22] developed an LLM-based system that analyzes user dialogue in real time, predicts depression risk from linguistic cues, and suggests personalized intervention strategies. Qin et al. [23] proposed a three-stage framework for detecting depression from Reddit data, generating explainable diagnostic feedback using a GPT, and providing emotional interventions via a chatbot. Li et al. [24] conducted a meta-analysis of AI-based conversational agents, finding empirical evidence that such systems can reduce depression, anxiety, and stress. Cui et al. [25] developed a ChatGPT-4-based suicide intervention chatbot, which received positive evaluations for user interface, intervention effect, safety, privacy, and overall satisfaction. Wang et al. [26] designed a cognitive restructuring chatbot (CRBot) in collaboration with mental health experts, implementing therapeutic dialogue flows through prompt engineering; the system effectively identified and reconstructed depression-related cognitive patterns in real-world interactions.
These studies demonstrate the potential of text-based depression detection, yet most approaches remain limited to quantifying or classifying emotional states without establishing a direct link to expert intervention. While chatbot systems offer high accessibility, they often struggle to accurately assess complex psychological states. Conversely, expert counseling ensures high accuracy and clinical reliability but suffers from limited accessibility due to time and resource constraints.

2.2. Multimodal and Quantitative Emotion Analysis Studies

Research has also progressed in multimodal emotion recognition, which incorporates non-linguistic signals. Hadjar et al. [27] applied AI-based facial expression and speech analysis to remote psychological counseling, enabling real-time assessment of users’ emotional states and delivery of appropriate interventions. Zhang et al. [28] proposed an Audio–Video–Text Fusion–Three-Branch Network (AVTF-TBN) model by inducing emotions through reading and interview tasks and collecting facial expression videos, speech, and text. Their model effectively extracted and integrated modality-specific features, achieving an F1-score of 0.78, precision of 0.76, and recall of 0.81 in depression risk detection. Gimeno-Gómez et al. [29] introduced a concise and scalable transformer-based architecture that integrates various non-verbal signals (facial expressions, speech embeddings, body and hand movements, eye blinks, and gaze), achieving state-of-the-art performance with an F1-score of up to 0.78 on DAIC-WOZ, E-DAIC, and D-Vlog benchmark datasets.
Efforts have also been made to quantify emotions along the Valence–Arousal–Dominance (VAD) dimensions. Park et al. [30] proposed a multi-task learning approach to regress VAD scores from categorical emotion labels, using a RoBERTa-based model to jointly perform emotion classification and VAD regression. Mitsios et al. [31] combined valence and arousal prediction into an ordinal classification framework, capturing subtle differences in emotional intensity while reducing prediction errors. Fatima et al. [32] developed the DASentimental framework, which extracts emotional features—including VAD dimensions—from recalled emotional words and their semantic networks, achieving a correlation of approximately 0.7 in depression prediction.
However, most of these studies rely on English-centric datasets such as EmoBank [33], leading to a scarcity of VAD resources not only for Korean but also for minority languages more broadly. To address this gap, the present study constructs a Korean VAD-labeled dataset by combining categorical Korean emotion data with an English VAD lexicon. Based on this resource, we propose a platform that quantifies depression scores from user-written diary text and delivers the results to mental health professionals for qualitative feedback and timely intervention. This approach aims to combine the accessibility of chatbot-based systems with the reliability of expert counseling, while enabling extensibility to various affective states such as anxiety, anger, and lethargy.

3. Methodology

This section details our methodology end-to-end. Section 3.1 outlines the web-based platform architecture; Section 3.2 presents the user interface and outputs for users and professionals; Section 3.3 describes dataset construction and preprocessing; Section 3.4 explains the model design—VAD regression and depression scoring via a multi-anchor distance method grounded in PAD/VAD theory and a public VAD lexicon; and Section 3.5 summarizes training and evaluation settings. The sequence follows the pipeline from system to data to modeling and scoring, culminating in empirical assessment, reported in Section 4.

3.1. Platform Architecture

The proposed platform consists of a client, a web server, and an AI server, operating within a web-based environment. The client runs in the user’s web browser and serves as the interface between the user and the web server. When a user submits a diary entry, the data are transmitted to the web server, which places the task into a thread-safe asynchronous queue. At fixed intervals, tasks are retrieved from the queue and sent to the AI server via HTTPS (TLS) requests. The AI server returns the analysis results, which are then stored in the database by the web server.
The AI server employs a KLUE-RoBERTa-based Valence–Arousal–Dominance (VAD) regression model loaded from Hugging Face to predict the VAD values of the input text across three continuous dimensions: valence, arousal, and dominance. The predicted VAD vector is then converted into a depression score using a multi-anchor Euclidean distance calculation, followed by reverse scaling to produce an interpretable score ranging from 0 to 100.
Both the depression score and the predicted VAD values are stored in the database via the web server. Users can view the visualized results through the client interface, while professionals can access the same data to monitor high-risk individuals and provide tailored feedback. To ensure stable operation under multi-user conditions, the platform adopts a polling-based architecture, which helps distribute the computational load of the AI server and enhance system reliability.
Figure 1 illustrates the overall data flow and interactions between system components, from diary submission to emotion analysis and visualization.

3.2. User Interface Overview

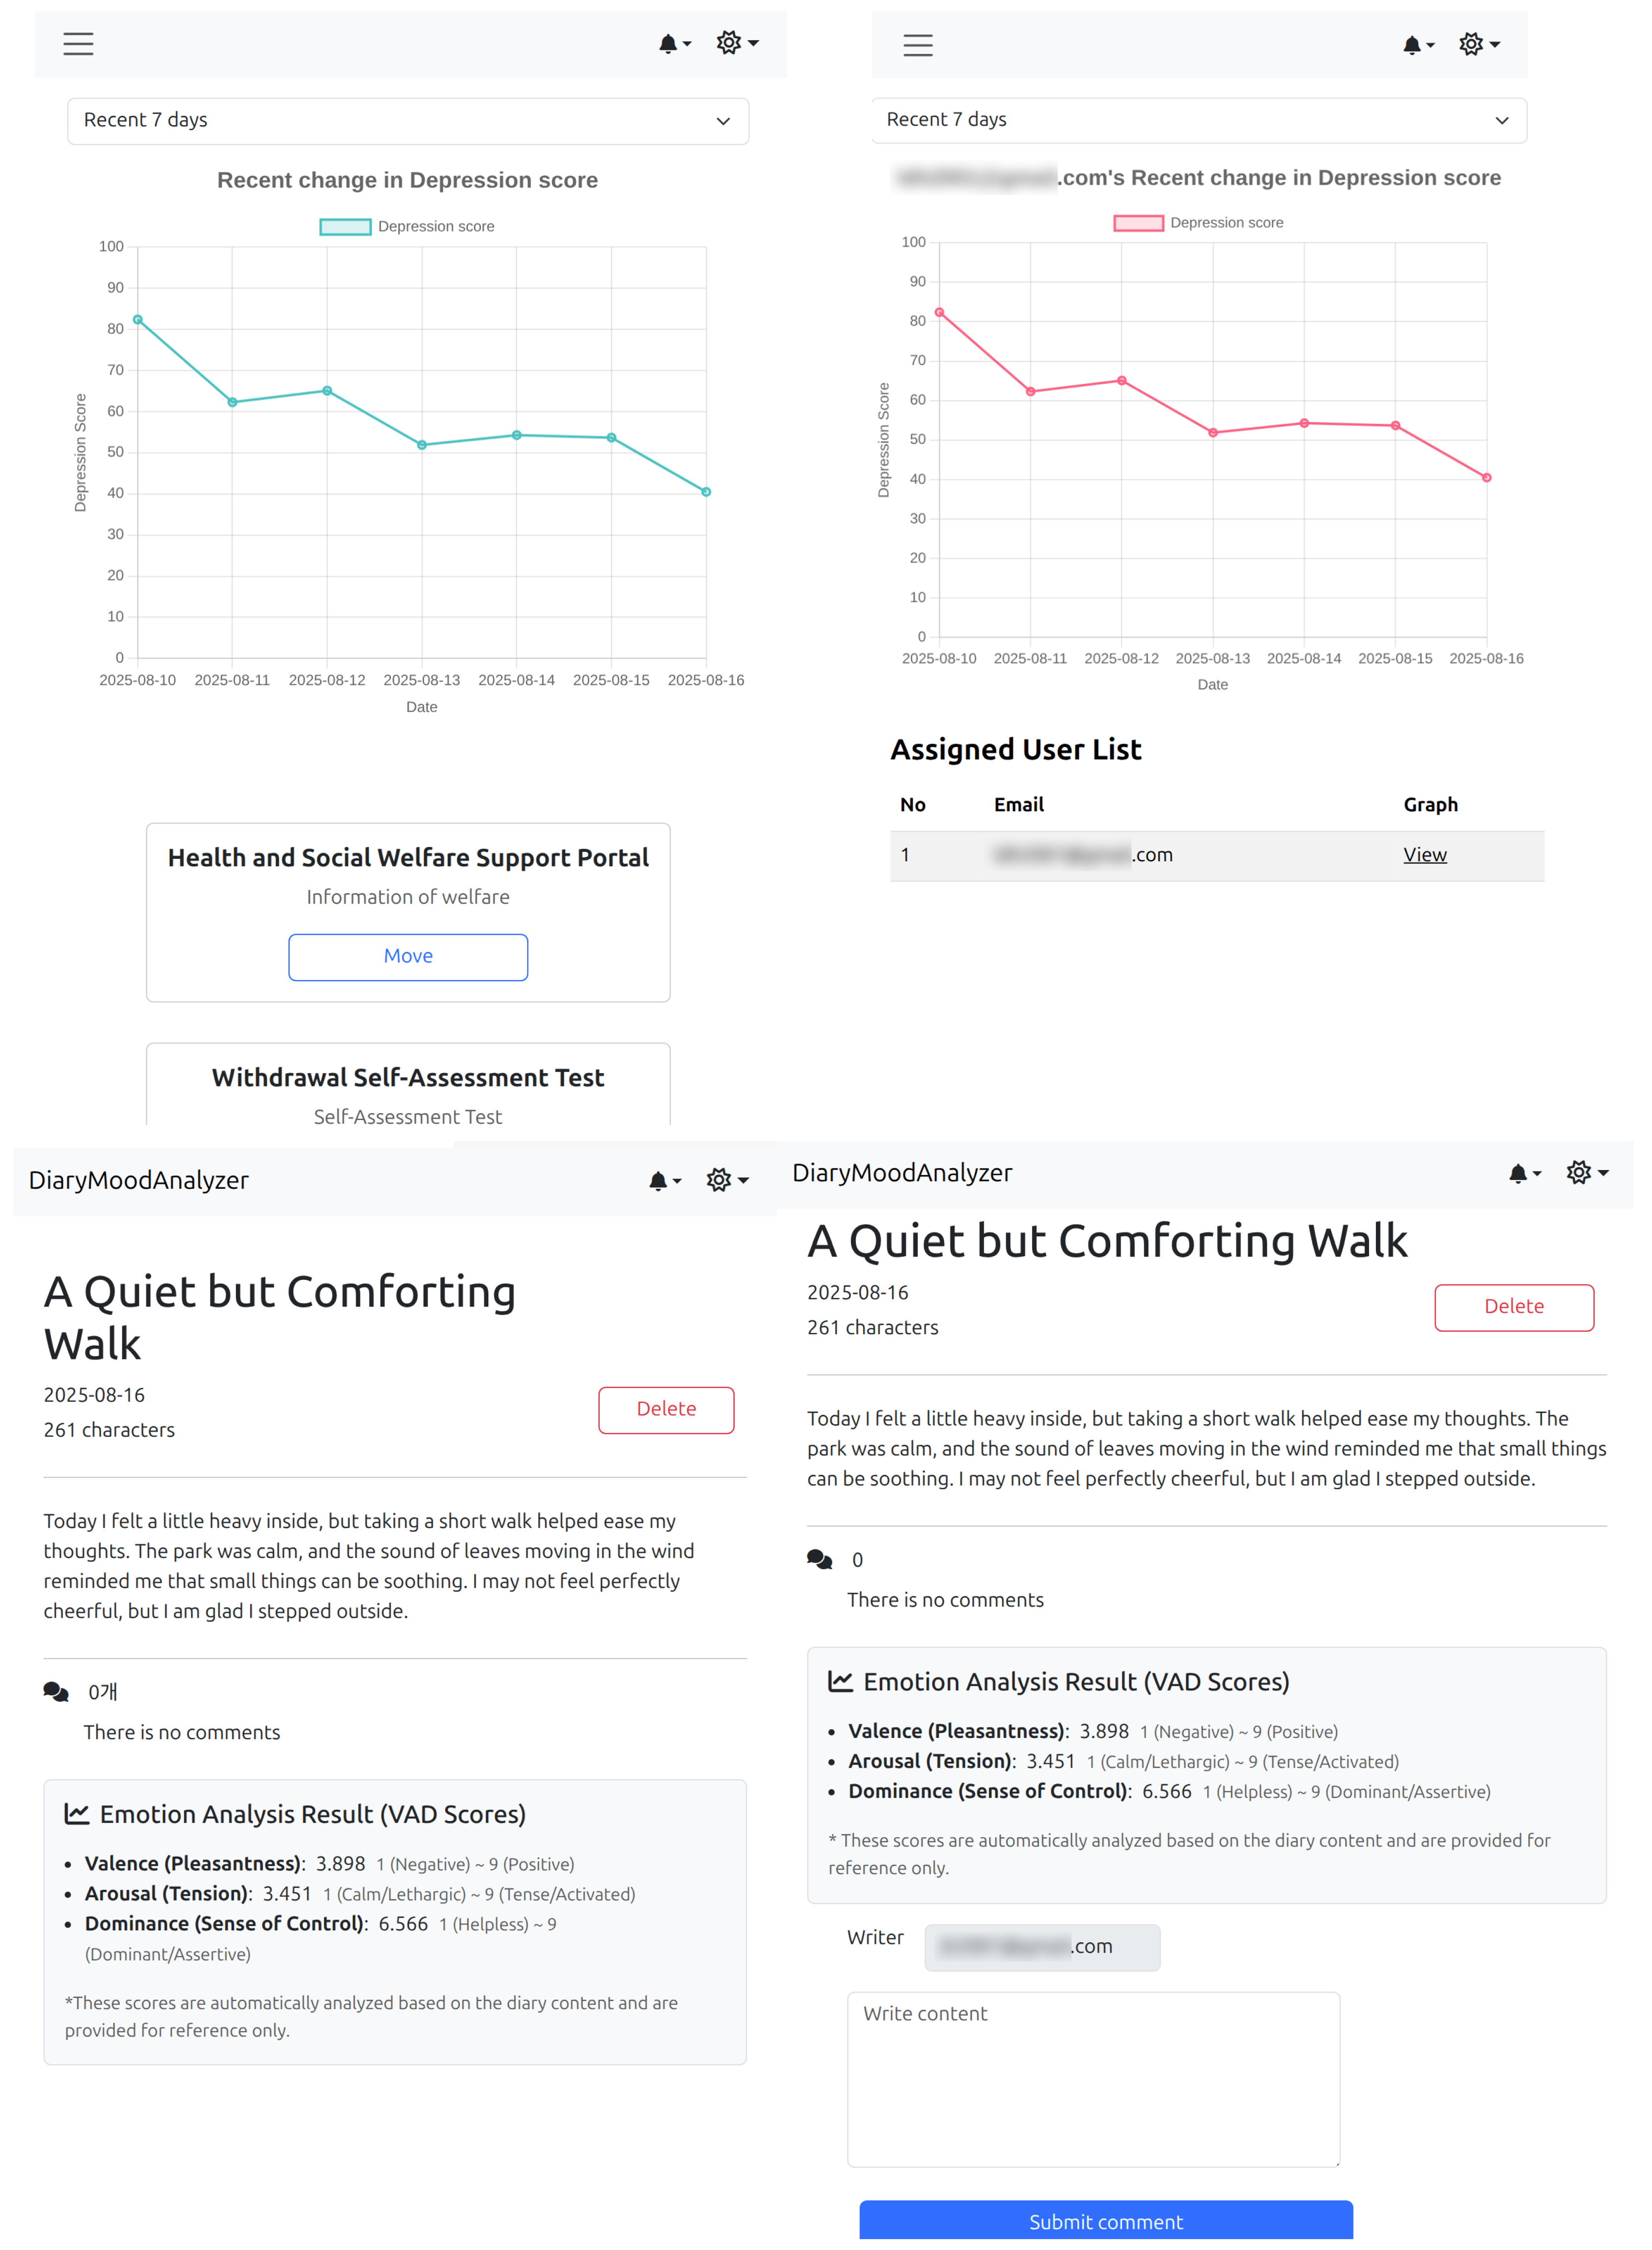
The platform adopts a responsive user interface for both mobile and desktop environments. Figure 2 juxtaposes the two roles in a single comparative view: the left column shows the user interface and the right column shows the expert interface. For each role, the upper subfigure presents the home screen, where recent depression scores are visualized as a graph—enabling the user to track their own trends and the expert to monitor assigned users at a glance. The lower subfigure shows the desktop diary detail screen, where the underlying analysis can be inspected (e.g., full text, emotion analysis outputs, and a comment/feedback panel). Additionally, after logging in, the expert can select a target user from a user list to open that user’s diaries, review results, and leave feedback. A more thorough description of the analysis views is provided in the subsequent subsection.
Figure 3 separately illustrates the user’s desktop diary list. This list view displays entry titles, short snippets, timestamps, counts of professional comments, and emotion analysis indicators; it supports quick navigation to the full detail page by selecting an entry.
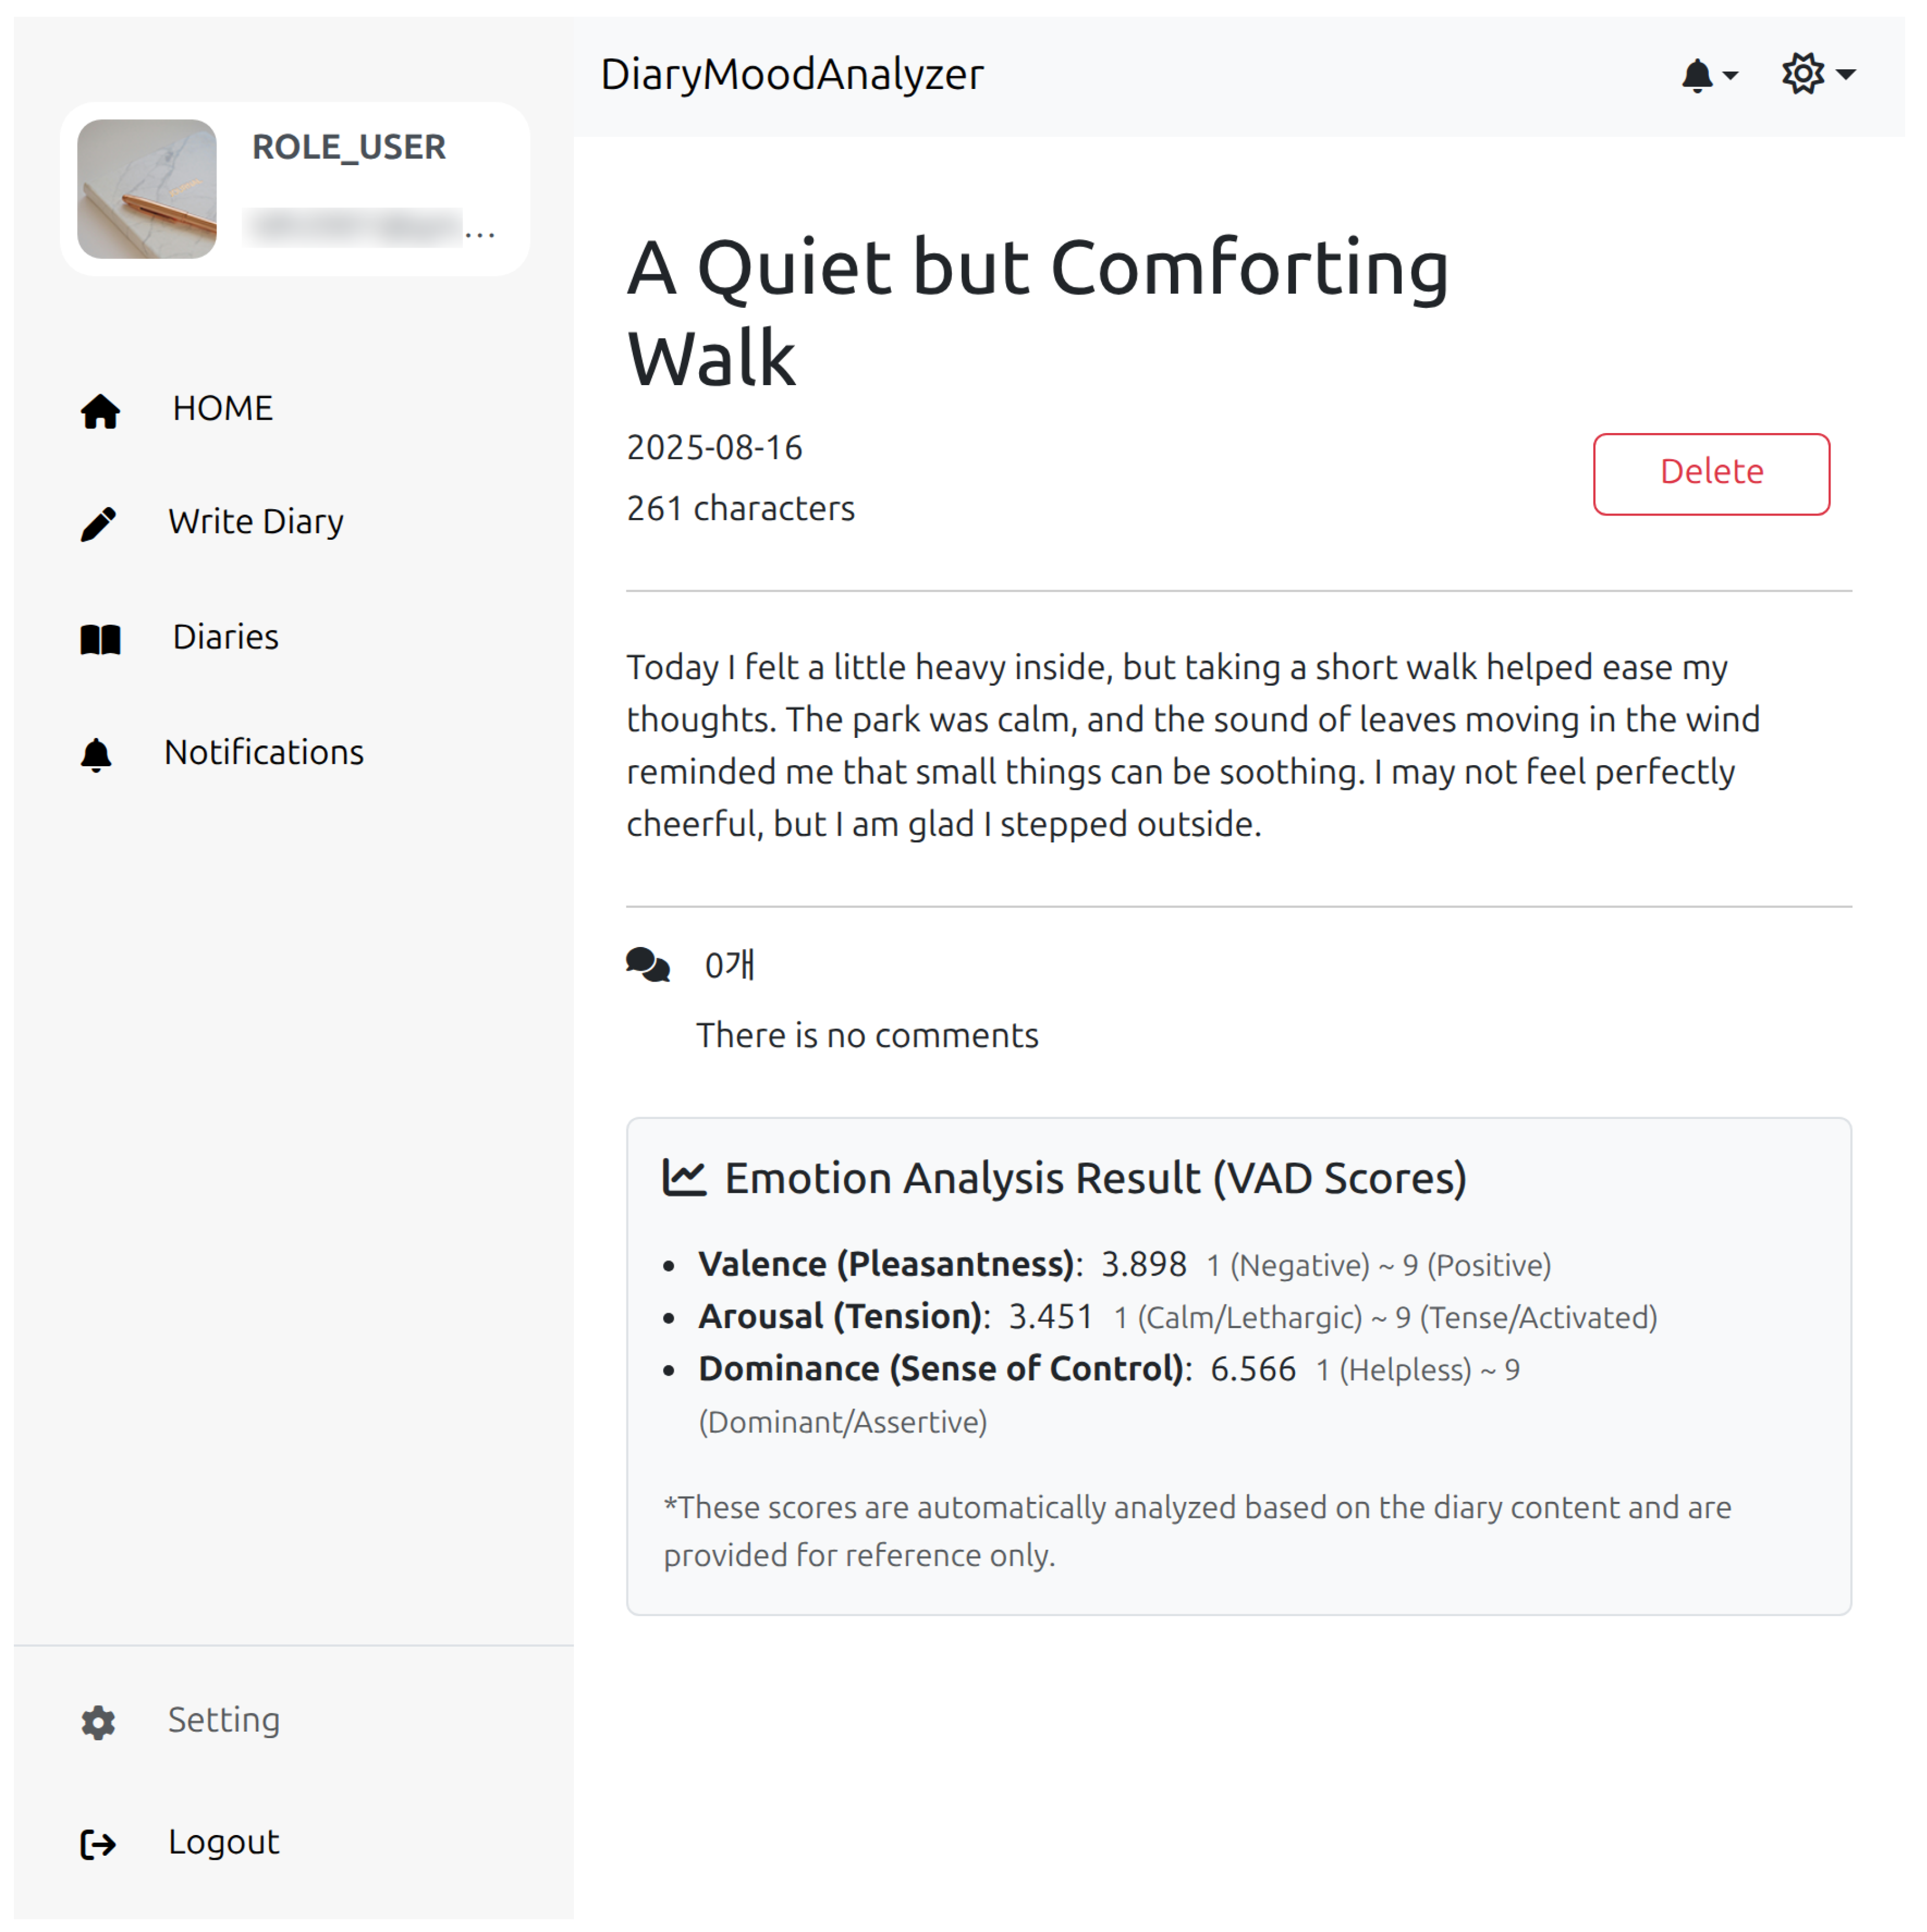
Finally, Figure 4 presents a detailed analysis example that visualizes the predicted VAD values together with the calculated depression score. The combined presentation of valence, arousal, and dominance predictions with the depression score enables users to intuitively recognize their VAD-based emotional profile, while providing professionals with a structured reference for assessing the need for early intervention.

3.3. Dataset and Preprocessing

This study constructed a large-scale Korean Valence–Arousal–Dominance (VAD) dataset by integrating multiple resources—specifically, the Korean emotional dialogue corpus (AI Hub) [34], the NRC-VAD Lexicon v2.1 [35], and EmoBank [33]—and by performing careful preprocessing to ensure label consistency and quality. The final dataset was designed to provide paired inputs and labels for both depression score regression and VAD score prediction tasks.
Regarding licensing, EmoBank is available under CC BY-SA 4.0, while the AI Hub emotional dialogue corpus permits analysis, publication, and model/service deployment with proper attribution but forbids redistribution of original files (see Data Availability Statement and Acknowledgments).
First, we employed the NRC-VAD Lexicon v2.1 [35], an affective lexicon containing approximately 55,000 English words annotated with valence (pleasant–unpleasant), arousal (active–inactive), and dominance (dominant–submissive) scores on a 0–1 scale. These three continuous dimensions enable a fine-grained representation of affective states. For compatibility with our model output range and interpretability, the original 0–1 values were linearly rescaled to 1–9. Formally, we apply min–max scaling from the original u [ 0 ,   1 ] to the target range [ 1 ,   9 ] via the elementwise mapping ϕ ( u ) = 1 + 8 u for V, A, and D. For example, the original scores for “depressed” (V = 0.02, A = 0.43, D = 0.14) were transformed to (V = 1.19, A = 4.56, D = 2.09).
To map the emotion codes in the Korean emotional dialogue corpus [34] to the NRC-VAD Lexicon [35], the most semantically relevant English keyword was selected for each code, and its corresponding VAD values were directly assigned. For instance, the emotion code E24 (“depressed”) was mapped to the VAD values of “depressed,” while E20 (“sadness”) was mapped to those of “sadness.” When an emotion code corresponded to multiple English words (e.g., “poor, unfortunate”), the mean of their VAD scores was used. Through this mapping procedure, categorical emotion labels were transformed into continuous VAD vectors, thereby preserving affective similarity and enabling regression-based modeling. The complete mapping is provided in Appendix A (Table A1).
For sentence-level data construction, we extracted sentences rich in affective content from the Korean emotional dialogue corpus [34], which contains approximately 146,000 sentences labeled with emotion codes and categories. Only the first sentence from each dialogue turn that best reflected the speaker’s affective state was selected, and all selections were manually verified to ensure quality. The mapped VAD scores from the NRC Lexicon were then assigned to these sentences, resulting in 58,269 sentence–VAD pairs.
To further expand the dataset’s coverage and expression diversity, we incorporated EmoBank [33], an English sentence-level dataset annotated with VAD scores. All sentences were translated into Korean, and the translations were manually reviewed to correct grammatical errors, avoid semantic distortion, and maintain consistency in affective expression. This process yielded an additional 29,802 high-quality Korean sentence–VAD pairs. All translated sentences underwent manual quality assurance using two criteria: (i) sentence completeness/fluency and (ii) preservation of the source affect; items failing either criterion were corrected or discarded.
Finally, we combined the 58,269 sentences obtained from the Korean emotional dialogue corpus [34] mapping with the 8290 translated and verified EmoBank [33] sentences, resulting in a total of 66,559 VAD-labeled entries. This integrated dataset was used as the primary resource for training and evaluating the proposed VAD regression model. Table 1 summarizes the final dataset composition and preprocessing procedures.
We split the integrated dataset into training/validation/test sets with a 4:1:1 ratio. All statistics used for normalization and scaling—e.g., μ , σ in Equations (1) and (2) and d min , d max in Equation (4)—were estimated on the training split only and then applied to validation and test sets to prevent information leakage.
The numerical values of these constants (e.g., μ , σ , d min , d max ) are summarized in Appendix B (Table A2).

3.4. Model Design

This study employs a regression-based approach to predict the affective state of a sentence along three continuous dimensions—valence, arousal, and dominance (VAD)—and subsequently derive a depression score from the predicted values. The depression score is calculated by first regressing the VAD scores for a given sentence and then computing a scalar score from the resulting VAD vector.

3.4.1. VAD Vector Regression Model

For each input sentence, independent regression models were constructed to predict the valence, arousal, and dominance values. Each model is based on KLUE-RoBERTa [36], a pretrained Korean language model, and was fine-tuned on the affective sentence dataset developed in this study. Sentence embeddings are extracted using the RoBERTa encoder and passed through a regression layer with a single output node to predict each affective dimension on a scale of 1–9.
To ensure stable optimization during training, the target V, A, and D values were standardized using the mean μ and standard deviation σ computed from the training set. The normalized target y ^ was obtained as
y ^ = y μ σ
During validation and inference, the predicted normalized value was transformed back to the original 1–9 range using
y ˜ = y ^ · σ + μ
Here, μ and σ are precomputed on the training split; specifically, μ V = 3.1036 , σ V = 2.1210 , μ A = 5.76297 , σ A = 1.590486 , and μ D = 3.8244 , σ D = 1.3897869 (see Appendix B, Table A2).
This process allows the model to output a continuous VAD vector ( v , a , d ) for each sentence, with each dimension representing the affective characteristics of the text in a continuous space; in practice, a KLUE–RoBERTa encoder feeds a single linear regression head per dimension to produce the final scores.

3.4.2. Depression Score Calculation via Multi-Anchor Euclidean Distance

To derive a continuous depression score from the predicted VAD vector, this study adopts a mean-distance approach in the affective space. Specifically, multiple representative vectors (anchors) corresponding to depressive affective states are predefined, and the depression score is quantified as the mean Euclidean distance between the predicted VAD vector and these anchors.
Rationale for the metric. The PAD/VAD model is commonly construed as an orthogonal affective space with valence, arousal, and dominance serving as independent axes; thus, the Euclidean metric is the natural choice for measuring distances in this space [12,37]. Although empirical studies have shown that the VAD dimensions may not always behave independently in real-world data [38,39], we neglect these effects in the present study and retain the orthogonality assumption in order to prioritize interpretability and reproducibility of the score.
Following the PAD/VAD account of depression [12], we chose anchor terms whose VAD profiles align with low valence, moderately low arousal, and low dominance: “sadness”, “depressed”, and “sorrowful” from the NRC-VAD Lexicon [35]. Conceptually, these anchors target the dysphoric core of depression in the PAD/VAD framework—low valence, moderately low arousal, low dominance—rather than the full comorbid spectrum (e.g., anxiety, numbness, hopelessness). This preserves construct specificity and interpretability of the score. The lexicon scores were linearly mapped to our [ 1 ,   9 ] scale via ϕ ( u ) = 1 + 8 u . Let these anchor vectors be denoted μ 1 , μ 2 , and μ 3 , and define the depressive anchor set as { μ k } k = 1 3 . For a predicted sentence vector x R 3 , the depression score is computed as the mean Euclidean distance to the anchors:
D multi ( x ) = 1 3 k = 1 3 x μ k 2
Note that the factor 1 / 3 averages distances over the three anchors and does not impose any per-dimension weighting on V, A, or D.
Covariance-aware alternatives. We considered covariance-aware distances such as Mahalanobis (and the GLS view) as potential alternatives. However, in our setting the depressive anchor set comprises only three points, which is insufficient to estimate a stable covariance matrix for the depressive region (leading to ill-conditioned or singular Σ ). Using corpus-wide covariance instead would introduce dataset-dependent reweighting and reduce cross-dataset comparability. For these reasons we retain the Euclidean geometry in the main analysis; as future work, we plan to compute Mahalanobis distances using clinically verified depressive corpora and report a sensitivity analysis alongside the Euclidean variant.
The specific VAD values for each anchor are as follows: sadness ( 1.416 , 3.304 , 2.312 ) , depressed ( 1.192 , 4.560 , 2.088 ) , sorrowful ( 1.392 , 4.376 , 2.304 ) . The three anchors also form a compact cluster in VAD space with centroid ( V ¯ , A ¯ , D ¯ ) = ( 1.333 , 4.080 , 2.235 ) and a mean pairwise Euclidean distance of 0.91 (on the 1–9 scale), supporting their coherence as a dysphoric prototype. When computed on the ground-truth VAD vectors in the dataset, D multi spans the range [ 0.7892 , 9.7557 ] . Intuitively, smaller distances indicate closer proximity to depressive affective states in the affective space.
To transform this distance into a depression score, min–max scaling with inversion is applied. First, the distance d is normalized to the range [ 0 ,   100 ] using
s = d d min d max d min × 100
where d min = 0.7892 and d max = 9.7557 . Then, to ensure that lower distances (closer to depressive anchors) yield higher scores, the final depression score is defined as
DepressionScore ( x ) = 100 s
Beyond the continuous score, we also derive a binary at-risk label by thresholding the depression score at τ :
y ^ class ( x ) = DepressionScore ( x ) τ
In the main experiments (Section 4), we fix τ = 40 to enable a consistent comparison with classification-based approaches; unless otherwise noted, the positive class denotes the at-risk condition. For sensitivity analysis or operating-point selection, τ can alternatively be tuned on the validation set (e.g., by maximizing the F 1 score).
Thus, VAD vectors closer to the depressive anchors result in higher depression scores, indicating stronger depressive tendencies. This multi-anchor approach enables a structured interpretation of affective positions in the VAD space, capturing relationships with multiple depressive affective states rather than relying on a single label. Such continuous score representations facilitate fine-grained tracking of affective changes and have potential applications in clinical monitoring and user feedback-based personalization.

3.5. Training Setup

For predicting the continuous VAD values (valence, arousal, dominance) of each sentence, independent regression models were trained for each dimension. The base model was KLUE-RoBERTa [36], which has shown strong performance in Korean NLP tasks. Input sentences were tokenized with a maximum sequence length of 128. The implementation used Hugging Face transformers, with a single scalar output neuron for each regression target.
To improve training stability and convergence, the target label y was standardized and later restored following Equations (1) and (2). Specifically, during training we used z-scored labels computed with the training-set mean μ and standard deviation σ , and during validation/inference, predictions were mapped back to the original 1–9 scale via the inverse transformation.
Training was performed using the AdamW optimizer with a learning rate of 3 × 10 5 , batch size of 32, weight decay of 0.01, warmup ratio of 0.1, and gradient clipping with a maximum norm of 1.0 to stabilize training. The maximum number of epochs was 20, with early stopping applied if the validation MAE did not improve for 10 consecutive epochs. The best model was selected as the checkpoint achieving the lowest validation MAE on the restored 1–9 scale (via Equation (2)).
To mitigate bias from skewed label distributions, sample weights were assigned based on the distribution of target scores and applied in the loss computation. Specifically, for each VAD dimension we discretized the ground-truth targets on the original 1–9 scale into B = 10 equal-width bins. Let n b ( j ) denote the number of training samples whose target for dimension j { V , A , D } falls into bin b { 1 , , B } , and let N ( j ) be the total number of training samples for that dimension. We defined a bin weight α b ( j ) = N ( j ) B n b ( j ) so that each bin contributes equally in expectation, and assigned each sample i the weight w i ( j ) = α b i ( j ) according to its bin b i ( j ) . The training objective is the weighted mean squared error (WMSE) averaged over the three VAD dimensions (Equation (9)); for reference, the unweighted per-dimension MSE is given in Equation (7).
MSE ( j ) = 1 N i = 1 N y i ( j ) y ^ i ( j ) 2 , j { V , A , D } .
WMSE ( j ) = 1 i = 1 N w i ( j ) i = 1 N w i ( j ) y i ( j ) y ^ i ( j ) 2 , j { V , A , D } ,
L = 1 3 j { V , A , D } WMSE ( j ) .
In practice, we computed the weighted loss independently for each dimension and then averaged the three losses to obtain the final objective L .
During training, y i ( j ) and y ^ i ( j ) were standardized values obtained via Equation (1); for reporting, restored predictions y ˜ i ( j ) were computed via Equation (2).
For interpretability and consistency with the reported results, we additionally evaluated models using the mean absolute error (MAE) and the Pearson correlation coefficient r on the restored 1–9 scale (i.e., using y ˜ i obtained via Equation (2)). The MAE and Pearson r are defined as
MAE = 1 n i = 1 n | y i y ˜ i |
r = i = 1 n ( y i y ¯ ) ( y ˜ i y ˜ ¯ ) i = 1 n ( y i y ¯ ) 2 i = 1 n ( y ˜ i y ˜ ¯ ) 2
Here, y i denotes the ground-truth label on the original 1–9 scale, y ˜ i the restored prediction via Equation (2), and y ¯ , y ˜ ¯ their respective means. Unless otherwise specified, MAE and Pearson r are computed per VAD dimension (valence, arousal, dominance) and also for the derived depression score.
For the thresholded binary risk classification in Equation (6), we report precision, recall, and the F 1 score:
Precision = T P T P + F P , Recall = T P T P + F N , F 1 = 2 · Precision · Recall Precision + Recall
Predictions for these metrics were obtained by applying the fixed threshold τ in Equation (6) (set to τ = 40 in Section 4) to the restored depression scores, with the positive class defined as the at- risk condition.
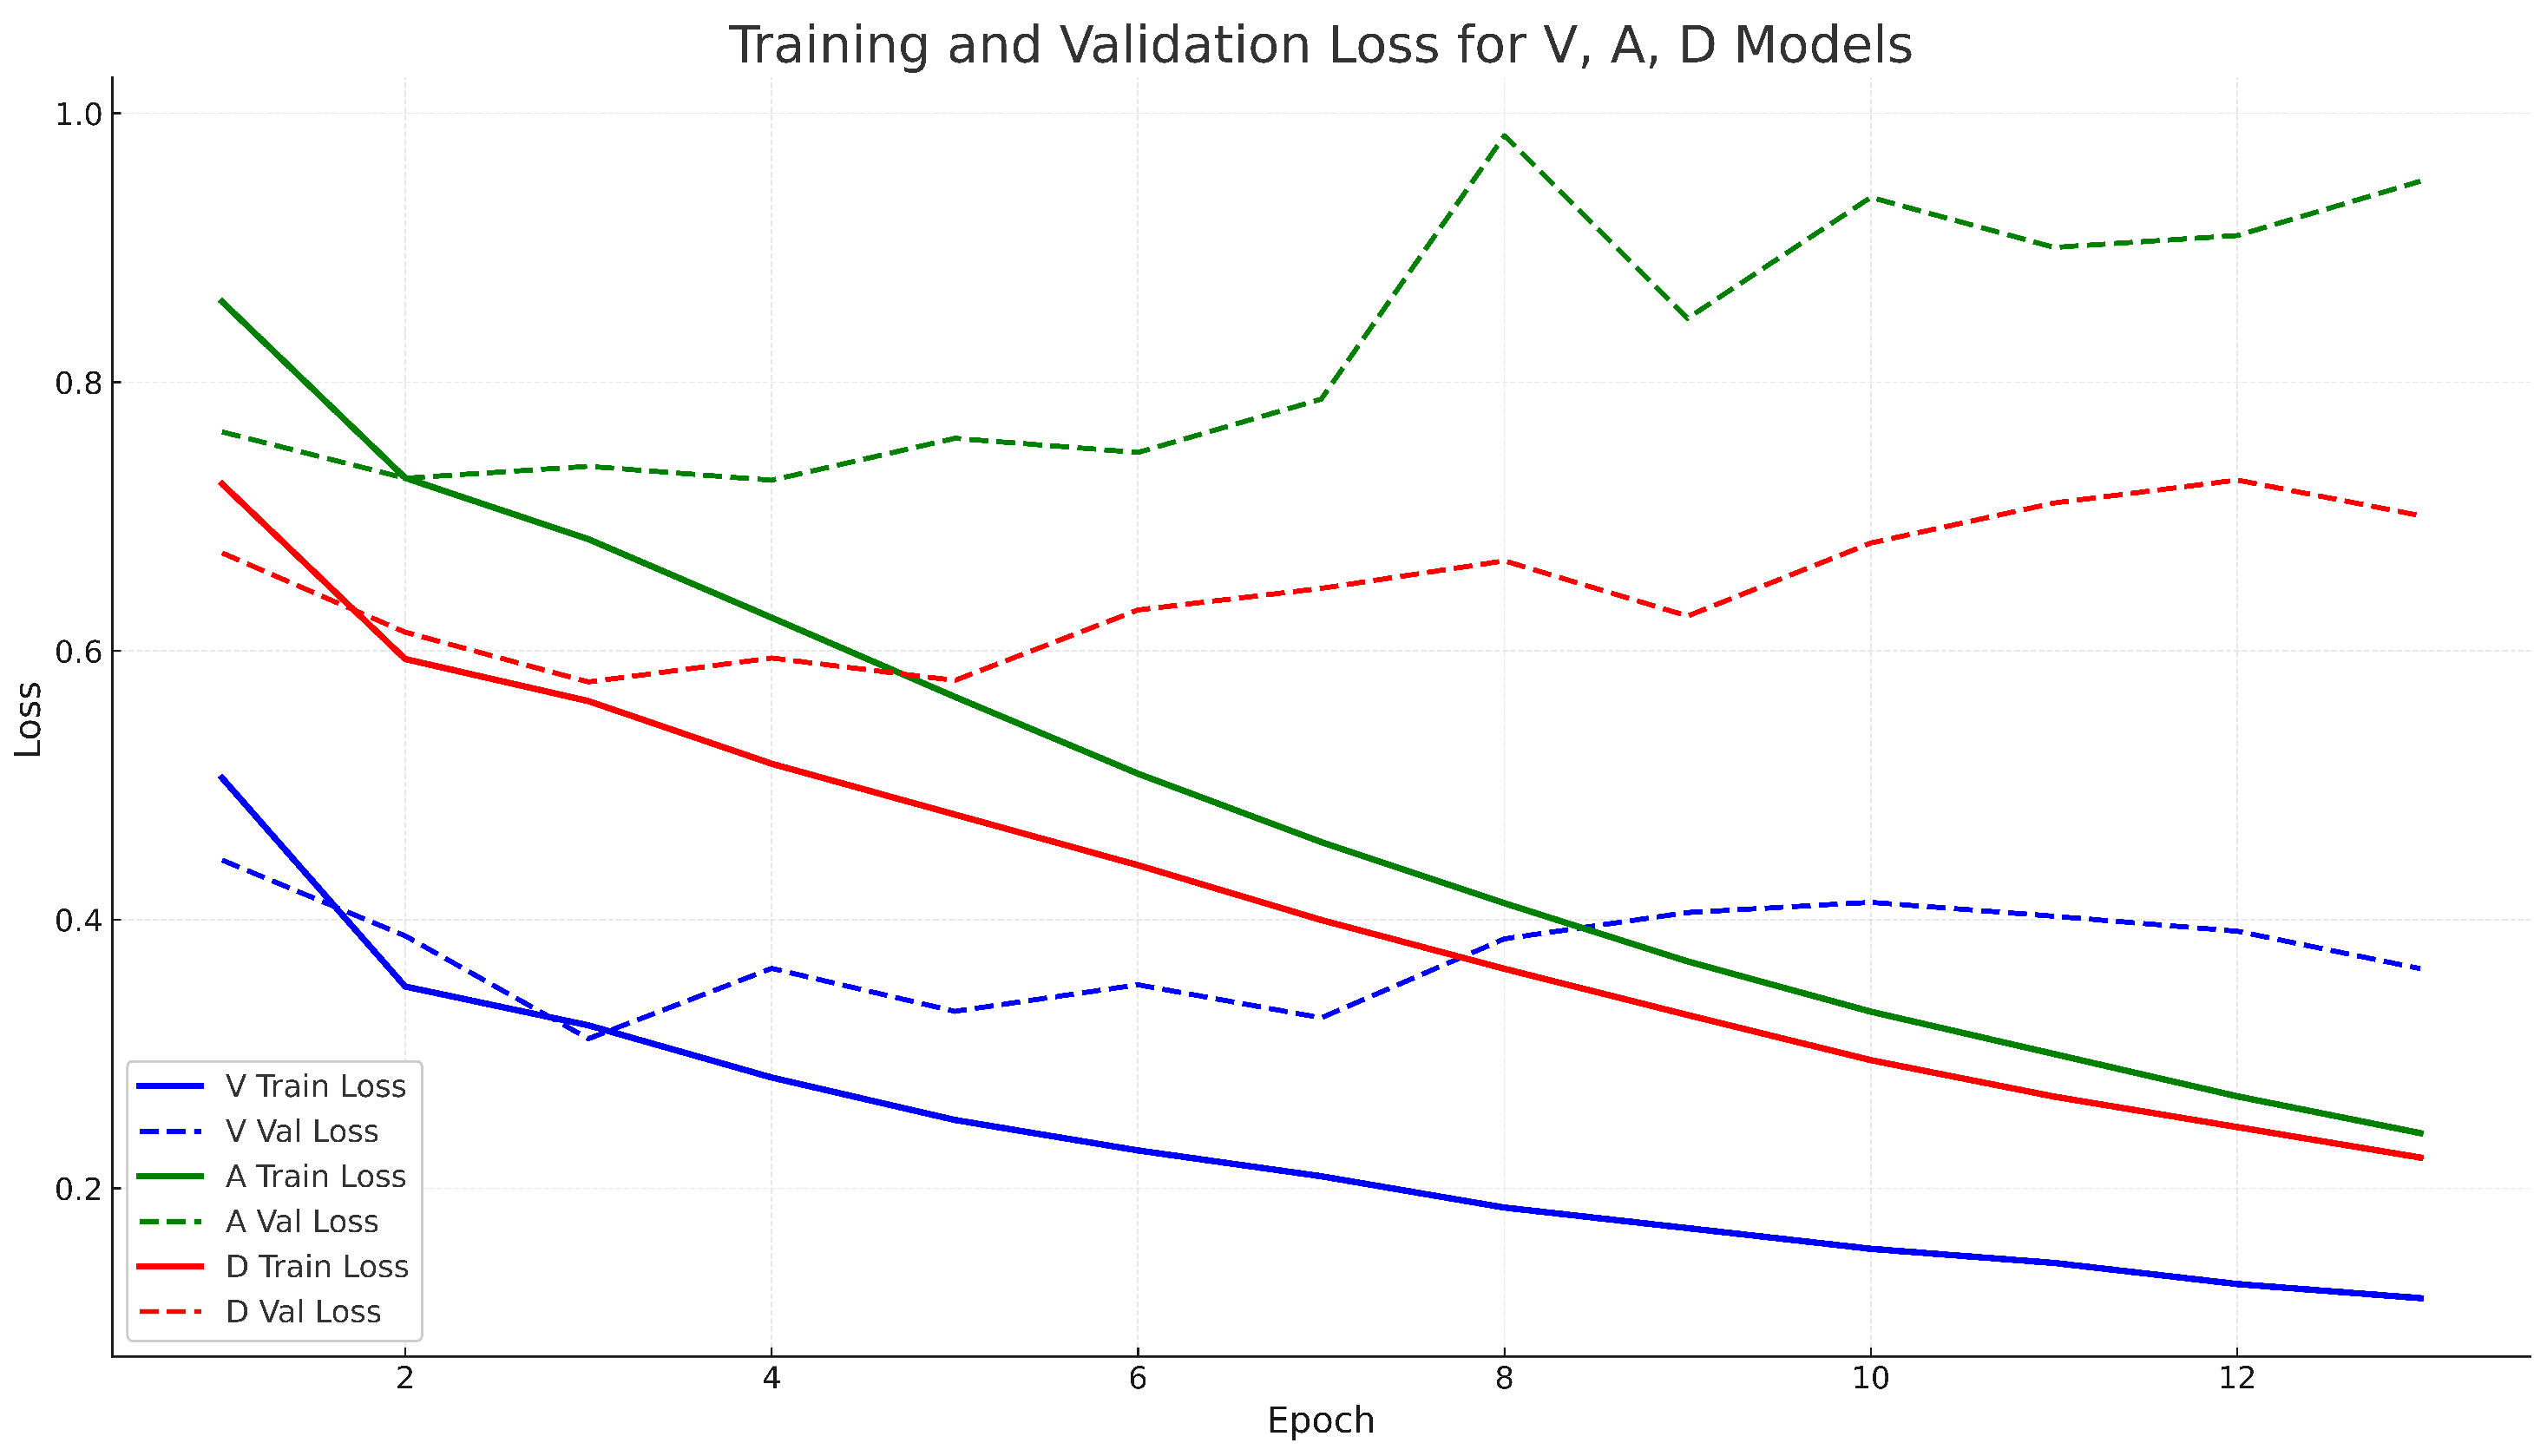
During training, the losses were computed on the standardized (z-score) labels, resulting in values typically within the 0–1 range. For interpretability, evaluation metrics such as MAE were calculated after inverse normalization to the original 1–9 VAD scale. Although the maximum number of training epochs was set to 20, the validation loss reached its minimum at the 3rd epoch and began to increase thereafter, indicating the onset of overfitting. Consequently, early stopping selected the model from epoch 3 as the final version. The training and validation loss curves are shown in Figure 5.

4. Experiments

After training each model, we evaluated their performance on a separate test dataset that was not used during training. For each sentence in the test set, we first predicted the values of valence (V), arousal (A), and dominance (D), then computed a continuous depression score using the proposed multi-anchor method. Regression performance metrics were calculated by comparing the predicted values with the ground truth. For comparison with classification-based approaches, we binarized the continuous depression score using a fixed threshold of τ = 40 (consistent with Section 4). The positive class denotes the at-risk condition, and we report standard classification metrics (precision, recall, and F 1 ) computed at this fixed threshold.
Table 2 summarizes the regression performance for the three affective dimensions (VAD), the regression results for the multi-anchor-based depression score, and the corresponding binary classification performance.
The prediction for the V dimension achieved a Pearson correlation of 0.88 and a low mean absolute error (MAE) of 0.64, indicating strong performance. The D dimension also showed reasonably stable prediction accuracy (Pearson 0.72, MAE 0.71), while the A dimension yielded the lowest correlation (0.58) and the highest MAE (1.01) among the three.
The continuous depression score derived from the VAD vectors via the multi-anchor method was normalized to the range of 0–100. It achieved an MAE of approximately 8.9 and a Pearson correlation of 0.87 with the ground truth, demonstrating a strong positive correlation and the ability to quantitatively reflect depression severity.
When converted to binary classification with a threshold of 40, the depression score achieved an accuracy of 98.25% and an F1-score of 0.9724. The balanced precision (0.97) and recall (0.97) indicate that the regression-based approach is effective for detecting high-risk depression cases.
To validate the effectiveness of the proposed model, we conducted comparison experiments with various baseline models on the same dataset. These baselines included a Support Vector Regression (SVR) model using VAD features, as well as pretrained language models such as BERT-base, KoELECTRA, and KLUE-RoBERTa. All models were trained and tested with identical inputs, preprocessing procedures, and evaluation metrics. For each model, two approaches were tested: (1) simple regression using precomputed depression scores as targets, and (2) the proposed VAD + Multi-anchor method.
Table 3 presents the depression score regression performance for each model in terms of MAE, Pearson correlation, and F1-score after binarization.
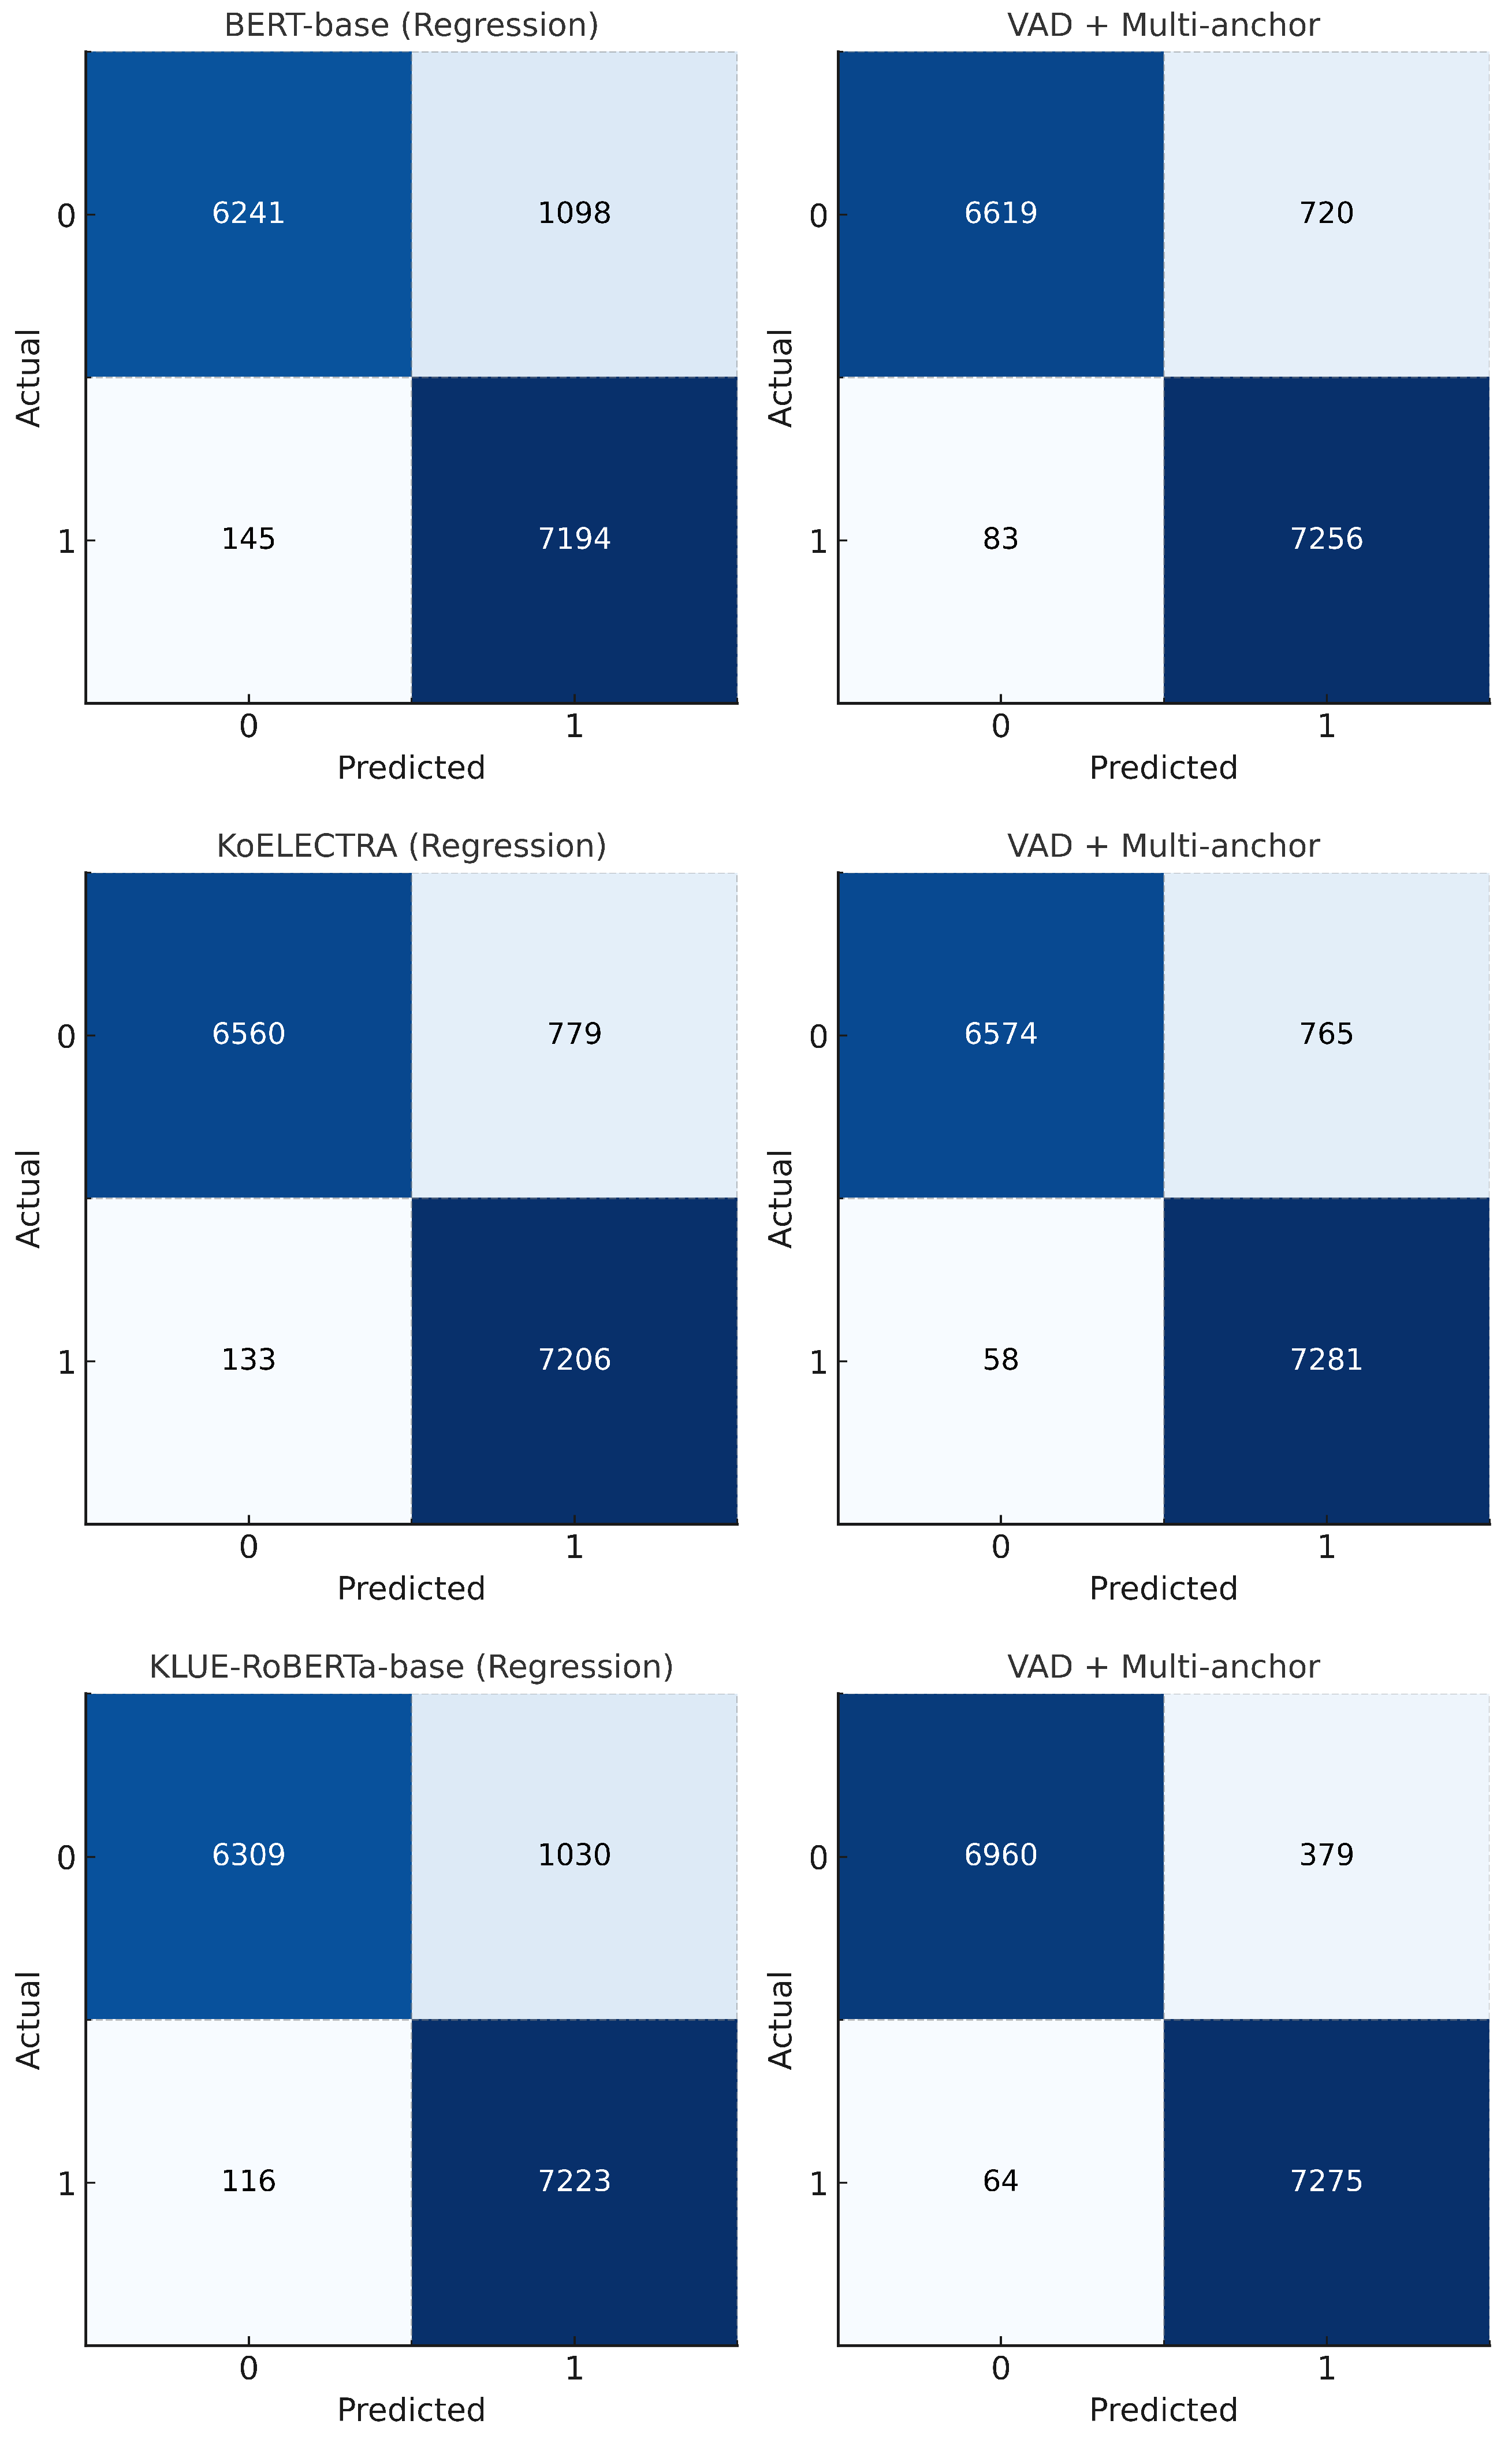
Notably, KLUE-RoBERTa-base with VAD + Multi-anchor achieved the best performance (MAE 8.90, Pearson 0.87, F1-score 0.97), demonstrating the advantages of predicting VAD dimensions first and then computing depression scores based on their distances to multiple depressive anchors in the affective space. Figure 6 presents the confusion matrices for the binary classification results. Models using the VAD + Multi-anchor method exhibited fewer false positives (FPs) and false negatives (FNs) compared to their simple regression counterparts, indicating more balanced class predictions. KLUE-RoBERTa-base (VAD + Multi-anchor) achieved the fewest false negatives, contributing to its high F1-score.
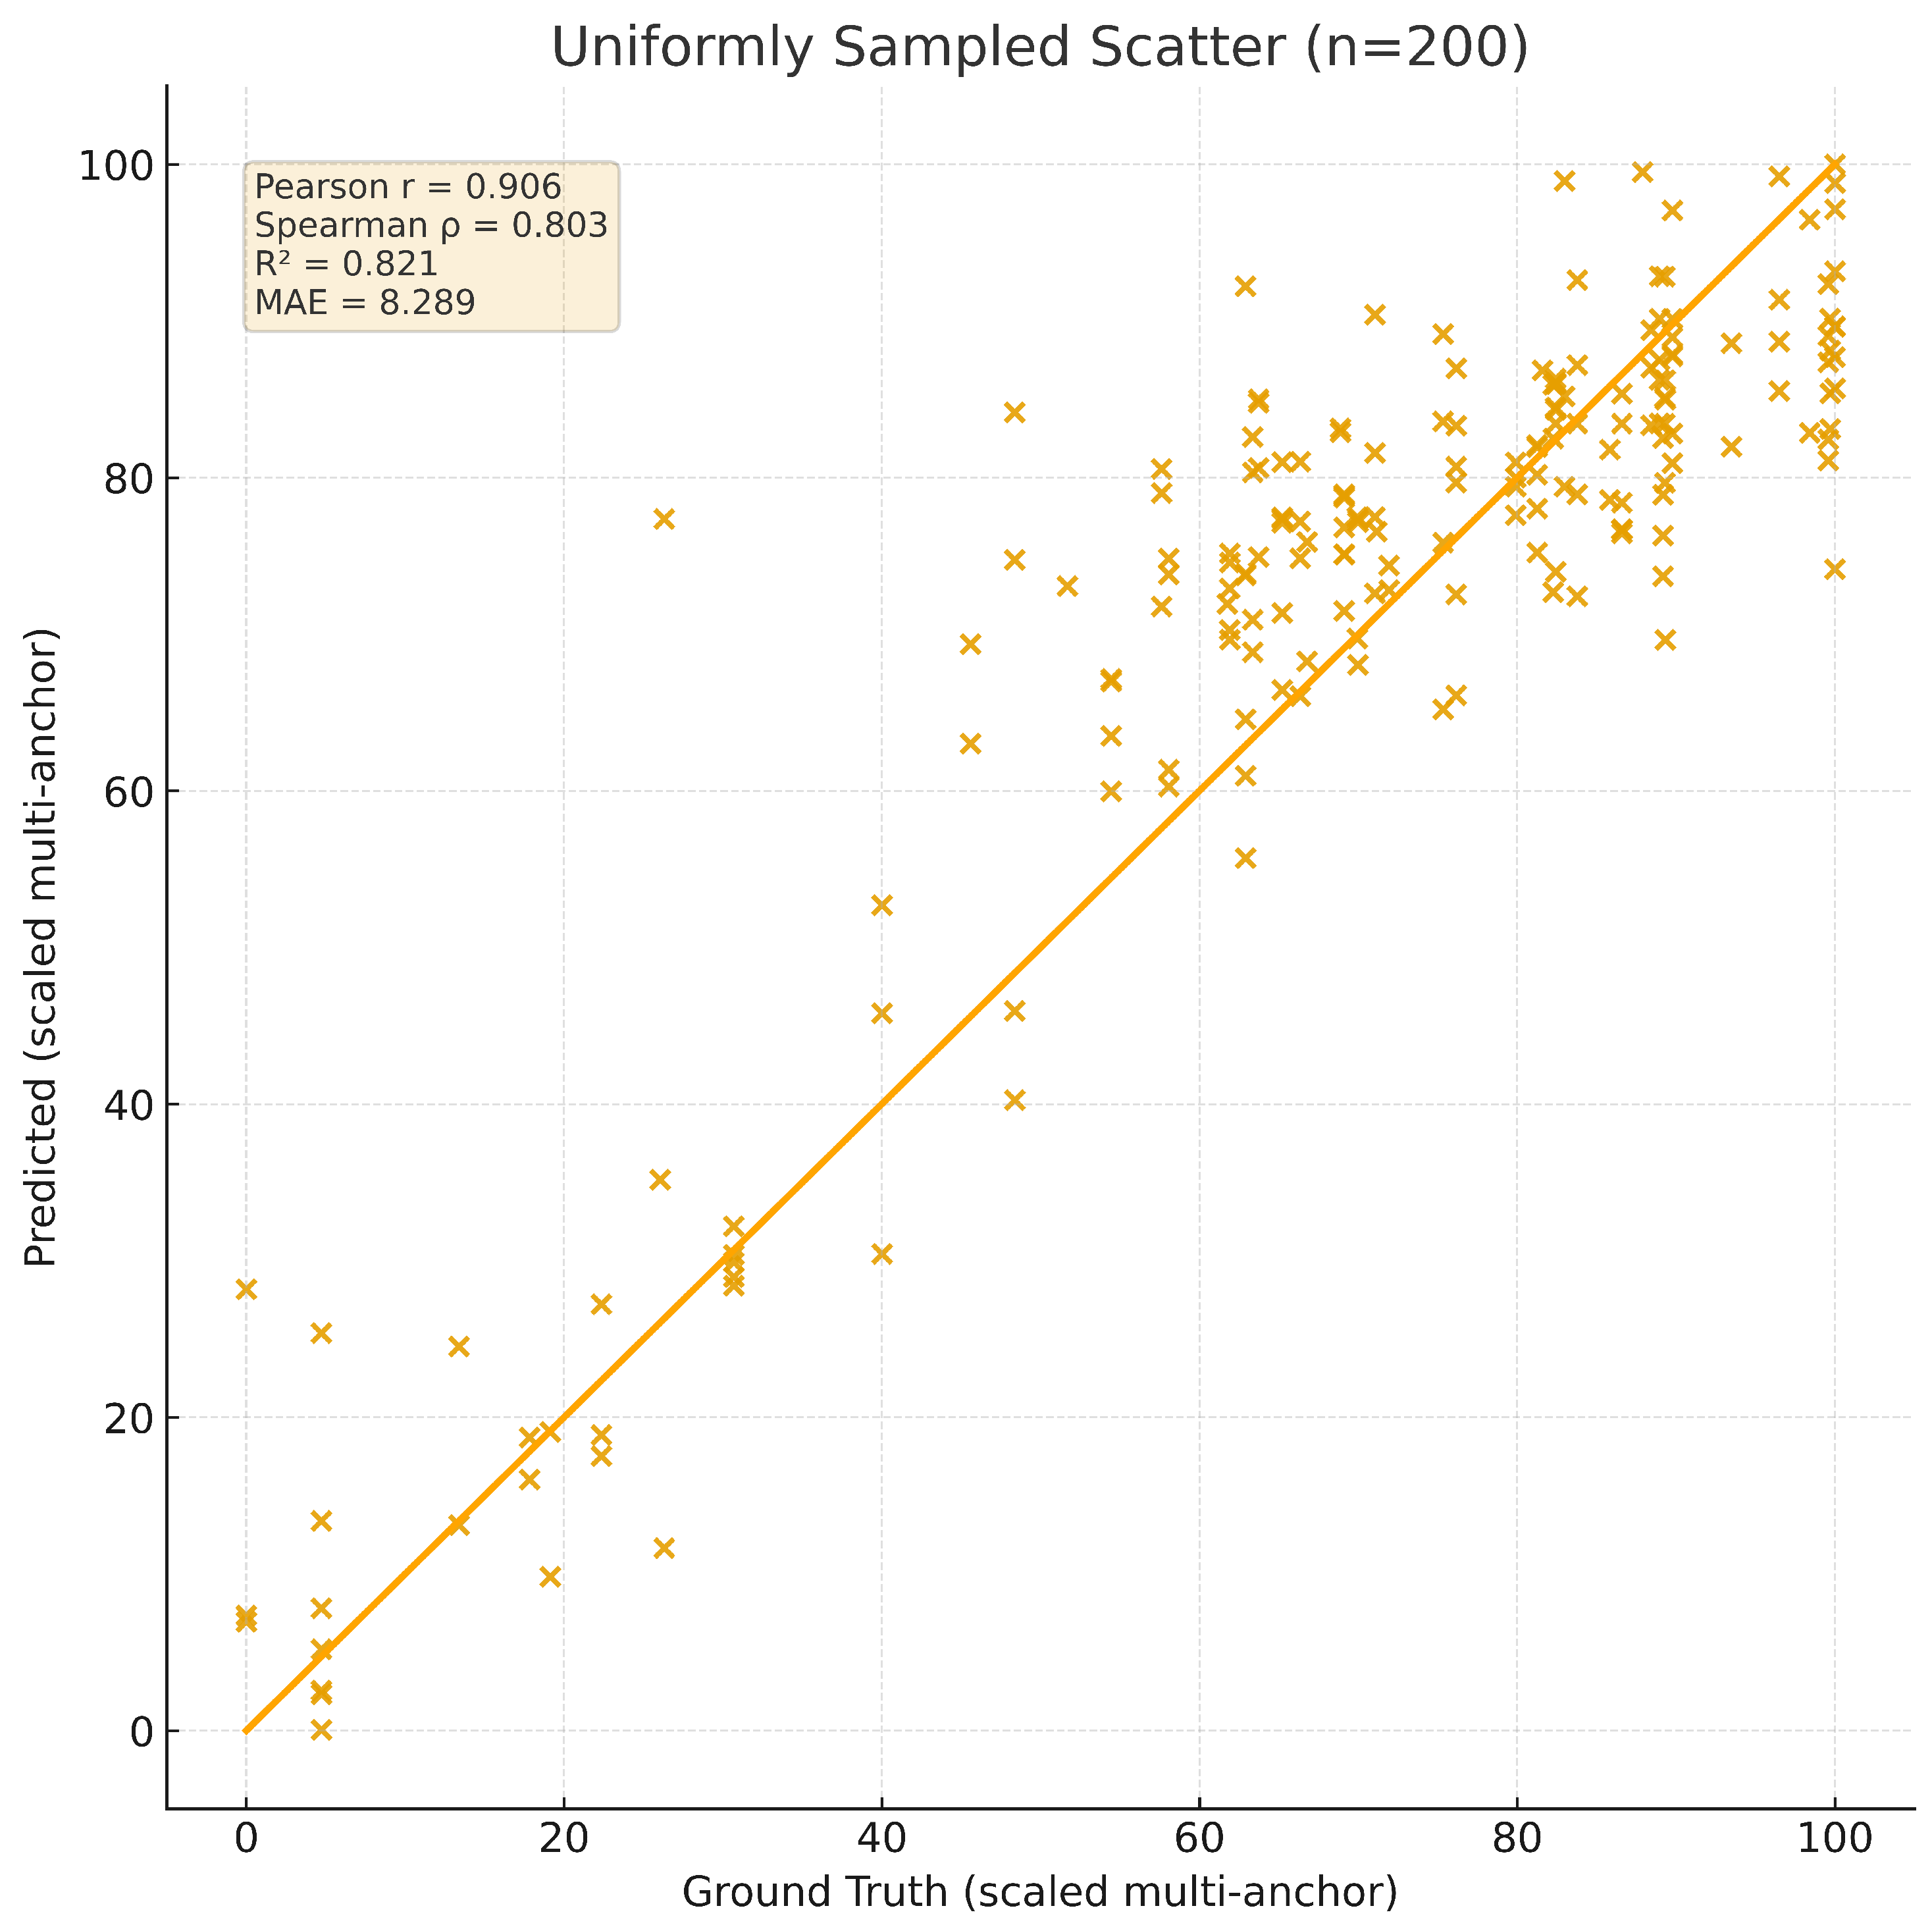
To further examine the regression performance of the proposed model, Figure 7 shows a scatter plot of the ground truth versus predicted depression scores. Samples were uniformly selected across the score range to provide a balanced visualization. Points near the diagonal line ( y = x ) indicate accurate predictions, confirming the model’s ability to quantitatively capture depression severity.
Finally, Table 4 provides a qualitative analysis of five representative sentences covering diverse VAD-based affective states. For each sentence, the table shows the predicted VAD values, deviations from the ground truth in parentheses, and the resulting depression scores.
This analysis shows that predicting the VAD dimensions enables a more fine-grained interpretation of affective states, and that the derived continuous depression scores provide richer insights than binary classification alone. Such quantitative outputs improve interpretability and offer practical flexibility for early detection, risk stratification, and personalized interventions in mental health applications.

5. Discussion and Conclusions

This study presented a web-based platform for quantitative depression risk prediction via VAD regression on Korean text and multi-anchor distance scoring. The system enables users to record diary entries, automatically predicts Valence–Arousal–Dominance (VAD) values, and derives depression scores based on multi-anchor distance, providing both self-reflection opportunities for users and early risk monitoring for professionals.
To support this, we constructed the Korean VAD-labeled dataset by integrating the NRC-VAD Lexicon, the Korean emotional dialogue corpus [34], and translated EmoBank [33] data, yielding 66,559 sentences with VAD labels. A KLUE-RoBERTa-based regression model was trained to predict VAD vectors, and depression scores were computed by measuring the inverse-scaled mean Euclidean distance to multiple depressive anchor vectors. The model achieved strong performance, with a Pearson correlation of r = 0.87 and an F1-score of 0.97 for binary depression risk classification, highlighting both predictive accuracy and interpretability.
The proposed framework offers several advantages. First, representing affective states in a continuous VAD space enables more fine-grained and explainable analysis than categorical classification. Second, the explicit and structured depression scoring process allows professionals to intuitively interpret outcomes and design intervention strategies. Third, the web-based platform facilitates continuous, low-burden monitoring, making it feasible to identify high-risk cases even among individuals reluctant to seek conventional mental health support.
Nonetheless, limitations remain. The arousal dimension exhibited relatively low correlation (0.58) and a higher MAE (1.01), suggesting the need for additional data collection and augmentation to balance label distributions. The depression threshold (e.g., 40) was heuristically defined and lacks clinical validation; collaboration with mental health experts will be necessary to establish clinically grounded cutoffs. Likewise, our initial anchor set is derived from a general-purpose affective lexicon and has not yet undergone clinical calibration. We also did not adopt a covariance-aware distance (e.g., Mahalanobis/GLS) because a clinically grounded covariance for the depressive region was unavailable; once such data are collected, we will compare Euclidean and Mahalanobis variants as part of a pre-registered sensitivity analysis. Finally, because our dataset integrates Korean emotion labels mapped to an English VAD lexicon, cross-lingual semantic shifts may persist (e.g., the Korean term “고립된” used in the context of social isolation can convey stronger affect than the English “isolated”), potentially biasing intensity estimates. In addition, our experiments were conducted on a curated corpus with relatively standardized register; generalization to in-the-wild text—e.g., colloquialisms, dialectal variants, spelling variations/emoji, and unstructured clinical notes—has not yet been verified. Such distribution shift may affect both regression accuracy and the stability/calibration of the derived depression score. Moreover, the platform’s real-world impact and user experience have yet to be validated through field deployment and clinical studies.
Future work will focus on (1) expanding and balancing the dataset, particularly for the arousal and dominance dimensions; additionally, collecting native Korean VAD ratings to calibrate cross-lingual mappings and reduce culture-specific intensity bias, (2) defining clinically validated thresholds and calibrating the anchor set with clinicians for depression scoring, (3) conducting user–expert interaction studies to assess practical usability and intervention effectiveness, and (4) evaluating out-of-domain generalization on real-world diaries and de-identified clinical texts by combining domain-adaptive pretraining, normalization/augmentation for slang and dialect, and domain-specific threshold calibration with uncertainty-aware triage. All prospective real-world evaluations will follow IRB approval and de-identification protocols. Through these steps, the proposed VAD regression on Korean text with multi-anchor scoring and its web-based implementation can be advanced into a reliable and accessible tool for proactive mental health care.

Author Contributions

Conceptualization, D.L. and C.K.; methodology, D.L.; software, D.L.; validation, K.L., J.J., H.L. and H.B.; formal analysis, D.L.; investigation, K.L., J.J., H.L. and H.B.; resources, C.K.; data curation, K.L., J.J., H.L. and H.B.; writing—original draft preparation, D.L.; writing—review and editing, C.K.; visualization, D.L.; supervision, C.K.; project administration, C.K.; funding acquisition, C.K. All authors have read and agreed to the published version of the manuscript.

Funding

Learning & Academic research institution for Master’ PhD students, and Postdocs (LAMP) Program of the National Research Foundation of Korea (NRF) grant funded by the Ministry of Education (No. RS-2023-00301974).

Institutional Review Board Statement

Not applicable.

Informed Consent Statement

Not applicable.

Data Availability Statement

The raw datasets analyzed in this study are third-party resources and cannot be redistributed by the authors. EmoBank [33] is available under the CC BY-SA 4.0 license. (https://creativecommons.org/licenses/by-sa/4.0/ (accessed on 8 April 2025)). The AI Hub emotional dialogue corpus [34] is accessible to registered users under AI Hub terms that allow analysis, publication, and model/service deployment with proper attribution, while prohibiting redistribution of the original files. Consistent with these terms, we provide our preprocessing scripts, mapping rules upon request from the corresponding author.

Acknowledgments

This research (paper) used datasets from “The Open AI Dataset Project (AI-Hub, S. Korea)”. All data information can be accessed through “AI-Hub (www.aihub.or.kr (accessed on 10 May 2025))”.

Conflicts of Interest

The authors declare no conflicts of interest.

Appendix A. Complete Mapping of Korean Emotions

Table A1. Full mapping of Korean emotion labels to VAD scores using NRC-VAD Lexicon [35] keywords. Each entry shows the Korean emotion label, its code, the mapped NRC keyword, and the corresponding valence (V), arousal (A), and dominance (D) scores. Source: author’s contribution.
Emotion Label (Korean)CodeNRC WordVAD
anger (분노)E10anger2.3367.9206.256
grunting (툴툴대는)E11grunting2.5847.6164.848
frustrated (좌절한)E12frustrated1.6406.2083.040
annoyed (짜증내는)E13annoyed1.8327.2643.760
defensive (방어적인)E14defensive5.3366.1206.424
malicious (악의적인)E15malicious2.4167.1205.856
impatient (안달하는)E16impatient3.0006.6644.432
disgusting (구역질 나는)E17disgusting1.2487.3682.960
angry (노여워하는)E18angry1.9767.6405.832
annoying (성가신)E19annoying1.6567.8243.784
sadness (슬픔)E20sadness1.4163.3042.312
disappointed (실망한)E21disappointed1.5684.7762.928
sorrowful (비통한)E22sorrowful1.3924.3762.304
regretful (후회되는)E23regretful2.3364.8402.504
depressed (우울한)E24depressed1.1924.5602.088
numb (마비된)E25numb1.8644.3603.816
pessimistic (염세적인)E26pessimistic1.7044.1522.888
tearful (눈물이 나는)E27tearful2.6645.0002.472
discouraged (낙담한)E28discouraged2.7603.4321.360
jaded (환멸을 느끼는)E29jaded3.0405.4804.200
anxiety (불안)E30anxiety2.1687.9203.736
afraid (두려운)E31afraid1.0926.4082.884
stressed out (스트레스 받는)E32stressed out2.0005.3443.168
vulnerable (취약한)E33vulnerable2.5844.9202.960
confused (혼란스러운)E34confused2.7606.2002.432
baffled (당혹스러운)E35baffled2.2085.8003.712
skeptical (회의적인)E36skeptical2.6565.0004.616
worried (걱정스러운)E37worried1.7527.5924.160
cautious (조심스러운)E38cautious4.7604.5605.136
nervous (초조한)E39nervous2.6687.5602.704
hurt (상처)E40hurt1.4967.1843.328
jealous (질투하는)E41jealous2.3847.8403.760
betrayed (배신당한)E42betrayed1.9767.1523.464
isolated (고립된)E43isolated2.7683.8483.040
shocked (충격 받은)E44shocked3.3367.1844.000
poor, needy (가난한, 불우한)E45poor, needy3.0644.2362.242
victimized (희생된)E46victimized1.9206.1523.184
resentful (억울한)E47resentful1.9605.8643.592
distressed (괴로워하는)E48distressed2.1447.1683.592
abandoned (버려진)E49abandoned1.3684.8482.040
embarrassed (당황)E50embarrassed2.4725.4803.120
isolated (고립된(당황한))E51isolated2.7683.8483.040
self conscious (남의 시선을 의식하는)E52self conscious5.6645.1605.256
lonely (외로운)E53lonely3.0002.8082.904
inferiority complex (열등감)E54inferiority complex3.8965.9443.584
guilty (죄책감의)E55guilty2.0807.1603.816
ashamed (부끄러운)E56ashamed2.2485.7042.824
repulsive (혐오스러운)E57repulsive2.1687.2004.400
pathetic (한심한)E58pathetic1.7044.7122.112
confused (혼란스러운(당황한))E59confused2.7606.2002.432
joy (기쁨)E60joy8.8407.5927.352
grateful (감사하는)E61grateful8.6643.8245.480
trusting (신뢰하는)E62trusting7.8565.0647.000
comfortable (편안한)E63comfortable8.4162.3044.784
satisfied (만족스러운)E64satisfied8.6725.0806.480
excited (흥분)E65excited8.2648.4486.672
relaxed (느긋)E66relaxed7.9201.3604.244
relief (안도)E67relief7.7523.2244.848
excited (신이 난)E68excited8.2648.4486.672
confident (자신하는)E69confident7.1203.5926.784

Appendix B. Constants and Data-Derived Statistics

Table A2. Constants and data-derived statistics used in the study. Source: author’s contribution.
Symbol/SettingValueUsage (Eq./Sec.)Determination/Procedure
μ V 3.1036Equations (1) and (2)Mean of valence on the training split (1–9 scale).
σ V 2.1210Equations (1) and (2)Std. of valence on the training split (1–9 scale).
μ A 5.76297Equations (1) and (2)Mean of arousal on the training split (1–9 scale).
σ A 1.590486Equations (1) and (2)Std. of arousal on the training split (1–9 scale).
μ D 3.8244Equations (1) and (2)Mean of dominance on the training split (1–9 scale).
σ D 1.3897869Equations (1) and (2)Std. of dominance on the training split (1–9 scale).
d min 0.7892Equation (4)Minimum of D multi computed on ground-truth VAD vectors over the dataset.
d max 9.7557Equation (4)Maximum of D multi computed on ground-truth VAD vectors over the dataset.
τ 40Equation (6)Fixed threshold for binary at-risk label in main experiments; may be tuned on validation if noted.
B10Equations (8) and (9)Number of equal-width bins on the 1–9 scale for computing sample weights.
ϕ ( u ) 1 + 8 u Section 3.3Linear map from [ 0 , 1 ] (lexicon) to [ 1 ,   9 ] (model/output) applied elementwise to V , A , D .
Split ratio4:1:1Section 3.3Train/validation/test split; all statistics (e.g., μ , σ ) estimated on the training split only.

References

  1. Park, S.M.; Joo, M.J.; Lim, J.H.; Jang, S.Y.; Park, E.C.; Ha, M.J. Association between hikikomori (social withdrawal) and depression in Korean young adults. J. Affect. Disord. 2025, 380, 647–654. [Google Scholar] [CrossRef]
  2. Leigh-Hunt, N.; Bagguley, D.; Bash, K.; Turner, V.; Turnbull, S.; Valtorta, N.; Caan, W. An overview of systematic reviews on the public health consequences of social isolation and loneliness. Public Health 2017, 152, 157–171. [Google Scholar] [CrossRef]
  3. Wong, J.C.M.; Wan, M.J.S.; Kroneman, L.; Kato, T.A.; Lo, T.W.; Wong, P.W.C.; Chan, G.H. Hikikomori phenomenon in East Asia: Regional perspectives, challenges, and opportunities for social health agencies. Front. Psychiatry 2019, 10, 512. [Google Scholar] [CrossRef] [PubMed]
  4. Goldman, N.; Khanna, D.; El Asmar, M.L.; Qualter, P.; El-Osta, A. Addressing loneliness and social isolation in 52 countries: A scoping review of National policies. BMC Public Health 2024, 24, 1207. [Google Scholar] [CrossRef]
  5. Muris, P.; Ollendick, T.H. Contemporary hermits: A developmental psychopathology account of extreme social withdrawal (Hikikomori) in young people. Clin. Child Fam. Psychol. Rev. 2023, 26, 459–481. [Google Scholar] [CrossRef] [PubMed]
  6. Ogawa, T.; Shiratori, Y.; Midorikawa, H.; Aiba, M.; Sugawara, D.; Kawakami, N.; Arai, T.; Tachikawa, H. A survey of changes in the psychological state of individuals with social withdrawal (hikikomori) in the context of the COVID pandemic. COVID 2023, 3, 1158–1172. [Google Scholar] [CrossRef]
  7. Lin, P.K.; Andrew.; Koh, A.H.; Liew, K. The relationship between Hikikomori risk factors and social withdrawal tendencies among emerging adults—An exploratory study of Hikikomori in Singapore. Front. Psychiatry 2022, 13, 1065304. [Google Scholar] [CrossRef]
  8. Lin, T.; Heckman, T.G.; Anderson, T. The efficacy of synchronous teletherapy versus in-person therapy: A meta-analysis of randomized clinical trials. Clin. Psychol. Sci. Pract. 2022, 29, 167. [Google Scholar] [CrossRef]
  9. Giovanetti, A.K.; Punt, S.E.; Nelson, E.L.; Ilardi, S.S. Teletherapy versus in-person psychotherapy for depression: A meta-analysis of randomized controlled trials. Telemed. E-Health 2022, 28, 1077–1089. [Google Scholar] [CrossRef]
  10. Fernandez, E.; Woldgabreal, Y.; Day, A.; Pham, T.; Gleich, B.; Aboujaoude, E. Live psychotherapy by video versus in-person: A meta-analysis of efficacy and its relationship to types and targets of treatment. Clin. Psychol. Psychother. 2021, 28, 1535–1549. [Google Scholar] [CrossRef]
  11. Yamazaki, S.; Ura, C.; Inagaki, H.; Sugiyama, M.; Miyamae, F.; Edahiro, A.; Ito, K.; Iwasaki, M.; Sasai, H.; Okamura, T.; et al. Social isolation and well-being among families of middle-aged and older hikikomori people. Psychogeriatrics 2024, 24, 145–147. [Google Scholar] [CrossRef]
  12. Mehrabian, A. Analysis of the big-five personality factors in terms of the PAD temperament model. Aust. J. Psychol. 1996, 48, 86–92. [Google Scholar] [CrossRef]
  13. Kannan, K.D.; Jagatheesaperumal, S.K.; Kandala, R.N.; Lotfaliany, M.; Alizadehsanid, R.; Mohebbi, M. Advancements in machine learning and deep learning for early detection and management of mental health disorder. arXiv 2024, arXiv:2412.06147. [Google Scholar] [CrossRef]
  14. Olawade, D.B.; Wada, O.Z.; Odetayo, A.; David-Olawade, A.C.; Asaolu, F.; Eberhardt, J. Enhancing mental health with Artificial Intelligence: Current trends and future prospects. J. Med. Surgery Public Health 2024, 3, 100099. [Google Scholar] [CrossRef]
  15. Nag, P.K.; Bhagat, A.; Priya, R.V.; Khare, D.K. Emotional intelligence through artificial intelligence: Nlp and deep learning in the analysis of healthcare texts. In Proceedings of the 2023 International Conference on Artificial Intelligence for Innovations in Healthcare Industries (ICAIIHI), Raipur, India, 29–30 December 2023; IEEE: Piscataway, NJ, USA, 2023; Volume 1, pp. 1–7. [Google Scholar] [CrossRef]
  16. Zhang, T.; Schoene, A.M.; Ji, S.; Ananiadou, S. Natural language processing applied to mental illness detection: A narrative review. NPJ Digit. Med. 2022, 5, 46. [Google Scholar] [CrossRef]
  17. Zhang, Z.; Zhu, J.; Guo, Z.; Zhang, Y.; Li, Z.; Hu, B. Natural Language Processing for Depression Prediction on Sina Weibo: Method Study and Analysis. JMIR Ment. Health 2024, 11, e58259. [Google Scholar] [CrossRef]
  18. Mansoor, M.A.; Ansari, K.H. Early detection of mental health crises through artificial-intelligence-powered social media analysis: A prospective observational study. J. Pers. Med. 2024, 14, 958. [Google Scholar] [CrossRef] [PubMed]
  19. Gavalan, H.S.; Rastgoo, M.N.; Nakisa, B. A BERT-Based Summarization approach for depression detection. arXiv 2024, arXiv:2409.08483. [Google Scholar] [CrossRef]
  20. Saffar, A.H.; Mann, T.K.; Ofoghi, B. Textual emotion detection in health: Advances and applications. J. Biomed. Inform. 2023, 137, 104258. [Google Scholar] [CrossRef] [PubMed]
  21. Teferra, B.G.; Rueda, A.; Pang, H.; Valenzano, R.; Samavi, R.; Krishnan, S.; Bhat, V. Screening for Depression Using Natural Language Processing: Literature Review. Interact. J. Med. Res. 2024, 13, e55067. [Google Scholar] [CrossRef]
  22. Zhong, Z.; Wang, Z. Intelligent Depression Prevention via LLM-Based Dialogue Analysis: Overcoming the Limitations of Scale-Dependent Diagnosis through Precise Emotional Pattern Recognition. arXiv 2025, arXiv:2504.16504. [Google Scholar] [CrossRef]
  23. Qin, W.; Chen, Z.; Wang, L.; Lan, Y.; Ren, W.; Hong, R. Read, diagnose and chat: Towards explainable and interactive LLMs-augmented depression detection in social media. arXiv 2023, arXiv:2305.05138. [Google Scholar] [CrossRef]
  24. Li, H.; Zhang, R.; Lee, Y.C.; Kraut, R.E.; Mohr, D.C. Systematic review and meta-analysis of AI-based conversational agents for promoting mental health and well-being. NPJ Digit. Med. 2023, 6, 236. [Google Scholar] [CrossRef]
  25. Cui, X.; Gu, Y.; Fang, H.; Zhu, T. Development and Evaluation of LLM-Based Suicide Intervention Chatbot. Front. Psychiatry 2025, 16, 1634714. [Google Scholar] [CrossRef] [PubMed]
  26. Wang, Y.; Wang, Y.; Xiao, Y.; Escamilla, L.; Augustine, B.; Crace, K.; Zhou, G.; Zhang, Y. Evaluating an LLM-Powered Chatbot for Cognitive Restructuring: Insights from Mental Health Professionals. arXiv 2025, arXiv:2501.15599. [Google Scholar] [CrossRef]
  27. Hadjar, H.; Vu, B.; Hemmje, M. TheraSense: Deep Learning for Facial Emotion Analysis in Mental Health Teleconsultation. Electronics 2025, 14, 422. [Google Scholar] [CrossRef]
  28. Zhang, Z.; Zhang, S.; Ni, D.; Wei, Z.; Yang, K.; Jin, S.; Huang, G.; Liang, Z.; Zhang, L.; Li, L.; et al. Multimodal sensing for depression risk detection: Integrating audio, video, and text data. Sensors 2024, 24, 3714. [Google Scholar] [CrossRef]
  29. Gimeno-Gómez, D.; Bucur, A.M.; Cosma, A.; Martínez-Hinarejos, C.D.; Rosso, P. Reading between the frames: Multi-modal depression detection in videos from non-verbal cues. In Proceedings of the European Conference on Information Retrieval, Glasgow, UK, 24–28 March 2024; Springer: Berlin/Heidelberg, Germany, 2024; pp. 191–209. [Google Scholar] [CrossRef]
  30. Park, S.; Kim, J.; Ye, S.; Jeon, J.; Park, H.Y.; Oh, A. Dimensional emotion detection from categorical emotion. arXiv 2019, arXiv:1911.02499. [Google Scholar] [CrossRef]
  31. Mitsios, M.; Vamvoukakis, G.; Maniati, G.; Ellinas, N.; Dimitriou, G.; Markopoulos, K.; Kakoulidis, P.; Vioni, A.; Christidou, M.; Oh, J.; et al. Improved text emotion prediction using combined valence and arousal ordinal classification. arXiv 2024, arXiv:2404.01805. [Google Scholar] [CrossRef]
  32. Fatima, A.; Li, Y.; Hills, T.T.; Stella, M. Dasentimental: Detecting depression, anxiety, and stress in texts via emotional recall, cognitive networks, and machine learning. Big Data Cogn. Comput. 2021, 5, 77. [Google Scholar] [CrossRef]
  33. Buechel, S.; Hahn, U. Emobank: Studying the impact of annotation perspective and representation format on dimensional emotion analysis. arXiv 2022, arXiv:2205.01996. [Google Scholar] [CrossRef]
  34. AI Hub. Emotional Dialogue Corpus. 2022. Available online: https://aihub.or.kr/aihubdata/data/view.do?dataSetSn=86 (accessed on 13 January 2025).
  35. Mohammad, S.M. NRC VAD Lexicon v2: Norms for valence, arousal, and dominance for over 55k English terms. arXiv 2025, arXiv:2503.23547. [Google Scholar] [CrossRef]
  36. Park, S.; Moon, J.; Kim, S.; Cho, W.I.; Han, J.; Park, J.; Song, C.; Kim, J.; Song, Y.; Oh, T.; et al. Klue: Korean language understanding evaluation. arXiv 2021, arXiv:2105.09680. [Google Scholar] [CrossRef]
  37. Vaiouli, P.; Panteli, M.; Panayiotou, G. Affective and psycholinguistic norms of Greek words: Manipulating their affective or psycho-linguistic dimensions. Curr. Psychol. 2023, 42, 10299–10309. [Google Scholar] [CrossRef]
  38. Kuppens, P.; Tuerlinckx, F.; Russell, J.A.; Barrett, L.F. The relation between valence and arousal in subjective experience. Psychol. Bull. 2013, 139, 917. [Google Scholar] [CrossRef] [PubMed]
  39. Nandy, R.; Nandy, K.; Walters, S.T. Relationship between valence and arousal for subjective experience in a real-life setting for supportive housing residents: Results from an ecological momentary assessment study. JMIR Form. Res. 2023, 7, e34989. [Google Scholar] [CrossRef]
  40. Devlin, J.; Chang, M.W.; Lee, K.; Toutanova, K. Bert: Pre-training of deep bidirectional transformers for language understanding. In Proceedings of the 2019 Conference of the North American Chapter of the Association for Computational Linguistics: Human Language Technologies, Minneapolis, MN, USA, 2–7 June 2019; Volume 1, pp. 4171–4186. [Google Scholar] [CrossRef]
  41. Park, J. KoELECTRA: Pretrained ELECTRA Model for Korean. 2020. Available online: https://github.com/monologg/KoELECTRA (accessed on 13 June 2025).
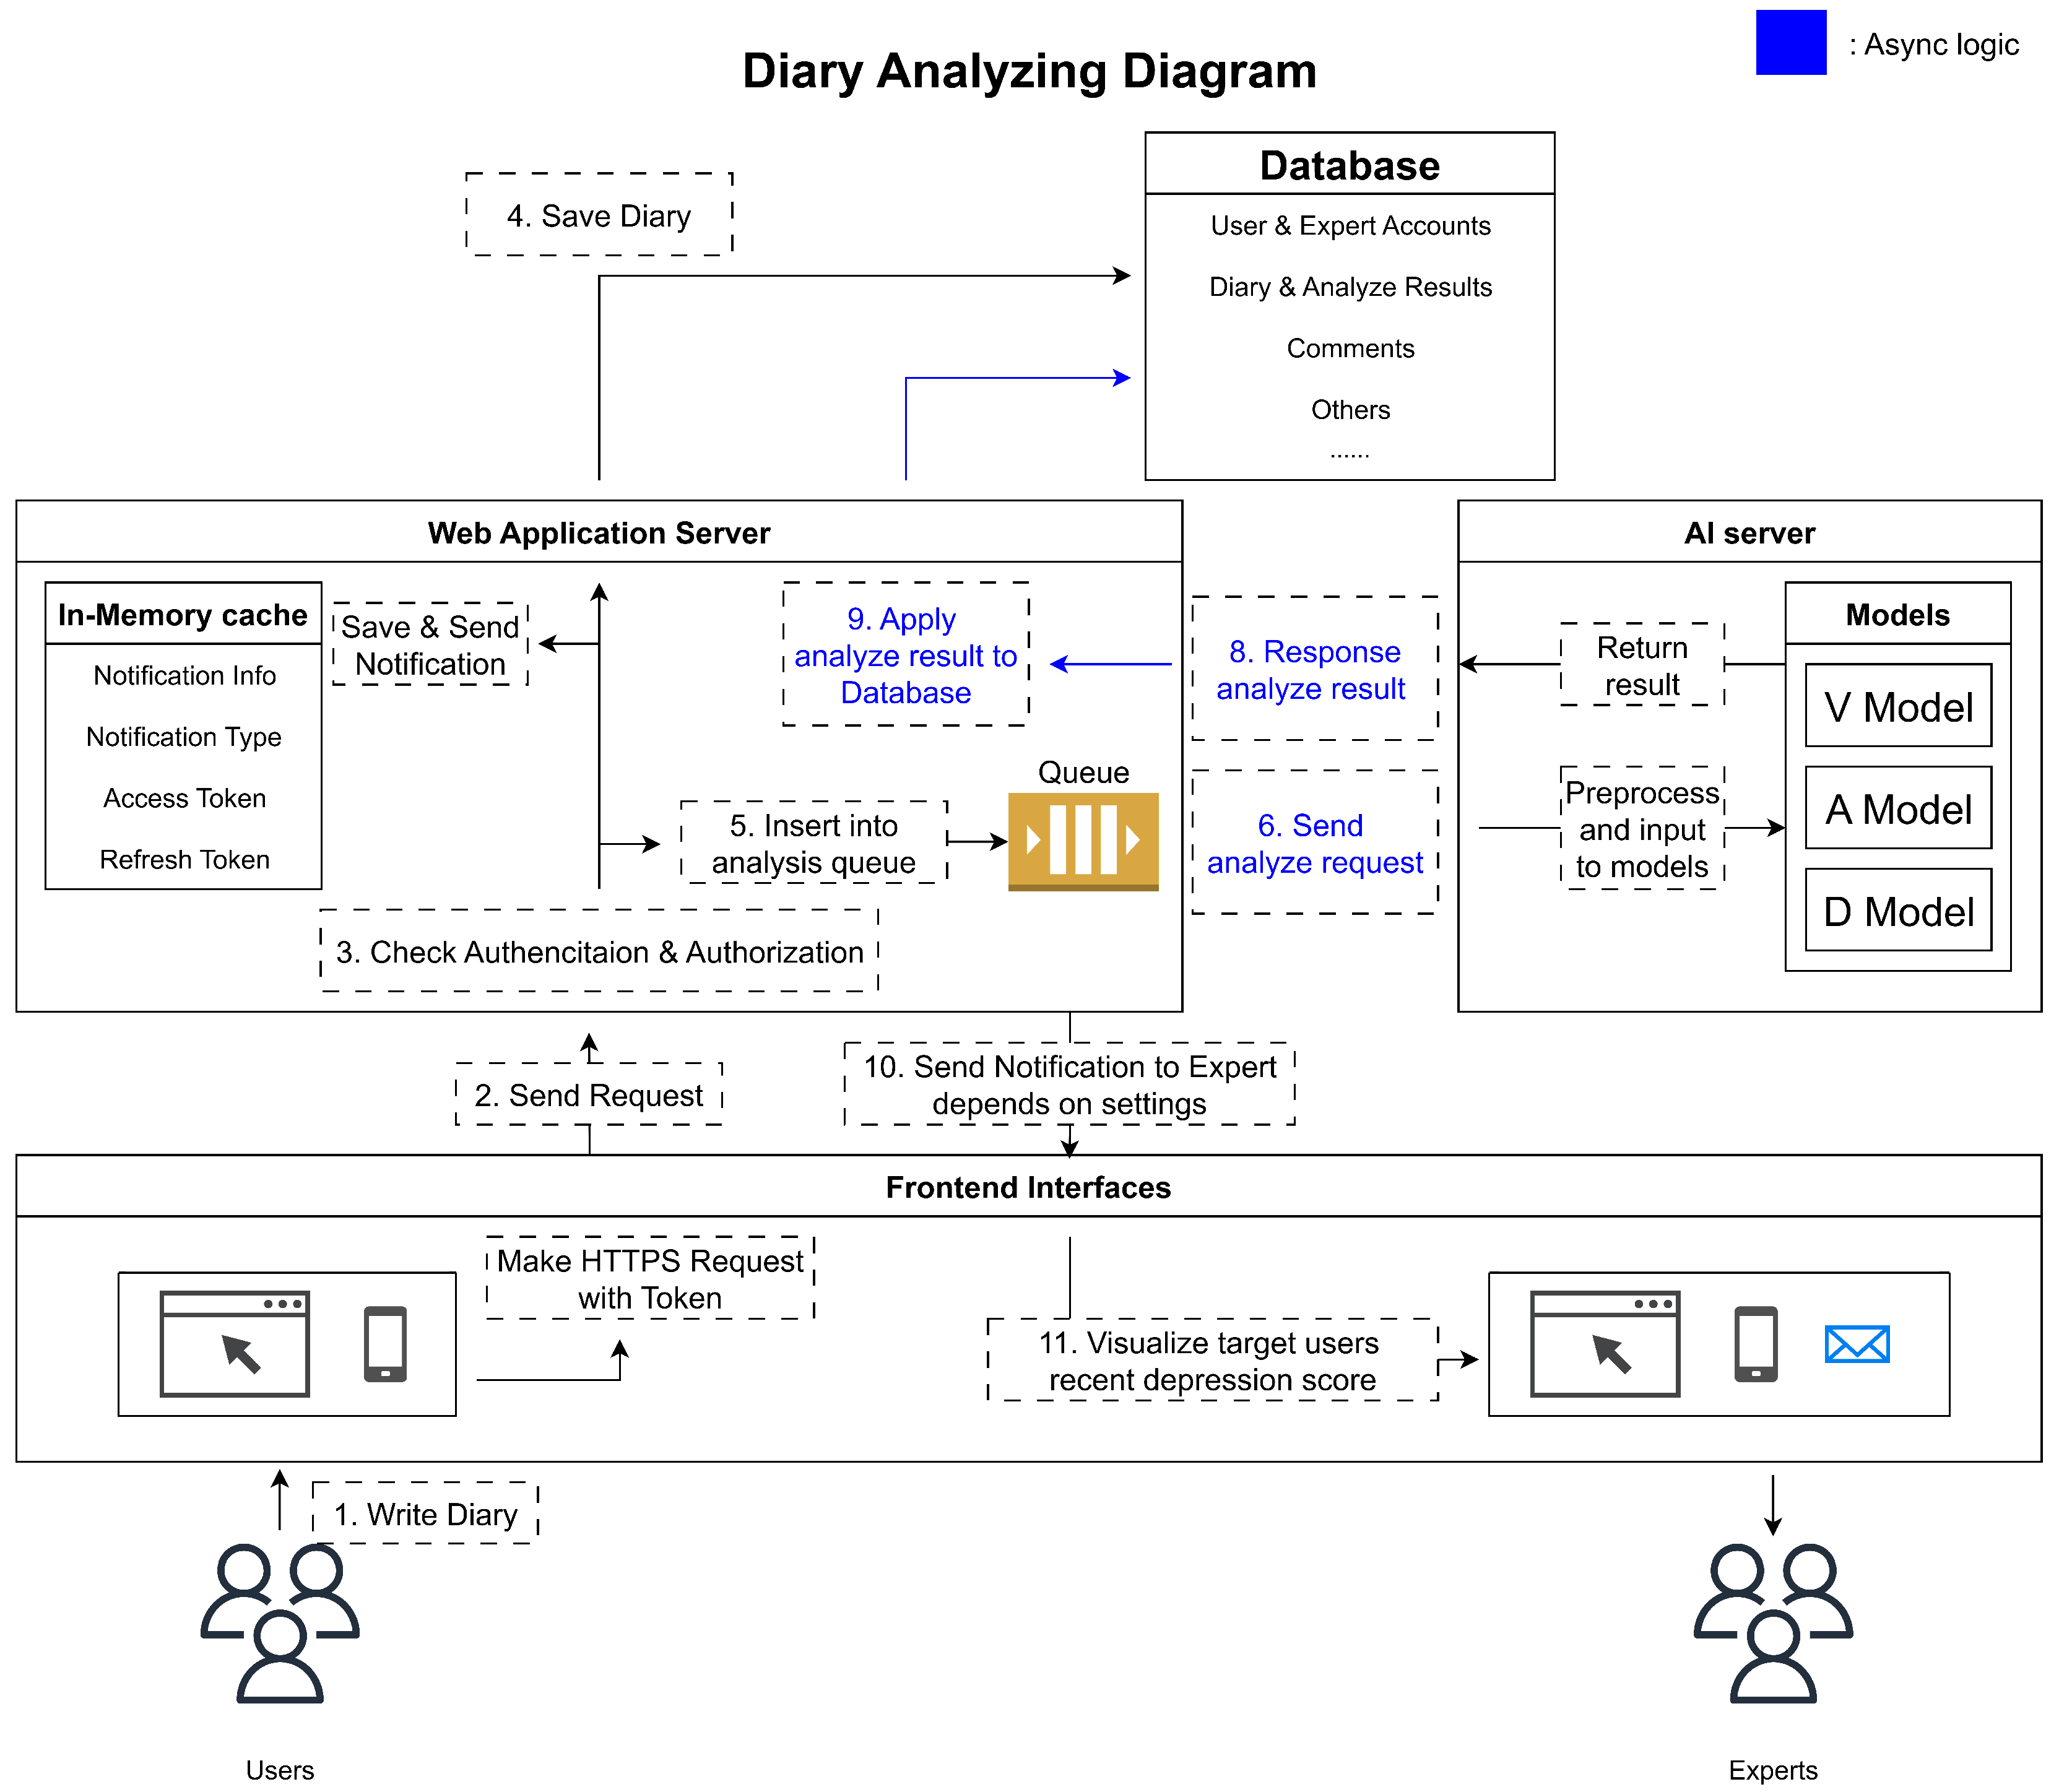
Figure 1. Overall architecture of the proposed web-based platform, illustrating the data flow from diary submission to emotion analysis and depression score visualization. Source: author’s contribution.
Applsci 15 10170 g001
Figure 2. Comparison of user and expert interfaces: left column—user home screen and diary entry review (desktop detail); right column—expert home screen and feedback screen with diary entry review (desktop detail). For readability, the detail screens are shown with cropped sidebars. All texts shown are example entries created solely for demonstration purposes. All personally identifiable information (e.g., email addresses) has been anonymized. Source: author’s contribution.
Applsci 15 10170 g002
Figure 3. User desktop diary list interface: entries are displayed with titles, snippets, timestamps, counts of professional comments, and emotion analysis indicators; selecting an entry opens the full detail page. All texts shown are example entries created solely for demonstration purposes. Source: author’s contribution. All personally identifiable information (e.g., email addresses) has been anonymized. Source: author’s contribution.
Applsci 15 10170 g003
Figure 4. Visualization of predicted VAD values and the corresponding depression score. Source: author’s contribution. All personally identifiable information (e.g., email addresses) has been anonymized. Source: author’s contribution.
Applsci 15 10170 g004
Figure 5. Training and validation loss curves for the KLUE-RoBERTa-based VAD regression models. Source: author’s contribution.
Applsci 15 10170 g005
Figure 6. Confusion matrices for binary classification of depression scores. Models in the first column use simple regression, while those in the second column apply the VAD + Multi-anchor method. VAD + Multi-anchor models generally reduce false positives and false negatives, improving class balance. Source: author’s contribution.
Applsci 15 10170 g006
Figure 7. Scatter plot showing the relationship between ground truth and predicted depression scores (uniformly sampled test set, n = 200 ). Points closer to the diagonal reference line ( y = x ) indicate more accurate predictions. Summary statistics: Pearson r = 0.906 , Spearman ρ = 0.803 , R 2 = 0.821 , MAE = 8.289 . OLS fit (reported for completeness): y ^ = 14.250 + 0.826 x . Note that the Pearson correlation stated in Section 5 ( r = 0.87 ) is computed on the full test set. Source: author’s contribution.
Applsci 15 10170 g007
Table 1. Summary of the final VAD-labeled dataset composition. Source: author’s contribution.
Data SourceSentencesPreprocessing MethodNotes
Emotional dialogue corpus (AI Hub) [34]58,269 (87.54%)First utterance selection; emotion-to-VAD mappingVAD scores derived from NRC-VAD Lexicon
EmoBank [33] (translated and verified)8290 (12.46%)Korean translation with manual verificationOriginal VAD scores preserved
Total66,559 (100%)
Table 2. Evaluation metrics for VAD regression and multi-anchor-based depression score prediction. Source: author’s contribution.
SectionMetricValence (V)Arousal (A)Dominance (D)
VAD RegressionMSE1.02611.70100.9478
MAE0.64461.01470.7129
Pearson0.88430.58420.7220
Multi-anchor (Regression)
MSE152.0647
MAE8.9024
Pearson0.8735
Multi-anchor (Classification)
Accuracy0.9825
Precision0.9733
Recall0.9715
F1-Score0.9724
Table 3. Performance comparison of different models on the same dataset. Source: author’s contribution.
No.Model (Method)MAE (Depression Score)Pearson rF1-Score (Binary)
1SVR (VAD + Multi-anchor)13.520.64120.835
2BERT-base [40] (Simple Regression)12.240.72680.92
3BERT-base [40] (VAD + Multi-anchor)10.19750.84420.95
4KoELECTRA [41] (Simple Regression)11.430.77220.94
5KoELECTRA [41] (VAD + Multi-anchor)10.16420.83100.9590
6KLUE-RoBERTa-base [36] (Simple Regression)10.35160.77700.94
7KLUE-RoBERTa-base [36] (VAD + Multi-anchor)8.90240.870.97
Table 4. Example sentences with predicted VAD values and derived depression scores. Deviations from ground truth are shown in parentheses. Source: author’s contribution.
No.SentenceValence (Δ)Arousal (Δ)Dominance (Δ)Dep. Score (Δ)
(1)I’m sick, but my children don’t care about me—just about money. I feel betrayed.1.96 (−0.02)7.13 (−0.02)3.39 (−0.07)71.64 (0.60)
(2)Something truly joyful happened during the holidays.8.66 (−0.18)7.59 (0.00)6.65 (−0.70)5.52 (5.52)
(3)I feel much more at ease now that my retirement is approaching.8.66 (0.24)2.85 (0.55)4.77 (−0.01)21.00 (−1.34)
(4)My wife has been abroad for a long time, and I feel very depressed—like I’ve been left behind.1.84 (0.65)4.67 (0.11)2.62 (0.53)97.90 (−2.09)
(5)Why did I have to get this illness and keep going to the hospital? I’m so sick and tired of it.1.93 (0.10)7.38 (0.12)3.77 (0.01)67.51 (−1.35)
Disclaimer/Publisher’s Note: The statements, opinions and data contained in all publications are solely those of the individual author(s) and contributor(s) and not of MDPI and/or the editor(s). MDPI and/or the editor(s) disclaim responsibility for any injury to people or property resulting from any ideas, methods, instructions or products referred to in the content.