Article

Analytical Method for Temperature Field Distribution of Annular Double-Loop Freezing Pipes in Adjacent Urban Tunnels

1
Department of Geotechnical Engineering, College of Civil Engineering, Tongji University, 1239 Siping Road, Shanghai 200092, China
2
Key Laboratory of Geotechnical and Underground Engineering, Tongji University, Ministry of Education, 1239 Siping Road, Shanghai 200092, China
3
Junchi Engineering Co., Ltd., Taipei 103012, China
*
Author to whom correspondence should be addressed.
Appl. Sci. 2025, 15(18), 10149; https://doi.org/10.3390/app151810149
Submission received: 4 August 2025 / Revised: 14 September 2025 / Accepted: 15 September 2025 / Published: 17 September 2025
(This article belongs to the Special Issue Artificial Ground Freezing Technology—2nd Edition)

Abstract

The complex condition of an adjacent tunnel in urban city includes high water content, limited construction space, and the presence of an adjacent tunnel. To address these challenges, the artificial ground freezing method is employed to ensure construction safety and stability. Considering the complex problem of temperature field interaction in the freezing construction process of adjacent tunnels, for the first time, this paper proposes a generalized analytical solution for two-dimensional steady-state temperature fields suitable for the annular double-loop freezing system of adjacent tunnels. Based on the polar coordinate heat conduction control equation and the conformal transformation method, the complex geometric arrangement is mapped into a linear system that can be solved, and the analytical solution expression is constructed by combining the heat source superposition principle. In this paper, a numerical model of the adjacent tunnel annular double-loop freezing pipe is established through COMSOL Multiphysics 6.2 software. At the same time, the formula of the analytical method is programmed and solved using Python 3.12, and finally the temperature fields obtained by the two methods are compared. The results show that the analytical solution has good consistency in isotherm distribution, temperature field trend and characterization of frozen core area, which verifies the theoretical rationality and practicability of the constructed model.

1. Introduction

In recent years, the rapid pace of urbanization and the continuous increase in traffic demand have made underground space development an essential solution to relieve urban traffic pressure. The shield tunneling method, owing to its advantages of high automation, rapid construction, low sensitivity to weather, and minimal disturbance to surrounding environments, has become the predominant approach in underground construction projects [1,2,3]. With the expansion of urban rail transit systems, an increasing number of new tunnel projects must traverse densely built-up areas, often involving interactions with existing underground structures or historical infrastructures [4]. This has brought new challenges to underground construction, where safety and stability under complex boundary conditions require more sophisticated technical measures.
In urban cities, for example, a shield tunnel project was carried out in an area with a high density of underground railway facilities. Residual piles from a previously demolished bridge remained deeply buried along the tunnel alignment, creating serious potential obstacles for shield tunneling. Moreover, the stratum in this area is composed primarily of silty clay and silty fine sand with a shallow groundwater table, which increases the difficulty of controlling construction-induced disturbances. Under such circumstances, ensuring safe excavation requires overcoming spatial conflicts between new tunnels and existing structures, while simultaneously maintaining the stability of operational transportation systems [5]. Therefore, the design of reinforcement techniques and risk-control measures in such complex engineering environments has become a critical focus of urban tunneling research.
Artificial Ground Freezing (AGF) is a widely used temporary support and waterproofing method in environmental engineering [6], mining engineering [7,8], underground engineering [9,10,11,12], tunnel launch shafts [13], interchange reconstruction, and complex foundation reinforcement projects. Its basic principle involves using refrigeration equipment to circulate low-temperature refrigerant through freezing pipes installed within the soil, causing the surrounding moisture to freeze into ice and form a frozen curtain with high strength and waterproof properties [14,15,16], thereby achieving both support and waterproofing objectives. Compared with other stratum reinforcement methods, the AGF has outstanding advantages such as no vibration, green environmental protection [17], and strong adaptability, especially for underground space projects with complex geological structures.
As the utilization of urban underground space in China continues to deepen, dual-line, dual-tunnel, and even multi-tunnel parallel construction has become the norm. In these complex conditions, the arrangement of freezing pipes has evolved from the traditional single-pipe, single-loop configuration to a ring-shaped dual-loop or multi-loop layout, aiming to enhance freezing speed and create a uniformly thick frozen curtain. For the typical ring-shaped double-loop pipes layout, the inner-loop freezing pipes primarily control the freezing core area, while the outer-loop freezing pipes dominate the closure process of the frozen soil curtain. The synergistic effect of both can effectively accelerate freezing progress, reduce shaft eccentricity, and enhance frozen curtain strength. However, the temperature distribution patterns in this configuration are more complex, and there are significant thermal interference effects between the double loops and adjacent tunnels, making it difficult for traditional theories to accurately predict the freezing range and waterproofing effectiveness [18].
Regarding the problem of freezing temperature fields, scholars both domestically and internationally have proposed various analytical and numerical methods. Soviet scholars derived an analytical solution for the steady-state freezing temperature field of a single tube based on the fundamental theory of heat conduction [19]. In China, Xiangdong Hu and other scholars, building on previous work, systematically studied the steady-state freezing temperature field problems for single-row, double-row, and ring-shaped configurations, and proposed generalized analytical solutions for single-row and double-row freezing temperature fields [20,21]. They also used conformal mapping to transform complex configurations into rectangular domains, thereby successfully obtaining the steady-state analytical solution for a ring-shaped double-loop freezing tube system [18], providing important theoretical support for such problems.
Although previous studies have systematically addressed the issue of double-loop freezing in a single tunnel, traditional models cannot be directly applied in the context of parallel construction in multiple tunnels due to thermal interference and boundary coupling between adjacent freezing systems. Especially under complex geological conditions such as high groundwater flow velocity and shallow overburden layers, the coupling between freezing rings significantly influences the evolution of the temperature field and the formation of a frozen curtain. Therefore, it is necessary to further derive the two-dimensional steady-state temperature field of adjacent double-loop freezing systems based on the analytical framework of a single tunnel with a double-loop configuration, to meet the urgent demands of current complex subway engineering design. This paper takes a metro section in a certain city as the engineering background and considers that two parallel tunnels each adopt a circular double-loop pipe layout. Based on the polar coordinate heat conduction control equation, using the conformal transformation method from complex function theory and the principle of heat source superposition, the paper derives the analytical expression for the two-dimensional steady-state temperature field of the double-loop freezing pipes under mutual influence between the two tunnels. Additionally, the author validated the analytical solution through numerical simulation and Python 3.12 programming. The results indicate that under reasonable assumptions, the analytical solution possesses good engineering applicability and numerical accuracy, making it suitable for parameter optimization and rapid temperature field prediction during the freezing design phase. This provides a reliable theoretical basis for freezing scheme design in underground engineering projects such as subways.

2. Project Overview

2.1. Project Introduction

The project is located beneath a main road in a certain city in urban city and is part of the newly built tunnels in the urban rail transit system. It adopts the shield method to pass through the area where the existing railway is underground. This section was originally occupied by a bridge structure. Although the superstructure has been demolished, a large number of foundation piles still remain underground, each with a diameter of 1.2 m and a length of 30 m, and are distributed relatively densely, posing a substantial obstacle to the tunneling route of the shield machine. In addition, the tunnel advancement section simultaneously overlaps with the existing railway underground structure in multiple ways. The main interfering structures include underground continuous walls and intermediate columns as deep as 29 m, etc. Moreover, the shield tunnel is adjacent to existing structures, posing extremely high safety risks during construction.

2.2. Engineering Geological Conditions

The area where this project is located is the built-up area of a certain city. The terrain is flat. The stratum where the proposed construction section is located is composed of 9.7 m thick silty clay and 24.7 m thick silty fine sand, distributed in layers. The geological structure is relatively loose, with a low bearing capacity and high water content in the soil. It is prone to deformation and seepage problems under disturbance. The groundwater level is relatively shallow, located 2 m below the surface, with strong water richness and prone to sudden surges. This area has a strong groundwater recharge capacity and a large permeability coefficient. If not properly controlled during the freezing construction process, phenomena such as insufficient freezing, leakage, and softening damage may occur, posing risks to subsequent tunnel excavation and lining construction.

2.3. Freezing Scheme Design

As shown in Figure 1, the underground abandoned foundation piles are left underground, causing interference to the construction project. In order to ensure that the shield section passes through the existing structural section smoothly, and ensure the sealing of groundwater and the stability of foundation pit, the artificial ground freezing method is used for local reinforcement and water stop. The freezing construction area is mainly concentrated in the connecting channel and the obstacle removal well. The freezing form is arranged by annular double-loop freezing pipes. By forming a closed freezing wall, the double functions of surrounding rock reinforcement and water stop are realized.
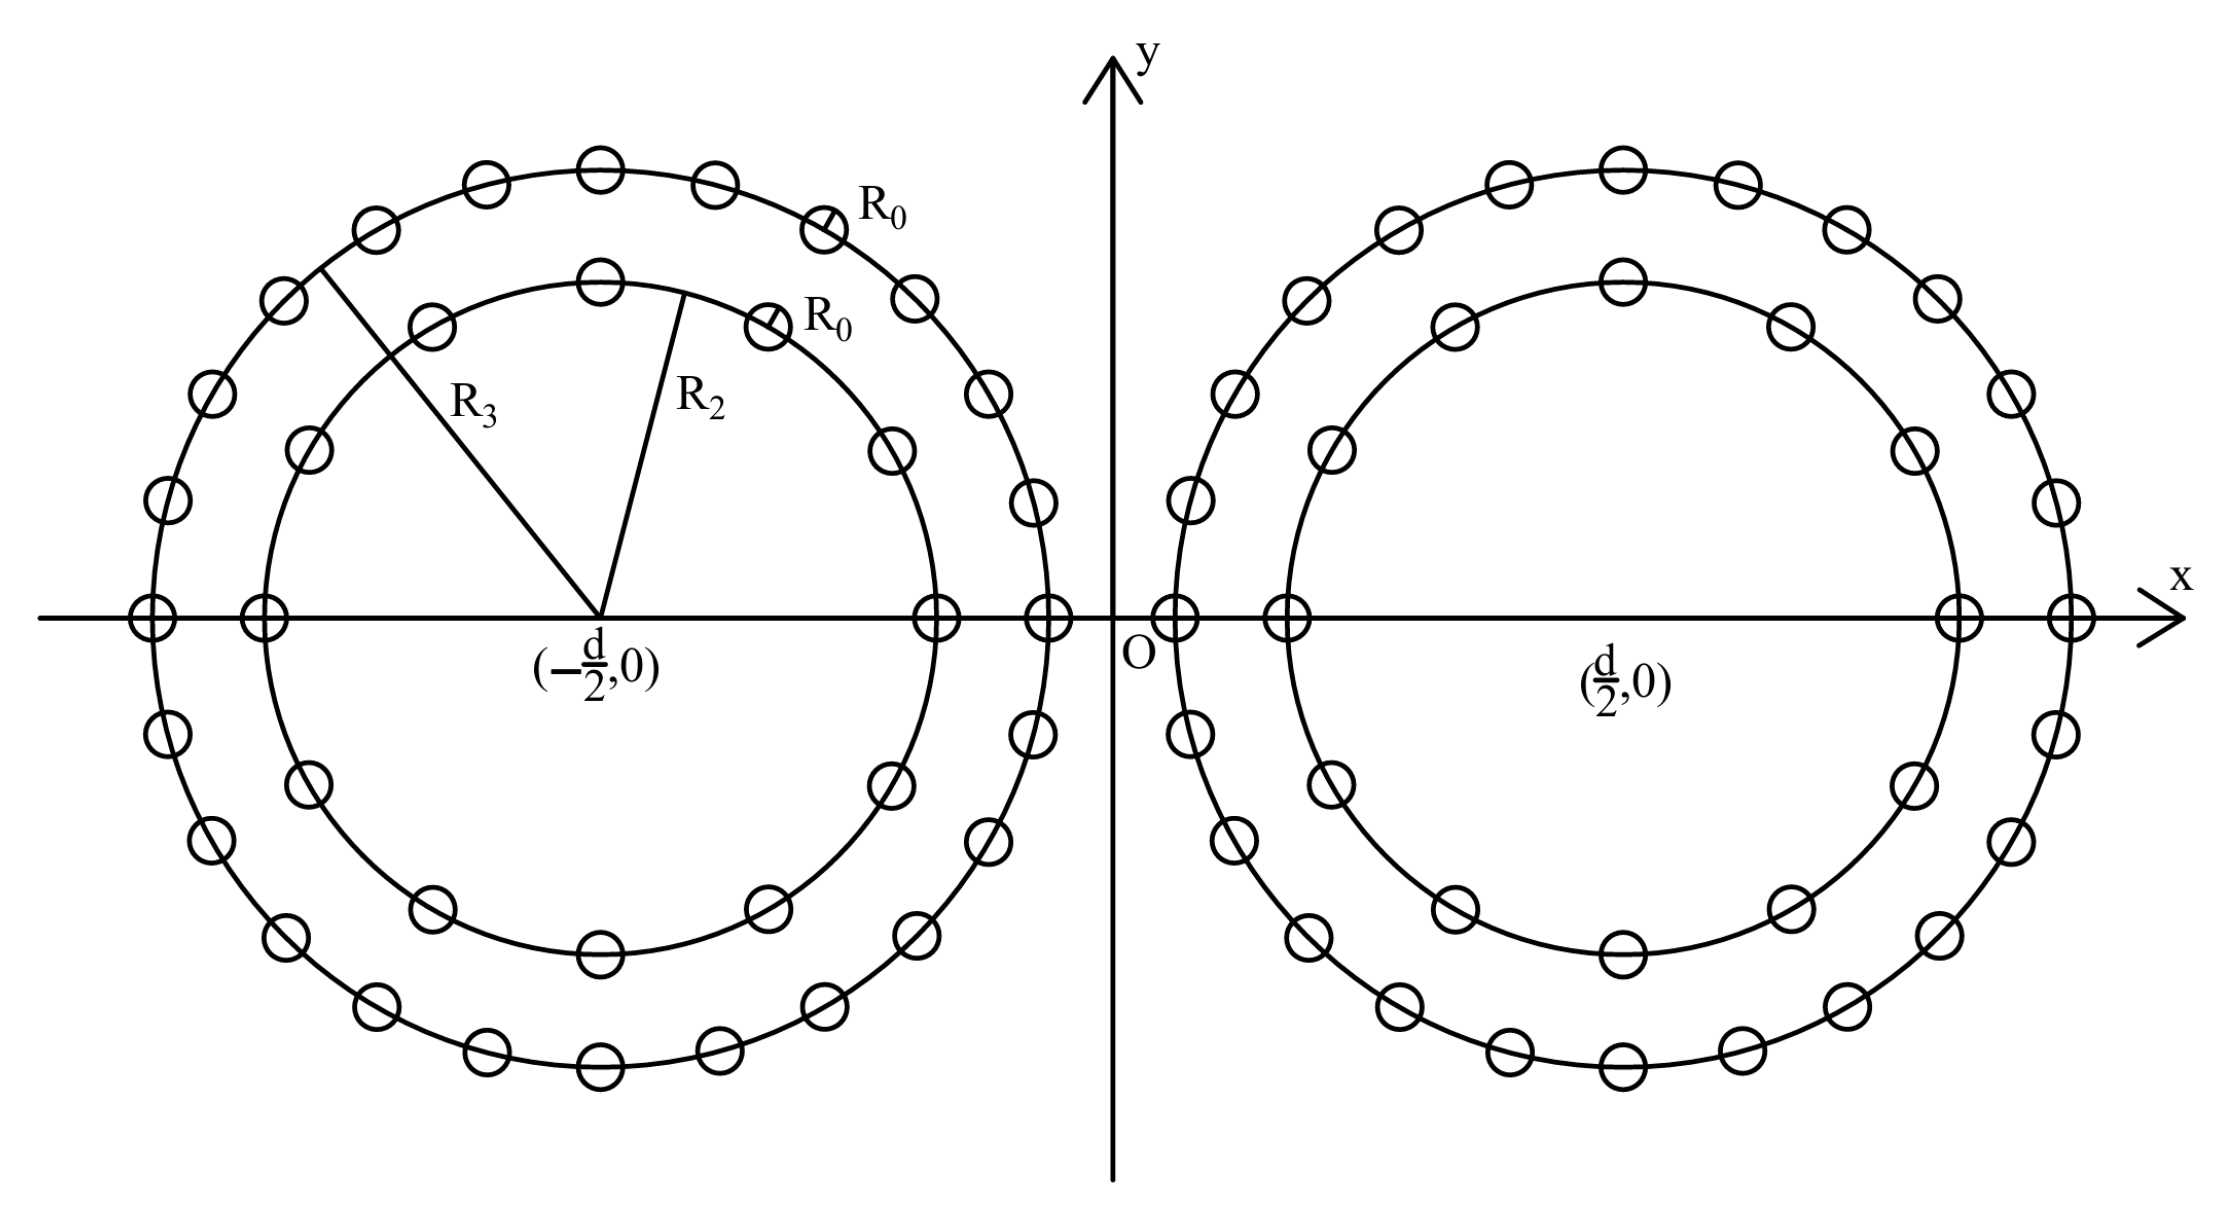
Figure 2 shows the layout scheme of annular double-loop freezing pipe in adjacent double tunnels adopted in the project. The inner ring freezing pipes and the outer ring freezing pipes are set around the center of each tunnel to form a two-layer closed annular freezing structure. The left and right tunnels are centered at ( d 2 , 0 ) and ( d 2 , 0 ) , respectively, with freezing pipes of radius R 0 arranged at equal intervals along the tunnel circumference.

3. Derivation of Analytical Solutions

3.1. Control Equations and Physical Assumptions

Once the freezing process reaches the steady-state stage, the temperature field around the freezing pipes tends to be stable in time, and the temperature distribution at each point in the soil is mainly dominated by heat conduction, which no longer changes with time [18]. At this time, the temperature distribution at any point r , θ within the two-dimensional region satisfies the Laplace equation in polar coordinates:
2 T r 2 + 1 r T r + 1 r 2 2 T θ 2 = 0
where T is the temperature representing a function of spatial coordinates and time; t is time; r is the polar radius, indicating the radial distance from a point in two-dimensional space to the freezing center; θ is the polar angle.
To simplify the problem and obtain the analytical expressions, the following assumptions are made in this paper:
  • The freezing pipes maintain a constant low temperature T f , while the external soil temperature remains constant at T 0 ;
  • The frozen curtain has formed, and the temperature field has stabilized, which can be regarded as quasi-steady state;
  • The thermodynamic parameters of the soil are independent of temperature and treated as constants;
  • The frozen zone enclosed by the double-loop freezing pipes is circular or approximately circular.
In actual AGF projects, the brine temperature inside freezing pipes is controlled by refrigeration equipment and can be regarded as constant after stabilization. Similarly, the natural ground temperature far from the freezing influence remains nearly unchanged during the freezing period. Thus, it is reasonable to assume that both are constant in Assumption 1. In fact, the thermal parameters of soil, such as thermal conductivity, specific heat capacity and thermal diffusivity, do indeed vary with temperature and water content. Especially during the freezing process, the phase change of water-bearing soil (the transformation from liquid water to ice) will significantly affect the thermal parameters. However, this paper studies the steady-state heat conduction problem, and the research object is the overall temperature field distribution law rather than the fine phase change heat transfer process. Therefore, the parameters are approximated as constants for research.
In this study, for the purpose of simplifying the analytical derivation, the thermodynamic parameters of the soil, such as thermal conductivity and specific heat capacity, were assumed to be constant. However, in real engineering conditions, these parameters are temperature-dependent and vary significantly with moisture content, especially during the phase change from water to ice. Future work will incorporate temperature-dependent material properties to better capture the transient freezing process and further improve the accuracy of the model.

3.2. Double-Loop Pipes Freezing Model of Single Tunnel with Incomplete Freezing

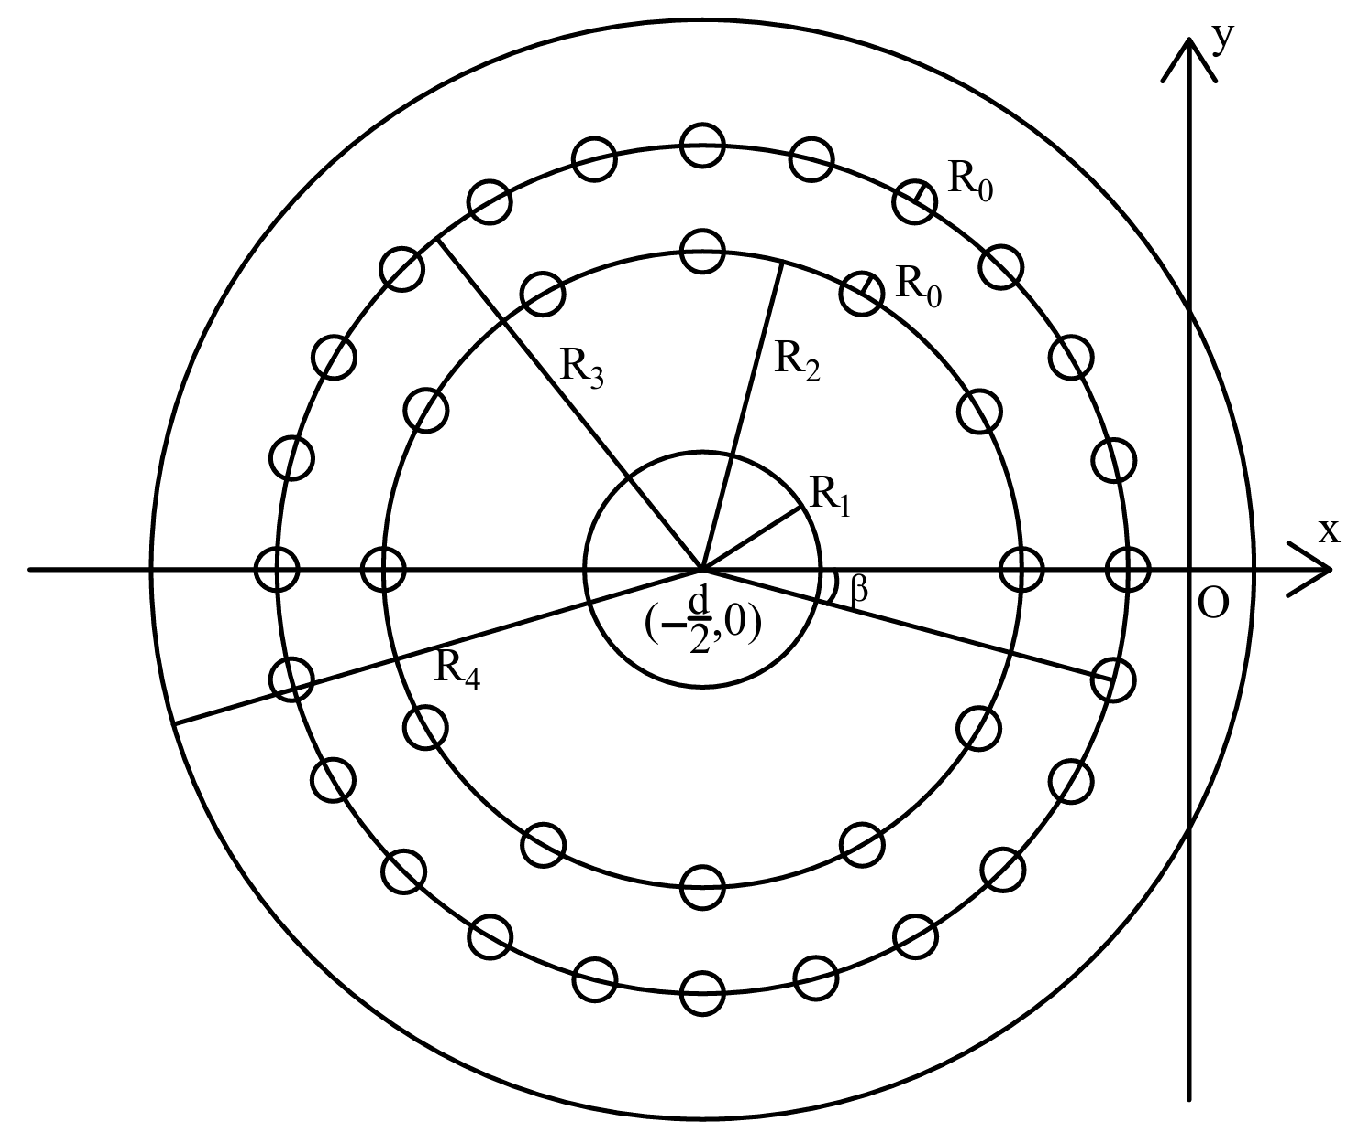
To simplify the analytical modeling of the freezing temperature field in double tunnels, this paper takes the left line tunnel as a representative to construct a double-loop tube freezing model of a single tunnel that has not been completely frozen, and conducts the derivation of the two-dimensional steady-state temperature field. In the freezing system of this project, the freezing pipes are arranged along two concentric circles, where the inner ring freezing pipes are distributed at radius R 2 with a total number of n 1 ; the outer ring freezing pipes are distributed at radius R 3 with a total number of n 2 ; the outer ring is rotated by an angle β relative to the inner ring; the inner boundary of the frozen zone is R 1 , while the outer boundary is R 4 ; the freezing pipes wall temperature is T f , and the boundary temperatures of the frozen zone are T 0 . Figure 3 shows the double-loop tube freezing model on the left line. These parameters are derived from the geological exploration report of this area and the corresponding specifications (Technical Code for Crosspassage Freezing Method, DG/TJ 08-902-2016) [22].
According to the above parameters, the boundary conditions of the model are expressed as
T R 1 , θ = T 0 T R 4 , θ = T 0 T R 2 + R 0 , θ k ( 1 ) = T f T R 3 + R 0 , θ k ( 2 ) + β = T f
where θ k ( 1 ) = k 1 2 π n 1 , θ k ( 2 ) = k 2 2 π n 2 , k 1 takes integer values from 0 to n 1 1 , and k 2 takes integer values from 0 to n 2 1 .

3.3. Transformation from Polar Coordinates to Cartesian Coordinates

In the global Cartesian coordinate system, the geometric transformation relationships from any point P ( x , y ) to the centers of the left and right tunnels in polar coordinates are as follows:
For the left tunnel: With the center at ( d 2 , 0 ) , then
r L = ( x + d 2 ) 2 + y 2 ,   θ L = arctan y x + d 2
For the right tunnel: With the center at ( d 2 , 0 ) , then
r R = ( x d 2 ) 2 + y 2 ,   θ R = arctan y x d 2

3.4. Conformal Transformation

In order to solve the periodic boundary problem, the conformal transformation in the complex variable function is introduced, and the ring region in the original polar coordinates is mapped into a linear strip region (rectangular region).
In the complex plane, defining the point Z Z c = x + i y = r e i θ , we introduce the following conformal transformation:
ζ = i ln Z Z c R 2 R 3 = u + i v
where Z c is the horizontal coordinate of the tunnel center; Z-plane is the object plane with Z = r e i θ + Z c , where r represents the polar radius and θ represents the polar agle; the ζ -plane is the image plane with u as the horizontal coordinate and v as the vertical coordinate. Substitute the two planes into the transformation function, respectively, and solve inversely to obtain u = θ , v = ln Z Z c R 2 R 3 = ln r R 2 R 3 . The relevant equations for conformal transformation are as follows:
u = arg ( Z Z c ( R 2 R 3 ) ) , v = ln Z Z c R 2 R 3 ξ 1 = ln R 2 / R 1 , ξ 2 = ln R 4 / R 3 R w 1 = R 0 / R 2 , R w 2 = R 0 / R 3 l 1 = 2 π / n 1 , l 2 = 2 π / n 2 L = ln R 3 / R 2 K = β
where n 1 is the number of annular inner-loop pipes, n 2 is the number of annular outer-loop pipes, ξ 1 is the distance from the center of the outer freezing pipes to the outer boundary, and ξ 2 is the distance from the center of the inner circle freezing tube to the inner boundary.

4. The Construction and Solution of Planar Temperature Field Solutions

4.1. Analytical Solution of Image Plane Temperature Field

Taking the left-line annular tunnel as an example, according to the separability of boundary conditions, the image plane solution is decomposed into the superposition of two generalized single-row pipes freezing steady-state temperature fields.
The first row of pipe freezing steady-state temperature field:
2 T 1 u 2 + 2 T 1 v 2 = 0 T 1 ( u , ( ξ 1 + L / 2 ) ) = T 0 T 1 ( u , ξ 2 + L / 2 ) = T 0 T 1 ( j l 1 , L / 2 + R w 1 ) = T f T f 1 T 1 ( K + j l 2 , L / 2 + R w 2 ) = T f 2
The second row of pipe freezing steady-state temperature field:
2 T 2 u 2 + 2 T 2 v 2 = 0 T 2 ( u , ( ξ 1 + L / 2 ) ) = 0 T 2 ( u , ξ 2 + L / 2 ) = 0 T 2 ( j l 1 , L / 2 + R w 1 ) = T f 1 T 1 ( K + j l 2 , L / 2 + R w 2 ) = T f T f 2
According to the solution of the generalized single row freezing steady-state temperature field given in References [18,20], the solution under the condition of Equation (7) is
T 1 = T 0 + T A 1 A 1 ξ 1 + v + L 2 B 1 ξ 2 v + L 2 C 1
where
T A 1 = T f T f 1 T 0 ( ξ 2 + L ) ln cosh 2 π R w 1 l 1 1 cosh 2 π ξ 1 l 1 1 ξ 1 ln cosh 2 π ( ξ 2 + L ) l 1 1 cosh 2 π R w 1 l 1 1
A 1 = ( ξ 1 + ξ 2 + L ) ln cosh 2 π ( v + L / 2 ) l 1 cos 2 π u l 1
B 1 = ln cosh 2 π ( ξ 2 + L ) l 1 1
C 1 = ln cosh 2 π ξ 1 l 1 1
T f 1 = T A 2 ( ξ 1 + ξ 2 + L ) ln cos h 2 π L l 2 ( ξ 1 + R w 1 + L ) B 2 ( ξ 2 R w 1 ) C 2
Similarly, the solution to Equation (8) is as follows
T 2 = T A 2 A 2 ξ 1 + v + L 2 B 2 ξ 2 v + L 2 C 2
where
T A 2 = T f T f 2 ξ 2 ln cosh 2 π R w 2 l 2 1 cosh 2 π ( ξ 1 + L ) l 2 1 ( ξ 1 + L ) ln cosh 2 π ξ 2 l 2 1 cosh 2 π R w 2 l 2 1
A 2 = ( ξ 1 + ξ 2 + L ) ln cosh 2 π ( v L / 2 ) l 2 cos 2 π ( u K ) l 2
B 2 = ln cosh 2 π ξ 2 l 1 1
C 2 = ln cosh 2 π ( ξ 1 + L ) l 1 1
T f 2 = T 0 + T A 1 ( ξ 1 + ξ 2 + L ) ln cos h 2 π L l 1 ( ξ 1 + R w 2 + L ) B 1 ( ξ 2 R w 2 ) C 1
By combining Equations (9) and (15), we obtain:
T f 1 = D 2 ( D 1 E 1 ) D 1 D 2 E 1 E 2 ( T f T 0 )
T f 2 = D 1 ( D 2 E 2 ) T f E 2 ( E 1 D 1 ) T 0 D 1 D 2 E 1 E 2
where
D 1 = ( ξ 1 + ξ 2 + L ) ln cos h 2 π L l 1 ( ξ 1 + R w 2 + L ) B 1 ( ξ 2 R w 2 ) C 1
D 2 = ( ξ 1 + ξ 2 + L ) ln cos h 2 π L l 2 ( ξ 1 + R wl + L ) B 2 ( ξ 2 R wl ) C 2
E 1 = ( ξ 2 + L ) ln ch 2 π R wl l 1 1 ch 2 π ξ 1 l 1 1 ξ 1 ln ch 2 π ( ξ 2 + L ) l 1 1 ch 2 π R wl l 1 1
E 2 = ξ 2 ln ch 2 π R w 2 l 2 1 ch 2 π ( ξ 1 + L ) l 2 1 ( ξ 1 + L ) ln ch 2 π ξ 2 l 2 1 ch 2 π R w 2 l 2 1
After finishing, the analytical solution of the plane temperature field of the left line tunnel image is obtained:
T L = T 1 + T 2 = ( T f T 0 ) D 2 E 2 D 1 D 2 E 1 E 2 × A 1 ξ 1 + v + L 2 B 1 ξ 2 v + L 2 C 1 + ( T f T 0 ) D 1 E 1 D 1 D 2 E 1 E 2 × A 2 ξ 1 + v + L 2 B 2 ξ 2 + L 2 v C 2 + T 0

4.2. Analytical Solution of Object Plane Temperature Field

Substituting the conformal transformation Equation (6) into Equation (27) yields the result:
T L = ( T f T 0 ) D 2 E 2 D 1 D 2 E 1 E 2 A 1 ln R 2 R 1 + ln r R 2 R 3 + L 2 B 1 ln R 4 R 3 ln r R 2 R 3 + L 2 C 1 + ( T f T 0 ) D 1 E 1 D 1 D 2 E 1 E 2 A 2 ln R 2 R 1 + ln r R 2 R 3 + L 2 B 2 ln R 4 R 3 + L 2 ln r R 2 R 3 C 2 + T 0
where
A 1 = ( ξ 1 + ξ 2 + L ) ln cosh 2 π ( v + L / 2 ) l 1 cos 2 π u l 1
A 2 = ( ξ 1 + ξ 2 + L ) ln cosh 2 π ( v L / 2 ) l 2 cos 2 π ( u K ) l 2
B 1 = ln cosh 2 π ( ξ 2 + L ) l 1 1
B 2 = ln cosh 2 π ξ 2 l 2 1
C 1 = ln cosh 2 π ξ 1 l 1 1
C 2 = ln cosh 2 π ( ξ 1 + L ) l 1 1
Substituting all the converted parameters, the analytical solution of the temperature field of the left tunnel is obtained:
T L = ( T f T 0 ) D 2 E 2 D 1 D 2 E 1 E 2 ln ( R 4 R 1 ) ln cosh ( n 1 ln r R 2 ) cos ( n 1 θ ) ln ( r R 1 ) × ln ( cosh ( n 1 ln R 4 R 2 ) 1 ) ln ( R 4 r ) ln ( cosh ( n 1 ln R 2 R 1 ) 1 ) + ( T f T 0 ) D 1 E 1 D 1 D 2 E 1 E 2 × ln ( R 4 R 1 ) ln cosh ( n 2 ln r R 3 ) cos n 2 ( θ + β ) ln ( r R 1 ) ln ( cosh ( n 2 ln R 4 R 3 ) 1 ) ln ( R 4 r ) ln ( cosh ( n 1 ln R 3 R 1 ) 1 ) + T 0
where
r L = ( x + d 2 ) 2 + y 2 ,   θ L = arctan y x + d 2
D 1 = ln ( R 4 R 1 ) ln R 3 R 2 n 1 + R 2 R 3 n 1 2 R 1 R 2 n 1 + R 2 R 1 n 1 2 ln ( R 3 R 1 ) ln R 4 R 2 n 1 + R 2 R 4 n 1 2 R 1 R 2 n 1 + R 2 R 1 n 1 2
D 2 = ln ( R 4 R 1 ) ln R 2 R 3 n 2 + R 3 R 2 n 2 2 R 1 R 3 n 2 + R 3 R 1 n 2 2 ln ( R 2 R 1 ) ln R 4 R 3 n 2 + R 3 R 4 n 2 2 R 1 R 3 n 2 + R 3 R 1 n 2 2
E 1 = ln ( R 4 R 1 ) ln e n 1 r 0 / R 2 + e n 1 R 0 / R 2 2 R 1 R 2 n 1 + R 2 R 1 n 1 2 ln ( R 2 R 1 ) ln R 4 R 2 n 1 + R 2 R 4 n 1 2 R 1 R 2 n 1 + R 2 R 1 n 1 2
E 2 = ln ( R 4 R 1 ) ln e n 2 r 0 / R 3 + e n 2 r 0 / R 3 2 R 1 R 3 n 2 + R 3 R 1 n 2 2 ln ( R 3 R 1 ) ln R 4 R 3 n 2 + R 3 R 4 n 2 2 R 1 R 3 n 2 + R 3 R 1 n 2 2
Similarly, the analytical solution of the temperature field of the right line tunnel T R :
T R = ( T f T 0 ) D 2 E 2 D 1 D 2 E 1 E 2 ln ( R 4 R 1 ) ln cosh ( n 1 ln r R 2 ) cos ( n 1 θ ) ln ( r R 1 ) × ln ( cosh ( n 1 ln R 4 R 2 ) 1 ) ln ( R 4 r ) ln ( cosh ( n 1 ln R 2 R 1 ) 1 ) + ( T f T 0 ) D 1 E 1 D 1 D 2 E 1 E 2 × ln ( R 4 R 1 ) ln cosh ( n 2 ln r R 3 ) cos n 2 ( θ + β ) ln ( r R 1 ) ln ( cosh ( n 2 ln R 4 R 3 ) 1 ) ln ( R 4 r ) ln ( cosh ( n 1 ln R 3 R 1 ) 1 ) + T 0
where
r R = ( x d 2 ) 2 + y 2 ,   θ R = arctan y x d 2
other parameters are the same as above.
Therefore, the analytical solution of the steady-state temperature field of the annular double-loop pipes freezing in adjacent tunnels is:
T = T L + T R
It should be emphasized that several simplifying assumptions were adopted in the derivation of the analytical solution. The thermophysical properties of the soil were considered constant, thereby neglecting their temperature dependence. This approximation facilitates the formulation but may compromise accuracy under heterogeneous or stratified soil conditions. Moreover, the present study is restricted to steady-state analysis and does not account for transient freezing processes, which are of practical relevance to construction safety and stability. As a result, the proposed analytical solution is more suitable as a rapid assessment tool during preliminary design, whereas detailed transient numerical simulations remain indispensable for refined analysis, safety evaluation, and risk management in complex hydrogeological environments.

5. Finite Element Numerical Model

5.1. Geometric Modeling

In this paper, the calculation model is modeled by COMSOL Multiphysics software 6.2. The software is a multi-physical field simulation software based on finite element analysis technology. Through COMSOL Multiphysics 6.2, a three-dimensional numerical model of the annular double-loop freezing pipe of adjacent tunnels is created to accurately simulate the spatial layout of the freezing pipe. In the calculated results, the corresponding two-dimensional temperature field is selected and compared with the analytical solution results.
For the annular freezing pipe, on the cross section of the tunnel, the inner ring and outer ring freezing pipes are arranged, respectively. The parameters such as the radius R 2 of the inner ring freezing pipe, the radius R 3 of the outer ring freezing pipe and the pipe spacing are consistent with the two-dimensional analytical model to ensure the matching of plane geometric features. In the longitudinal dimension, the freezing pipe extends continuously along the longitudinal direction of the tunnel to form a spatial ring pipe network structure, which completely simulates the conduction path of the freezing cold energy in the three-dimensional space. The specific parameters are detailed in Table 1.

5.2. Material Parameter Setting

In the COMSOL model, it is very important to set the material parameters reasonably. The stratum soil of the proposed tunnel is silty fine sand. In order to simplify the calculation during modeling, the soil material only considers silty fine sand. And its thermodynamic parameters, including thermal conductivity, specific heat capacity and density, are determined based on on-site measurements, laboratory tests of soil samples and reference values under similar geological conditions. For groundwater and tunnel lining materials, standard engineering values were adopted in accordance with design specifications and empirical data reported in the literature. The properties of the freezing pipes were defined according to their actual material composition and manufacturer specifications. These parameter settings ensure that the model accurately reflects the heat conduction behavior of different media during the freezing process and improves the reliability of numerical simulation. The detailed values are summarized in Table 2.

5.3. Boundary Condition Setting and Grid Division

The setting of model boundary conditions is closely combined with the actual engineering situation. At the outer boundary of the model, a constant temperature boundary condition is set, and the temperature value is taken as the external temperature T 0 of the soil mass. The temperature value is 19 °C, which is determined based on the annual average ground temperature of the engineering area. For the wall of the freezing tube, a constant low-temperature boundary condition is set, with the temperature set to T f , to simulate the low-temperature environment brought about by the circulation of the refrigerant inside the freezing tube. By precisely setting boundary conditions, the model can accurately simulate the conduction and distribution of temperature during the actual freezing process.
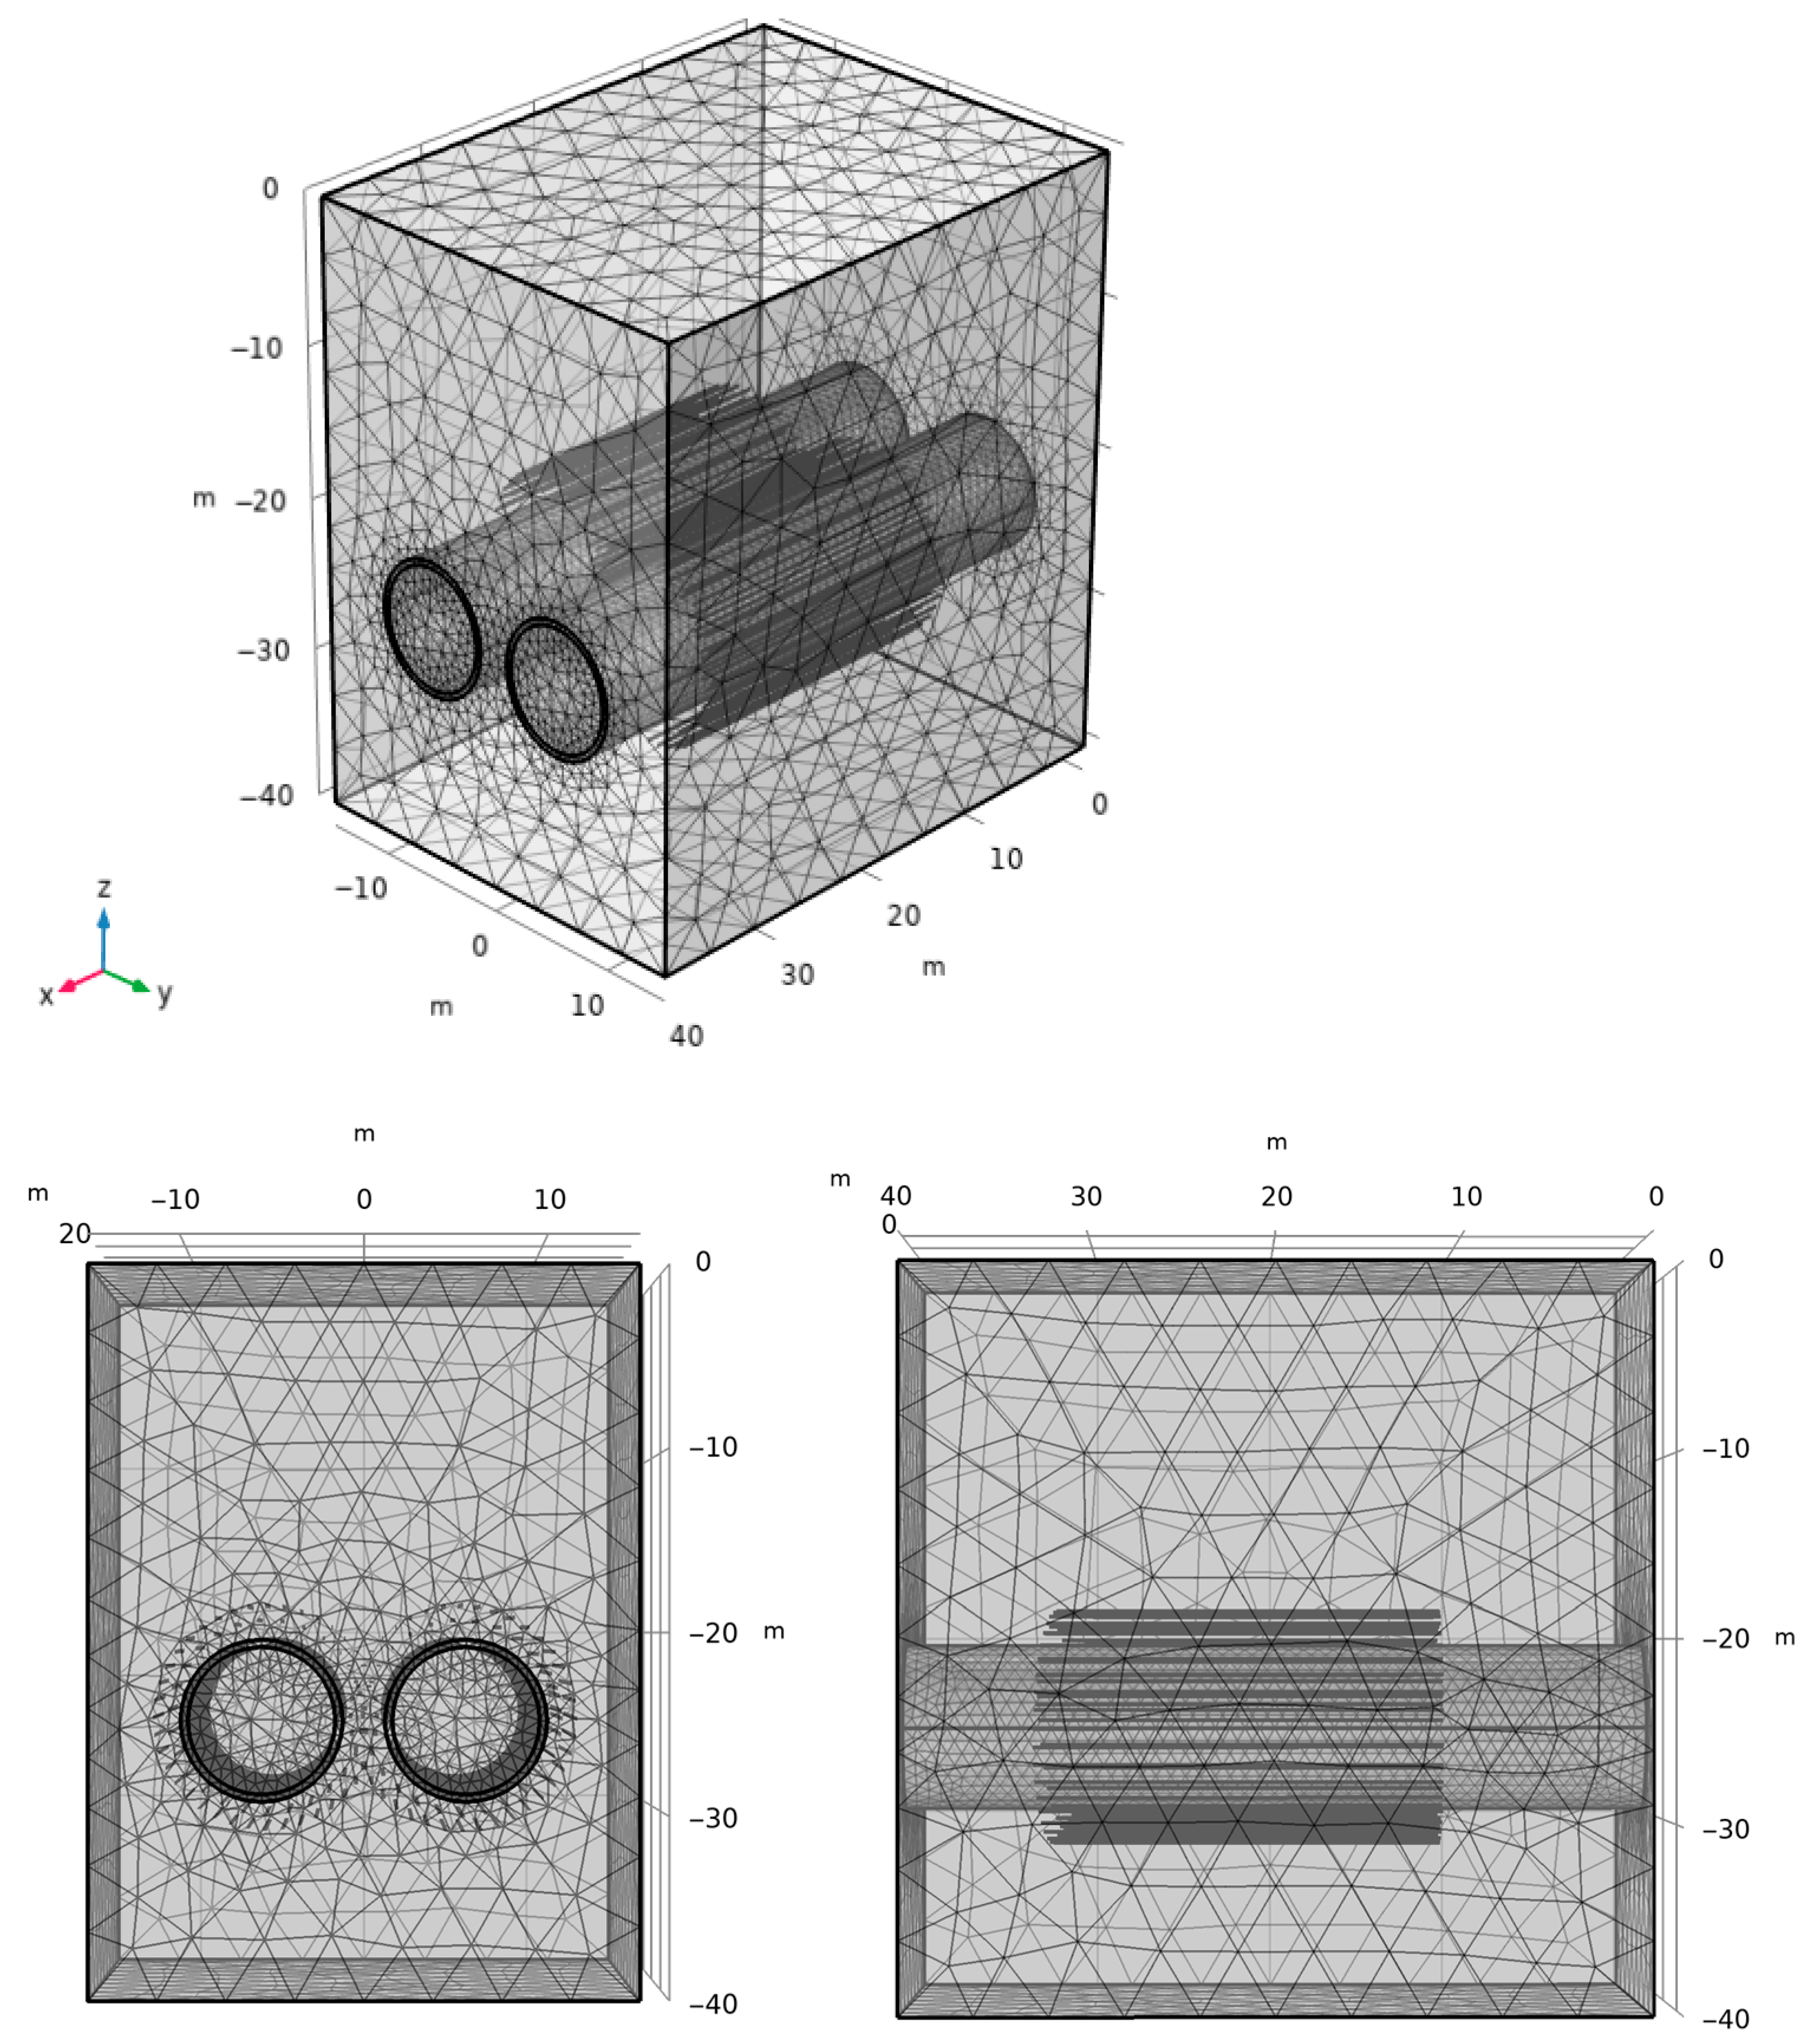
In order to ensure the accuracy of numerical simulation, the model is finely meshed. In the areas with large temperature gradients around the freezing pipe and near the tunnel, the dense grid processing is used to ensure that the details of the temperature field can be accurately captured. In the area far away from the freezing pipe and the tunnel, the grid size is appropriately increased to balance the calculation accuracy and calculation efficiency. The specific grid division situation is shown in Figure 4. Through many experiments, the appropriate meshing scheme is determined to make the grid quality meet the calculation requirements and avoid the deviation of the calculation results due to the grid quality problem. In key areas, such as the contact area between the freezing pipe and the soil, the minimum unit size is controlled within the range that can accurately reflect the temperature change, while ensuring the continuity and rationality of the overall grid.

5.4. Solution Settings and Two-Dimensional Equivalent Extraction

The steady-state heat transfer solver is selected in COMSOL Multiphysics software for calculation. The relative tolerance is set to 1 × 10⁻⁵ to ensure the accuracy of temperature field calculation. The MUMPS solver is used to solve the sparse matrix equation quickly. During the solution process, special attention is given to the convergence of the calculation. In the event of anomalies, solver parameters are adjusted or model settings are re-examined to ensure stable and reliable results. Through the above steps, the numerical model of the temperature field of the annular double-loop freezing pipe of the adjacent tunnel based on COMSOL is completed. After the calculation of the three-dimensional model is completed, the temperature field data of the Z = 0 m transverse section of the tunnel are extracted by COMSOL Multiphysics post-processing module. Figure 5 is the extracted temperature distribution cloud map.

6. Accuracy Test of the Solution

There is a certain degree of simplification in the above derivation process. Considering whether the steady-state temperature field can well predict the temperature distribution of the transient temperature field, it is necessary to verify the accuracy of the solution. Therefore, in this paper, the analytical solution of the model is implemented in Python 3.12. The program applies the derived analytical expressions to compute temperature values across a defined grid of spatial coordinates, enabling visualization of the steady-state temperature distribution. By using libraries such as NumPy for numerical calculations and Matplotlib 3.10.3 for plotting, a two-dimensional temperature field image is generated, which provides an intuitive representation of the frozen core area and the overall heat transfer characteristics.
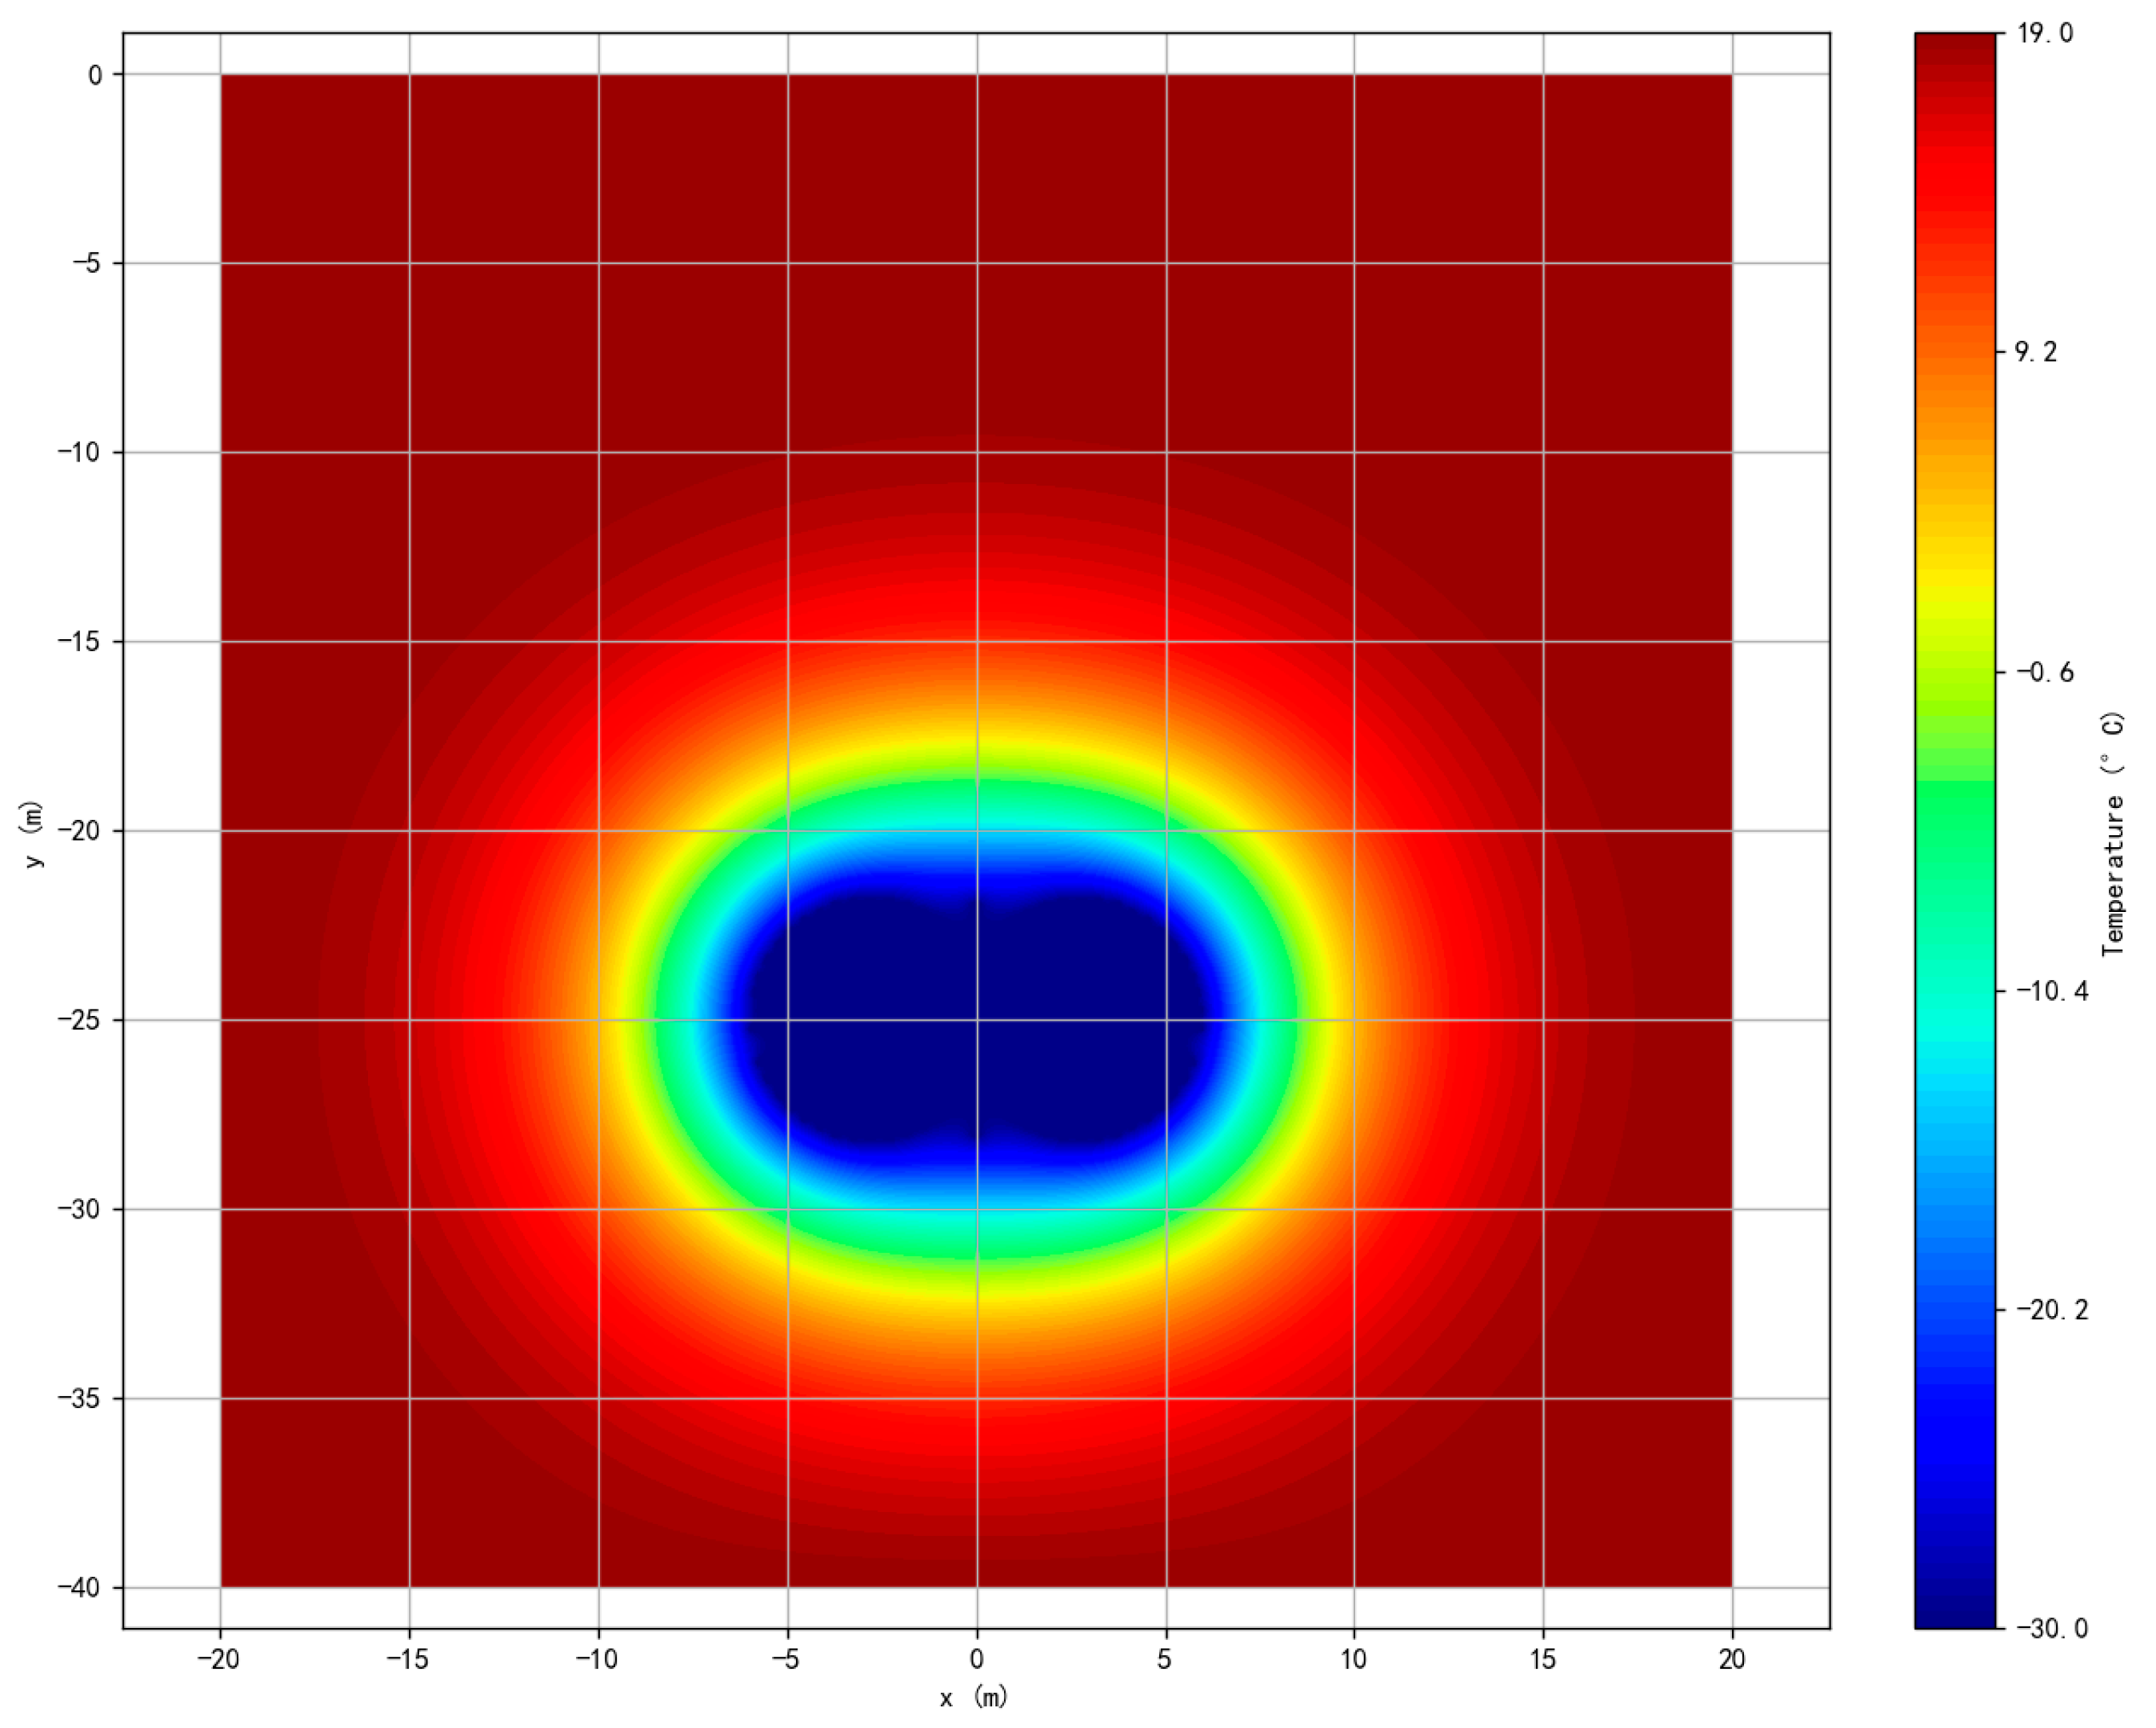
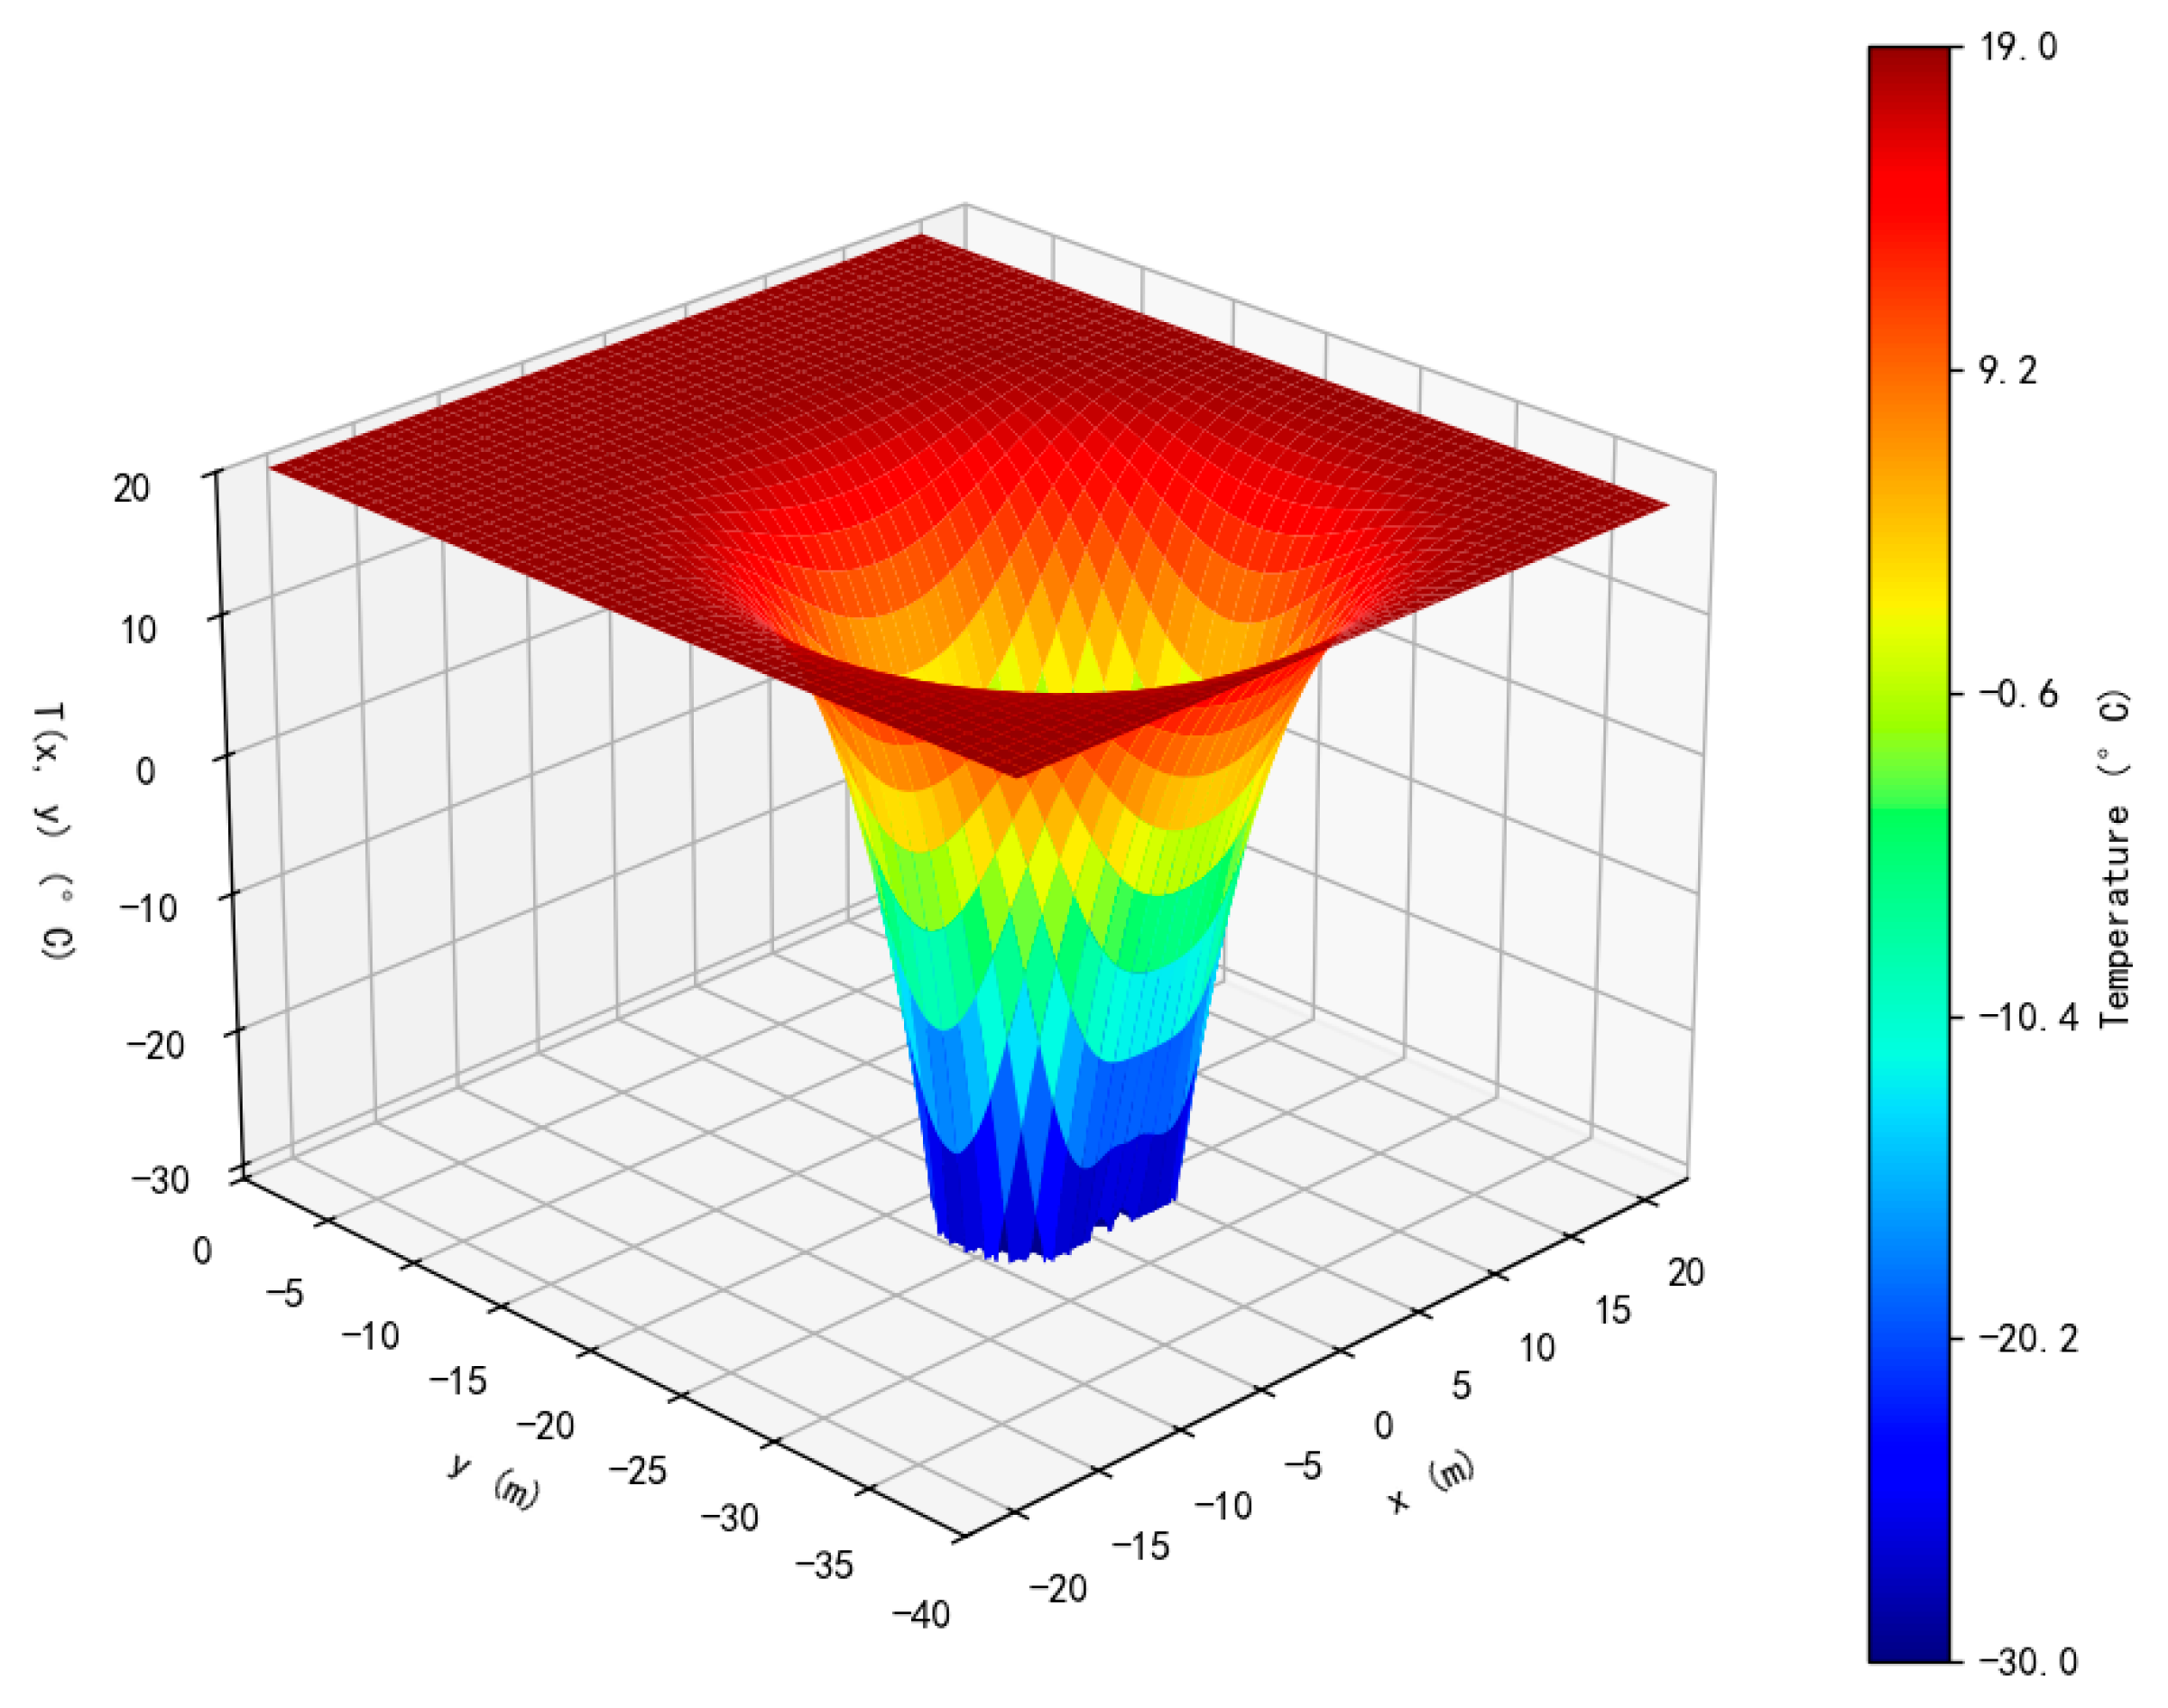
Figure 6 shows the steady-state temperature field distribution of the double-loop freezing system of adjacent tunnels on the two-dimensional plane (x, y) drawn by Python 3.12 programming. The color in the figure gradually changes from dark blue to red, corresponding to the gradual transition from the lowest temperature to the natural ground temperature. The frozen core area is clearly delineated, and the shape is approximately elliptical, which conforms to the geometric logic of symmetrical arrangement of double-loop freezing pipes. The distribution of isothermal lines is continuous and dense, showing obvious heat conduction gradient, which verifies the accuracy of the polar coordinate form and conformal transformation used in the analytical model in the geometric mapping. Figure 7 is a three-dimensional expansion of Figure 6, which shows the spatial variation trend of temperature field in the (x, y) plane. The frozen core area is obviously concave in the shape of ‘hot well’, and the lowest temperature area is concentrated near the center of the double tunnel layout area. The steep area of temperature gradient is concentrated around the freezing pipes, which reflects the local concentration of heat conduction. The stereogram highlights the ability of temperature response under the superposition effect of multiple cold sources. The thermal field diffusion boundary is obvious and the contour is distinct. Through Figure 5 and Figure 6, it can be seen that the analytical solution and the numerical solution have good consistency in the prediction of temperature distribution trend, isotherm shape and freezing core area.
In order to further evaluate the accuracy of the analytical solution, this paper selects seven representative points (A-F and O) to quantitatively compare the results of the analytical solution and the numerical simulation (Figure 8).
The calculation formulas for the root mean square error and correlation coefficient are as follows:
R M S E = 1 7 i = 1 7 ( T n u m T a n a ) 2
R = i = 1 7 ( T n u m , i T ¯ n u m ) ( T a n a , i T ¯ a n a ) i = 1 7 ( T n u m , i T ¯ n u m ) 2 ( T a n a , i T ¯ a n a ) 2
where T n u m is the temperature of the analytical solution; T a n a is the temperature of the numerical solution; T n u m , i represents the numerical solution temperature of the i-th point; T a n a , i represents the analytical solution temperature of the i-th point; T ¯ n u m represents the average value of the numerical solution temperature; T ¯ a n a represents the average value of the analytical solution temperature.
The results are summarized in Table 3. The absolute error ranges between 0.772 °C and 1.917 °C, corresponding to relative errors of 2.57–6.99%. The overall RMSE is calculated to be 1.462 °C. The correlation coefficient between the analytical and numerical results is R = 0.534 (53.4%). Although this value indicates only a moderate correlation, the RMSE and relative errors remain within acceptable ranges for engineering approximations. This suggests that the analytical model can still provide useful guidance in preliminary design, while detailed numerical simulations are needed for refined analysis. These results confirm that the analytical model can reproduce the overall temperature distribution trend and capture the frozen core region with sufficient accuracy for engineering applications. Although deviations are observed due to simplifying assumptions (e.g., steady-state approximation, constant soil thermal properties), the analytical solution remains reliable as a rapid prediction tool in the early design stage, while the numerical simulation can be reserved for refined analysis and risk assessment.
The results show that the analytical method proposed in this paper can obtain the distribution law of the freezing temperature field under steady-state conditions on the basis of meeting the accuracy requirements of engineering applications. Especially under the condition that the freezing pipes are arranged around and the temperature difference is obvious, the analytical solution can still accurately capture the contour of the low temperature region, which verifies the theoretical rationality and practicability of the constructed model. In the early stage of engineering design, the analytical solution method can realize the rapid estimation and sensitivity analysis of the freezing range, and significantly improve the efficiency of parameter optimization. The COMSOL Multiphysics numerical model is more suitable for refined later verification and risk simulation. The combination of the two can provide theoretical and engineering support for the freezing design of adjacent tunnels under complex geological conditions. It should be noted that the proposed analytical model is based on steady-state assumptions with constant soil thermal parameters, without considering groundwater seepage or phase-change effects. Therefore, its applicability is limited to preliminary design and parameter optimization, while detailed risk analysis should rely on numerical simulations.

7. Conclusions

In this paper, based on the polar coordinate heat conduction theory and the complex variable function conformal transformation method, a two-dimensional steady-state temperature field analytical model is constructed for the temperature field problem of the annular double-loop freezing system of adjacent double tunnels under complex working conditions of urban subways. The following main conclusions are obtained:
  • Model development and applicability. The analytical framework successfully transforms the complex double-loop system into a solvable generalized single-row problem through heat source superposition. The proposed model is applicable under steady-state conditions, with assumptions of constant soil thermal parameters and negligible groundwater flow and phase-change effects. It is thus suitable mainly for preliminary design, parameter optimization, and sensitivity studies, but not for final safety assessments under highly dynamic or heterogeneous conditions.
  • Accuracy and validation. Quantitative comparisons with COMSOL Multiphysics 6.2 numerical simulations confirm the reliability of the analytical model. At seven representative points, the RMSE between the analytical and numerical results was 1.462 °C, with relative errors of 2.57–6.99% and a correlation coefficient of R = 0.534. These results demonstrate that the analytical solution can reproduce the overall temperature distribution trend, isothermal contour shapes, and frozen core area characterization with sufficient accuracy for engineering applications.
  • Sensitivity and robustness. A sensitivity analysis indicates that the analytical solution responds predictably to variations in soil thermal conductivity, freezing pipe radius and spacing, and brine temperature. This highlights its robustness for design parameter evaluation, even though simplifications may limit absolute accuracy.
  • Engineering significance. The analytical model provides a rapid and practical tool for early-stage freezing scheme design and optimization, significantly improving computational efficiency. For detailed verification and risk control, particularly under complex geological and hydrogeological conditions, COMSOL numerical simulations remain indispensable. The combination of both approaches offers a comprehensive methodology for freezing design in adjacent tunnels.
Several limitations of this study should also be acknowledged. The analytical framework assumes constant thermal parameters and steady-state conditions, which may not fully capture the complexity of real freezing processes, particularly in heterogeneous or layered soils. Furthermore, validation has thus far been limited to a single case study, without comprehensive testing across diverse geological and hydrological settings. Future research will therefore focus on incorporating temperature-dependent material properties, stratified soil structures, and multiple engineering case studies to enhance the robustness and applicability of the model. In addition, the influence of construction sequence and external disturbances on freezing performance will be investigated through field monitoring and advanced numerical simulations.

Author Contributions

Conceptualization, J.Z. and K.M.; methodology, J.Z. and K.M.; software, C.B. and C.L.; validation, J.Z., K.M. and H.Z.; formal analysis, J.Z., H.Z. and X.S.; investigation, J.Z., H.Z. and C.B.; resources, J.Z. and X.S.; data curation, H.Z. and C.L.; writing—original draft preparation, K.M. and C.B.; writing—review and editing, J.Z. and X.S.; visualization, C.L. and H.Z.; supervision, J.Z.; project administration, J.Z. and X.S.; funding acquisition, J.Z. and X.S. All authors have read and agreed to the published version of the manuscript.

Funding

The research was funded by the National Natural Science Foundation of China (No. 42477182), the Natural Science Foundation of Chongqing, China (CSTB2023NSCO-MSX0816) and Research on key technical issues and digital twin technology of freezing restoration project of Bangkok Tunnel (kz0023020241452).

Institutional Review Board Statement

Not applicable.

Informed Consent Statement

Not applicable.

Data Availability Statement

Data will be made available on request.

Conflicts of Interest

Author Xinmin Shang was employed by the company Junchi Engineering Co., Ltd. The remaining authors declare that the research was conducted in the absence of any commercial or financial relationships that could be construed as a potential conflict of interest.

Nomenclature

SymbolDefinitionUnit
d The abscissa of the center of the circlem
R 0 Freezing tube radiusm
R 1 The inner boundary of the frozen zonem
R 2 The arrangement radius of the inner ring freezing pipem
R 3 The arrangement radius of the outer ring freezing pipem
R 4 The radius of the outer boundary of the frozen zonem
T Soil temperature field functionK
r Polar radius1
θ Polar anglerad
T f Freezing tube temperatureK
T 0 Natural ground temperatureK
n 1 The number of inner ring freezing tubes/
n 2 The number of outer ring freezing tubes/
β Rotate the outer ring of the freezing tube at an angle relative to the inner ringrad
ξ 1 The distance from the center of the outer freezing pipes to the outer boundarym
ξ 2 The distance from the center of the inner circle freezing tube to the inner boundarym
ρ Material densitykg/m3
λ Thermal conductivity of materialW/(m·K)
C p The constant pressure heat capacity of the materiaJ/(kg·K)
E Young’s modulusGPa
μ Poisson’s ratio of material/
α Thermal expansion coefficient of the material1/K

References

  1. Ding, Z.; Wei, X.-J.; Wei, G. Prediction methods on tunnel-excavation induced surface settlement around adjacent building. Geomech. Eng. 2017, 12, 185–195. [Google Scholar] [CrossRef]
  2. Liu, C.; Bezuijen, A.; Yang, M.; Cachim, P. Elastic analysis of ground movements around a tunnel considering a buoyant lining moving upwards. Int. J. Numer. Anal. Methods Geomech. 2019, 43, 1562–1575. [Google Scholar] [CrossRef]
  3. Su, Y.; Su, Y.; Zhao, M.; Vlachopoulos, N. Tunnel Stability Analysis in Weak Rocks Using the Convergence Confinement Method. Rock Mech. Rock Eng. 2020, 54, 559–582. [Google Scholar] [CrossRef]
  4. Huang, K.; Sun, Y.-W.; Zhou, D.-Q.; Li, Y.-J.; Jiang, M.; Huang, X.-Q. Influence of water-rich tunnel by shield tunneling on existing bridge pile foundation in layered soils. J. Central South Univ. 2021, 28, 2574–2588. [Google Scholar] [CrossRef]
  5. Chen, H.; Shen, G.Q.; Feng, Z.; Yang, S. Safety risk assessment of shield tunneling under existing tunnels: A hybrid trapezoidal cloud model and Bayesian network approach. Tunn. Undergr. Space Technol. 2024, 152, 105936. [Google Scholar] [CrossRef]
  6. Gallardo, A.H.; Marui, A. The aftermath of the Fukushima nuclear accident: Measures to contain groundwater contamination. Sci. Total. Environ. 2016, 547, 261–268. [Google Scholar] [CrossRef] [PubMed]
  7. Shen, Y.-J.; Wang, Y.-Z.; Zhao, X.-D.; Yang, G.-S.; Jia, H.-L.; Rong, T.-L. The influence of temperature and moisture content on sandstone thermal conductivity from a case using the artificial ground freezing(AGF) method. Cold Reg. Sci. Technol. 2018, 155, 149–160. [Google Scholar] [CrossRef]
  8. Zhelnin, M.; Kostina, A.; Prokhorov, A.; Plekhov, O.; Semin, M.; Levin, L. Coupled thermo-hydro-mechanical modeling of frost heave and water migration during artificial freezing of soils for mineshaft sinking. J. Rock Mech. Geotech. Eng. 2022, 14, 537–559. [Google Scholar] [CrossRef]
  9. Wallis, S. Freezing Under the Sea Rescues Oslo-Fjord Highway Tunnel. 1999. Available online: https://prokcssmedia.blob.core.windows.net/sys-master-images/h51/h8a/8898431287326/GEOFROST.pdf (accessed on 1 August 2025).
  10. Hu, X.D.; Zhang, L.Y. Artificial Ground Freezing for Rehabilitation of Tunneling Shield in Subsea Environment. Adv. Mater. Res. 2013, 734–737, 517–521. [Google Scholar] [CrossRef]
  11. Papakonstantinou, S.; Anagnostou, G.; Pimentel, E. Evaluation of ground freezing data from the Naples subway. Proc. Inst. Civ. Eng.—Geotech. Eng. 2013, 166, 280–298. [Google Scholar] [CrossRef]
  12. Marwan, A.; Zhou, M.-M.; Abdelrehim, M.Z.; Meschke, G. Optimization of artificial ground freezing in tunneling in the presence of seepage flow. Comput. Geotech. 2016, 75, 112–125. [Google Scholar] [CrossRef]
  13. Li, Z.; Chen, J.; Sugimoto, M.; Ge, H. Numerical simulation model of artificial ground freezing for tunneling under seepage flow conditions. Tunn. Undergr. Space Technol. 2019, 92, 103035. [Google Scholar] [CrossRef]
  14. Alzoubi, M.A.; Xu, M.; Hassani, F.P.; Poncet, S.; Sasmito, A.P. Artificial ground freezing: A review of thermal and hydraulic aspects. Tunn. Undergr. Space Technol. 2020, 104, 103534. [Google Scholar] [CrossRef]
  15. Liu, P.; Hu, J.; Dong, Q.; Chen, Y. Studying the Freezing Law of Reinforcement by Using the Artificial Ground Freezing Method in Shallow Buried Tunnels. Appl. Sci. 2024, 14, 7106. [Google Scholar] [CrossRef]
  16. Hu, R.; Liu, Q.; Xing, Y. Case Study of Heat Transfer during Artificial Ground Freezing with Groundwater Flow. Water 2018, 10, 1322. [Google Scholar] [CrossRef]
  17. Zhou, J.; Zhou, H.; Wang, C.; Guo, Z.; Pei, W. Analysis of moisture Migration, Temperature, and pore structure characteristics of the muddy clay column subject to artificial ground freezing Based on LF NMR. Tunn. Undergr. Space Technol. 2022, 133, 104948. [Google Scholar] [CrossRef]
  18. Hu, X.; Fang, T.; Han, Y. Generalized analytical solution of steady-state temperature field of annular double-loop pipes freezing. J. Coal 2017, 42, 2287–2294. (In Chinese) [Google Scholar] [CrossRef]
  19. Troupak, N.G. Freezing of Rocks During Shaft Sinking (Замoраживание Гoрных Пoрoд При Прo Хoдке Ствoлoв); Ugletekhizdat: Moscow, Russia, 1954. [Google Scholar]
  20. Hu, X.; Fang, T. Analytical solution of steady-state temperature field of generalized single-row pipes freezing. J. Coal 2019, 44, 535–543. (In Chinese) [Google Scholar] [CrossRef]
  21. Hu, X.; Han, Y.; Yu, X. Generalized analytical solution of steady-state temperature field of double-row pipes freezing. J. Tongji Univ. (Nat. Sci. Ed.) 2015, 43, 386–391. (In Chinese) [Google Scholar]
  22. DG/TJ 08-902-2016; Technical Code for Crosspassage Freezing Method. Shanghai Municipal Commission of Housing and Urban-Rural Development: Shanghai, China, 2016.
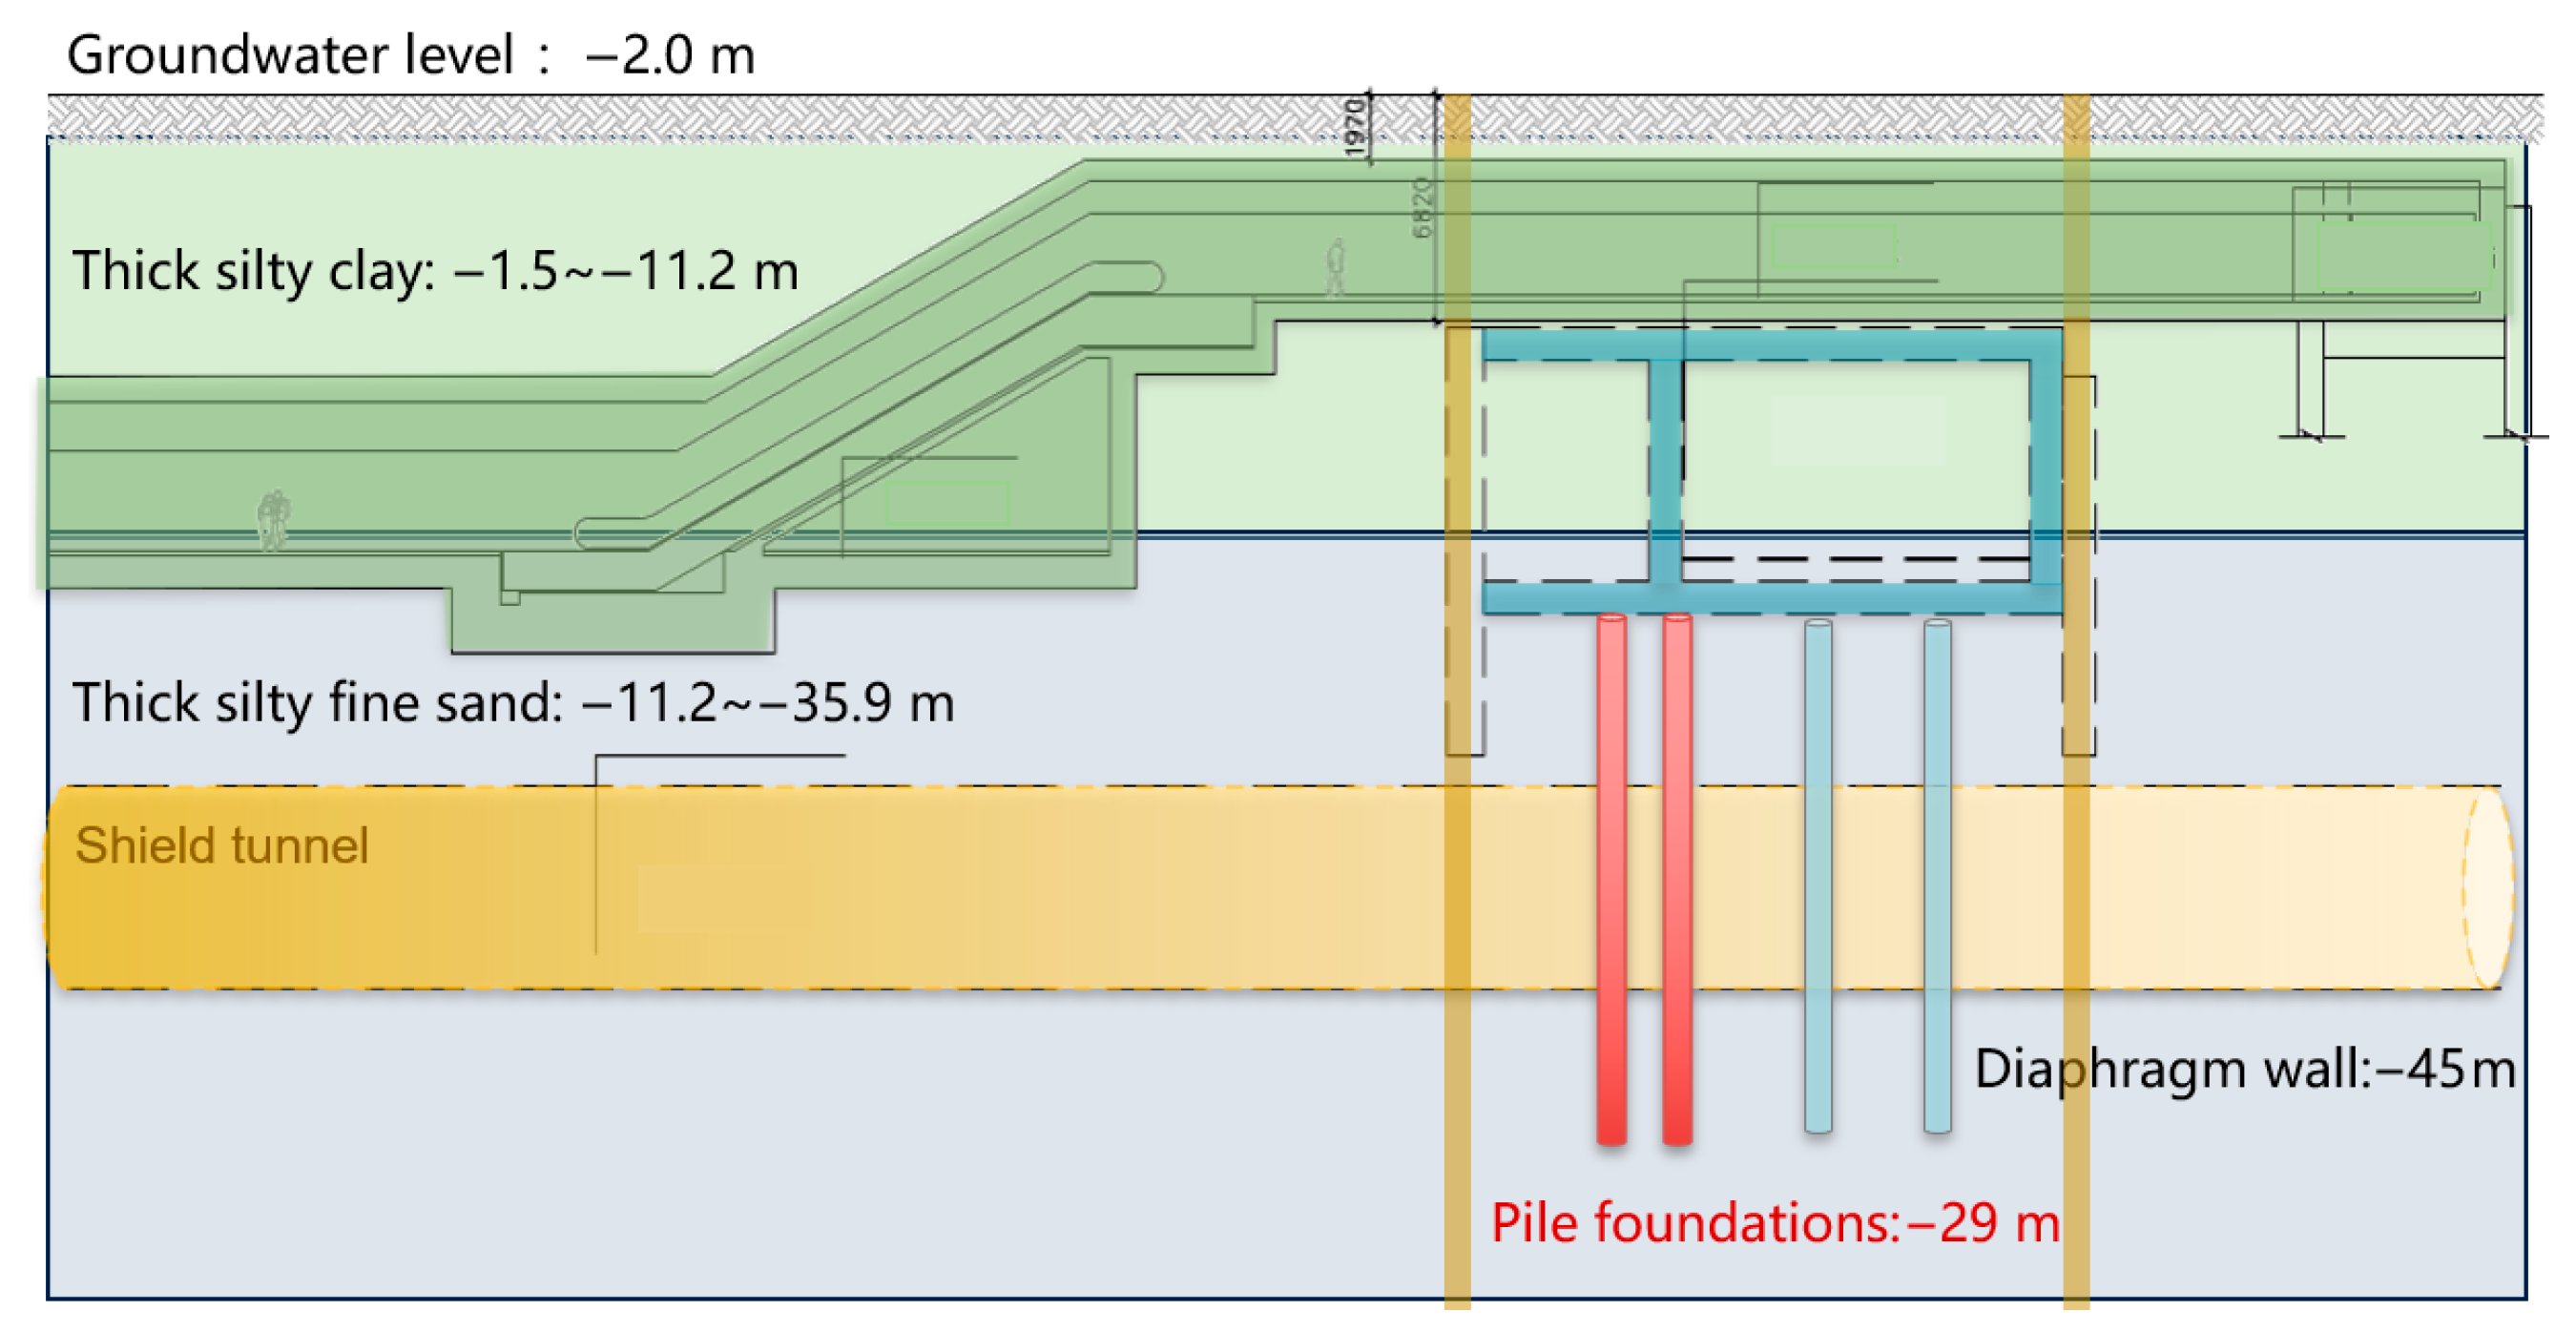
Figure 1. Geological stratification and distribution profile of structures.
Applsci 15 10149 g001
Figure 2. Layout plan of circular double-loop freezing pipes in adjacent tunnels.
Applsci 15 10149 g002
Figure 3. Left line double-loop pipes freezing model.
Applsci 15 10149 g003
Figure 4. Model grid division.
Applsci 15 10149 g004
Figure 5. Two-dimensional image of temperature field numerical solution.
Applsci 15 10149 g005
Figure 6. Analytical solution image of temperature field.
Applsci 15 10149 g006
Figure 7. Three-dimensional analytical solution of temperature field.
Applsci 15 10149 g007
Figure 8. Locations of points (A–F and O) for quantitative comparison between analytical and numerical solutions.
Applsci 15 10149 g008
Table 1. Geometric parameters of model.
ParametersNumerical ValueUnit
R 0 0.075m
R 2 2.750m
R 3 3.150m
n 1 30/
n 2 40/
T 0 19°C
T f −30°C
d 5.550m
Table 2. Materials and thermodynamic parameters.
Material TypesParametersNumerical ValueUnit
Groundwater ρ 1000kg/m3
λ 0.58W/(m·K)
C p 4200J/(kg·K)
Tunnel lining
(Concrete)
ρ 2300kg/m3
λ 1.8W/(m·K)
C p 880J/(kg·K)
E 25GPa
μ 0.20/
α 1 × 10−51/K
Silty fine sand ρ 1860kg/m3
λ 1.7838W/(m·K)
C p 3653.2J/(kg·K)
E 7 × 10⁷Pa
μ 0.23/
α 01/K
Where ρ is the material density; λ is the thermal conductivity of material; C p is the constant pressure heat capacity of the material; E is Young’s modulus; μ is the Poisson’s ratio of material; α is the thermal expansion coefficient of the material.
Table 3. Comparison of numerical and analytical temperatures at points and corresponding errors.
PointTnum (°C)Tana (°C)Abs. Error (°C)Rel. Error
A−29.987−29.2150.7722.57%
B−26.442−25.2381.2044.55%
C−26.956−28.7211.7656.55%
O−29.997−29.1240.8732.91%
D−27.304−25.8931.4115.17%
E−27.439−29.3561.9176.99%
F−27.267−29.1021.8356.73%
Disclaimer/Publisher’s Note: The statements, opinions and data contained in all publications are solely those of the individual author(s) and contributor(s) and not of MDPI and/or the editor(s). MDPI and/or the editor(s) disclaim responsibility for any injury to people or property resulting from any ideas, methods, instructions or products referred to in the content.