Article

Study on Simplified Model of Pressure Loading in Adjacent Cabin with Internal Explosions in Cabin

1
College of Mechanical and Electrical Engineering, North University of China, Taiyuan 030051, China
2
Chongqing Changjiang Electrical Appliances Industries Group Co., Ltd., Chongqing 404100, China
*
Author to whom correspondence should be addressed.
Appl. Sci. 2025, 15(18), 10140; https://doi.org/10.3390/app151810140
Submission received: 2 August 2025 / Revised: 11 September 2025 / Accepted: 12 September 2025 / Published: 17 September 2025

Abstract

The study of explosion loadings in cabin structures is of great significance for evaluating structural damage. At present, most studies focus on the characteristics of explosion loadings in a single cabin. However, there are few studies on the loading characteristics of adjacent cabins under multi-cabin explosions, and there is no calculation model for calculating the load of adjacent cabins. In order to study the pressure loading characteristics of the adjacent cabin during an internal explosion, a simplified calculation model of the adjacent cabin load was constructed. The adjacent cabin environment was constructed by clamping the perforated baffle between the two cabins. The opening area of the perforated baffle accounts for 3%, 5%, 15%, and 20% of the area of the baffle. The pressure loadings of the adjacent cabin were measured by an implosion test in the adjacent cabin. A finite element simulation calculation was carried out for the test conditions. The results show that the rise time of the quasi-static pressure is in good agreement with the test results. Based on the above research, the pressure loading characteristics of the adjacent cabin were determined. A simplified model of pressure change during the pressure relief process from the explosion cabin to the adjacent cabin was obtained. Assuming an exponential decay process during pressure venting, a theoretical method for calculating the rise time of quasi-static pressure in adjacent cabins was derived. Compared with the experimental value, the maximum error is 15.9%, which can realize the prediction of the quasi-static pressure rise time of the adjacent cabin during the internal explosion. This calculation method can provide load input for internal explosion damage assessment of the complex structure of the multi-cabin.

1. Introduction

Explosive loading within confined environments exhibits complex phenomena, including wave reflection and superposition [1,2], along with post-detonation combustion of explosive products [3,4]. These processes result in intricate loading patterns and pose challenges for accurate prediction [5]. As explosive loading constitutes the critical input parameter for assessing explosive damage capacity and extent [6], its precise characterization is essential. Realistic environments for confined explosions involve cabins [1,7,8,9,10,11], buildings [12,13,14,15], and pipelines or tunnels [16,17,18,19,20,21,22]. Internal explosions within structures can be categorized as fully confined or locally confined with venting holes. Based on simulations, Salvado F C [9] described typical pressure loading profiles in both fully and locally confined environments. The U.S. Unified Facilities Criteria (UFC 3-340-02) [6] simplifies internal blast loading into two distinct phases: the shock wave phase and the quasi-static pressure phase. Experimental work by Weibull H.R.W. [23] demonstrates that the shockwave phase remains unaffected by venting when the vent-to-cabin surface area ratio is sufficiently small. In terms of the distribution of internal explosions, Hou Hailiang et al. [24] carried out a small equivalent internal explosion test for a scaled-down cabin and measured the center of the cabin wall and the corners of the shockwave. The study showed that at the same proportional distance, the shock wave peak of the explosion in the air is lower than that of the internal explosion. V.R. Feldgun [3] carried out a series of internal explosions in an explosion cabin with a 1.2 m circular hole at the top and gave the distribution pattern of the peak shock wave on the wall surface inside the explosion cabin by arranging several pressure loading points to record the shock wave load. Similarly, HU Y [25], Zyskowski A [26], and others have carried out studies on cabin internal explosions loading and provided schematic diagrams of shock wave overpressure distribution on the walls of the cabins. However, their conclusions are only applicable to single-compartment internal explosions. For an internal explosion quasi-static pressure loading, Anderson [27], Kingery C.N. [28], Proctor [29], and Kinney G.F. [30] simplified the waveform of internal explosion quasi-static pressure loading in the presence of a vent based on the experimentally measured pressure data, segmenting the quasi-static pressure loading into peak point and depressurization regimes. Empirical models for predicting quasi-static pressure peaks were developed by Carlson R.W. [31], Moira D.C. [32], and Baker W.E. [33] through extensive testing across varied structural scales and charge weights. Established methodologies for estimating quasi-static pressure peaks are included in authoritative references, including the Lloyd’s Register Naval Rules [34] and U.S. Department of Defense standard TM5-1300 [35].
To summarize, most studies on internal explosion loads have focused on single cabins. However, practical structures such as buildings [6] and ship cabins [34] typically feature multiple cabins or structures. Windows, doors, or blast-induced structural breaches [16] facilitate the propagation of blast loads into adjacent cabins, resulting in secondary damage. Existing assessment methodologies are only capable of evaluating damage within the primary blast cabin; loading conditions and damage states in adjacent cabins remain unquantifiable by current approaches. Regarding the study of the adjacent cabin of the explosion, Wang Y [36] carried out a series of cabin internal explosions tests of the cabin where the explosion is located, including cabin wall shear failure and damage to the adjacent cabin. However, they did not systematically investigate the load characteristics within adjacent cabins. At present, the load characteristics of the implosion adjacent cabin are not determined, and the load form is not clear. The calculation model of the implosion adjacent cabin load is still unknown.
In order to investigate the pressure loadings characteristics in the cabin adjacent to an explosion and to develop a corresponding pressure loading model, an adjacent cabin environment was established by using two cabins with a perforated bulkhead clamped in the middle. A series of internal explosion tests was conducted by varying the opening area in the bulkhead, and pressure sensors were used to measure the pressure curves within the adjacent cabin. Based on the load characteristics of the adjacent cabin, this study systematically analyzed the characteristic parameters of pressure loads and elucidated the pressure load form of the implosion adjacent cabin, ultimately establishing a simplified load model tailored for adjacent explosion cabins. The findings of this study can provide support for assessing the damage range caused by accidental explosions in building and ship cabin environments.

2. Experimental Design

2.1. Cabin Structure Design

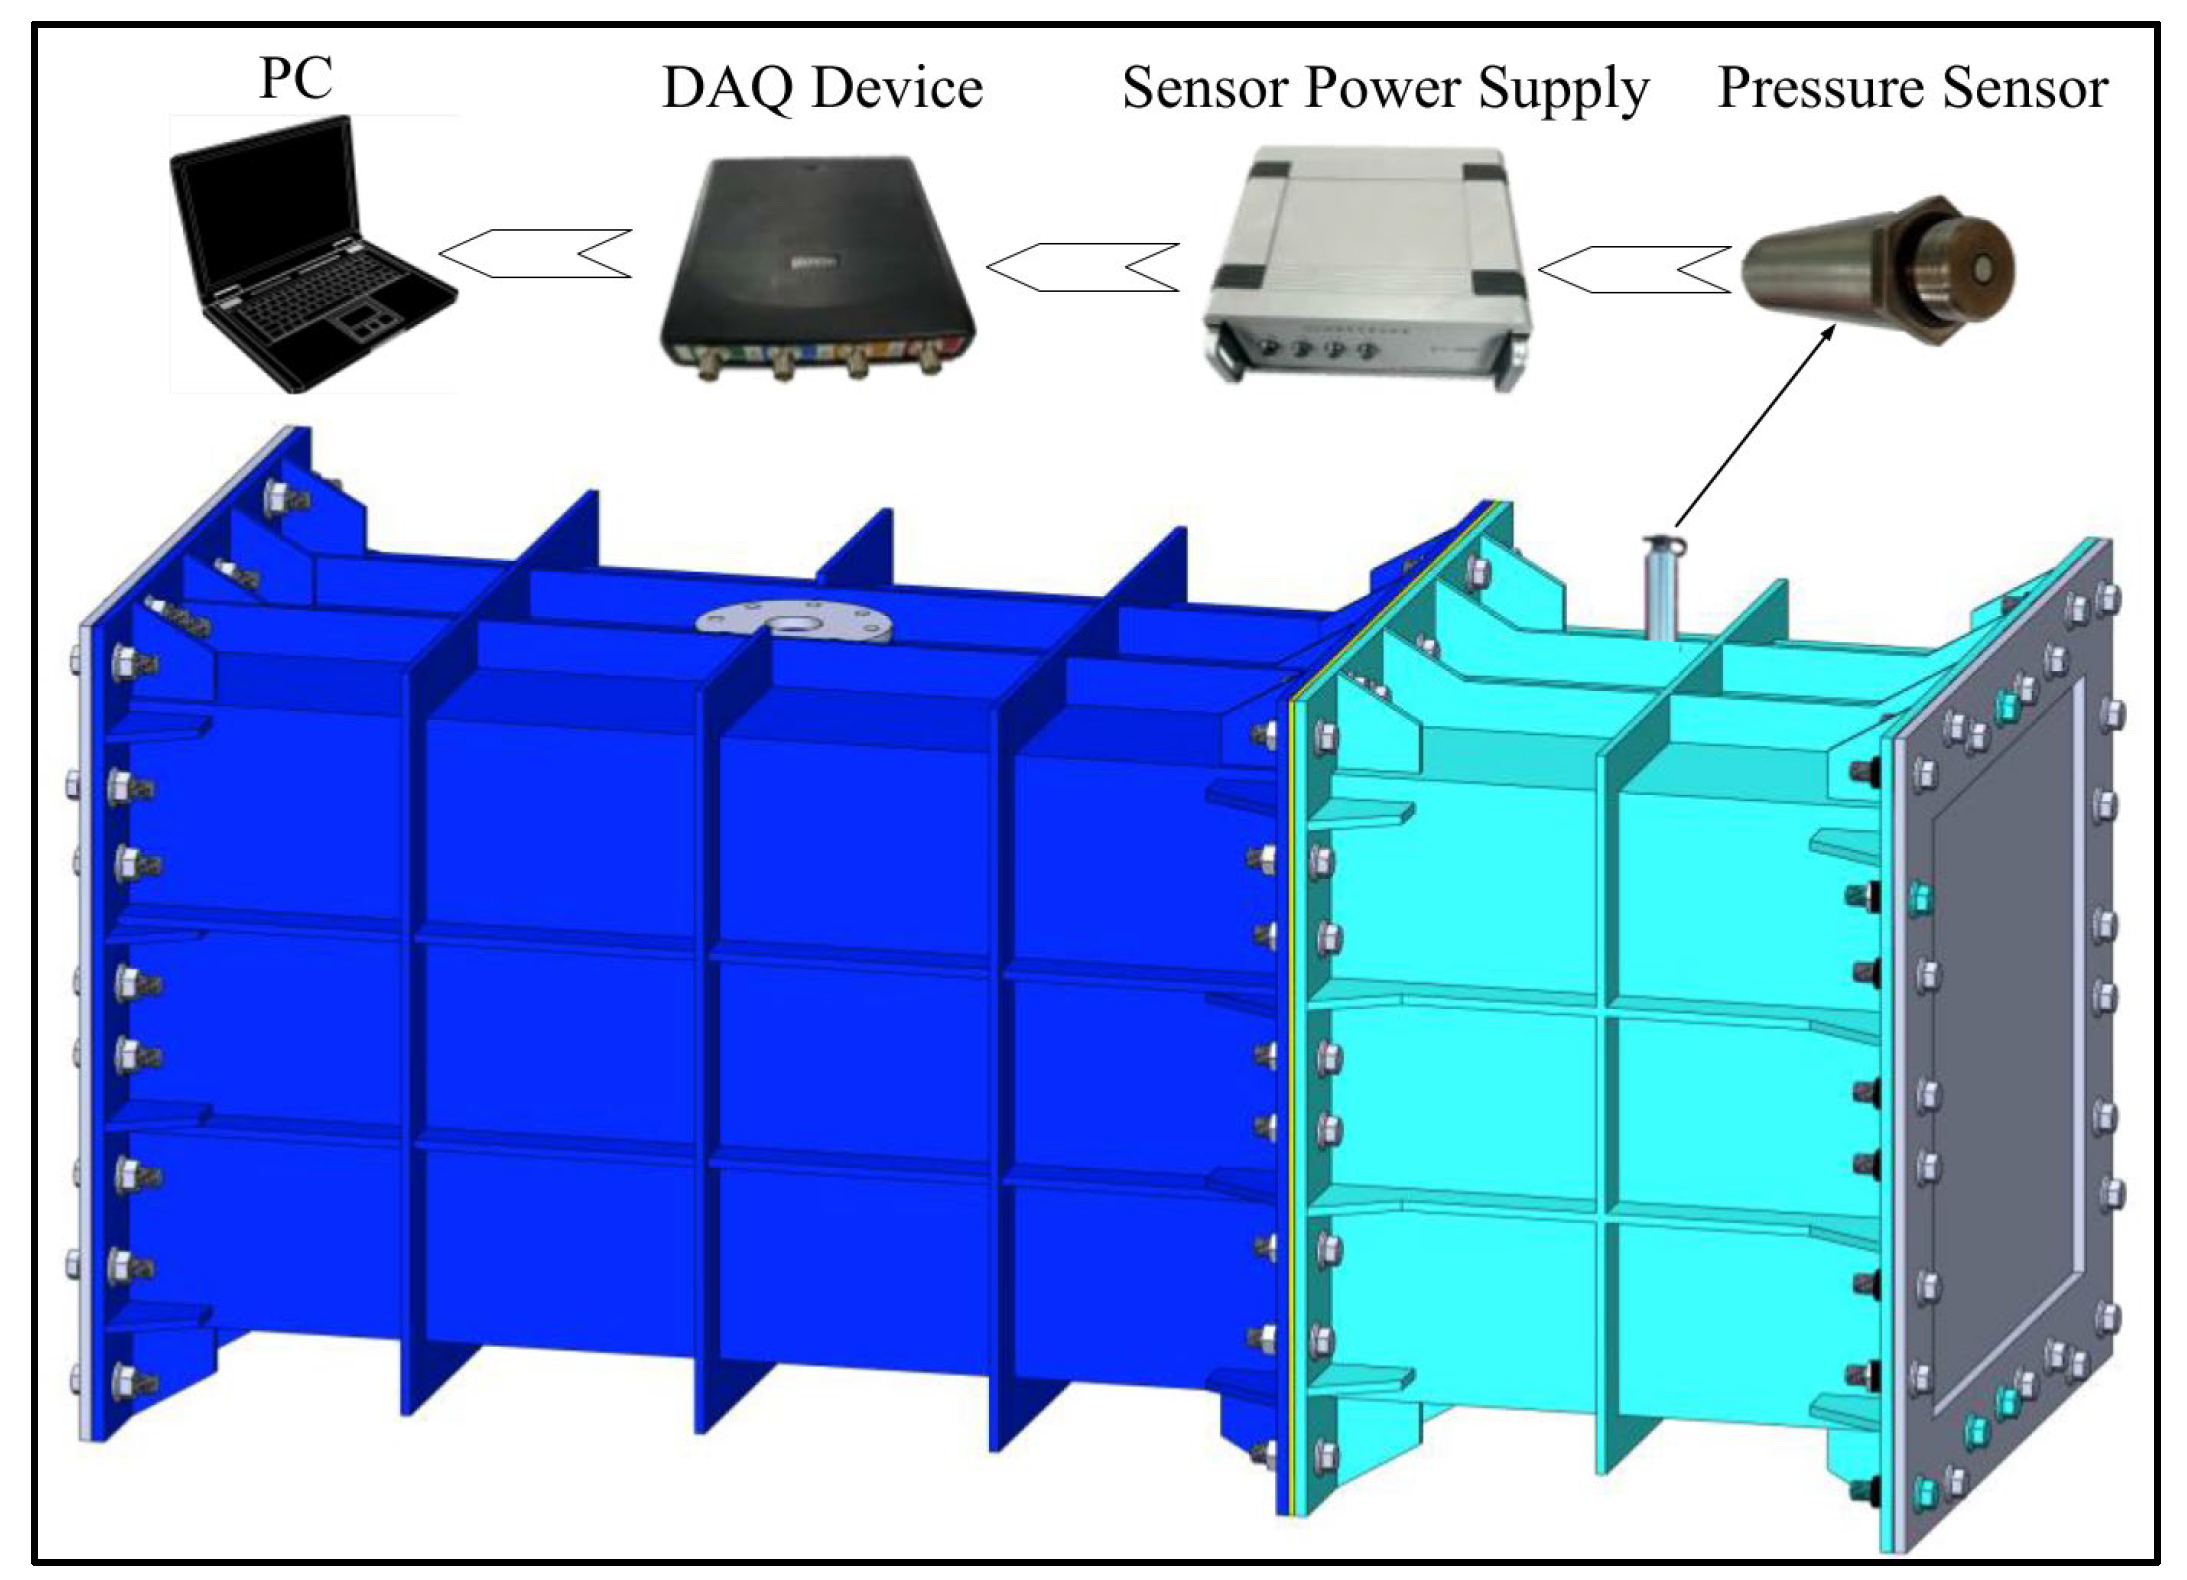
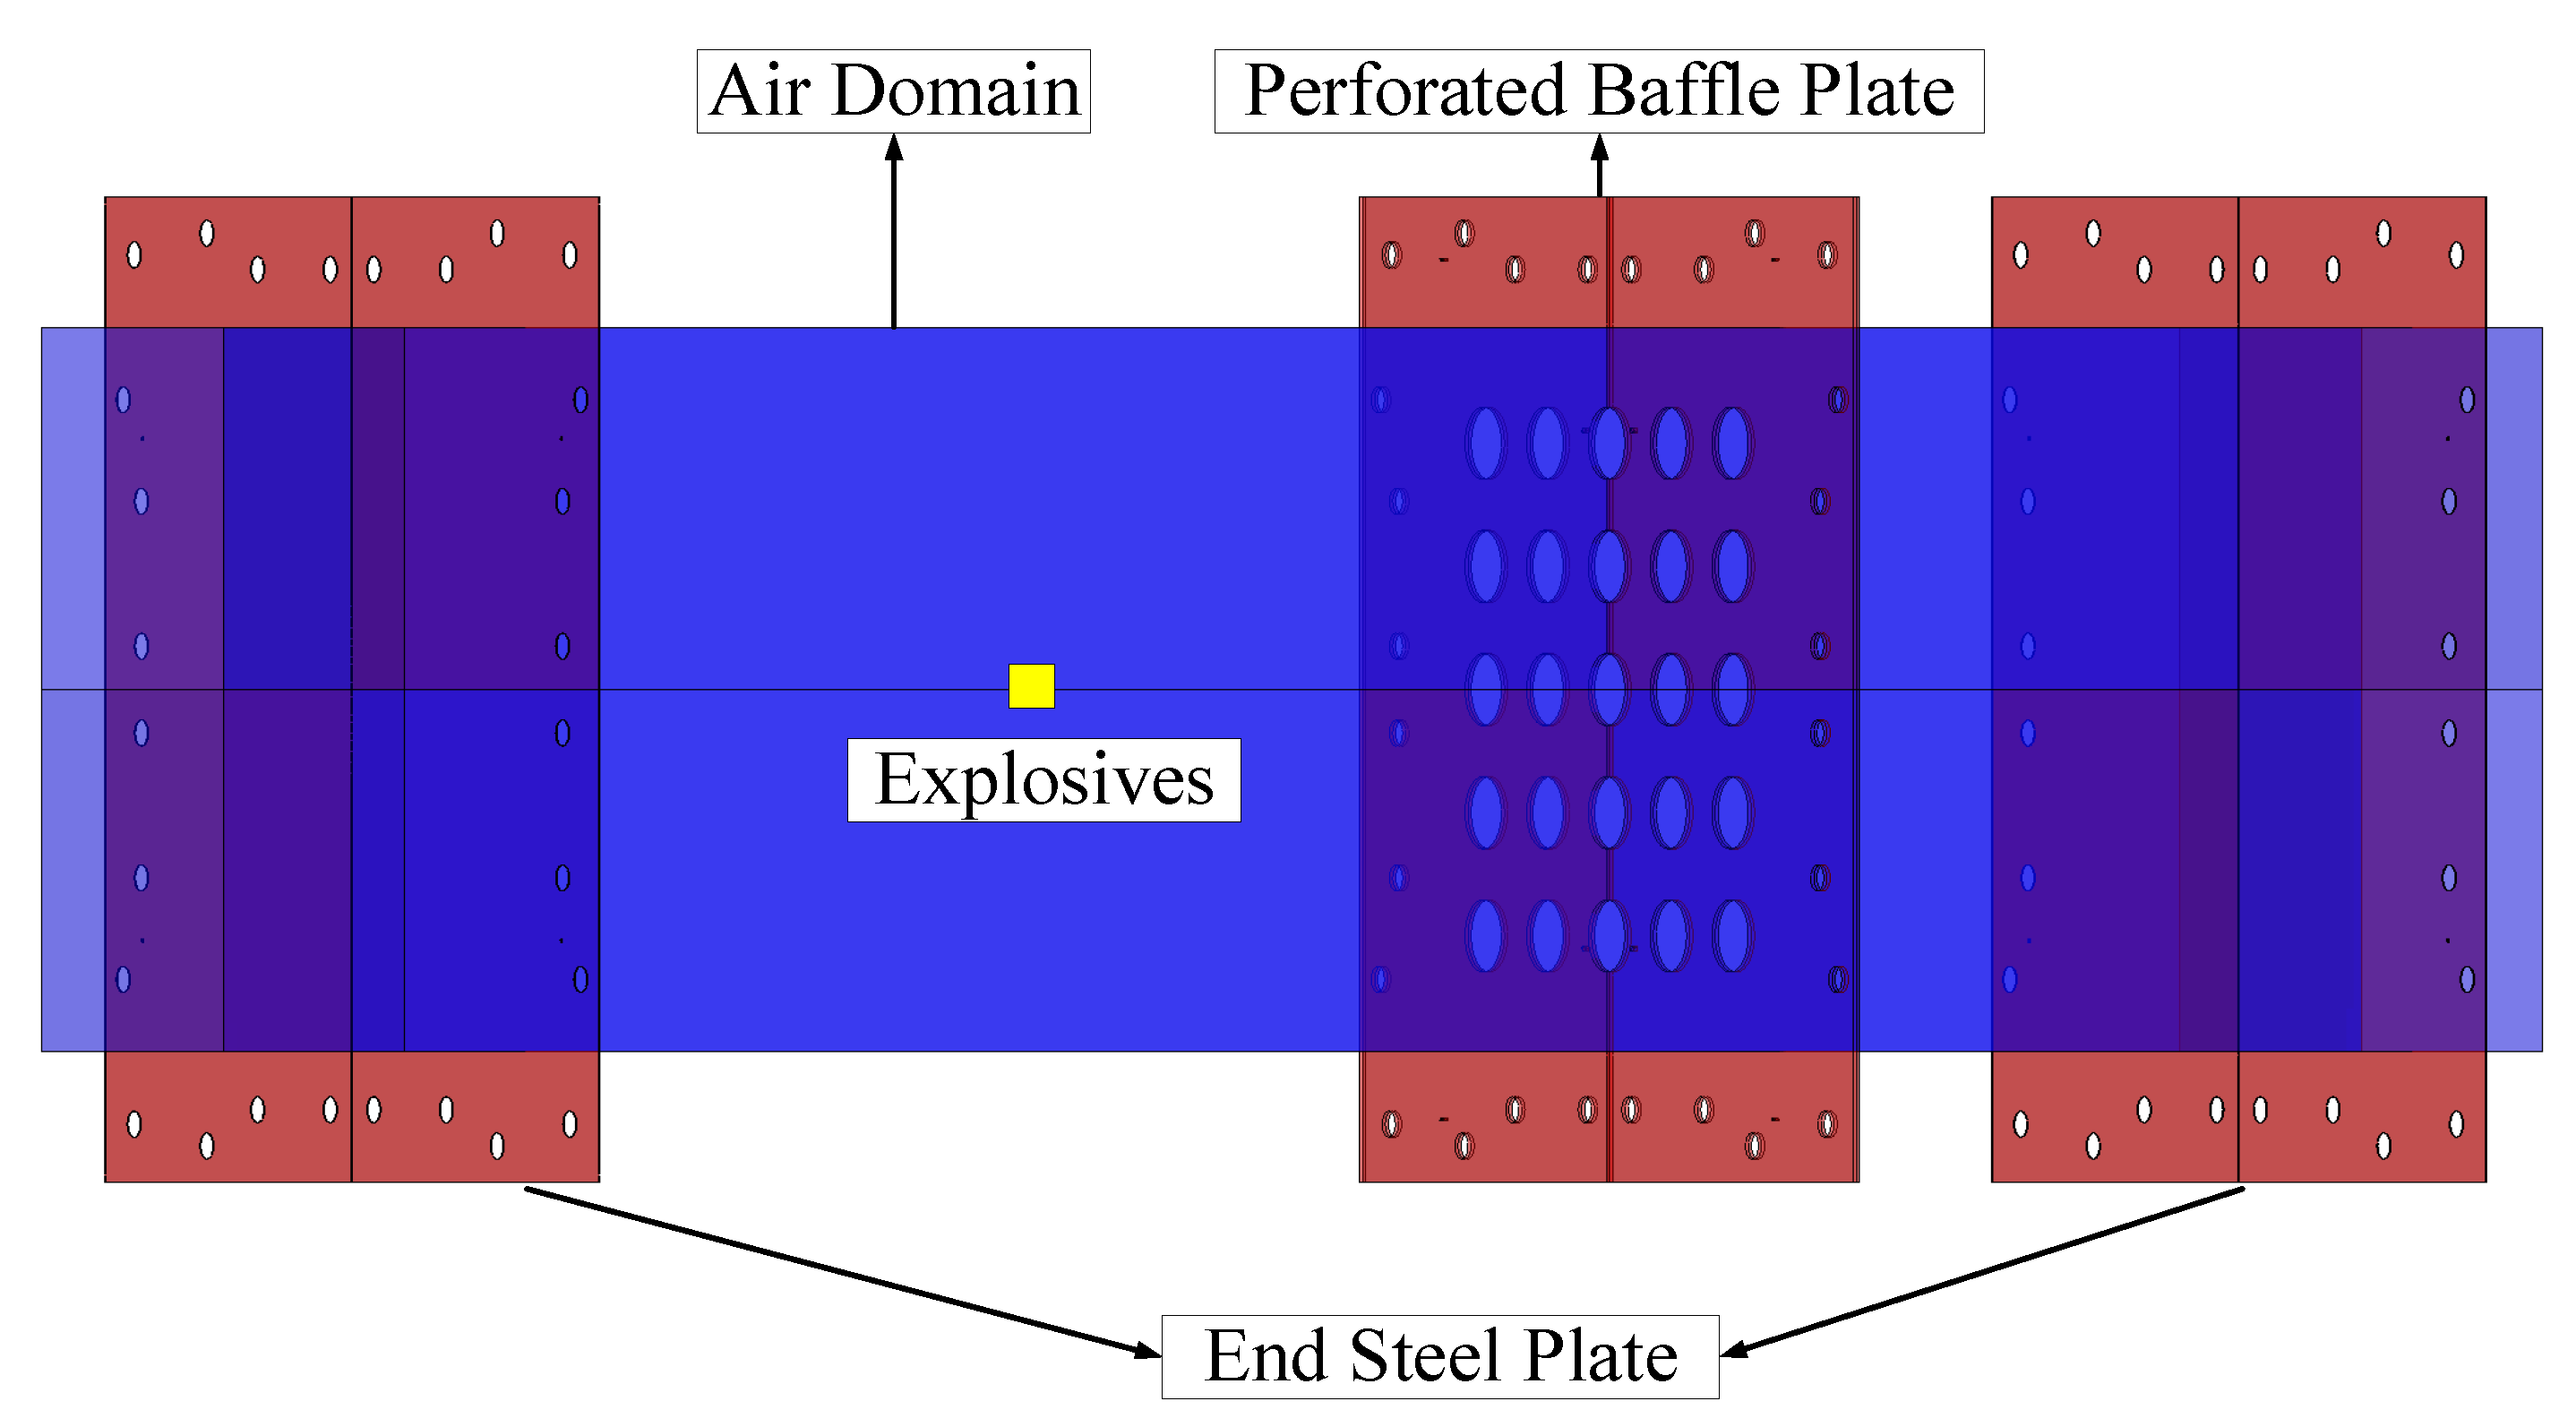
An adjacent cabin environment was constructed using two cabins separated by a clamped perforated bulkhead. As shown in Figure 1 (exploded view), the explosion cabin measured 1000 mm (L) × 500 mm (W) × 500 mm (H), while the adjacent cabin measured 500 mm × 500 mm × 500 mm internally. The wall thickness of both the explosion and the adjacent cabin is 10 mm. Both cabins are connected by a bolt connection.
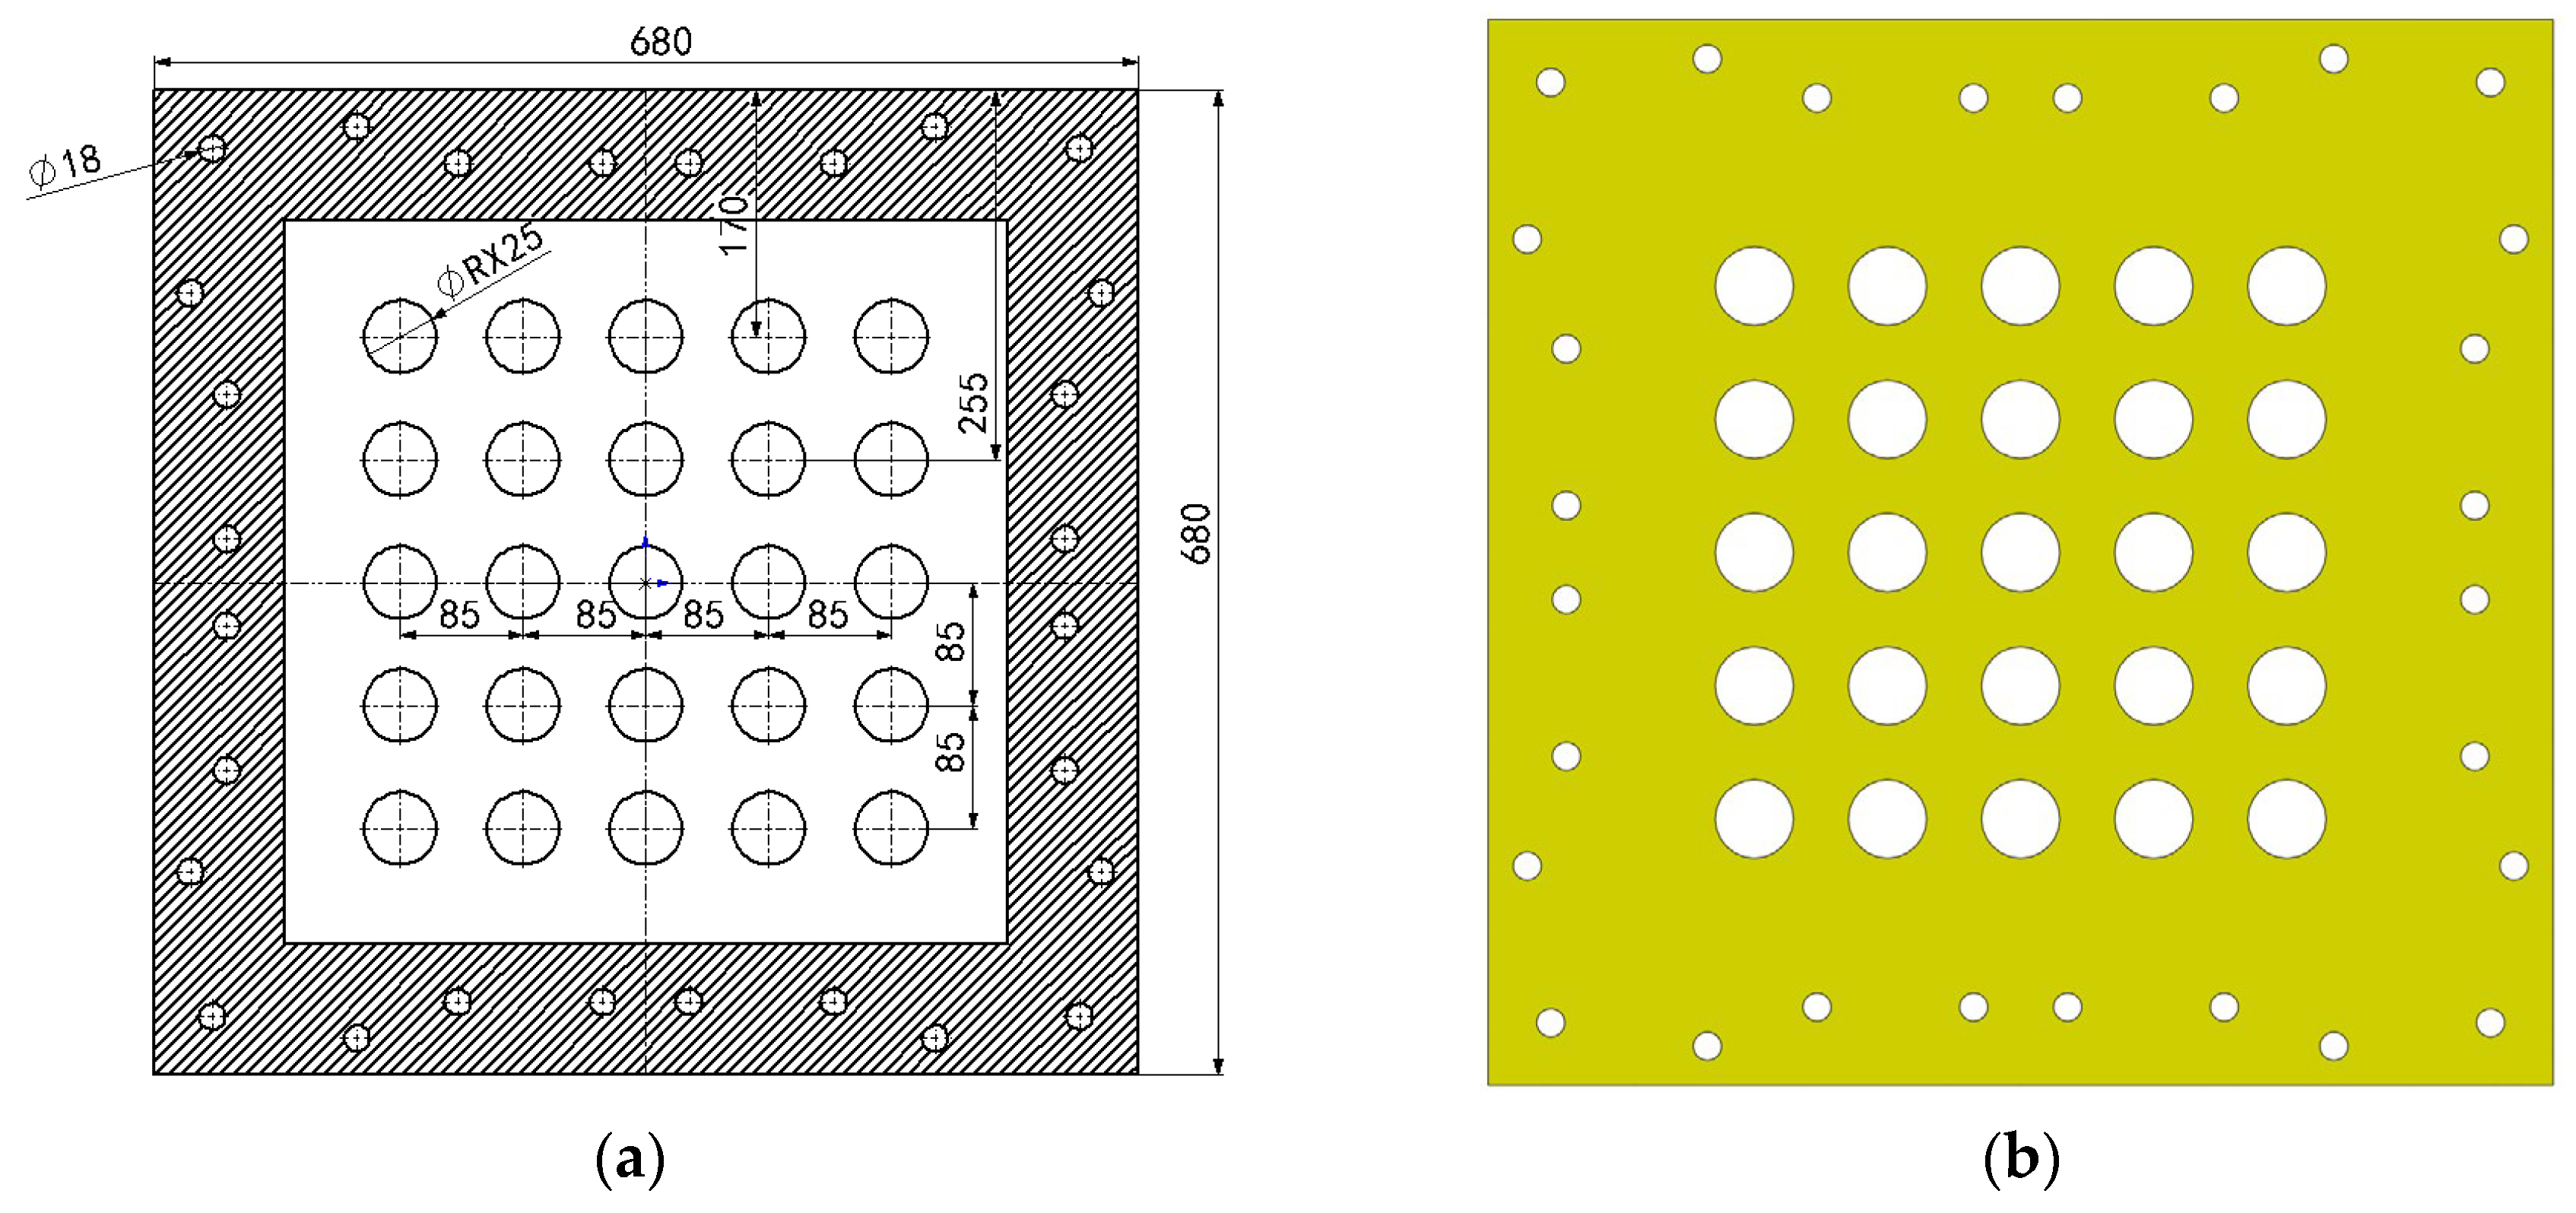
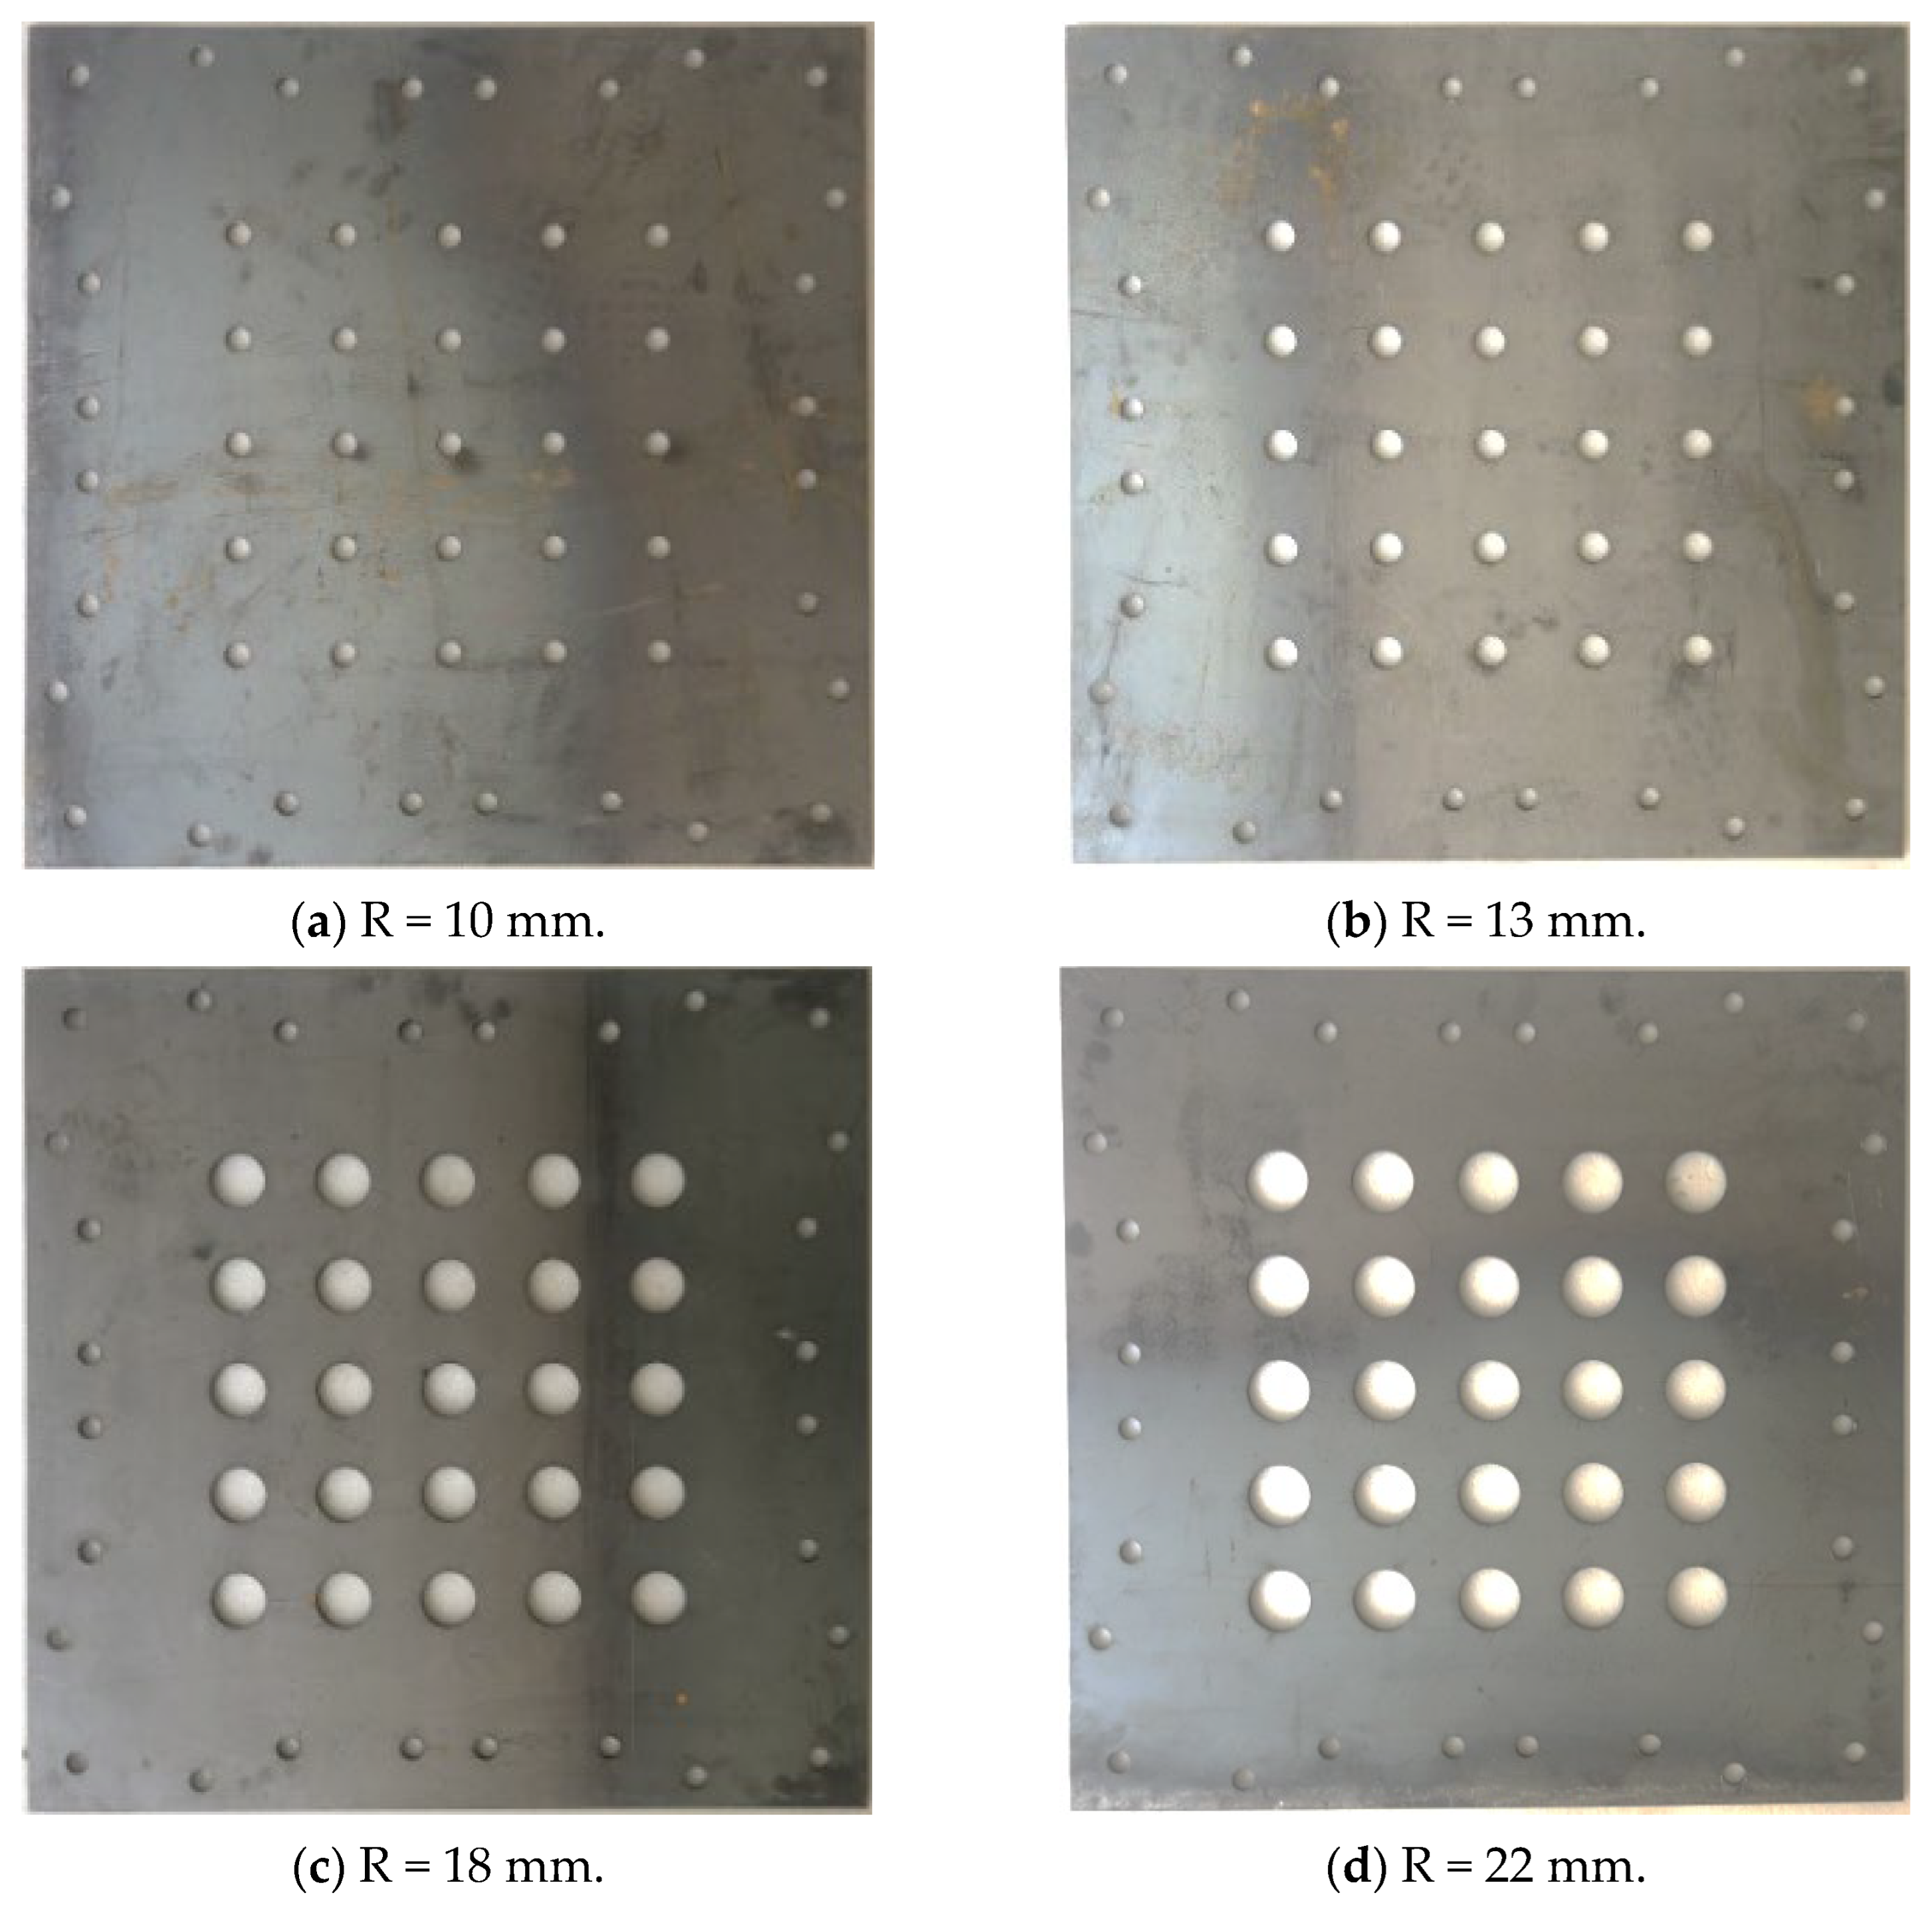
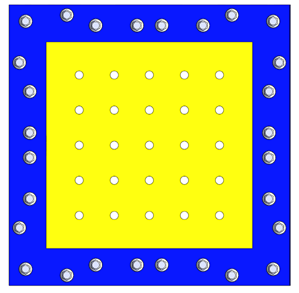
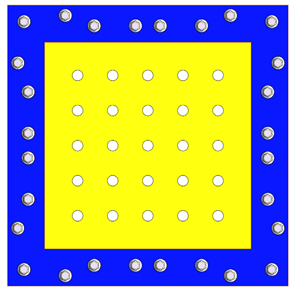
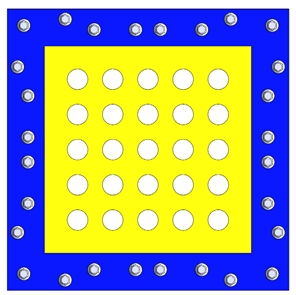
For the center-clamped perforated spacer, four different opening sizes were designed based on the opening area ratio, specifically 3%, 5%, 15%, and 20%. The center location of each hole on the spacer remains unchanged, and only the radius of the hole is varied, corresponding to 10 mm, 13 mm, 22 mm, and 25 mm, respectively. Taking the 25 mm open hole as an example, Figure 2 illustrates the layout of the hole centers on the perforated bulkhead, with the shaded region along the edge representing the clamped area. Physical diagrams of the bulkheads with different opening sizes are provided in Figure 3.

2.2. Charging Parameters and Structure

The test was conducted by means of a lifting load. The explosive used was TNT, with a charge mass of approximately 60 g and a density of 1.58 g/cm3. The charge measured 40 mm in diameter and 30 mm in height. Detonation was initiated using a detonator. The configuration of the charge is detailed in Figure 4.

2.3. Test Methods

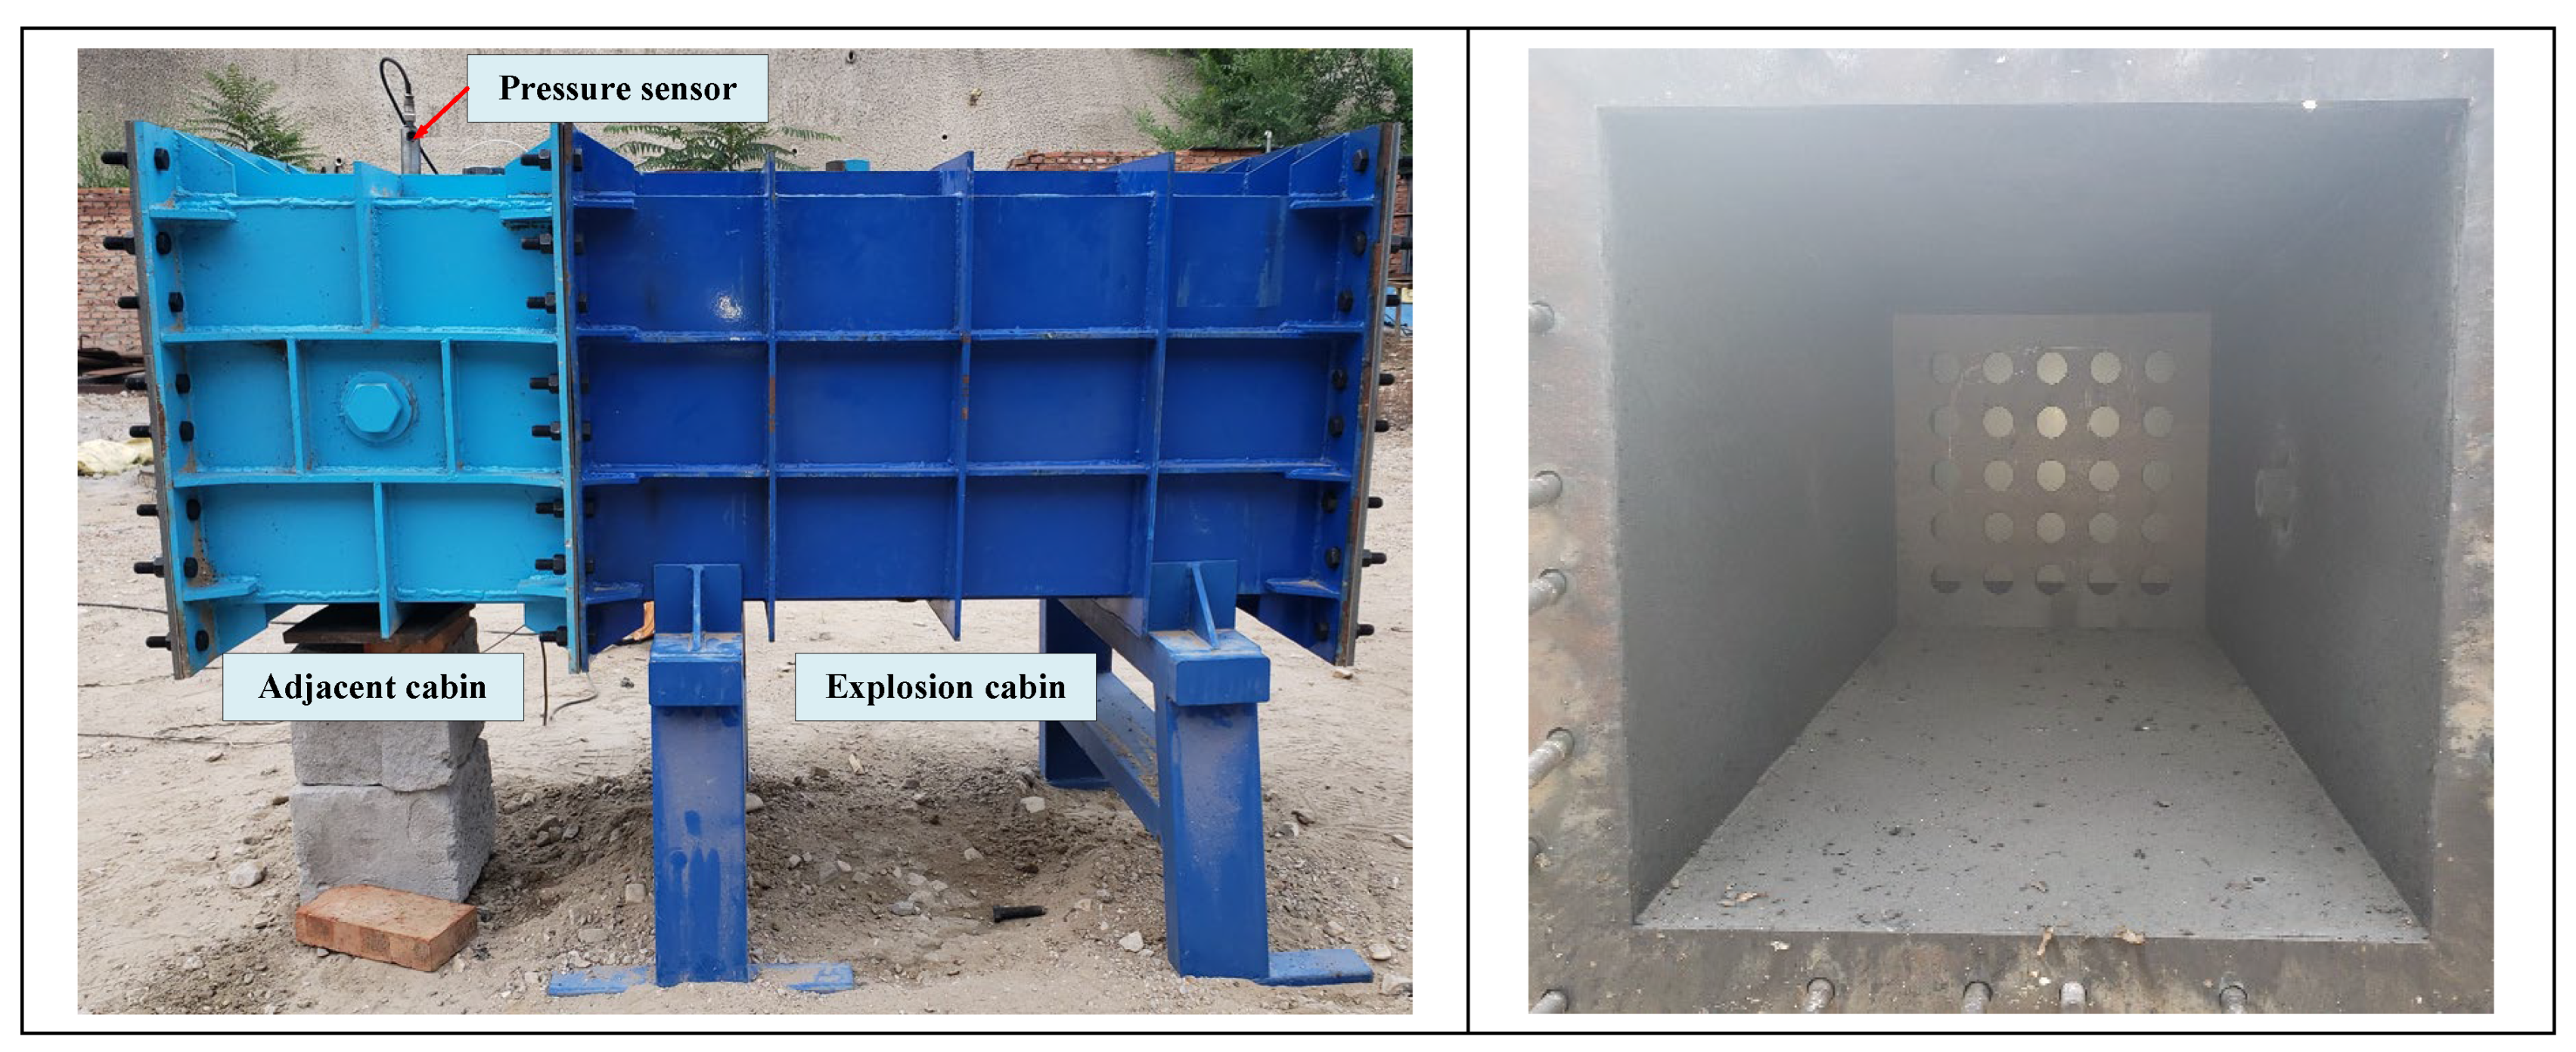
A pressure transducer (model CYG1401F, range: 5 Mpa, Kunshan Shuangqiao Sensor Measurement and Control Technology Co., Ltd., Kunshan, China) was mounted on the top of an adjacent cabin, as shown in Figure 5. It requires a 15 V power supply. Signal acquisition was performed using a Handyscope HS6 collector (TiePie Engineering, Sneek, The Netherlands)with a sampling frequency of 1 MHz. Figure 6 shows the physical configuration of the transducer, and Figure 7 shows the test setup.

2.4. Test Condition Design

Four test shots were conducted. Actual charge mass was measured before each detonation. The charge quality of the four experiments is shown in Table 1. A new perforated bulkhead with a different open-area ratio was installed for each test, sequentially using ratios of 3%, 5%, 15%, and 20%. Open area ratio refers to the proportion of the area of all ventilation holes on a single perforated partition to the total loaded area of the bulkhead where the hole is located. Hole radius refers to the radius of a single hole.

2.5. Analysis of Experimental Results

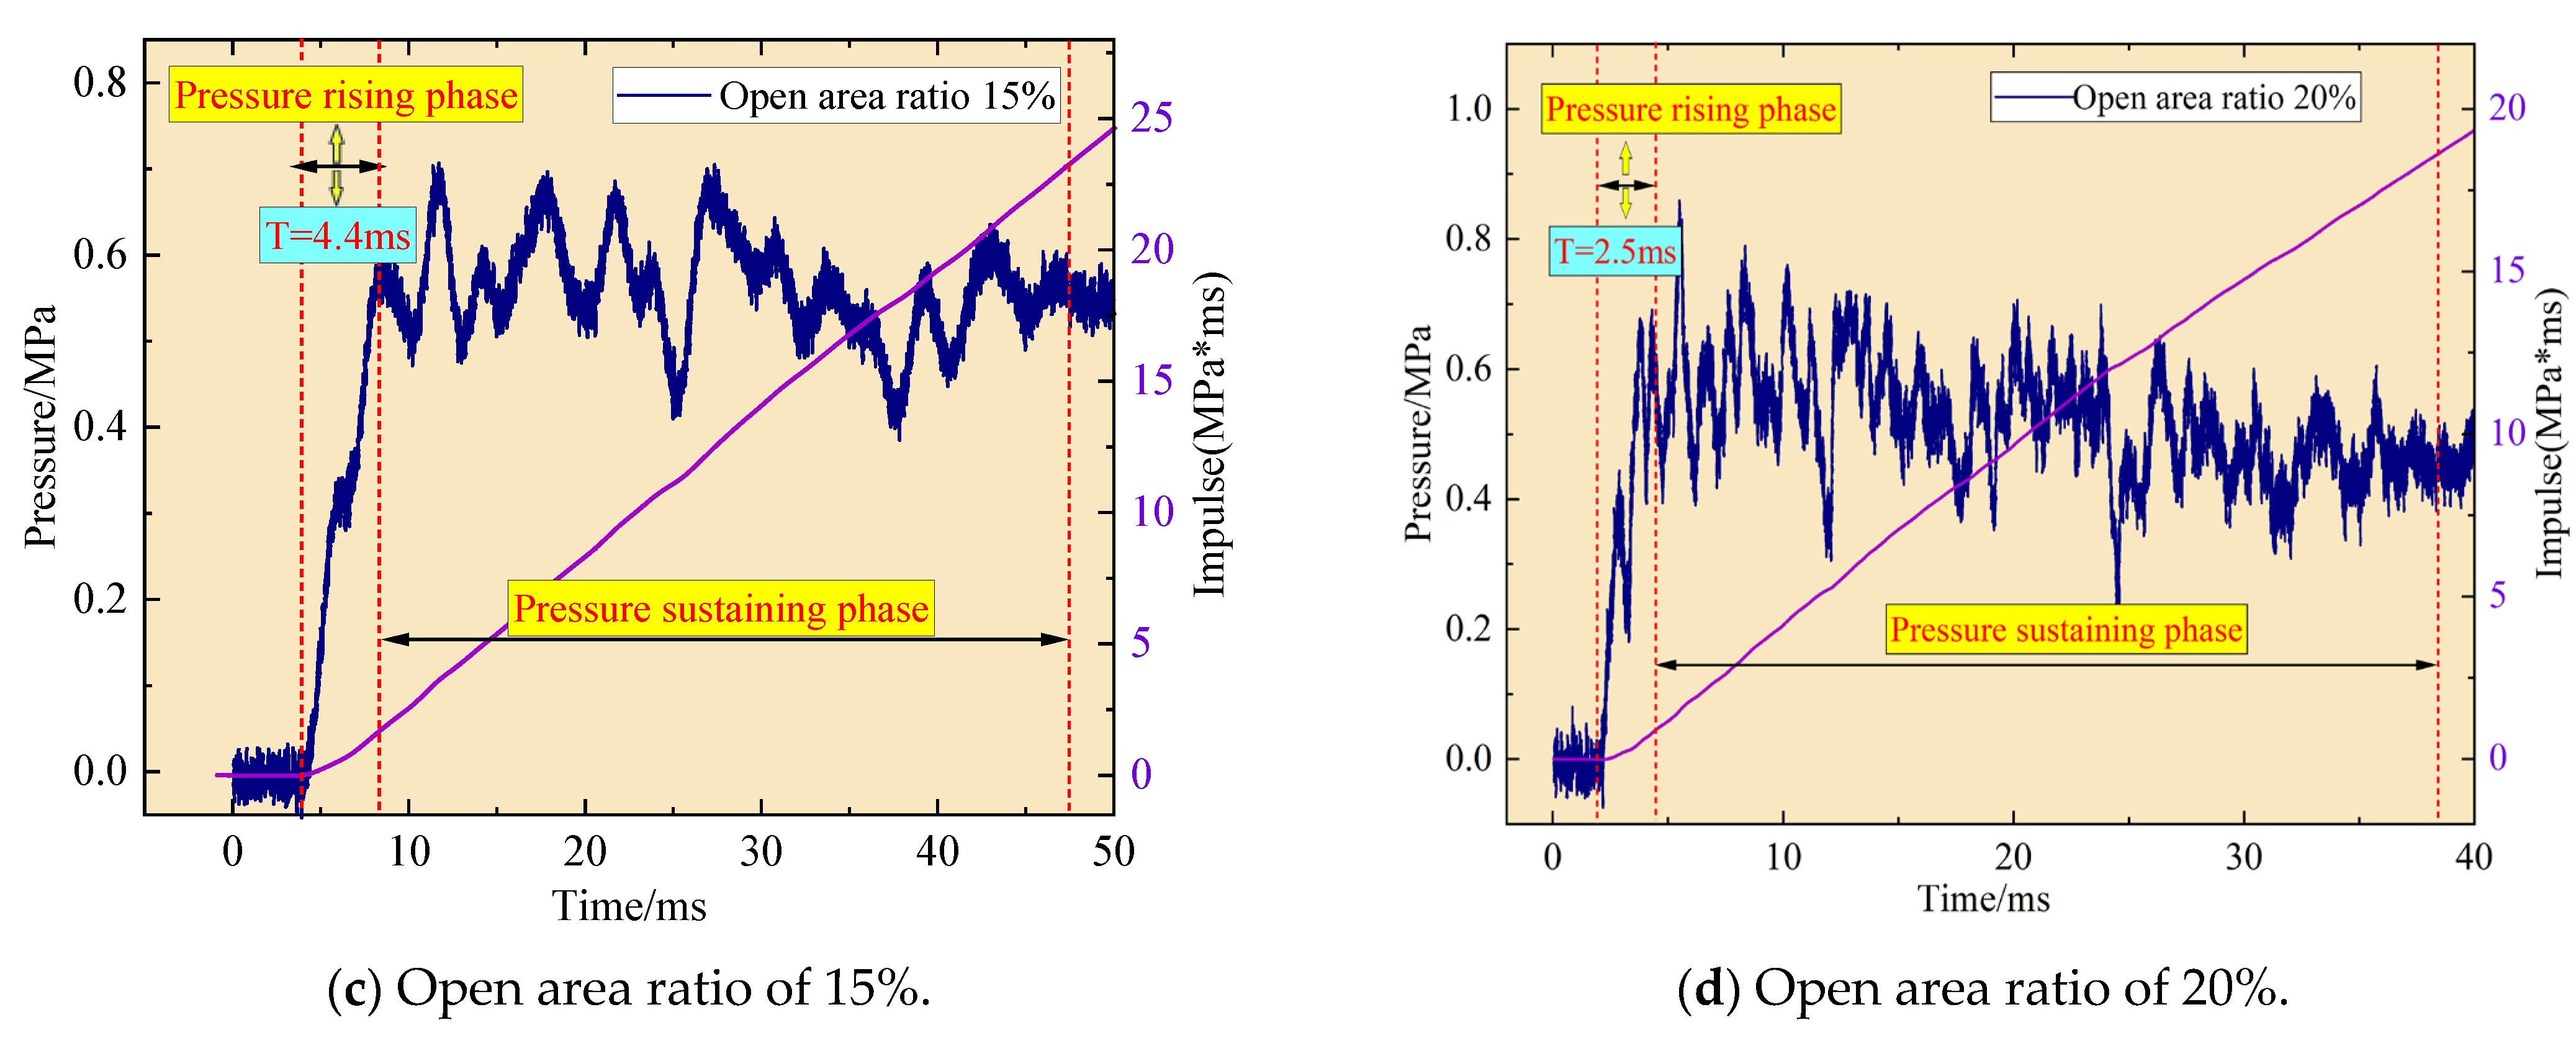
The test was carried out for a total of four rounds, as shown in Figure 8, where (a), (b), (c), and (d) present the pressure-time histories measured in the adjacent cabins at opening area ratios of 3%, 5%, 15%, and 20%, respectively.
In Figure 8, it can be seen that the pressure loading in the adjacent cabins mainly exhibits quasi-static characteristics, which is consistent with the findings reported by Wang Y [36]. The curves show two different stages: a quasi-static pressure rise phase and a sustained pressure phase. The pressure rise time decreases with the increase in the open area ratio. The average values of the quasi-static pressure of the adjacent cabin are 0.538 Mpa, 0.54 Mpa, 0.595 Mpa, and 0.6 Mpa, respectively, when the open area ratio is 3%, 5%, 15%, and 20%. Standard deviation σ = 0.0293. Coefficient of variation CV = 5.1%. The coefficient of variation is the ratio of the standard deviation to the average value. Under the same volume, the average value of the quasi-static pressure peak in the four groups of experiments fluctuates very little, indicating the consistency and accuracy of the experiment. But the quasi-static pressure peak is reduced when the open area is smaller than when the open area is larger. This phenomenon may be attributed to the longer duration of the quasi-static pressure rise period associated with smaller open areas. The incomplete sealing of the structure leads to partial leakage of explosive gas products during the quasi-static pressure rise stage, resulting in a decrease in the peak quasi-static pressure when the opening area is small.

3. Finite Element Simulation

3.1. Simulation Model Introduction

To further investigate pressure loading characteristics in cabins adjacent to internal explosions and elucidate loading propagation mechanisms, numerical simulations were conducted based on experimental test conditions. Leveraging structural symmetry, a quarter-symmetry model was employed. Figure 9 illustrates the symmetric configuration for clarity. Perforated bulkheads with open area ratios of 3%, 5%, 10%, 12%, 15%, 18%, and 20% were modeled. AUTODYN14.5 is an explicit nonlinear dynamic simulation software program that is integrated in the commercial software ANSYS14.5. It is mainly used to deal with transient dynamic problems involving large deformation, extremely high strain rate, and complex material behavior. The simulations implemented the AUTODYN-3D fluid–structure interaction (FSI) algorithm, and the air was modeled using the Eula formulation. The pressure variation curves of MP2 observation points under different mesh sizes are shown in Figure 10. When the mesh size is 1 mm and 2 mm, the peak pressure and variation curve are basically consistent. When the mesh size increases to 4 mm, there is a significant decrease in the peak pressure. After analyzing the convergence of the mesh, the mesh size of air was set to 2 mm × 2 mm × 2 mm. Both the bulkhead and the end target plates were discretized using Lagrange elements measuring 5 mm × 5 mm. The arrangement of the explosives and the intermediate partition was consistent with the test conditions. Since the test cabin was constructed of reinforced and thickened high-strength steel, the structure was approximated to a rigid wall under small charge internal explosions. During the experiment, the explosion cabin and adjacent cabin remained stationary, so their boundaries were completely fixed in the simulation model. The boundary of the air domain adopts a Non-Reflective boundary.
The Johnson–Cook (JC) constitutive relation was selected to model the material behavior of the cabin structure. The relation can be defined through multiplicative Equation (1):
σ = ( A + B ε p n ) ( 1 + C l n ε ˙ * ) ( 1 T * m )
where A is the static yield stress, B is the strain hardening coefficient, n is the strain hardening index, ε p is the effective plastic strain, ε ˙ * = ε ˙ / ε ˙ 0 is the effective plastic strain rate at the reference strain rate, and ε 0 ˙ = 1   s 1 . T * = ( T T r ) / ( T T m ) is the corresponding temperature, where the reference temperature T r is 294 K and the melting temperature of material T m is 1795 K. The temperature in the JC constitutive model is expressed in Kelvin (K). C is the strain rate sensitivity coefficient, m is the thermal sensitivity index, and ε ˙ 0 is the reference strain rate. Values used in the Johnson–Cook constitutive relation are presented in Table 2.
The air in the simulation was described by the ideal gas equation of state (EOS), as shown in Equation (2):
P = γ 1 ρ e
where γ , ρ , and e denote the specific heat ratio, density, and specific internal energy, respectively. Simulation parameters were assigned as γ = 1.4 , ρ = 1.225 × 10 −3 g/cm3, and e = 2.068 × 10 5 J/kg.
TNT was used in the JWL (Jones–Wilikins–Lee) equation of state, as shown in Equation (3):
P T = C 1 1 ω r 1 v e r 1 v + C 2 1 ω r 2 v e r 2 v + ω e v
where C 1 C 2 r 1 r 2 , and ω are material constants; P T , v , and e represent pressure, relative volume, and initial energy of the explosive. TNT parameters are specified in Table 3.
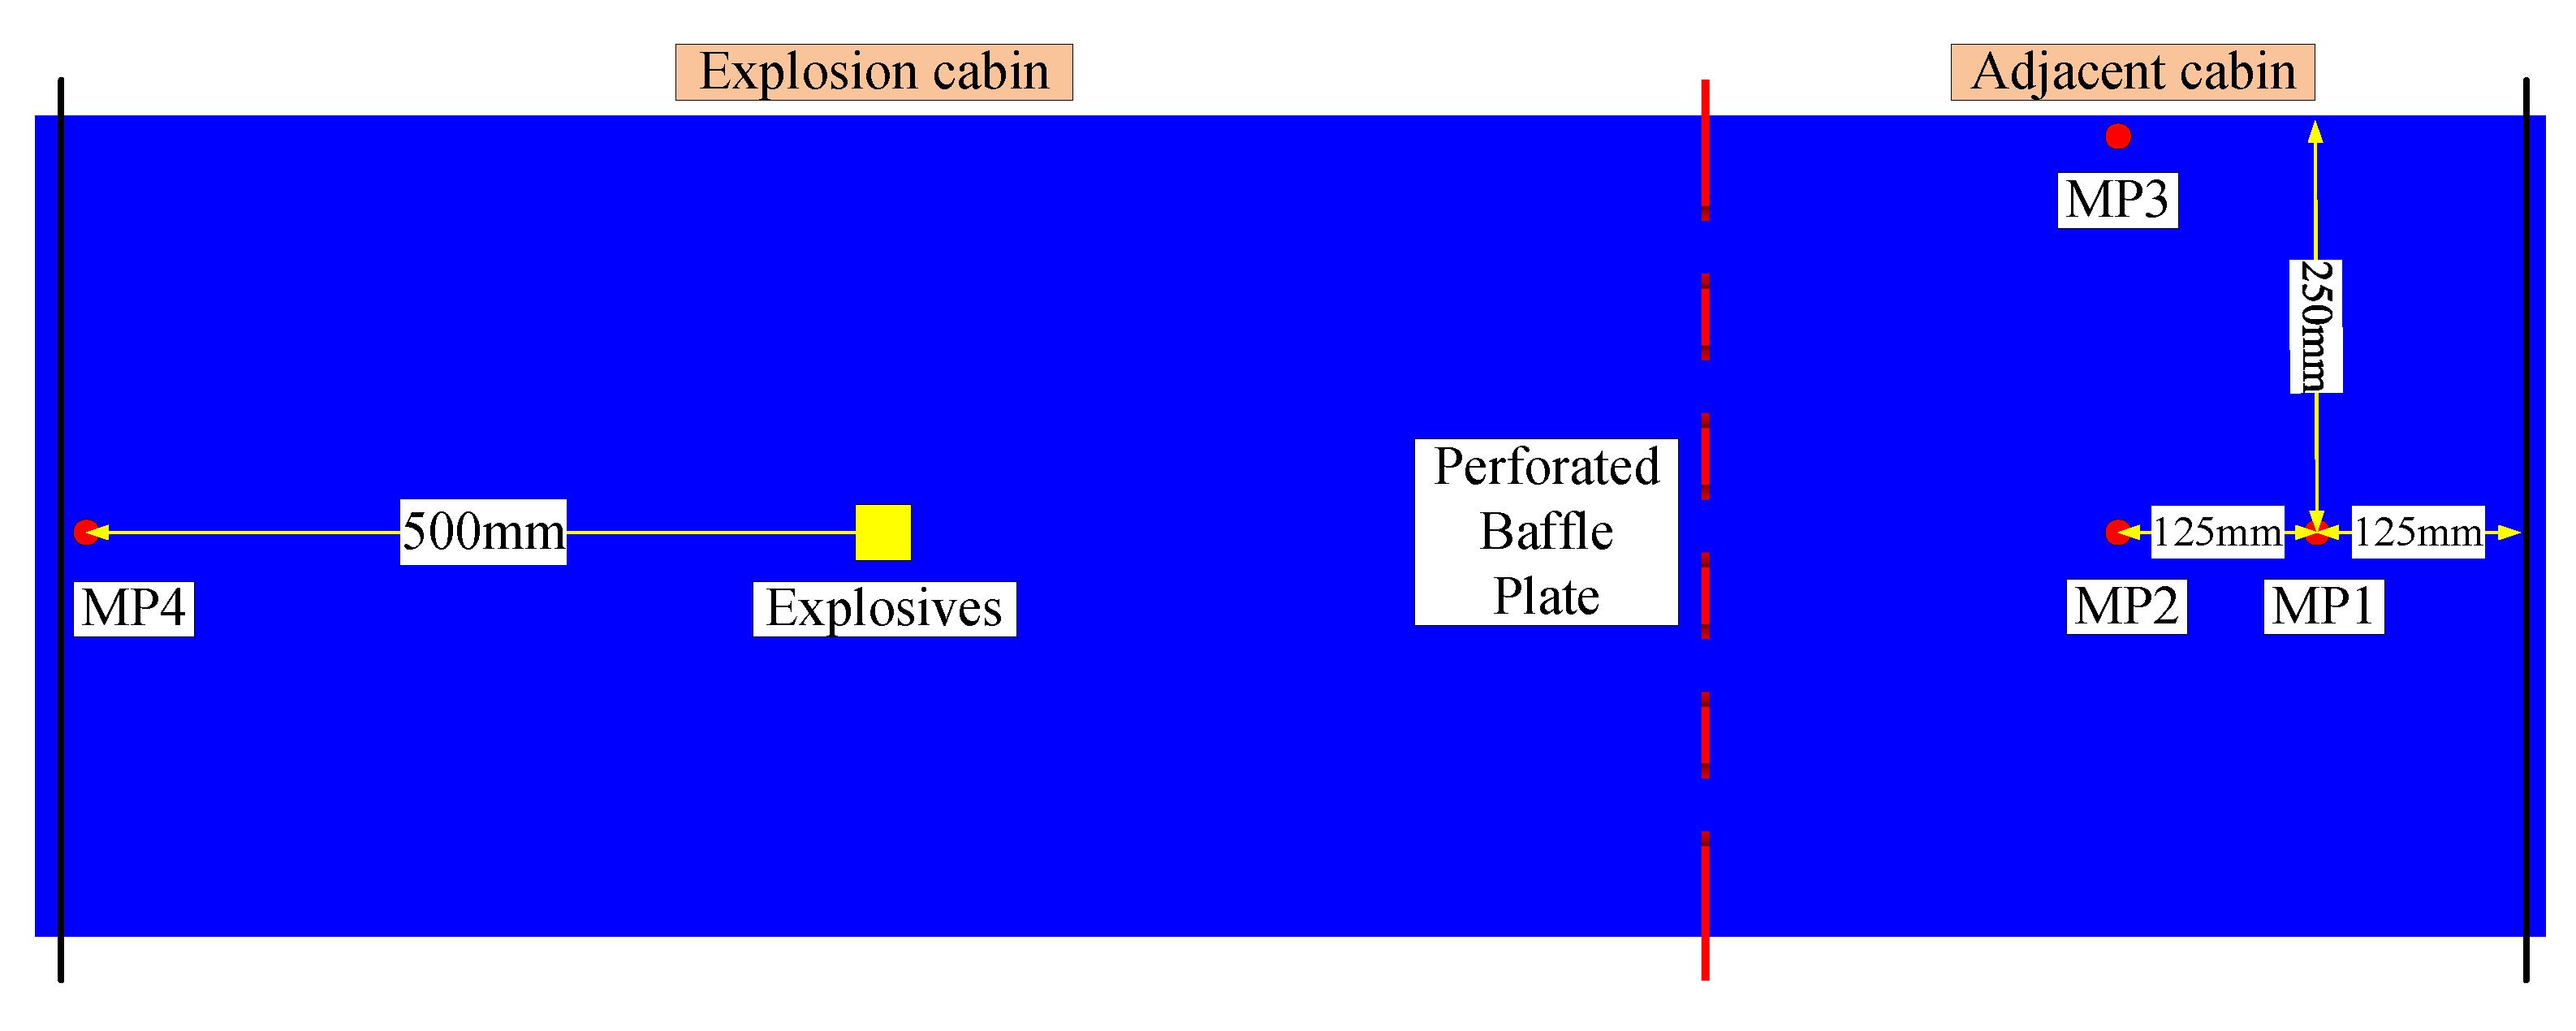
Four pressure monitoring points (MP1–MP4) were positioned within the air domain: MP4 in the explosion cabin, and MP1–MP3 in the adjacent cabin. The specific locations of the measurement points are shown in Figure 11.

3.2. Analysis of Simulation Results

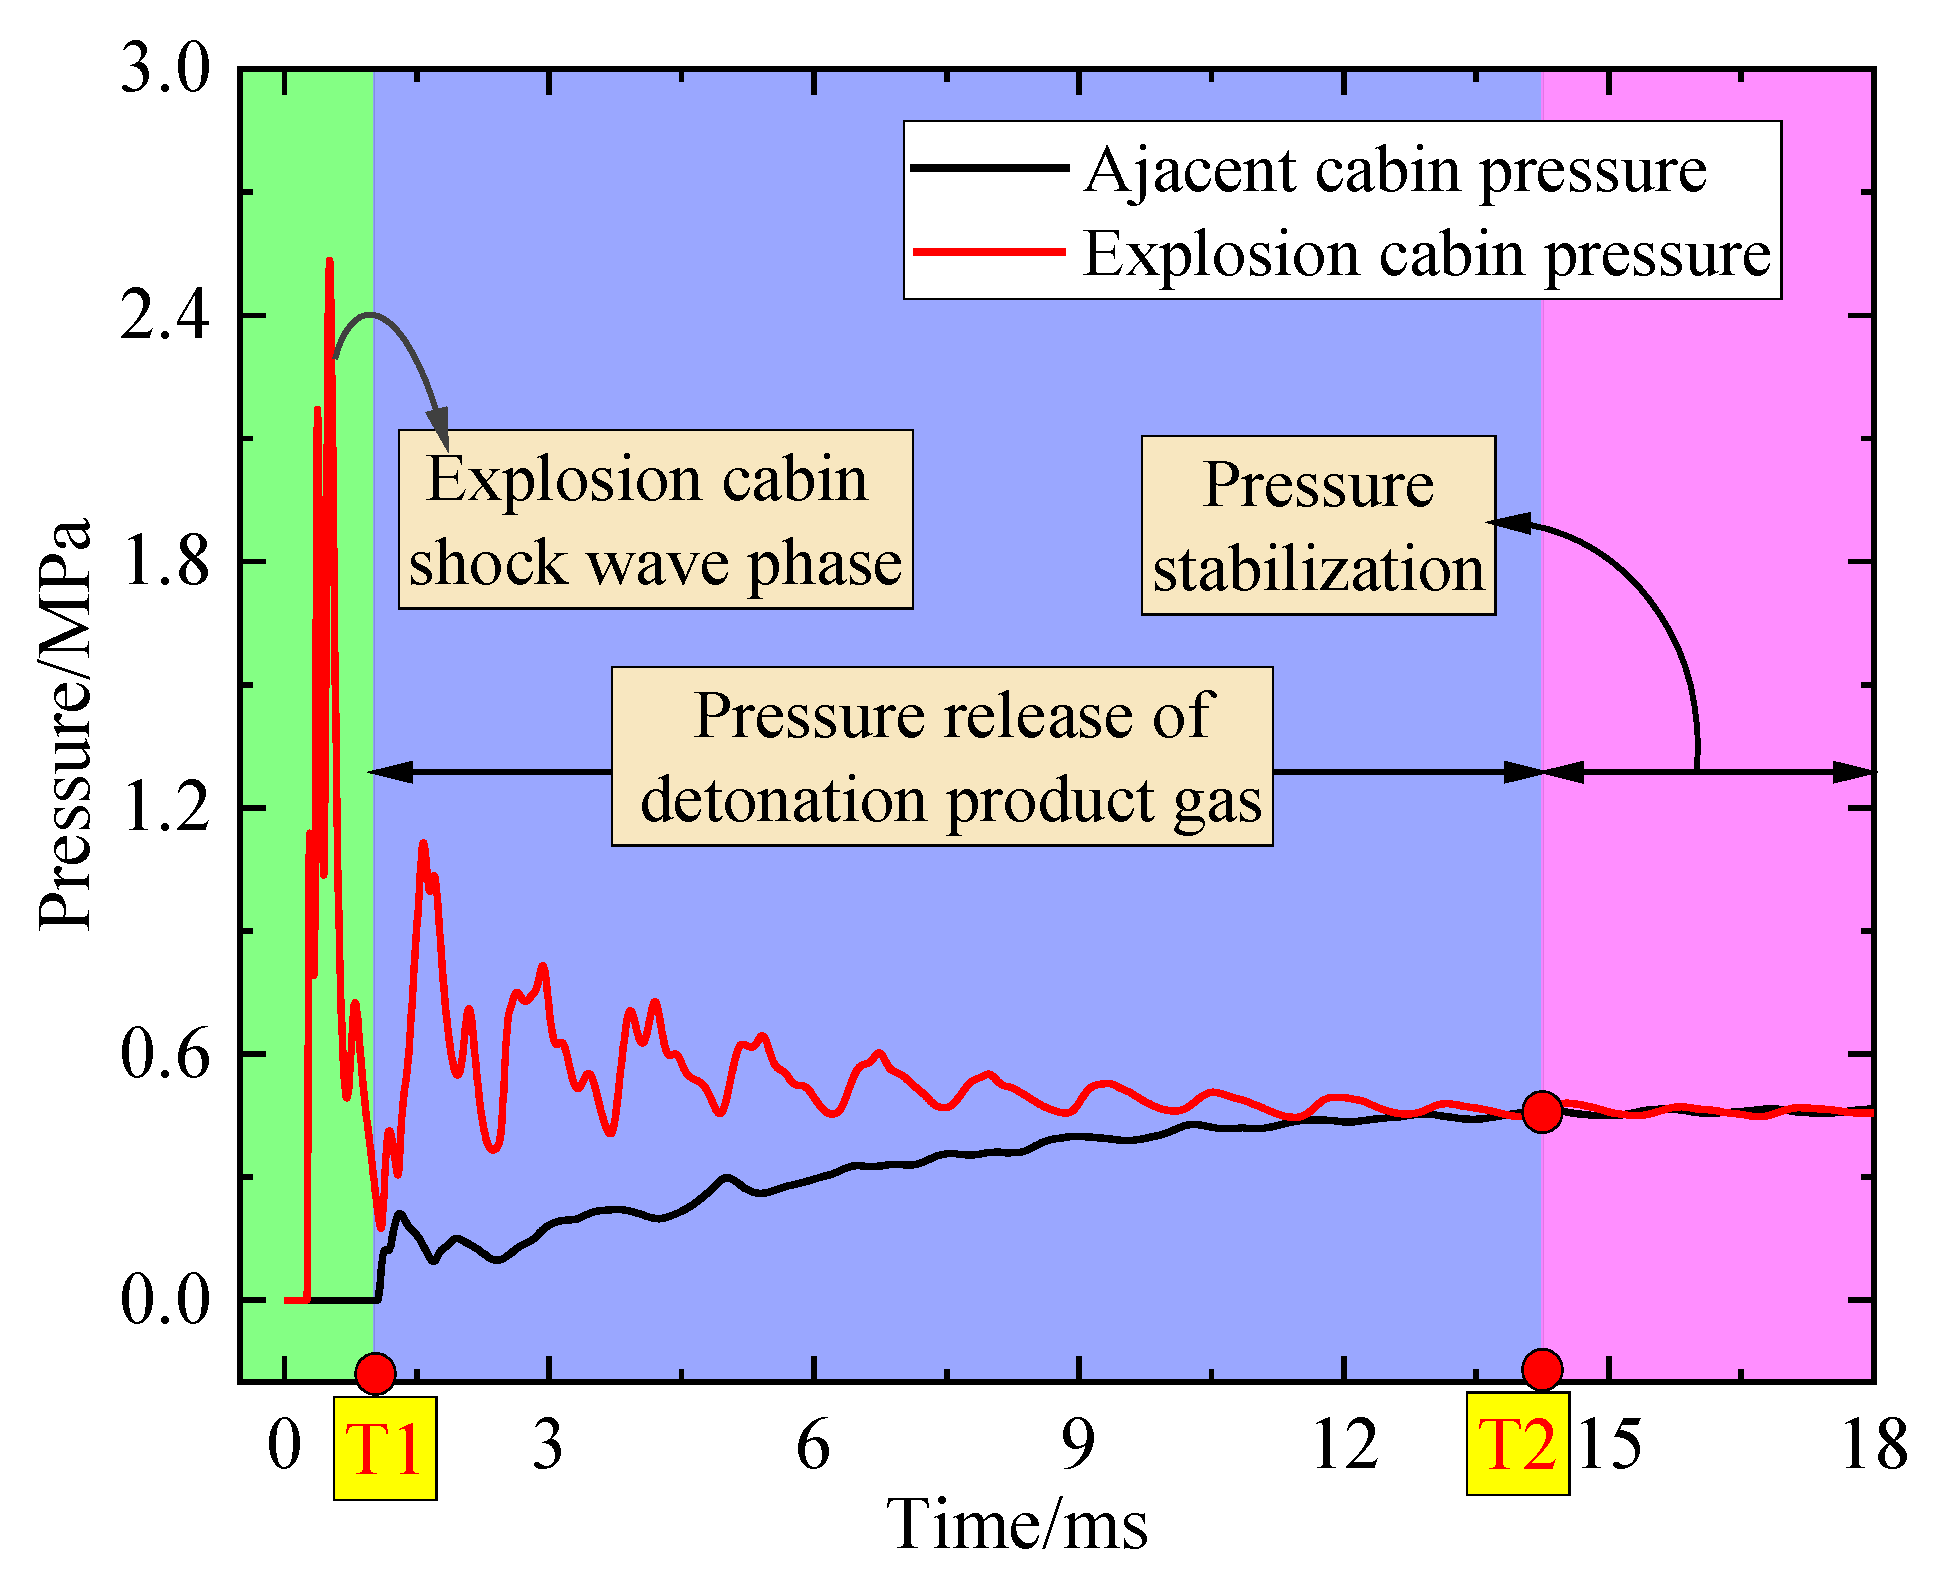
Pressure histories from MP4 (explosion cabin) and MP2 (adjacent cabin) for the 5% open area configuration are compared in Figure 12. The explosion cabin exhibits distinct shock wave and quasi-static pressure phases, consistent with UFC 3-340-02 [6]. Adjacent cabin loading manifests primarily as quasi-static pressure, initiating a rise at T1 and peaking at T2, with both cabins stabilizing post-T2. Figure 13 presents the stress and the deformation fields of the explosion cabin at 300 ms. The maximum stress value of the cabin bulkhead is 225 MPa, which does not exceed the yield strength of the material. Therefore, no plastic deformation occurred in the cabin.
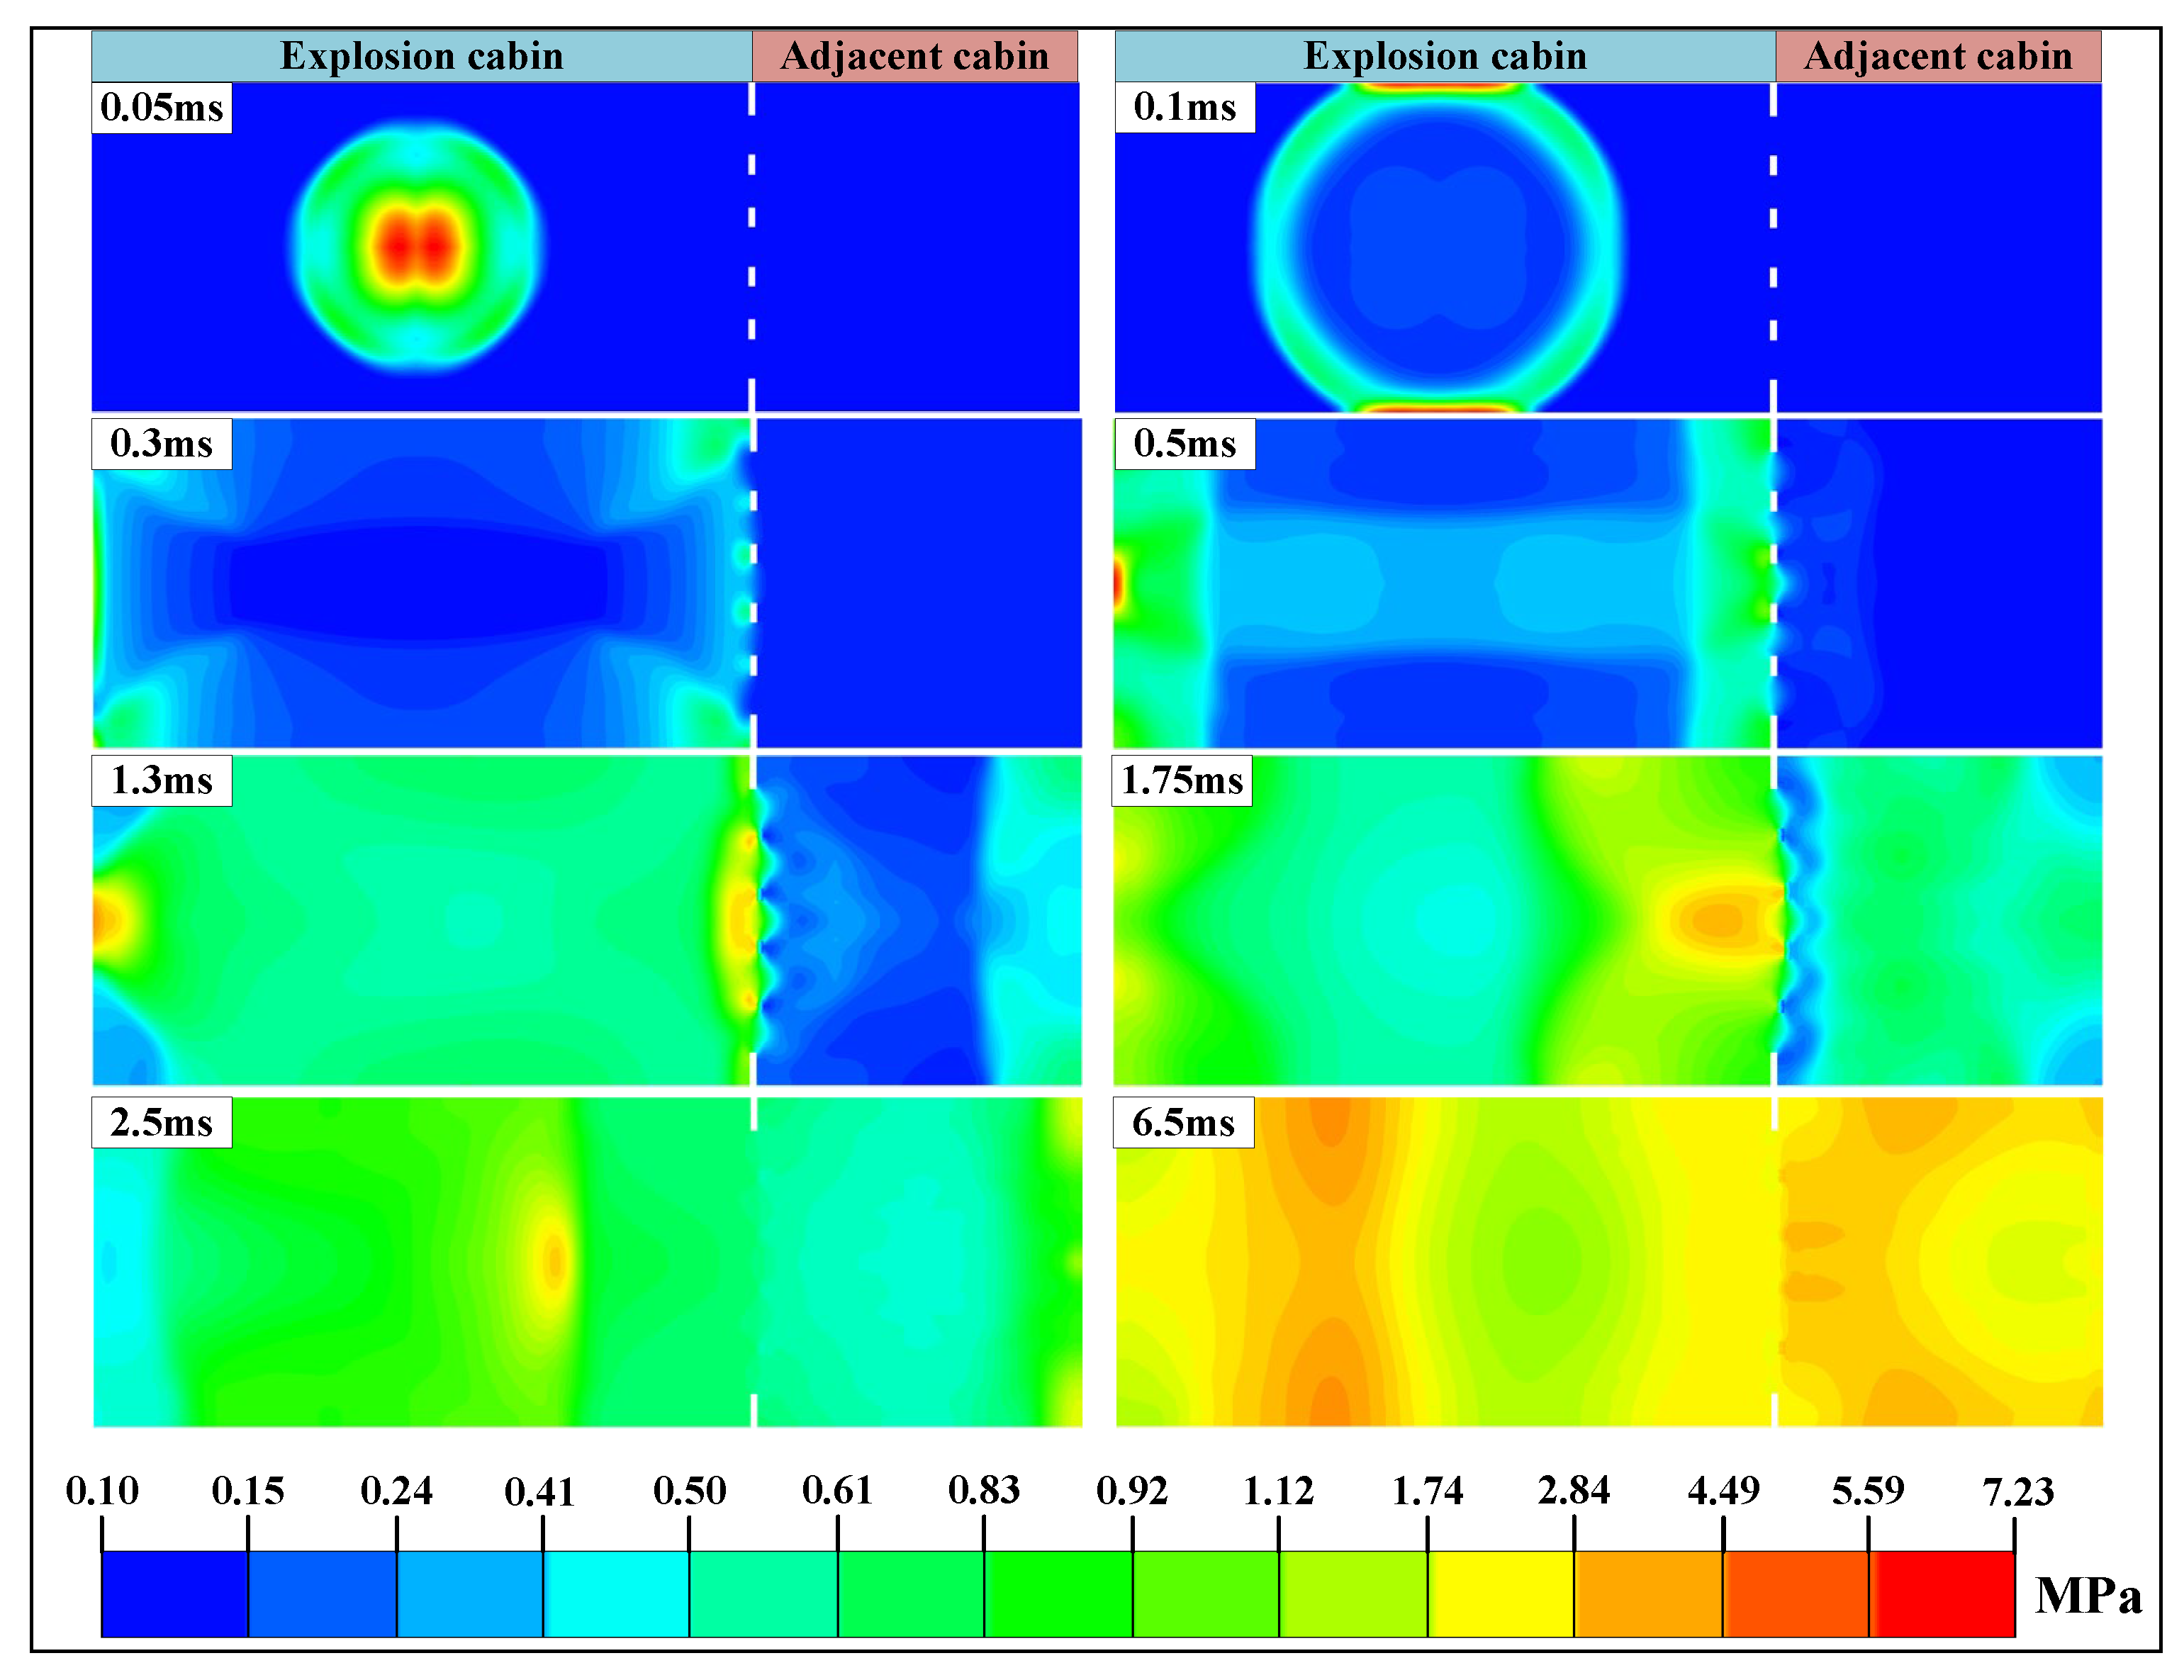
To better visualize the pressure propagation process from the explosion cabin to the adjacent cabin, a simulation case with a relatively large open area of the partition (open area ratio of 20%) was chosen, and the pressure contours at different moments are shown in Figure 14. In the figure, it can be seen that the explosive shock wave propagates to the bulkhead at 0.3 ms, gathers at the open hole, and starts to propagate to the adjacent cabin. In contrast, the explosive products (shown in Figure 13) have not yet reached the bulkhead at 0.3 ms. By 0.5 ms, a distinct shock wave cloud is visible in the adjacent cabin. Compared to that in the explosion cabin, the cloud appears lighter in color, indicating lower pressure. From 1.3 ms to 2.5 ms, the explosion cabin of the pressure is gradually propagated to the adjacent cabin. At 2.5 ms after the explosion, the cabin and the adjacent cabin pressure contours converge in color, gradually blending with each other and indicating that the pressure reaches a stable stage.
Figure 15 illustrates the propagation process of detonation products. The transmission of detonation products from the explosion cabin to the adjacent cabin lags behind shock propagation. At 0.9 ms, only partial detonation products penetrated the bulkhead into the adjacent cabin. By 2.5 ms, consistent with pressure contour evolution, the adjacent cabin was substantially filled with detonation products. The pressure distributions in both cabins gradually equilibrated, as indicated by converging color gradients in pressure contours, marking the transition into the pressure stabilization phase.
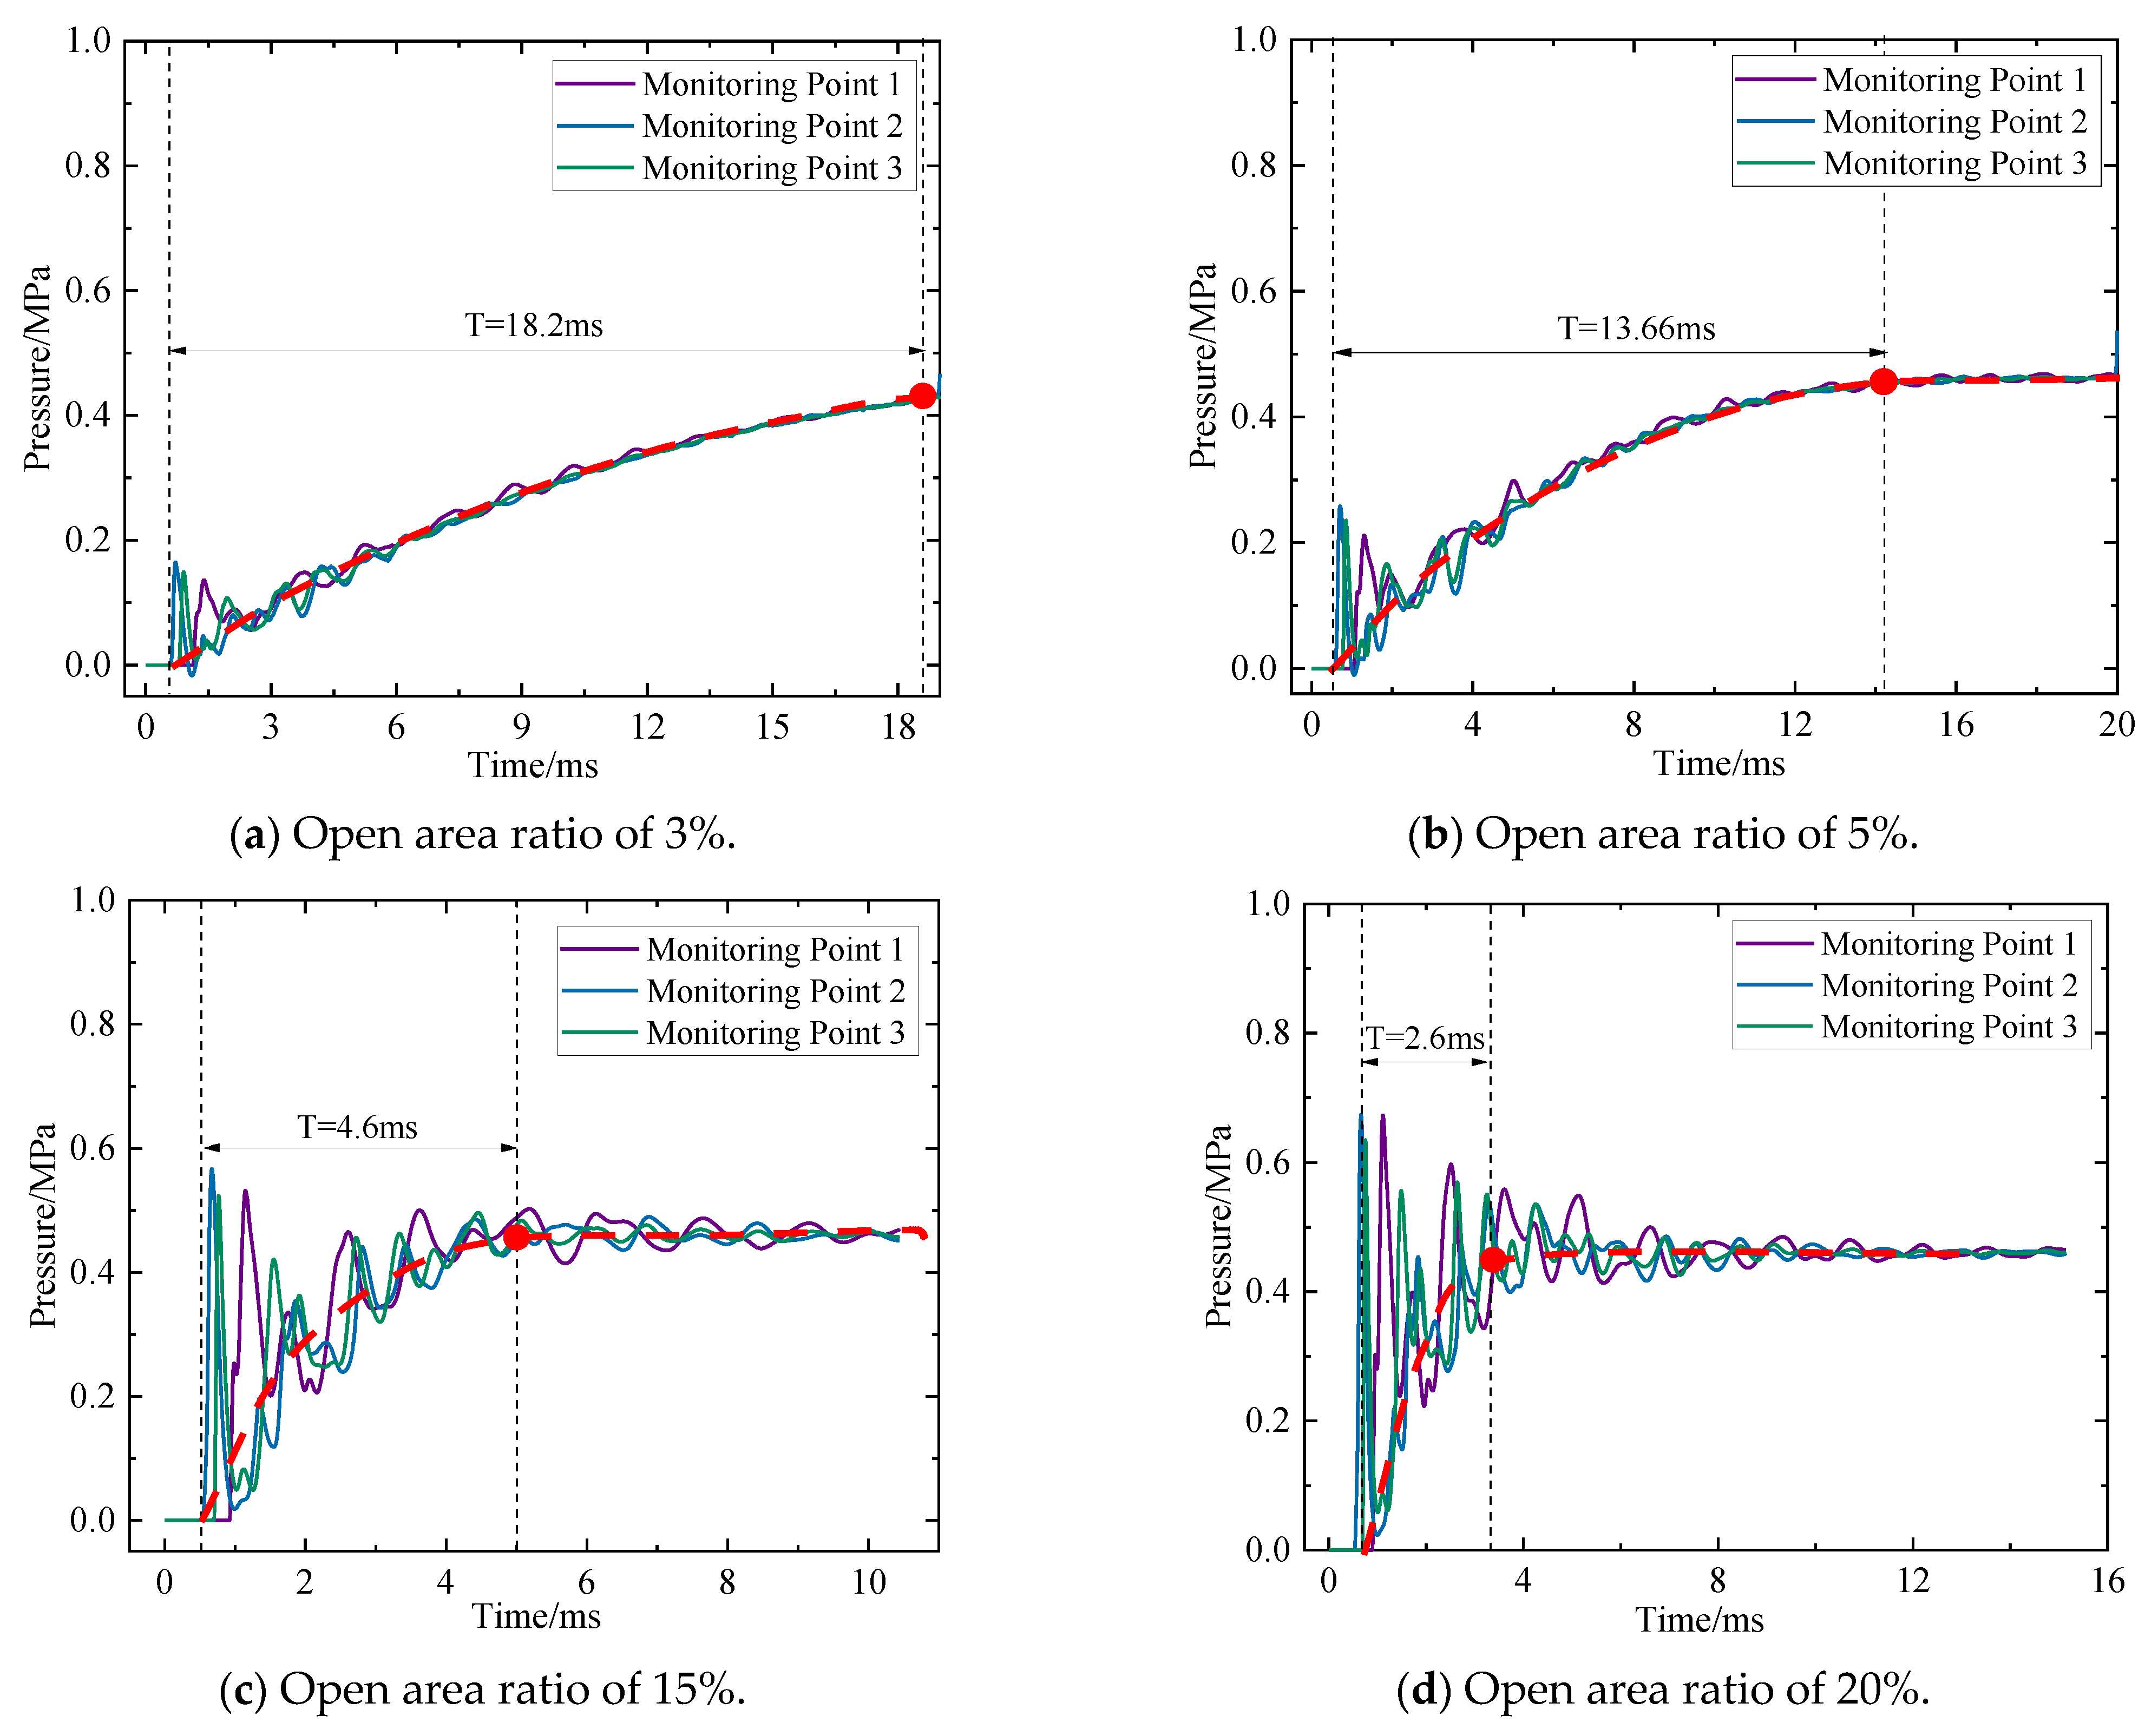
Figure 16 shows the pressure curves of three measurement points in the adjacent cabin at different opening area ratios. The red curve indicates the variation trend of the pressure load.
The pressure curves of the adjacent cabin shown in Figure 16 show that the pressure rise time is generally consistent with the experimental results. In the initial stage, the shock wave from the explosion passes through the bulkhead, causing an early pressure perturbation in the adjacent cabin. With the increase in the area of the openings, the shock-induced perturbation becomes more pronounced. The pressure curves of the three measurement points of the adjacent cabin basically coincide, exhibiting differences only during the initial disturbance phase. All curves demonstrate a quasi-static pressure loading behavior, which can be divided into a pressure rise section and a pressure sustained section.

4. Simplified Model of Pressure Loading in the Adjacent Cabin of the Explosion

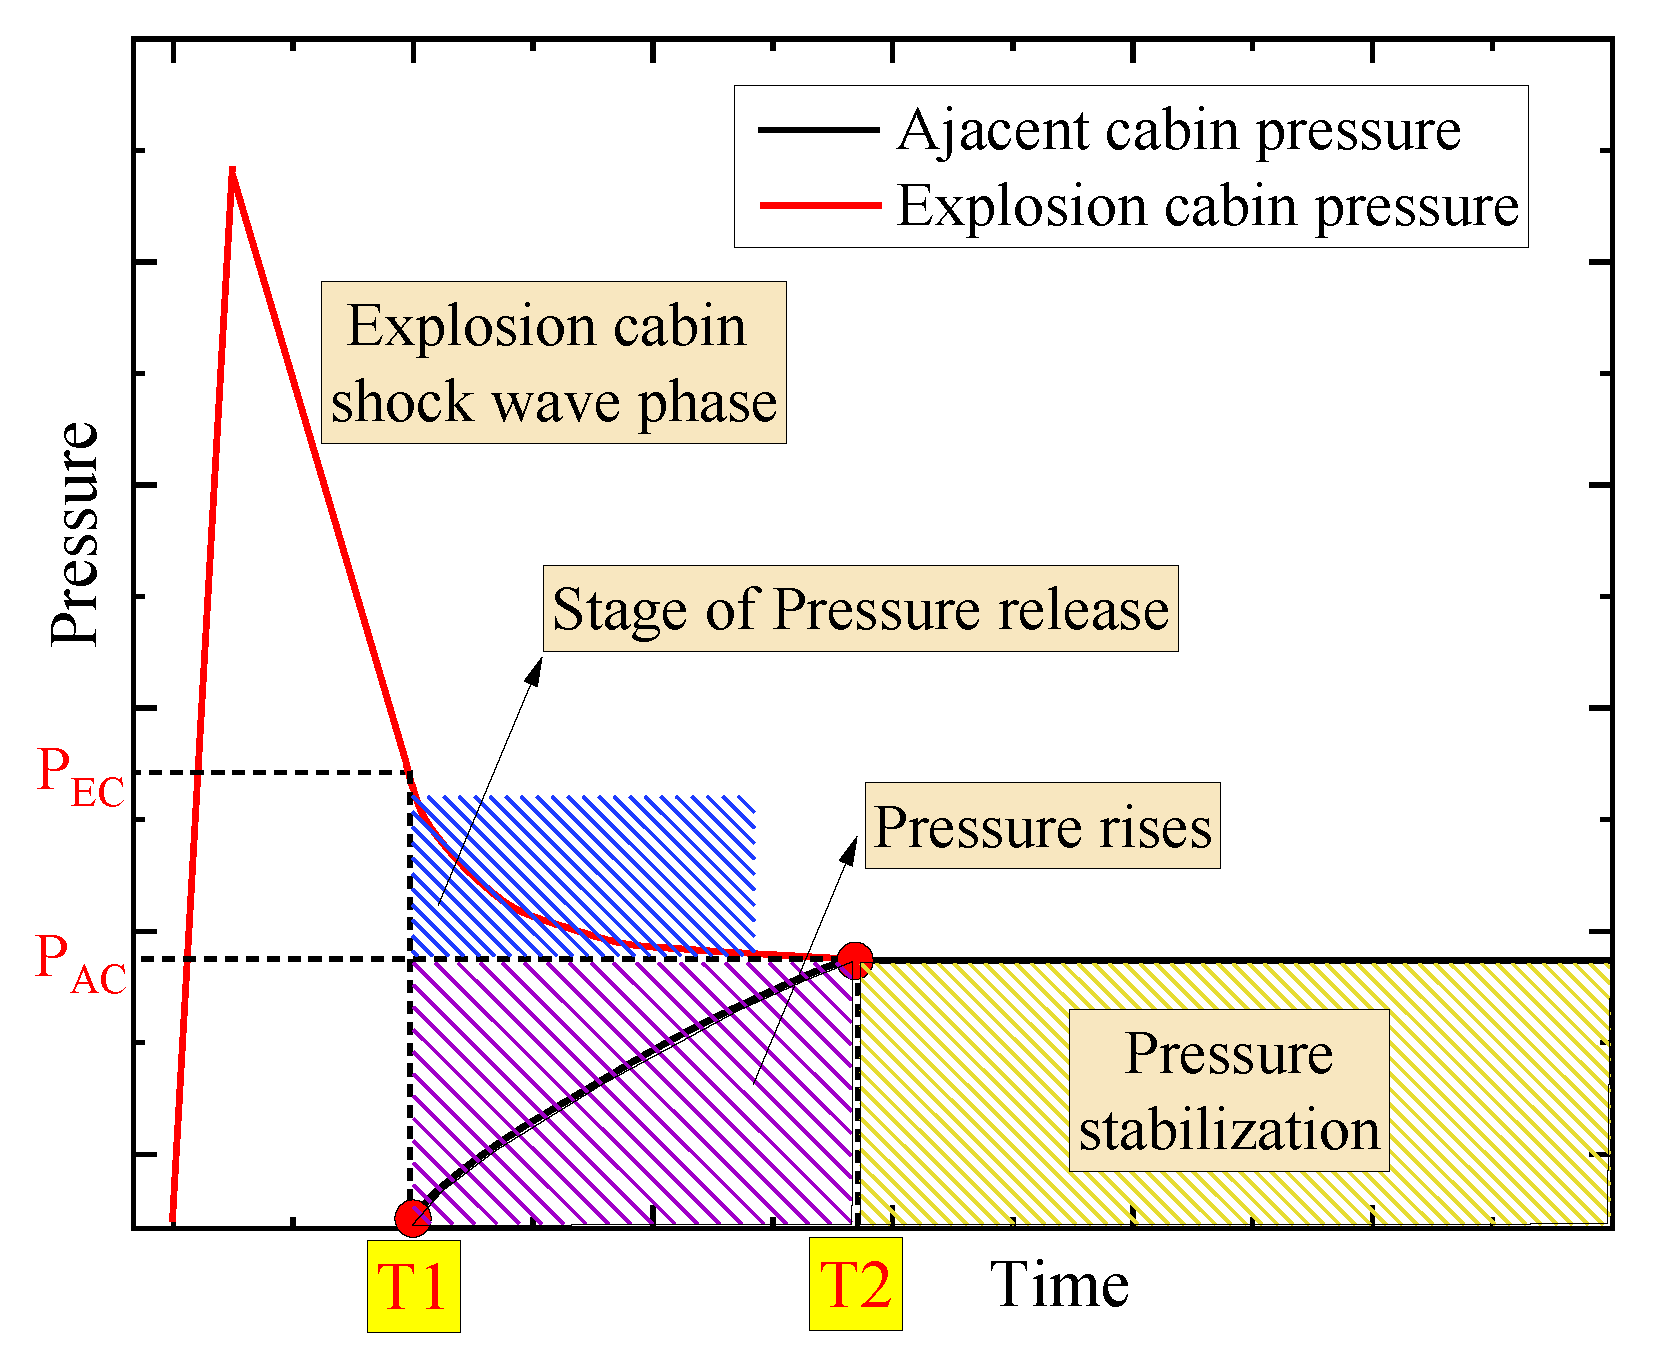
The load curve obtained from the above tests and simulations shows that the loading in the adjacent cabin is mainly characterized by quasi-static pressure. This pressure results from the explosion products and their afterburning reactions, which heat the gas and increase its pressure [3,4]. Thus, the process by which blast products travel from the explosion cabin to the adjacent cabin can be described as a gas pressure venting process. The explosion cabin and adjacent cabin together form a system, as shown in Figure 17. The entire process, from the beginning of the explosion to the pressure equilibrium, can be divided into two phases: the first phase of the shock wave, in which the explosion shock wave from the explosion cabin through the perforated bulkhead to the adjacent cabin propagates. This stage is short in duration and causes initial pressure perturbations in the adjacent cabin. Following the shock wave phase, the blast products of the gas continue to be leaked from the open holes to the adjacent cabin, leading to a continued rise in pressure therein. We assume the quasi-static pressure in the explosion cabin as PEC, and that in the adjacent cabin as PAC. Venting ceases when PEC = PAC, marking the establishment of system equilibrium.
As shown in Figure 18, the pressure loading in the adjacent cabin commences at time T1 (ms), increases gradually, and attains its peak at time T2 (ms). The pressure rise time serves as the critical parameter in this process. Although existing models accurately predict pressure peaks [32,34], this study focuses on developing a theoretical analysis for the rise time.
Baker et al. [5] established that venting processes approximate exponential decay:
P ( t ) = P E C e κ t
Therefore,
t = 1 κ ln P ( t ) P E C
κ = 2.13 ( c A V E C )
where P(t) is the pressure of the explosion cabin at moment t, and κ is a parameter obtained by Baker [5] through magnitude analysis, where c is the speed of sound, which is generally taken as 340 m/s, and A the area of the venting hole (m2). PEC is the quasi-static pressure peak of the explosion cabin.
Assuming that the quasi-static pressure of the adjacent cabin reaches the peak PAC after time t, P(t) at this moment is PAC. Neglecting the heat transfer between the whole system and the outside, then Equation (8) can be obtained from the ideal gas equation of state (7):
P = n R T V
P E C V E C = P A C ( V E C + V A C )
where P represents the pressure when the system is at equilibrium, n is the amount of material, R is the gas constant, T is the thermodynamic temperature, and V is the system volume. VEC is the volume of the explosive cabin, and VAC is the volume of the adjacent cabin.
Equation (9) can be derived from Equation (8):
P A C = P E C V E C ( V E C + V A C )
When the quasi-static pressure in the adjacent cabin reaches the peak PAC, P(t) = PAC, so Equation (9) is substituted into Equation (5) to obtain Equation (10):
T 2 T 1 = 1 κ ln P E C V E C ( V E C + V A C ) P E C
Substituting in the speed of sound c, the pressure relief area A, and the volume of the blast cabin VEC yields κ :
κ = 725 ( A V E C )
Since VEC and VAC are known quantities, when the explosion equivalent is known, PEC can be calculated by the quasi-static peak pressure calculation model given by Lloyd’s Register of Shipping, as shown in Equation (12):
P E C = 2.74 ( W V E C ) 0.8
where W is the equivalent TNT mass (kg), such that substituting κ , PEC, VEC, and VAC into Equation (10) yields the quasi-static pressure rise time Equation (13) for the adjacent cabin:
T 2 T 1 = 1 725 ( A V E C ) ln P E C V E C ( V E C + V A C ) P E C
The entire calculation process is shown in Figure 19, which is programmed to draw a simplified curve of the pressure in the adjacent cabin of internal explosions.
In order to verify the accuracy of the simplified model of the pressure in the adjacent cabin of internal explosions, the experimental and theoretical values of the pressure rise time in the adjacent cabin were compared, as shown in Figure 20, with a maximum error of 15.9%.

5. Conclusions

This study established an adjacent cabin environment using twin cabins separated by a clamped perforated bulkhead. Multiple internal explosion tests were conducted with a constant charge mass while systematically varying bulkhead open area ratios. Pressure transducers mounted in the adjacent compartment recorded pressure–time curves, enabling analysis of loading characteristics and quantification of pressure rise times under different vent configurations. AUTODYN finite element software was used to simulate the test conditions. The pressure curves of the explosion cabin and the adjacent cabin were recorded by adding pressure measurement points. Combined with the pressure contours of the explosion cabin and the adjacent cabin at different moments and the propagation process of the products of the detonation, the pressure loading characteristics of the explosion adjacent cabin were clarified. The propagation process of internal explosions in the cabin to the adjacent cabin and the loading model of the adjacent cabin was simplified based on the loading characteristics of the adjacent cabin. Based on the assumption of the exponential venting process, the rise time of the load of the adjacent cabin was theoretically analyzed, and a simplified calculation model of the pressure loading of the adjacent cabin was given. The findings of this study provide a load model that supports the assessment of the damage range of internal explosions in multiple compartments and structures. The main conclusions obtained from this study are as follows:
(1)
Pressure measurements in the adjacent cabin exhibit characteristic quasi-static loading profiles, consisting of a pressure rise phase followed by stabilization. The pressure rise time decreases exponentially with an increasing open area ratio.
(2)
Finite element simulations replicated experimental conditions, obtaining pressure curves for both the explosion and adjacent cabins, along with pressure contours and the propagation process of detonation products at various time intervals. Analysis demonstrates the following: During the initial phase, adjacent cabin loading experiences disturbances from the explosion cabin’s shock wave, with disturbance intensity proportional to vent area. In the intermediate phase, venting of detonation products from the explosion cabin induces a gradual pressure rise in the adjacent cabin. Ultimately, the pressures equilibrate between cabins. Pressure curves at all adjacent cabin locations essentially coincide, exhibiting deviations only during the initial shock wave disturbance phase.
(3)
Based on the assumption that the venting process is an exponential decay, the computational model of the pressure loading rise time of adjacent cabins for internal explosions in the cabin is established. A simplified workflow for estimating the adjacent cabin load is provided. The model predicts pressure rise times with relatively small error compared to experimental values, demonstrating its suitability for engineering applications.

Author Contributions

Conceptualization, X.L.; methodology, X.L., X.Z. and J.Y.; software, X.L. and Z.F.; validation, X.L.; formal analysis, X.L., Z.F., X.Z. and J.Y.; investigation, X.L.; resources, X.L.; data curation, X.L. and Z.F.; writing—original draft preparation, X.L.; writing—review and editing, X.L., Z.F., X.Z. and J.Y.; visualization, X.L., Z.F., X.Z. and J.Y.; supervision, X.L.; project administration, X.L.; funding acquisition, X.L. All authors have read and agreed to the published version of the manuscript.

Funding

This research was funded by the Youth Fund Project of Shanxi Province Basic Research Program-Free Exploration Category, grant number 202203021212136.

Institutional Review Board Statement

Not applicable.

Informed Consent Statement

Not applicable.

Data Availability Statement

The original contributions presented in this study are included in the article; further inquiries can be directed to the corresponding author.

Acknowledgments

The author would like to thank Lanyang Liu for his assistance in validation, investigation, and writing—review and editing, which greatly improved the quality of this study.

Conflicts of Interest

Author Xudong Li was employed by the company Chongqing Changjiang Electrical Appliances Industries Group Co., Ltd. The remaining authors declare that the research was conducted in the absence of any commercial or financial relationships that could be construed as a potential conflict of interest.

References

  1. Wu, C.; Lukaszewicz, M.; Schebella, K.; Antanovskii, L. Experimental and numerical investigation of confined explosion in a blast chamber. J. Loss Prev. Process. Ind. 2013, 26, 737–750. [Google Scholar] [CrossRef]
  2. Kong, X.; Zhou, H.; Xu, J.; Zheng, C.; Lu, A.; Wu, W. Scaling of confined explosion and structural response. Thin-Walled Struct. 2023, 186, 110656. [Google Scholar] [CrossRef]
  3. Edri, I.; Feldgun, V.; Karinski, Y.; Yankelevsky, D. On Blast Pressure Analysis Due to a Partially Confined Explosion: III. Afterburning Effect. Int. J. Prot. Struct. 2012, 3, 311–331. [Google Scholar] [CrossRef]
  4. Ames, R.G.; Drotar, J.T.; Silber, J.; Sambrook, J. Quantitative distinction between detonation and afterburn energy deposition using pressure-time histories in enclosed explosions. In Proceedings of the 13th International Detonation Symposium, Norfolk, VA, USA, 23–28 July 2006. [Google Scholar]
  5. Baker, W.E. Explosion Hazard Sand Evaluation; Elsevier Publishing Company: New York, NY, USA, 1983. [Google Scholar]
  6. U.S. Department of Defense. Structures to Resist the Effects of Accidental Explosions (UFC 3-340-02); U.S. Department of Defense: Washington, DC, USA, 2023. [Google Scholar]
  7. Lin, X.; Wang, S.; Zhang, L.; Xu, S.; Hu, Y. Study on load characteristics and structural impact response propagation law of cabin internal explosion. Ocean Eng. 2024, 301, 117582. [Google Scholar] [CrossRef]
  8. Kong, X.; Zhu, Z.; Zheng, C.; Zhou, H.; Wu, W. Numerical investigation on the dynamic behavior of thermoplastic fiber-metal laminates subject to confined explosion loading. Thin-Walled Struct. 2025, 214, 113354. [Google Scholar] [CrossRef]
  9. Salvado, F.C.; Tavares, A.J.; Teixeira-Dias, F.; Cardoso, J.B. Confined explosions: The effect of compartment geometry. J. Loss Prev. Process. Ind. 2017, 48, 126–144. [Google Scholar] [CrossRef]
  10. Grisaro, H.Y. Pressure-Impulse diagrams for assessment of structural response due to a fully confined explosion. Eng. Fail. Anal. 2023, 146, 107103. [Google Scholar] [CrossRef]
  11. Chang, W.; Choung, J. Sensitivity analysis of damage extent in naval ship compartments due to internal airborne explosions. Int. J. Nav. Arch. Ocean Eng. 2024, 16, 100622. [Google Scholar] [CrossRef]
  12. Zhang, Y.-L.; Liu, Y.; Song, P.; Liang, H.-Z.; Yang, D.; Han, L.; Jiang, H.-Y.; Zhong, K. Experimental study on the TNT equivalence for blast parameters in a confined space. Def. Technol. 2025, 48, 238–249. [Google Scholar] [CrossRef]
  13. Guo, X.; Li, Y.; McCrum, D.P.; Hu, Y.; Bai, Z.; Zhang, H.; Li, Z.; Wang, X. A reinforced concrete shear wall building structure subjected to internal TNT explosions: Test results and numerical validation. Int. J. Impact Eng. 2024, 190, 104950. [Google Scholar] [CrossRef]
  14. Li, S.; Ma, J.; Zhao, K.; Xiu, Z.; Li, R.; Liu, Z.; Zhao, Y.; Li, M.; Liu, Q. Experimental study on the effects of equivalence ratio on vented methane-hydrogen mixture explosion in confined area. Energy 2025, 322, 135646. [Google Scholar] [CrossRef]
  15. Choubey, B.; Dutta, S.C.; Prakhya, G.K.V.; Mandal, P.; Tanwar, R.K. Blast pressure analysis due to confined explosion-after effects. Structures 2020, 28, 521–536. [Google Scholar] [CrossRef]
  16. Guo, B.; Liang, W.; Xu, X.; Song, S.; Fu, Q.; Liu, S. Study on the characteristics of internal explosion loads in masonry-infilled reinforced concrete frame structures. J. Build. Eng. 2025, 111, 113243. [Google Scholar] [CrossRef]
  17. Zhong, Q.; Zhong, X.; Liu, Z.; Lu, Y.; Chen, T. Impact of the blockage ratio and void fraction of porous obstacle on gas explosion characteristics in semi-confined channel. Int. J. Hydrogen Energy 2024, 77, 253–264. [Google Scholar] [CrossRef]
  18. Li, R.; Xiu, Z.; Liu, Z.; Liu, Q.; Li, M. Simulation of obstacle spacing effects on premixed hydrogen-air explosion dynamics in semi-confined spaces. Int. J. Hydrogen Energy 2025, 105, 735–747. [Google Scholar] [CrossRef]
  19. Tang, J.; Chen, C.; Wang, B.; Zhang, S.; Mo, L.; Li, C. Whether hydrogen blending in natural gas pipelines induce detonation? A numerical investigation of explosions in confined pipeline compressor plants. Int. J. Hydrogen Energy 2025, 133, 247–260. [Google Scholar] [CrossRef]
  20. Xu, L.; Chen, L.; Feng, B.; Zhou, D. Research on internal explosion loads in folded arch tunnels: A theoretical approach. Tunn. Undergr. Space Technol. 2024, 147, 105731. [Google Scholar] [CrossRef]
  21. Zhang, Z.; Wang, H.; Wang, Z.; Tian, W.; Wang, Z. The effect of orifice plates with different shapes on explosion propagation of premixed methane–air in a semi-confined pipeline. J. Loss Prev. Process. Ind. 2021, 71, 104498. [Google Scholar] [CrossRef]
  22. Cheng, R.; Chen, W.; Hao, H.; Li, J. Effect of internal explosion on tunnel secondary and adjacent structures: A review. Tunn. Undergr. Space Technol. 2022, 126, 104536. [Google Scholar] [CrossRef]
  23. Weibull, H.R.W. Pressures recorded in partially closed compartments at explosion of TNT charges. Ann. N. Y. Acad. Sci. 1968, 152, 357–361. [Google Scholar] [CrossRef]
  24. Hou, H.L.; Zhu, X. Experimental studies on characteristics of blast loading when exploded inside ship cabin. J. Ship Mech. 2010, 14, 901–907. [Google Scholar]
  25. Hu, Y.; Wu, C.; Lukaszewicz, M.; Dragos, J.; Ren, J.; Haskett, M. Characteristics of confined blast loading in unvented structures. Int. J. Prot. Struct. 2011, 2, 21–43. [Google Scholar] [CrossRef]
  26. Zyskowski, A.; Sochet, I.; Mavrot, G.; Bailly, P.; Renard, J. Study of the explosion process in a small scale experiment—structural loading. J. Loss Prev. Process. Ind. 2004, 17, 291–299. [Google Scholar] [CrossRef]
  27. Anderson, C.E.; Baker, W.E.; Wauters, D.K.; Morris, B.L. Quasi-static pressure, duration, and impulse for explosions in structures. Int. J. Mech. Sci. 1983, 25, 455–464. [Google Scholar] [CrossRef]
  28. Kingery, C.N.; Schumacher, R.N.; Ewing, W.O. Internal Pressures from Explosions in Suppressive Structures; BRL Memorandum Report ARBRL-MR-02848; USA Ballistic Research Laboratory: Aberdeen Proving Ground, MD, USA, 1978. [Google Scholar]
  29. Proctor, J.F.; Filler, W.S. A computerized technique for blast loads from confined explosions. In Proceedings of the 14th Annual Explosives Safety Seminar, New Orleans, LA, USA, 8–10 November 1972; Volume 10, pp. 99–124. [Google Scholar]
  30. Kinney, G.F.; Sewell, R.G.S. Venting of Explosions; NWC Tech. Mem. 2448; Naval Weapons Center: China Lake, CA, USA, 1974. [Google Scholar]
  31. Carlson, R.W. Confinement of an Explosion by a Steel Vessel; LANL: Los Alamos, NM, USA, 1945. [Google Scholar]
  32. Moir, D.C. Safety Analysis of the M-2 Comfinement Systems; LANL: Los Alamos, NM, USA, 1979. [Google Scholar]
  33. Baker, W.E.; Hokanson, J.C.; Esparza, E.D.; Sandoval, N.R. Gas Pressure Loads with Invented and Unvented Structures; Southwest Research Institute: San Antonio, TX, USA, 1983. [Google Scholar]
  34. Lloyd’s Register. Rules and Regulations for the Classification of Naval Ships: Naval Ship Code (NSC); Lloyd’s Register Group Limited: London, UK, 2020. [Google Scholar]
  35. TM5-1300; Structures to Resist the Effects of Accidental Explosions. Departments of the Army, the Navy and the Airforce: Washington, DC, USA, 1990.
  36. Wang, Y.; Li, W.; Zhu, W.; Zhang, Q.; Li, W.; Wang, X. Dynamic response of steel cabin structure under blast loading from adjacent cabin. Eng. Struct. 2024, 311, 118213. [Google Scholar] [CrossRef]
Figure 1. Adjacent cabin test configuration schematic.
Applsci 15 10140 g001
Figure 2. Schematic diagram of dimensions and shape of perforated partitions. (a) Geometric dimensions of perforated bulkhead, (b) geometric shape of perforated bulkhead.
Applsci 15 10140 g002
Figure 3. Different opening areas of the bulkhead physical diagram.
Applsci 15 10140 g003
Figure 4. Structure and method of charge during the experiment. (a) Location of the explosive charge; (b) the size and structure of the charge.
Applsci 15 10140 g004
Figure 5. Experimental test system.
Applsci 15 10140 g005
Figure 6. Pressure transducer physical configuration.
Applsci 15 10140 g006
Figure 7. Adjacent cabin layout and transducer installation.
Applsci 15 10140 g007
Figure 8. The quasi-static pressure time curves test data for adjacent cabin.
Applsci 15 10140 g008aApplsci 15 10140 g008b
Figure 9. Simulation model used for quasi-static pressure study of adjacent cabin.
Applsci 15 10140 g009
Figure 10. Convergence analysis of mesh sensitivity.
Applsci 15 10140 g010
Figure 11. Pressure monitoring point distribution.
Applsci 15 10140 g011
Figure 12. Pressure loading curves of explosion cabin and adjacent cabin.
Applsci 15 10140 g012
Figure 13. The stress and deformation fields of the cabin component walls. (a) The stress fields of the explosion cabin; (b) the deformation fields of the explosion cabin.
Applsci 15 10140 g013
Figure 14. Cloud diagram of explosive load propagation process.
Applsci 15 10140 g014
Figure 15. The propagation process of detonation products.
Applsci 15 10140 g015
Figure 16. Pressure profiles of adjacent cabins with different opening area ratios.
Applsci 15 10140 g016
Figure 17. Venting process from explosion cabin to adjacent cabin.
Applsci 15 10140 g017
Figure 18. Simplified model of pressure change in the venting process from the cabin of the explosion to the adjacent cabin.
Applsci 15 10140 g018
Figure 19. Computational workflow for adjacent cabin pressure loading.
Applsci 15 10140 g019
Figure 20. Comparison of simplified model predictions with experimental data.
Applsci 15 10140 g020
Table 1. Test parameters.
TestCharge Mass (g)Open Area RatioHole Radius (mm)Schematic
159.353%10Applsci 15 10140 i001
259.465%13Applsci 15 10140 i002
360.4115%22Applsci 15 10140 i003
459.6820%25Applsci 15 10140 i004
Table 2. Material properties and Johnson–Cook material constants.
Density ρ/(kg/m3) A /(Mpa)B/(Mpa)nCm
78002688890.7460.0580.94
Table 3. Parameters of the JWL equation of state for TNT.
Density ρ/(kg/m3)Detonation Velocity/D(m/s)C-J Pressure/(Pa)C1/(Pa)
163068002.1 × 10103.74 × 1011
C2r1r2ω
3.75 × 1094.150.90.35
Disclaimer/Publisher’s Note: The statements, opinions and data contained in all publications are solely those of the individual author(s) and contributor(s) and not of MDPI and/or the editor(s). MDPI and/or the editor(s) disclaim responsibility for any injury to people or property resulting from any ideas, methods, instructions or products referred to in the content.