1. Introduction
Commercial buildings are among the main building blocks of modern economies, but they impose significant pressure on energy consumption, particularly due to air conditioning systems. A large portion of electricity demand peaks during daytime hours when businesses are fully active [
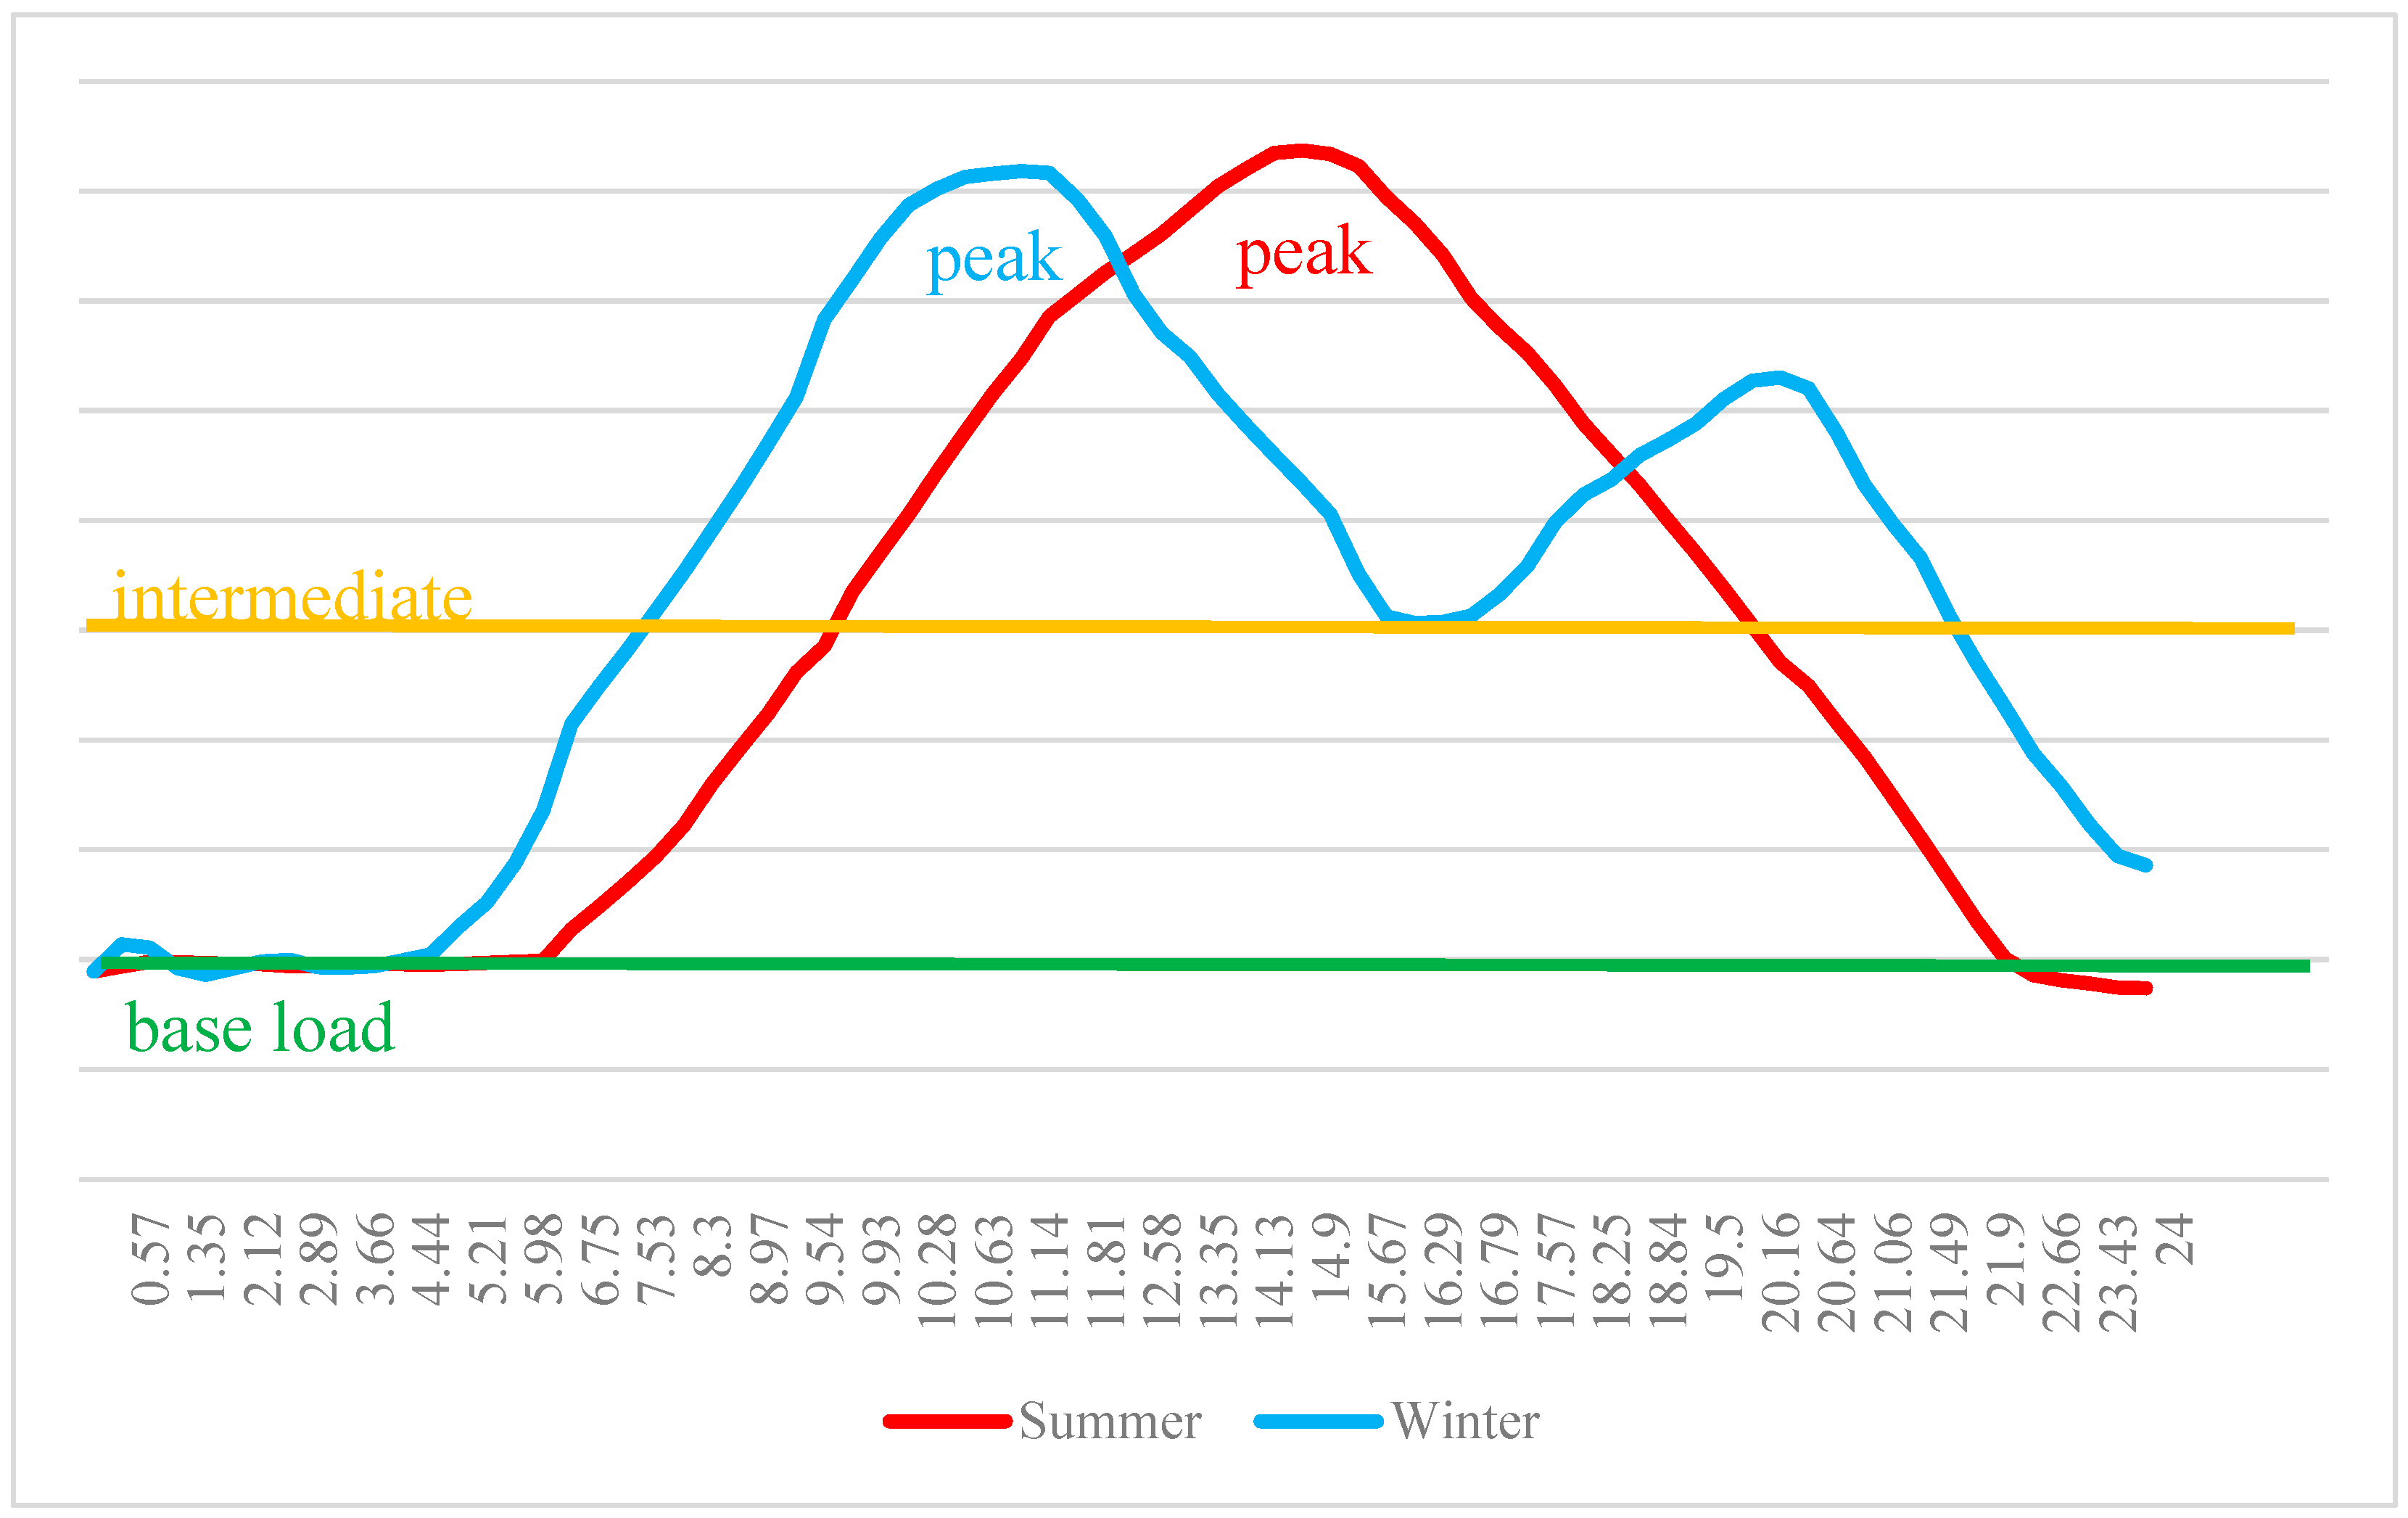
1]. This becomes especially critical in summer, as the hours of maximum commercial activity coincide with the highest ambient heat load, as illustrated in
Figure 1. Since refrigeration and air conditioning account for 25–30% of global electricity consumption, Cold Thermal Energy Storage (CTES) technologies are considered a key solution for improving efficiency, especially at sub-zero temperatures [
2]. This demand intensity also forces the activation of less efficient peak-load power plants, further increasing environmental impact [
3].
Cold Thermal Energy Storage (CTES) technologies are generally classified into sensible storage (e.g., chilled water tanks), latent storage (e.g., ice storage systems), and hybrid configurations that combine both approaches [
4,
5]. Sensible storage benefits from higher charging COP due to operation at above-zero evaporating temperatures, but it suffers from low volumetric energy density (~30–50 kWh/m
3), requiring very large tank volumes [
6]. In contrast, latent storage—employed in the present study—utilizes the high latent heat of fusion of water (~334 kJ/kg) and achieves much higher energy density (~80–100 kWh/m
3), enabling compact installations [
5,
7,
8]. Hybrid systems, which combine chilled water and encapsulated PCM/ice modules, have been proposed to balance compactness and efficiency [
9]. In this study, we specifically investigate a latent storage (ice) system, aiming to experimentally validate its performance and techno-economic feasibility in commercial building cooling applications.
One of the most effective CTES methods is the ISS, which shifts cooling production to off-peak night hours when both demand and unit electricity prices are lower [
3]. In addition, an ISS can reduce required chiller and electrical infrastructure capacity, potentially lowering upfront costs. Cooling energy is stored in the form of ice during the night and utilized the following day to meet cooling requirements. This approach directly reduces operating costs, since energy-intensive cooling units need not operate during expensive peak tariff periods. Moreover, night-time operation at lower ambient temperatures increases the coefficient of performance (COP), with improvements of up to 4.4% reported in previous studies [
10]. Beyond peak load shifting, an ISS can also be regarded as a form of “virtual energy storage,” providing ancillary flexibility services to the power grid and enhancing demand-side management capabilities [
11]. Moreover, recent work has also highlighted the potential of an ISS in non-urban contexts, such as rural microgrids, where ice-plate storage units can support both cooling demand and microgrid stability [
12].
For these reasons, the ISS has been widely studied in the literature, primarily through simulation models and scenario analyses. However, this gap in the literature highlights the need for experimental studies to validate the techno-economic performance of optimized short-term charging strategies under real operating conditions. Addressing this gap, the present work experimentally investigates the performance of a VCR air conditioning system integrated with an ISS, and provides validated results on charge COP, discharge efficiency, and economic feasibility.
The integration of an ISS into air conditioning systems has been extensively studied in the literature through different modeling tools and scenarios. These systems typically rely on Phase Change Materials (PCMs)—classified as organic, inorganic, or eutectic mixtures—to store energy at high densities [
13]. In one of the pioneering studies in this field, the effect of an ISS on an HVAC system for non-residential buildings was modeled with TRNSYS 15 software [
14]. The researchers, who validated their simulation model with an experimental setup, reported that ISS integration provided positive benefits on operating expenses and HVAC efficiency, but that the chosen scenario had a serious impact on the results [
14].
Control strategies, another critical factor affecting system performance, were investigated in a MATLAB/Simulink environment [
15]. A key application of these strategies is for peak electricity shaving, for which PCM-air heat exchangers have been specifically designed and optimized [
16]. The combined use of an ISS with other energy systems has also been researched; in an analysis of a combined system including solar energy and a heat pump in seven different buildings, it was found that solar energy made the largest contribution to energy production, while the contribution of the ISS was more limited [
17]. Other configurations have explored using concentrated solar power, such as solar dish collectors, to drive absorption refrigeration cycles that are coupled with PCM storage [
18].
Research has also focused on the performance of an ISS in different climate conditions and the importance of its position in the cooling cycle. For example, in Canada, the contribution of an ISS added to a solar-assisted heat pump system to the heating performance was also analyzed [
19]. In their study, they observed that the ISS provided a more stable temperature source to the heat pump than air during the winter season, resulting in energy savings of up to 66% in heating and 51% in total annual consumption [
19]. The physical location of the ISS in the cycle, another factor that directly affects the system’s efficiency, was theoretically investigated [
20]. The researchers, who placed the ISS, usually located between the condenser and the expansion valve, in three alternative positions, showed that the most efficient result (46.7% energy saving) was obtained with the partial cooling cycle, where it was positioned after the evaporator [
20].
Experimental investigations have also analyzed the charging and discharging performance of sensible heat storage systems, demonstrating their ability to maintain comfort conditions for several hours [
21]. Economic feasibility stands out as an important evaluation criterion. In an analysis conducted for an office building in Singapore, it was stated that although the ISS yielded efficient results in all scenarios, the investment payback period of the system could vary in a wide range from 8.9 to 16 years [
22].
Although the existing literature has generally examined the performance of an ISS through simulations or under standard scenarios, there is still a need for experimental studies that reveal the thermo-economic performance of direct expansion systems and optimized short-term charging strategies under real field conditions. In this context, this article fills this gap in the literature by presenting the experimental results of an ideal operating strategy developed on a unique test setup containing custom-made components. The main contributions of the study are the experimental determination of the system’s charging efficiency (COP), discharging (energy transfer) efficiency, and the room insulation coefficient, and proving the economic feasibility of the system with these data. Therefore, this study creates a validated reference model for the optimization of similar systems.
2. Materials and Methods
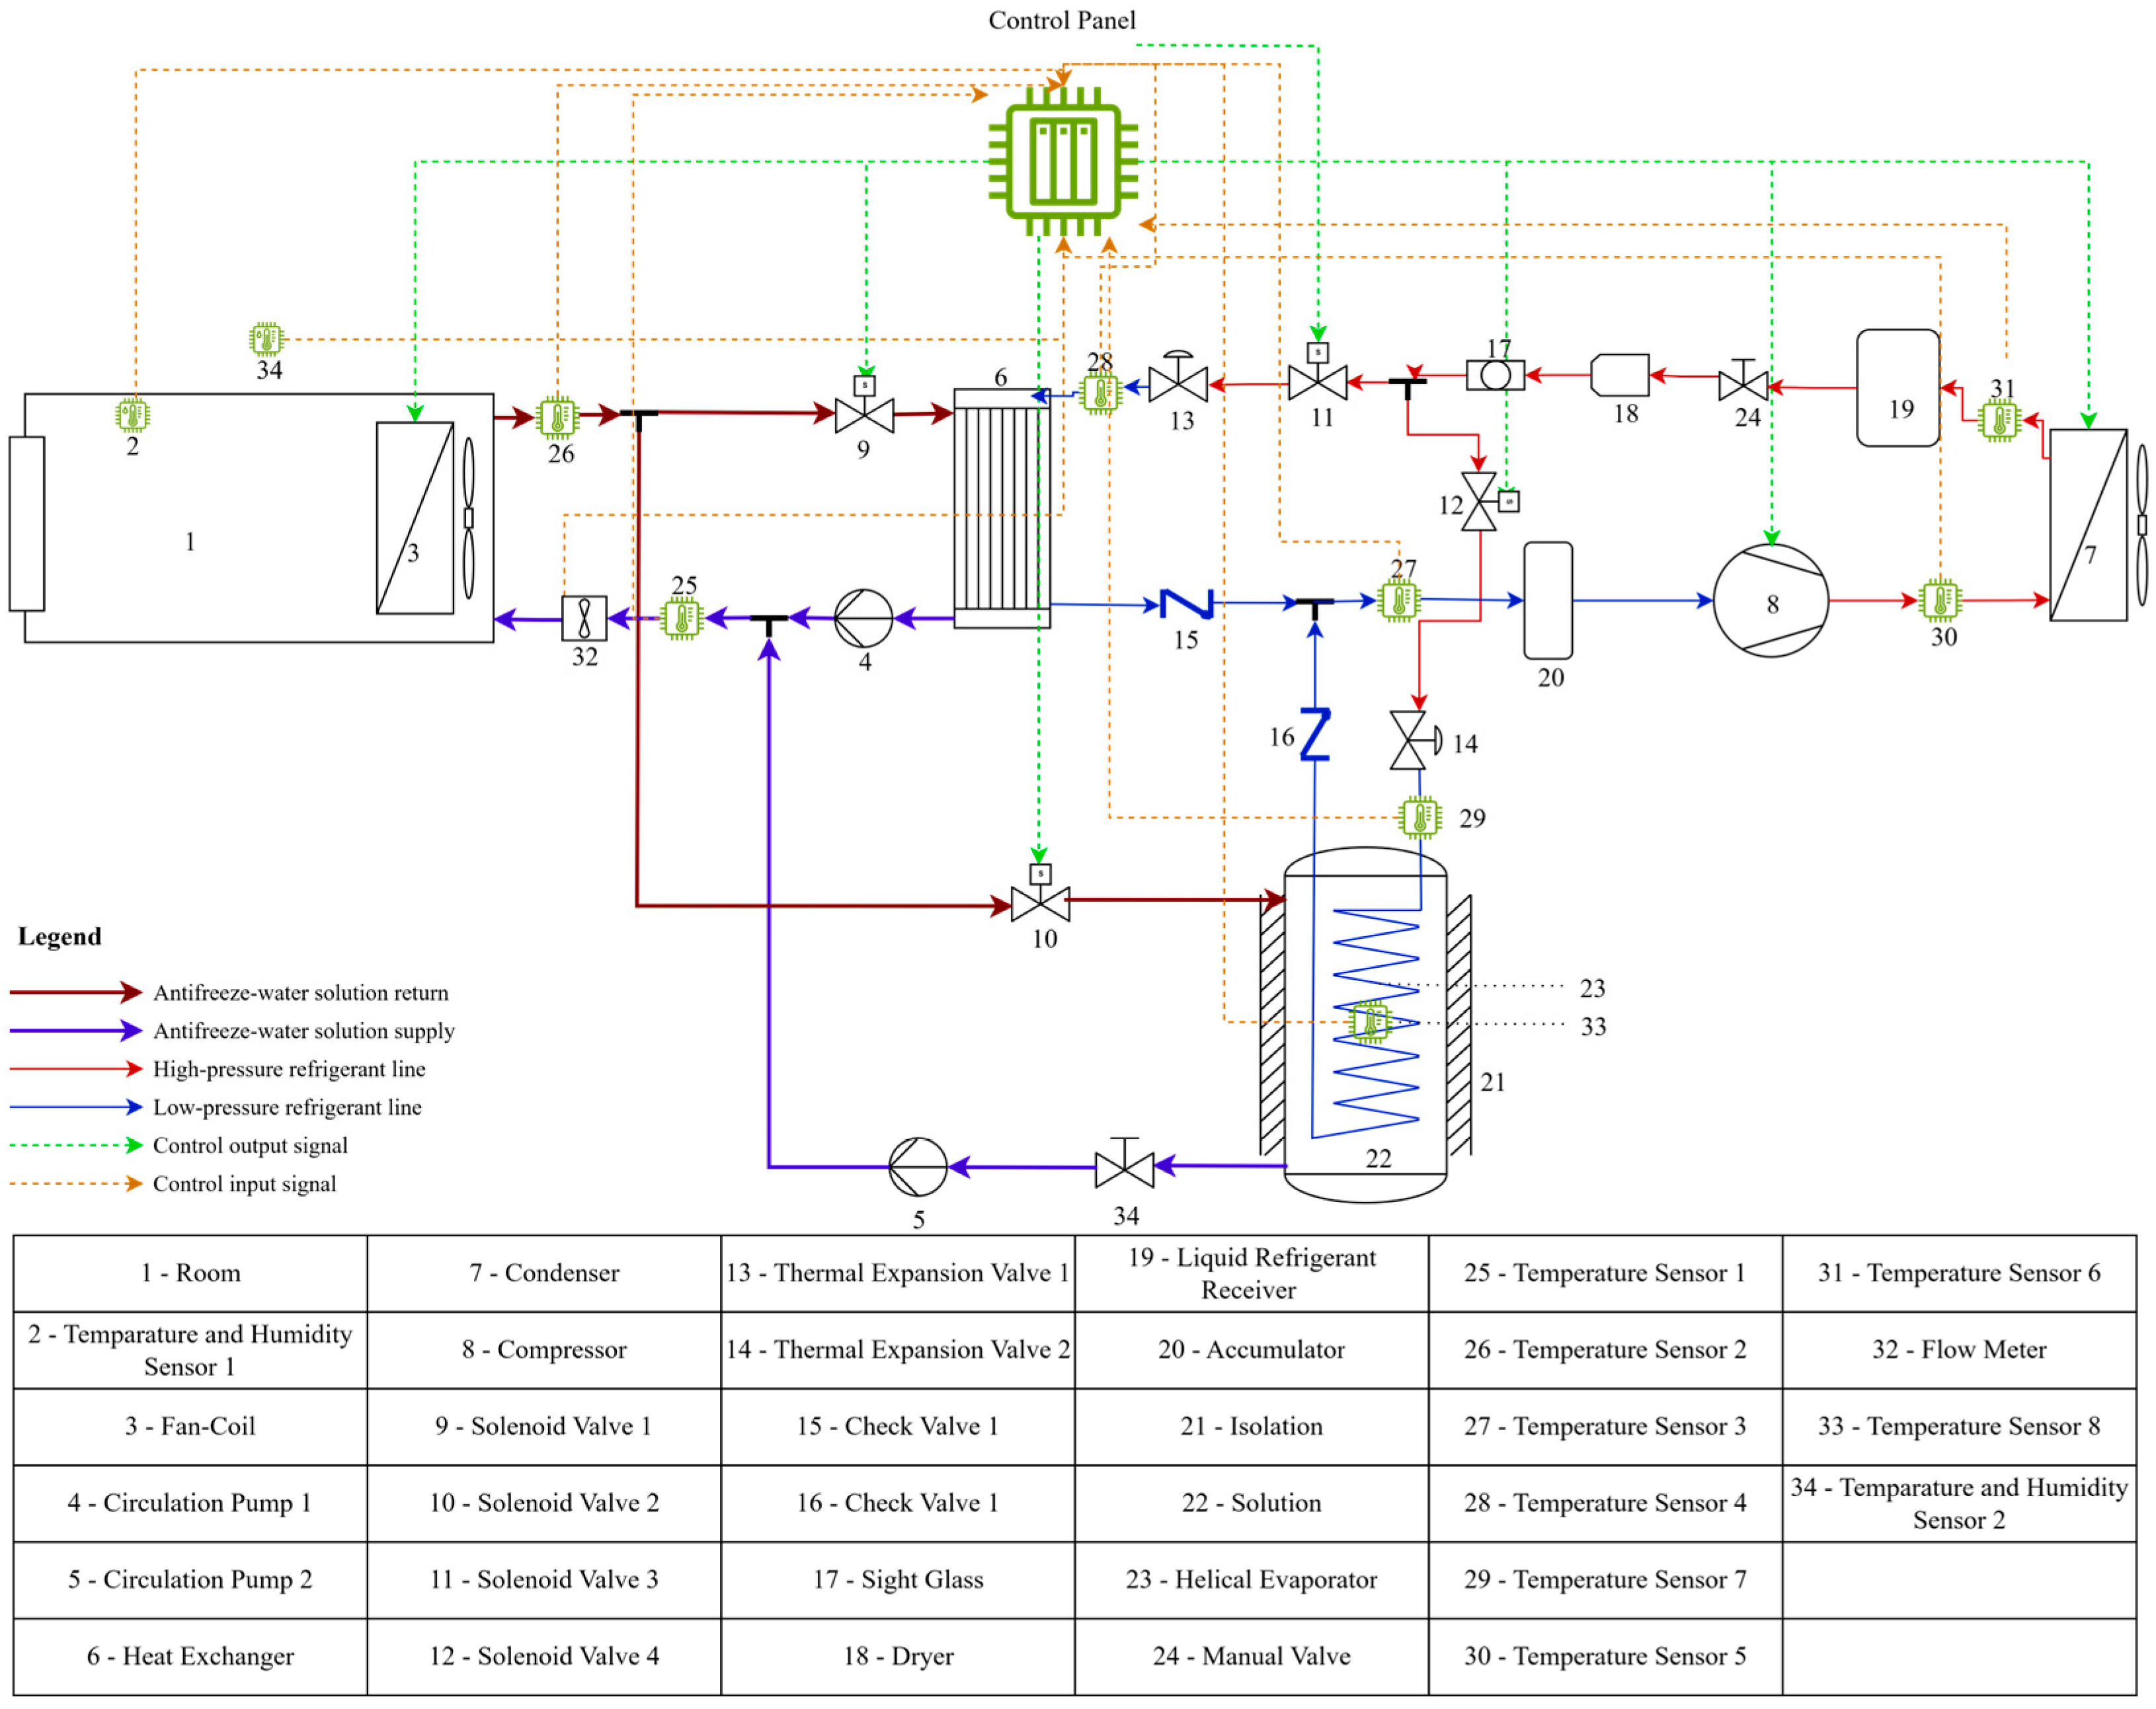
The experimental setup used in this study consists mainly of a test room to be conditioned, an ice storage unit, and a VCR system (
Figure 2).
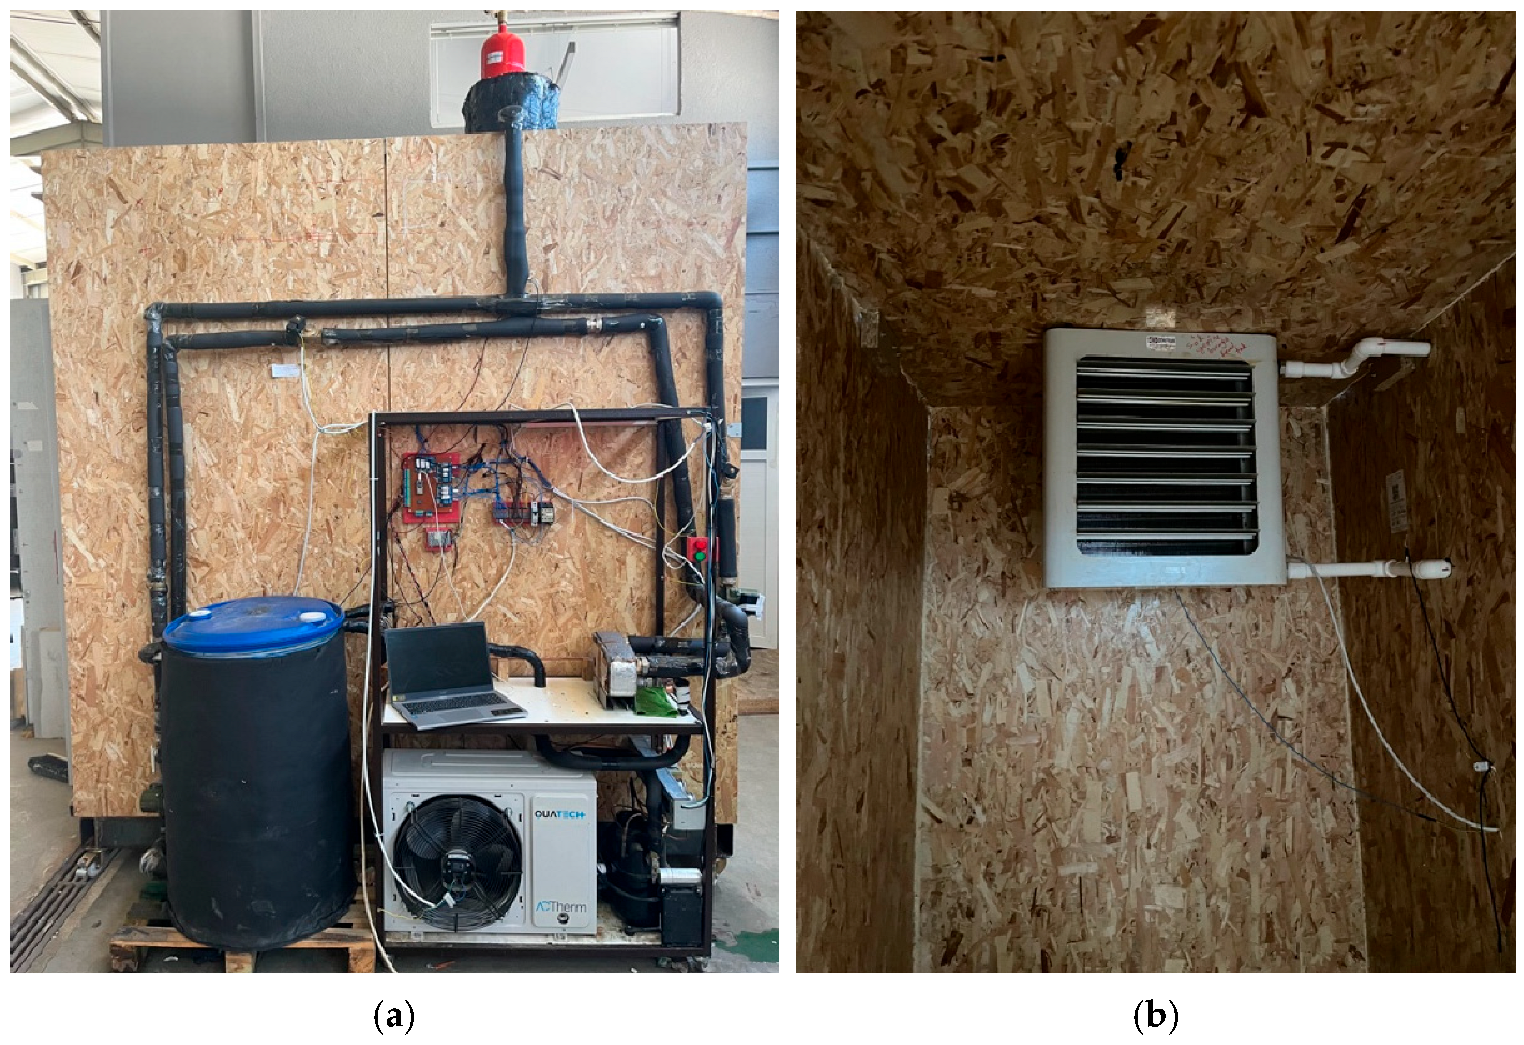
The test room (
Figure 3) where the experiments were conducted was built with dimensions of 1220 mm width × 2200 mm length × 2440 mm height. The heat transfer coefficient of the panels and the door used is 0.42 W/m
2K.
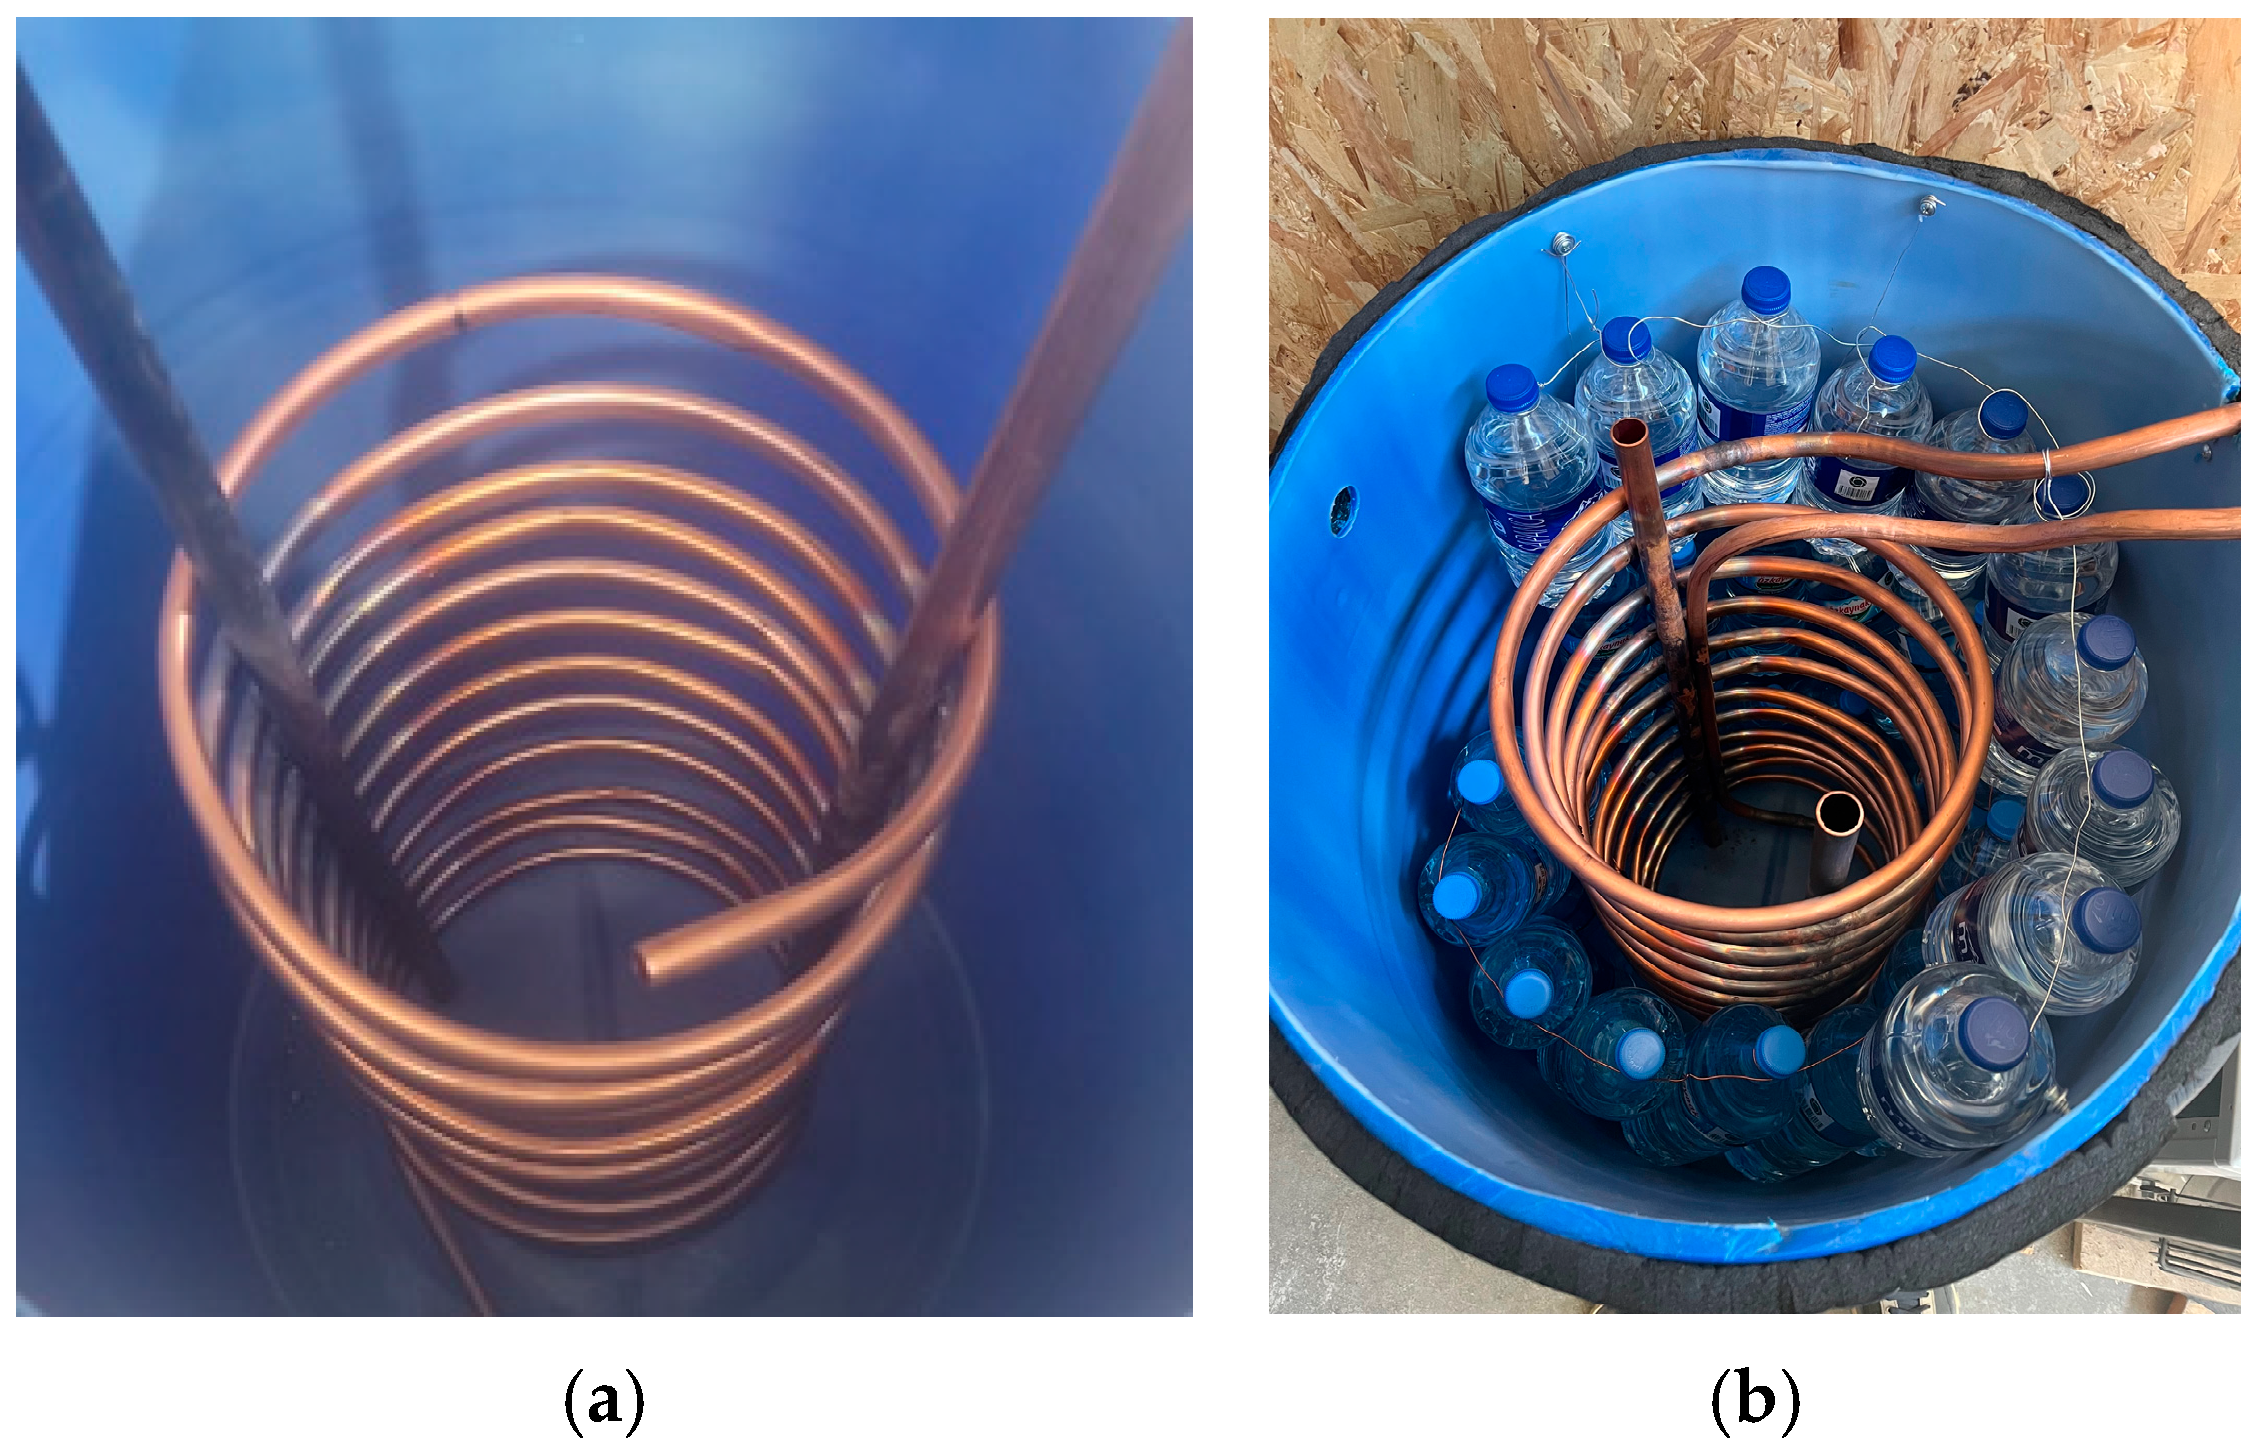
The ice storage unit consists of a 200 L water tank insulated with 9 mm thick rubber material. Thermal energy is stored by freezing the water in 30 × 1.5-L and 10 × 1-L bottles, containing a total of 55 L of water, placed inside this tank, which is filled with an antifreeze–water solution (40%) (
Figure 4). The refrigerant circulating through the helical evaporator tubes absorbs heat from the antifreeze–water solution and evaporates. The heat transfer between the water trapped inside the plastic bottles and the surrounding antifreeze–water solution causes the water inside the plastic bottles to change phase and freeze. As is well known, ice formation on evaporator tubes negatively impacts heat transfer. To prevent this, 40% antifreeze was mixed into the water outside the evaporator tubes, and the ice was stored in plastic bottles. Despite its low heat transfer conductivity, the plastic bottle was preferred due to its availability and low cost.
The VCR system is composed of a compressor, a fan coil unit as condenser, a helical pipe as evaporator (helical), a plate heat exchanger (as an evaporator), and a thermostatic expansion valve, which are listed in
Table 1.
The heat transfer between the antifreeze–water solution in the tank and the refrigerant is provided by a custom-made helical evaporator made of copper pipe with an outer diameter of 3/4 inch (19.05 mm). The pipe length is approximately 11.5 m, and the diameter of the coil is 30 cm. The system has two main loops: cooling with VCR system and cooling with cooled water–antifreeze solution.
The automation and performance monitoring of the system were carried out by transferring and recording data to a computer. The main measuring devices used and their manufacturer-specified tolerances are summarized in
Table 2.
The control logic of the system is divided into two main operation periods:
Charge (Ice Storage) Period (00:00–08:00): The system automatically switches to this mode at 00:00. The compressor and condenser fan are activated to start the cooling with the VCR system, aiming to freeze the water inside the plastic bottles in the ice storage tank. During this period, the fan-coil and circulation pumps are off.
Discharge Period (08:00–17:00): In this period, the system operates in three different modes based on the temperature data from the test room sensor.
Cooling system is disabled: When the test room temperature is measured below the set value of 21 °C, the VCR system (compressor, fans, pumps) stops.
Cooling with cooled antifreeze–water solution: When the room temperature rises above 23 °C and the temperature of the water–antifreeze solution in the ice storage tank is below 10 °C, the compressor does not activate. Only the fan-coil and the relevant circulation pump are operated to transfer the stored cold energy from the tank to the room.
Cooling with VCR system: When the temperature of the water–antifreeze solution in the ice storage tank rises above 10 °C and the cooling need continues, the system switches to cooling mode with the VCR system.
2.1. Experimental Procedure
The experiments were conducted according to a cycle of conditioning the room during the 9 h workday from 08:00 to 17:00 (discharge period) and storing ice in an 8 h period (00:00–08:00) (charge period). The indoor target temperature was set to 22 ± 1 °C. Five data points per second were taken from all temperature sensors; the smallest and largest of these data were discarded, the average of the remaining three data points was taken, and this final value was recorded. Indoor relative humidity was monitored using a DHT22 sensor during all test cycles, but no active humidity control was implemented. The experimental setup was designed to meet a theoretically calculated cooling energy of 4.568 kWh. The ambient conditions affecting the performance of the system’s main components (compressor, condenser, ice tank) were continuously monitored during the experiment. During the experiment, the charging period was started at 00:00 and lasted for 8 h, and the discharging period was carried out according to the cycle of conditioning the room during the 9 h working period between 08:00 and 17:00.
To ensure the utmost reliability and consistency of our findings, we conducted several full-day (24 h) charge–discharge cycles on the system. These preliminary trials not only demonstrated the stable operation of the control logic but also revealed that the sensor readings were consistently accurate. Remarkably, similar performance characteristics emerged across all cycles, reinforcing the robustness of our approach. All results and figures in this paper are based on a representative full-day test cycle conducted under stable conditions.
2.2. Calculations
During the experiment, the efficiencies of the system during both charging and discharging are calculated using a specific relation. The system efficiency during charging, known as the Coefficient of Performance (COP), is defined as the ratio of the thermal energy stored to the energy consumed by the system during that process. Additionally, an overall COP value is defined for understanding full-cycle efficiency. These efficiencies can be calculated using the following equation.
In this equation,
and
represent the tank temperatures at the beginning and end of the analyzed period, as measured by the SS8 sensor. The physical constants for specific heat capacity (
) and the latent heat of fusion (
) were taken as follows:
= 2090 J/kg·K,
= 3420 J/kg·K,
= 4186 J/kg·K, and
= 334,000 J/kg.
During the discharge period, the discharge efficiency measures how effectively the system transfers stored energy to the room. It is calculated by taking the ratio of the energy transferred to the room to the total stored energy, using the following equation.
The heat loss from the tank during the energy storage process is calculated using the following equation:
2.3. Uncertainty Analysis
In this study, an uncertainty analysis was performed to evaluate the reliability of the calculated final performance metrics (COP, etc.). The analysis is based on the standard Kline and McClintock method, which calculates how errors in the basic measurement variables (temperature, power, flow rate) are reflected in the derived results. The basic measurement uncertainties used in the analysis are based on the device error tolerances given in
Table 2.
3. Results
In this section, the findings from the experimental setup operating under the improved scenario are presented and interpreted in the context of theoretical design goals and economic feasibility. Preliminary experiments showed that a shorter 8 h charge period shifted to the coldest hours of the night (e.g., 00:00–08:00) was sufficient to reach the total energy storage target of ~7.7 kWh and provided a higher charge COP (1.42 ± 0.06). This finding demonstrates that the system can reach its full potential with lower energy cost and emphasizes the importance of dynamic and more efficient charging strategies instead of static operating regimes. The instantaneous operating data recorded during both charging and discharging are summarized in the
Supplementary Materials (Table S1), providing representative values from the experimental runs.
3.1. System Performance During Charge (Ice Storage) and Discharge Periods
Data from the power analyzer module indicated that the cooling system used a total of 5.436 kWh of electrical energy to store 7.70 kWh of thermal energy. Based on this information, the COP during the charging period was calculated to be 1.42. This COP value suggests that the system operated with good efficiency, successfully storing 42% more thermal energy than the electrical energy consumed. Sample instantaneous operating data can be found in
Supplementary Materials (Table S1).
The COP of 1.42 achieved in this study aligns with typical values for ice-making devices, which usually range from 1.0 to 2.0 due to sub-zero evaporating temperatures [
4]. While this value is significantly lower than the COP of conventional comfort-cooling systems operating at above-zero evaporation levels (commonly 3–4), it is representative of the consumed energy for freezing water and the latent energy stored. The COP from this experimental setup confirms that it is realistic for ice storage operation.
The uncertainty analysis revealed that the charging COP of 1.42 has an uncertainty of ±0.06, while the discharge efficiency of 67.5% has an uncertainty of ±2.4%. This confirms the statistical reliability of the results.
During the discharge period, thermodynamic calculations using the ice tank energy balance method indicated that approximately 7.70 kWh of thermal energy was stored in the tank during the process. A total of 5.195 kWh of cooling was delivered to the room, resulting in a discharge efficiency of 67.5%. A significant portion of this energy comes from the latent heat generated by the phase change of 55 L of water into ice. Consequently, approximately 2.6 kWh of the stored energy was lost.
By combining the charging and discharging stages, an effective full-cycle COP of 0.96 was obtained with Formula (2), defined as the ratio of delivered cooling (5.195 kWh) to charging electricity (5.436 kWh). This metric provides a direct benchmark for comparing the ice storage system with conventional cooling systems on a full-cycle basis.
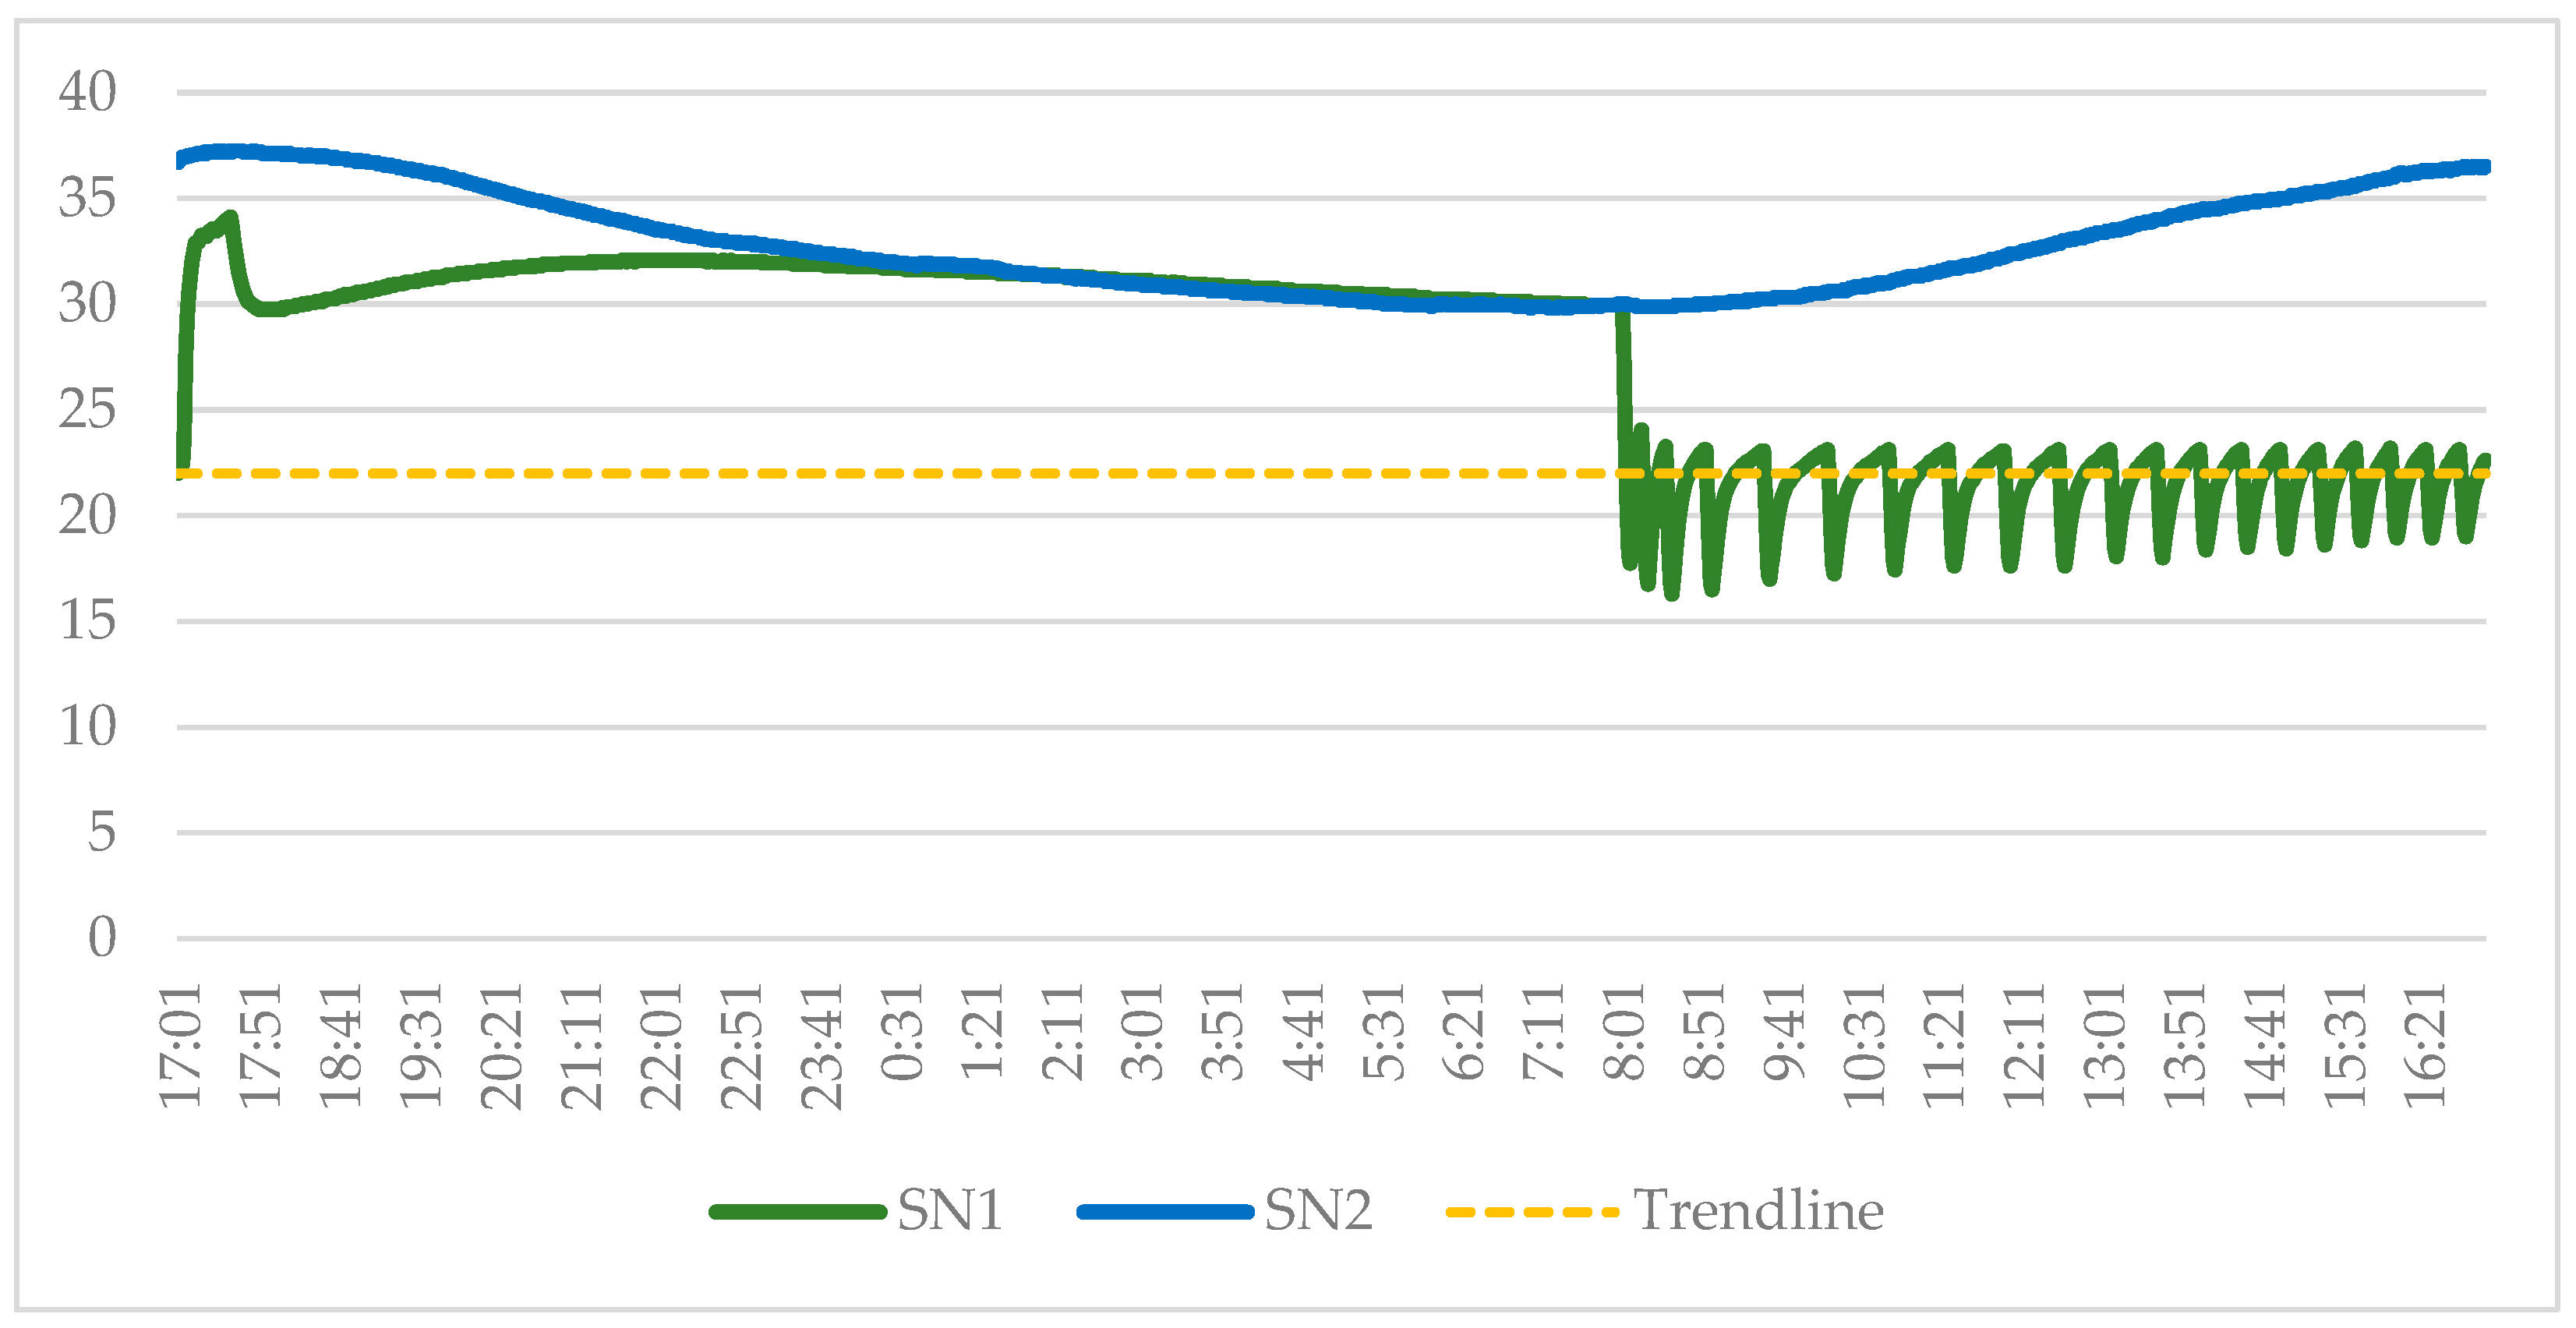
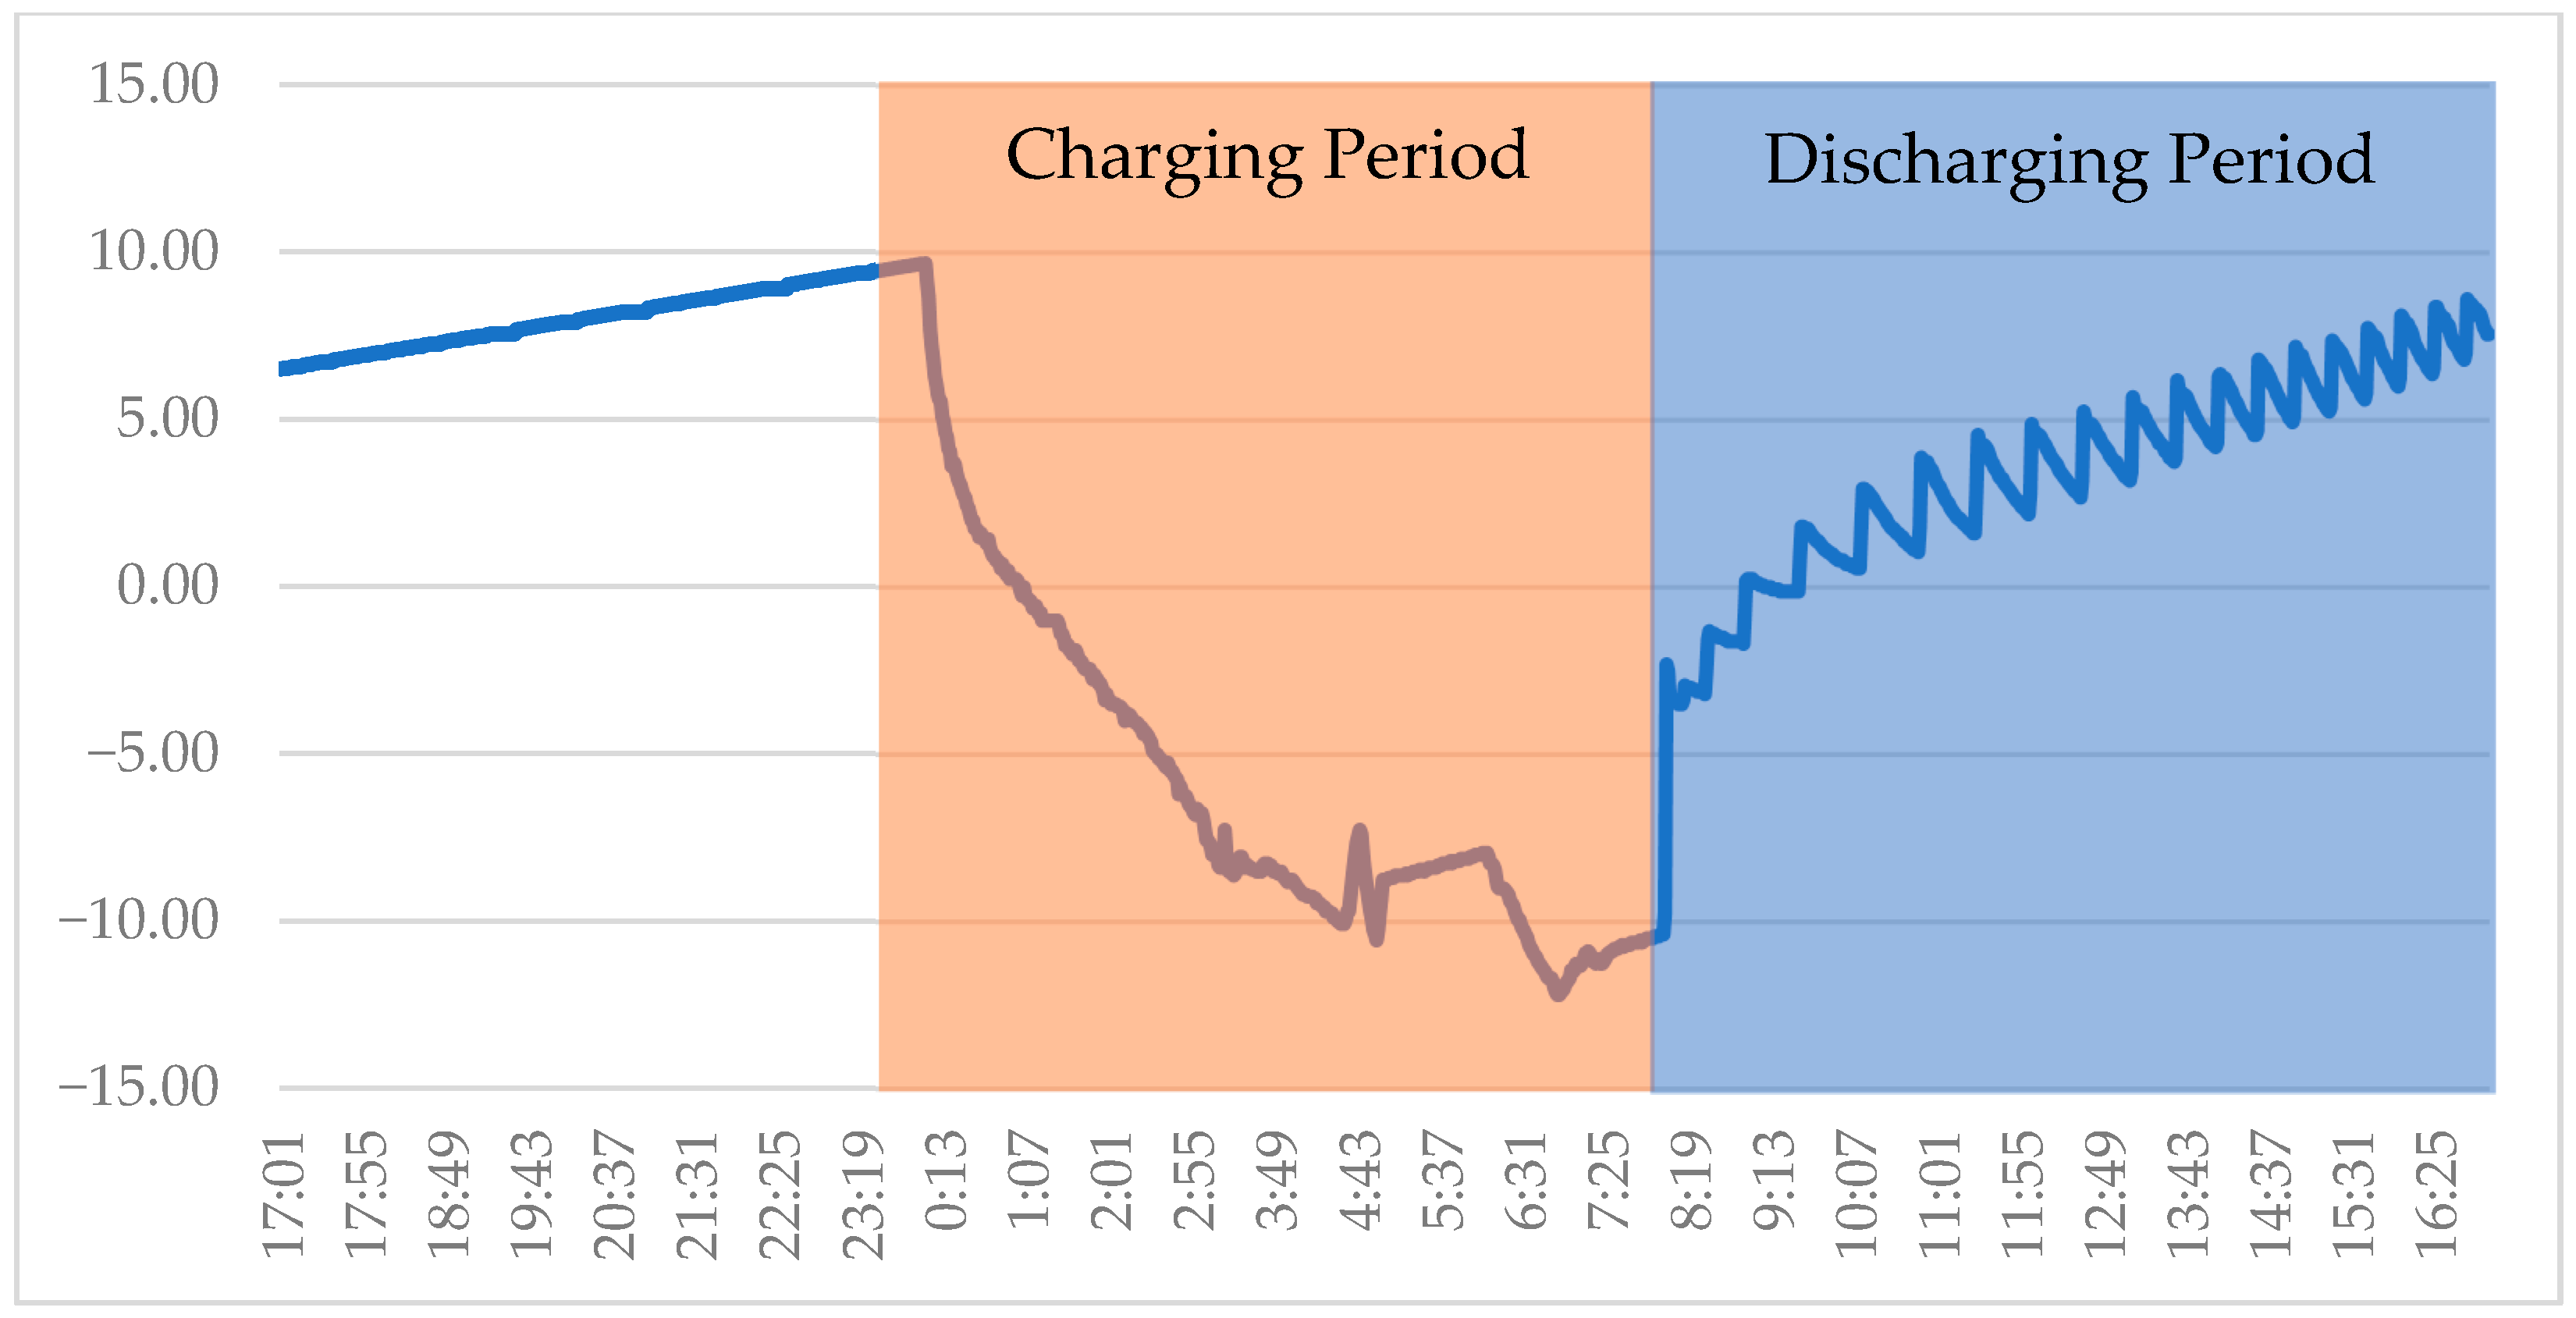
Figure 5 shows variation of the ambient and the room temperatures. The thermostatic control maintained an indoor temperature around 22 ± 1 °C using the stored cooling. The corresponding variation in the water–antifreeze solution temperature in the ice storage tank during charge and discharge periods is shown in
Figure 6.
3.2. Economic Analysis
To prove the economic feasibility of the ISS, which is one of the main objectives of this study, the operating costs of two different operating strategies were experimentally compared. In both scenarios, the goal is to transfer 5.195 kWh of cooling energy to the room.
Strategy 1: Ice Storage Method (Cooling with cooled antifreeze–water solution): In this method, the system was charged for 8 h starting from 00:00 at night according to the improved scenario and discharged during the 9 h daytime period.
Measured Electricity Consumption (Night): 5.44 kWh;
Tariff Used: Night Tariff (2.11 TRY/kWh);
Calculated Total Cost: TRY 11.47
Strategy 2: Direct Cooling Method (Cooling with VCR system): To measure the performance of the VCR system, experiments were repeated on different days under similar outdoor conditions, using only the direct cooling scenario during the discharge mode hours (daytime). The energy consumed by the system to meet the 5.195 kWh cooling demand was directly measured.
Measured Electricity Consumption (Daytime): 3.21 kWh;
Tariff Used: Daytime Tariff (4.45 TRY/kWh);
Calculated Total Cost: TRY 14.28
The experimental data clearly proves that the ice storage strategy provides an operating cost advantage of approximately 20%, reducing the cost from TRY 14.28 (TRY 1 = USD 0.025) to TRY 11.47, compared to performing the same cooling task directly during the day. This result confirms the potential of an ISS to provide significant economic benefits by shifting energy demand to cheaper night tariffs. The ~20% cost advantage reached in this analysis is specific to the industrial electricity tariffs in Turkiye at the time of the study. In order to also evaluate the feasibility of the system under different energy pricing policies, a break-even analysis was conducted to determine the conditions under which it would be profitable. For the system to provide a cost advantage, the cost of the ice storage method must be lower than or equal to the cost of direct cooling:
When we substitute our experimentally measured consumption values (
= 5.44 kWh,
= 3.21 kWh) into this equation, the required tariff ratio for the system to be profitable is found as follows:
This result shows that for the installed ISS to be economically advantageous, the night tariff must be lower than 59% of the daytime tariff. The fact that this ratio was approximately 47.4% (TRY 2.11/TRY 4.45) with the current tariffs at the time of the analysis mathematically explains why the system is profitable and offers a saving margin of ~20%. This sensitivity analysis shows that the feasibility of the system is not only dependent on current tariffs but also has a certain flexibility against changes in future energy pricing policies.
To complement the operational cost comparison, we estimated the incremental capital cost of adding the ISS on top of a conventional VCR system. The ISS-specific items (one circulation pump, the custom helical evaporator, the ice storage tank, and the measurement and control hardware) amount to approximately TRY 18,900. Using the experimentally observed daily operating-cost reduction of 2.81 TRY/day (direct cooling: 14.28 TRY/day vs. night-charged ISS: 11.47 TRY/day), a simple payback can be written as:
where
,
, and
is the number of cooling days per year. For
days (illustrative seasonal operation), the annual saving is 337 TRY/year, yielding a simple payback of ≈56 years. For 300 days/year, the annual saving would be ≈843 TRY/year and the simple payback ≈ 22.4 years. These figures reflect the laboratory scale of the present setup and a conservative, incremental capital-cost basis; in practice, payback improves with (i) larger daily cooling loads, (ii) higher day/night tariff differentials, and (iii) reduced storage/transfer losses (e.g., improved tank insulation and secondary-loop optimization). Conversely, lower differentials or fewer operating days lengthen payback. This analysis is intended as an order-of-magnitude indication rather than a universal economic conclusion. Beyond individual project economics, large-scale ISS deployment has also been shown to contribute to energy supply security and multi-agent economic benefits, strengthening its role in broader system-level planning [
23].
4. Discussion
In this study, the performance of an air conditioning system with ice storage was experimentally analyzed and shown to be thermo-economically promising. The methodological innovation lies in evaluating performance with two separate metrics, ”Charge Efficiency” and ”Discharge Efficiency,” which clearly identify the main bottleneck as the discharge process rather than the refrigeration cycle.
The relatively low discharge efficiency can be attributed mainly to heat ingress through the tank insulation and the auxiliary power consumption of the circulation pump. To address these limitations, several improvements can be considered as follows: (i) applying thicker or higher-quality insulation to the tank and piping, (ii) optimizing the circulation loop by selecting a lower-power pump and adjusting flow rate, and (iii) minimizing the piping length between the tank and the conditioned space. Such refinements are expected to enhance discharge efficiency in future implementations.
It should also be noted that the use of water-filled plastic bottles as encapsulated PCM units, while cost-effective and convenient for experimental validation, introduces an additional thermal resistance due to the low thermal conductivity of plastic. This effect reduces the overall heat transfer rate during both charging and discharging. Nevertheless, the use of bottles enabled a low-cost and easily replicable experimental setup. Future designs should explore specialized PCM modules with higher thermal conductivity to improve performance.
The integration of thermal comfort indices and demand response strategies into ISS operation has also been reported as a promising approach to maximize both user satisfaction and grid benefits [
24]. Another limitation of the present work is that although indoor relative humidity was monitored throughout the experiments, no active humidity control was applied. As a result, the reported performance primarily reflects sensible cooling behavior, without fully capturing the impact of varying latent loads. Future studies should explicitly incorporate latent load effects and investigate performance under diverse humidity conditions.
Overall, the below-unity COP observed in the system reflects the cumulative penalty of storage and transfer losses. The dominant role of tank insulation losses, with a smaller pump contribution, suggests that improving insulation quality and optimizing the secondary loop are key levers to enhance overall system performance.
