Article

Enhancing Diabetes Diagnosis Through Machine Learning: A Comparative Study

by
Denisse Enríquez-Ortega
1,
Bryan Chulde-Fernández
1,
Paula Pozo-Coral
1,
Anahí Vaca
1,
Luis Zhinin-Vera
2,
Diego Almeida-Galárraga
1,
Lenin Ramírez-Cando
1,
Andrés Tirado-Espín
3,
Carolina Cadena-Morejón
3,
Fernando Villalba-Meneses
1,
Cesar Guevara
4 and
Patricia Acosta-Vargas
5,*
1
School of Biological Sciences and Engineering, Yachay Tech University, Urcuquí 100651, Ecuador
2
LoUISE Research Group, University of Castilla-La Mancha, 02005 Albacete, Spain
3
School of Mathematical and Computational Sciences, Yachay Tech University, Urcuquí 100651, Ecuador
4
Quantitative Methods Department, CUNEF Universidad, 28040 Madrid, Spain
5
Intelligent and Interactive Systems Laboratory, Universidad de Las Américas, Quito 170125, Ecuador
*
Author to whom correspondence should be addressed.
Appl. Sci. 2025, 15(18), 10087; https://doi.org/10.3390/app151810087
Submission received: 1 August 2025 / Revised: 3 September 2025 / Accepted: 12 September 2025 / Published: 15 September 2025
(This article belongs to the Section Computing and Artificial Intelligence)

Abstract

Diabetes is a chronic metabolic disorder characterized by persistent hyperglycemia. The globally rising prevalence of diabetes has made early and accurate diagnosis imperative to avoid long-term sequelae and decrease the cost burden on health facilities. Machine Learning (ML) has emerged as a highly effective tool of clinical science because of its capability of discovering complex patient data patterns and diagnostic performance optimization. This paper is a comparative performance evaluation of five ML models—Decision Tree (DT), Random Forest (RF), Logistic Regression (LR), K-Nearest Neighbors (KNN), and Multilayer Perceptron (MLP)—utilized for diabetes prediction. Data were processed using the “Healthcare Diabetes Dataset,” made up of eight commonly used clinical parameters. For making the models trustworthy, a strong data preprocessing pipeline was utilized, made up of outlier detection using the Interquartile Range (IQR), normalization of data, and class balancing using the Synthetic Minority Over-sampling Technique (SMOTE). Results reveal that the RF and DT models achieved the highest performance based on accuracy rates of 98.15% and 97.51%, respectively, though more moderate outcomes were recorded by LR and MLP. They reveal the remarkable potential of ML models, particularly ensemble-based ML models such as RF, at supporting early diagnosis of diabetes. When implemented complementarily to clinical decision-making processes, these models can serve a cost-effective and effective replacement of conventional diagnostic methods.

1. Introduction

Diabetes mellitus is a chronic metabolic disorder caused by dysregulation of blood glucose, leading to hyperglycemia or hypoglycemia. If unmanaged, it causes severe complications (heart, kidneys, liver) and increases mortality [1]. According to the IDF Diabetes Atlas 2021, an estimated 537 million adults, aged 20–79, are currently living with diabetes. This number is expected to rise to 643 million by 2030 and 783 million by 2045. Globally, in 2021, diabetes caused 6.7 million deaths and generated approximately USD 966 billion in healthcare expenditures [2]. In Ecuador (INEC data), it was the fourth leading cause of death in 2022 (5100 deaths) and the fifth in 2023 (4460). In 2023, it ranked fifth among men and second among women, highlighting a gender disparity [3,4].
Diabetes arises from either insufficient insulin production by the pancreas or the body’s inability to utilize insulin effectively, leading to dysregulated glucose metabolism [5]. Diabetes has two main types: type 1, an autoimmune destruction of insulin-producing pancreatic β -cells, typically emerging in childhood, and type 2, marked by insulin resistance and linked to obesity, sedentary lifestyles, and poor diet [6]. Early diagnosis is critical to prevent severe complications (e.g., cardiovascular disease, nephropathy), reduce treatment costs, and allow timely interventions, improving results and easing healthcare burdens [7]. In this work, the analysis focuses specifically on Type 2 Mellitus. This specification is supported by the clinical variables available in the dataset glucose concentration, Body Mass Index (BMI), diastolic blood pressure, age, insulin levels, number of pregnancies, and family history which are recognized risk markers of type 2 rather than autoimmune indicators of type 1 diabetes. Furthermore, the dataset population corresponds to adult patients, a group in which type 2 is epidemiologically more prevalent. Consequently, the predictive models developed in this study are oriented toward the identification and risk prediction of type 2, the most common form of diabetes worldwide.
Recent studies have shown that hybrid models combining architectures such as VGG16 and EfficientNetB0, along with channel-based attention modules, can achieve up to 95% accuracy. This highlights the enormous potential of artificial intelligence to improve clinical diagnosis [8].
Machine Learning (ML) has become a vital tool in medical diagnostics, analyzing large clinical datasets to uncover subtle patterns and predict disease progression before symptoms appear. This enables earlier detection, streamlines diagnostic workflows, and supports more effective disease management by reducing healthcare risks and improving patient outcomes [9,10]. In this field, classification algorithms such as Decision Trees (DT) [11], Logistic Regression (LR) [12], Multilayer Perceptron (MLP) [13], K-Nearest Neighbors (KNN) [14], and Random Forest (RF) [15] have been extensively utilized for disease prediction and classification. These models are capable of processing high-dimensional medical data, uncovering complex patterns that may be imperceptible to traditional diagnostic methods [16,17]. The integration of ML in healthcare offers several advantages, including enhanced diagnostic accuracy, reduced processing time, and the ability to analyze large-scale datasets efficiently. This contributes to data-driven decision-making, facilitating more precise and timely disease identification [18]. While achieving high predictive performance is important, clinical applications of machine learning must also be interpretable. For physicians, it is not enough to know that a patient is classified as high risk; it is equally relevant to understand which variables contribute to that prediction. Models that provide transparency strengthen clinical trust, facilitate their incorporation into medical practice, and support preventive or therapeutic decision-making. In this context, highlighting interpretable features such as glucose concentration, body mass index, blood pressure, and age offers greater clinical value compared with opaque “black-box” approaches.
Despite significant advances in the use of machine learning models to diagnose diabetes, there are still important limitations to consider. Many studies rely on small or specific datasets, lack cross-validation, and fail to compare different algorithms with the same rigor. This study aims to address these shortcomings by systematically evaluating five widely used algorithms. To achieve this, we applied data cleaning, normalization, and balancing procedures, and removed variables with low classification power, all with the goal of improving both predictive and clinical performance.

2. Related Works

Diabetes, a prevalent chronic disease with major global health impacts, has seen its prediction and classification transformed by machine learning. These techniques efficiently analyze large clinical datasets, uncovering complex patient patterns and improving diagnostic accuracy [19].
A comparative study of different previous works was conducted. For example, Kaur and Kumari’s work [20] on 768 records of Indian women aged 21 and over employed a linear SVM model that reached 89% accuracy; although the study is relevant, it was based on a homogeneous population and lacked external validation, which limited its generalizability. More complex models include those such as MVA-RNA fusion proposed by Nadeem et al. [21], who explored a more advanced approach by integrating SVM models with artificial neural networks (ANNs) using a set of eight techniques. Their study, which analyzed 10,267 records of patients aged 21–77 years, achieved an exceptional accuracy of 94.67%, demonstrating the effectiveness of combining multiple algorithms to improve diagnostic accuracy; however, their approach did not include systematic preprocessing steps, such as outlier removal or balancing, which could overestimate the predictive ability. Another study explored the use of SVM and K-Nearest Neighbors (KNN), Random Forest, Decision Tree, bagging, and adaboost algorithms on a dataset comprising 788 patient records (ages 21–81), achieving 77% accuracy; this approach remains valuable in clinical applications where model interpretability and ease of implementation are prioritized [22]. In the study by Sarwar et al. [23], a Random Forest (RF) model applied to 700 records yielded 82% accuracy, demonstrating RF’s robustness with complex medical data, but without comparing it to alternative algorithms. Usama and Ghassan further advanced the field by integrating hybrid techniques on 650 records, achieving 94.87% accuracy [24]. Additionally, Gupta et al. leveraged a Multilayer Perceptron (MLP) trained on 768 records (500 non-diabetic, 268 diabetic), reaching 95% accuracy and demonstrating deep learning’s power in capturing intricate clinical patterns [25].
Several studies have demonstrated high classification accuracies by employing different ML approaches. Komal et al. emphasized using clinical parameters (glucose, blood pressure, medical history) for detection, testing Decision Trees (DT), Naïve Bayes (NB), and Neural Networks (NN), with accuracies of 70–80%, highlighting the benefits of classifier ensembles [26]. Another Indian study evaluated six models, RF, MLP, SVM, Gradient Boost (GB), DT, and Logistic Regression (LR), finding RF best at 98%, GB at 97%, SVM at 92%, MLP at 90.99%, DT at 96%, and LR at 69%; a comparative analysis with diabetic retinopathy detection (72% accuracy with deep learning) underscored the context-dependent performance of ML versus DL methods [27,28]. In another work, Zhu [29] evaluated three prediction models Logistic Regression, Random Forest, and a backpropagation neural network using a set of 1879 records and 46 clinical variables. The results showed that Random Forest was the algorithm with the highest performance, reaching 93.7% accuracy and 94.8% in the F1 metric. In parallel, Hasan and Yasmin [30] conducted a study at the Sylhet Diabetes Hospital (Bangladesh) with data from 520 patients, where the models based on Random Forest and Decision Trees exceeded 98% accuracy, above classical methods such as Logistic Regression or SVMs. Although both studies confirm the robustness of the tree-based and ensemble approaches, the validity of their results may be restricted due to the local nature of the samples used.
Despite the promising performance reported in these works, important limitations must be acknowledged. Many rely on small or population specific datasets (e.g., Kaur and Kumari [19]), limiting generalizability. A lack of rigorous cross-validation weakens statistical robustness. Although models like RF [22] and hybrid approaches [23] report high accuracies, they often omit analysis of irrelevant variables that can degrade model efficiency. For instance, Gupta et al. [24] do not detail essential preprocessing (outlier removal, class balancing). Moreover, the interpretability of deep neural networks remains limited [26,27], complicating their clinical adoption. Another recurring deficiency is the lack of comparative analyses where multiple algorithms are evaluated under identical preprocessing and evaluation protocols, which is essential for establishing key benchmarks. Table 1 summarizes different previous works detailing the machine learning models used, the implementation language or platform, and the reported evaluation parameters. This comparison not only allows us to observe which approaches have been the most common but also to evaluate their limitations and differences in terms of performance. These gaps highlight the need for more comprehensive methodologies, diverse data, rigorous preprocessing, and critical feature analysis to develop models that are both accurate and clinically useful.
Our study addresses these limitations by systematically evaluating five widely used algorithms (DT, RF, LR, KNN, and MLP) on the Diabetes in Healthcare Dataset, applying a rigorous selection process that includes data cleaning, normalization, outlier removal, and class balancing. Furthermore, we emphasized the clinical parameters most associated with diabetes risk, such as glucose and BMI, which improves model interpretability. This comprehensive approach provides methodological rigor and clinical relevance, positioning our contribution as a robust and novel comparative framework for diabetes prediction.

3. Materials and Methods

3.1. Library Versions

In this study, the following Python libraries were used for data analysis and visualization: Pandas (v2.2.2) for data manipulation, NumPy (v2.0.2) for numerical computations, Matplotlib (v3.10.0) and Seaborn (v0.13.2) for generating visualizations, Scikit-learn (v1.6.1) for machine learning algorithms, Imbalanced-learn (v0.14.0) for handling imbalanced data, and Plotly (v5.24.1) for interactive plots.

3.2. Data Analysis

The dataset was originally collected by the National Institute of Diabetes and Digestive and Kidney Diseases (NIDDK) and was accessed through the Healthcare Diabetes Dataset on Kaggle [31], which includes eight clinical variables and a binary label (0 = no diabetes, 1 = diabetes) in Table 2. It was chosen for its wealth of attributes and widespread use in medical studies with ML. The original dataset has a size of 2768 rows and 10 columns. After dividing the data and removing the “Id” column, the training set X_train initially had a size of 2214 rows and 8 columns (not counting the output column), and the test set X_test had a size of 554 rows and 8 columns.
The processed dataset was divided into training and test sets using train_test_split. The stratification strategy (stratify = y) was implemented during the split to ensure that the proportion of the target variable classes (Outcome) was kept similar in both sets, while preserving the original distribution of the classes for a more realistic evaluation. In addition, to avoid data leakage, the following preprocessing steps were applied only to the training set.

3.3. Outlier Removal—Training Set

Outliers were identified and removed using the Interquartile Range (IQR) method, a robust statistical approach for detecting extreme values [32]. The IQR is defined as the difference between the third quartile Q 3 and the first quartile Q 1 :
I Q R = Q 3 Q 1
An observation x was considered an outlier if it fell outside the following range:
Q 1 1.5 × I Q R x Q 3 + 1.5 × I Q R
Applying this method, 409 extreme values were removed from the dataset, reducing the total number of instances from 2214 to 1805. This step ensured a more uniform and representative data distribution, minimizing potential biases in model training. The numerical features of the processed training set (without outliers) were scaled using StandardScaler. It is crucial to highlight that the scaler was fitted only on the processed training set, and then applied to transform both the processed training set and the original test set. StandardScaler standardizes features by removing the mean and scaling to unit variance, which is a common requirement for many machine learning estimators:
x = x μ σ
where μ is the mean and σ is the standard deviation. This transformation preserved relative relationships between values while mitigating the impact of varying scales across features.

3.4. Data Balancing-Training Set

A preliminary analysis of the dataset revealed a strong imbalance between classes, with many more non diabetic than diabetic subjects, which may bias the model towards the majority class and decrease its ability to detect positive cases. To mitigate this issue, the Synthetic Minority Over-sampling Technique (SMOTE) was applied to the training set. SMOTE works by creating synthetic instances of the minority class (diabetic cases) based on the existing minority class examples [33]. Given a training dataset with N t r a i n , 0 non-diabetic cases and N t r a i n , 1 diabetic cases, SMOTE generates new synthetic samples for the minority class until the classes are balanced, aiming to achieve a balanced training set where:
N t r a i n , 0 N t r a i n , 1
where N t r a i n , 0 and N t r a i n , 1 represent the approximate new sample sizes for each class in the balanced training set. In this study, after applying SMOTE to the training data (which had outliers removed and scaled), the training set was adjusted to contain an equal number of non-diabetic and diabetic cases, specifically N t r a i n , 0 = N t r a i n , 1 = 1248 . This oversampling approach helps to address the class imbalance by providing the model with a more balanced representation of both classes during training, improving its ability to learn the characteristics of the minority class and enhancing its predictive performance, particularly sensitivity (recall) for the minority class, which is crucial in a diagnostic context. It is important to note that SMOTE was applied only to the training data to avoid data leakage and ensure that the evaluation metrics on the test set are representative of the model’s performance on unseen, imbalanced data. Finally, k-fold stratified cross-validation (k = 5) was performed on the preprocessed and SMOTE-balanced training set to robustly analyze the performance of various machine learning models.

3.5. Performance Evaluation-Training Set

After dataset preparation, multiple machine learning models are trained and optimized (including LR, DT, RF, MLP, and KNN). The performance of these models is rigorously evaluated using several statistical metrics, which provide a comprehensive assessment of predictive capability [34]:
  • Accuracy (ACC): Measures overall classification performance.
    A C C = T P + T N T P + T N + F P + F N
  • Sensitivity (Recall, SEN): Evaluates the model’s ability to correctly identify diabetic patients.
    S E N = T P T P + F N
  • F1 Score (F1): Balances precision and recall, providing a more robust measure of model effectiveness.
    F 1 = 2 × Precision × Recall Precision + Recall
  • Area Under the Curve (AUC): Quantifies the model’s ability to distinguish between positive and negative cases.
  • Brier Score (BS): Measures the calibration of predicted probabilities, where lower values indicate better reliability.
    B S = 1 N i = 1 N ( p i y i ) 2
  • Matthews Correlation Coefficient (MCC): A robust metric for imbalanced datasets, reflecting the quality of predictions.
    M C C = T P · T N F P · F N ( T P + F P ) ( T P + F N ) ( T N + F P ) ( T N + F N )
The experimental evaluation aims to determine whether or not excluding weakly correlated features enhances classification performance, ensuring that models are accurate and interpretable.

3.6. Structure of the Models

This section provides a brief description of the design or configuration of each of the models that were used in the study.

3.6.1. Logistic Regression (LR)

For the Logistic Regression model, L2 (Ridge) regularization was implemented to minimize overfitting by penalizing the model’s coefficients. The cost function optimization was performed using the ’lbfgs’ algorithm, an efficient quasi-Newton method for such problems. The inverse regularization parameter, C, was set to 1.0. Finally, a maximum of 1000 iterations was configured to ensure the optimizer’s full convergence and prevent premature termination during training [35].

3.6.2. Decision Tree (DT)

The Decision Tree classifier was configured to evaluate split quality using the Gini index as the criterion function. At each node, the best possible split among all features was selected using the ’best’ strategy. No maximum depth limit was imposed on the tree (max_depth = None), allowing it to expand until all leaves were pure or contained fewer than two samples. Pruning parameters were set with a minimum of two samples required to split a node (min_samples_split = 2) and a minimum of one sample per leaf node (min_samples_leaf = 1) [36].

3.6.3. Random Forest (RF)

A Random Forest classifier composed of 100 decision trees (n_estimators = 100) was employed to enhance the model’s robustness and accuracy. Each tree was constructed using the Gini index as the split quality metric and was allowed to grow without a predefined depth limit (max_depth = None). The construction of individual trees followed the same splitting conditions as the single Decision Tree model, requiring a minimum of two samples to split a node and one sample per leaf. Additionally, bootstrapping (bootstrap = True) was used to generate the training data subsets for each tree [37].

3.6.4. K-Nearest Neighbors (KNN)

For the K-Nearest Neighbors classification, the model was configured to base its predictions on the 5 nearest neighbors (n_neighbors = 5). The prediction was determined by uniform weighting (weights = ’uniform’), where each neighbor within the decision radius has equal influence. The distance between the data points was calculated using the Euclidean metric, which corresponds to the power parameter p = 2 of the Minkowski distance. The algorithm selection for neighbor search was set to ’auto’, allowing the system to choose the most efficient structure (e.g., BallTree, KDTree) based on the input data [38].

3.6.5. Multi-Layer Perceptron (MLP)

The network architecture consisted of a single hidden layer with 100 neurons. The Rectified Linear Unit (ReLU) was used as the activation function for this layer. The weight optimization process was managed by the ’adam’ optimizer, a variant of stochastic gradient descent. To control overfitting, an L2 regularization term with an alpha parameter of 0.0001 was applied. A limit of 1000 iterations was set as the maximum for the training process, thus ensuring sufficient time for model convergence [39].

3.6.6. Summary of Hyperparameter Configuration

Table 3 summarizes the main hyperparameters used for each machine learning model implemented in this study, along with the chosen values, their justification, and relevant references. The selection of these hyperparameters follows the recommendations from the official scikit-learn documentation and established literature, ensuring a robust and reproducible experimental setup.

4. Result

The achieved results in the experimentation for the classification models are shown in Table 4 and Table 5. On each model, the following were computed: precision, recall, F1 Score, accuracy, specificity, AUC, Brier Score, Matthews Correlation Coefficient (MCC). These indicators make it possible to estimate a general performance for each algorithm, taking into account a set of features for classification. The table shows up the respective values for the five analyzed models: Logistic Regression, Decision Tree, Random Forest, KNN, and MLP. Both show their respective numeric outputs for those aforementioned metrics, providing an indicative summary for the achieved performance in the analyzed dataset.
After observing the initial performance of the models, in particular the relatively low accuracy of Logistic Regression, the hypothesis was proposed that eliminating characteristics with low correlation could improve the model’s performance [40]. To examine this possibility, the correlation matrix between the predictor variables and the target variable (Outcome) was calculated. The objective was to identify the feature with the lowest absolute correlation with the Outcome variable, with the intention of eliminating it and performing an analysis to determine whether or not this action resulted in an improvement in the classification metrics of the models.

4.1. Correlation Matrix

The correlation matrix is a statistical tool used to quantify the linear relationship between numerical features in the dataset and the target variable. It provides valuable insights into the strength and direction of associations among variables, guiding feature selection and dimensionality reduction. Figure 1 presents the computed correlation matrix for the dataset. Mathematically, the correlation coefficient between two variables, X and Y, is given by the Pearson correlation formula [41]:
ρ ( X , Y ) = ( X i X ¯ ) ( Y i Y ¯ ) ( X i X ¯ ) 2 ( Y i Y ¯ ) 2
where X ¯ and Y ¯ denote the mean values of the respective variables. The coefficient ρ ( X , Y ) takes values in the range [ 1 , 1 ] , where:
  • ρ ( X , Y ) > 0 indicates a positive correlation (as one variable increases, the other tends to increase).
  • ρ ( X , Y ) < 0 indicates a negative correlation (as one variable increases, the other tends to decrease).
  • ρ ( X , Y ) 0 suggests no significant linear relationship between the variables.
Among the variables with the highest association to the diagnosis of diabetes, glucose level presented the highest positive correlation ( ρ = 0.50 ), consolidating as the main predictor; this suggests that people with elevated blood glucose values have a significantly higher risk of developing the disease. Body Mass Index (BMI) showed a moderate correlation ( ρ = 0.25 ), indicating that an increase in BMI is related to a higher probability of diabetes. Additionally, the number of pregnancies ( ρ = 0.23 ) and age ( ρ = 0.29 ) registered weak but appreciable correlations, indicating that, although they contribute to the prediction model, their individual impact is relatively limited.
Figure 1. Heatmap of the correlation matrix for variables associated with diabetes.
Applsci 15 10087 g001
In contrast, certain variables showed practically zero correlation with the diagnosis of diabetes; for example, Skin Thickness ( ρ = 0.04 ) presented an almost nonexistent linear relationship with the target variable, evidencing its low predictive capacity. Thanks to the analysis of the correlation matrix, feature selection was refined to prioritize more informative attributes and discard redundant or weakly correlated ones. This step optimizes the efficiency and improves the predictive accuracy of the machine learning models.

4.2. Reduced Feature Set

In this stage, new results were obtained after removing the variable Skin Thickness to evaluate its influence on the classification process. Table 6 and Table 7 report the corresponding values for the five analyzed models: Logistic Regression, Decision Tree, Random Forest, KNN, and MLP, providing a comparative summary of the achieved performance under this new feature configuration.

4.3. Statistical Tests

4.3.1. Full Features Set

The Friedman test was applied to detect significant differences between models. The results, shown in Table 8, indicate significant differences ( p < 0.05 ) across all metrics.
Post hoc Nemenyi tests identified significant differences between model pairs. For instance, for AUC and F1-Score, Random Forest and MLP significantly outperformed Logistic Regression ( p < 0.05 ), while Decision Tree showed inferior performance across multiple metrics.

4.3.2. Reduced Feature Set

The analysis was repeated, excluding Skin Thickness. The Friedman test results (Table 9) again showed significant differences ( p < 0.05 ) for all metrics.
Nemenyi post hoc tests revealed that Random Forest maintained superior performance in AUC and F1-Score, while excluding Skin Thickness did not significantly alter model differences, suggesting this variable has minimal impact on overall performance.

4.4. Curve Analysis

Cross-validation was used to analyze the performance of the classification models. The models were compared using metrics such as accuracy, recall, specificity, and F1-score.
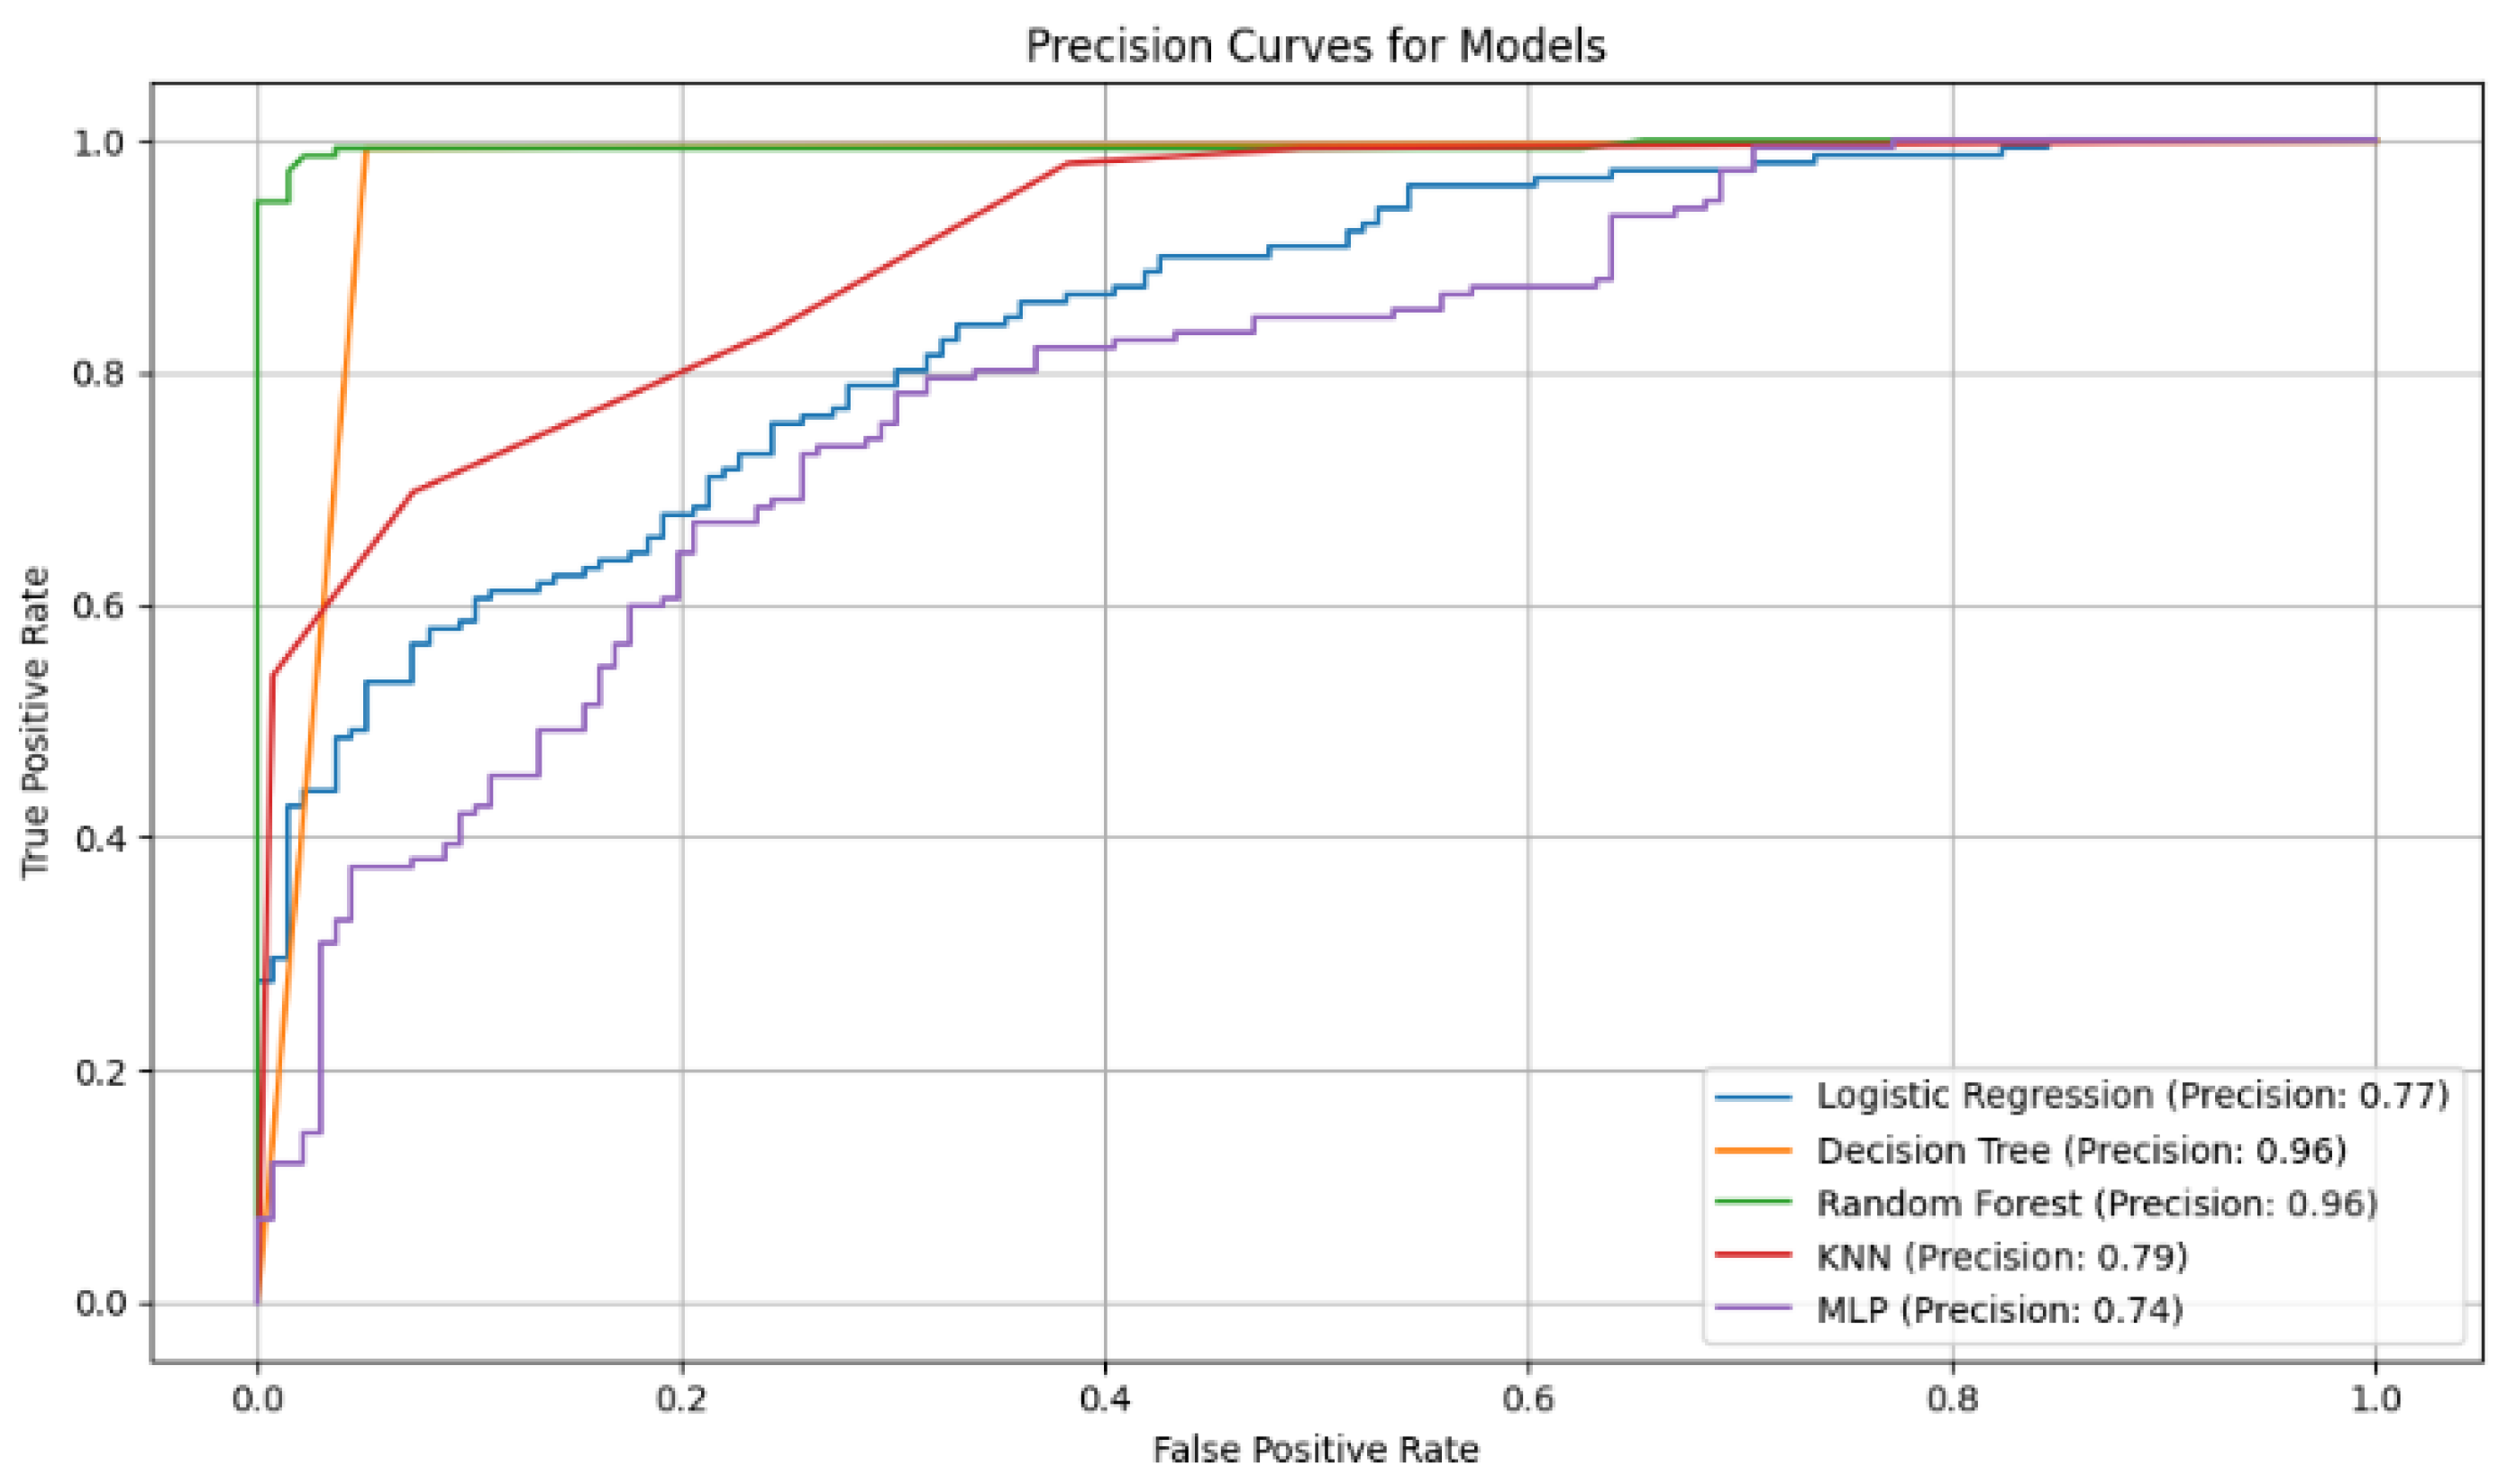
Our analysis revealed a clear superiority of tree-based algorithms. As can be seen in Figure 2, the model that ranks first is the Random Forest (RF) model, which achieved an exceptional accuracy of 98.2%. It was followed closely by the Decision Tree (DT) model, with a robust accuracy of 97.5%. The Multi-Layer Perceptron (MLP) model also demonstrated high performance, obtaining an accuracy of 97.4%, almost on par with the tree models. In contrast, the performance of the other algorithms was more moderate and lower than the previous ones. The K-Nearest Neighbors (KNN) model achieved 89.4% accuracy, while the Logistic Regression (LR) model lagged notably behind with 75.9%, being the lowest of all the models evaluated.
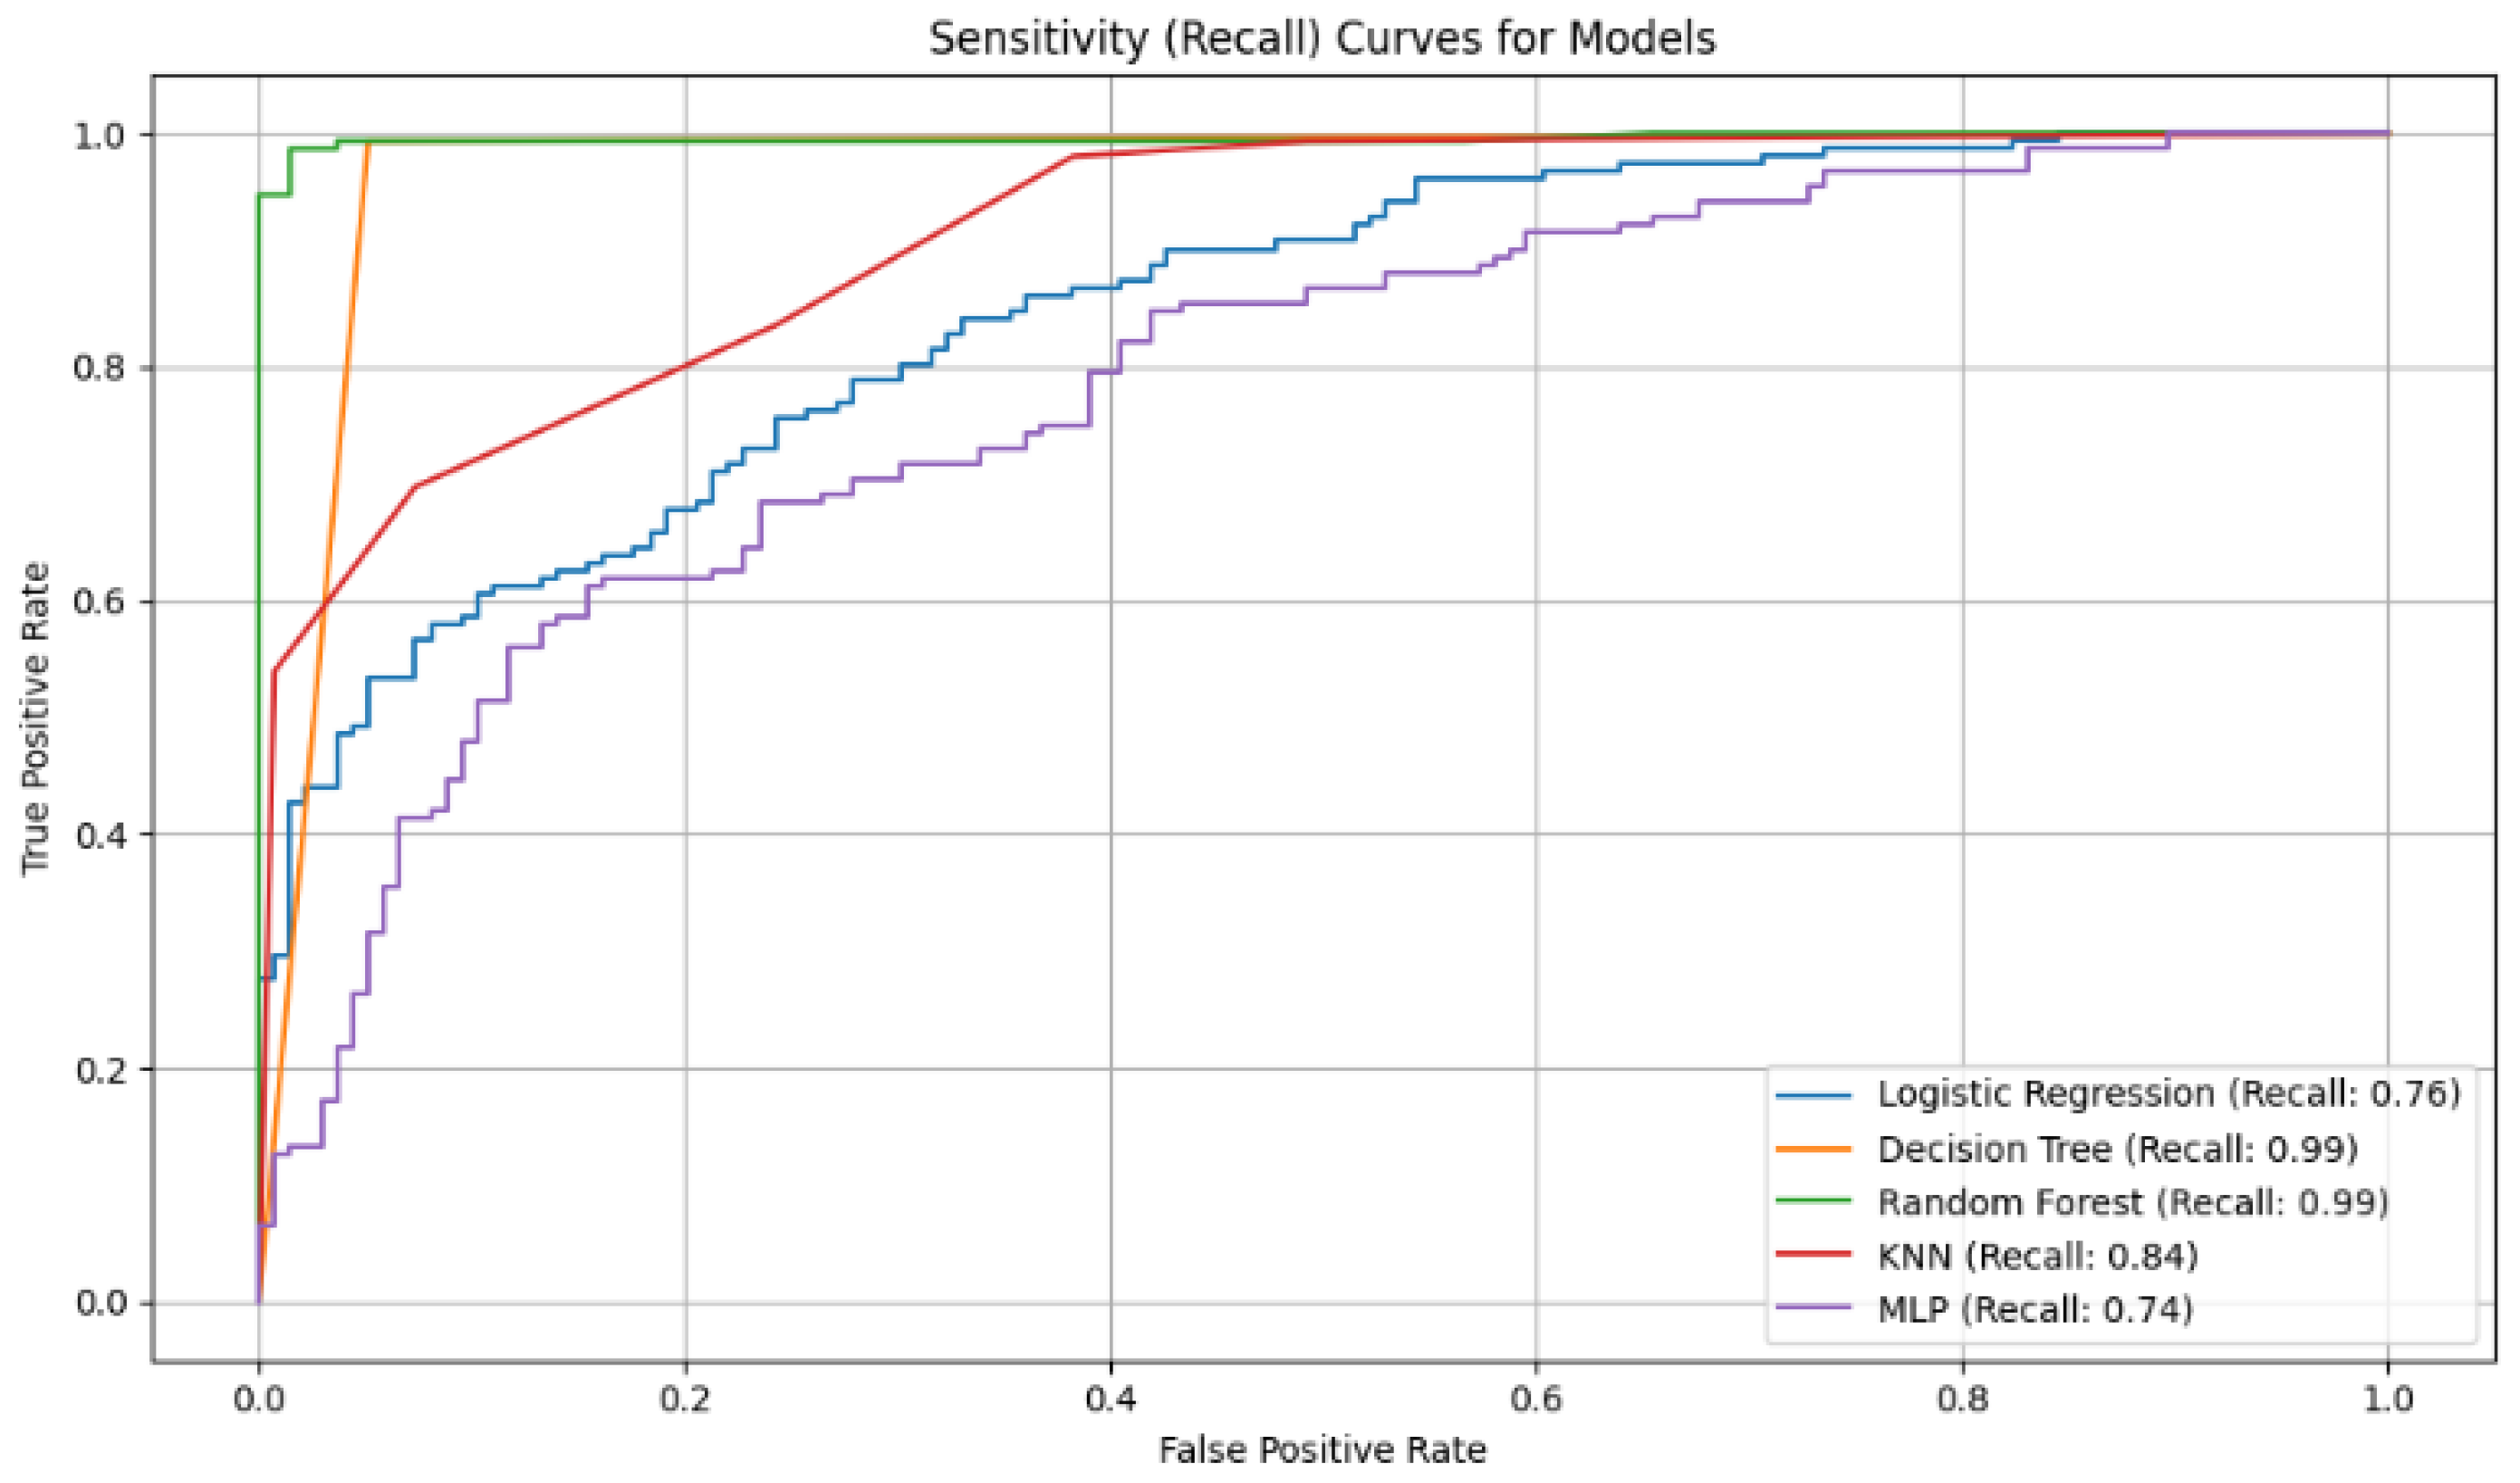
The analysis of the results graphs confirmed these conclusions: the recall curves (Figure 3) demonstrated the models’ ability to minimize false negatives, while the specificity curves (Figure 4) corroborated their effectiveness in reducing false positives. Likewise, the high F1-Score values (Figure 5) showed an optimal balance between precision and recall. These findings indicate that architectures capable of modeling complex non-linear relationships are better adapted to the nature of the data.

ROC Curves

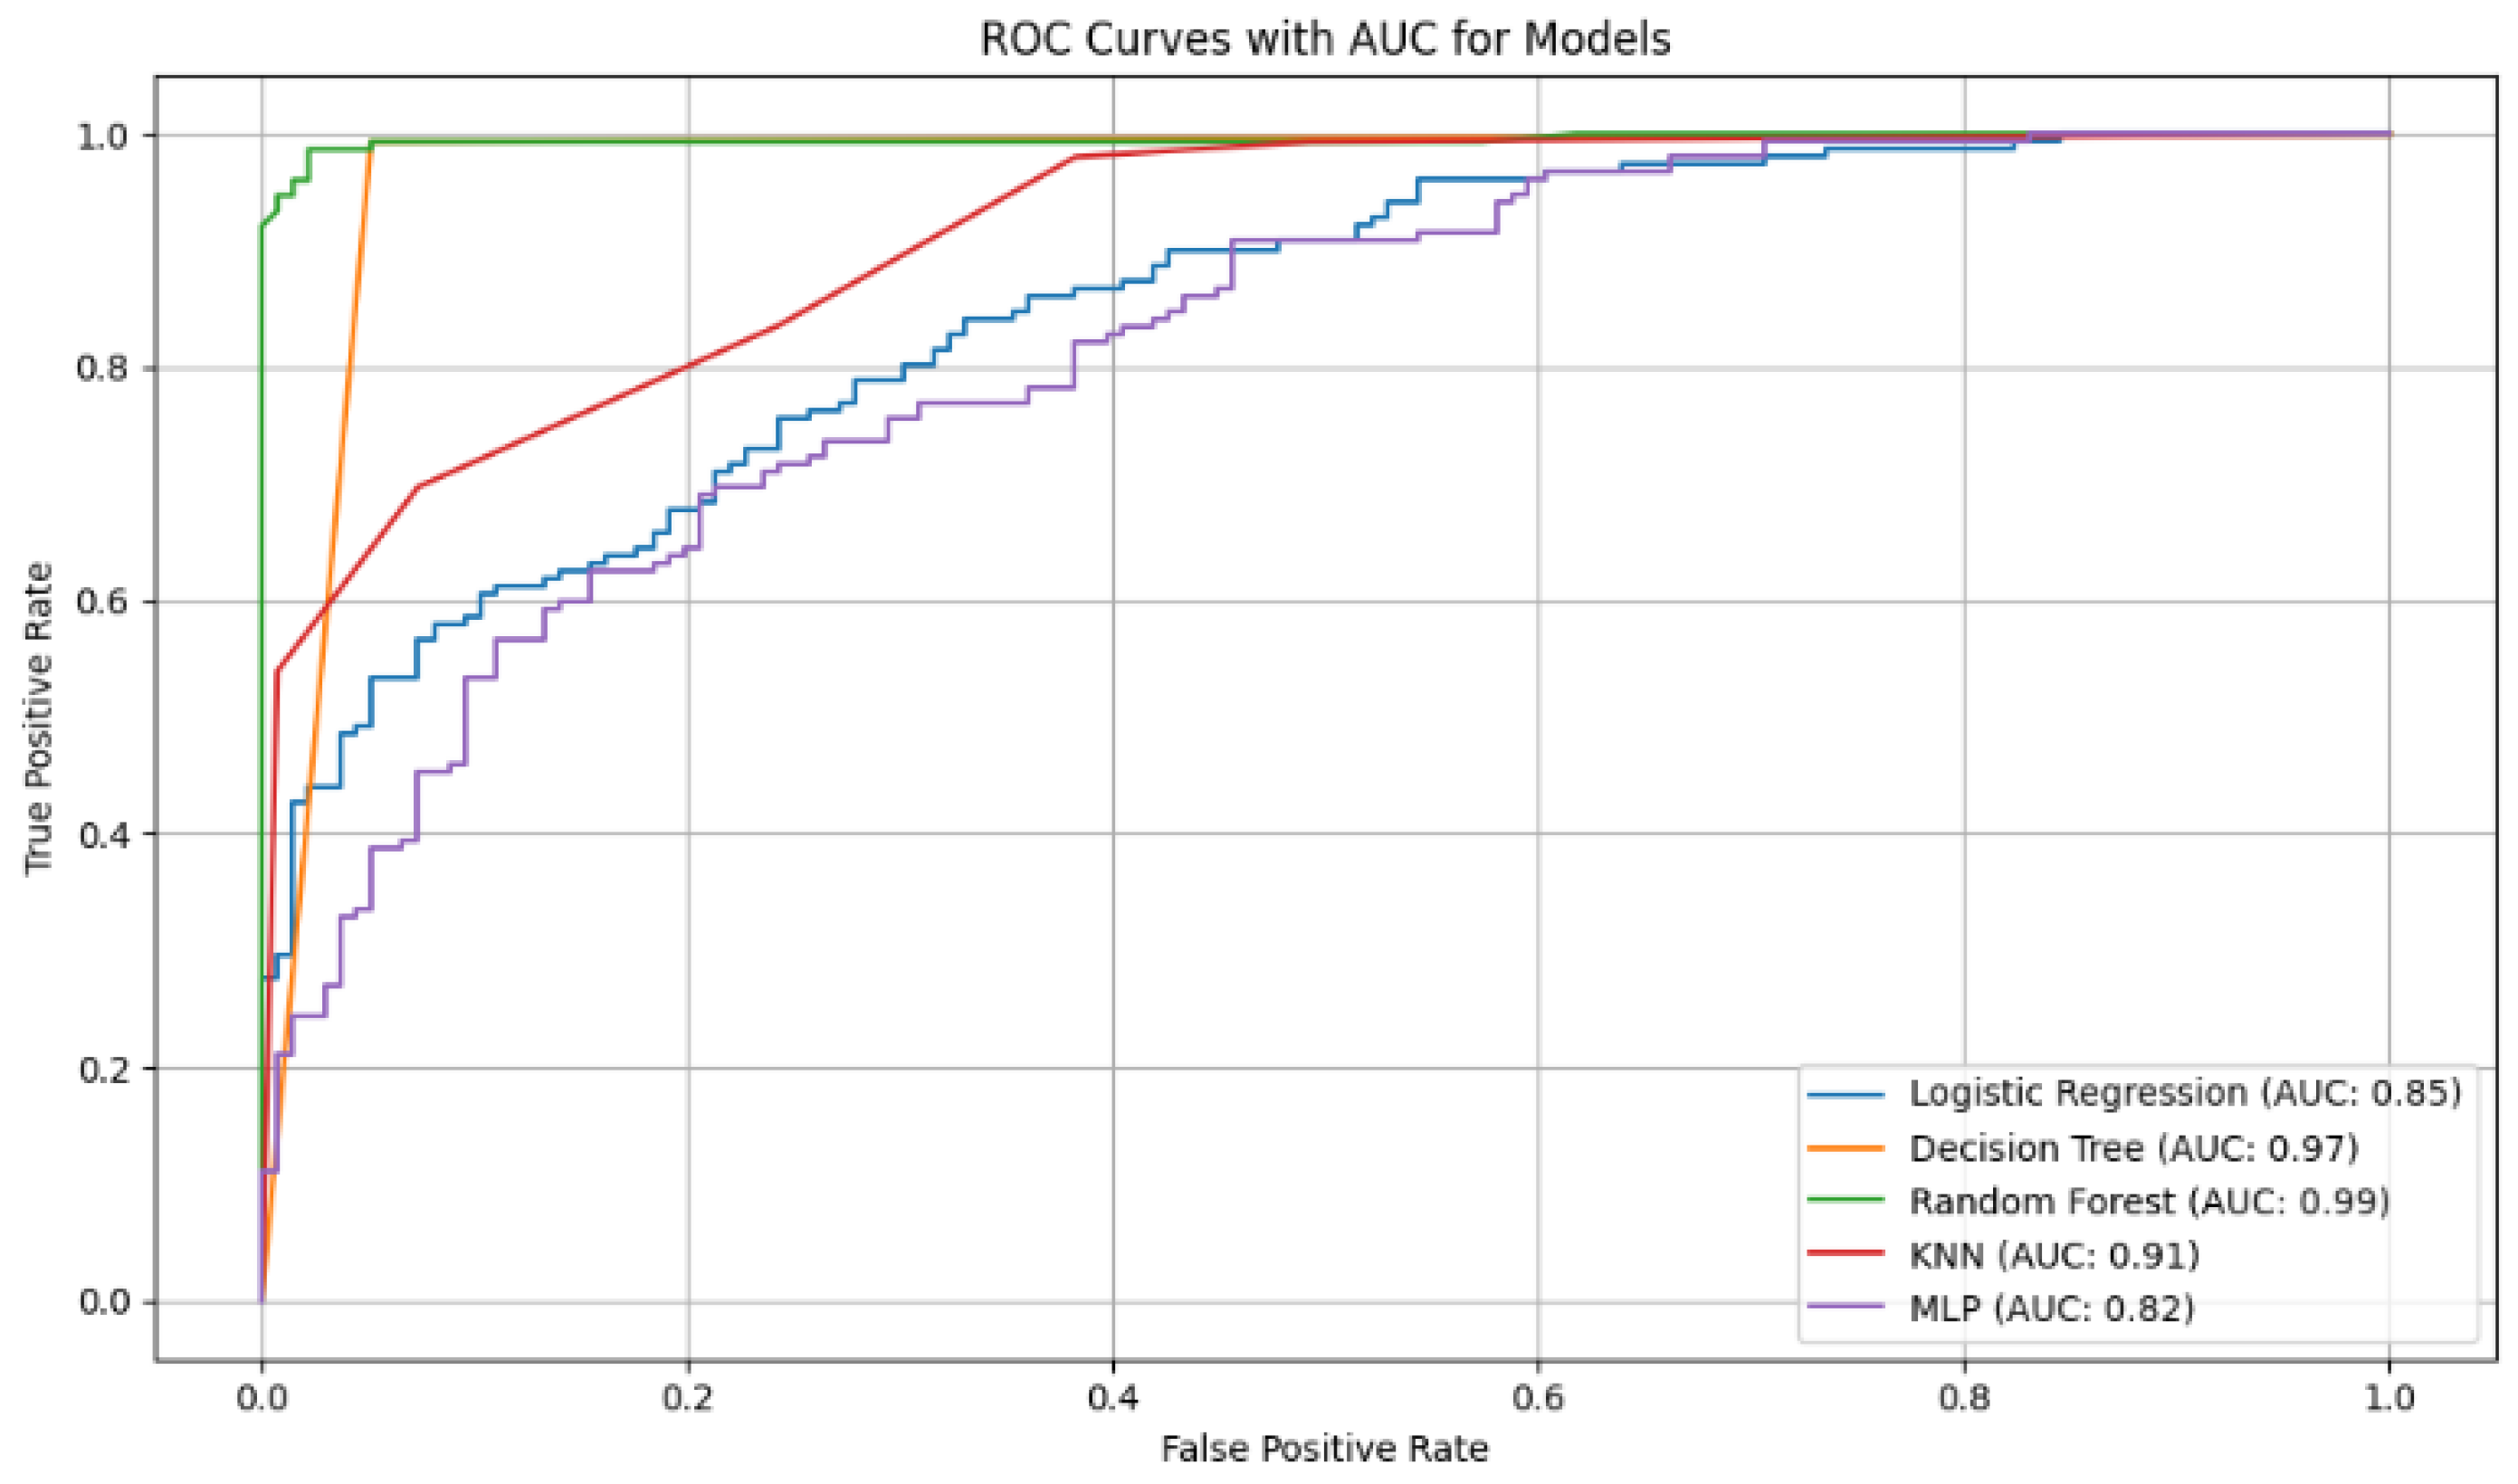
To complement the evaluation, Receiver Operating Characteristic (ROC) curves were generated to visualize the ability of each classifier to discriminate between classes.
Figure 6 illustrates the performance of all the models. In it, the Random Forest (AUC = 0.998) and Decision Tree (AUC = 0.975) models stand out as the best-performing models. Their curves are notably close to the upper-left corner, which indicates a high true positive rate alongside a low false positive rate. The nearly flawless AUC value of the Random Forest (RF) model confirms it as the most robust model. On the other hand, the curve for the Logistic Regression model (AUC = 0.852), while acceptable, is significantly further from the high-performing models, revealing a higher proportion of false positives for the same true positive rate.

5. Discussion

The Random Forest (RF) model was the best for predicting type 2 diabetes, with an accuracy of 98.1% and a nearly perfect result on the AUC plot (0.998), which highlighted it as the most robust and efficient classifier. Additionally, the Decision Tree (DT) model also performed excellently, with an accuracy of 97.5% and an AUC of 0.975. The almost flawless performance of these models shows they are especially well-suited for finding complex patterns in pathophysiological data. In particular, the ensemble architecture of the Random Forest model, which averages the predictions of multiple uncorrelated trees, achieves a drastic reduction in variance and high resistance to overfitting, a phenomenon widely documented in the literature [37].
Unlike the tree-based models, Logistic Regression (LR) performed significantly worse. Its accuracy was a mere 75.9% and the AUC reached 0.852. These values show a clear disadvantage compared to the more robust models. This also suggests that linear approaches are not the most suitable for describing complex biological phenomena, which often involve interactions between variables and non-linear thresholds that are difficult for such a restrictive model to capture. On the other hand, the performance of the K-Nearest Neighbors (KNN) and Multi-Layer Perceptron (MLP) models also failed to match the effectiveness of the tree-based models. This could be attributed to KNN’s sensitivity to dimensionality and the need for more exhaustive hyperparameter tuning in the case of MLP [38,39].
Our results stand out for their robustness and performance, positioning them favorably against other approaches. Our RF model conclusively surpasses the results of Sisodia and Sisodia [21], who reported an accuracy of 76.8% with Naive Bayes, and those of Zou et al. [22], who achieved 81.25% with a DT model. More notably, our 98.1% performance with RF is substantially higher than the 82% obtained by Sarwar et al. [23] and the 93.7% by Zhu [29], both using RF in similar contexts. This improvement is due to a careful preprocessing pipeline, which included filling in missing data, removing outliers using a statistical criterion based on quartiles, and, crucially, balancing the classes with the SMOTE (Synthetic Minority Over-sampling Technique), which prevents the model from being biased towards the majority class.
It is essential to contextualize the work of Gupta et al. [25], who reported an accuracy of 95% with an MLP. Although this is a solid result, it was obtained from a significantly smaller and more imbalanced dataset (500 negative and 268 positive records). Such a configuration considerably increases the risk of overfitting, where the model memorizes the noise of the training set instead of learning generalizable patterns, thereby compromising its external validity. Our approach, by using 5-fold cross-validation, provides a more reliable and robust estimate of the model’s performance on unseen data.
During the exploratory analysis phase, we investigated the hypothesis that removing variables with low correlation could optimize performance, particularly for the LR model, whose initial accuracy was approximately 0.7. A Pearson correlation matrix was used to identify predictors with a weak linear association with the target variable. This strategy is based on feature selection principles, suggesting that irrelevant variables can introduce stochastic noise and degrade model performance, a concept explored by Blessie and Karthikeyan [40]. However, empirical tests showed that excluding these variables did not produce a significant improvement in the high-performing models (RF and DT), with accuracy variations on the order of thousandths. Consequently, we chose to retain the full set of features to preserve maximum clinical information and avoid the premature exclusion of variables that might have important non-linear interactions. Statistically, DT and RF were found to be superior: Friedman’s test revealed significant differences between the five models in metrics such as AUC and F1 (p < 0.05), and Nemenyi’s post hoc comparisons corroborated that RF was significantly higher than LR, indicating that tree-based methods better understand pathophysiological complexity and that the detected effect is not an artifact of the dataset.
The analysis of the ROC curves corroborates these findings. The AUC of 0.998 for the RF model indicates a nearly perfect discrimination ability, which in a clinical setting translates to high confidence in distinguishing between healthy and diabetic patients across a wide spectrum of decision thresholds. The statistically significant difference between the AUC of RF/DT and that of LR confirms that the superiority of the tree-based models is not a random artifact but a direct consequence of their greater capacity to model the complexity inherent in the diagnostic problem.

Limitations of the Study

This study has some important limitations. First, the analysis was conducted solely with the Kaggle Healthcare Diabetes dataset. Although this dataset is widely used in research, it corresponds to a specific population and does not reflect the diversity of diabetic patients in other contexts, which limits the generalizability of the results. Finally, the analysis only included clinical variables in tabular format and excluded other sources of information, such as medical images or genetic markers.

6. Conclusions

In our analysis, we were able to confirm that machine learning models, especially all those based on ensembles like the Decision Tree (DT) and Random Forest (RF), have superior diagnostic performance for the early detection of type 2 diabetes. We achieved accuracies above 97% with both models and, most importantly, they showed great robustness by maintaining an excellent balance between sensitivity and specificity. Thanks to this balance, the models are highly effective at reducing both false positives and false negatives, a weak point we noted in more traditional models like Logistic Regression (LR), K-Nearest Neighbors (KNN), and Multi-Layer Perceptron (MLP), which remained at a more modest performance level. This leads us to conclude that the ability of DT and RF to decipher complex clinical patterns is what really makes the difference and turns them into such powerful tools.
From a clinical perspective, the findings indicate that tree-based models could be a cost-effective option for the initial screening of at-risk patients. Their integration into Electronic Health Record (EHR) systems would allow for the generation of automatic alerts based on common variables—such as glucose levels, Body Mass Index (BMI), and age. Thus, they would not replace a physician’s diagnosis but would function as a support tool to prioritize confirmatory tests, facilitate early interventions, and reduce the economic and healthcare burden on health systems.
For future work, it is recommended to expand and diversify the datasets to ensure the generalizability of the models across different populations, as well as to perform external validations in real-world clinical settings. It would also be useful to optimize their hyperparameters, include new predictive variables (such as family history, dietary habits, or physical activity), and explore more advanced architectures. Finally, the use of interpretability techniques like SHAP or LIME will be essential to increase the confidence of healthcare personnel and promote the adoption of these models in clinical practice.

Author Contributions

Conceptualization, D.E.-O., B.C.-F., P.P.-C., A.V., L.Z.-V., D.A.-G., L.R.-C., A.T.-E., C.C.-M., F.V.-M., C.G. and P.A.-V.; methodology, D.E.-O., B.C.-F., P.P.-C., A.V., L.Z.-V., D.A.-G., L.R.-C., A.T.-E., C.C.-M., F.V.-M., C.G. and P.A.-V.; software, D.E.-O., B.C.-F., P.P.-C., A.V., L.Z.-V., D.A.-G., L.R.-C., A.T.-E., C.C.-M., F.V.-M., C.G. and P.A.-V.; validation, D.E.-O., B.C.-F., P.P.-C., A.V., L.Z.-V., D.A.-G., L.R.-C., A.T.-E., C.C.-M., F.V.-M., C.G. and P.A.-V.; formal analysis, D.E.-O., B.C.-F., P.P.-C., A.V., L.Z.-V., D.A.-G., L.R.-C., A.T.-E., C.C.-M., F.V.-M., C.G. and P.A.-V.; investigation, D.E.-O., B.C.-F., P.P.-C., A.V., L.Z.-V., D.A.-G., L.R.-C., A.T.-E., C.C.-M., F.V.-M., C.G. and P.A.-V.; resources, D.E.-O., B.C.-F., P.P.-C., A.V., L.Z.-V., D.A.-G., L.R.-C., A.T.-E., C.C.-M., F.V.-M., C.G. and P.A.-V.; Data curation, D.E.-O., B.C.-F., P.P.-C., A.V., L.Z.-V., D.A.-G., L.R.-C., A.T.-E., C.C.-M., F.V.-M., C.G. and P.A.-V.; writing—original draft, D.E.-O., B.C.-F., P.P.-C., A.V., L.Z.-V., D.A.-G., L.R.-C., A.T.-E., C.C.-M., F.V.-M., C.G. and P.A.-V.; writing—review & editing, D.E.-O., B.C.-F., P.P.-C., A.V., L.Z.-V., D.A.-G., L.R.-C., A.T.-E., C.C.-M., F.V.-M., C.G. and P.A.-V.; visualization, D.E.-O., B.C.-F., P.P.-C., A.V., L.Z.-V., D.A.-G., L.R.-C., A.T.-E., C.C.-M., F.V.-M., C.G. and P.A.-V.; supervision, D.E.-O., D.A.-G., A.T.-E., C.C.-M., F.V.-M. and C.G.; project administration, D.A.-G. and F.V.-M.; funding acquisition, C.G. and P.A.-V. All authors have read and agreed to the published version of the manuscript.

Funding

This research was funded by Universidad de Las Américas—Ecuador as part of the internal research project 489. A.XIV.24.

Data Availability Statement

The original data presented in the study are openly available in “Healthcare Diabetes Dataset” at https://www.kaggle.com/datasets/nanditapore/healthcare-diabetes?resource=download, accessed on 11 September 2025.

Conflicts of Interest

The authors declare no conflict of interest.

References

  1. Shafi, S.; Ansari, G.A. Early Prediction of Diabetes Disease & Classification of Algorithms Using Machine Learning Approach. SSRN, 2021; preprint. [Google Scholar] [CrossRef]
  2. International Diabetes Federation. IDF Diabetes Atlas, 8th ed.; International Diabetes Federation: Brussels, Belgium, 2017; ISBN 978-2-930229-87-4. Available online: https://diabetesatlas.org (accessed on 11 September 2025).
  3. Pan American Health Organization. Diabetes in the Americas. Available online: https://www.paho.org/en/topics/diabetes (accessed on 11 September 2025).
  4. Logo, C.D.; Chávez, A.; Logo, D.d.R. Análisis espacio-temporal de morbimortalidad por Diabetes Mellitus Tipo 2 en Ecuador 2015–2020. Sitio Princ. 2022, 7, 2037–2083. [Google Scholar]
  5. Egan, A.M.; Dinneen, S.F. What is diabetes? Medicine 2022, 50, 615–618. [Google Scholar] [CrossRef]
  6. Banday, M.Z.; Sameer, A.S.; Nissar, S. Pathophysiology of diabetes: An overview. Avicenna J. Med. 2020, 10, 174–188. [Google Scholar] [CrossRef] [PubMed]
  7. Alam, T.M.; Iqbal, M.A.; Ali, Y.; Wahab, A.; Ijaz, S.; Baig, T.I.; Hussain, A.; Malik, M.A.; Raza, M.M.; Ibrar, S.; et al. A model for early prediction of diabetes. Inform Med. Unlocked 2019, 16, 100204. [Google Scholar] [CrossRef]
  8. Mounika, S.; RaviSankar, V. Diabetic Retinopathy Detection using the Genetic Algorithm and a Channel Attention Module on Hybrid VGG16 and EfficientNetB0. Eng. Technol. Appl. Sci. Res. 2025, 15, 21319–21325. [Google Scholar] [CrossRef]
  9. Llaha, O.; Rista, A. Prediction and detection of diabetes using machine learning. In Proceedings of the CEUR Workshop Proceedings, RTA-CSIT 2021, Tirana, Albania, 21 May 2021; CEUR-WS.org: Aachen, Germany, 2021; Volume 2872, pp. 94–102. Available online: https://ceur-ws.org/Vol-2872/paper13.pdf (accessed on 11 September 2025).
  10. Ma, J. Machine Learning in Predicting Diabetes in the Early Stage. In Proceedings of the 2nd International Conference on Machine Learning, Big Data and Business Intelligence (MLBDBI 2020), Taiyuan, China, 23–25 October 2020; pp. 167–172. [Google Scholar] [CrossRef]
  11. Saud, A.S.; Shakya, S.; Neupane, B. Analysis of Depth of Entropy and GINI Index Based Decision Trees for Predicting Diabetes. Indian J. Comput. Sci. 2021, 6, 19–28. [Google Scholar] [CrossRef]
  12. Rajendra, P.; Latifi, S. Prediction of diabetes using logistic regression and ensemble techniques. Comput. Methods Programs Biomed. Update 2021, 1, 100032. [Google Scholar] [CrossRef]
  13. Chang, V.; Bailey, J.; Xu, Q.A.; Sun, Z. Pima Indians diabetes mellitus classification based on machine learning (ML) algorithms. Neural Comput. Appl. 2023, 35, 1–17. [Google Scholar] [CrossRef]
  14. Suyanto, S.; Meliana, S.; Wahyuningrum, T.; Khomsah, S. A new nearest neighbor-based framework for diabetes detection. Expert Syst. Appl. 2022, 199, 116857. [Google Scholar] [CrossRef]
  15. Palimkar, P.; Shaw, R.N.; Ghosh, A. Machine Learning Technique to Prognosis Diabetes Disease: Random Forest Classifier Approach. In Advanced Computing and Intelligent Technologies: Proceedings of ICACIT 2021; Bianchini, M., Piuri, V., Das, S., Shaw, R.N., Eds.; Lecture Notes in Networks and Systems; Springer Nature: Singapore, 2022; pp. 219–244. [Google Scholar] [CrossRef]
  16. Hasan, M.K.; Alam, M.A.; Das, D.; Hossain, E.; Hasan, M. Diabetes prediction using ensembling of different machine learning classifiers. IEEE Access 2020, 8, 76516–76531. [Google Scholar] [CrossRef]
  17. Chulde-Fernández, B.; Enríquez-Ortega, D.; Guevara, C.; Navas, P.; Tirado-Espín, A.; Vizcaíno-Imacaña, P.; Villalba-Meneses, F.; Cadena-Morejon, C.; Almeida-Galarraga, D.; Acosta-Vargas, P. Classification of Heart Failure Using Machine Learning: A Comparative Study. Life 2025, 15, 496. [Google Scholar] [CrossRef]
  18. Ahamed, B.S.; Arya, M.S.; Nancy, A.O.V. Diabetes Mellitus Disease Prediction Using Machine Learning Classifiers with Oversampling and Feature Augmentation. Adv. Hum.-Comput. Interact. 2022, 2022, 1–14. [Google Scholar] [CrossRef]
  19. Sharma, T.; Shah, M. A comprehensive review of machine learning techniques on diabetes detection. Vis. Comput. Ind. Biomed. Art 2021, 4, 30. [Google Scholar] [CrossRef]
  20. Kaur, H.; Kumari, V. Predictive modelling and analytics for diabetes using a machine learning approach. Appl. Comput. Inform. 2022, 18, 90–100. [Google Scholar] [CrossRef]
  21. Nadeem, M.W.; Goh, H.G.; Ponnusamy, V.; Andonovic, I.; Khan, M.A.; Hussain, M. A fusion-based machine learning approach for the prediction of the onset of diabetes. Healthcare 2021, 9, 1393. [Google Scholar] [CrossRef]
  22. Tasin, I.; Nabil, T.U.; Islam, S.; Khan, R. Diabetes prediction using machine learning and explainable AI techniques. Healthc. Technol. Lett. 2023, 10, 1–10. [Google Scholar] [CrossRef] [PubMed]
  23. Sarwar, M.A.; Kamal, N.; Hamid, W.; Shah, M.A. Prediction of diabetes using machine learning algorithms in healthcare. In Proceedings of the 24th IEEE International Conference on Automation and Computing (ICAC 2018), Newcastle Upon Tyne, UK, 6–7 September 2018. [Google Scholar] [CrossRef]
  24. Ahmed, U.; Issa, G.F.; Khan, M.A.; Aftab, S.; Khan, M.F.; Said, R.A.T. Prediction of Diabetes Empowered With Fused Machine Learning. IEEE Access 2022, 10, 8529–8538. [Google Scholar] [CrossRef]
  25. Sivasankari, S.S.; Surendiran, J.; Yuvaraj, N.; Ramkumar, M.; Ravi, C.N.; Vidhya, R.G. Classification of Diabetes using Multilayer Perceptron. In Proceedings of the IEEE International Conference on Distributed Computing and Electrical Circuits and Electronics (ICDCECE 2022), Ballari, India, 23–24 April 2022. [Google Scholar] [CrossRef]
  26. Gupta, H.; Varshney, H.; Sharma, T.K.; Pachauri, N.; Verma, O.P. Comparative performance analysis of quantum machine learning with deep learning for diabetes prediction. Complex Intell. Syst. 2022, 8, 3073–3087. [Google Scholar] [CrossRef]
  27. Patil, K.; Sawarkar, S.D.; Narwane, S. Designing a Model to Detect Diabetes using Machine Learning. Int. J. Eng. Res. Technol. 2019, 8, 333–340. Available online: https://www.ijert.org/designing-a-model-to-detect-diabetes-using-machine-learning (accessed on 11 September 2025).
  28. Das, D.; Biswas, S.K.; Bandyopadhyay, S. A critical review on diagnosis of diabetic retinopathy using machine learning and deep learning. Multimed. Tools Appl. 2022, 81, 25613–25655. [Google Scholar] [CrossRef] [PubMed]
  29. Zhu, W. Comparison of prediction models for diabetes: Accuracy analysis of Logistic Regression, Random Forest, and Back Propagation Neural Network. Theor. Nat. Sci. 2025, 119, 69–76. [Google Scholar] [CrossRef]
  30. Hasan, M.; Yasmin, F. Predicting Diabetes Using Machine Learning: A Comparative Study of Classifiers. arXiv 2025. [Google Scholar] [CrossRef]
  31. Pore, N. Healthcare-Diabetes. 2022. Available online: https://www.kaggle.com/datasets/nanditapore/healthcare-diabetes (accessed on 4 August 2025).
  32. Vinutha, H.P.; Poornima, B.; Sagar, B.M. Detection of Outliers Using Interquartile Range Technique from Intrusion Dataset. In Advances in Intelligent Systems and Computing; Springer: Singapore, 2018; Volume 701, pp. 511–518. [Google Scholar] [CrossRef]
  33. Chawla, N.V.; Bowyer, K.W.; Hall, L.O.; Kegelmeyer, W.P. SMOTE: Synthetic minority over-sampling technique. J. Artif. Intell. Res. 2002, 16, 321–357. [Google Scholar] [CrossRef]
  34. Gao, J.; Gong, L.; Wang, J.Y.; Mo, Z.C. Study on Unbalanced Binary Classification with Unknown Misclassification Costs. In Proceedings of the IEEE International Conference on Industrial Engineering and Engineering Management, Bangkok, Thailand, 16–19 December 2018; pp. 1538–1542. [Google Scholar] [CrossRef]
  35. Zaidi, A. Mathematical justification on the origin of the sigmoid in logistic regression. Cent. Eur. Manag. J. 2022, 30, 1327–1337. [Google Scholar] [CrossRef]
  36. Ivanov, A. Decision Trees for Evaluation of Mathematical Competencies in the Higher Education: A Case Study. Mathematics 2020, 8, 748. [Google Scholar] [CrossRef]
  37. Barreñada, L.; Dhiman, P.; Timmerman, D.; Boulesteix, A.L.; Van Calster, B. Understanding overfitting in random forest for probability estimation: A visualization and simulation study. Diagn. Progn. Res. 2024, 8, 1–14. [Google Scholar] [CrossRef]
  38. Hu, X.; Wang, J.; Wang, L.; Yu, K. K-Nearest Neighbor Estimation of Functional Nonparametric Regression Model under NA Samples. Axioms 2022, 11, 102. [Google Scholar] [CrossRef]
  39. Naskath, J.; Sivakamasundari, G.; Begum, A.A.S. A Study on Different Deep Learning Algorithms Used in Deep Neural Nets: MLP SOM and DBN. Wirel. Pers. Commun. 2023, 128, 2913–2936. [Google Scholar] [CrossRef]
  40. Blessie, E.C.; Karthikeyan, E. Sigmis: A feature selection algorithm using correlation based method. J. Algorithms Comput. Technol. 2012, 6, 385–394. [Google Scholar] [CrossRef]
  41. Emerson, R.W. Causation and Pearson’s correlation coefficient. J. Vis. Impair. Blind 2015, 109, 242–244. [Google Scholar] [CrossRef]
Figure 2. Accuracy curves for the five classification models with selected variables. The Random Forest curve shows higher accuracy in correctly identifying positive cases, highlighting its robustness compared to other models evaluated.
Applsci 15 10087 g002
Figure 3. Analysis of Sensitivity (Recall): This metric evaluates a model’s ability to find all positive cases.
Applsci 15 10087 g003
Figure 4. Analysis of Specificity: It measures a model’s ability to correctly identify negative cases.
Applsci 15 10087 g004
Figure 5. Analysis of Balance (F1-Score): This score represents the harmonic mean between precision and sensitivity.
Applsci 15 10087 g005
Figure 6. ROC curves with AUC values for the diabetes classification models. The curves show that Random Forest (AUC = 0.99) and Decision Tree (AUC = 0.97) have the best discriminatory ability to differentiate between diabetic and non-diabetic patients.
Applsci 15 10087 g006
Table 1. Comparative of machine learning studies for diabetes prediction.
DescriptionP. LanguagesModelPrecisionRecallF1 ScoreCite
An automatic diabetes prediction was developed using the Pima Indian dataset and a private database of 203 women.PythonLG78%77%77%[22]
KNN78.43%76.37%76%
RF78.45%78.13%78.28%
DT75.25%73.56%73%
Bagging80.15%79.25%79.23%
Adaboost79.56%78.45%78.12%
This study proposes a fused machine learning model, using a database of 768 women in the age range of 21 years.PythonMLP95%--[24]
Three diabetes prediction models were evaluated using a dataset with 1879 samples and 46 variables.-LR85.70%81.20%82.90%[29]
Random Forest93.70%93.80%94.80%
BPNN79.70%78.80%78.50%
Presents a diagnosis of Diabetes at Sylhet Diabetes Hospital (Bangladesh), 520 patients.PythonLR95.46%98.56%96%[30]
RF98.56%98.23%99.13%
Decision tree95.45%98.56%96.35%
SVM95.34%98.67%96.52%
Table 2. Dataset attributes used for diabetes prediction.
AttributeVariable TypeUnitsDescription
PregnanciesIntegerNoneNumber of pregnancies
GlucoseIntegermg/dLBlood glucose level
BloodPressureIntegermmHgDiastolic blood pressure
Skin ThicknessIntegermmTriceps skinfold thickness
InsulinInteger μ U/mLInsulin level
BMIFloatkg/m2Body Mass Index
DiabetesPedigreeFloatNoneDiabetes risk based on family history
AgeIntegerYearsAge of the individual
OutcomeBinaryNonePresence (1) or absence (0) of diabetes
Table 3. Hyperparameter configuration for the models used.
ModelHyperparameterValue UsedJustificationReference
Logistic Regressionpenaltyl2Prevents overfitting with L2 regularization.[35]
C1.0Standard value for balancing fit and complexity.
solverlbfgsAn efficient and widely used optimizer.
max_iter1000Ensures the optimization algorithm converges.
Decision TreecriterionginiComputationally efficient metric for split quality.[36]
max_depthNoneAllows full tree growth for a detailed baseline.
min_samples_split2Standard value for creating a new node split.
Random Forestn_estimators100Balances model performance and computational cost.[37]
criterionginiStandard criterion for tree-based ensembles.
max_depthNoneAllows deep trees to capture feature variance.
bootstrapTrueDecorrelates trees to improve generalization.
K-Nearest Neighborsn_neighbors5Common value that balances bias and variance.[38]
weightsuniformGives all neighbors an equal vote in classification.
p2Specifies the use of standard Euclidean distance.
MLPhidden_layer_sizes100Provides sufficient complexity for the problem.[39]
activationreluEfficient function; avoids vanishing gradient problem.
solveradamA robust and widely used adaptive optimizer.
alpha0.0001L2 penalty term to reduce model overfitting.
max_iter1000Ensures the solver has enough iterations to converge.
Table 4. Performance results of the models in terms of Precision, Recall, F1 Score, and Accuracy.
ModeloPrecisionRecallF1 ScoreAccuracy
Logistic Regression0.7735220.7339790.7523300.759214
Decision Tree0.9814410.9687360.9750040.975157
Random Forest0.9833540.9799520.9815570.981567
KNN0.8485270.9623360.9014040.894224
MLP0.9626110.9855650.9738810.973556
Table 5. Performance results of the models in terms of Specificity, AUC, Brier Score, and MCC.
ModeloSpecificityAUCBrier ScoreMCC
Logistic Regression0.7844370.8521590.1592630.520188
Decision Tree0.9815550.9751450.0248430.950471
Random Forest0.9831580.9986600.0178160.963319
KNN0.8261270.9711380.0668810.796654
MLP0.9615330.9925870.0248280.947528
Table 6. Performance results of the models in terms of Precision, Recall, F1 Score, and Accuracy of the model without one variable.
ModelPrecisionRecallF1 ScoreAccuracy
Logistic Regression0.7734350.7267530.7484760.756809
Decision Tree0.9829260.9663490.9745610.974757
Random Forest0.9850470.9815520.9831760.983170
KNN0.8514150.9631420.9034650.896628
MLP0.9508010.9783710.9641820.963541
Table 7. Performance results of the models in terms of Specificity, AUC, Brier Score, and MCC without one variable.
ModeloSpecificityAUCBrier ScoreMCC
Logistic Regression0.7868370.8524160.1591710.515567
Decision Tree0.9831580.9747530.0252430.949659
Random Forest0.9847580.9981900.0181600.966583
KNN0.8301370.9731850.0650060.801005
MLP0.9487000.9900040.0292380.927903
Table 8. Results of the Friedman test (all variables).
MetricFriedman Statisticp-ValueResult ( α = 0.05 )
AUC18.40000.0010Significant difference detected
F1-Score19.36000.0007Significant difference detected
Recall15.23400.0042Significant difference detected
Specificity18.86870.0008Significant difference detected
Table 9. Results of the Friedman test (excluding Skin Thickness).
MetricFriedman Statisticp-ValueResult ( α = 0.05 )
AUC19.36000.0007Significant difference detected
F1-Score19.04000.0008Significant difference detected
Recall18.54550.0010Significant difference detected
Specificity17.22450.0017Significant difference detected
Disclaimer/Publisher’s Note: The statements, opinions and data contained in all publications are solely those of the individual author(s) and contributor(s) and not of MDPI and/or the editor(s). MDPI and/or the editor(s) disclaim responsibility for any injury to people or property resulting from any ideas, methods, instructions or products referred to in the content.