Article

Predictive Models for the Convective Drying Kinetics of Pinus spp. Energy Wood Chips

by
Víctor Daniel Núñez-Retana
1,2,
Artemio Carrillo-Parra
3,
José Antonio Escobar Machado
4,
Diego-David Moposita-Vasquez
5 and
Borja Velázquez-Martí
1,*
1
Departamento de Ingeniería Rural y Agroalimentaria, Universitat Politècnica de València, Camino de Vera s/n, 46022 Valencia, Spain
2
Facultad de Ciencias Forestales, Universidad Autónoma de Nuevo León, Carretera Nacional km 145, Linares 67700, Mexico
3
Institute of Silviculture and Wood Industry, Juárez University of the State of Durango, Boulevard del Guadiana 501, Ciudad Universitaria, Research Tower, Durango 34120, Mexico
4
Facultad de Ciencias Agronomicas Facultad de Ciencias Agropecuarias y Recursos Naturales, National University of Chimborazo, Km 1 ½ Vía Guano “Edison Riera” Campus, Riobamba 060107, Ecuador
5
Facultad de Ciencias Agropecuarias Recursos Naturales y del Ambiente, Universidad Estatal de Bolívar, Av. Ernesto Che Guevara, Laguacoto II Sector, Guaranda, Ecuador
*
Author to whom correspondence should be addressed.
Appl. Sci. 2025, 15(18), 10081; https://doi.org/10.3390/app151810081
Submission received: 12 August 2025 / Revised: 3 September 2025 / Accepted: 11 September 2025 / Published: 15 September 2025
(This article belongs to the Special Issue Application of Biomass Energy Technology)

Abstract

The phenomena of capillarity, dipole–dipole attractions, and hydrogen bonding make the application of mass transfer models to predict the drying rate by air convection in wood chips imprecise. So, the modification of these models by tailoring their equations is required. This study aims to adapt theoretical mass transfer models to improve the prediction of drying time for Pinus spp. chips subjected to a known hot air stream with known velocity, temperature, and relative humidity. An experimental device was constructed to control the variables, where the air stream passes vertically through a cylinder filled with wood chips. The tested air velocities ranged between 7 and 10 m/s, with relative humidity between 10 and 30% and temperatures between 40 and 70 °C with 3 and 6 cm chip columns. It was demonstrated that the drying rate of chips in a convective process with air is not constant but rather decreases over time, and that the critical moisture content is above 42%. Factors such as the height of the chips pile influence the predictive equations for the drying rate. The average relative drying rate ranged between 0.063 and 0.040 g of water s−1 kg of dry chip−1 in both heights; meanwhile, the average absolute drying rate was between 0.0031 and 0.0032 g of water s−1. Modifications of the models have been developed that adjust theoretical values with experimental values, resulting in an r2 value of 0.80.

1. Introduction

The application of mass transfer models to predict the amount of water removed per unit of time in a convective drying process with hot air works well in water films. However, the density, specific porosity, and chemical nature of wood make these models unsuitable when applied to chipped biomass [1,2,3]. Predicting the drying rate is crucial in the design of hot air dryers in order to predict drying times in the wood industry for specific air flow, temperature, and relative humidity conditions [4]. Drying is a critical operation in the biomass industry as moisture content significantly impacts the properties of biofuels, such as calorific value, flammability, and suitability for pelletization or pyrolysis [5,6,7].
Empirical moisture ratio–time curves used to describe the drying process tend to be less versatile because they are only applicable under specific conditions [8]. That is why there is a need for more general models based on the principles of mass and heat transfer to predict drying rates under any given condition before conducting the process [9,10].
Mass transfer models state that the movement of water particles in a vapor state at the interface of a solid or liquid medium undergoing drying occurs either by diffusion, following Fick’s Law, or through the action of driving forces via convection [11]. When there is a hot air stream capable of absorbing and carrying water particles from a medium, it is assumed that the air becomes saturated at the interface of the water film and the circulating gas. In other words, it has a relative humidity of 100% with an absolute humidity ω s a t (kg of water kg of dry air−1) [12]. If the air stream circulates with a density ρ a i r (kg of dry air m−3) and absolute humidity ω a i r e , the mass of water removed per unit of time can be calculated using Equation (1), where h (m−2 s−1) is a proportionality constant related to the transfer area A, known as the convective mass transfer coefficient. This coefficient depends on the Sherwood number according to Equation (2), where D w is the mass diffusivity and L c is the characteristic length [13]. Both equations can be expressed as the following:
m ˙ s = h · ρ a i r · A · ω s a t ω a i r
h = S h · D w L c
The Sherwood number ( S h ) can be calculated based on the Reynolds number ( R e ) and the Schmidt number ( S c ). The relationship between the Sherwood number, Reynolds number, and Schmidt number follows an analogy with heat transfer equations [14], which is expressible as the following:
S h = f R e , S c
R e = υ   ρ   L c μ
S c = μ   ρ a i r   D w  
where υ is the air velocity,   L c is the characteristic length, and μ is the dynamic viscosity of the fluid.
There are several factors that cause the models created to determine the time of the drying process to differ from those obtained experimentally in industrial contexts. For instance, determining the velocity and Reynolds number in the gaps between the chips, the geometry of the pieces, and defining the characteristic length can lead to significant variations compared to experimental data [15].
A great number of kinetic models of drying are used based on mass transfer processes [1,2,3,16]. Tremblay et al. [17] presented a new experimental method to determine the convective heat and mass transfer coefficient in Pinus resinosa wood based on moisture content, indirectly related to the water potential at the wood surface at different drying times. They concluded that this coefficient increases with air velocity and remains constant until the moisture content at the wood surface reaches approximately 80%.
Jalili et al. [15] implemented a one-dimensional drying model based on the Whitaker model to dry a cylindrical infinite geometry pine wood particle as a porous medium, considering the volume fractions occupied by each phase: gas mixture ε g , solid ε s , free water ε f w , and bound water ε b w , such that:
ε g + ε s + ε f w + ε b w = 1
They concluded that the transport coefficients of the model in each phase showed a notable impact on the predicted drying time. Among all the variables, the intrinsic gas permeability was the most significant parameter affecting the model.
Chávez et al. [12] developed a model that simultaneously simulates mass and heat transfer at low temperatures in Pinus radiata wood while predicting mechanical stresses during drying. Specifically, the values of the local heat transfer coefficient “h” were calculated using the Colburn analogy, which allowed them to determine the values in terms of radial (Sn) and tangential (Sw) convective mass transfer coefficients, respectively. This can be expressed as the following:
h n = S n · K n D w · ( S h / P r ) 1 / 3
where K n is the permeability, D w is the diffusivity, S h is the Sherwood number, and P r is the Prandtl number.
The drying processes of Pinus spp. have been of great interest due to the importance of pine as a source of biomass. Current research trends related to drying focus their attention on kinetics to predict drying time [18,19]. A recent notable investigation is that of Kuznetsov et al. [3] which, based on experimental results, evaluated a non-monotonic change in the rates of moisture removal at a low-temperature heating mode and high ambient temperatures. These authors formulated a hypothesis explaining the physical mechanism of such a dependence of the mass rate of moisture removal on time.
We hypothesize that mass transfer models based on analogies with heat transfer can be used to predict the mass of water dried per unit of time in a convective system at the interface of a wet porous solid, such as wood. We propose that these models can be related to experimental data using simple linear equations. The objective is to obtain equations relating the mass of water dried per unit of time to the conditions of hot air, including air flow rate, temperature, and relative humidity, in which the drying process will be conducted.

2. Materials and Methods

2.1. Study Material

Logs from the Pinus genus obtained from a sawmill located in the municipality of Durango (Mexico) were used. As the logs were provided directly by the industry without being differentiated by species, it was not possible to identify the specific Pinus species; therefore, the generic designation Pinus spp. was adopted. The density of the resulting wood chips falls within the typical range reported for pine species (420–670 kg m−3) [20]. The logs were randomly selected and transported to the Wood Technology Laboratory of the Institute of Silviculture and Wood Industry, part of the Juárez University of the State of Durango. To prevent moisture loss, the logs were stored in controlled room conditions at 20 °C and 80% relative humidity, maintained using a portable dehumidifier (model CFM-40E, capacity 40 Pints/day). Subsequently, they were cut and chipped using an Industrial Duty SD4P25T61 machine obtaining a particle size distribution of P16S (3.15 mm < p ≤ 16 mm) following the UNE-EN ISO 17225-4 standard [21] (Figure 1). The generated wood chips were kept under the same temperature and humidity conditions using the portable dehumidifier. Before the drying tests, the initial moisture content was determined according to the UNE-EN ISO 18134-3 standard [22]. As the logs were collected without prior differentiation, both sapwood and heartwood were included in the material.

2.2. Experimental Device

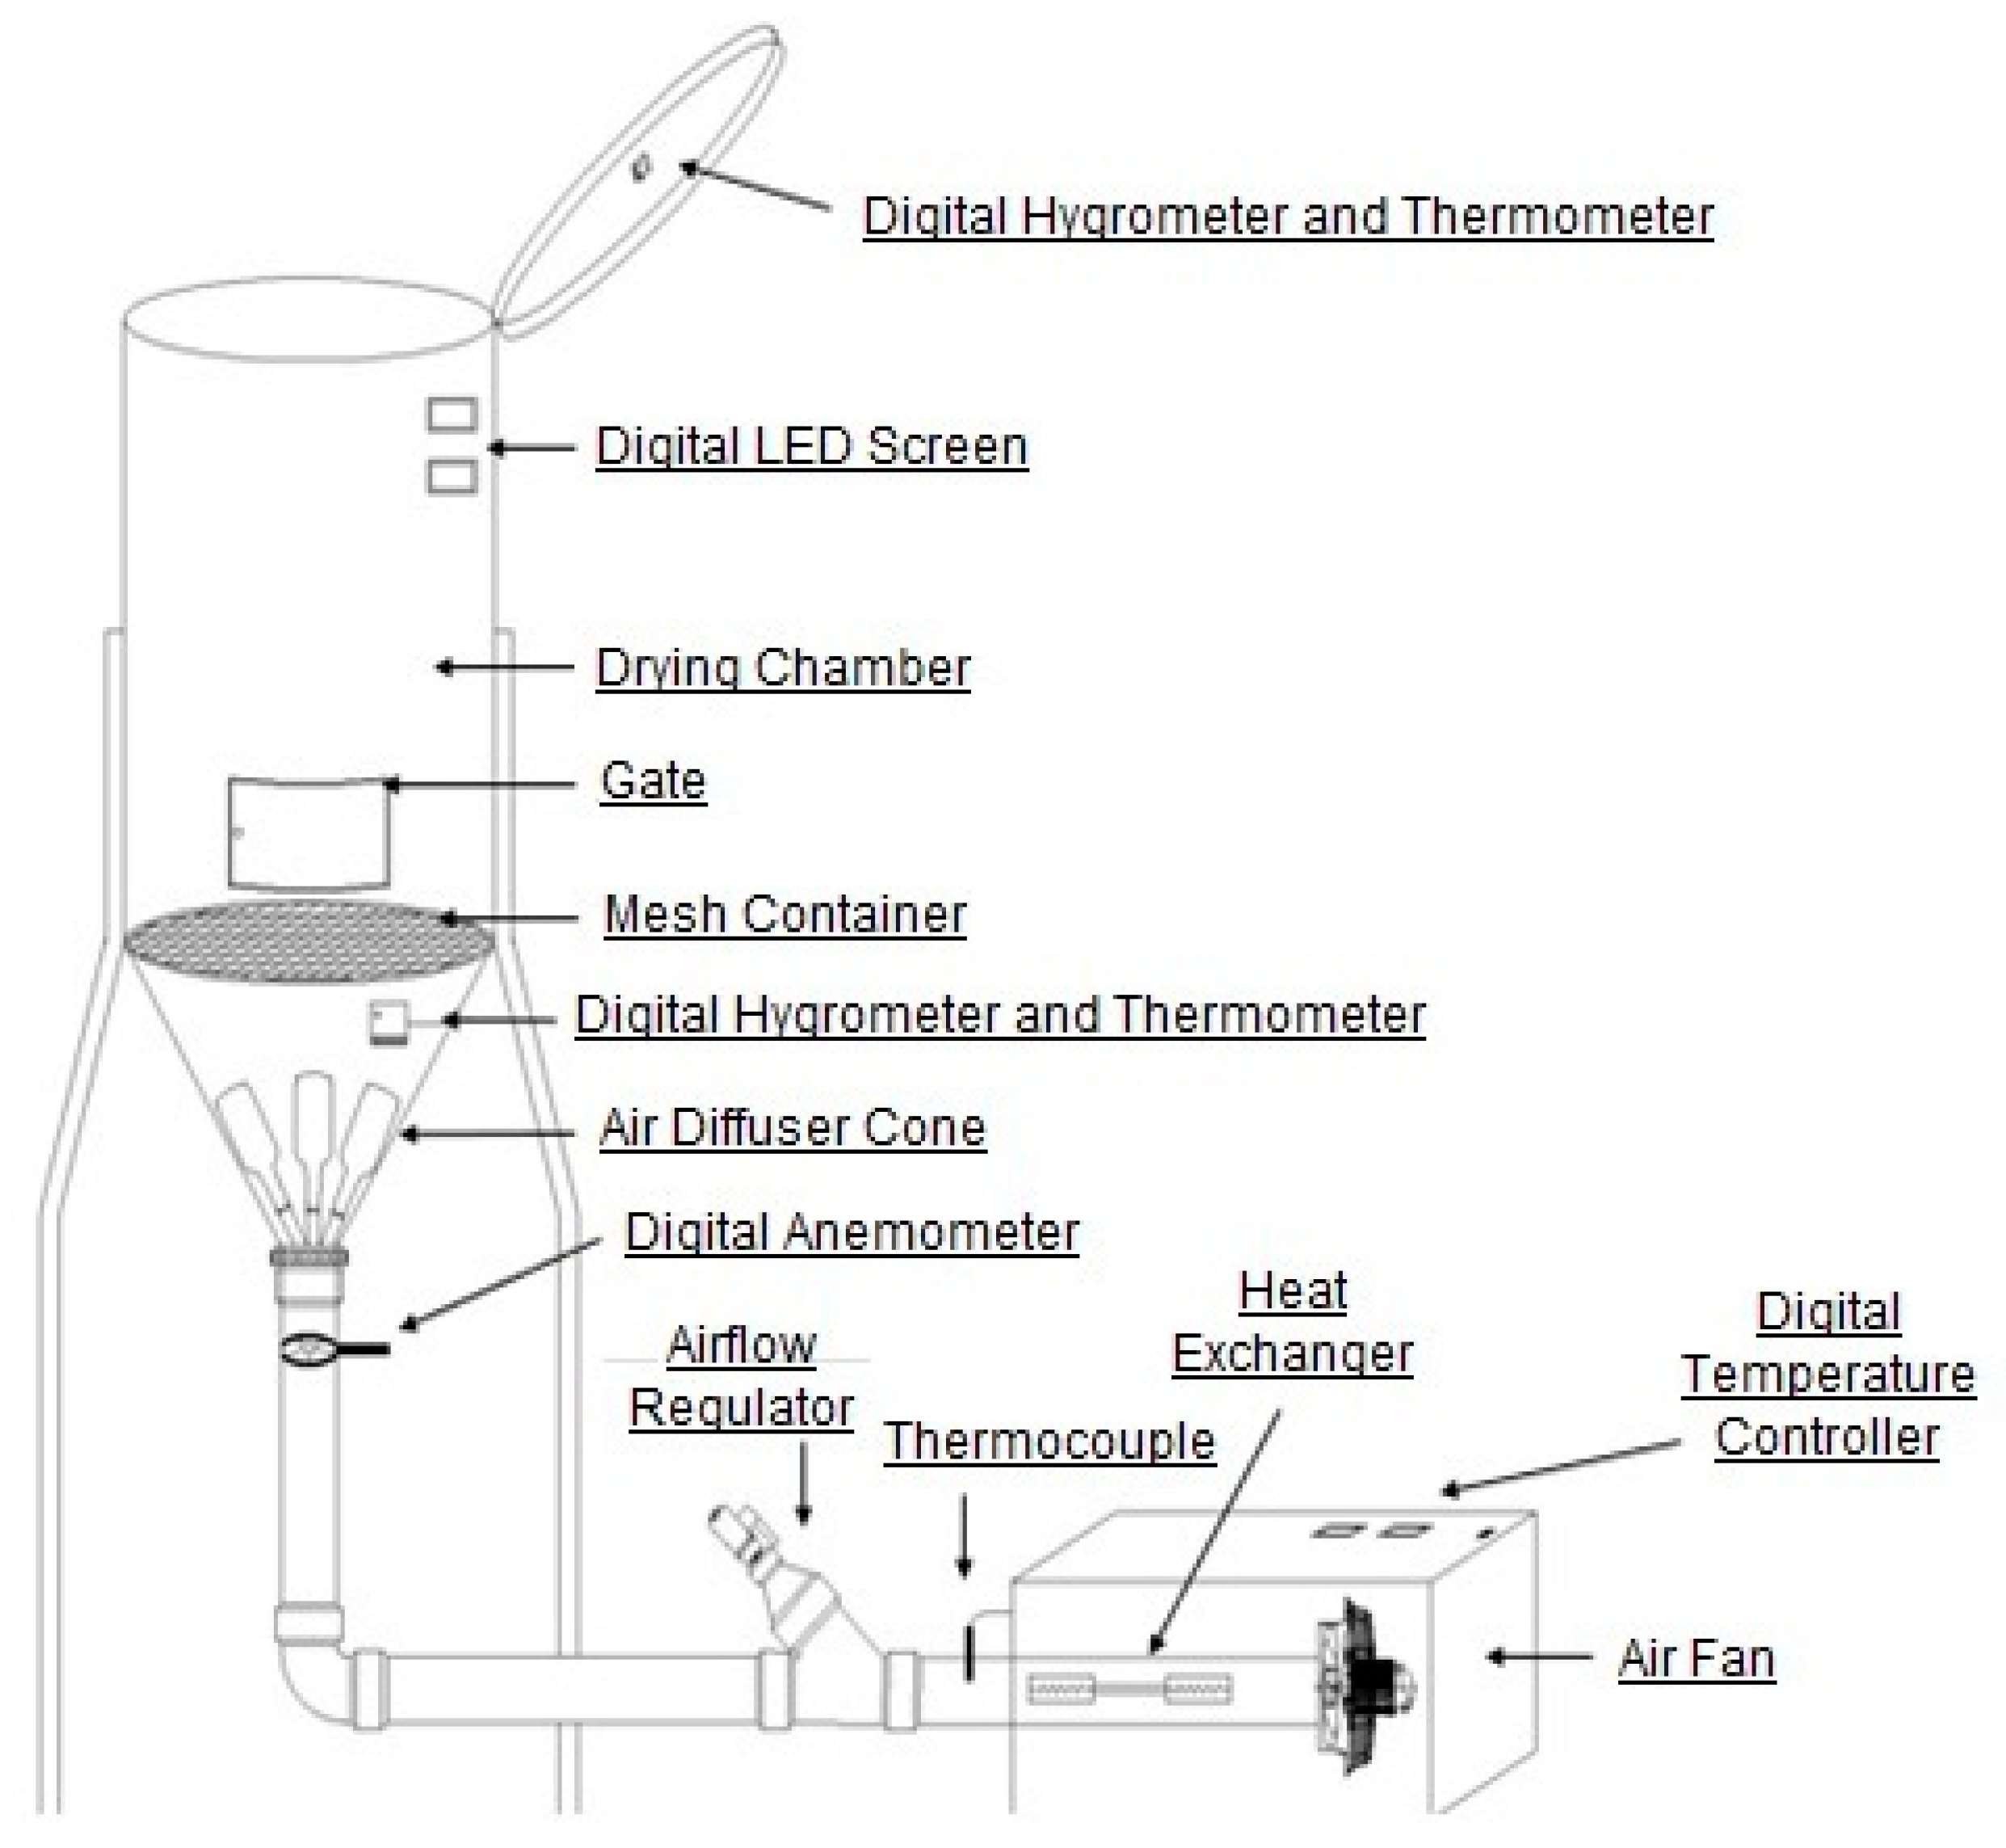
The experimental dryer is illustrated in Figure 2. It consists of a vertically arranged cylinder where a column of wood chips is placed, and a hot air stream is passed through it in an upward direction. The vertical movement of the hot air allows for the drying of the material, removing the humid air from the top.
The air is propelled by a fan placed in a supply tube. It is then heated as it passes through resistors, and the power variation of the resistors concede for temperature regulation. At the outlet of the fan, there is a valve that controls the airflow entering the drying column. This heated air then advances to a diffuser cone responsible for evenly distributing the air throughout the cross-section of the cylinder.
After the cone, there is a mesh that serves as a retention barrier for the wood chips, preventing them from falling into the diffuser cone, which could cause technical issues such as an airflow blockage or a potential ignition of the wood chips.
It also features temperature and humidity sensors placed in the diffuser cone (before the contact with the wood chips) and at the dryer’s outlet, as well as an anemometer before the diffuser cone to measure airflow velocity. Relative humidity in the air was between 10 and 30%.

2.3. Measurement Procedure

To evaluate the drying process through convective hot air, two levels of airflow V 1 , V 2 , three levels of temperature T 1 , T 2 , T 3 , and two levels of wood chip column height H 1 , H 2 were combined. In total, 2 × 3 × 2 = 12 experimental blocks were created, with 18 repetitions of each block, resulting in a total of 216 treatments. Table 1 displays the characteristic values for each level.
For each drying test, three metal boxes measuring 13.5 × 6.5 × 5.0 cm were placed in the middle of the drying chamber and filled with wood chips (Figure 1). The chips in the boxes served as reference samples to determine the moisture variation in the materials during the process. Prior to each drying test, the wood chips were sieved to remove fine particles that could pass through the mesh and cause solid mass loss between consecutive weight measurements. Then, wood chips were deposited in the drying column according to the treatment height conditions. The boxes containing the wood chips were weighed on a scale every 10 min during a period of 2.5 to 8 h, depending on the treatment. Finally, the final moisture content was determined according to the UNE-EN ISO 18134-3 standard [22].
The air conditions before and after passing through the drying column were taken from the velocity, temperature, and humidity sensors.

2.4. Characterization of the Drying Process

Six variables were determined to characterize the drying rate:
Average relative drying rate ( m ˙ w ¯ ). It is defined as the average mass of water removed from the wood chips per kilogram of dry solid mass and per unit of time (g of water s−1 kg of dry wood chip−1). It is calculated using Equation (3), where m i is the initial mass of the wood chips in grams; m f is the final mass of the wood chips in grams; t is the drying process time in seconds; and m d r y is the mass of the dry wood chips in kilograms. This can be expressed as the following:
m ˙ w ¯ = m i m f t · m d r y
Average absolute drying rate ( m ˙ s ¯ ). It is defined as the average mass of the water removed from the wood chips per unit of time (g of water s−1). It is calculated using Equation (4), which is expressible as the following:
m ˙ s ¯ = m i m f t
Instantaneous relative drying rate  ( m ˙ w ). It is defined as the mass of water being removed from the wood chips at a specific moment per kilogram of dry solid mass (g of water s−1 kg of dry chip−1). It is calculated using the Equation (5), where m 1 is the mass of wood chips at time t 1 in grams; m 2 is the mass of wood chips at time t 2 ; and m d r y is the mass of dry wood chips in kilograms. This can be expressed as the following:
m ˙ w = m 1 m 2 ( t 2 t 1 ) · m d r y
Instantaneous absolute drying rate  ( m ˙ s ). It is defined as the mass of water being removed from the wood chips at a specific moment (g of water s−1). It is calculated using Equation (6). This can be expressed as the following:
m ˙ s = m 1 m 2 t 2 t 1
Average moisture variation ( ω ˙ ¯ ). It represents the average percentage of moisture reduction per unit of time in the experiment (% s−1). It is calculated using Equation (7), where ω i is the initial moisture content of the wood chips in wet basis; ω f is the final moisture content of the wood chips in wet basis; and t is the drying time in seconds. This can be expressed as the following:
ω ˙ ¯ = ω i ω f t
Instantaneous moisture variation ( ω ˙ ). It represents the percentage of moisture reduction per unit of time at a specific moment (% s−1). It is calculated using Equation (8), where ω 1 is the moisture content of the wood chips in wet basis at time t 1 and ω 2 is the moisture content of the wood chips in wet basis at time t 2 . This can be expressed as the following:
ω ˙ = ω 1 ω 2 t 2 t 1
The instantaneous drying rates (relative and absolute) and the instantaneous moisture variation were evaluated as a function of the moisture content of the wood chips, obtaining the slopes of the respective curves (Table 2).

2.5. Calculation of Convective Mass Transfer

Based on the initial conditions of the air introduced into the dryer, the average relative and instantaneous drying rates of the process were calculated using the mass transfer by convection model based on Equations (1) and (2).
For its application, there was uncertainty about the most suitable characteristic length to obtain the Reynolds number and calculating the convective mass transfer coefficient (h) in Equation (2). Therefore, the calculations were performed by testing the following three possible characteristic lengths:
L c c h i p s = mean length of the chip;
L c D 1 = diameter of the air supply tube before the diffuser cone (0.071 m);
L c D 2 = diameter of the drying column (0.57 m).
On the other hand, when calculating the velocity of the Reynolds number, clear evidence was not found as it is difficult to accurately measure the cross-section through which the air flows through the wood chips. To evaluate the possibilities of simplifying the calculation process, the following two velocities were tested:
v 1 = Air velocity measured with the anemometer in the dryer before its contact with the wood chips.
v 2 = Air velocity after passing through the bed of wood chips in the dryer. This air velocity was calculated using Equation (9), where D 1 is the diameter of the air supply tube before the diffuser cone, and D 2 is the diameter of the cylinder. This can be expressed as the following:
v 2 = D 1 2 · v 1 D 2 2
The air properties (viscosity and density) to determine of the Reynolds number, Schmidt number, and diffusivity were taken at the inlet temperature of the air in the drying column.
Therefore, by combining the three characteristic lengths and the two considered air velocities, six different Reynolds numbers and h values were obtained to evaluate the variables that provided the best fit to the experimental observations.
The Sherwood number was calculated using Equation (8) with the Reynolds number and the Schmidt number, where S c replaces the Prandtl number, and S c s is the Schmidt number at the mass transfer surface. This can be expressed as the following:
1000 < R e < 2 · 10 5 , S c > 0.5 S h = 0.35 · R e 0.6 · S c 0.36 · ( S c / S c s ) 0.25
To calculate the transfer area ( A ) used in Equation (1), all the chips inside the metal boxes were counted and measured using a digital caliper. Then, the area of each chip was calculated considering all sides. The area was multiplied by a coefficient of 0.95, as the chips were not completely free but were adjacent to each other.

3. Results and Discussion

3.1. Statistical Description of the Measured Variables

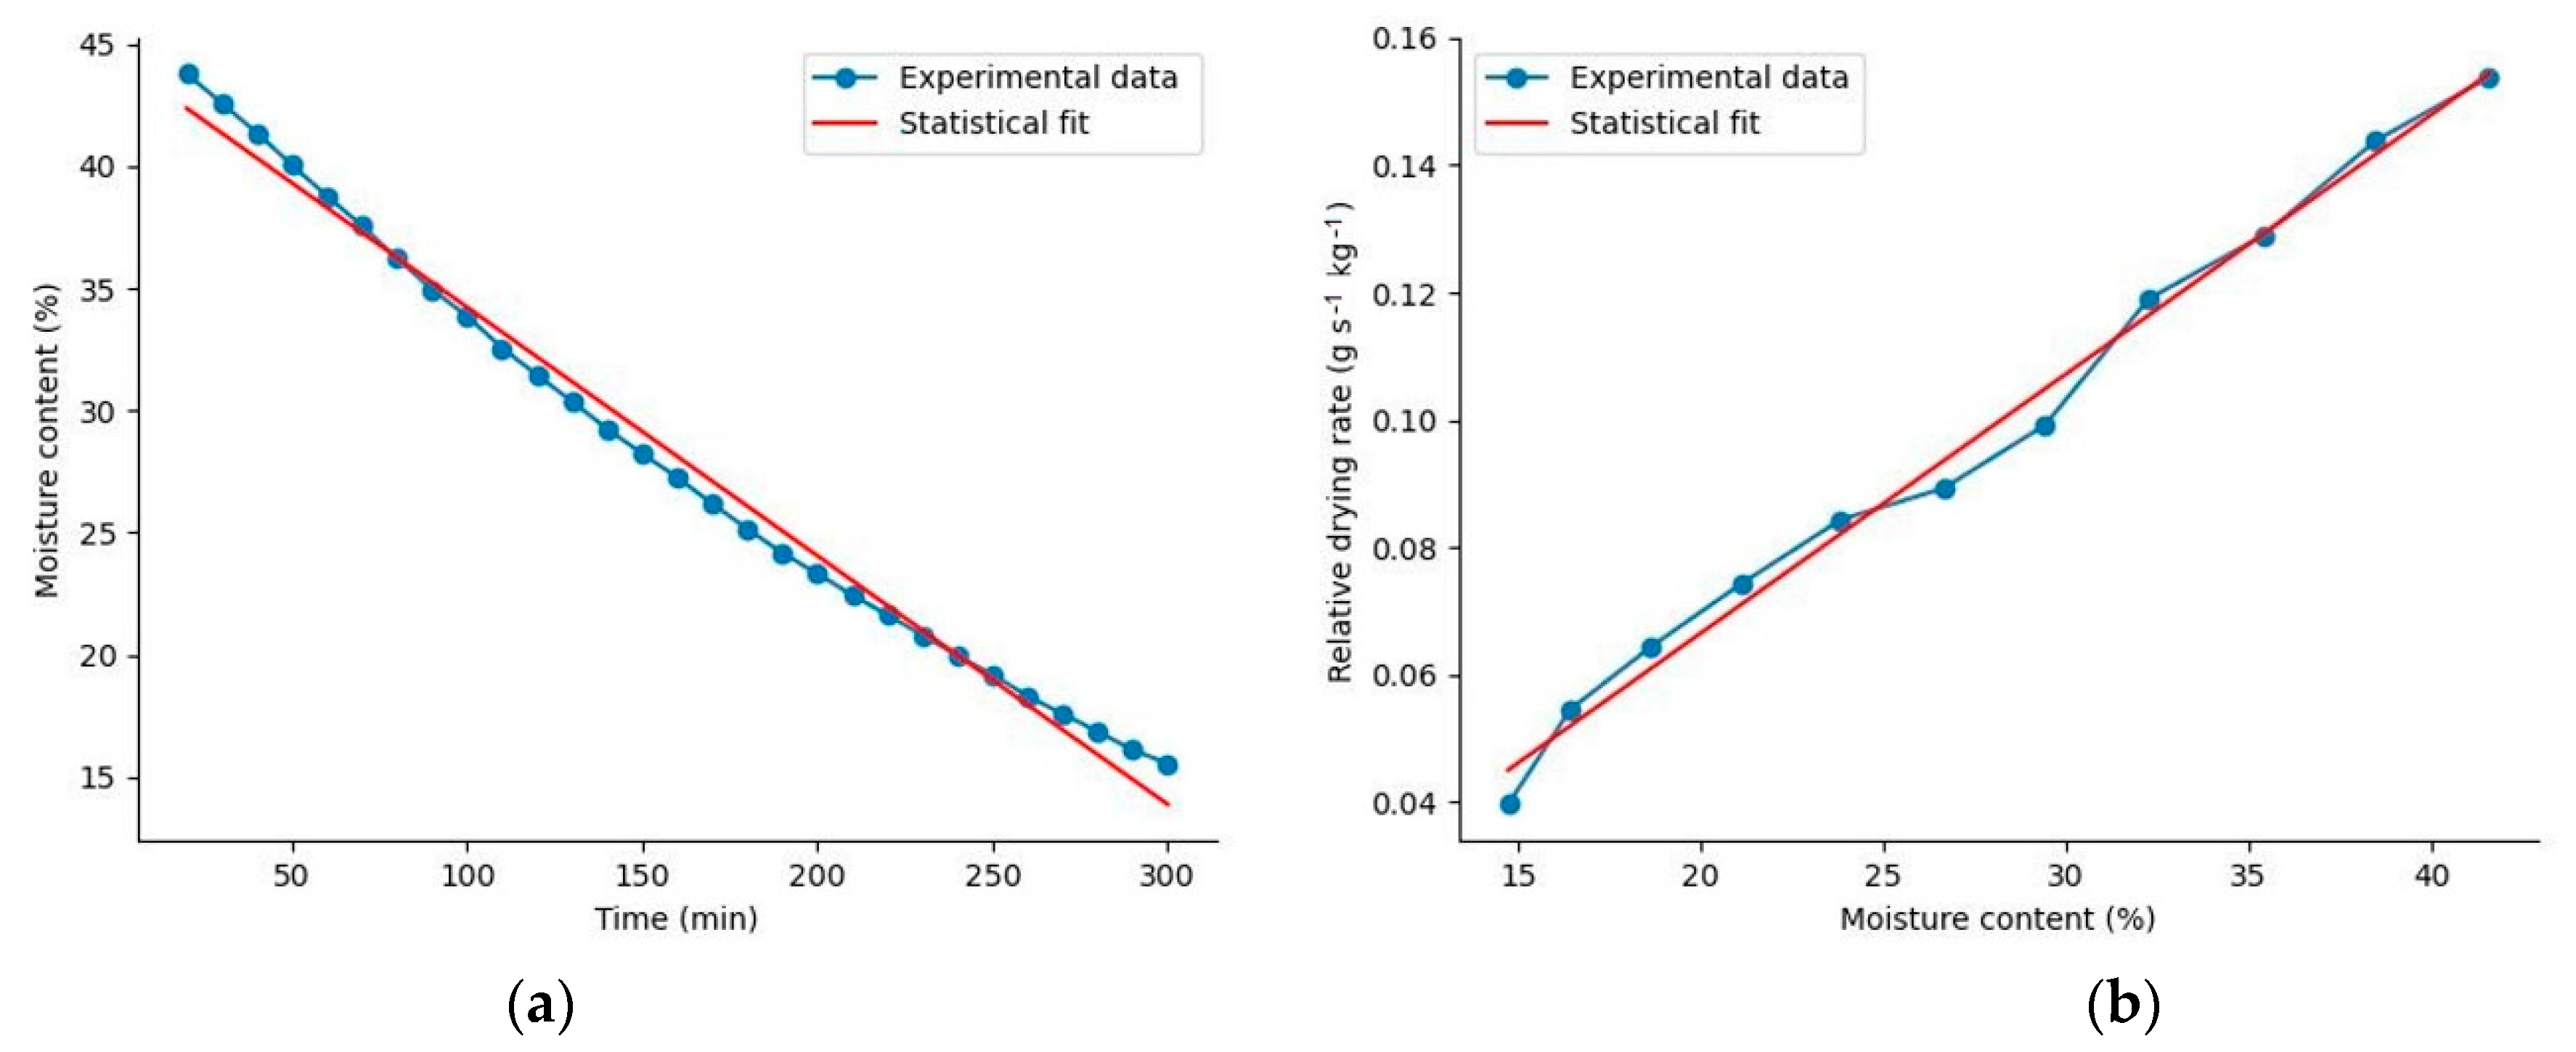
In Figure 3a, the variation in wood chip moisture content over time is depicted. Figure 3b represents the instantaneous drying rate in relation to the moisture content. The initial average moisture content in the treatments was 42%, reaching a final average moisture content of 15%. Numerous studies, such as Coumans [23] and Kucuk et al. [24], indicate that in the drying processes for porous materials, there is a critical moisture content above which the instantaneous drying rate remains constant, while below it, the rate decreases. In the drying experiments for the wood chips, it was observed that the relative drying rate decreased linearly as the moisture content decreases. At no point in the process did the drying rate remain constant; instead, it exhibited a linear decrease. This implies that the critical moisture content in Pinus spp. wood chips is above 42%. The linear equation fits with an r2 of 0.99.
Authors like Ananias et al. [25] mention that the critical moisture content of radiata pine during vacuum drying is 58% (dry basis). This critical moisture content is the average moisture content when almost all surface moisture on the material has evaporated, and the drying rate is no longer constant, indicating the influence of mass transfer phenomena within the material [26]. In our experiments, the initial moisture content of pine wood chips was lower than 58%, which explains why the drying rate did not exhibit a constant period but consistently decreased, consistent with results of Ananias et al. [25]. This observation has also been reported by authors such as Ananias et al. [27] for fir and beech woods, as well as by Arabi et al. [28] and Hosseinabadi et al. [29] in poplar wood particles. This can be explained by the absence of free surface water in the wood chips, indicating the absence of constant surface evaporation. Thus, it can be inferred that moisture mass transfer during drying predominantly occurs through liquid diffusion [30].
Keey et al. [31] mention that in hardwoods and in the heartwood of softwoods, the critical moisture content is likely to be the initial moisture content. Probably, Keey et al.’s [31] statement is debatable because, like a heating or cooling process where it must be ensured that the temperature variation within a specific piece is uniform, the Biot number of the mass transfer process ( B I O T m a s s ) needs to be sufficiently small enough to ensure the absence of moisture gradients during the drying process. In heat transfer, if the Biot number is large, temperature gradients occur during heating and cooling processes. In drying processes, if the relationship given by Equation (11) is not sufficiently small, moisture gradients will occur within the piece, and the drying rate will cease to be constant beyond a certain moisture content. Equation (11) can be expressed as the following:
B I O T m a s s = h m · L c D w
where h m is the coefficient of mass transfer by convection; L c is the characteristic length; and D v is the water diffusivity in the piece.
Therefore, it should be noted that despite our attempts in this experiment to create pieces small enough for the Biot number of the mass transfer process to be small, a constant drying rate was not detected in any of the cases. We evaluated the hypothesis that when there are no humidity gradients in a piece in the drying process, the speed with which water is eliminated is constant. That is, the mass of water released per unit of time and mass does not vary. However, constant speed drying did not occur in any of the experiments. This fact is reported in this article and confirms the observations of other researchers such as Kuznetsov et al. [3]. This suggests that water diffusivity in the wood is excessively small compared to the mass transfer coefficient. For this reason, in our attempt to relate the experimental drying rate with the rates provided by mass transfer models, to work with average experimental drying rates was compelled.
Initially, it was necessary to evaluate the normality of the average relative drying rate ( m ˙ w ¯ ), average absolute drying rate ( m ˙ s ¯ ), and average moisture variation ( ω ˙ ¯ ), as well as the slopes of the curves for the variation of instantaneous relative drying rates (relative d m ˙ w d ω and absolute d m ˙ s d ω ), and the variation of instantaneous moisture with moisture content ( d ω ˙ d ω ) (Table 3).
According to the Kolmogorov–Smirnov test, the level of confidence in the normality of these variables is too weak: average relative drying rate p = 0.051, average absolute drying rate p = 0.080, average moisture variation p = 0.042, the slope of the relative drying rate p = 0.057, the slope of the absolute drying rate p = 0.003, and the slope of the moisture variation p = 0.038. The weakness of normality justifies the study of possible factors influencing these parameters.
To analyse whether air temperature, air velocity, and height of the wood chip column in the dryer are factors influencing the kinetics of the drying process, an evaluation of the different levels and the interaction of these factors was performed. Of relevance are the kurtosis coefficients and standardized skewness, which indicate the proximity of the variable’s distribution to normality. Values of these coefficients between −2 and +2 indicate that the distributions of all variables shown in Table 3 approximate a normal distribution. Therefore, analysis of variance can be applied to assess their significance in the process, as well as to the data groups for reliable regression modelling based on mass transfer models.
The ANOVA (analysis of variance) results shown in Table 4 evaluate the influence of each factor on the kinetics of the drying process, as well as the potential interactions among different factors.
In Table 4, it can be observed that the average relative drying rate ( m ˙ w ¯ ), average moisture variation ( ω ˙ ¯ ), and the slopes of relative drying rate ( d m ˙ w d ω ) and moisture variation ( d ω ˙ d ω ) for both chip heights in the dryer are always higher for the 3 cm chip height. Conversely, the average absolute drying rate ( m ˙ s ¯ ) is similar for both heights (with 0.0032 g of water s−1 in 3 cm and 0.0033 of water s−1 in 6 cm), but is different from the slope of absolute drying rate ( d m ˙ s d ω ), where the 6 cm height is higher than the 3 cm height (0.00018 and 0.00013 g of water s−1 %−1, respectively). It is important to note that these rates and slopes are in absolute terms. This indicates that the capacity for water particle absorption in the air is limited. Increasing the height of the chip column reduces the relative drying rate but does not affect the amount of water removed per unit of time in the system. This is one of the highlighted conclusions.
When the drying column is increased, the amount of water removed per unit of time remains the same. However, the decrease in moisture varies.
Similar results were reported by Ozollapins et al. [32] in the drying of reeds, reed canary grass, and hemps with different drying bed thicknesses. They found the drying rates under constant airflow and temperature showed a significant difference when the drying bed thickness and the amount of material being dried were varied.
This can be explained by the air pressure resistance during the ventilation of the chips. In other words, the pressure within the drying area increases with the thickness of the chip bed in the dryer [33]. Heating the ventilation air leads to an increase in the volume of air at a constant pressure. Consequently, heating the ventilation air will result in an increase in the volumetric airflow and pressure resistance within a dryer [34].
On the other hand, it can be also observed from Table 4 that higher air velocity leads to higher drying rates, greater moisture variation, and steeper slopes of drying rates and moisture variation. This result is consistent because the air passing through the gaps between the chips becomes less saturated when it flows at a higher velocity.
Bengtsson [35] mentions that under certain conditions, air velocity primarily influences the period of constant drying rate in spruce chips, while air velocity and temperature have a greater influence on the period of decreasing drying rate. Airflow plays an important role in drying. However, according to Tremblay et al. [17], the drying rate can be increased with a rise in air velocity up to a critical point beyond which an increment in air velocity would not increase the drying rate.
According to the effect of air temperature on the average relative ( m ˙ w ¯ ) and absolute ( m ˙ s ) drying rates, it can be observed that both exhibit the same behaviour (Table 4). There are no significant differences between temperatures T 2 and T 3 , which are higher than T 1 for both rates, with average values of 0.041 g of water s−1 kg of dry chip−1 in the relative rate, and 0.0024 g of water s−1 in the absolute rate. In other words, an increase in air temperature will increase the drying rate and decrease the drying time [36]. Similarly, the average moisture variation ( ω ˙ ¯ ) and the slopes of the relative ( d m ˙ w d ω ) y absolute ( d m ˙ s d ω ) drying rate variations follow a similar trend. In the range of air temperatures, T 3 saw the largest variations, followed by T 2 y T 1 . In particular, the slope of moisture variation ( d ω ˙ d ω ) was higher when using temperature range T 1 and lower with range T 2 , with averages of 0.000052 s−1 and 0.000038 s−1. This means that at lower air temperatures, the moisture variation over time is greater compared to higher temperatures. This can be attributed to the fact that at higher temperatures, the moisture absorbed from the air can be higher. In other words, if the air temperature is low, the moisture extraction from the wood chips into the surrounding environment is also low [37].
Ståhl et al. [38] emphasize that drying at low temperatures can be beneficial when forest residues are used for combustion. Thus, it can prevent the volatilization of high-energy compounds.

3.2. Analysis of the Interactions

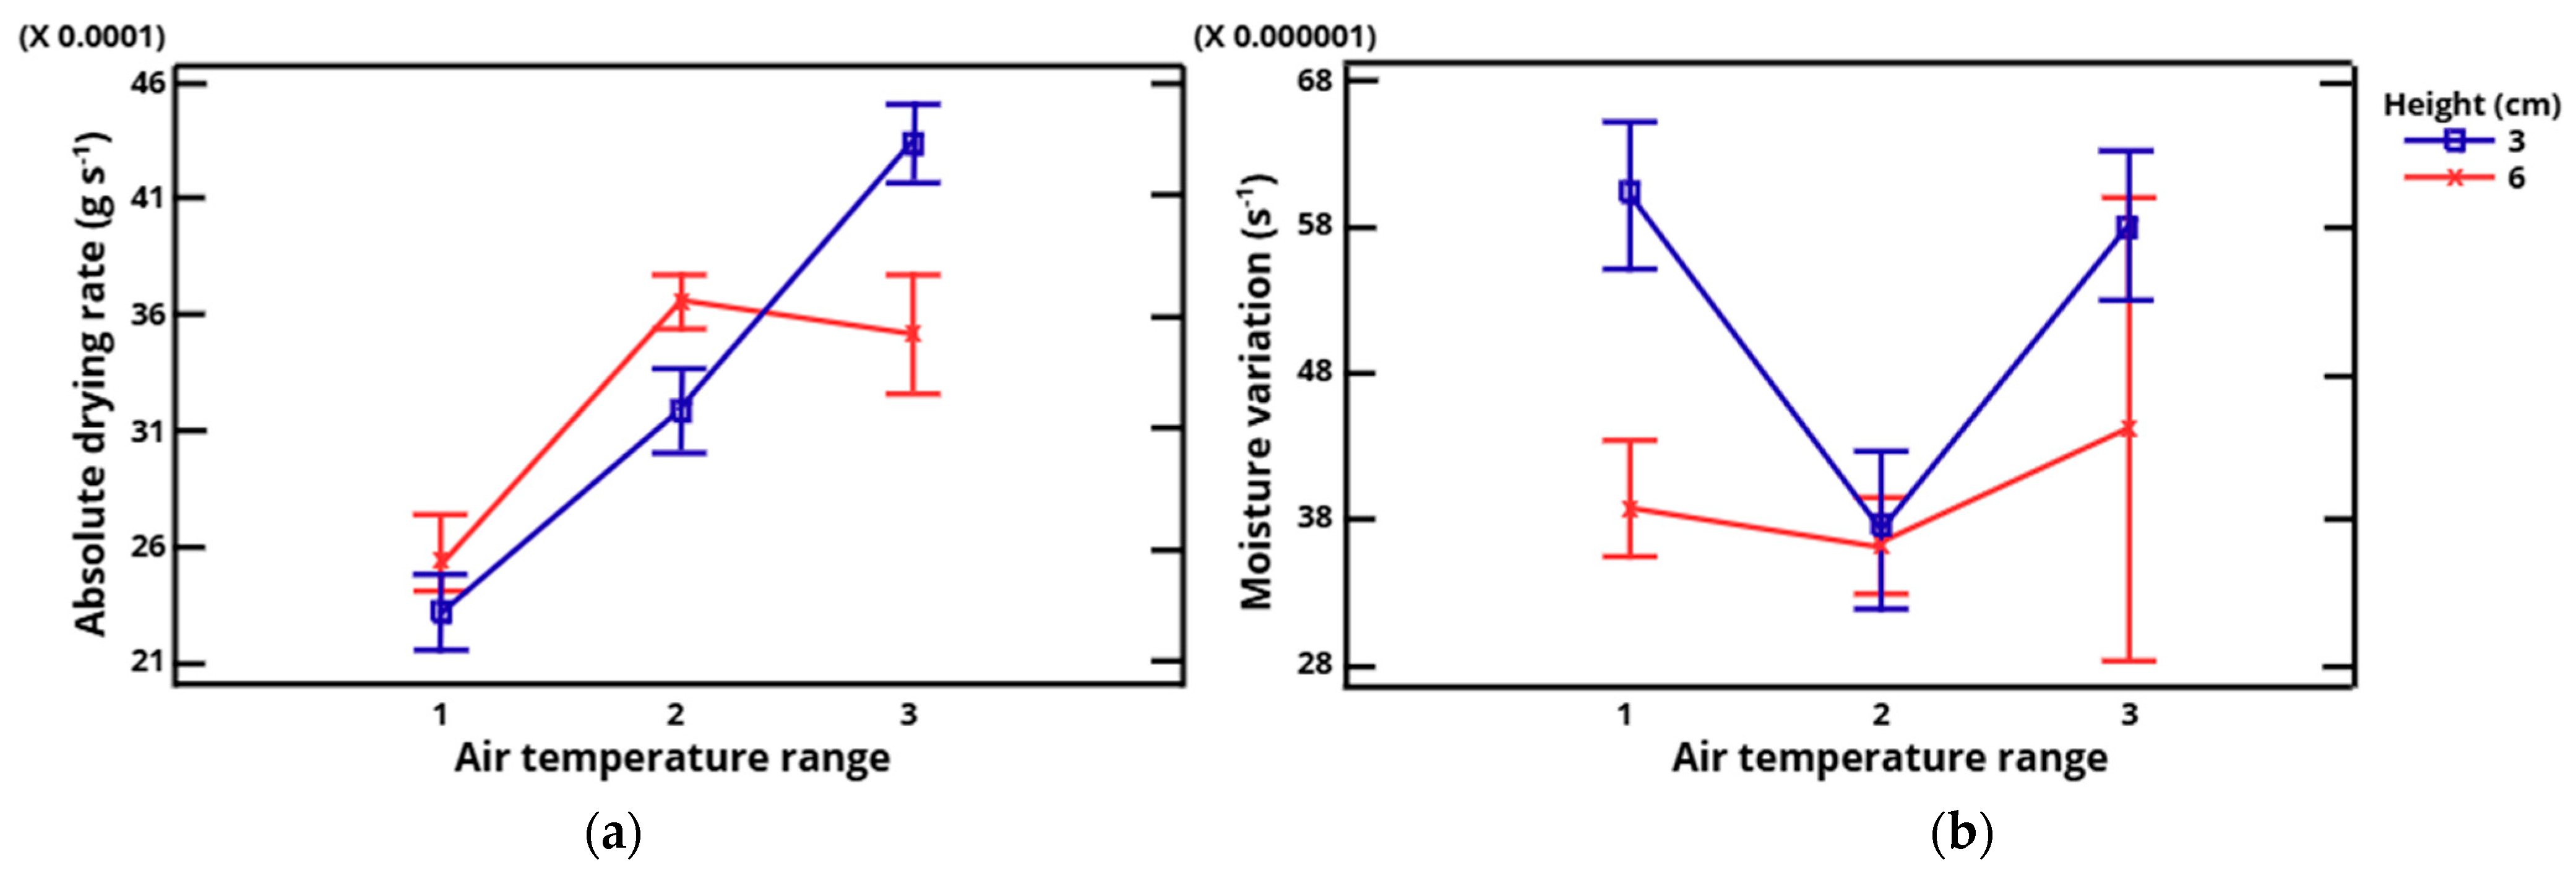
No significant interactions between chip column height and air velocity were found for any parameter (Table 4). This runs contrary to the findings reported by Klavina et al. [39] who found that with a decrease in the wood chip layer and an increase in airflow, the drying rate improved. In their model, the drying rate–airflow relationship was more intense than the drying rate–layer thickness relationship. Here, the effect of the interaction of the height of the chip column and the air temperature only had a significant effect on the average absolute drying rate ( m ˙ s ¯ ) and the slope of the moisture variation ( d ω ˙ d ω ) (Figure 4). When using temperature ranges T 1 and T 2 , the drying rate was higher for the 6 cm wood chip bed height. However, when using the temperature range T 3 , the absolute drying rate was higher for the 3 cm height (Figure 4a). This could be attributed to the higher increase in relative humidity of the air between the wood chips in the 6 cm bed height under elevated air temperatures. In other words, in the 3 cm wood chip bed, the water vapor existing between the pores was easier to remove compared to the 6 cm bed, resulting in a higher drying rate. It is necessary to release the relative humidity of the air between the gaps in the wood chips [40]. On the other hand, there is a significant influence of the wood chip bed height on the slope of moisture variation in the T 1 air temperature range, while it is not significant for the T 2 and T 3 temperature ranges (Figure 4b). In other words, whenever T 1 temperature range and a lower bed height of wood chips are used, the slope will be higher compared to the T 2 and T 3 temperature ranges, where the slope of variation was similar. This contradicts Lerman and Wennberg [41], who indicated that the drying rate increases with temperature and air velocity but is not influenced by the wood chips bed height.
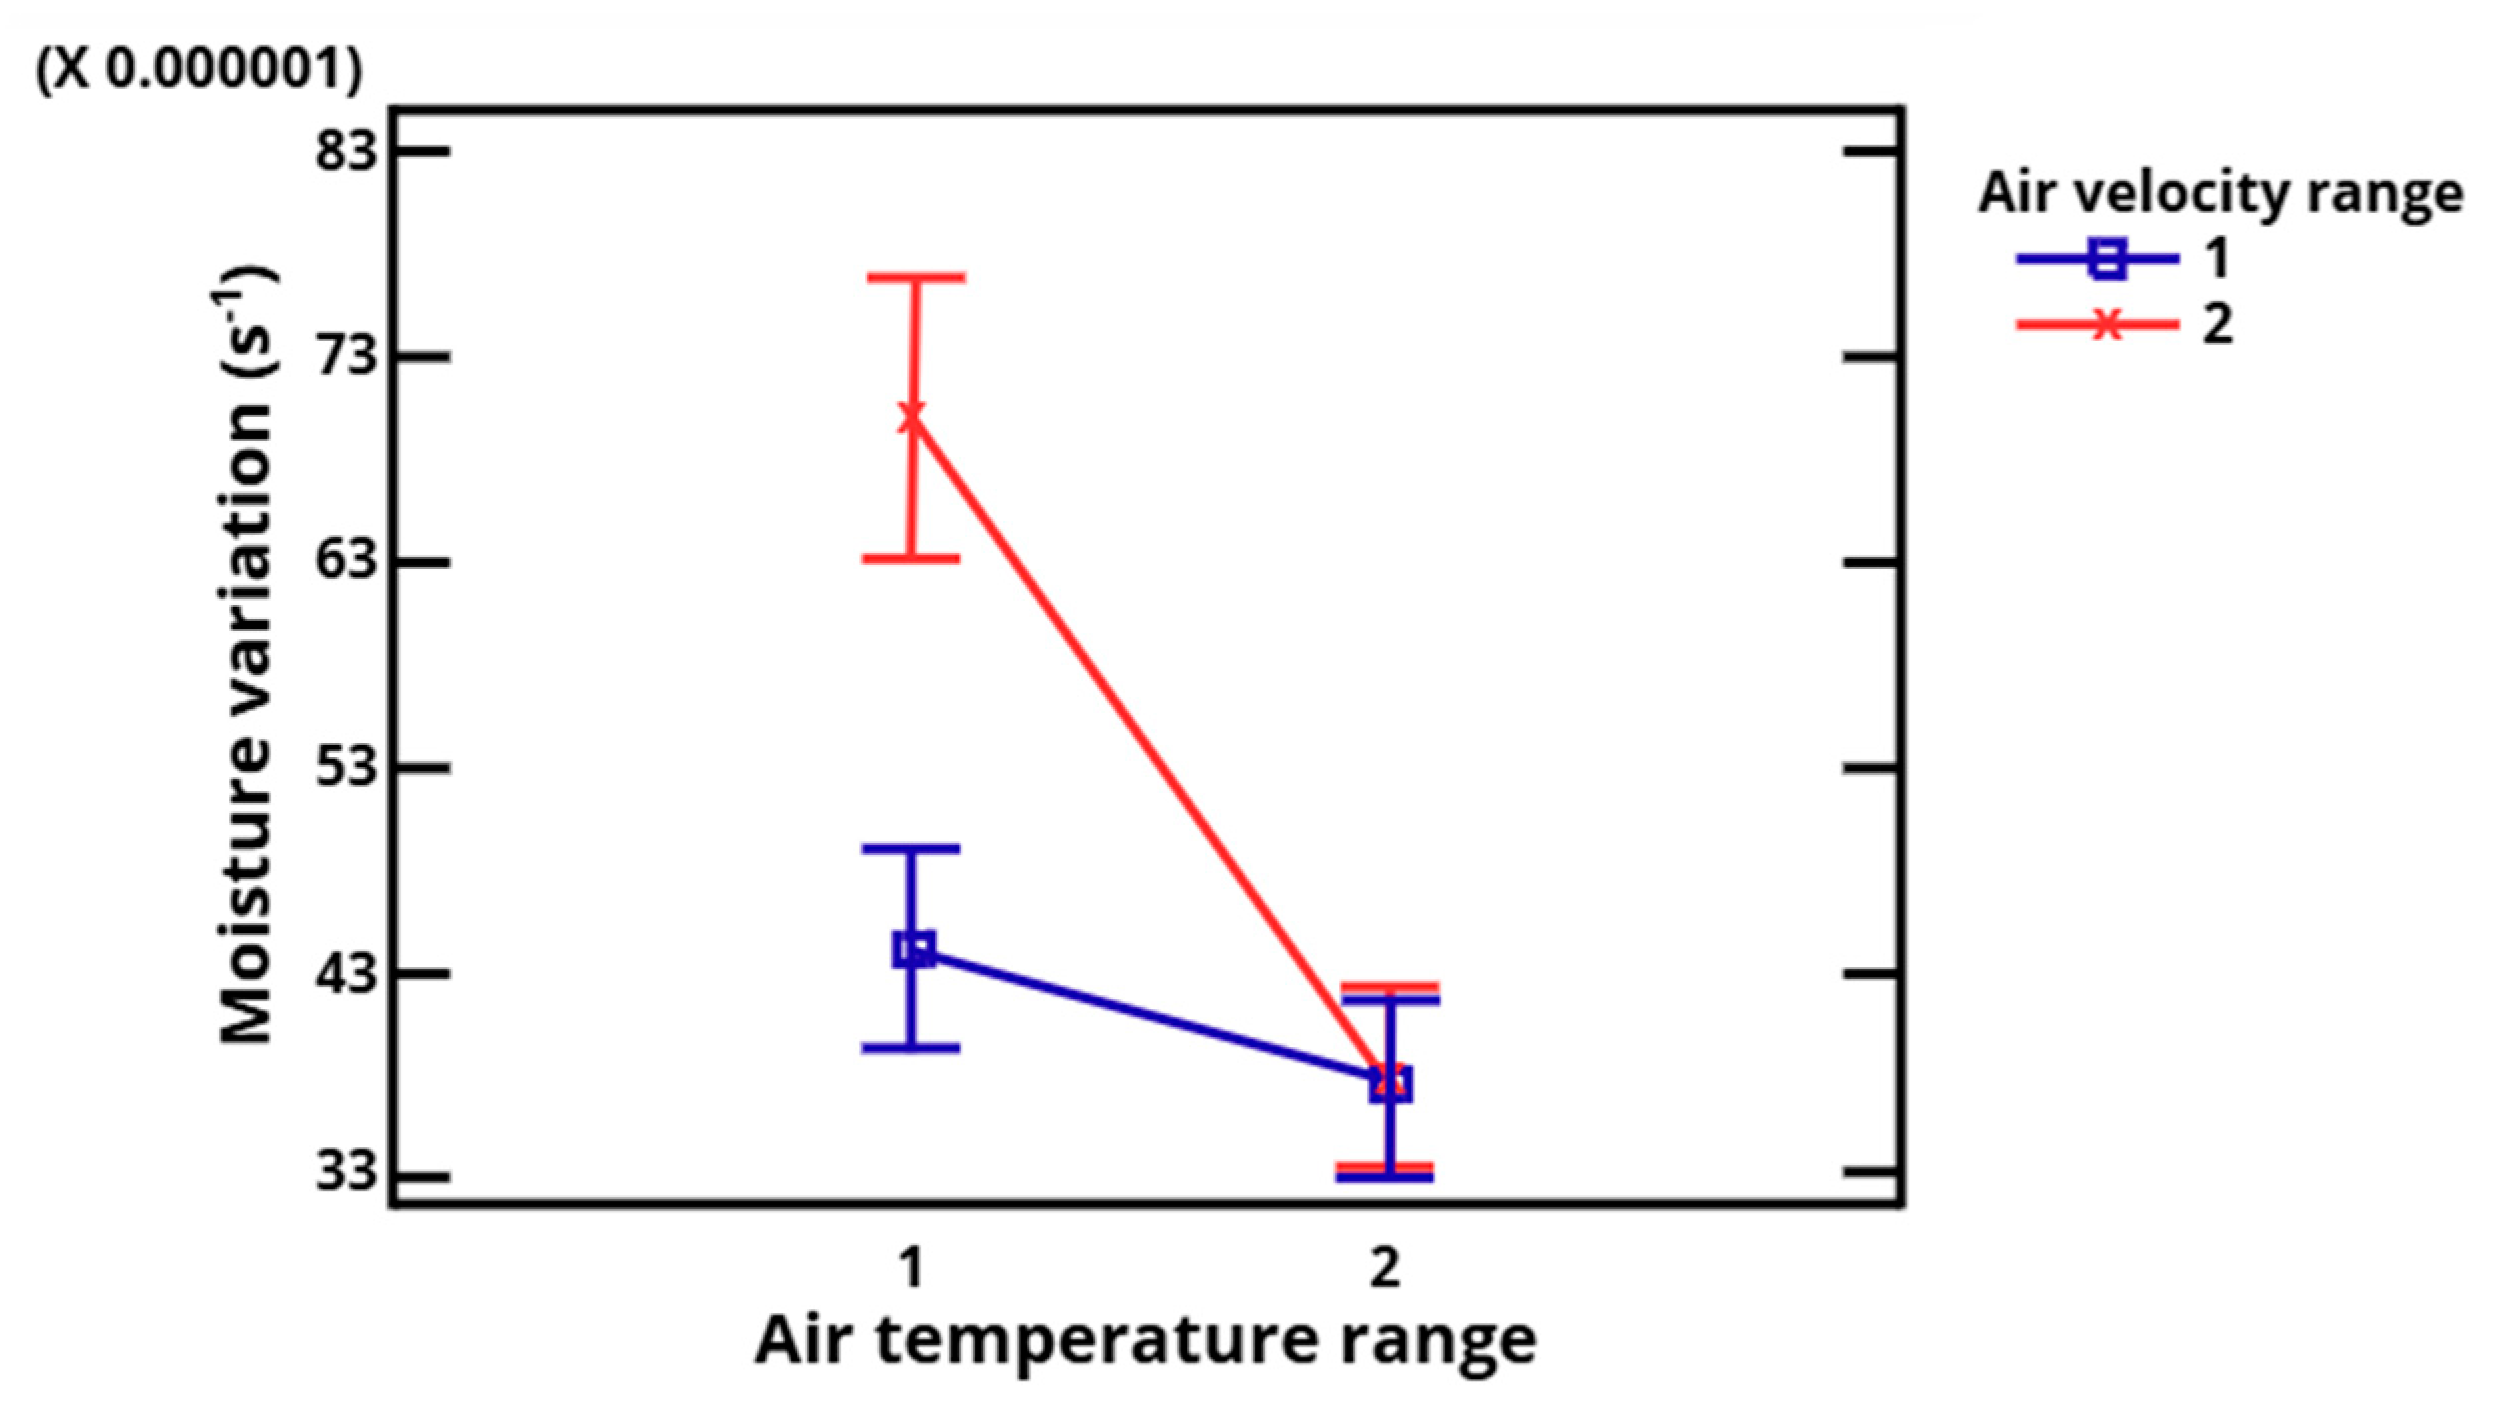
On the other hand, the interaction between air velocity and temperature was only significant for the slope of moisture variation ( d ω ˙ d ω ) (Figure 5). If the air temperature is low ( T 1 range) the velocity has a strong influence, such that when the velocity is high, the moisture variation changes significantly faster with decreasing humidity compared to when the air velocity is lower. However, starting from T 2 , the air velocity does not significantly modify this variable. Therefore, it can be concluded that whenever high temperatures are used, air velocity does not significantly affect the moisture variation within the experienced ranges. This finding is consistent with the study conducted by Ndukwu [42], which demonstrated that air temperature has a stronger effect than air velocity on the drying rate constant in cocoa beans at low temperatures.

3.3. Mass Transfer Models in the Prediction of Drying Rate

After testing with the three possible characteristic lengths and the two air velocities for the calculation of the Reynolds number and the convective mass transfer coefficient h, applying the mass transfer models based on Equations (1) and (2), the most suitable characteristic length was found to be L c c h i p s , which represents the mean length of the wood chip, and v 1 , which denotes the air velocity measured with an anemometer in the dryer before it comes into contact with the woodchips. These variables provided the theoretical drying rates that best fit the experimental data. Therefore, the following equations were deemed most appropriate:
R e = υ 1   ρ   L c c h i p s μ                                           h = S h · D w L c c h i p s
Table 5 presents the mass transfer models for predicting the relative and absolute drying rates, as well as the variation in average moisture content at different wood chip bed heights in the dryer. These equations are of utmost importance as the theoretical drying rate can be calculated for any temperature and air velocity condition within any column of wood chips in a hot air ventilation process.
m ˙ w T ¯ , m ˙ s T ¯ y ω m ˙ w ˙ ¯ are the values obtained from the application of the theoretical mass transfer models using Equation (1).
It can be observed that the coefficient of determination for the regression models relating the theoretical average drying rate obtained from mass transfer models to the average relative ( m ˙ w ¯ ) and absolute ( m ˙ s ¯ ) drying rates, as well as the average moisture content variation ( ω ˙ ¯ ) obtained experimentally, ranges from 47.06% to 86.20%. This indicates that the models explain 47–86% of the variability observed in the experiments. This result is similar to that reported by Ndukwu [42] where a coefficient of determination of 84.8% was reported for the relationship between temperature and drying rate, but when incorporating air velocity, this coefficient decreased to 80.9%.
The obtained coefficient of determination values can be considered acceptable, considering certain inaccuracies in the applied methodology. On one hand, periodically removing boxes with wood chips from the dryer to record their weight variation over time introduces a source of measurement error. On the other hand, determining the transfer area is done approximately since it can vary from one piece to another, and it is impossible to precisely measure all of the wood chips. Additionally, when wood chips are in contact with each other, not all of the surface area is available for moisture removal. However, it has been reported that the drying rate of wood chips increases with a decrease in wood chip size [40,43,44]. Tenorio et al. [45] mentioned that wood chips with a length of 10 cm exhibit slower moisture loss, followed by wood chips of 7 cm and 5 cm in length. Additionally, the air velocity between the wood chips is different from the one considered for calculating the Reynolds number since the cross-sectional area of the gaps between the wood chips is different from that of the air supply tube and much smaller than the drying cylinder cross-sectional area. Several studies [40,46,47] mention that physical factors such as wood chip size lead to different volumes of spaces between the wood chips, thereby modifying the diffusion of water vapor from the interior of the wood chip piles to the exterior. Finally, there is the intrinsic variability within the samples themselves. The porous structure of the wood chips may differ between chips, leading to variations in drying behaviour. That is, the magnitudes of the suction pressure, the force of gravity, and the resistance to viscosity can change depending on the distribution of the pore diameter between wood chips [26]. Therefore, having a coefficient of determination between the models ranging from 47% to 86% can be considered acceptable.

4. Conclusions

This study has demonstrated that the drying rate of Pinus spp. wood chips is not constant but rather decreases over time, and the critical moisture content is above 42%. Also, increasing the height of the wood chip column decreases the relative drying rate but does not affect the amount of water removed per unit of time in the system. The mass transfer deviations presented by the traditional models to calculate the average drying rate can be corrected by applying the regression models obtained in this work.
The application of theoretical mass transfer models requires the selection of an air circulation velocity and the consideration of a water transfer area between the woodchips and the air for the calculation of the Reynolds number, Schmidt number, and subsequently the Sherwood number and h . Given the difficulty of precisely determining these variables, this study evaluated which velocities and areas involved in the process allowed for the calculation of theoretical drying rates that best correlated with the experimental data of the average drying rate of Pinus spp. It has been demonstrated that using the air velocity before it encounters the wood chips and the characteristic length taken as the mean length of the wood chip resulted in models that correlate with the average drying rates with acceptable coefficients of determination.
The drying rate increases with air velocity and temperature, but while air temperature has a more significant impact on reducing drying time, there comes a point where increasing air velocity no longer accelerates the process, especially when high temperatures are used.
This study opens the way for optimizing drying parameters for different woods and industrial setups. The regression models proposed could support more precise predictions and improve our understanding of mass transfer processes in wood drying and other applications, such as food preservation, paper, and composites.

Author Contributions

V.D.N.-R.: Data curation, Formal analysis, Investigation, Methodology, Writing—original draft; A.C.-P.: Funding acquisition, Project administration, Resources, Supervision, Validation, Visualization; J.A.E.M.: Investigation; D.-D.M.-V.: Investigation; B.V.-M.: Conceptualization, Funding acquisition, Investigation, Methodology, Software, Writing—original draft, Writing—review & editing. All authors have read and agreed to the published version of the manuscript.

Funding

We thank SENER-CONACYT for funding “Fondo de Sustentabilidad Energética”, grant number SENER-CONACYT 2014 246911 “Clúster de Biocombustibles Sólidos para la generación térmica y eléctrica” and CONACYT project 166444. Also, we thank CONACYT for the doctorate scholarship awarded, and the UANL Foundation for the international mobility scholarship. This work has been carried out within the framework of the IBEROMASA Network of the Ibero-American Program of Science and Technology for Development (CYTED).

Conflicts of Interest

The authors declare no conflict of interest.

Nomenclature

A Transfer area (m2) R e Reynolds number
B I O T m a s s Biot number of the mass transfer process S c Schmidt number
D w Mass diffusivity (m−2 s−1) S c s Schmidt number at the mass transfer surface
D 1 Diameter of the air supply tube before the diffuser cone (m) S h Sherwood number
D 2 Diameter of the drying column (m) T Air temperature (°C)
h Convective mass transfer coefficient (m−2 s−1) t Drying process time (s)
H Wood chip column height (cm) V υ Air velocity (m s−1)
L c -Characteristic length (m) v 1 Air velocity measured before its contact with the wood chips (m s−1)
L c c h i p s Mean length of the chip (m) v 2 Air velocity after passing through the bed of wood chips (m s−1)
m i Initial mass of the wood chips (g)Greek symbols
m f Final mass of the wood chips (g)
m d r y Mass of the dry wood chips (kg) ρ Air density (kg m−3)
m ˙ s ¯ Average absolute drying rate (g of water s−1) μ Dynamic viscosity (kg m−1 s−1)
m ˙ s Instantaneous absolute drying rate (g of water s−1)
m ˙ s Mass of water removed per unit of time (g s−1) ω ˙ ¯ Average moisture variation (% s−1)
m ˙ w ¯ Average relative drying rate (g of water s−1 kg of dry wood chip−1) ω ˙ Instantaneous moisture variation (% s−1)
m ˙ w Instantaneous relative drying rate (g of water s−1 kg of dry chip−1) ω a i r Absolute air humidity (kg of water kg of dry air−1)
m 1 Mass of wood chips at time t 1 (g) ω s a t Saturation absolute humidity (kg of water kg of dry air−1)
m 2 Mass of wood chips at time t 2 (g) ρ a i r Air density (kg of dry air m−3)

References

  1. Khamtree, S.; Ratanawilai, T.; Nuntadusit, C.; Marzbani, H. Experimental study and numerical modeling of heat and mass transfer in rubberwood during kiln drying. Heat Mass Transf. 2020, 57, 453–464. [Google Scholar] [CrossRef]
  2. Koukouch, A.; Bakhattar, I.; Asbik, M.; Idlimam, A.; Zeghmati, B.; Aharoune, A. Analytical solution of coupled heat and mass transfer equations during convective drying of biomass: Experimental validation. Heat Mass Transf. 2020, 56, 1971–1983. [Google Scholar] [CrossRef]
  3. Kuznetsov, G.V.; Syrodoy, S.V.; Nigay, N.A.; Maksimov, V.I.; Gutareva, N.Y. Features of the processes of heat and mass transfer when drying a large thickness layer of wood biomass. Renew. Energy 2021, 169, 498–511. [Google Scholar] [CrossRef]
  4. Sychevskii, V.A. Heat and Mass Transfer in Convective Wood-Drying Plants. J. Eng. Phys. Thermophys. 2018, 91, 705–711. [Google Scholar] [CrossRef]
  5. Callejón-Ferre, A.J.; Carreño-Sánchez, J.; Suárez-Medina, F.J.; Pérez-Alonso, J.; Velázquez-Martí, B. Prediction models for higher heating value based on the structural analysis of the biomass of plant remains from the greenhouses of Almería (Spain). Fuel 2014, 116, 377–387. [Google Scholar] [CrossRef]
  6. Velázquez-Martí, B. Aprovechamiento de la Biomasa Para Uso Energético, 2nd ed.; Reverté: Barcelona, Spain, 2017; ISBN 978-84-9048-675-7. [Google Scholar]
  7. Kamperidou, V. Quality Analysis of Commercially Available Wood Pellets and Correlations between Pellets Characteristics. Energies 2022, 15, 2865. [Google Scholar] [CrossRef]
  8. Konopka, A.; Barański, J.; Orłowski, K.A.; Mikielewicz, D.; Dzurenda, L. Mathematical model of the energy consumption calculation during the pine sawn wood (Pinus sylvestris L.) drying process. Wood Sci. Technol. 2021, 55, 741–755. [Google Scholar] [CrossRef]
  9. Mołczan, T.; Cyklis, P. Mathematical Model of Air Dryer Heat Pump Exchangers. Energies 2022, 15, 7092. [Google Scholar] [CrossRef]
  10. Mołczan, T.; Cyklis, P. Impact of the Evaporation Temperature on the Air Drying Rate for a Finned Heat Exchanger. Energies 2023, 16, 2132. [Google Scholar] [CrossRef]
  11. Mohan, V.P.C.; Talukdar, P. Design of an experimental set up for convective drying: Experimental studies at different drying temperature. Heat Mass Transf. 2013, 49, 31–40. [Google Scholar] [CrossRef]
  12. Chávez, C.A.; Moraga, N.O.; Salinas, C.H.; Cabrales, R.C.; Ananías, R.A. Modeling unsteady heat and mass transfer with prediction of mechanical stresses in wood drying. Int. Commun. Heat Mass Transf. 2021, 123, 105230. [Google Scholar] [CrossRef]
  13. Simo-Tagne, M.; Rémond, R.; Rogaume, Y.; Zoulalian, A.; Bonoma, B. Modeling of coupled heat and mass transfer during drying of tropical woods. Int. J. Therm. Sci. 2016, 109, 299–308. [Google Scholar] [CrossRef]
  14. Çengel, Y. Transferencia de Calor y Masa; Tercera, Ed.; McGraw-Hill Interamericana: New York, NY, USA, 2007; ISBN 9788578110796. [Google Scholar]
  15. Jalili, M.; Anca-Couce, A.; Zobel, N. On the uncertainty of a mathematical model for drying of a wood particle. Energy Fuels 2013, 27, 6705–6717. [Google Scholar] [CrossRef]
  16. Dedic, A.D. Modelling of coupled heat and mass transfer during convective drying of wood. Dry. Technol. 2002, 20, 1299–1301. [Google Scholar] [CrossRef]
  17. Tremblay, C.; Cloutier, A.; Fortin, Y. Experimental determination of the convective heat and mass transfer coefficients for wood drying. Wood Sci. Technol. 2000, 34, 253–276. [Google Scholar] [CrossRef]
  18. Skarbalius, G.; Džiugys, A.; Misiulis, E.; Navakas, R. A novel method for convective drying rate estimation in a deep fixed porous material bed. Powder Technol. 2022, 404, 117499. [Google Scholar] [CrossRef]
  19. Vorotinskienė, L.; Paulauskas, R.; Zakarauskas, K.; Navakas, R.; Skvorčinskienė, R.; Striūgas, N. Parameters influencing wet biofuel drying during combustion in grate furnaces. Fuel 2020, 265, 117013. [Google Scholar] [CrossRef]
  20. Bajwa, D.S.; Peterson, T.; Sharma, N.; Shojaeiarani, J.; Bajwa, S.G. A review of densified solid biomass for energy production. Renew. Sustain. Energy Rev. 2018, 96, 296–305. [Google Scholar] [CrossRef]
  21. UNE-EN ISO 17225-4; Especificaciones y Clases de Combustibles. Parte 4: Clases de Astillas de Madera. Spanish Association for Standardization and Certification: Madrid, Spain, 2014.
  22. UNE-EN ISO 18134-3; Determinación del Contenido de Humedad. Método de Secado en Estufa. Parte 3: Humedad de la Muestra Para Análisis General. Spanish Association for Standardization and Certification: Madrid, Spain, 2016.
  23. Coumans, W.J. Models for drying kinetics based on drying curves of slabs. Chem. Eng. Process. Process Intensif. 2000, 39, 53–68. [Google Scholar] [CrossRef]
  24. Kucuk, H.; Midilli, A.; Kilic, A.; Dincer, I. A Review on Thin-Layer Drying-Curve Equations. Dry. Technol. 2014, 32, 757–773. [Google Scholar] [CrossRef]
  25. Ananias, R.A.; Vallejos, S.; Salinas, C. Estudio de la cinética del secado convencional y bajo vacío del pino radiata. Maderas Cienc. Tecnol. 2005, 7, 37–47. [Google Scholar] [CrossRef]
  26. Inoue, T.; Iyota, H.; Nishimura, N.; Yoshida, M. Effect of Pore Size Distribution on Heat and Moisture Transfer in Porous Material for High Humidity Hot Air and Superheated Steam Drying. J. Jpn. Soc. Exp. Mech. 2009, 9, 54–59. [Google Scholar]
  27. Ananias, R.A.; Mougel, E.; Zoulalian, A. Introducing an overall mass-transfer coefficient for prediction of drying curves at low-temperature drying rates. Wood Sci. Technol. 2009, 43, 43–56. [Google Scholar] [CrossRef]
  28. Arabi, M.; Faezipour, M.M.; Layeghi, M.; Khanali, M.; Zareahosseinabadi, H. Evaluation of thin-layer models for describing drying kinetics of poplar wood particles in a fluidized bed dryer. Part. Sci. Technol. 2017, 35, 723–730. [Google Scholar] [CrossRef]
  29. Hosseinabadi, H.Z.; Doosthoseini, K.; Layeghi, M. Drying Kinetics of Poplar (Populus deltoides) Wood Particles by a Convective Thin Layer Dryer. Drv. Ind. 2012, 63, 169–176. [Google Scholar] [CrossRef]
  30. Sridhar, D.; Madhu, G.M. Drying kinetics and mathematical modeling of Casuarina equisetifolia wood chips at various temperatures. Period. Polytech. Chem. Eng. 2015, 59, 288–295. [Google Scholar] [CrossRef]
  31. Keey, R.; Langrish, T.A.G.; Walker, K.C.F. Kiln-Drying of Lumber, 1st ed.; Springer: Berlin/Heidelberg, Germany, 2000; ISBN 978-3-642-64071-1. [Google Scholar]
  32. Ozollapins, M.; Kakitis, A.; Nulle, I. Stalk biomass drying rate evaluation. Eng. Rural Dev. 2013, 482–487. [Google Scholar]
  33. Grubecki, I. Airflow versus pressure drop for a mixture of bulk wood chips and bark at different moisture contents. Biosyst. Eng. 2015, 139, 100–110. [Google Scholar] [CrossRef]
  34. Kuptz, D.; Hartmann, H. Prediction of air pressure resistance during the ventilation of wood chips as a function of multiple physical fuel parameters. Biomass Bioenergy 2021, 145, 105948. [Google Scholar] [CrossRef]
  35. Bengtsson, P. Experimental analysis of low-temperature bed drying of wooden biomass particles. Dry. Technol. 2008, 26, 602–610. [Google Scholar] [CrossRef]
  36. Phanphanich, M.; Mani, S. Drying characteristics of pine forest residues. BioResources 2009, 5, 108–120. [Google Scholar] [CrossRef]
  37. Cota-Espericueta, A.D.; Ponce-Corral, C. Eliminación de bacterias patógenas en lodos residuales durante el secado solar. Rev. Int. Contam. Ambient. 2008, 24, 161–170. [Google Scholar]
  38. Ståhl, M.; Granström, K.; Berghel, J.; Renström, R. Industrial processes for biomass drying and their effects on the quality properties of wood pellets. Biomass Bioenergy 2004, 27, 621–628. [Google Scholar] [CrossRef]
  39. Klavina, K.; Cinis, A.; Zandeckis, A. Experimental Study on the Effects of Air Velocity, Temperature and Depth on Low-temperature Bed Drying of Forest Biomass Residue. Energy Procedia 2015, 72, 42–48. [Google Scholar] [CrossRef]
  40. Ahmadinia, S.; Palviainen, M.; Kiuru, P.; Routa, J.; Sikanen, L.; Urzainki, I.; Laurén, A. Forest chip drying in self-heating piles during storage as affected by temperature and relative humidity conditions. Fuel 2022, 324, 124419. [Google Scholar] [CrossRef]
  41. Lerman, P.; Wennberg, O. Experimental method for designing a biomass bed dryer. Biomass Bioenergy 2011, 35, S31–S39. [Google Scholar] [CrossRef]
  42. Ndukwu, M.C. Effect of Drying Temperature and Drying Air Velocity on the Drying Rate and Drying Constant of Cocoa Bean. Agric. Eng. Int. CIGR J. 2009. [Google Scholar]
  43. Pari, L.; Brambilla, M.; Bisaglia, C.; Del Giudice, A.; Croce, S.; Salerno, M.; Gallucci, F. Poplar wood chip storage: Effect of particle size and breathable covering on drying dynamics and biofuel quality. Biomass Bioenergy 2015, 81, 282–287. [Google Scholar] [CrossRef]
  44. Rezaei, H.; Jim Lim, C.; Lau, A.; Bi, X.; Sokhansanj, S. Development of Empirical Drying Correlations for Ground Wood Chip and Ground Wood Pellet Particles. Dry. Technol. 2017, 35, 1423–1432. [Google Scholar] [CrossRef]
  45. Tenorio, C.; Moya, R.; Cubero, R. Difusión del agua en astillas de madera de diez especies de rápido crecimiento en plantaciones en costa rica. Interciencia 2014, 39, 129–135. [Google Scholar]
  46. Anerud, E.; Larsson, G.; Eliasson, L. Storage of wood chips: Effect of chip size on storage properties. Croat. J. For. Eng. 2020, 41, 277–286. [Google Scholar] [CrossRef]
  47. Pecenka, R.; Lenz, H.; Idler, C. Influence of the chip format on the development of mass loss, moisture content and chemical composition of poplar chips during storage and drying in open-air piles. Biomass Bioenergy 2018, 116, 140–150. [Google Scholar] [CrossRef]
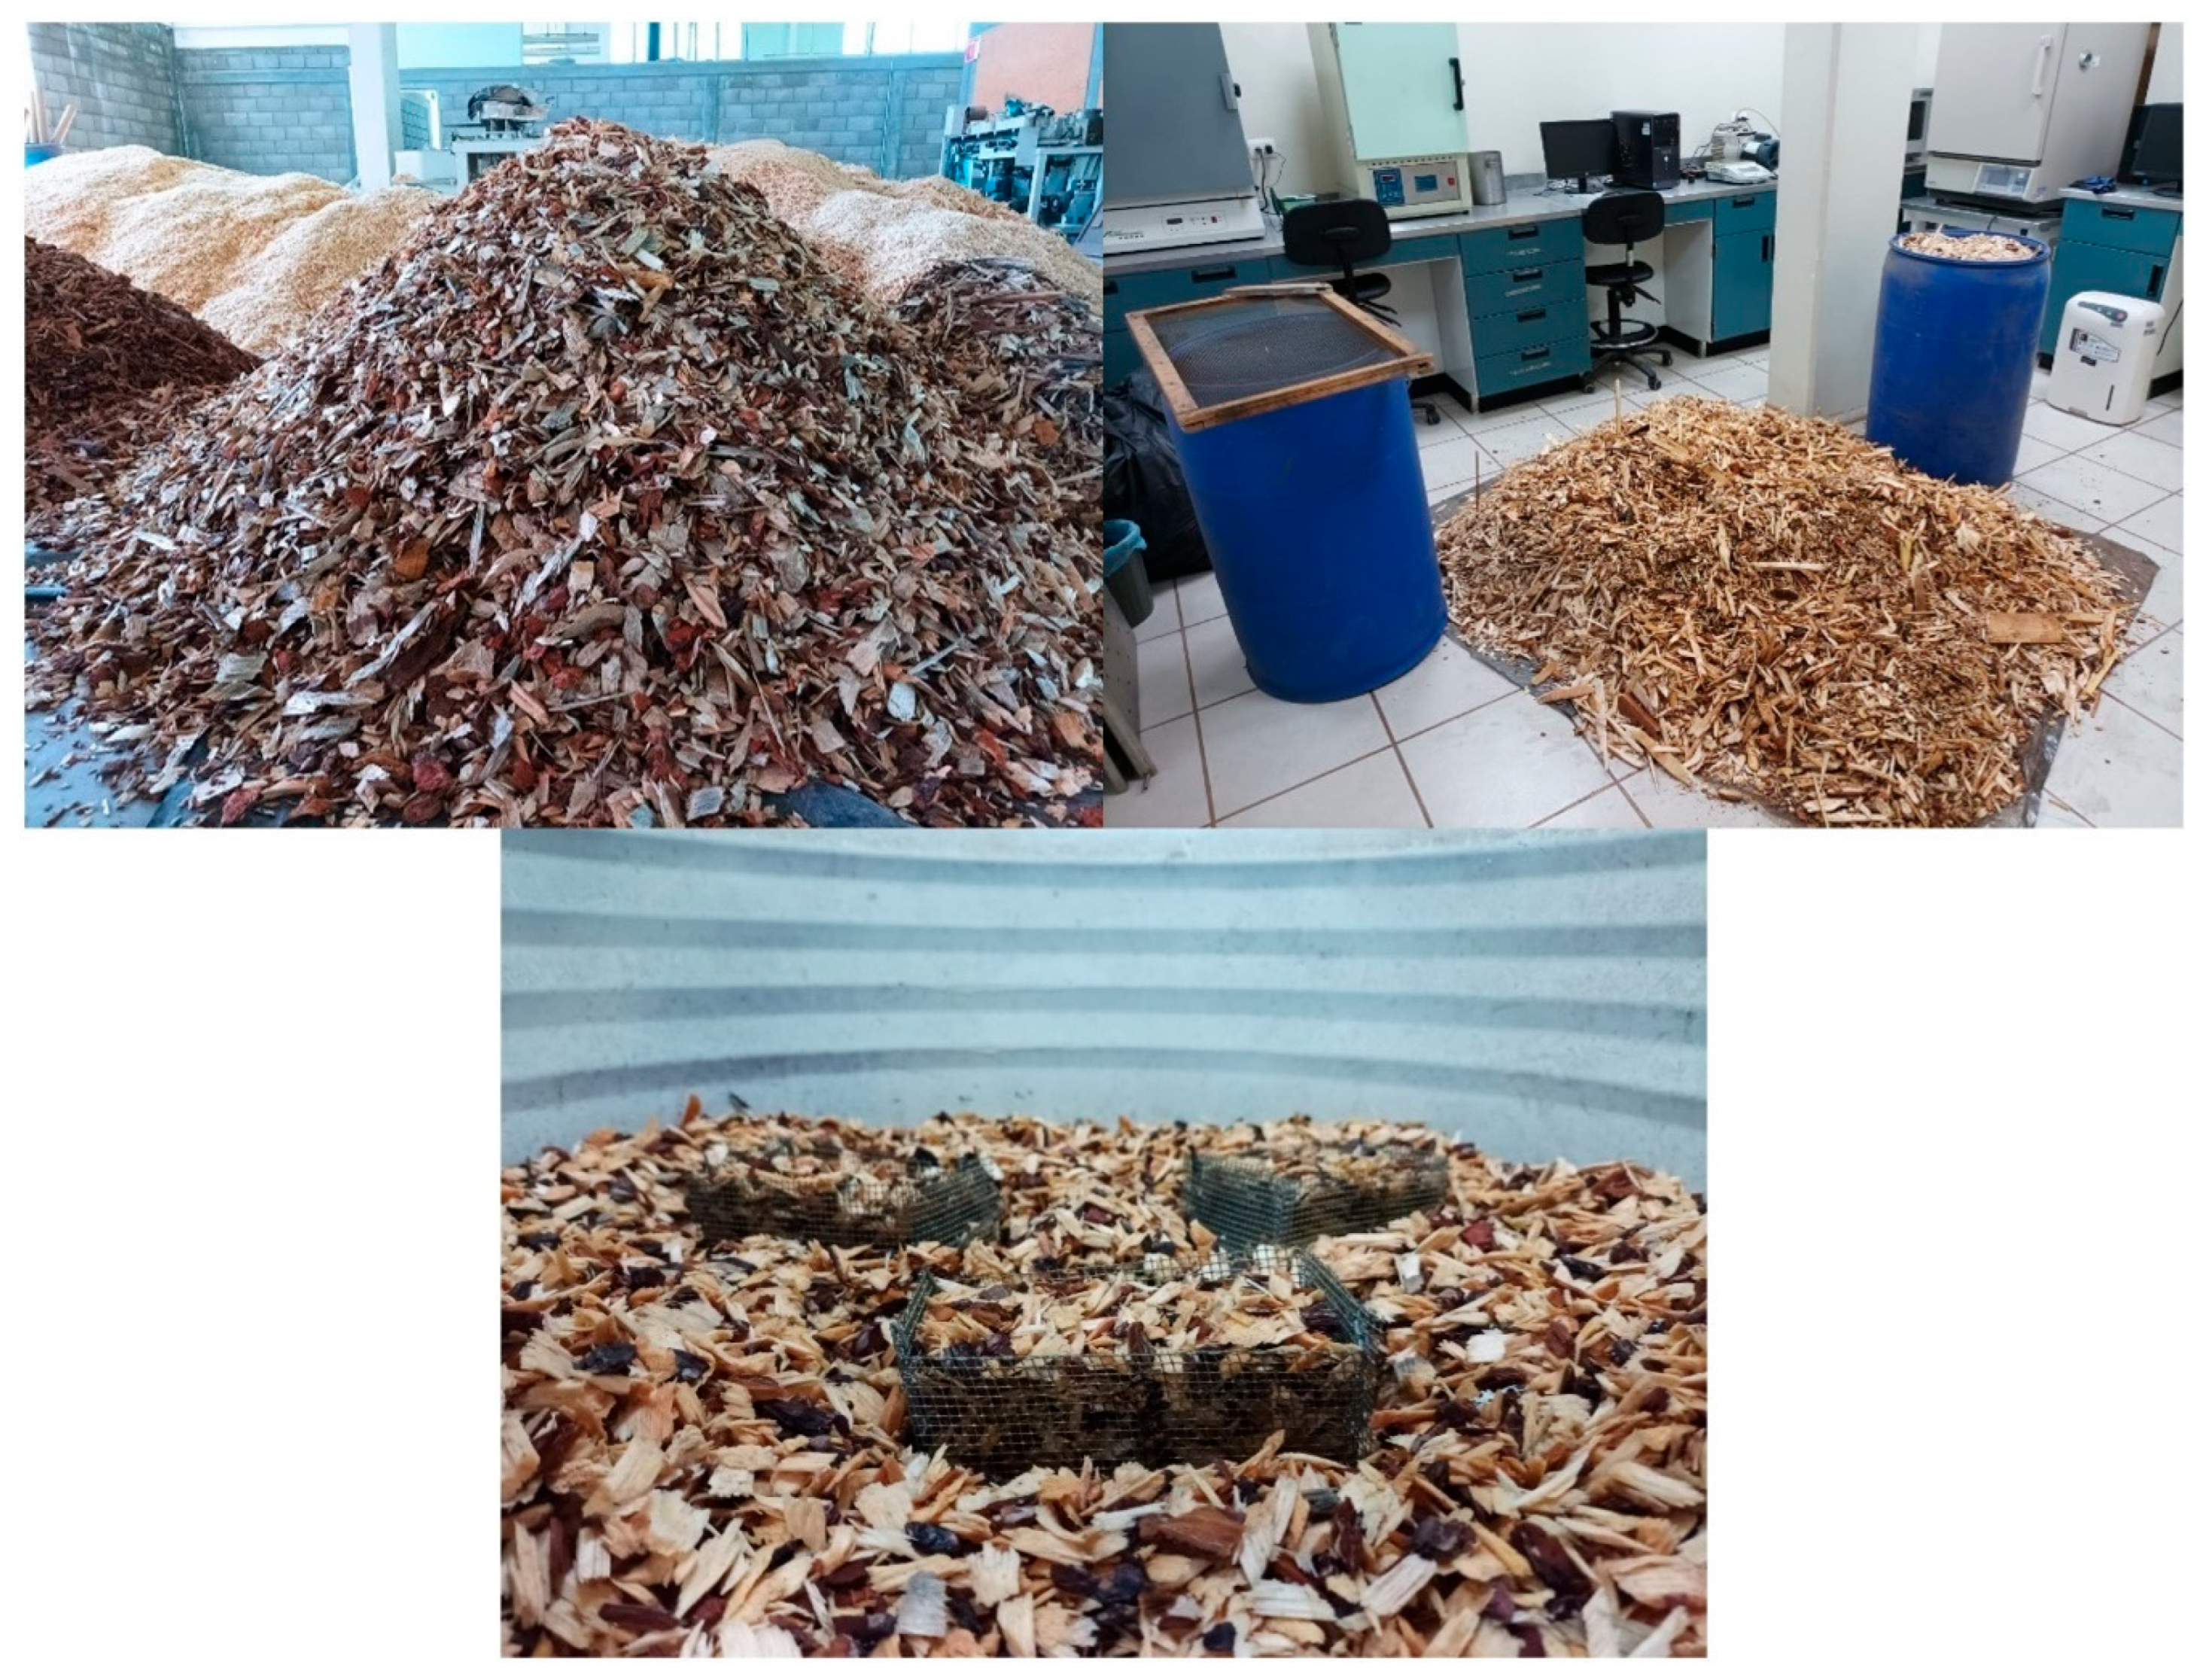
Figure 1. Pine wood chips used in the experiments.
Applsci 15 10081 g001
Figure 2. Experimental biomass dryer.
Applsci 15 10081 g002
Figure 3. Moisture content loss of pine wood chips. (a) Moisture variation with time, (b) Drying rate of pine wood chips. Experimental data (blue line) correspond to mean values obtained from triplicate runs (n = 18). The statistical fit (red line) was performed using these averaged data.
Applsci 15 10081 g003
Figure 4. The LSD intervals for the interaction between the air temperature ranges and height on (a) absolute drying rate and (b) slope of moisture variation.
Applsci 15 10081 g004
Figure 5. LSD intervals for the interaction between temperature and air velocity ranges on the slope of moisture variation against moisture content.
Applsci 15 10081 g005
Table 1. Levels of the evaluated factors in each experiment.
Airflow (m s−1)Temperature (°C)Height (cm)
V 1 6.93–8.46 T 1 40.10–48.84 H 1 3
T 2 48.84–57.58
V 2 8.46–9.99 H 2 6
T 3 57.58–66.32
Table 2. Slopes of the curves for the variation of instantaneous drying rates (relative and absolute) and the variation of instantaneous moisture with the moisture content of the wood chips.
d ω ˙ d ω d m ˙ w   d ω d m ˙ s   d ω
Table 3. Statistical description of the kinetic variables of the drying process in the experimental setup for each of the levels of the studied factors.
ParameterFactor MeanStandard
Deviation
MinimumMaximumStandardized
Skewness
Standardized Kurtosis
m ˙ w ¯
(g of water s−1 kg of dry chip−1)
Height H 1 0.0630.0150.0340.1040.61−1.46
H 2 0.0400.0100.0230.0661.72−1.15
Air velocity V 1 0.0460.0100.0230.0661.29−0.38
V 2 0.0570.0170.0280.1041.71−1.35
Air temperature T 1 0.0410.0100.0230.0640.96−1.33
T 2 0.0580.0120.0340.0841.62−0.09
T 3 0.0550.0190.0280.104−1.22−0.73
m ˙ s ¯
(g of water s−1)
Height H 1 0.00310.00090.00190.00582.82−0.18
H 2 0.00320.00080.00160.00551.65−0.48
Air velocity V 1 0.00280.00050.0010.0040.83−1.75
V 2 0.00350.00080.0020.0051.41−1.17
Air temperature T 1 0.00240.00030.00160.00320.85−0.73
T 2 0.00350.00060.00220.00551.55−0.28
T 3 0.00360.00080.00250.00581.03−1.01
ω ˙ ¯
(% of water s−1)
Height H 1 0.00240.00080.000130.00472.53−1.58
H 2 0.00170.00040.00080.00270.89−1.12
Air velocity V 1 0.00190.00040.00080.00302.771.58
V 2 0.00220.00070.00100.00413.580.04
Air temperature T 1 0.00160.00040.00080.00281.94−0.90
T 2 0.00220.00030.00110.00302.870.89
T 3 0.00240.00080.00180.00411.46−1.76
d m ˙ w d ω
(g of water s−1 kg of dry chip−1 %−1)
Height H 1 0.00280.00090.00130.00511.24−1.75
H 2 0.00220.00070.00110.00401.73−1.15
Air velocity V 1 0.00210.00040.00110.00311.45−0.57
V 2 0.00290.00080.00130.00511.11−0.88
Air temperature T 1 0.00190.00050.00110.00302.00−0.88
T 2 0.00270.00060.00130.00421.64−0.79
T 3 0.00300.00080.00160.0051−0.43−0.86
d m ˙ s d ω
(g of water s−1 %−1)
Height H 1 0.000130.000040.000050.000293.841.94
H 2 0.000180.000060.000080.000342.94−0.50
Air velocity V 1 0.000130.000030.000050.000231.77−0.72
V 2 0.000180.000060.000080.000342.28−1.19
Air temperature T 1 0.000110.000020.000070.000181.140.75
T 2 0.000170.000050.000050.000311.93−0.09
T 3 0.000190.000060.000130.000341.46−0.35
d ω ˙ d ω
(s−1)
Height H 1 0.0000490.000020.000020.000143.450.12
H 2 0.0000410.000010.000020.000094.612.64
Air velocity V 1 0.0000400.000020.000020.000093.770.61
V 2 0.0000490.000020.000020.000113.580.10
Air temperature T 1 0.0000520.000020.000020.000100.85−1.83
T 2 0.0000380.000010.000020.000082.060.57
T 3 0.0000430.000010.000020.000092.010.87
Table 4. ANOVA of the drying rates and moisture variation slopes of the pine chips by height in the dryer, and by ranges of air velocity and temperature.
ParameterFactorsInteractions
HeightAir VelocityAir Temperature H × V H × T V × T
m ˙ w ¯ H 1 0.063 ± 0.015 a
H 2 0.040 ± 0.010 b
V1 0.046 ± 0.010 b
V2 0.057 ± 0.017 a
T1 0.041 ± 0.010 b
T2 0.058 ± 0.012 a
T3 0.055 ± 0.019 a
No
interaction
No
interaction
No
interaction
m ˙ s ¯ H 1 0.0031 ± 0.0009 a
H 2 0.0032 ± 0.0008 a
V1 0.0028 ± 0.0005 b
V2 0.0035 ± 0.0008 a
T1 0.0024 ± 0.0003 b
T2 0.0035 ± 0.0006 a
T3 0.0036 ± 0.0008 a
No
interaction
Interaction p = 0.0001No
interaction
ω ˙ ¯ H 1 0.0024 ± 0.0008 a
H 2 0.0017 ± 0.0004 b
V1 0.0019 ± 0.0004 b
V2 0.0022 ± 0.0007 a
T1 0.0016 ± 0.0004 c
T2 0.0022 ± 0.0003 b
T3 0.0024 ± 0.0008 a
No
interaction
No
interaction
No
interaction
d m ˙ w d ω H 1 0.0028 ± 0.0009 a
H 2 0.0022 ± 0.0007 b
V1 0.0021 ± 0.0004 b
V2 0.0029 ± 0.0008 a
T1 0.0019 ± 0.0005 c
T2 0.0027 ± 0.0006 b
T3 0.0030 ± 0.0008 a
No
interaction
No
interaction
No
interaction
d m ˙ s d ω H 1 0.00013 ± 0.00004 b
H 2 0.00018 ±0.00006 a
V1 0.00013 ± 0.00003 b
V2 0.00018 ± 0.00006 a
T1 0.00011 ± 0.00002 c
T2 0.00017 ± 0.00005 b
T3 0.00019 ± 0.00006 a
No
interaction
No
interaction
No
interaction
d ω ˙ d ω H 1 0.000049 ± 0.00002 a
H 2 0.000041 ± 0.00001 b
V1 0.000040 ± 0.00002 b
V2 0.000049 ± 0.00002 a
T1 0.000052 ± 0.00002 a
T2 0.000038 ± 0.00001 b
T3 0.000043 ± 0.00001 ab
No
interaction
Interaction
p = 0.02
Interaction p = 0.0007
Values with the same letters are statistically similar according to Fisher’s Least Significant Difference (LSD) test (p ≥ 0.05). The symbol ± represents the standard deviation.
Table 5. Equations describing the average relative drying rate, average absolute drying rate, and variation in average moisture content for different wood chip bed heights.
ParameterHeightModelR2Adjusted R2MAERMS
m ˙ w ¯ General 0.0293 + 14.0941 · m ˙ w T ¯ 57.1156.870.00840.0101
H 1 0.0418 + 10.5835 · m ˙ w T ¯ 64.0363.510.00680.0085
H 2 0.0201 + 18.9509 · m ˙ w T ¯ 59.8759.430.00550.0067
m ˙ s ¯ General 0.0017 + 0.0153 · m ˙ s T ¯ 80.3680.220.000310.00037
H 1 0.0017 + 0.0148 · m ˙ s T ¯ 86.2086.000.000300.00035
H 2 0.0016 + 0.0167 · m ˙ s T ¯ 71.1670.770.000310.00038
ω ˙ ¯ General 0.0011 + 0.3963 · ω m ˙ w ˙ ¯ 47.0646.710.000250.00029
H 1 0.0016 + 0.2038 · ω m ˙ w ˙ ¯ 68.5267.440.000110.00013
H 2 0.0009 + 0.4899 · ω m ˙ w ˙ ¯ 57.1756.770.000220.00026
Disclaimer/Publisher’s Note: The statements, opinions and data contained in all publications are solely those of the individual author(s) and contributor(s) and not of MDPI and/or the editor(s). MDPI and/or the editor(s) disclaim responsibility for any injury to people or property resulting from any ideas, methods, instructions or products referred to in the content.