Article

Design and Optimization of a Contour Deep Loosening and Stubble Pressing Mechanism Suitable for Strip Tillage

1
College of Mechanical and Electronic Engineering, Shandong Agricultural University, Taian 271018, China
2
Shandong Academy of Agricultural Machinery, Jinan 250100, China
3
Shandong Academy of Agricultural Sciences, Jinan 250100, China
*
Author to whom correspondence should be addressed.
Appl. Sci. 2025, 15(18), 10062; https://doi.org/10.3390/app151810062
Submission received: 20 August 2025 / Revised: 9 September 2025 / Accepted: 12 September 2025 / Published: 15 September 2025

Abstract

Aiming at the problems of excessive soil disturbance caused by deep plowing and stripped straw backfilling in strip tillage machinery, which are induced by the large amount of residual straw before maize sowing in the Huang-Huai-Hai Region, an integrated tillage machine suitable for pre-sowing strip tillage of summer maize—integrating subsoiling, stubble-crushing, and soil-guiding functions—was designed. First, the physical properties of straw were analyzed to determine the tooth profile parameters of the stubble-crushing wheel. The unique convex structure of the tooth disc enables it to simultaneously perform depth-limiting and soil-pressing functions. By calculating the flow characteristics of soil during tillage, the angle and distance between the subsoiling shovel and the stubble-crushing wheel were designed. This not only enhances soil crushing and flow but also reduces the occurrence of blockages. A discrete element simulation test with quadratic orthogonal rotation combination was conducted. The machine’s forward speed, wheel position distance, and wheel deflection angle were selected as test factors to analyze their effects on the soil loss rate of the seedbed strip and straw backflow effect under different combinations. The optimal combination of parameters was determined as follows: forward speed of 7.383 km/h, front–rear position distance parameter of −10.131 cm, and deflection angle of 8.608°, with the soil loss rate of the seedling belt reaching 5.486% under this condition. Field experiments were conducted in combination with the strip tiller to verify the simulation-optimized parameters, and comparative experiments at different speeds were also carried out. The field experimental results showed that the deviation of the actual soil disturbance rate caused by the machine from the simulated value was −1.166%, and the soil disturbance rate within the seedling belt was even lower. The results indicated that after the operation of the improved machine, there were no obvious ruts on the soil surface, and the straw was evenly distributed at the edge of the seedling belt, which meets the agronomic requirements for maize planting.

1. Introduction

The double-cropping agricultural areas, primarily covering parts of Beijing, Tianjin, Hebei, Shandong, and Henan in the North China Plain [1], represent a critical grain-producing region in China [2]. Currently, the dominant tillage practice in these double-cropping areas is continuous flat planting for two crops per year, which results in a large amount of residual straw remaining in the field. At present, the primary approach to address extensive field-residual straw is direct stubble crushing and returning to the field [3]. While direct straw returning can improve soil fertility and indirectly increase crop yield, it leads to blockage issues during sowing, which impairs sowing efficiency [4]. Meanwhile, the decomposition of straw in the seedbed strip exacerbates plant diseases and insect pests, reducing the subsequent seedling emergence rate [5]. Therefore, there is an urgent need to explore novel straw management methods [6].
In double-cropping areas, the no-tillage sowing technology for maize during the “Three Summers” period (i.e., summer harvesting, summer sowing, and summer field management) has been basically mature [7]. Currently, shallow subsoiling is widely adopted in the process of strip tillage operations, which leads to uneven sowing depths of seeds and even seed exposure on the soil surface—ultimately resulting in a low seedling emergence rate [8]. Additionally, soil clogging and soil pushing are common occurrences during sowing operations. At present, strip tillage machinery still faces problems, such as excessive soil disturbance and straw backfilling [9].
Relevant research has been conducted both domestically and internationally to address the aforementioned issues [10]. Yang Shandong adopted a wide seedling belt sowing mode and designed an auger-type soil covering and leveling mechanism capable of completing stubble removal, sowing, soil covering and leveling, and rolling in one pass. Through power-driven rotary tillage, this mechanism can crush straw in the seedling belt area, reducing straw accumulation during sowing [11]. Sun Wenliang developed a passive strip clearing mechanism with independent profiling capability, which can cut long straw at the edge of the seedling belt and minimize straw entanglement and blockage during high-speed sowing [12]. Wang Qingjie proposed a method of picking up, crushing, and deep-burying straw in strips: by crushing and screening straw, the straw is crushed and buried in the deep soil, avoiding straw interference during shallow subsoiling and sowing [13]. Lin Jing presented a combined operation machine for strip subsoiling, clearing, and straw mixing–burying. This machine places a stubble-cutting disc in front of the subsoiling shovel to first cut and then crush the straw in the seedling belt, followed by subsoiling the soil to treat the straw in the seedling belt [14]. Internationally, BIGham Company (USA) uses curved baffles on both sides of the seedling belt to guide the flow of subsoiled soil, which can effectively reduce the range of soil disturbance under low-speed operation conditions. Farmet (Czech Republic) employs large, notched discs for flow-guiding operations. During strip sowing, these discs can cut the straw at the edge of the seedling belt and divert the soil in the seedling belt. Domestically, the common practice is to cut and crush straw in the seedling belt. With the assistance of external power, although the problem of straw accumulation has been generally solved, the issue of uneven seed sowing depths caused by excessive soil disturbance still persists. Internationally, large-scale machinery is more prevalent, which uses large-sized notched discs to cut straw. These machines have high cutting force but are mostly designed for single terrain types and lack depth-limiting and undulation-adapting capabilities. Currently, there is a wide variety of strip subsoiling machinery; therefore, it is feasible to integrate the functions of different components and design multi-functional structures to enhance adaptability [15].
To address the aforementioned issues, a tillage machine suitable for strip tillage is proposed, featuring independent profiling capability and integrating subsoiling and stubble-crushing functions. The mechanical components are designed to achieve independent undulation and profiling, with the undulation pressure automatically adjustable according to terrain conditions. The soil-guiding and stubble-crushing wheels are arranged in a left–right symmetric manner and they perform multiple functions, including depth limiting, stubble crushing, soil guiding, and soil crushing. When applied in strip tillage and sowing operations, this machine can effectively reduce blockages and contribute to the formation of high-quality seedbed strips.

2. Materials and Methods

2.1. Whole Machine Structure

As illustrated in Figure 1, the independent profiling subsoiling and stubble-crushing mechanism is primarily composed of two core components: a subsoiling unit and a stubble-crushing and soil-guiding unit. The subsoiling unit consists of a subsoiling shovel and a spring-type overload protection structure. This spring structure serves as a critical buffer—when the subsoiling shovel encounters hard obstacles (e.g., stones) in the soil, it absorbs impact forces to prevent structural damage to the shovel, thereby ensuring the safety and stability of deep loosening operations. Symmetrically arranged on the left and right sides of the subsoiling shovel, the stubble-crushing and soil-guiding unit is inherently equipped with a profiling structure, allowing it to synchronously adapt to terrain undulations alongside the subsoiling unit [16]. Furthermore, this unit integrates structures for adjusting the arm angle and wheel angle, enabling flexible optimization of stubble-crushing efficiency and soil-guiding direction according to specific tillage requirements. A notch is machined on the rear side of the unit, facilitating free adjustment of its front–rear length to accommodate different operational scenarios. The length of the double arms is fixed and adjusted using double-plate U-shaped clamps, realizing stepless adjustment across multiple dimensions (e.g., length and angle). This multi-directional stepless adjustability enhances the mechanism’s adaptability to varying soil textures and strip tillage specifications, thereby improving its overall operational versatility.

2.2. Operating Principle

The strip sowing operation of the subsoiling and stubble-crushing mechanism is divided into two key stages: the soil subsoiling stage and the soil-guiding and stubble-crushing stage. Prior to operation, adjustments are made according to the specific requirements of the field: The penetration depth of the subsoiling shovel is calibrated to match the target depth of deep loosening. The angle of the soil-guiding wheels, as well as the rotation angle and length of the arms, are adjusted to optimize soil-guiding efficiency and stubble-crushing performance. During operation, the subsoiling shovel acts first to disturb the soil in the lower layer of the seedbed strip. The soil-guiding wheels on the left and right sides of the subsoiling shovel are responsible for further disturbing the soil turned up by the subsoiling shovel and guiding it backward. The unique tooth profile of the soil-guiding wheels enables them to crush and cut the straw at the edge of the seedbed strip, forming a straw belt along the strip edge. This straw belt acts as a barrier to prevent straw from backfilling into the sowing area, which avoids blockages during seeding. The soil-guiding wheels are equipped with an independent depth-limiting and profiling function, allowing them to fit closely to the undulating surface of the field. Their convex disc design ensures effective profiling, soil pressing, and depth limiting across varying terrains. When soil moisture is high and blockages occur, the wheels generate an upward floating thrust, lifting the soil-guiding components to discharge the clogged soil aggregates. This mechanism maintains the smoothness of soil guiding and ensures uninterrupted operation.

2.3. Key Component Design

During strip tillage operations, residual straw stripped from the seedbed strip tends to backfill into the strip a second time due to factors such as the straw’s own friction and gravity, which impairs the quality of sowing operations. In the process of strip subsoiling, as the sowing speed increases, the subsoiled soil undergoes excessive disturbance—some soil is thrown out or crosses the width of the seedbed strip, while the remaining soil fails to backfill in a timely manner. This phenomenon leads to reduced sowing uniformity and inconsistent sowing depths, ultimately affecting seedling emergence. Therefore, to form the required high-quality seedbed strip, it is essential to regulate the disturbance and flow behavior of both straw and soil. A texture analyzer was used to measure the force variation of straw during the shearing process and the force required for straw breakage—providing quantitative data for the design of straw-handling components. Plates for preventing straw backfill were arranged symmetrically on the left and right edges of the strip. Based on preliminary experiments and the structural requirements of the entire machine, a disc with a diameter of 475 mm was selected as the core structure to block straw backfill. Considering the comprehensive operational needs, the soil-guiding and stubble-crushing wheels (as shown in Figure 2) were designed to integrate multiple functions, including soil guiding, stubble cutting, stubble crushing, and depth limiting.

Design of Diversion and Pressure Wheel

Notches were cut into the disc to endow the wheel edge with a stubble-crushing function. Meanwhile, a unidirectional cutting edge was machined on the arc surface of the disc, enabling the wheel to cut off straw stubble. As shown in Figure 1, a force analysis was conducted on the cutting edge of the soil-guiding wheel to investigate the variation in the force exerted by the wheel on straw during operation. This analysis ensured that the soil-guiding wheel could press into the straw without completely cutting off the stubble. The straw was cut both vertically (from top and bottom), and the resultant force in the vertical direction was zero. The force exerted by the wheel was calculated and verified using Equation (1):
f 3 = N 1 + N 3 f 2 cos θ 2 G 1 cos θ 1 ,
where ƒ3 = force exerted by the wheel on the straw (N), ƒ2 = depth-limiting resistance of the wheel against the ground (N), ƒ1 = thrust of the soil on the tooth tip (N), N1 = support force of the straw on the gear teeth (N), N2 = support force of the ground on the teeth (N), N3 = support force of the ground on the wheel protrusion (N), G1 = ground pressure (N), and θ1 = stubble-pressing deflection angle of the straw (°), which is related to the physical properties of the straw. Among these, N1 and ƒ3 are perpendicular to each other, and θ1 + θ2 = 90°.
Obtained through formula analysis, when the force exerted by the wheel on the straw is excessively large, the soil-guiding wheel completely severs the straw. This fails to achieve the stubble-crushing effect and, consequently, cannot block straw backflow into the seedbed strip. When the force exerted by the wheel on the straw is overly small, the soil-guiding wheel only disturbs the straw without pressing it down. This leads to straw splashing, which undermines sowing quality. Preliminary experiments determined that the force required to completely cut the straw is above 8 N. Further mechanical analysis and calculations showed that when the machine operates at a speed of 8 km/h, the force exerted by the wheel on the straw ranges from 6 N to 9 N. This force range enables partial cutting of the straw while simultaneously achieving the stubble-crushing function—meeting the design requirement for balanced straw handling during strip tillage.
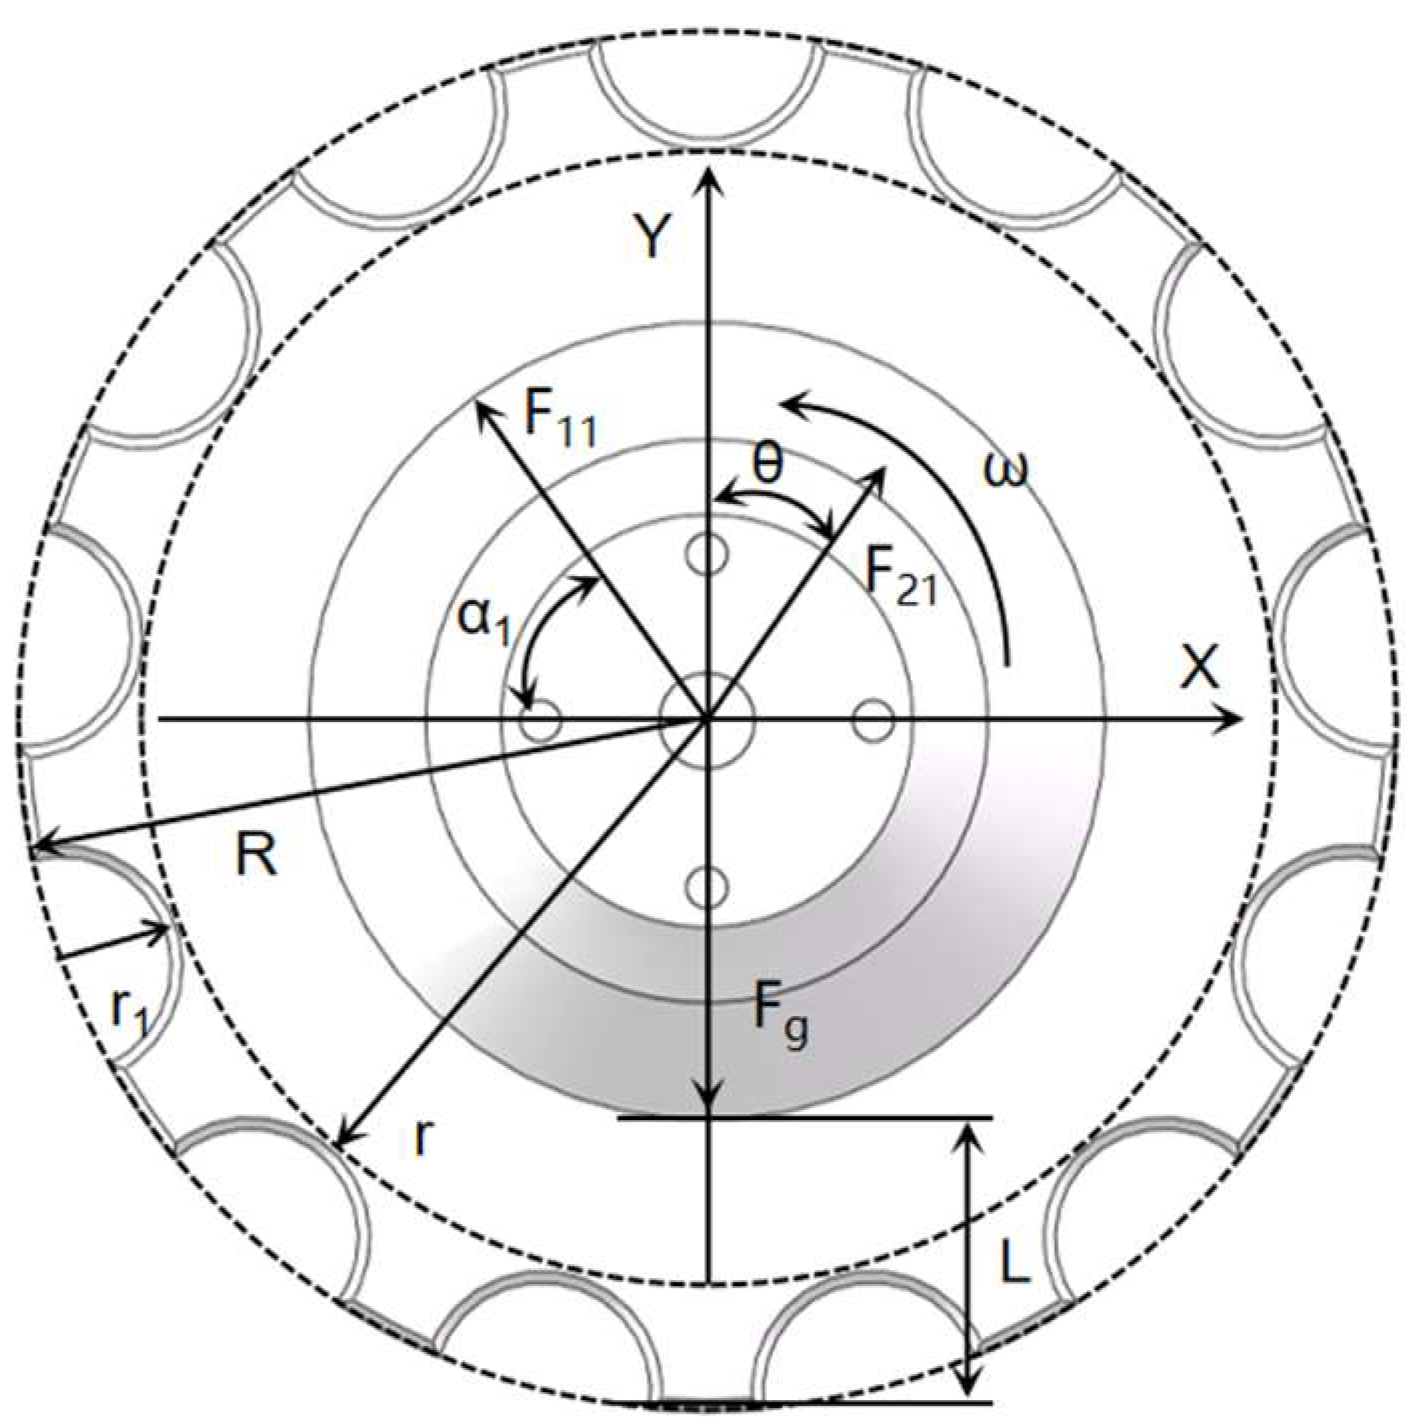
After verifying that the design objectives of stubble crushing and stubble cutting were achieved through mechanical analysis, the penetration depth of the disc during operation could not be determined, leading to excessive stubble crushing and cutting. During soil-guiding and stubble-crushing operations, straw accumulated under the forward thrust, resulting in an insignificant stubble-crushing effect. As illustrated in Figure 3, a structural optimization strategy was proposed based on the above analysis: a cutting edge was machined on the notched surface of the disc, while the arc surface was kept blunt. This design enables the separation of “pressing” and “cutting” operations—ensuring targeted straw cutting via the notched edge and effective straw pressing via the blunt arc surface, thereby resolving the accumulation issue. To prevent the unlimited downward cutting of the pressing–cutting disc (which would increase operational resistance), a convex circular structure was designed on the inner side of the disc. This structure restricts excessive downward movement of the disc, maintaining the stability of the pressing–cutting depth. The downward cutting depth, L, of the soil-guiding disc was calculated and verified using Equation (2):
m = k π ( R 2 + 2 3 r 2 + 13 2 r 1 2 ) F y = F g F 11 sin α 1 F 21 cos θ L = 100 F y m 1 2 t 2 L = 50 t 2 F g F 11 sin α 1 F 21 cos θ k π ( R 2 + 2 3 r 2 + 13 2 r 1 2 ) ,
where L = depth of stubble penetration into the soil (cm), R = radius of the diversion disc (cm), r = inner blade distribution radius (cm), r1 = inner blade radius (cm), k = the mass factor of the guide wheel (related to the material, kg/cm2), m = the total mass of the guide wheel (kg), Fy = the resultant force of external forces on the guide wheel (N), F11 = the resultant force of the straw on the ground acting on the wheel during operation (N), F21 = the resultant force of the disturbed soil and the ground acting on the wheel (N), α1 = the throwing angle of straw (related to the physical properties of straw), and θ = the angle of repose of soil (related to the physical properties of soil).
Calculating and analyzing through formulas, when L is excessively large, the downward cutting force exceeds the shear deformation capacity of the straw. This causes complete fracture of the straw, eliminating its ability to act as a barrier against straw backflow into the seedbed strip. When L is overly small, the straw is only pressed and cut within the surface soil layer (i.e., the “soil variable layer”). This superficial treatment fails to ensure the stability of the straw barrier. Through a combination of formula calculations and preliminary experimental validation, the downward cutting depth of the soil-guiding wheel was determined to be 8.393 cm—a value that balances straw barrier effectiveness, straw-cutting stability, and the structural integrity of the disc.
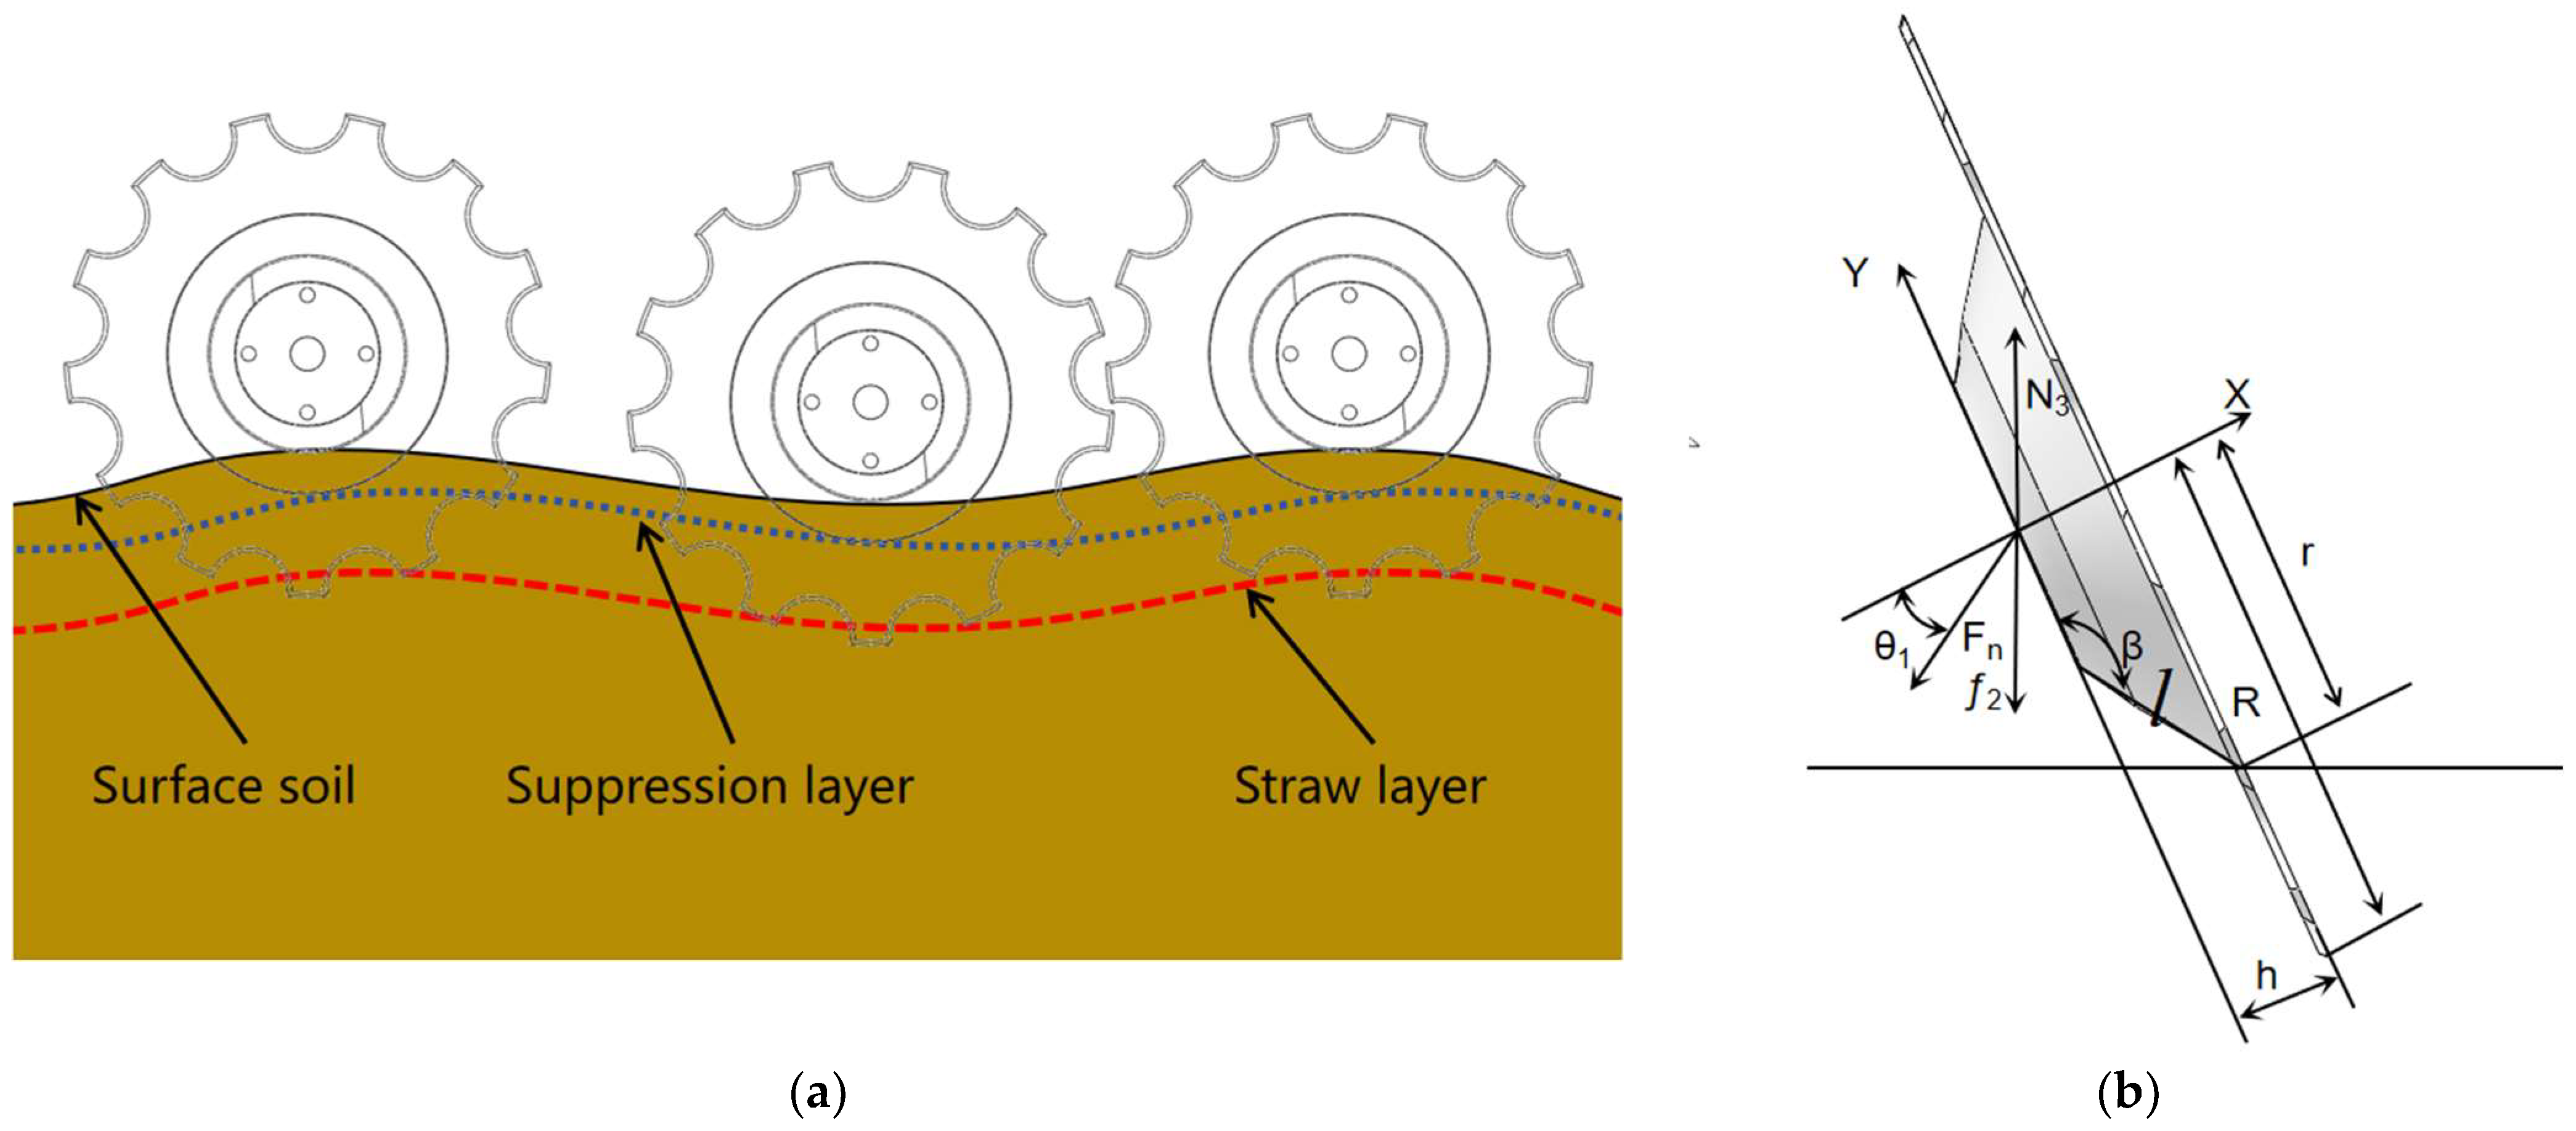
To maintain consistency in the depth of straw cutting, a guide and pressure wheel was installed at the existing strip mechanical structure, taking into account the rationality of the structural dimensions, as shown in Figure 4a. By analyzing the trajectory changes of the wheel in different terrains during operation, the height, h, of the outer convex limit depth of the pressure wheel is calculated using Formula (3):
h = 10 0 R F n ( r r 1 ) d x ,
where h = limit depth and convex height (mm) and Fn = uniformly distributed load generated by diversion soil (N).
When the outer convex circle of the same size disc is too high, the disc has a good imitation effect. However, due to the limited spacing of the mechanism, the deep loose soil cannot be quickly carried out, resulting in serious blockage. When the outer convex circle is low, the contact area between the soil and the wheel decreases, resulting in a decrease in support force and frequent floating of the wheel during stubble pressing, greatly reducing the uniformity of the stubble depth. Through comprehensive analysis, it is concluded that the optimal working effect is achieved when the convex height, h, is between 35 mm and 40 mm.
Under the condition of qualified height, h, as shown in Figure 4b, the deflection angle β determines the effect of the diversion depth limit. We calculate the deviation angle β using Formula (4):
l = N 3 f 2 cos θ 2 F n cos θ 1 π R + r 1 h 2 k 500 t 2 β = 180 ° arcsin h l ,
where l = the contact arc length between the ground and the wheel (mm) and β = the deviation angle (°).
According to the formula calculation, it can be seen that when β increases, the contact area between the corresponding wheel arc surface and the ground decreases, and the support force is concentrated, resulting in an increase in the depth of straw compression. When β decreases, the contact area between the outer convex surface of the wheel and the ground increases, and the straw is subjected to longitudinal support force before it is fully cut in. The straw cannot be compacted, and effective obstruction cannot be formed. Considering the wheel diameter and row spacing requirements, it is calculated that the deviation angle β between 142.14° and 145.23° can meet the design requirements.

2.4. Component Parameter Optimization

The deep loosening stubble-pressing component is an important structure that affects the quality of the seedling belt. Parameters such as the distance between the two side wheels and the deep loosening shovel, the deflection angle of the side wheels, and the front and rear positions of the side wheels and shovel arms affect the quality of the seedling belt. To improve the quality of seedling preparation in strip tillage, it is necessary to optimize and analyze the parameters of the above components.

2.4.1. Optimization of Front and Rear Position Parameters of Guide Wheel

Referring to the vertical centerline of the wheel, according to the position relationship between the guide wheel and the deep loosening shovel, it can be divided into three positions: front, center, and rear. The schematic diagram of the wheel position is shown in Figure 5. We analyzed the passage of soil at different locations. By comparing the permeability of soil at different locations, we selected the optimal parameter range.
The effect varies when the guide wheel is in different positions. As shown in Figure 5a, when the guide wheel is in front, the deeply overturned soil is in high-speed motion. With the guidance of the guide wheel, it can be quickly exported. When working on land with high soil viscosity and humidity, rapid passage can cause soil compression, resulting in crowded accumulation. After the guide wheel is placed in the center, as shown in Figure 5b, the deeply plowed soil always stays within the grid, without causing soil jumping and inter-row interference, but the soil’s passability is poor. When installing at the rear, as shown in Figure 5c, the high-speed soil blocks can freely release pressure due to the lack of barriers, and then be guided by the guide wheel to reduce congestion. However, if they are located at the back, they cannot be completely blocked, which will cause soil splashing in the seedling belt and affect the uniformity of the seedling belt. Different positions will produce different effects, as shown in Figure 6. By simulating and analyzing the soil passing through, dynamic analysis of the wheel is carried out.
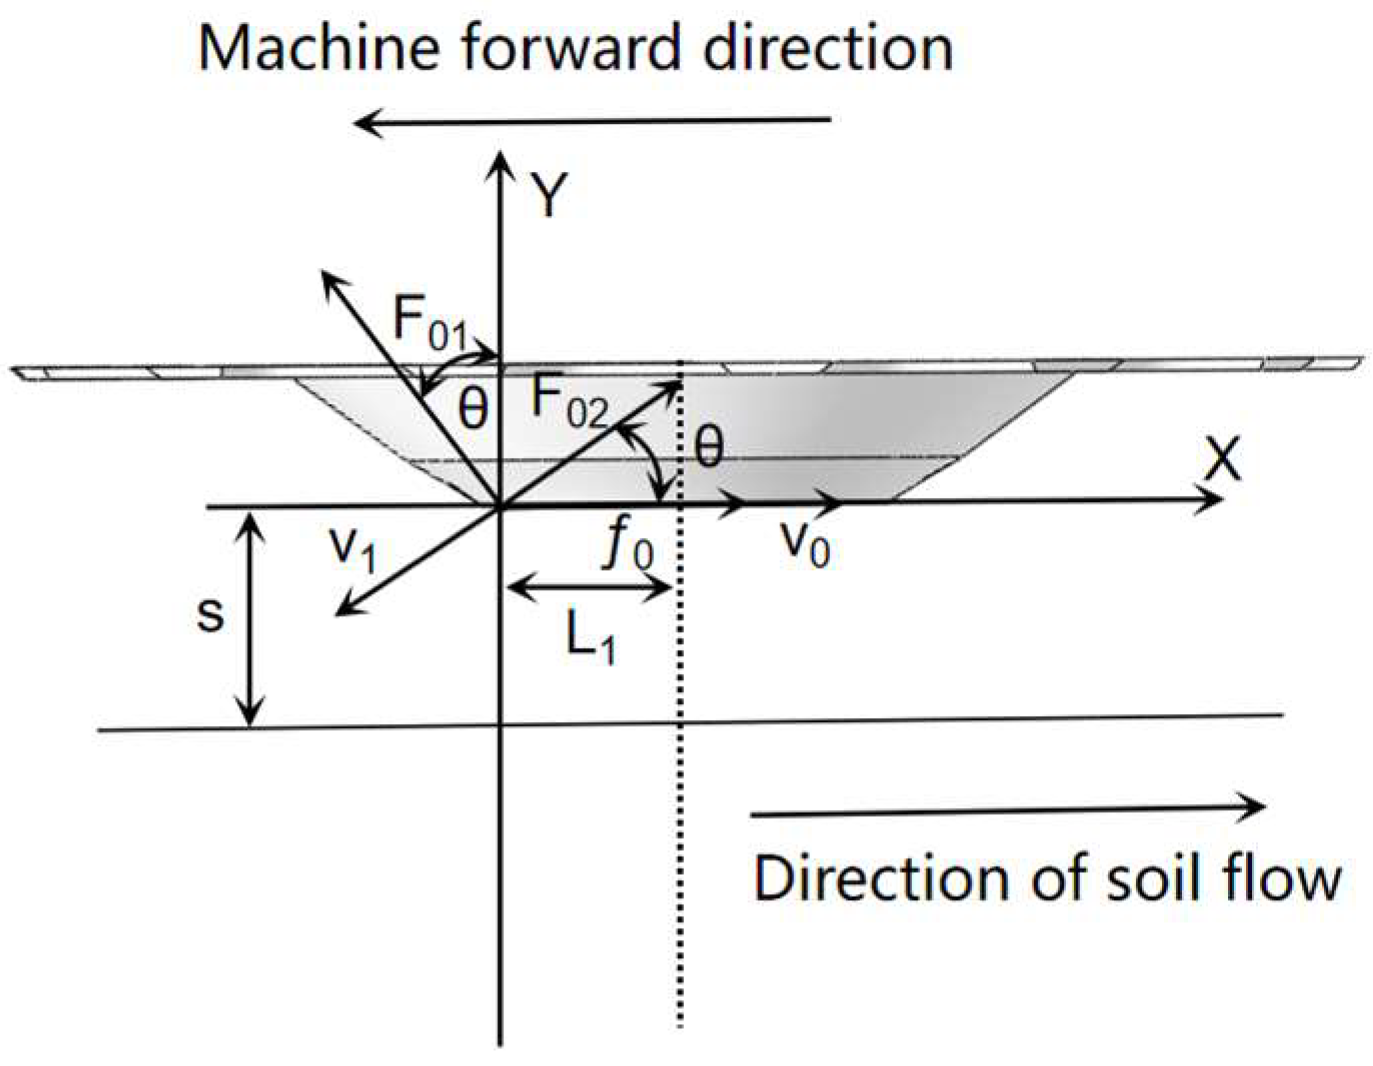
When L1 is positioned at the center, it is set to 0. Combining kinematic analysis and dynamic equilibrium, L1 is calculated as follows: In Figure 6, v1 is decomposed along the X-direction to obtain its horizontal component v1x. The total effective velocity of the component in the horizontal direction is the sum of the active velocity v0 and the horizontal component of the slip velocity v1x. The calculation formula for L1 is derived based on the changes in momentum and displacement velocity, and the specific formula is shown as Equation (5):
v = v 0 v 1 cos θ F 02 cos θ + f 0 F 01 sin θ t = m v 1 cos θ L 1 = v 0 v 1 cos θ t L 1 = 100 ( v 0 t + F 02 cos θ + f 0 F 01 sin θ t 2 2 m ) ,
where v1 = the rebound velocity of soil when it comes into contact with the wheel edge, v0 = the soil diversion velocity, and S = the distance from the wheel to the center of the seedling belt, i.e., half the width of the seedling belt. Once other parameters are determined, S becomes a fixed value automatically, F01 = the force exerted by the subsoiled soil on the wheel edge, ƒ0 = the vertical directional force of the soil, F02 = the force exerted by the rebounded soil on the device during soil diversion, and it is a longitudinal force that promotes soil flow, θ = the soil repose angle, which is related to the physical properties of the soil, and L1 = the distance from the diversion wheel to the subsoiler and, in practice, it is equivalent to the displacement of the soil after being disturbed by the subsoiler.
As noted earlier, the soil-guiding wheel induces issues affecting seedbed strip quality at any single fixed position. To identify a balanced positional range, preliminary experiments were conducted to measure the pressure exerted on the soil at different locations and determine the static accumulation angle of the soil. Subsequent verification via formula calculations revealed that when the positional coordinate L1 falls within the range of −15 cm to 15 cm, the soil exhibits favorable passage performance. Within this interval, although minor soil splashing outside the seedbed strip was observed, it was negligible and did not disrupt the overall structural integrity of the seedbed. Large-scale blockages (a critical issue in extreme positions) were effectively avoided, ensuring continuous and stable tillage operations. This range thus achieved a practical balance between mitigating soil blockages and minimizing soil splashing, ultimately meeting the quality requirements for seedbed strip preparation in strip tillage.

2.4.2. Optimization of Diversion Offset Angle Parameters

Given that the overall width of the seedbed strip ranges from 25 cm to 35 cm, the lateral spacing available for the soil-guiding wheels is highly limited. To address this constraint and improve the efficiency of soil guiding and passage, an angular offset design for the wheels was adopted. Based on the angular relationship between the wheel orientation and the machine’s forward direction, the offset angles are categorized into three types: positive offset, parallel (zero offset), and negative offset. Variations in the offset angle directly affect two key operational performances: The contact area and pressure between the wheel and straw change with the offset angle, influencing the degree of straw compaction and cutting. The direction of soil flow is altered by the offset angle, which impacts the uniformity of soil distribution in the seedbed strip and the likelihood of blockages. A schematic diagram of the stubble-crushing process by the offset soil-guiding wheels is presented in Figure 7a, while a schematic of soil guiding and crushing is shown in Figure 7b.
The mechanical analysis of the guide wheel is shown in Figure 8a. The outer side of the wheel is subjected to the interaction force of straw, causing the wheel to deviate, while the inner side is subjected to a uniform load from the soil, resulting in a rotational motion with an angular velocity of ω when in contact with the ground. The rotational speed is positively correlated with the forward speed. There is a certain correlation with the installation angle. We calculate the offset angle using Formula (6):
V C O S λ 2 = 2 ω D ,
where V = machine forward speed (m/s), λ2 = offset angle (°; velocity factor), and ω = angular speed (rad/s).
In the formula, if the machine operates at a speed greater than 12 km/h, the range of λ can be obtained as −30° to 30°. When the machine is running, as the speed increases, the resistance it receives changes accordingly, as shown in Figure 8b. By analyzing the force on the wheels and ensuring the normal operation of the machine, the range of its offset angle is determined through Formula (7):
λ = arcsin H H 0 2 D + arctan H H 0 ( d 2 d 1 ) 0 h ρ ( x ) d x ,
where H = the width of soil in the seedling belt, H0 = the outer width of the individual frame, d2 = bearing diameter, and λ = offset angle (°; external force factor).
When the wheel angle deviation is too large, the resistance increases until the machine is damaged. When the angle deviation is too small, the range of straw slip increases, and the effectiveness of embankment protection decreases. By using Formula (7) for calculation and verification, considering the influence of velocity factors, it is found that under reasonable force conditions, the effective offset angle range is −13° to 13°. Formula (6), under the condition of velocity as the main factor, has an offset angle range of −30° to 30°. We take the intersection of the above ranges and optimize the offset angle range to −13° to 13°.

3. Discrete Element Simulation Experiment

3.1. Establishment of Simulation Test Model

During strip tillage operations, the stubble-crushing and soil-guiding device interacts dynamically with field straw stubble and soil [17]. To optimize the operational performance of this device and determine the optimal working parameters, a discrete element method (DEM) simulation experiment was conducted, with a software simulation model established using EDEM 2022 [18]. The experiment mainly analyzes the interaction laws between the device and soil, as well as between the device and straw. The contact parameters of the soil model and the material properties of the device components are detailed in Table 1, providing the fundamental input data for the DEM simulation to ensure consistency with real-world operational conditions.
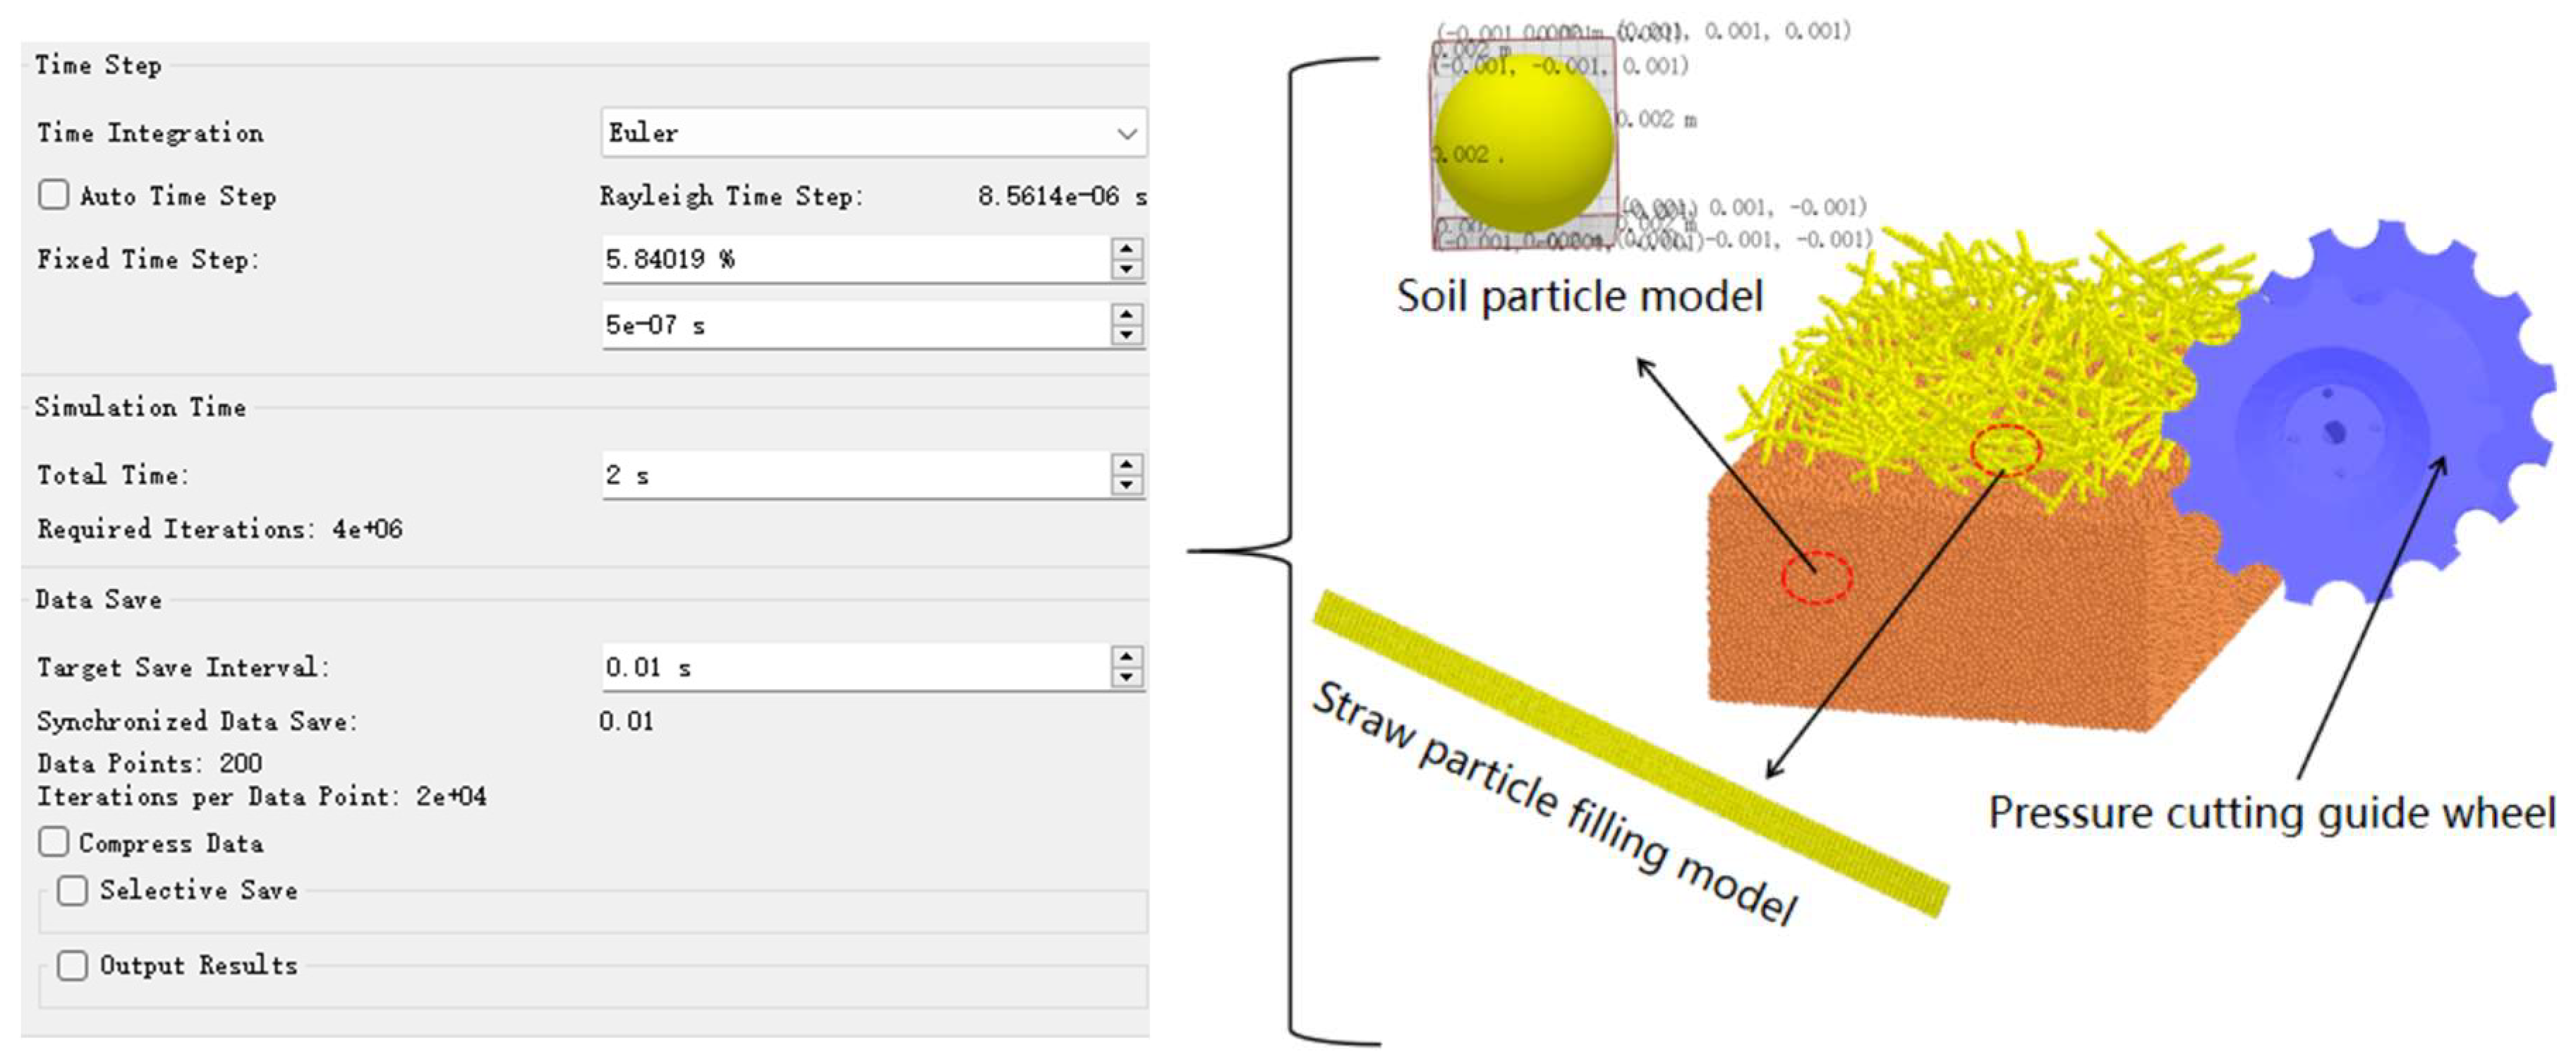
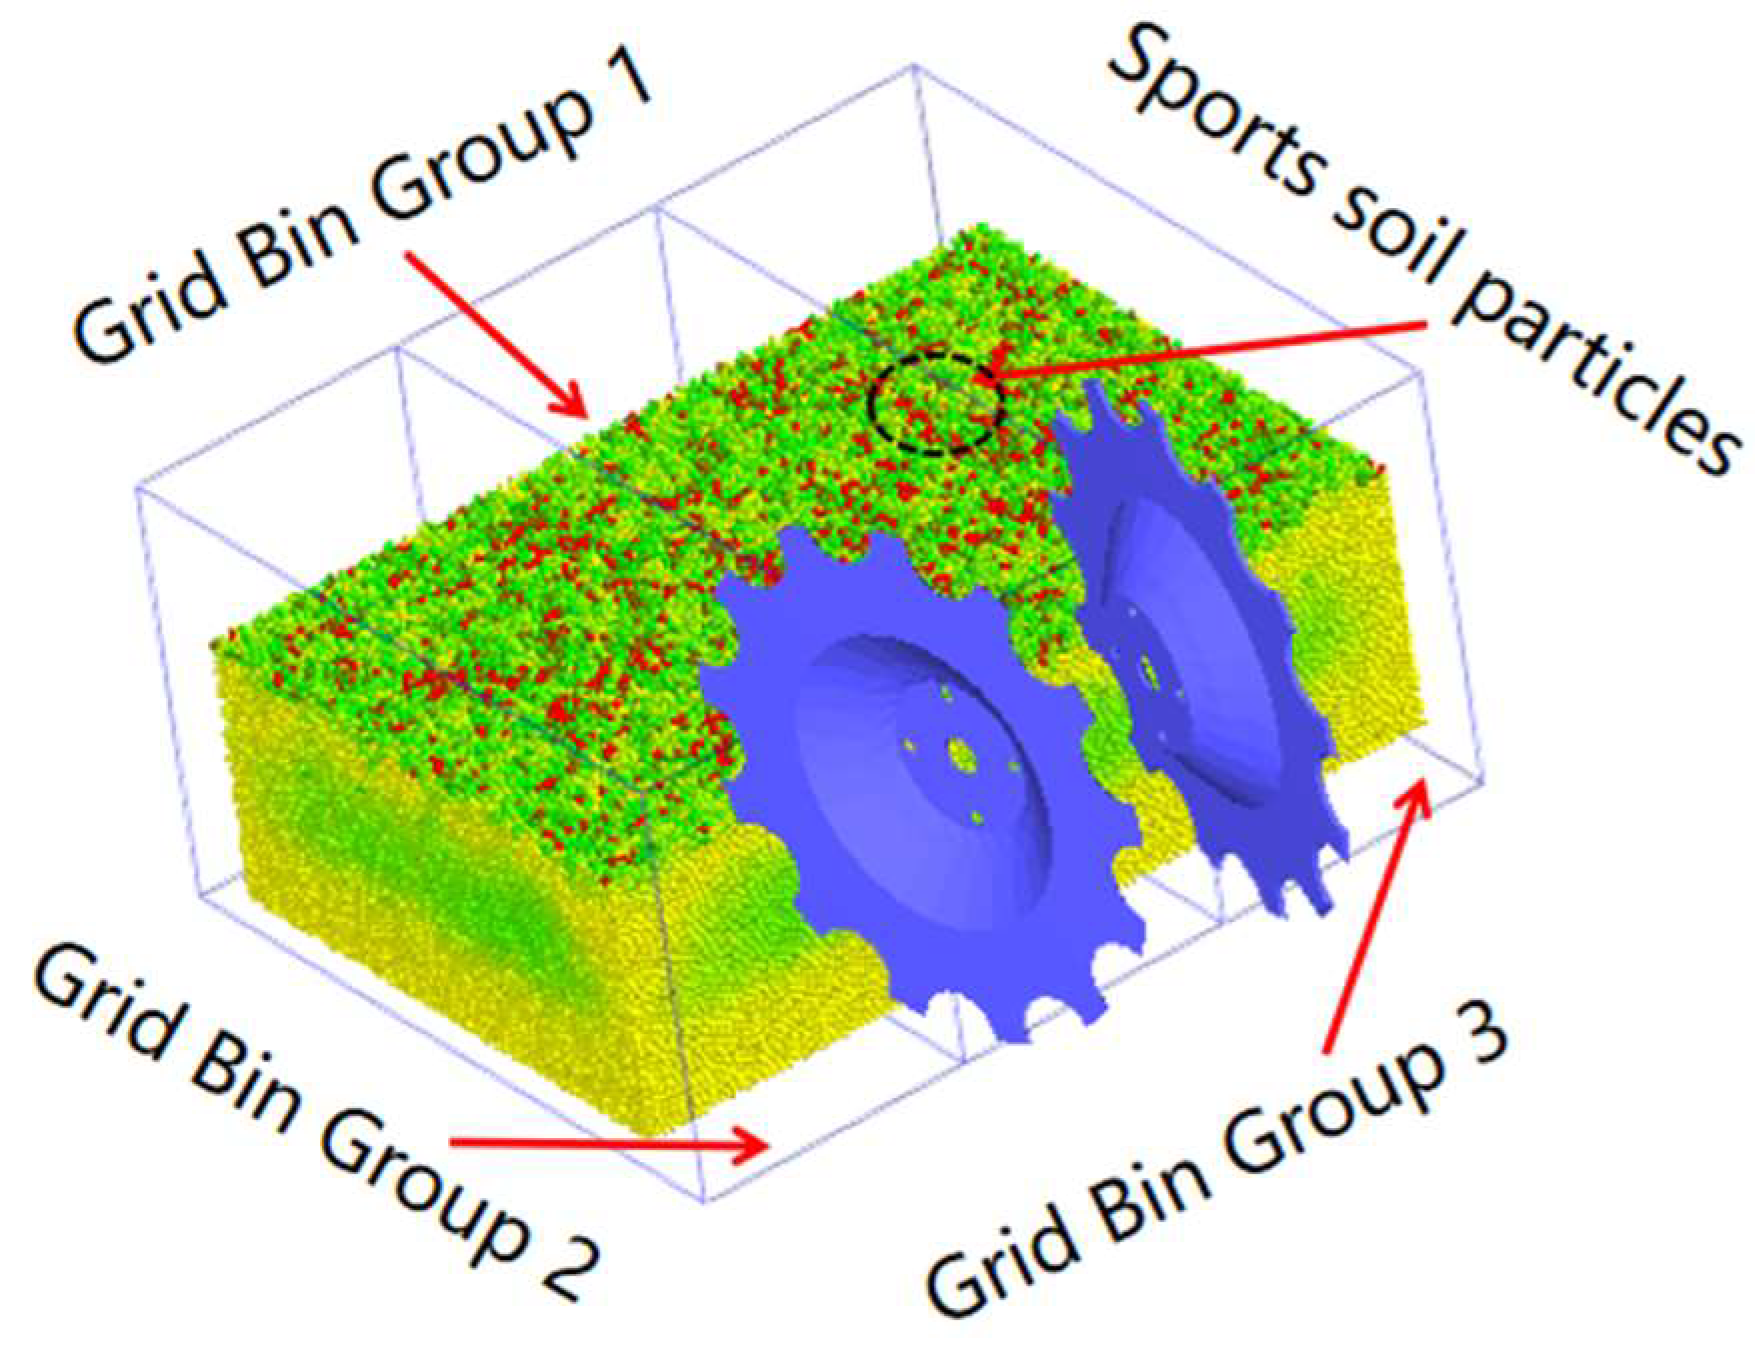
Based on the data in Table 1, the parameters for the soil particle model, straw particle model, and device material were configured in EDEM software (8 EDEM 2022) [19]. The contact model between particles is the Hertz Mindlin with JKR model, and the contact model between particles and geometry is the Hertz Mindlin (no slip) model. The basic size of the soil trough was set to 800 mm × 600 mm × 300 mm. A hollow straw model with a length of 120 mm and a diameter of 5 mm was established using small balls with a diameter of 0.5 mm. In the straw generation stage, bonds were added between straw particles to simulate the real straw distribution. The straw particles were generated in a normal distribution. When soil was generated in the soil tank, adhesive bonds were used to bond the soil, and the radius of soil particles varied within the range of 0.8 to 1.2 times the average radius. As the device is mainly responsible for preventing straw from slipping off and soil splashing after strip straw stripping, a disturbance device for straw was placed in front of the device to simulate the strip straw stripping process during simulation experiments. After the preparation of the soil tank was completed, we imported the three-dimensional model of the stubble diversion device and set its material parameters. The grid size was 3Rmin, the simulation time step was 5 × 10⁻⁷ s, the total simulation time was 2 s, and the data storage interval was 0.01 s. We conducted simulation experiments. The simulation model is shown in Figure 9 [20].

3.2. Simulation Test Method

During operation, the subsoiling device disturbed the soil in the seedbed strip: the placement position and forward speed of the soil-guiding wheels exerted a significant influence on soil-guiding efficiency, while the offset angle of the left and right wheels affected both the straw penetration depth and the soil-guiding row spacing. Therefore, this article takes the deflection angle of the guide wheel, the distance between the front and rear positions, and the forward speed as experimental factors, and uses the soil loss rate as the experimental indicator to conduct a quadratic regression rotation orthogonal combination simulation experiment [21]. The forward speed is the speed of the device, the forward and backward position parameters are the relative distance between the wheel and the centerline of the deep loosening shovel, and the deflection angle is the angle between the wheel and the forward direction [22]. For the convenience of data processing, the factor levels were coded using the “Orthogonal Quadratic” function in the Design-Expert 13 software. The level coding of experimental factors is shown in Table 2.
The lost soil was quantified via statistical grid calculations in EDEM’s post-processing module, where a Grid Bin Group was established to monitor soil particle displacement. Three statistical grids were arranged transversely along the forward direction, each with dimensions of 800 mm × 200 mm × 300 mm. These grids were symmetrically positioned within the 60 cm seedbed strip, with their bottoms close to the model base and their tops extending above the soil surface (as illustrated in Figure 10). This configuration ensures comprehensive coverage of potential soil lateral displacement zones. During operation of the stubble-crushing and soil-guiding device, the subsoiling shovel disturbed the soil in the seedbed strip, causing lateral slippage of soil particles. The pre-configured grid sensors dynamically tracked and recorded changes in the number of soil particles within each grid, providing quantitative data to calculate the soil loss rate, defined as the proportion of particles displaced outside the target seedbed strip relative to the initial particle count.
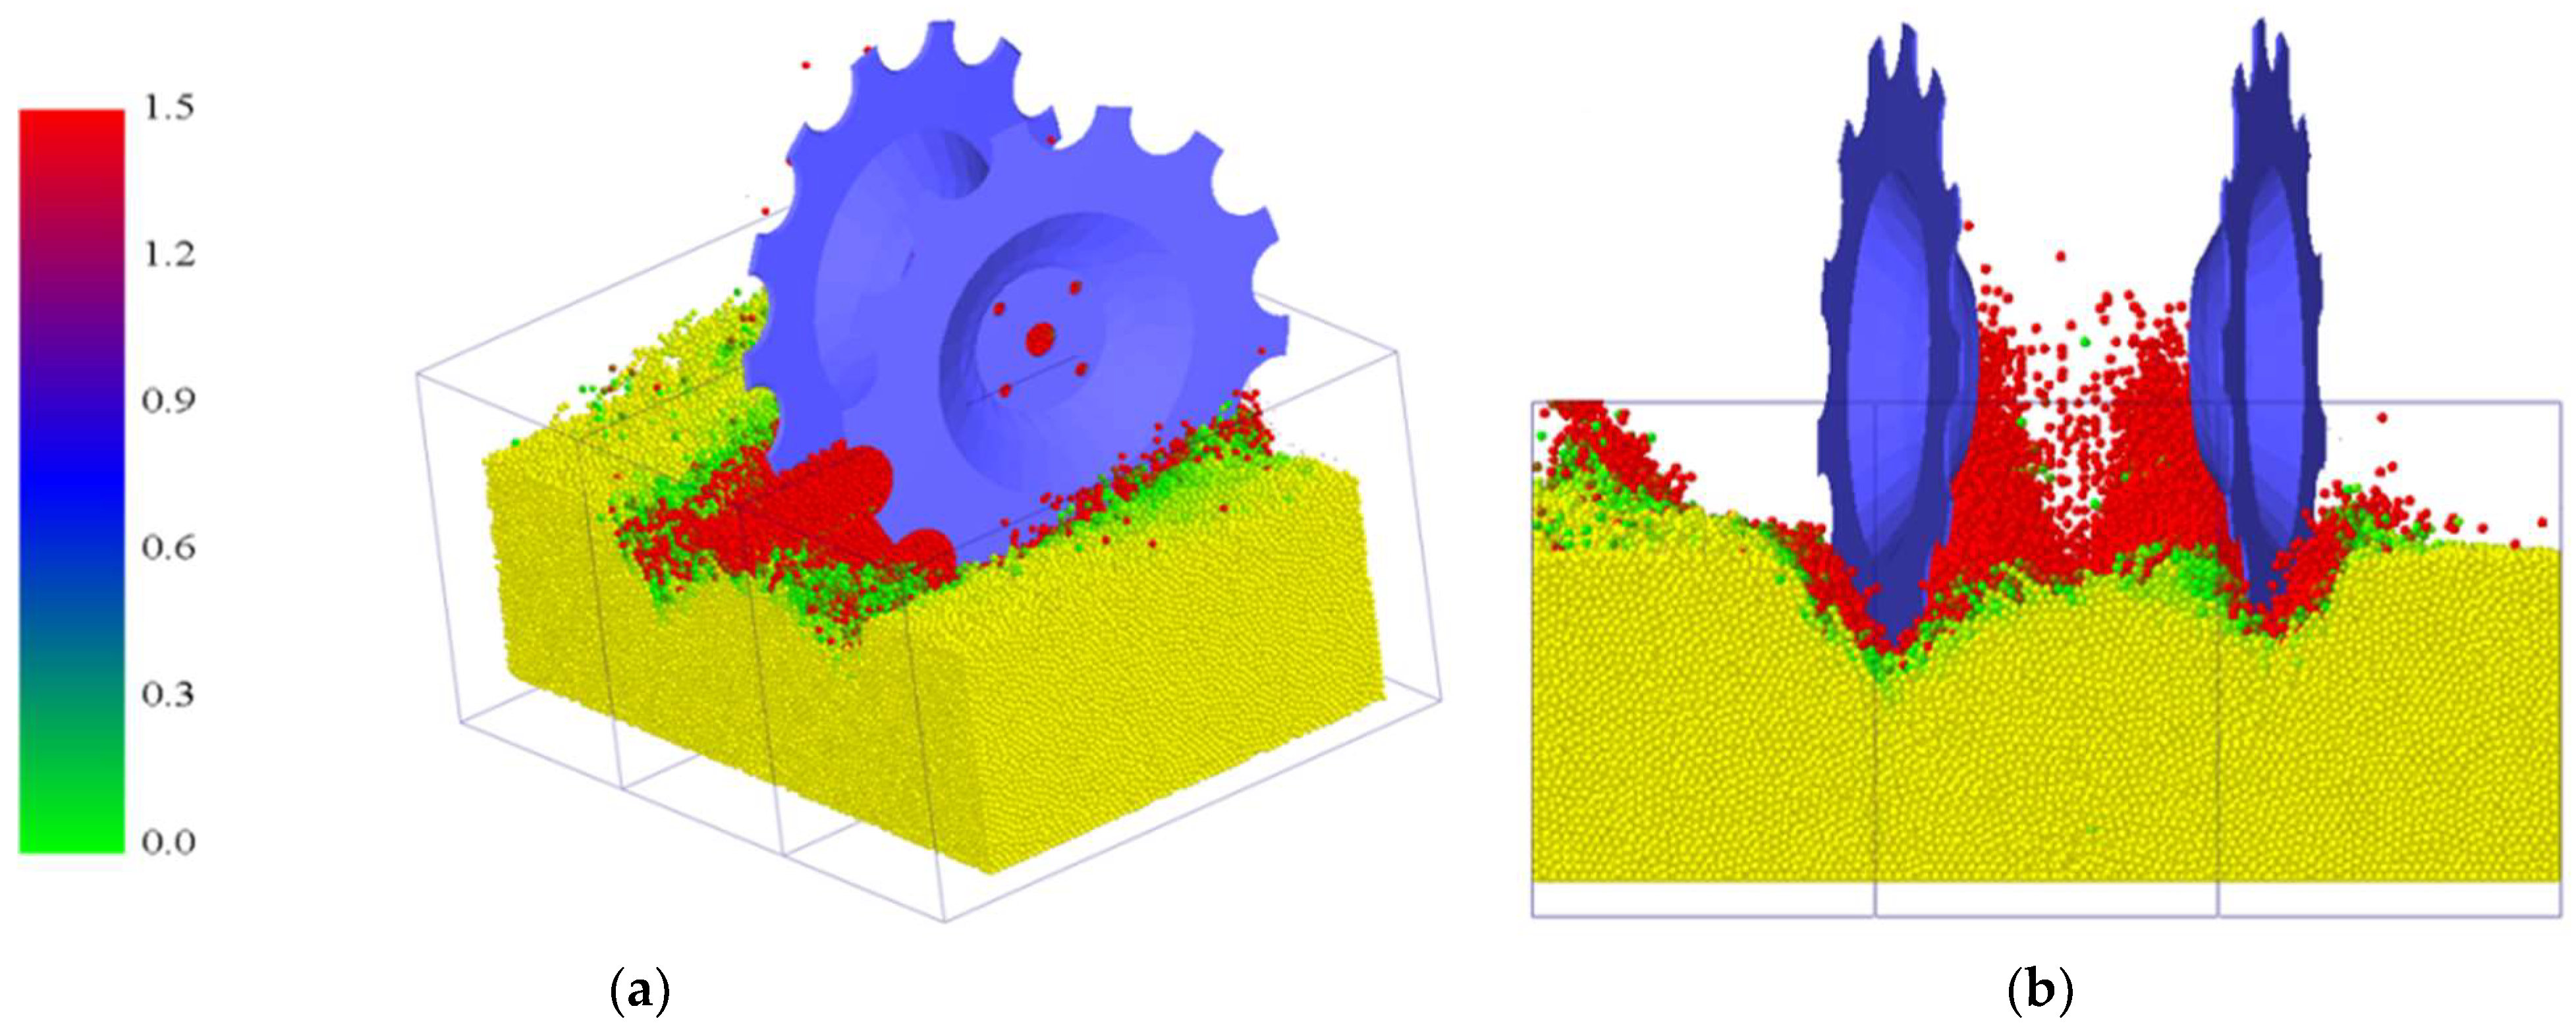
During the simulation, soil particles disturbed by the stubble-crushing and soil-guiding device move at varying initial velocities. These moving particles mix with stationary ones, making it difficult to directly quantify the degree of soil loss through particle count alone. To address this challenge, soil disturbance was visualized and characterized by particle velocity. As illustrated in Figure 10, particles were color-coded based on their initial velocities: red particles represent high-velocity disturbed particles, while particles of other colors correspond to progressively decreasing velocities. High-velocity soil particles (red) are “active particles” that are highly prone to splashing outside the seedbed strip. Thus, the proportion of red particles within the seedbed strip was used as an indirect indicator of soil-guiding performance: a lower number of red particles outside the device boundary indicates a better soil-guiding effect. By extension, the same velocity-based characterization applies to straw movement: a higher number of high-velocity straw particles at the edge of the seedbed strip means the straw is more likely to backfill or slip into the seedbed—directly reflecting a poorer stubble-crushing performance.

4. Results and Discussion

4.1. Analysis of Simulation Experiment Results

Figure 11 is a schematic diagram of the simulation operation of the stubble diversion device. As shown in Figure 11a, an increase in the device’s forward speed led to more frequent soil disturbance within the seedbed strip. This heightened disturbance directly correlated with a change in the number of soil particles displaced outside the seedbed strip: faster speeds tended to intensify particle motion, increasing the likelihood of soil splashing beyond the target strip boundary. The front–rear positional parameter of the wheels significantly influenced the range of soil disturbance. Under high-speed operation, the left and right soil-guiding devices cooperated with redirecting soil flow. As illustrated in Figure 11b, high-velocity red particles (indicative of active, splash-prone soil) were primarily concentrated inside the soil-guiding wheels. This concentration not only restricted the range of soil disturbance within the seedbed strip but also accelerated the longitudinal directional flow of soil—effectively guiding soil along the machine’s forward path and reducing lateral splashing.
The subsoiling and stubble-crushing device effectively reduced straw slippage into the seedbed strip. As illustrated in Figure 12, the number of high-velocity straw particles outside the seedbed strip was significantly reduced. Post-analysis confirmed that low-velocity straw particles did not fall back into the seedbed—verifying that the device successfully addressed the straw slippage issue. By optimizing the angle parameters, as shown in Figure 12, which is a sectional view of the device after operation, the stubble-guiding device interacted with the straw at the edge of the seedling belt, and compressed and cut the straw outside the edge of the seedling belt. The outer straw was evenly pressed into the soil to form an embankment, and the inner straw was cut off, with a small portion remaining without affecting the quality of subsequent operations.

4.2. Establishment and Significance Analysis of Regression Equations

A quadratic orthogonal rotation combination test was conducted using Design-Expert software. In the software, a three-factor, five-level test under the “Central Composite” list was selected, and the maximum and minimum values of each factor were inputted. The range of each factor was determined through calculations, with the three factors coded as X1, X2, and X3, and the five levels coded via the “Orthogonal Quadratic” function of the software. After selecting the five levels for the three factors, the software directly coded the test factor levels and generated 19 combinations for the test. Simulation tests were designed based on each parameter combination, and the simulation test data were entered into a table for data analysis using the software. The experimental scheme and results of the quadratic orthogonal rotation combination are shown in Table 3. We performed regression analysis and significance testing on the simulation results. The test was analyzed and calculated through the data collected by the EDEM software. The change in soil particles in different sensor ranges was counted by changing the range of test factors within the test area, observing the change of test, and calculating the soil loss rate and other test indicators through Formula (8):
η = N ( n 1 + n 2 + n 3 ) N + n 1 + n 3 n 2 × 100 % ,
where η = soil loss rate, N = total number of soil particles in the experiment, n1 = remaining soil particles in sensor 1, n2 = remaining soil particles in sensor 2, and n3 = remaining soil particles in sensor 3.
The results of the variance analysis and significance test are shown in Table 4. The results indicate that the regression equation model of the experimental indicators was p < 0.05, indicating that the experimental model was significant. Among the various experimental factors, the position distance parameter of the guide wheel had a significant impact on the experimental indicators, while the forward speed and offset angle parameters had a significant impact on the experimental indicators. Moreover, the influence of each main factor on the soil loss rate index was ranked from large to small as position distance parameter, offset angle parameter, and forward speed. The sum of squares and degrees of freedom of insignificant interaction terms and secondary main effect terms were incorporated into the residual term, and insignificant factors were removed for variance analysis. The regression equation between each factor and soil loss rate was obtained as Formula (9):
Y = 14.37 + 2.14 x 1 + 3.39 x 2 2.81 x 3 + 0.7750 x 1 x 2 0.6250 x 1 x 3 1.8 x 2 x 3 1.4 x 1 2 + 0.7745 x 2 2 0.4730 x 3 2
where x1 = traction speed (km/h), x2 = distance between front and rear positions (cm), and x3 = deflection angle of the guide wheel (°).
The above regression equation was subjected to a test for loss of fit, as shown in Table 4. The loss of fit term p = 0.3029 > 0.1 was not significant, indicating a significant quadratic relationship between the experimental indicators and factors. This indicates that the experimental analysis results are reasonable, and the regression equation has a high degree of fit. The model determination coefficient R2 was 0.7989, meaning the model can explain over 79% of the variation in the test results. This demonstrates the model’s reliability for test prediction of the soil loss rate under different factor combinations.

4.3. Response Surface Analysis

The test results were analyzed by response surface analysis using Design-Expert software, as shown in Figure 13 [23]. By analyzing Figure 13a, it can be seen that when the control offset angle parameters remained unchanged, when the speed was lower than 8 km/h, the test indicators gradually decreased with the backward movement of the position. When the device moved forward at high speed, the test indicators increased significantly. The test indicators were better when the position distance factor was at a negative value. By analyzing Figure 13b, it can be seen that when the control wheel position distance remained at a negative value, the test indicators would not change significantly with the increase in speed, and the effect of the angle on the indicators was not obvious. When the control device was running at the same speed, as shown in Figure 13c, it can be seen that the angle and position interacted with the test indicators. When the position distance parameter was at a negative value and the angle offset parameter was positive, the soil loss rate was low and the inter-row interference was small.

4.4. Parameter Optimization

In order to obtain the optimal working performance parameters, the regression model was optimized and solved, and the objective function and constraints were selected according to the actual operating conditions and work requirements. The objective function and constraints are shown in Equation (10) [24]:
min Y ( x 1 , x 2 , x 3 ) s . t . 6 km / h x 1 14 km / h 15 cm x 2 15 cm 13 ° x 3 13 ° Y 7.5 % .
When conducting response surface analysis on simulation parameters, the optimal parameter combination for each experimental factor was obtained: forward speed of 7.383 km/h, front to rear position distance parameter of −10.131 cm, and deflection angle of 8.608°. At this time, the soil loss rate of the seedling belt was 5.486%. To verify the reliability of the response surface analysis conclusions, a preliminary experiment was conducted after adjusting the machine parameters according to this combination. The experimental verification showed that the soil disturbance rate—a key indicator of the machine’s working performance—was 5.4%, which is lower than the 5.486% obtained from the simulation test. With an error of less than 1%, the experimental result is basically consistent with the optimization result.

5. Field Experiments

5.1. Test Conditions and Equipment

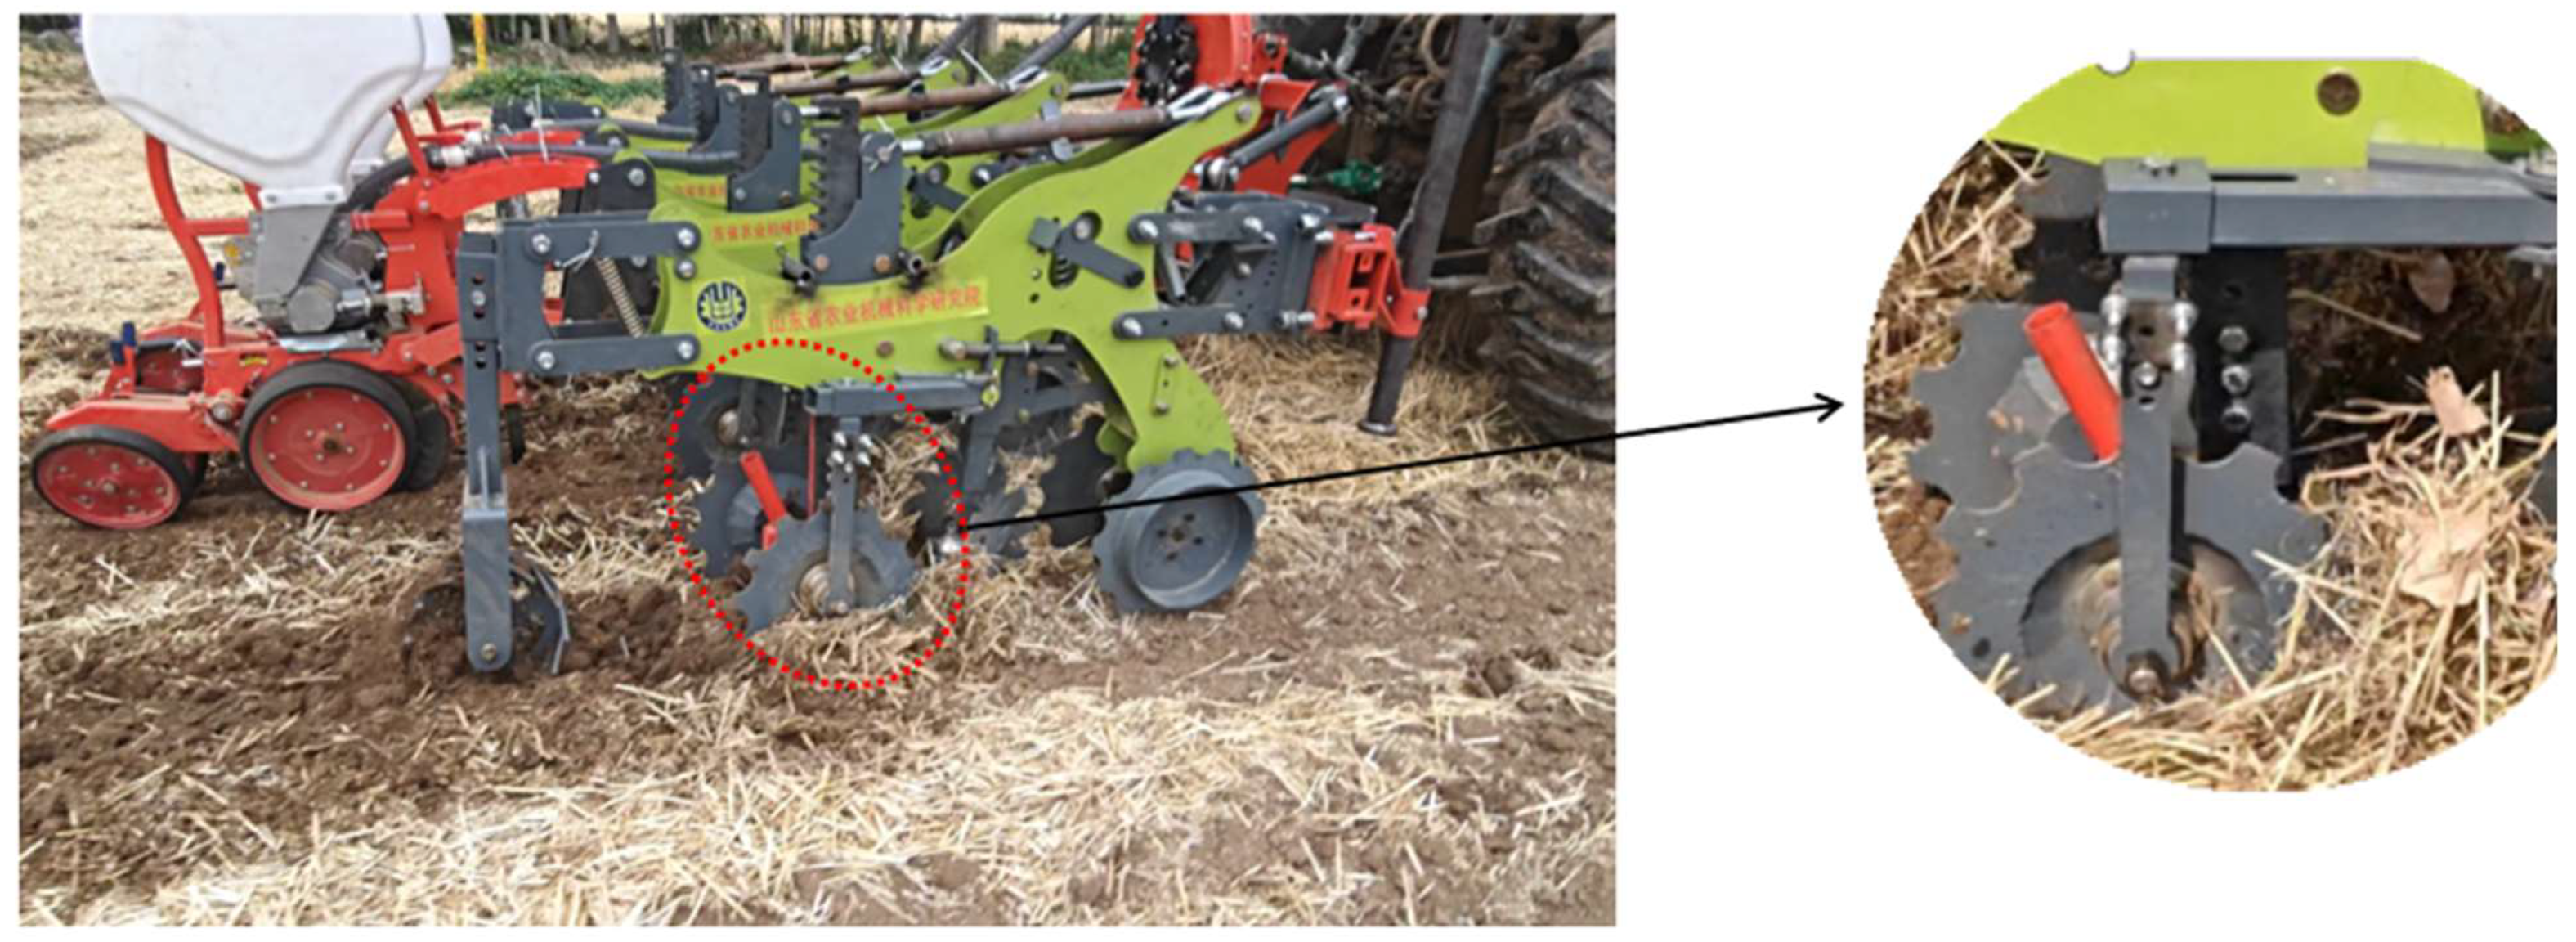
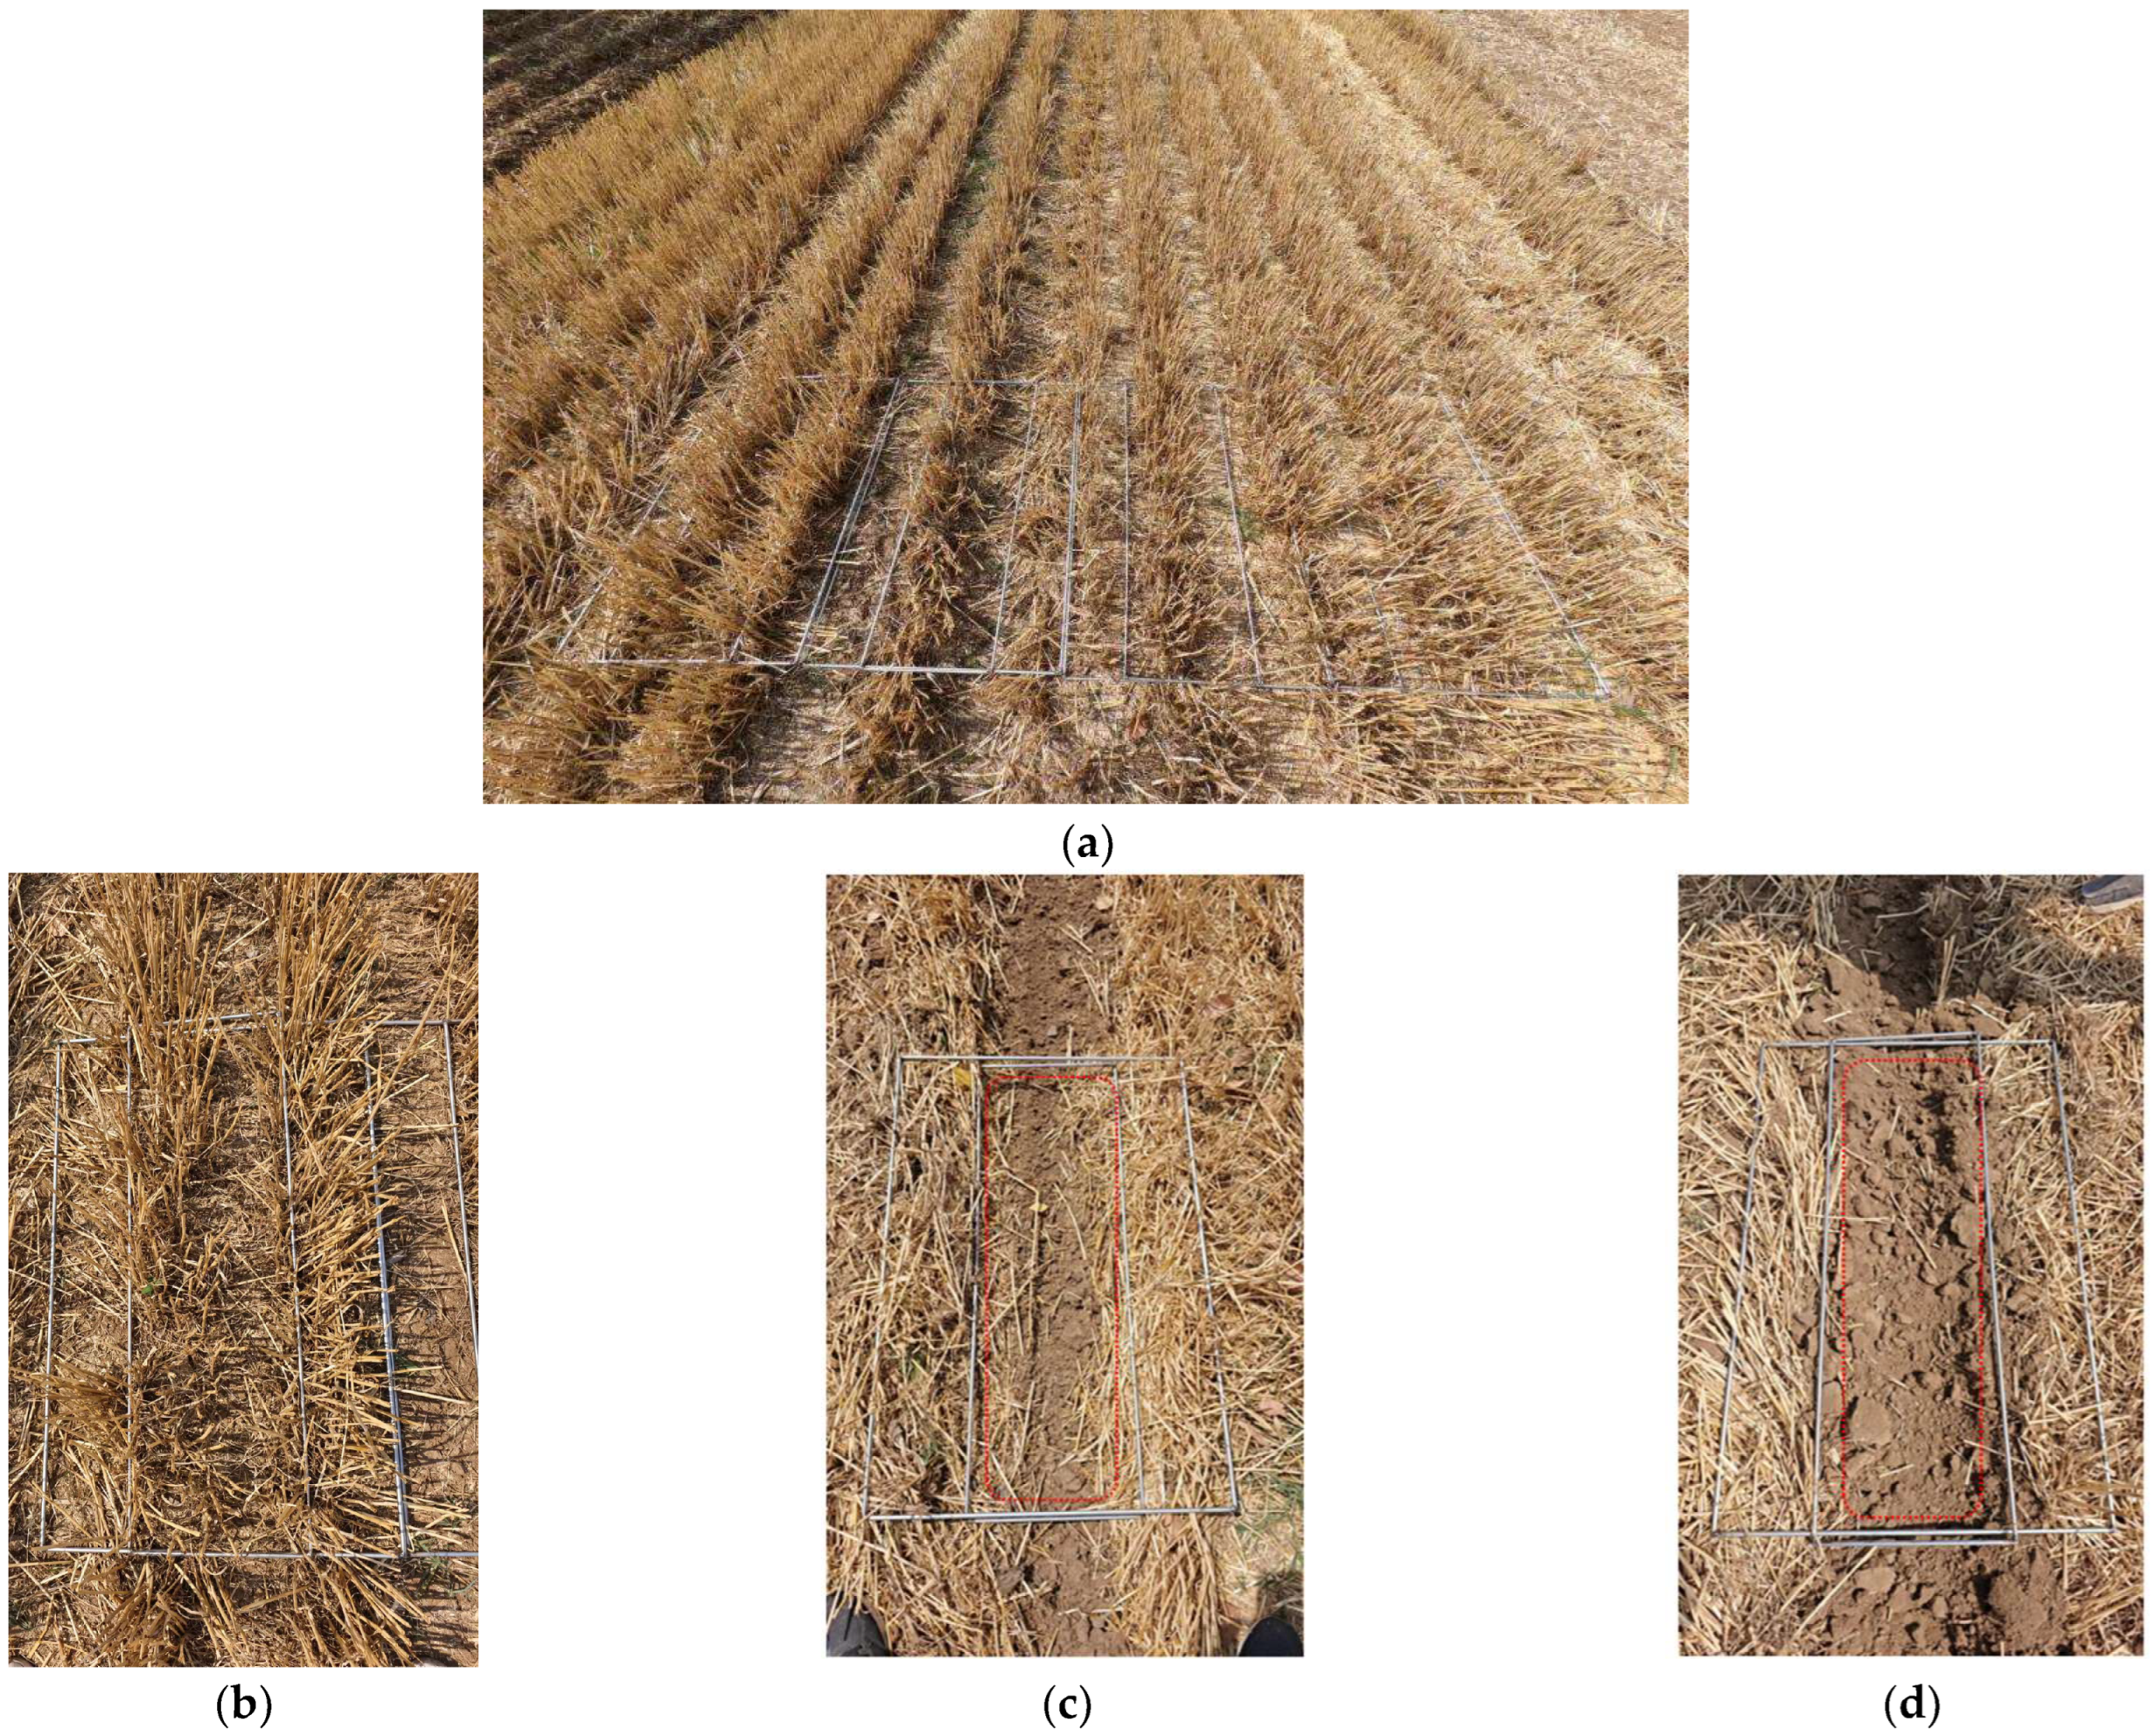
To test the field performance of the designed imitation pressure stubble diversion device [25], field experiments were conducted during the summer corn-sowing period in Shandong Province [26]. Wheat stubble plots without any mechanical work after harvesting were selected. Based on the optimized design of the optimal combination parameters, the prototype was tested and installed after the straw-cleaning device of the strip land preparation machine. We used a tractor for towing operations. The cross-sectional view of the prototype is shown in Figure 14, the experimental plots are shown in Figure 15a.

5.2. Test Method

After installing the power of the entire machine, we adjusted the parameter combination according to the test. We adjusted the individual row spacing of the entire machine to 600 mm, used four rows of individual cells to operate simultaneously, conducted comparative experiments, and verified the interference between rows. We used the soil loss rate as the experimental indicator and observed the slippage of straw after work. According to the soil moisture requirements of the homework, we sampled soil disturbance of 600 mm × 1000 mm, measured the soil quality below the straw layer of 20 mm or more, and calculated the soil loss rate using Formula (11):
δ = M 1 + M 2 M 1 + M 2 + M 3 × 100 %
where δ = soil loss rate, M1 = the mass of soil that covers the upper part of the straw layer within the 300 mm seedling belt on the left side during soil turnover, M2 = the mass of soil that covers the upper part of the straw layer within the 300 mm seedling belt on the right side during soil turnover, and M3 = the total mass of remaining soil within the 600 mm × 1000 mm × 20 mm seedling belt range.

5.3. Analysis of Test Results

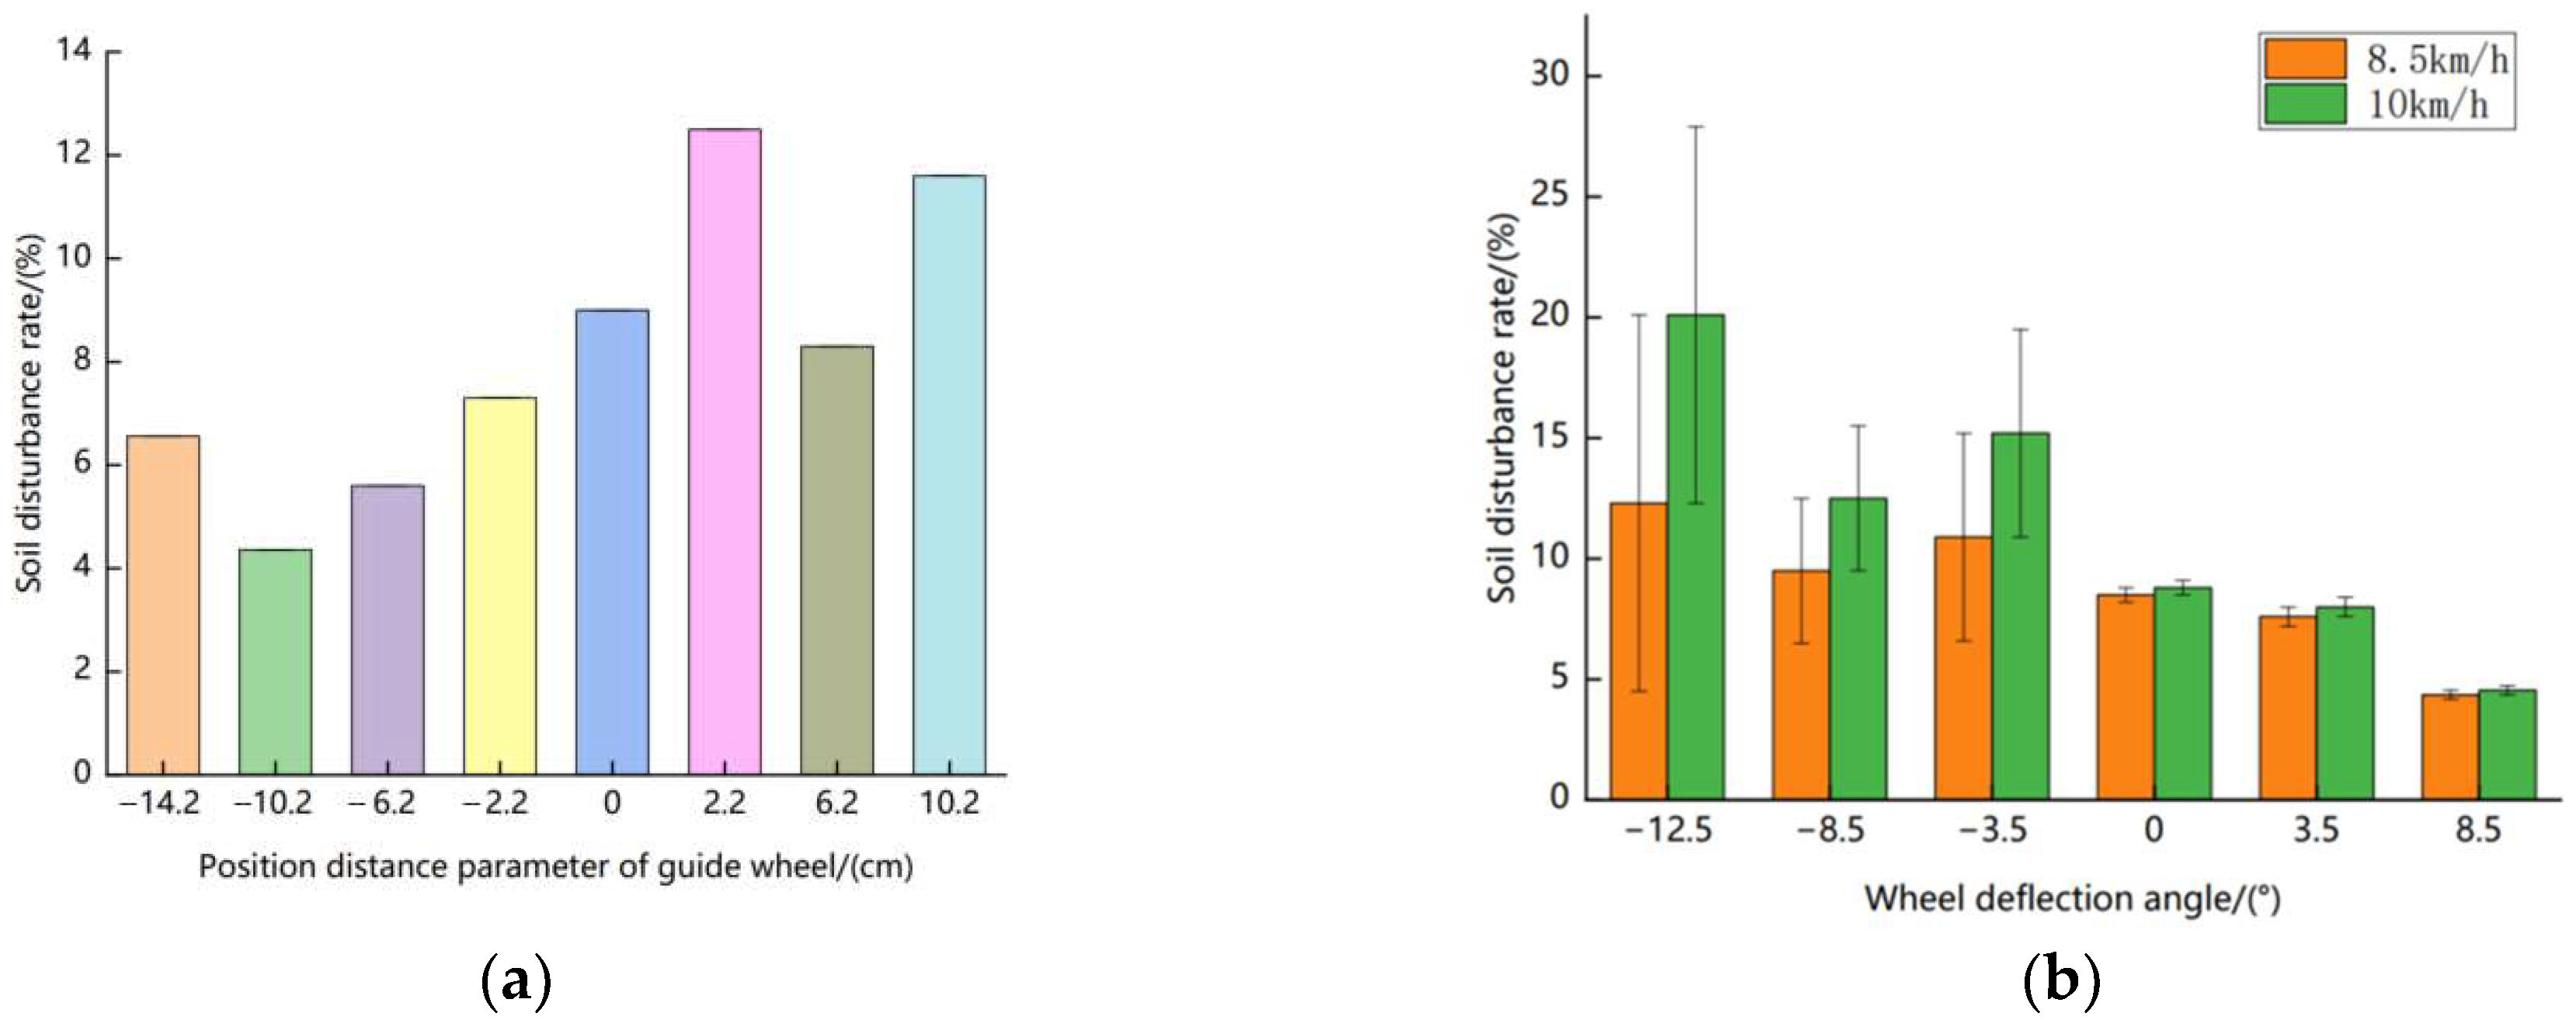
During the comparative experiment, when using an unoptimized prototype for testing, congestion and soil pushing occurred during high-speed operation. At the same time, a large amount of soil was disturbed on the upper layer of straw on both sides of the seedling belt, and some soil was excessively disturbed, exceeding the row spacing and causing inter-row interference. From Figure 15c, it can be seen that the large-scale straw slippage that occurred after mechanical operation affected the quality of subsequent sowing operations. The field test effect of the prototype after parameter optimization is shown in Figure 15d, The above problems did not occur in the experiment. At the same time, it can be seen that there was no obvious disturbance in the soil after the experiment, and it did not exceed the working seedling zone. The stripped straw was pressed into the soil by the wheel at the edge of the seedling zone, forming an embankment. The straw gathered outside the edge of the seedling zone without obvious slippage. After the experiment, data processing was performed on the disturbance of the soil, and the results are shown in Figure 16.
Figure 16a illustrates the relationship between the machine’s performance and its position when the machine was maintained at the optimal speed and the deflection angle was set to the optimal position. From the data in the figure, it can be observed that during the soil preparation operation, the smaller the position parameter of the guide wheel, the lower the soil disturbance. The best performance was achieved when the guide wheel was located 10.2 cm behind the subsoiler. Figure 16b shows the soil disturbance of the machine on the seedling belt under different speed and deflection angle conditions, with the machine’s position fixed. As can be seen from the figure, at low speeds, a larger deflection angle resulted in better lateral blocking of the soil by the machine and lower soil disturbance. With the increase in speed, soil movement accelerated, leading to increased soil disturbance. Due to the influence of the deflection angle, the increase in the soil disturbance rate when the angle was positive was significantly lower than that at other angles. It can be concluded that the machine’s performance was significantly improved after parameter optimization. Field tests indicate that the optimal combination of machine parameters was as follows: forward speed of 8.5 km/h, front–rear position distance of −10.2 cm, and deflection angle of 8.5°. Under this parameter combination, the soil disturbance rate of the machine in the field was 4.32%, which is 1.166% lower than the performance result of the simulation test. The field test index was superior to that of the simulation test, with better actual operation performance, thus meeting the design goal of machine optimization.

6. Conclusions

Based on the above analysis, the following conclusions can be drawn:
(1)
This article designs a copying deep loosening and stubble pressing mechanism suitable for strip tillage, which integrates profiling, depth limiting, diversion, and stubble pressing. The working principle of the device was expounded, the tooth shape parameters, convex structure parameters, and distribution mode of the mechanism were determined, the working process was optimized and analyzed, and the parameter range of the actual operation of the mechanism was verified through theoretical analysis and calculation.
(2)
The machine parameters obtained through discrete element simulation tests were as follows: forward speed of 7.383 km/h, front–rear position distance parameter of −10.131 cm, deflection angle of 8.608°, and soil loss rate of the seedling belt of 5.486%. Preliminary tests showed that after the machine operated, soil disturbance was reduced and machine performance was improved.
(3)
Based on the actual operation conditions and requirements, the working parameters of the mechanism were optimized, and field tests were conducted. Taking the soil disturbance rate and straw return status as the test indices, an optimization analysis of the design parameters was carried out. Field test data showed that the machine achieved the best operation performance when the forward speed was 8.5 km/h, the front–rear position distance parameter was −10.2 cm, and the deflection angle was 8.5°. Under these conditions, there was no large clod of soil remaining in the seedling belt after operation, and the surface soil was flat. The tests also revealed that no obvious straw sliding occurred after operation, and only a small amount of straw remained in the planting seedling belt, which did not affect the subsequent sowing quality. After parameter optimization, the operation performance of the machine was significantly improved.
(4)
The optimal combination of deflection angle and front–rear relative position parameters derived from this research can serve as specific reference criteria for manufacturers to optimize the structure of existing equipment. It can help enterprises address the issues of high tillage resistance, soil clogging, and uneven crushing that exist in traditional products, and holds practical reference significance for improving the efficiency of machinery in the industry.

Author Contributions

Conceptualization, W.Y. and S.S.; methodology, W.Y.; software, S.S.; validation, K.L., Z.L., and Z.W.; formal analysis, W.Y.; investigation, S.S.; resources, S.S.; data curation, J.Z.; writing—original draft preparation, W.Y.; writing—review and editing, S.S.; visualization, J.Z.; supervision, G.W.; project administration, J.Z.; funding acquisition, S.S. All authors have read and agreed to the published version of the manuscript.

Funding

This research was funded by the “Key R&D Program of Shandong Province, China” and the “Key R&D Program of Shandong Province—Development of High-Speed Air Suction Seedling Belt Preparation Precision Sowing Joint Operating Machine” and the “State Key Laboratory of Nutrient Use and Management”, grant numbers “2024CXGC010901” and “2024TSGC0596”.

Institutional Review Board Statement

Not applicable.

Informed Consent Statement

Not applicable.

Data Availability Statement

The data presented in this study are available upon request from the corresponding author. Due to the nature of this research, participants of this study did not agree for their data to be shared publicly.

Conflicts of Interest

The authors declare no conflicts of interest.

References

  1. Tang, Q.X.; Li, S.K.; Xie, R.Z.; Zhang, J.X.; Ren, T.Z.; Lin, T.; Gao, S.J. Effects of Conservation Tillage on Crop Yield: A Case Study in the Part of Typical Ecological Zones in China. Agric. Sci. China 2011, 10, 860–866. [Google Scholar] [CrossRef]
  2. Hu, R.W.; Liu, Y.J.; Chen, T.; Zheng, Z.Y.; Peng, G.J.; Zou, Y.D.; Tang, C.G.; Shan, X.H.; Zhou, Q.M.; Li, J. Responses of soil aggregates, organic carbon, and crop yield to short-term intermittent deep tillage in Southern China. J. Clean. Prod. 2021, 298, 126767. [Google Scholar] [CrossRef]
  3. Askari, M.; Shahgholi, G.; Abbaspour-Gilandeh, Y. New wings on the interaction between conventional subsoiler and paraplow tines with the soil: Effects on the draft and the properties of soil. Arch. Agron. Soil Sci. 2019, 65, 88–100. [Google Scholar] [CrossRef]
  4. Afzalinia, S.; Zabihi, J. Soil compaction variation during corn growing season under conservation tillage. Soil Tillage Res. 2014, 137, 1–6. [Google Scholar] [CrossRef]
  5. Afshar, R.K.; Cabot, P.; Ippolito, J.A.; Dekamin, M.; Reed, B.; Doyle, H.; Fry, J. Corn productivity and soil characteristic alterations following transition from conventional to conservation tillage. Soil Tillage Res. 2022, 220, 105351. [Google Scholar] [CrossRef]
  6. Pöhlitz, J.; Rücknagel, J.; Koblenz, B.; Schlüter, S.; Vögel, H.J.; Christen, O. Computed tomography and soil physical measurements of compaction behaviour under strip tillage, mulch tillage and no tillage. Soil Tillage Res. 2018, 175, 205–216. [Google Scholar] [CrossRef]
  7. Murmu, K.; Thakur, T.C. Design and Development of Combined Conservation Tillage Machine with Chiselers and Clod Pulverizing Roller. Ama-Agric. Mech. Asia Afr. Lat. Am. 2019, 50, 66–72. [Google Scholar]
  8. Salar, M.R.; Esehaghbeygi, A.; Hemmat, A. Soil loosening characteristics of a dual bent blade subsurface tillage implement. Soil Tillage Res. 2013, 134, 17–24. [Google Scholar] [CrossRef]
  9. Loghin, F.; Capatîna, I. Aspects Regarding the Reduction of Penetration Resistance of Soil as a Consequence Soil Working. Environ. Eng. Manag. J. 2010, 9, 1619–1622. [Google Scholar] [CrossRef]
  10. Shahgoli, G.; Saunders, C.; Desbiolles, J.; Fielke, J. The effect of oscillation angle on the performance of oscillatory tillage. Soil Tillage Res. 2009, 104, 97–105. [Google Scholar] [CrossRef]
  11. Hou, S.Y.; Wang, S.Z.; Ji, Z.C.; Zhu, X.X. Design and Test of the Clearing and Covering of a Minimum-Tillage Planter for Corn Stubble. Agriculture 2022, 12, 1209. [Google Scholar] [CrossRef]
  12. Chen, Y.; Liu, S.; Li, H.; Li, X.F.; Song, C.Y.; Cruse, R.M.; Zhang, X.Y. Effects of conservation tillage on corn and soybean yield in the humid continental climate region of Northeast China. Soil Tillage Res. 2011, 115, 56–61. [Google Scholar] [CrossRef]
  13. Zeng, Z.W.; Chen, Y. Performance evaluation of fluted coulters and rippled discs for vertical tillage. Soil Tillage Res. 2018, 183, 93–99. [Google Scholar] [CrossRef]
  14. Wang, Q.; Wang, B.; Sun, M.J.; Sun, X.B.; Zhou, W.Q.; Tang, H.; Wang, J.W. Design and Testing of an Automatic Strip-Till Machine for Conservation Tillage of Corn. Agriculture 2023, 13, 2357. [Google Scholar] [CrossRef]
  15. Feng, X.; Yao, J.Y.; Gao, Y.P.; Zeng, L.C.; Wang, L.J.; Wang, B.; Yang, Z.L. Review of Root-Stubble Characteristics and Root-Stubble Crushing and Clearing Technologies for Conservation Tillage. Sustainability 2024, 16. [Google Scholar] [CrossRef]
  16. Overstreet, L.F. Strip tillage for sugarbeet production. Int. Sugar J. 2009, 111, 361–368. [Google Scholar]
  17. Li, C.R.; Liu, Z.N.; Liu, M.; Xu, T.Y.; Ji, C.; Qiao, D.; Wang, Y.; Jiang, L.M.; Wang, J.L.; Feng, W.Z. Design and Testing of Key Components for a Multi-Stage Crushing Device for High-Moisture Corn Ears Based on the Discrete Element Method. Appl. Sci. 2024, 14, 9108. [Google Scholar] [CrossRef]
  18. Yuan, Y.W.; Wang, J.Y.; Zhang, X.; Zhao, S.H. Effect of Rotary Speed on Soil and Straw Throwing Process by Stubble-Crushing Blade for Strip Tillage Using DEM-CFD. Agriculture 2023, 13, 877. [Google Scholar] [CrossRef]
  19. Hou, S.Y.; Xue, D.H.; Ji, Z.C.; Zhou, C.; Chen, H.T. Parameter Combination Optimization of the Lateral Straw Clearing and Throwing Knife Based on Discrete Element Simulation. Agronomy 2023, 13. [Google Scholar] [CrossRef]
  20. Liu, X.T.; Qi, H.Y.; Wang, S.; Xu, Z.H.; Gao, P.; Fu, D.P.; Ma, Y.H. The Design and Experimentation of a Wing-Shaped Stubble-Breaking Device for Maize Stubbles. Agriculture 2024, 14, 2108. [Google Scholar] [CrossRef]
  21. Bai, S.H.; Yang, Q.Z.; Niu, K.; Zhao, B.; Zhou, L.M.; Yuan, Y.W. Discrete Element-Based Optimization Parameters of an Experimental Corn Silage Crushing and Throwing Device. Trans. Asabe 2021, 64, 1019–1026. [Google Scholar] [CrossRef]
  22. Xu, Z.; Shi, A.; Zhang, M.; Liu, L.; Zhou, Z.; Ding, L. Design and Testing of Air-Separation-Type Tillage Layer Residual Film Recovery Machines. AgriEngineering 2025, 7, 262. [Google Scholar] [CrossRef]
  23. Li, H.S.; Yang, L.; Zhang, D.X.; Tao, C.; He, X.T.; Xie, C.J.; Li, C.; Du, Z.H.; Xiao, T.P.; Li, Z.M.; et al. Design and optimization of a high-speed maize seed guiding device based on DEM-CFD coupling method. Comput. Electron. Agric. 2024, 227, 109604. [Google Scholar] [CrossRef]
  24. Zhu, H.B.; Wu, X.; Qian, C.; Bai, L.Z.; Ma, S.A.; Zhao, H.R.; Zhang, X.; Li, H. Design and Experimental Study of a Bi-Directional Rotating Stubble-Cutting No-Tillage Planter. Agriculture 2022, 12, 1637. [Google Scholar] [CrossRef]
  25. Zhu, A.W.; Xu, C.T.; Liu, Y.F.; Wang, J.S.; Tan, X.D. Design and Experiment of Oblique Stubble-Cutting Side-Throwing Anti-Blocking Device for No-Tillage Seeder. Agriculture 2024, 14, 2250. [Google Scholar] [CrossRef]
  26. Yazgi, A.; Taylor, R.K.; Navid, H.; Weckler, P. Performance Modeling and Seed Releasing Characteristics of a Corn Planter Metering Unit Using Response Surface Methodology. Appl. Eng. Agric. 2017, 33, 181–189. [Google Scholar] [CrossRef]
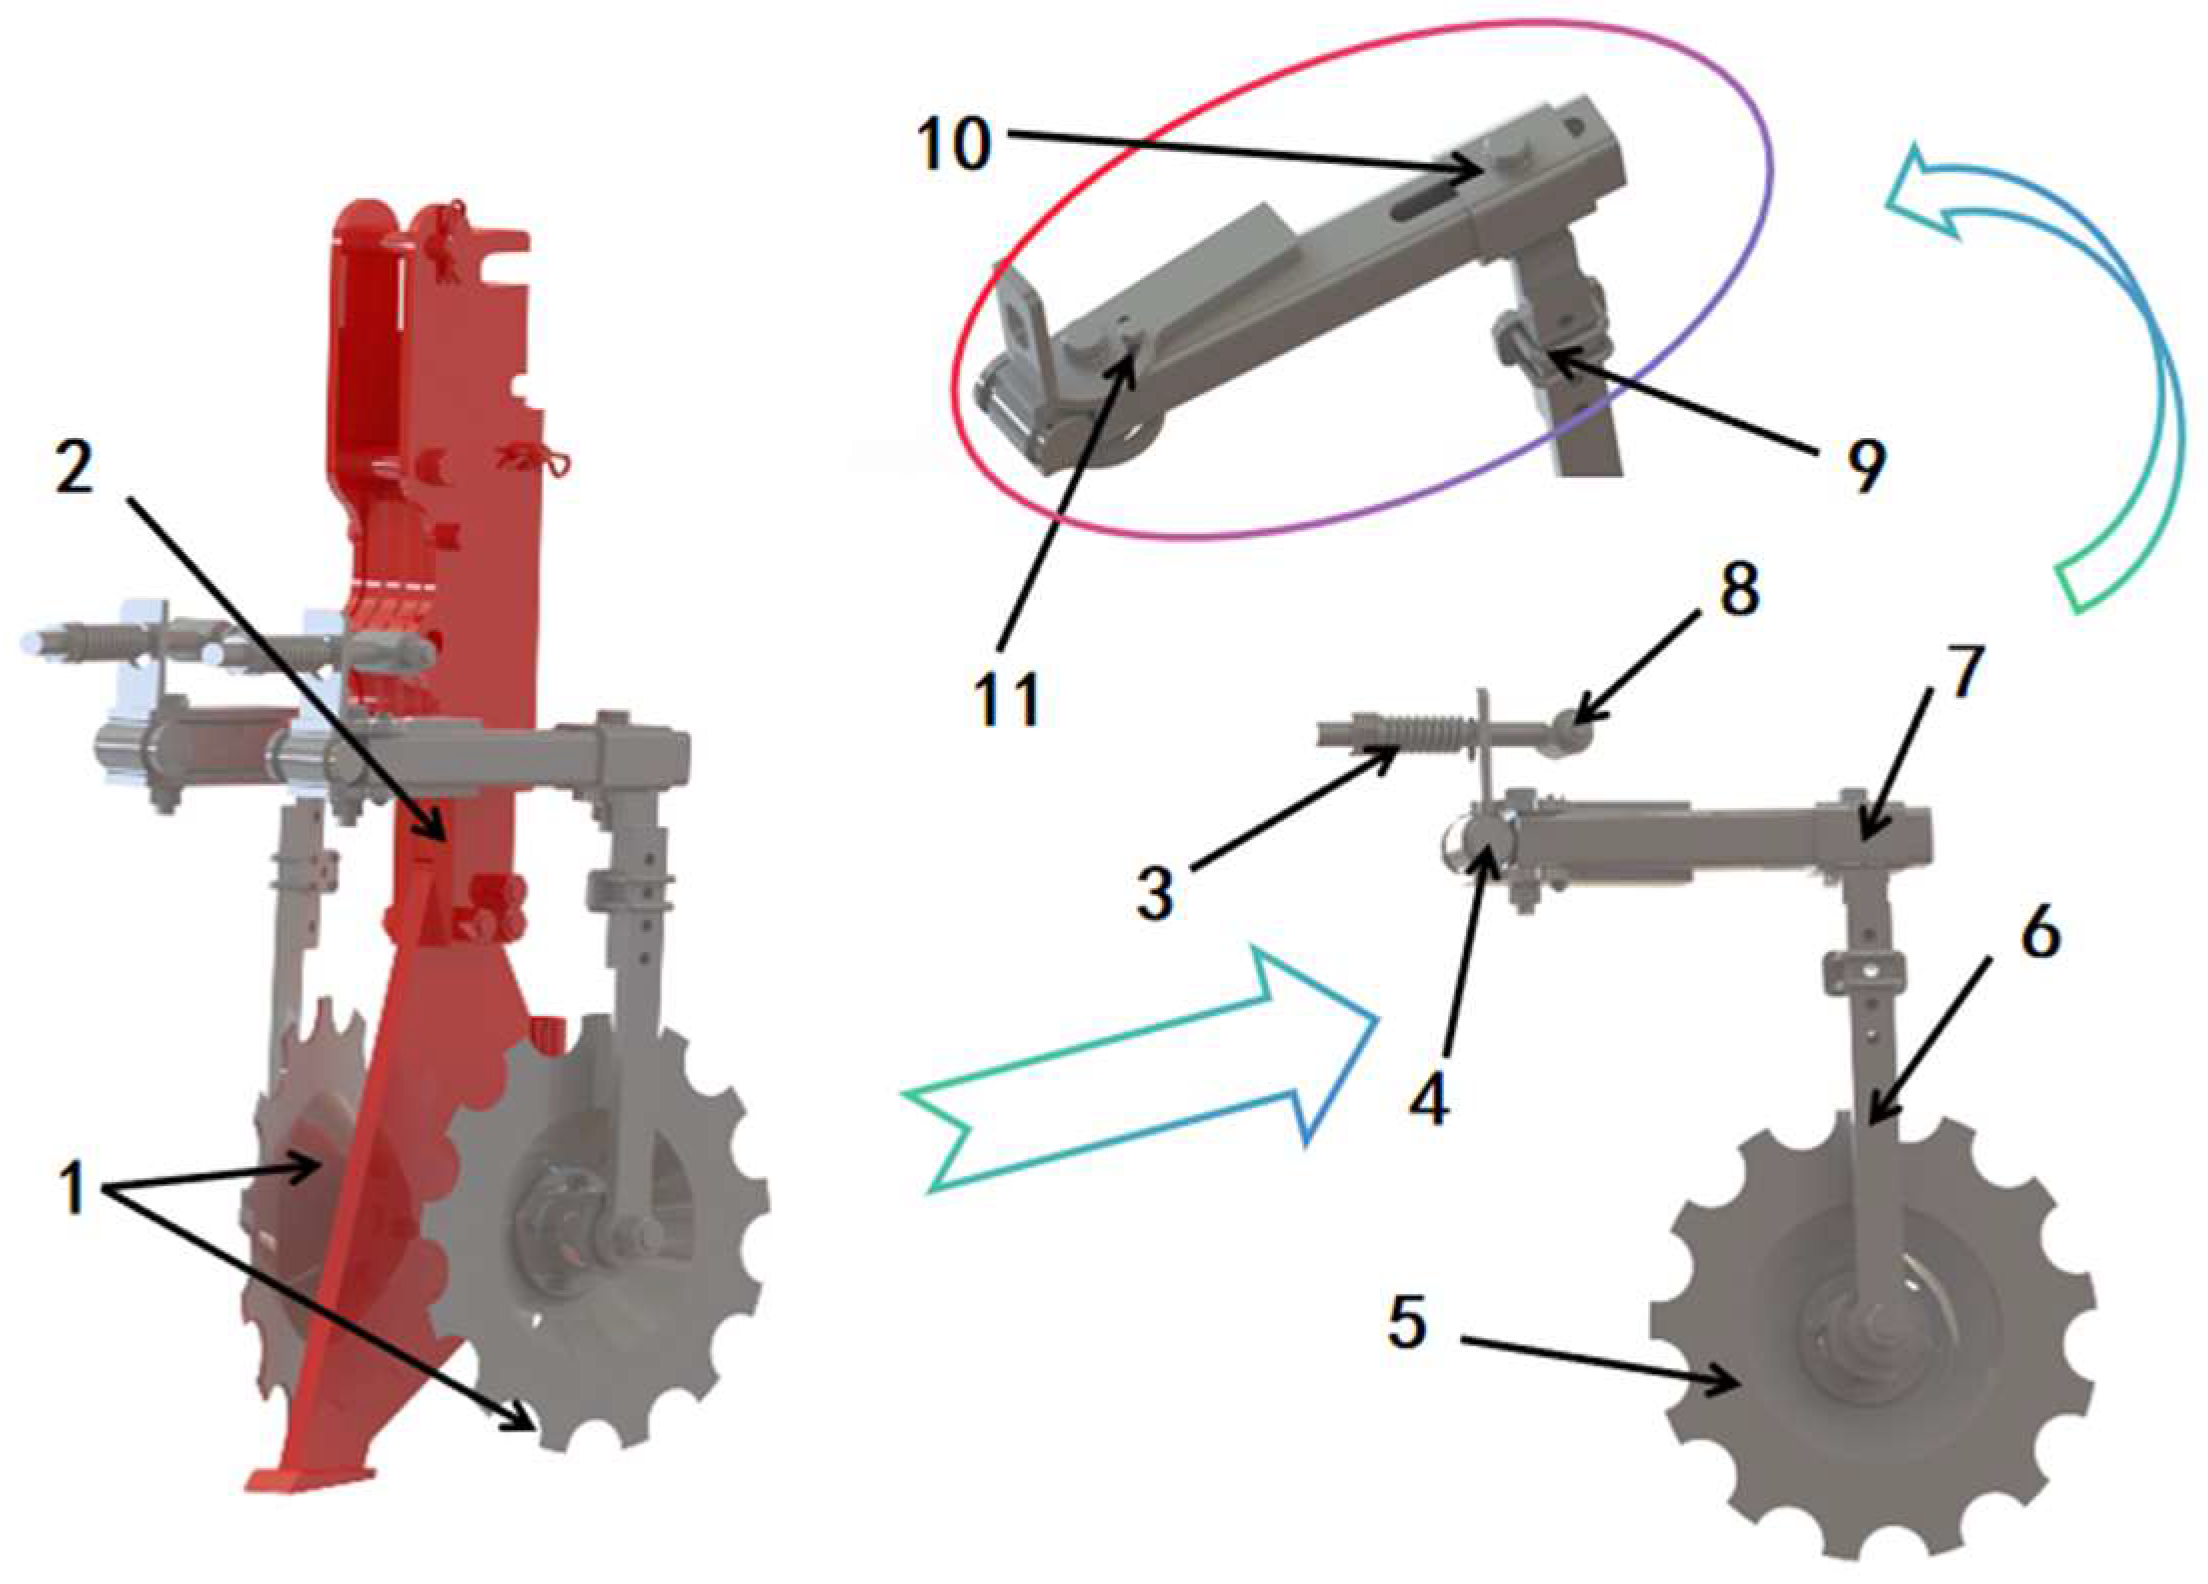
Figure 1. Schematic diagram of the overall structure. (1) Flow diversion and cutting components, (2) deep loosening components, (3) imitation structure, (4) guiding arm pivot shaft, (5) diversion and pressure wheel, (6) guide wheel arm, (7) corner adjustment structure, (8) imitation structure arm, (9) height adjustment structure, (10) flow arm length adjustment structure, and (11) arm angle adjustment structure.
Applsci 15 10062 g001
Figure 2. Mechanical analysis diagram of wheel straw shearing.
Applsci 15 10062 g002
Figure 3. Analysis map of burial depth.
Applsci 15 10062 g003
Figure 4. (a) Sectional view of homework trajectory. (surface soil = Surface of soil for machine operation; suppression layer = Soil layer with limited depth for machine wheels; straw layer = Machine presses into the soil layer of straw) (b) Analysis diagram of limited depth deviation angle.
Applsci 15 10062 g004
Figure 5. (a) Front position method, (b) center position method, and (c) rear position method. The dashed line in the figure represents the direction of soil flow during machine operation.
Applsci 15 10062 g005
Figure 6. Mechanical analysis diagram.
Applsci 15 10062 g006
Figure 7. (a) Schematic diagram of guide wheel operation, yellow represents wheat straw. (b) Schematic diagram of guide wheel guide fragmentation. Red represents the deep loosening shovel, circles represent soil particles, and arrows indicate the direction of soil flow.
Applsci 15 10062 g007
Figure 8. (a) Top view of the guide wheel. (b) Force analysis diagram of the guide wheel.
Applsci 15 10062 g008
Figure 9. Discrete element simulation of the soil trough model.
Applsci 15 10062 g009
Figure 10. Schematic diagram of detection sensor settings (Red represents high-speed moving particles, yellow represents stable moving particles, and green represents boundary moving particles).
Applsci 15 10062 g010
Figure 11. (a) Lateral view of high-speed simulation, (b) Simulated rear view.
Applsci 15 10062 g011
Figure 12. Sectional view of the diversion and stubble-pressing process.
Applsci 15 10062 g012
Figure 13. (a) x1x2 Response surface, (b) x1x3 response surface, and (c) x2x3 response surface.
Applsci 15 10062 g013
Figure 14. Strip type diversion and pressure tillage experiment.
Applsci 15 10062 g014
Figure 15. (a) Real situation map of the experimental site. (b) Plot map before the experiment. (c) Prototype operation effect diagram after parameter optimization. (d) Unoptimized prototype operation rendering.
Applsci 15 10062 g015
Figure 16. Statistical charts of field experiment data: (a) figure of experimental data for the position factor and (b) figure of data analysis for the angle factor.
Applsci 15 10062 g016
Table 1. Material parameters and contact parameters.
ModelContact ParametersNumerical Value
Straw residue modelPoisson’s ratio0.39
Solid density/(kg/m3)1678
Shear modulus/(pa)1.696 × 107
Straw residue straw modelCollision recovery coefficient0.65
Static friction coefficient0.3
Dynamic friction coefficient0.01
Straw residue cleaning wheel modelCollision recovery coefficient0.32
Static friction coefficient0.33
Dynamic friction coefficient0.05
Soil particle modelPoisson’s ratio0.43
Solid density/(kg/m3)1364
Shear modulus/(pa)1 × 108
Soil particle soil modelCollision recovery coefficient0.25
Static friction coefficient0.66
Dynamic friction coefficient0.29
Soil particle cleaning wheel modelCollision recovery coefficient0.51
Static friction coefficient0.63
Dynamic friction coefficient0.29
Soil particle straw residue modelCollision recovery coefficient0.51
Static friction coefficient0.29
Dynamic friction coefficient0.06
Cleaning wheel modelPoisson’s ratio0.29
Solid density/(kg/m3)7852
Shear modulus/(pa)3.5 × 109
Table 2. Factor level coding table.
EncodingConsideration
Traction Speed, X1 (km/h)Distance Between Front and Rear Positions, X2 (cm)Deflection Angle of Guide Wheel, X3 (°)
−1.4716−15−13
−17.28112−10.1958−8.83636
01000
112.718910.19588.83636
1.471141513
Table 3. Experimental plan and results.
Test Serial Numberx1/(km/h)x2/(cm)x3/(°)Soil Disturbance Rate/%
100015.3
21−117.3
3001.47112.6
41.4710016.2
500014.5
6−1−115.6
700012.5
801.471018.6
9−11110.5
10−1.471007.5
11−1−1−19.6
1211−126.8
131−1−111.6
140−1.471014.5
1500−1.47115.1
1611113.1
1700017.8
1800010.9
19−11−119.5
Table 4. Analysis of variance.
SourceSum of SquaresdfMean SquareF-Valuep-Value
MODEL355.86939.543.970.0260
X156.53156.535.680.0410
X2141.941141.9414.270.0044
X397.5414.819.800.0121
X1X24.8113.130.48290.5046
X1X33.13125.920.31410.5889
X2X325.92118.292.610.1410
X1218.2915.621.840.2082
X225.6212.100.56480.4715
X322.1019.950.21070.6571
Residual89.55912.30
Lack of Fit61.5157.011.750.3029
Pure Error28.044
Cor. Total445.4118
Note: 0.01 ≤ p < 0.05 is significant, and p < 0.01 is extremely significant.
Disclaimer/Publisher’s Note: The statements, opinions and data contained in all publications are solely those of the individual author(s) and contributor(s) and not of MDPI and/or the editor(s). MDPI and/or the editor(s) disclaim responsibility for any injury to people or property resulting from any ideas, methods, instructions or products referred to in the content.