Abstract
This study employs computational fluid dynamics methods to investigate the aerodynamic noise of a 35° inclination Ahmed body mounted with six hollow spoilers of different opening areas. The study combines the steady k-ε model and the transient large eddy simulation model, and extracts acoustic data through the Ffowcs-Williams & Hawkings equation. The results show that all spoilers can effectively reduce noise, but there is a non-near relationship between the noise reduction effect, aerodynamic drag, and opening area of the spoilers. Among them, Case 4 achieves the optimal noise reduction effect, though its drag is slightly higher than that of the Base model. Flow field analysis reveals that the 300 Hz noise peak originates from the entrainment of side airflow into the wake region. The hollow spoilers achieve noise reduction by altering the vortex structures in the wake, and this finding provides targeted guidance for the optimization design of spoilers, helping to deepen the understanding of the mechanism by which hollow spoilers affect aerodynamic noise.
1. Introduction
While automobiles bring convenience to urban life and transportation, they also pose potential threats to the ecological environment. With the popularization and promotion of electric vehicles, due to the absence of mechanical noise from their engines, automotive aerodynamic noise has become a significant factor in vehicles’ impact on the ecological environment [1,2,3,4,5]. Studies have shown that the intensity of aerodynamic noise is proportional to the sixth power of the vehicle’s speed. When the speed reaches 100 km/h, aerodynamic noise becomes the primary noise source of the vehicle [6,7,8,9,10,11,12]. In recent years, with the rapid development of the passenger vehicle market, especially the growing recognition and popularity of SUVs, automotive companies have continuously improved vehicle quality to enhance customer satisfaction amid fierce market competition. Among various aspects of vehicle quality, wind noise generation at high speeds has attracted increasing attention from consumers. As a result, automotive wind noise control has become a key technical challenge in current automotive NVH development.
The generation of wind noise in vehicles is directly related to their aerodynamic shape. Existing studies have widely focused on experimental and simulation methods to investigate the wind noise generated by components such as side mirrors, A-pillars, wipers, and fenders, leading to numerous meaningful conclusions and engineering practices [13,14].
Moath et al. [1] focused on lowering noise emission from vehicles by optimizing the orientation of the mirror base, and they examined multiple angles, ranging from 0 to 90°, to determine the optimal angle for the mirror base, with the results showing that changing the mirror base orientation results in a difference in sound pressure levels of up to 32 dB [15]. The aerodynamic noise level results can be improved through the flow control around the side mirror. For example, adding a bionic shark fin structure could reduce the maximum noise by 7.3 dB by effectively combing the streamlines and turbulence intensity at the rear of the side mirror to reduce the negative pressure area [16].
With the implementation of the China VI emission standard and World Light Vehicle Test Cycle (WLTC), automotive drag has also become one of the key focuses in the study of automotive aerodynamic characteristics. Under normal driving conditions, aerodynamic drag is proportional to the square of vehicle speed; when the vehicle speed exceeds 80 km/h, 50% of the energy consumption is used to overcome aerodynamic drag. For battery electric SUVs traveling at a constant speed of 120 km/h, the driving range increases by 6–7 km for every 10 counts of reduction in vehicle drag. The aerodynamic drag of a vehicle mainly originates from the pressure difference between the front and rear of the vehicle body; therefore, increasing the pressure at the rear of the vehicle body is crucial. The design of components such as tires, rims, and air curtains can affect the flow characteristics around the vehicle, thereby altering the pressure distribution at the front and rear of the body, and ultimately influencing aerodynamic drag [17,18,19,20,21]. Furthermore, the automotive spoiler is one of the most important aerodynamic structures of a vehicle. Automotive spoilers can effectively improve the vortex structures at the rear of the vehicle and increase the pressure at the rear, thereby reducing aerodynamic drag while exerting a direct influence on vehicle lift [2,17,22,23,24].
To pursue the sportiness of automobile styling and brand individuality, hollow spoilers have begun to be applied to vehicles, as shown in Figure 1. To address the limitations of wind tunnel tests, such as long cycle times, high costs, and difficulty in grasping flow patterns, the Computational Fluid Dynamics (CFD) method has become an important means to explore the relationship between structures and flow fields [25,26,27,28,29]. Zuo Huihui conducted research on the drag and lift of non-hollow spoilers through a combination of simulation and experimental methods [30]. Zhang et al. investigated the influence of different configurations of hollow spoilers on vehicle aerodynamic drag, and elucidated the mechanism of aerodynamic drag variation from the perspective of the flow field [31]. Zhang et al. adopted numerical simulation and experimental methods, investigated the flow characteristics of hollow spoiler deflectors, and proposed the use of spoiler rib shape measures to reduce aerodynamic noise [32]. However, the hollow spoiler increases the airflow space at the rear of the vehicle, especially at high speeds, where airflow separation occurs around the spoiler, leading to strong vortices and resulting in significant aerodynamic noise, similar to the pantograph noise in high-speed trains [33,34].

Figure 1.
Different SUVs’ hollow spoiler shapes.
The existing literature primarily focuses on the drag reduction effects of hollow spoilers and has produced some meaningful conclusions [35,36,37], but downplays their impact on aerodynamic noise. In addition, due to the diverse designs of hollow spoilers, this study refers to existing vehicle configurations and designs six different hollow spoilers, using CFD methods to explore the mechanism by which hollow spoiler configurations affect automotive aerodynamic noise, laying the foundation for rapid selection and optimization of rear spoiler designs in the early stages of vehicle development. The structure of the paper is as follows: Section 2 introduces the model geometry, numerical set-up, and mesh generation. Six types of hollow spoilers are designed and their aerodynamic noise generation is explained, and an analysis of the flow field characteristics and noise reduction mechanism in Section 3. Finally, Section 4 provides the conclusion of this study. Compared with previous studies, this work presents a new perspective of the effects of different hollow spoilers on aerodynamic noise, and the relevant results could provide targeted guidance for the improvement of aerodynamic performance during the design and optimization of vehicle shapes.
2. CFD Case Description and Numerical Settings
2.1. Geometry Model
The Ahmed body is a general car model which is used by the automotive industries to examine aerodynamic performance, which is experienced in a variety of configurations [38,39]. Based on the published research results of Reference [40], this paper chooses the Ahmed model with the inclination angle of the wake of the body at 35°, and the overall dimensions of the Ahmed model are presented in Figure 2.
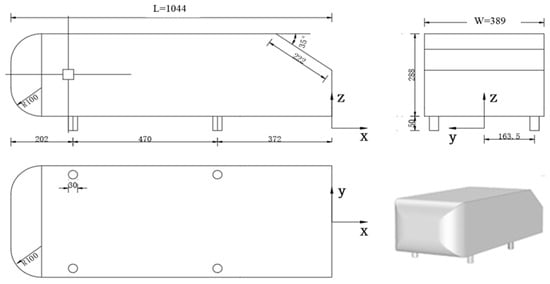
Figure 2.
A schematic diagram of the Ahmed model parameters.
2.2. Domain and Boundary Conditions
The size of the Ahmed model is L = 1044 mm, W = 389 mm, and H = 338 mm, which are the length, width, and height of the model, respectively. The size of the calculation domain of the pantograph is 13L * 9W * 6H, as shown in Figure 3. To improve the quality of the mesh, a resolution box is created around the Ahmed model with dimensions of 0.2 at the front, and two resolution boxes of 0.3L and 0.5L are formed at the backside, as well as one of 0.2L above it, as shown in Figure 3. All Ahmed models are placed within a rectangular computational domain.
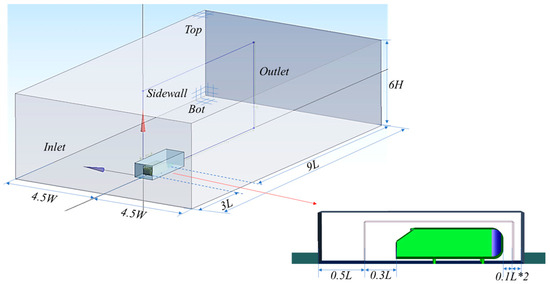
Figure 3.
The dimensions of the computational domain.
Figure 3 clearly indicates the boundary conditions for the computational domain that consists of velocity inlet, pressure outlet, and wall boundaries. The top and both side walls of the boundary are assumed to be symmetrical, while the surface of the car body is regarded as nonslip. The freestream velocity is set to the inlet as 40 m/s, leading to a Reynolds number of 7.8 * 105 based on model height. The road is a nonslip wall with zero shear force. The simulated wind tunnel fluid material is set to air, with a temperature of 288.15 K and a density of 1.225 kg/m3.
2.3. Numerical Methods
The numerical simulation is performed using commercially available software, Ansys Fluent (https://www.ansys.com/products/fluids/ansys-fluent, accessed on 7 September 2025). Considering the high cost of the direct calculation of aerodynamic noise in the external flow field of a car, this paper adopts a combination of steady state and transient calculations. Firstly, for the steady state calculation, the solution set-up is pressure-based since the air is assumed to be incompressible in this case. The realizable k-ε model with non-equilibrium wall function is selected for this simulation, which is better for the flow away from the wall. The Semi-Implicit Method for Pressure-Linked Equations (SIMPLE) algorithm is adopted for the pressure–velocity coupling, and the second-order windward format is used for the discrete format of all variables. In the steady state calculation, the acoustics of the flow are estimated using the broadband noise source model with 100 sampling realizations. The total number of iteration steps for the steady state is 4000.
After the steady state calculation is completed, the unsteady state calculation is conducted based on the steady state calculation result file. For the unsteady state calculation, the large eddy simulation (LES) model is selected for the simulation of unsteady flow feature and acoustic calculation [41]. The Pressure-Implicit Splitting of Operators (PISO) algorithm is used for the transient flow, and the discrete format is a second-order windward format with a time step of 1.25 × 10⁻⁴ s and fifteen iterations in each unit time step. After the 0.3 s transient computation period ends, the acoustic collection begins and it lasts for 0.2 s. Throughout the acoustic collection, the statistical processing of the flow field is open, and the sampling interval is set as 3.
When air flows through the hollow spoiler, because of the guiding effect of the holes, unstable fluid vortices like the Karman vortex street should be generated around the rear of the car body, and this will generate flow-induced oscillation; then, fluctuating pressure will be generated and radiate noise outside, and this can lead to window vibration. All the surfaces of the Ahmed model are set as the acoustic source, and the Ffowcs-Williams & Hawkings formulation in Fourier series format with the Hanning window is used to extract acoustic data [42]. The ten noise measuring points are presented in Figure 4. The measuring points P1 to P5 are named as Zone 1, and are placed in the center of the car body, while points S1 to S5 are named as Zone 2, and are fixed at the side of the car body. The details of the ten measuring points’ positions are listed in Table 1.
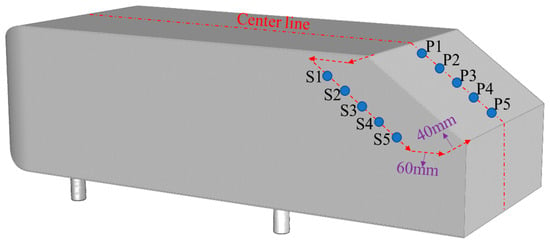
Figure 4.
The arrangement of the noise measuring points.

Table 1.
The details of the different noise measuring points’ positions. (Unit: mm.)
2.4. Mesh Strategy
The mesh size should be chosen to yield the best results without requiring long computational times. In this case, a poly hex core unstructured grid is chosen and generated using the ANSYS Fluent [43]. To ensure that the meshing does not affect the results, a grid independency test (GIT) is carried out to seek the optimum element size for meshing [44]. Thus, three different grid scales are used to conduct the GIT. Table 2 shows the simulation values of the drag coefficients, and a comparison of the results with the available literature data is also presented.

Table 2.
The mesh strategy and the comparison results.
Firstly, it can be seen that there is relatively little difference in the simulation values for the fine and medium grids. Based on a balance between efficiency and accuracy, as well as comprehensive analysis of the published study results, the medium grid scale is selected to conduct the numerical simulation in this study. In addition, the distribution of the acoustic power levels derived from the broadband noise source model using the three grids is shown in Figure 5, which also shows that the simulation accuracy of the medium grid is equivalent to that of the fine grid. Figure 6 shows the mesh layout of the medium grid. To accurately capture the flow filed near the car body wall, a boundary layer grid is created that contains five layers, with the first grid being 0.5 mm, and has a normal growth rate of 1.2.

Figure 5.
The grid-independent analysis using the acoustic power level.
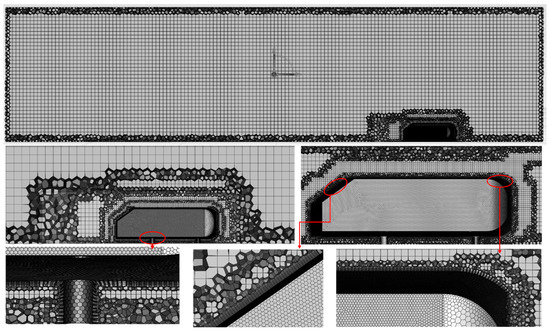
Figure 6.
The computational grid layout with boundary layer mesh details.
3. Results and Discussion
3.1. Design and Noise Characteristics
Based on our research results, which indicate the effects of hollow spoilers on aerodynamic drag [31], and according to the influence of the spoiler’s angle on aerodynamic drag, Figure 7 shows the appearance and the overall sizes, including the angle, dimensions, and vertical spacing, of the six hollow spoilers—specifically, their angle is 25°, total length is 389 mm, upper layer width is 46 mm, lower layer width is 38 mm, and vertical separation is 5 mm. To investigate the effects of hollow spoilers on aerodynamic noise, the three main parameters, D, H, and L, are selected as design variables, and the six typical structures of hollow spoilers are used, the size details of which are presented in Figure 8. It should be noted that the original Ahmed model without a spoiler, as shown in Figure 4, is referred to as the Base model.
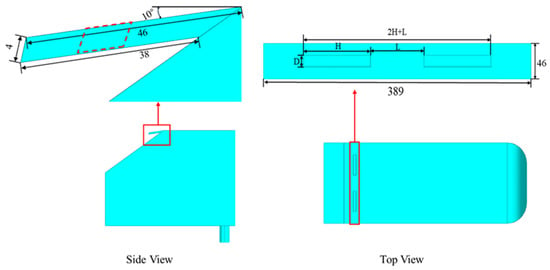
Figure 7.
The configuration and sizes of the hollow spoilers.
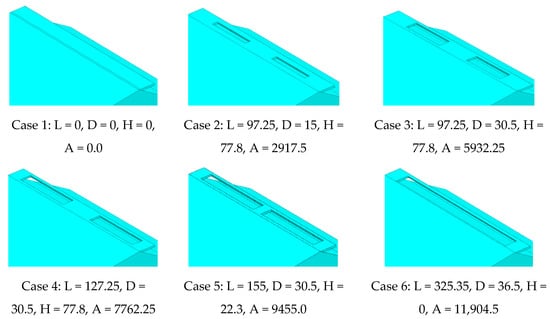
Figure 8.
The design parameters for the different hollow spoilers. (Unit: mm.)
The aerodynamic noise in this work is evaluated by the Sound Pressure Level (SPL, ). According to the definition of international standard ISO 3095-2013 for noise testing, can be calculated as follows [15]:
where is the sound pressure in Pa, and is the reference sound pressure of Pa.
The Overall Sound Pressure Level (OASPL) represents the intensity of the sound spectrum, which provides an overall description of the acoustic field. As it is a combination of all computer frequencies, it will exceed any individual SPL in the specification, where the of OASPL is defined as follows [15]:
where (i = 1, 2, …, n) denotes the of the testing point and is the number of noise-receiving points.
The SPL distributions of various measuring points within the seven types of spoilers are shown in Figure 9. The SPL in the two different zones has obvious differences—the values of the SPL in Zone 1 are higher than that in Zone 2, which means that the flow instability induced by the spoilers in Zone 1 is relatively more remarkable. For the spoilers of three of the models, Base, Case 1, and Case 2, the values of SPL in Zone 1 generally decrease with increases in the frequencies; however, the values of SPL in Case 3 to Case 6 increase and then decrease with increases in the frequencies, and a peak SPL of around 300 Hz appears in the frequency domain. For the values of SPL in Zone 2, all the characteristics of the noise spectrums of the five measuring points are similar, as the values of SPL first increase and then decrease, and there is also a peak value of SPL at around 300 Hz. For the SPL value in Zone 2, the peak value of SPL in Case 3 is below 80 dB, the value in Case 2 and Case 5 is about 80 dB, and the value in other Cases is above 80 dB. The differences in SPL between the zones means that there are flow instabilities caused by the different spoilers. A comprehensive analysis based on the ten measuring points in different zones has been performed, and it suggests that the SPL changes of the five measuring points in Zone 1 is higher than that of the five measuring points in Zone 2. It can be illustrated that there is a notable flow instability in the rear of the car body.
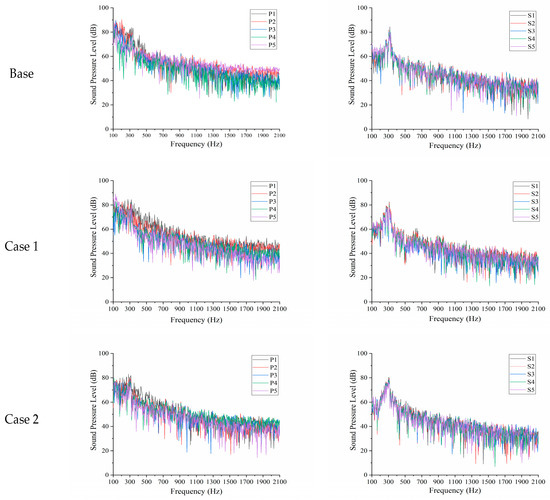
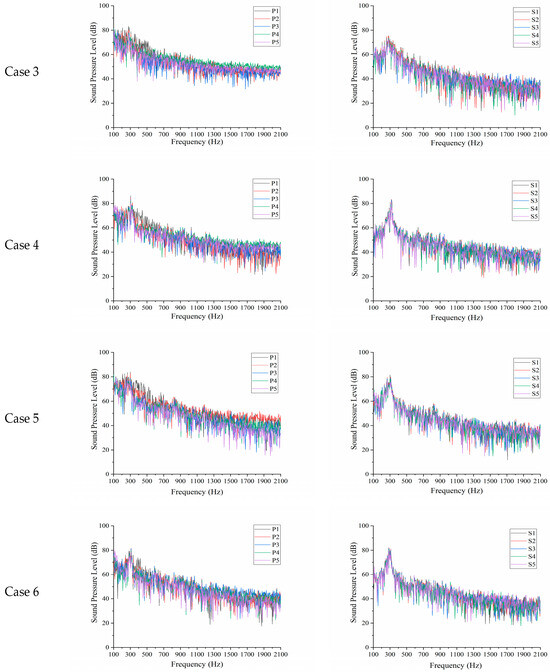
Figure 9.
The SPL of the measuring points of the different spoilers.
Figure 10 compares the drag coefficient and noise of the vehicle when different hollow spoilers are used. The results show that the addition of the spoiler effectively reduces aerodynamic noise in both Zone 1 and Zone 2, thereby improving the vehicle’s NVH characteristics, both externally and internally. However, in terms of aerodynamic drag, the addition of the spoiler introduces some uncertainty in the drag coefficient. Some configurations, such as Case 4 and Case 6, result in an increase in the drag coefficient, while others reduce it. Therefore, it can be inferred that in the future, comprehensive optimization of the aerodynamic shape of hollow spoilers is necessary to balance both fuel economy and comfort.
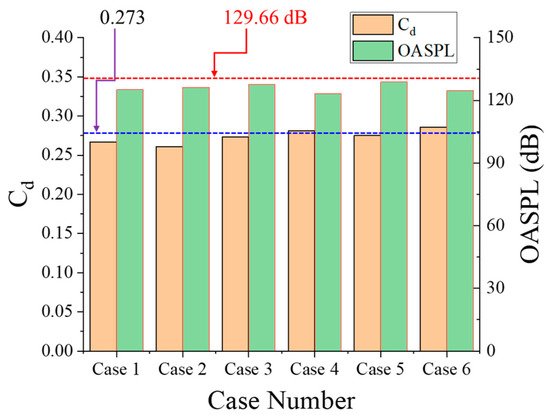
Figure 10.
A comparison between drag and SPL in different cases.
3.2. Flow Behavior
When exploring the relationship between the peak value of SPL and flow behavior, we found that throughout the values of SPL in Zone 1 and Zone 2, the peak values of SPL, at around 300 Hz, mainly appear in Zone 2; however, in Zone 1, the Base model does not present the peak value, and the peak value appears with the opening area increase. The main reason for the peak value of SPL reaching around 300 Hz is that the airflow along the side surface is spilling into the car body’s wake. Taking the location of P2 measurement as an object, a reference plane at Z = 250 mm is created, and the field distribution of the RMSE velocity and vorticity are presented in Figure 11. It can be seen that there are two visible vorticities near both side edges of the car body, and this unsteady flow can result in the peak values of SPL in Zone 2; due to the differences of the root mean square error (RMSE) velocity in the wake, the inhomogeneity of the flow in Case 6 is more obvious than that of the Base, and this can be used to explain the difference in the peak values of SPL in Zone 1.
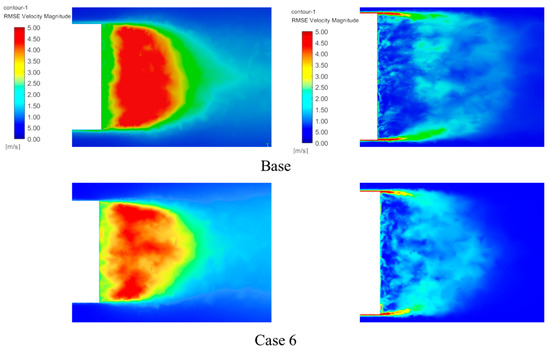
Figure 11.
A comparison of the RMSE velocity and vorticity distributions between the Base and Case 6.
The differences in noise at the measurement points are primarily due to variations in the hollow spoiler’s structural parameters which, in turn, lead to different wake conditions. To illustrate the effect of the spoiler structure on the wake flow, four planes are selected along the positive X-axis, and Figure 12 presents a comparison of the root mean square of velocity fluctuations on each plane. From Figure 12, it can be seen that as the distance increases, the velocity unevenness on each plane shows an increasing trend. Compared to the original model, for Plane 1 and 2, the angled structure of the spoiler causes the airflow to be directed toward the slanted rear surface, resulting in a larger RMSE velocity difference in the upper part of the model, with smaller effects at the bottom. For Planes 3 and 4, at the rear of the model, the presence of negative pressure in the wake region significantly increases flow unevenness. Under the continuous influence of the spoiler’s flow redirection, the vortex region becomes smaller than in the original model, causing the vortex core V2 near the bottom to move upward, thereby improving flow instability in the bottom region of Section 3. The vortex region in the model with the spoiler is smaller than in the original model, and in Section 4, the flow stability of the original model is slightly higher than that of the other models.
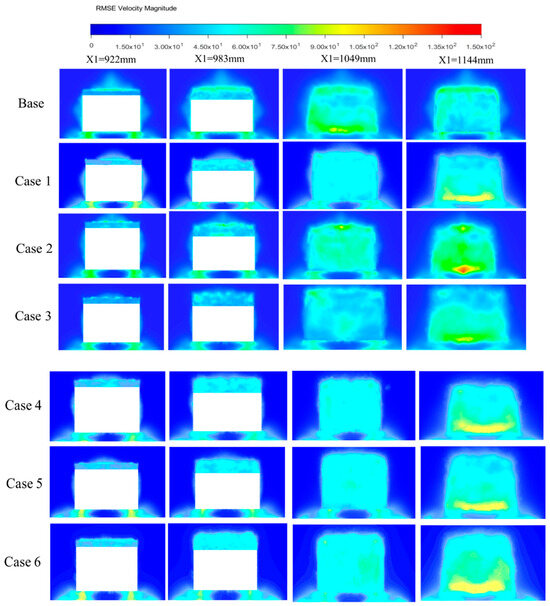
Figure 12.
The RMSE velocity distributions, where X = 922, 983, 1049, and 1144 mm.
The time root mean square of the fluctuation pressure on the car body surface can be used to reflect the aerodynamic noise source intensity. The fluctuating pressure results from the unsteady flow, and the time root mean square of the fluctuating pressure can be calculated using the following equation [46,47].
where is the transient pressure, is the fluctuating pressure, and is the time average of the transient.
where T is the sample time.
Due to the shape of the car body, the bottom is not changed, and the impact of the hollow spoiler on the airflow movement is mainly concentrated around the rear and the wake. Figure 13 qualitatively compares the distribution around the car body surface. Figure 13 gives the of the different car model surfaces, and it is found that the high is mainly located in the central area of the top surface; however, the presence of the spoilers at the rear can influence the high source intensity distribution. In comparison with Case 1, the distribution of high is more concentrated, with the opening area increasing; meanwhile, there is sporadic source intensity scattered on the top surface, and there is also high source intensity on the middle surface of the hollow spoiler.
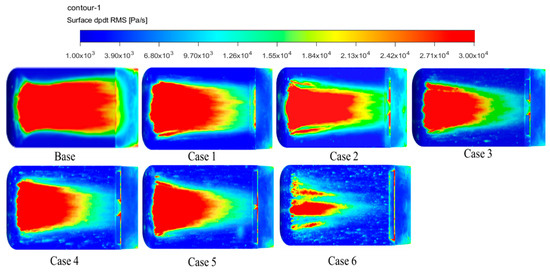
Figure 13.
The distribution contour around the car body in different cases.
The following equation is the sound power calculation formula of an equivalent sound source [24,42,48,49].
where is the equivalent sound power of the sound source; denotes the vector of the sound source; is the fluctuation pressure time gradient of the car’s entire surface; and is the noise source area.
Figure 14 presents the proportion of the six spoilers relative to the Base model. It shows that all the spoilers can reduce the equivalent sound power of the whole car model. The distribution of the equivalent sound power is similar to the OASPL that is illustrated in Figure 10.
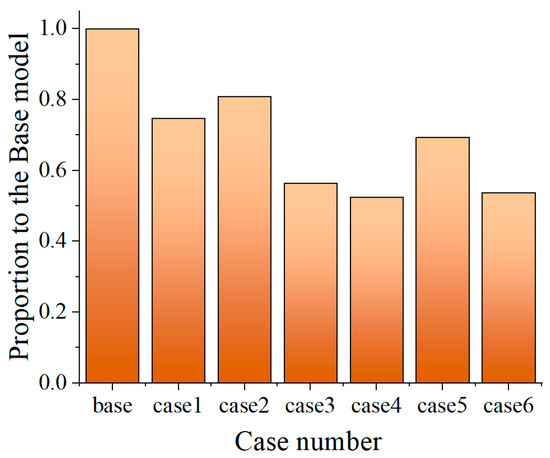
Figure 14.
A comparison of the equivalent sound power in different cases.
The nature of aeroacoustics noise is due to unsteady airflow movement, and airflow movement is affected the aerodynamic shape design of the car body. To reduce aerodynamic drag, the spoiler is one of the most popular methods in automobile aerodynamics. It is true that the airflow movement around the car body in this work is also influenced by the shapes of the hollow spoilers. To analyze the effect of different spoiler configurations on the wake flow distribution, Figure 15 represents the time-averaged streamlines in the centrally symmetric plane of the Ahmed model. As demonstrated in Figure 15, the existence of the slant spoiler can effectively influence the airflow patterns and movement in the wake region. To clarify the effect of characters and rules, two significant vortex structures, named V1 and V2, are proposed. It can be seen that the two rotating vortices, V1 and V2, appear in all of the models. In Case 1 and Case 2, the vortex core V2 moves backward, and the V1 vortex shrinks and moves backward as well. This enhances surface pressure recovery on the slanted and bottom surfaces (reducing aerodynamic drag), and through the weakening of rearward inclination and enhanced wash flow, it gradually increases the vortex strength at the bottom of the model. In Case 6, the V2 vortex significantly strengthens, and its core moves forward, with the V1 vortex also moving forward. This results in an expanded wake separation zone, increased energy dissipation, and an increase in aerodynamic drag.

Figure 15.
The time-averaged streamline distributions in the symmetry planes.
4. Conclusions
In this paper, we used numerical simulation to investigated the effects of hollow spoilers with different opening areas on the aerodynamic noise of an Ahmed body. Six types of hollow spoilers were designed and the SPL in two zones was investigated. Finally, the flow features around the different spoilers were compared and analyzed to explore the differences in aerodynamic noise. The following main conclusions can be drawn.
(1) The simulation model of an Ahmed body is established, and the computer method is verified using the published research results. Afterward, six hollow spoilers with different opening areas are designed and mounted at the rear of the Ahmed body. Compared with the classic Ahmed model, all six hollow spoilers can effectively reduce the noise, and the effect of noise reduction does not have a linear relationship with the opening area.
(2) The aerodynamic drag of the Ahmed model with a different hollow spoiler is not linear with the increase in the opening area. A comprehensive comparison between the drag and SPL reveals that the effect of the opening area of the hollow spoilers on noise is higher than its effect on aerodynamic drag. Case 4 has the lowest SPL, while its drag is higher than that of the Base model. This suggests that a preferred aerodynamic shape for the hollow spoiler, characterized by smaller drag and lower noise, can be provided by choosing rational structure parameters.
(3) The flow field properties around the wake of the Ahmed model are directly influenced by the spoiler configuration. The main reason for the peak value of SPL at 300Hz is that the airflow along the side surface spills into the car body’s wake. Increasing the opening area of the hollow spoiler will reduce the noise source concentration degree; meanwhile, the eddy characteristics in the wake region will change as well, the scale of vortex will be V1 reduced, vortexes V1 and V2 will move backward, and the spacing will become smaller, thereby restraining the flow separation at the model’s rear.
In the future, parametric model and fluid dynamics analyses of the hollow spoilers could be worth conducting. And with the help of wind tunnel experiments or numerical simulation, the effects of the hollow spoilers on aerodynamic noise can be examined using statistical analysis. An aerodynamic noise prediction method suitable for the aerodynamic configuration optimization of hollow spoilers is a problem worthy of investigation in future work, which will be helpful in exploring some potential drag and noise reduction measures or aerodynamic shape optimization.
Author Contributions
Conceptualization, Z.-P.W.; methodology, Z.-P.W. and W.Z.; software, H.-R.L.; validation, W.Z. and H.-R.L.; formal analysis, W.Z.; investigation, H.-C.Z. and W.Z.; resources, Z.-P.W. and H.-R.L.; data curation, Z.-P.W.; writing—original draft, Z.-P.W., W.Z. and H.-R.L.; writing—review and editing, H.-C.Z.; funding acquisition, H.-C.Z. All authors have read and agreed to the published version of the manuscript.
Funding
This research was funded by the National Natural Science Foundation of China, grant numbers 52072156 and 52272366; and the Postdoctoral Foundation of China, grant number 2020M682269.
Institutional Review Board Statement
Not applicable.
Informed Consent Statement
Not applicable.
Data Availability Statement
The raw data supporting the conclusions of this article will be made available by the authors on request.
Acknowledgments
The authors gratefully acknowledge the support provided by the funds.
Conflicts of Interest
Author Zhi-Ping Wang was employed by the company Aeolus Tyre Co., Ltd. The remaining authors declare that the research was conducted in the absence of any commercial or financial relationships that could be construed as a potential conflict of interest.
References
- Zaareer, M.; Mourad, A.H. Effect of vehicle side mirror base position on aerodynamic forces and acoustics. Alex. Eng. J. 2022, 61, 1437–1448. [Google Scholar] [CrossRef]
- Zin, M.Z.M.; Rahman, W.M.W.W.A. Simulation the effect of spoiler on aerodynamic for sedan car. J. Automot. Powertrain Transp. Technol. 2022, 2, 1–8. [Google Scholar] [CrossRef]
- Liu, W.; Zeng, S.; Chen, X. Design and Experiment of Adaptive Profiling Header Based on Multi-Body Dynamics–Discrete Element Method Coupling. Agriculture 2024, 14, 105. [Google Scholar] [CrossRef]
- Ding, Z.; Tang, Z.; Zhang, B.; Ding, Z. Vibration Response of Metal Plate and Shell Structure under Multi-Source Excitation with Welding and Bolt Connection. Agriculture 2024, 14, 816. [Google Scholar] [CrossRef]
- Yu, Z.; Li, Y.; Du, X.; Liu, Y. Threshing cylinder unbalance detection using a signal extraction method based on parameter-adaptive variational mode decomposition. Biosyst. Eng. 2024, 244, 26–41. [Google Scholar] [CrossRef]
- Sun, J.; Wang, Z.; Ding, S.; Xia, J.; Xing, G. Adaptive disturbance observer-based fixed time nonsingular terminal sliding mode control for path-tracking of unmanned agricultural tractors. Biosyst. Eng. 2024, 246, 96–109. [Google Scholar]
- Nusser, K.; Becker, S. Numerical investigation of the fluid structure acoustics interaction on a simplified car model. Acta Acust. 2021, 5, 22. [Google Scholar] [CrossRef]
- Xu, L.; Chai, X.; Gao, Z.; Li, Y.; Wang, Y. Experimental study on driver seat vibration characteristics of crawler-type combine harvester. Int. J. Agric. Biol. Eng. 2019, 12, 90–97. [Google Scholar] [CrossRef]
- Zhu, Z.; Yang, Y.; Wang, D.; Cai, Y.; Lai, L. Energy Saving Performance of Agricultural Tractor Equipped with Mechanic-Electronic-Hydraulic Powertrain System. Agriculture 2022, 12, 436. [Google Scholar] [CrossRef]
- Zhu, Z.; Zeng, L.; Cheng, L.; Zou, R.; Cai, Y. Fuzzy Adaptive Energy Management Strategy for a Hybrid Agricultural Tractor Equipped with HMCVT. Agriculture 2022, 12, 1986. [Google Scholar] [CrossRef]
- Cui, B.; Cui, X.; Wei, X.; Zhu, Y.; Ma, Z.; Zhao, Y.; Liu, Y. Design and Testing of a Tractor Automatic Navigation System Based on Dynamic Path Search and a Fuzzy Stanley Model. Agriculture 2024, 14, 2136. [Google Scholar] [CrossRef]
- Chode, K.K.; Viswanathan, H.; Chow, K.; Reese, H. Investigating the aerodynamic drag and noise characteristics of a standard square back vehicle with inclined side-view mirror configurations using a hybrid computational aeroacoustics (CAA) approach. Phys. Fluids 2023, 35, 075148. [Google Scholar] [CrossRef]
- Schell, A.; Cotoni, V. Prediction of interior noise in a sedan due to exterior flow. SAE Int. J. Passeng. Cars-Mech. Syst. 2015, 8, 1090–1096. [Google Scholar] [CrossRef]
- Cerrato, G. Automotive sound quality–powertrain, road and wind noise. Sound Vib. 2009, 43, 16–24. [Google Scholar]
- Zaareer, M.N.; Mourad, A.H.I.; Darabseh, T.; Abdullah, K.; ElSayed, M.S. Aeroacoustics wind noise optimization for vehicle’s side mirror base. Int. J. Thermofluids 2023, 18, 100332. [Google Scholar] [CrossRef]
- Ye, J.; Xu, M.; Xing, P.; Cheng, Y.; Meng, D.; Tang, Y.; Zhu, M. Investigation of aerodynamic noise reduction of exterior side view mirror based on bionic shark fin structure. Appl. Acoust. 2021, 182, 108188. [Google Scholar] [CrossRef]
- Jiao, D.Q.; Zhou, H.C.; Huang, T.H.; Zhang, W. Numerical Study on Aerodynamic Noise Reduction in Passenger Car with Fender Shape Optimization. Symmetry 2024, 16, 651. [Google Scholar] [CrossRef]
- Lu, E.; Ma, Z.; Li, Y.; Xu, L.; Tang, Z. Adaptive backstepping control of tracked robot running trajectory based on real-time slip parameter estimation. Int. J. Agric. Biol. Eng. 2020, 13, 178–187. [Google Scholar] [CrossRef]
- Chen, Y.X.; Chen, L.; Huang, C.; Liu, Y.; Wang, C. A dynamic tire model based on HPSO-SVM. Int. J. Agric. Biol. Eng. 2019, 12, 36–41. [Google Scholar] [CrossRef]
- Chen, Y.X.; Chen, L.; Wang, R.C.; Xu, X.; Shen, Y.J.; Liu, Y.L. Modeling and test on height adjustment system of electrically-controlled air suspension for agricultural vehicles. Int. J. Agric. Biol. Eng. 2016, 9, 40–47. [Google Scholar]
- Liu, H.; Yan, S.C.; Shen, Y.; Li, C.H.; Zhang, Y.F.; Hussain, F. Model predictive control system based on direct yaw moment control for 4WID self-steering agriculture vehicle. Int. J. Agric. Biol. Eng. 2021, 14, 175–181. [Google Scholar] [CrossRef]
- Yin, T.S.; Taib, I.; Husaini, M.H.; Ibrahim, W.M.N.W.; Saad, M.A.C.; Basar, N.; Halif, M.H. Modelling of the effect of rear spoiler angle on the aerodynamics of passenger car. J. Adv. Fluid Heat Mater. Eng. 2025, 4, 36–45. [Google Scholar]
- Cheng, S.Y.; Mansor, S. Influence of rear-roof spoiler on the aerodynamic performance of hatchback vehicle. MATEC Web Conf. 2017, 90, 9. [Google Scholar] [CrossRef]
- Wu, B. CFD study of submersible mixers in anaerobic digesters. Trans. ASABE 2017, 60, 275–282. [Google Scholar] [CrossRef]
- Liang, Z.W.; Xu, L.Z.; De Baerdemaeker, J.; Li, Y.M.; Saeys, W. Optimisation of a multi-duct cleaning device for rice combine harvesters utilising CFD and experiments. Biosyst. Eng. 2020, 190, 25–40. [Google Scholar] [CrossRef]
- Hu, Y.; Chen, Y.; Wei, W.; Hu, Z.; Li, P. Optimization design of spray cooling fan based on CFD simulation and field experiment for horticultural crops. Agriculture 2021, 11, 18. [Google Scholar] [CrossRef]
- Ni, J.H.; Dong, J.T.; Ullah, I.; Mao, H.P. CFD simulation of sucrose flow field in the stem of greenhouse tomato seedling. Int. J. Agric. Biol. Eng. 2022, 15, 111–115. [Google Scholar] [CrossRef]
- Liu, J.P.; Hussain, Z.; Wang, X.J.; Li, Y.F. Optimization and numerical simulation of the internal flow field of water-pesticide integrated microsprinklers. Irrig. Drain. 2023, 72, 328–342. [Google Scholar] [CrossRef]
- Hussain, S.; Hu, J.J.; Chen, Y.; Ali, A.; Song, H.Y.; Zheng, D.C.; Farid, M.U.; Ghafoor, A.; Ahmed, M. CFD study of self-cleaning system of multi-stage tangential roller threshing unit for precise buckwheat breeding. Heliyon 2024, 10, e27180. [Google Scholar] [CrossRef]
- Zuo, H.H. Study on the aerodynamic performance of a hollow spoiler for a pure electric SUV. Shanghai Auto 2022, 9. [Google Scholar]
- Zhou, H.C.; Zhang, W.; Huang, T.H.; Li, H.R. Numerical analysis of the aerodynamic performance of an ahmed body fitted with spoilers of different opening areas. Fluid Dyn. Mater. Process. 2025, 21, 1113. [Google Scholar] [CrossRef]
- Zhang, F.; Zhang, R.; Luo, Q.; Zhang, Y.; Li, B.; Guo, H. Research on the aerodynamic noise mechanism and noise reduction of SUV roof hollow spoiler. J. Mech. Eng. 2024, 60, 398–408. [Google Scholar]
- Zhang, Y.D.; Zhang, J.Y.; Li, T.; Zhang, L. Investigation of the aeroacoustic behavior and aerodynamic noise of a high-speed train pantograph. Sci. China Technol. Sci. 2017, 60, 561–575. [Google Scholar] [CrossRef]
- Li, T.; Qin, D.; Kan, X.; Zhang, J.Y. Study on aerodynamic drag and noise reduction of high-speed pantograph with streamwise holes. Eng. Appl. Comput. Fluid Mech. 2025, 19, 12–22. [Google Scholar] [CrossRef]
- Abid, A. Aerodynamic Phenomena of Controlling Passive Flow of a Time-Independent Ground Vehicle Under the Scope of Optimally Slanted Rear Wing-Spoiler Combination. Eng. Rep. 2025, 7, e13123. [Google Scholar] [CrossRef]
- Mintao, D.; Jun, S.; Bin, Y. Simulation and optimization of spoiler wind noise based on wavenumber-frequency analysis. Acta Aerodyn. Sin. 2024, 42, 69–76. [Google Scholar]
- Yudianto, A. Application of multi-objective adjoint-based aerodynamic optimisation on generic road vehicle with rear spoiler. Automot. Exp. 2024, 7, 28–47. [Google Scholar] [CrossRef]
- Zhou, H.C.; Qin, R.Z.; Zheng, Z. Comparative analysis of the aerodynamic behavior on Ahmed body mounted with different wheel configurations. Proc. Inst. Mech. Eng. Part D J. Automob. Eng. 2024, 238, 128–146. [Google Scholar] [CrossRef]
- Siddiqui, N.A.; Chaab, M.A. A simple passive device for the drag reduction of an ahmed body. J. Appl. Fluid Mech. 2020, 14, 147–164. [Google Scholar]
- Liu, K.; Zhang, B.F.; Zhang, Y.C.; Zhou, Y. Flow structure around a low-drag Ahmed body. J. Fluid Mech. 2021, 913, A21. [Google Scholar] [CrossRef]
- Jiang, Y.; Li, H.; Hua, L.; Zhang, D.M. Three-dimensional flow breakup characteristics of a circular jet with different nozzle geometries. Biosyst. Eng. 2020, 193, 216–231. [Google Scholar] [CrossRef]
- Jiang, Y.; Li, H.; Xiang, Q.J.; Chen, C. Comparison of PIV experiment and numerical simulation on the velocity distribution of intermediate pressure jets with different nozzle parameters. Irrig. Drain. 2017, 66, 510–519. [Google Scholar] [CrossRef]
- Zhang, Z.Q.; Chen, J.; Li, Y.M.; Guan, Z.H.; Liao, C.Q.; Qiao, X.S. Design and experiment on the air-blowing and vibrating supply seed tray for precision seeder. Int. J. Agric. Biol. Eng. 2022, 15, 115–121. [Google Scholar] [CrossRef]
- Yu, J.X.; Zhangzhong, L.L.; Lan, R.P.; Zhang, X.; Xu, L.L.; Li, J.J. Ensemble learning simulation method for hydraulic characteristic parameters of emitters driven by limited data. Agronomy 2023, 13, 21. [Google Scholar] [CrossRef]
- Meile, W.; Brenn, G.; Reppenhagen, A. Experiments and numerical simulations on the aerodynamics of the Ahmed body. CFD Lett. 2011, 3, 32–39. [Google Scholar]
- Shahin, I.; Alqaradawi, M.; Gadala, M.; Badr, O. On the aero acoustic and internal flows structure in a centrifugal compressor with hub side cavity operating at off design condition. Aerosp. Sci. Technol. 2017, 60, 68–83. [Google Scholar] [CrossRef]
- Guo, J.; Tan, X.M.; Yang, Z.G.; Xue, Y.Q.; Shen, Y.N.; Wang, H.W. Aeroacoustic optimization design of the middle and upper part of pantograph. Appl. Sci. 2022, 12, 11. [Google Scholar] [CrossRef]
- Zhang, Z.; Lu, Y.Z.; Yang, M.Y.; Wang, G.Q.; Zhao, Y.Q.; Hu, Y.G. Optimal training strategy for high-performance detection model of multi-cultivar tea shoots based on deep learning methods. Sci. Hortic. 2024, 328, 112949. [Google Scholar] [CrossRef]
- Wang, J.; Chen, R. An improved finite element model for the hydraulic analysis of drip irrigation subunits considering local emitter head loss. Irrig. Sci. 2024, 38, 147–162. [Google Scholar] [CrossRef]
Disclaimer/Publisher’s Note: The statements, opinions and data contained in all publications are solely those of the individual author(s) and contributor(s) and not of MDPI and/or the editor(s). MDPI and/or the editor(s) disclaim responsibility for any injury to people or property resulting from any ideas, methods, instructions or products referred to in the content. |
© 2025 by the authors. Licensee MDPI, Basel, Switzerland. This article is an open access article distributed under the terms and conditions of the Creative Commons Attribution (CC BY) license (https://creativecommons.org/licenses/by/4.0/).