Article

Research on BBHL Model Based on Hybrid Loss Optimization for Fake News Detection

1
School of Intelligent Science and Engineering, Qinghai Minzu University, Xining 810007, China
2
School of Cyber Science and Engineering, Qinghai Minzu University, Xining 810007, China
3
Joint Laboratory for Cyberspace Security, Qinghai Minzu University, Xining 810007, China
4
College of Computer Science and Technology, Qinghai Normal University, Xining 810016, China
*
Author to whom correspondence should be addressed.
Appl. Sci. 2025, 15(18), 10028; https://doi.org/10.3390/app151810028
Submission received: 22 August 2025 / Revised: 10 September 2025 / Accepted: 11 September 2025 / Published: 13 September 2025
(This article belongs to the Special Issue Natural Language Processing in the Era of Artificial Intelligence)

Abstract

With the rapid development of social media, the spread of fake news has become a significant issue affecting social stability. To address the problems of incomplete feature extraction and simplistic loss function design in traditional fake news detection, this paper proposes a BBHL model based on hybrid loss optimization. The model achieves deep extraction of text features by integrating BERT, Bi-LSTM, and attention mechanisms, and innovatively fuses binary cross-entropy (BCE) loss with contrastive loss to enhance feature discriminability and the model’s generalization ability. Experiments on the Weibo, Twitter, and Pheme datasets demonstrate that the BBHL model significantly outperforms baseline models such as EANN and MCNN in metrics including accuracy and F1-score. Ablation experiments verify the effectiveness of contrastive loss, providing a robust and generalizable solution for fake news detection.

1. Introduction

With the in-depth popularity of social media, platforms such as WeChat, Twitter, Weibo, and Facebook have become the primary channels for the public to access information, with the daily generated information growing exponentially [1]. Against this backdrop of information explosion, fake news spreads rapidly through algorithmic recommendation and social communication mechanisms, posing a severe threat to social stability, public cognition, and even political and economic order. For example, during the 2024 U.S. presidential election, maliciously fabricated information supporting candidates from both parties spread through platforms like Facebook, with a single piece of fake news being shared over 37 million times, directly interfering with voters’ judgment [2]. In sudden public health incidents, the spread of false epidemic prevention information may trigger secondary crises such as panic buying and the squeeze on medical resources. Faced with massive amounts of information, manual verification is not only costly but also unable to cope with the real-time dissemination characteristics of fake news. Therefore, developing efficient and robust automatic detection technologies has become an urgent task.
Early fake news detection methods were centered on traditional machine learning, relying on techniques such as Bag-of-Words (BOW) and TF-IDF to extract text features, and combining classifiers like SVM and Naive Bayes for detection [3,4]. However, such methods have significant limitations: on the one hand, they treat text as a collection of isolated words, ignoring word order and contextual semantic associations, which makes it impossible to capture linguistic phenomena such as “polysemy” and “synonymy” [5]; on the other hand, feature engineering is highly dependent on manual experience, resulting in weak capability in handling complex expressions such as metaphors and irony. With the development of deep learning technologies, models such as CNN and RNN have gradually replaced traditional methods. CNN captures local text features through multi-scale convolution kernels [6], while the C-GRU model combines convolutional layers with GRU networks to simultaneously mine local window features and temporal dependencies of text [7]. Although these methods show advantages in unimodal tasks, their limitations have become increasingly prominent when dealing with the multimodal characteristics of modern fake news (the integration of text, images, videos, and social interaction data). For example, a fake news piece accompanied by a forged on-site picture can easily be misjudged as real through text analysis alone [8].
Multimodal fake news detection, which compensates for the defects of unimodal approaches by fusing cross-modal information, has become a research hotspot. Existing multimodal methods can be categorized into three types: The first type, represented by MVAE, learns shared latent representations of text and images through variational autoencoders, but its fusion method only relies on simple concatenation and fails to explore deep semantic associations [9]; The second type, such as the TDEDA model, extracts visual object features using ResNet, combines them with text representations from BERT, and enhances cross-modal alignment through a dual-attention mechanism. However, it over-relies on the generalization ability of pre-trained models and performs poorly in specific domains [10]; The third type introduces external knowledge. For instance, the FKGFND framework constructs a triple knowledge graph of <embedded text, characters, background knowledge> to supplement hidden information in images, but the construction cost of the knowledge graph is high, making it difficult to adapt to dynamically changing news content [11]. In addition, the loss function design of existing models generally suffers from a problem of singularity. Most adopt binary BCE loss, which only focuses on the correctness of sample classification and ignores the constraints of feature aggregation for samples of the same class and feature separation for samples of different classes, resulting in insufficient generalization ability of the models for new types of fake news [12,13].
To address the aforementioned issues, this paper proposes a BBHL fake news detection model based on hybrid loss optimization, whose core design includes three aspects:
(1)
The feature extraction module integrates BERT, Bi-LSTM, and an attention mechanism. BERT is responsible for capturing deep semantics, Bi-LSTM models temporal dependencies, and the attention mechanism focuses on key information, enabling multi-level extraction of text features [14];
(2)
The hybrid loss function innovatively fuses BCE loss and contrastive loss through weighted summation. The former ensures classification accuracy, while the latter enhances feature discriminability by narrowing the feature distance between samples of the same class and widening that between samples of different classes;
(3)
The model architecture has modal scalability, allowing flexible integration of feature extractors for images, videos, etc., to adapt to multi-scenario requirements. The main contributions of this paper are as follows:
  • The proposed BBHL model is a general framework for fake news detection. The feature extraction part can be easily replaced by different models specifically designed for feature extraction, thereby adapting to diverse task requirements and data modalities, and achieving continuous optimization of model performance and scenario generalization.
  • In the model optimization part, contrastive loss is innovatively used as an auxiliary component, which is weighted and summed with the main BCE loss to jointly solve the problem of model training optimization and improve the generalization ability of the model.
  • Experiments demonstrate that the proposed BBHL model can effectively identify fake news and perform well when tested on multiple large-scale real-world datasets.
The subsequent structure of this paper is organized as follows: Section 2 provides a review of existing studies relevant to fake news detection, focusing on core research directions and technical approaches in this field. Section 3 elaborates on the detailed implementation of the proposed BBHL model framework, including the design principles and operational mechanisms of each key module. Section 4 outlines the experimental foundations, covering the source and characteristics of the datasets used, the selection and adaptation of baseline models, the specific configuration of model training parameters, and the evaluation metrics employed to assess performance. Section 5 presents and analyzes the experimental outcomes, encompassing comparative results between the BBHL model and baseline models, ablation experiments verifying the effectiveness of key components (e.g., contrastive loss), and supplementary analyses such as convergence and parameter sensitivity.

2. Related Work

In this section, we briefly review the work related to the proposed model. We focus primarily on two themes: fake news detection methods and the application of hybrid loss functions in fake news detection.

2.1. Fake News Detection Methods

The core of multimodal fake news detection lies in the effective fusion of multi-dimensional information such as text, images, and social propagation, and its performance depends on the comprehensiveness of feature extraction and the depth of exploring cross-modal associations. In recent years, researchers have carried out explorations from two aspects: intra-modal feature enhancement and cross-modal fusion strategies, forming a variety of technical routes.
In terms of text feature extraction, pre-trained language models have become the mainstream choice. BERT, with its bidirectional Transformer architecture and masked language model (MLM) task, can capture context-dependent deep semantics and has been widely used in fake news detection [15]. For example, the MCNN model uses BERT to process text and combines BiGRU to mine temporal information, achieving an accuracy of 87.12% on the Weibo dataset [16]; while the SAFE model extracts text features through BERT, calculates the cosine similarity with visual features, and identifies samples with low similarity as fake news [17]. In addition to BERT, Text-CNN is good at capturing local n-gram features, and BiLSTM performs better in temporal modeling of long texts [18].
Visual feature extraction focuses on the semantic content and tampering traces of images. For semantic feature extraction, pre-trained models such as ResNet and VGG-19 are commonly adopted. ResNet alleviates the gradient vanishing problem in deep networks through residual connections, achieving higher accuracy in image classification tasks [19]; VGG-19, due to its simple structure, is widely used for feature dimension unification (e.g., aligning the dimensions of image features and text features) [20]. Tampering feature extraction targets forged images (such as PS synthesis and splicing). The MCNN model introduces the ELA (Error Level Analysis) algorithm to identify tampered regions by detecting inconsistencies in image compression noise [16]; the MVACLNet model enhances the model’s robustness to tampering features through virtual sample augmentation (e.g., randomly occluding image regions) [5].
Cross-modal fusion strategies are crucial for multimodal detection, and existing methods can be categorized into three types:
(1)
Attention mechanism: Highlighting important associations by dynamically assigning weights. For example, the TDEDA model designs text-visual bidirectional attention, where text features guide visual features to focus on key regions (such as facial expressions of people in news), and visual features feedback to text features to enhance scene description [10];
(2)
Knowledge graph assistance: Introducing external knowledge to compensate for the lack of modal information. For instance, the ERIC-FND model links Wikipedia entities, fusing entities like “celebrities” and “institutions” in news with background knowledge to improve semantic understanding [21];
(3)
Contrastive learning: Enhancing fusion effects by aligning cross-modal feature spaces. For example, the BMR method adopts multi-view contrastive learning, forcing the feature representations of text, image patterns, and image semantics to converge in a shared space [22].
Despite advancements in multimodal methods, there remain three limitations: first, the problem of modal imbalance, where most models over-rely on text features and exhibit weak capability in processing low-quality images [23]; second, insufficient dynamic adaptability, as the feature distribution of pre-trained models tends to shift when confronted with emerging events [24]; third, underutilization of propagation features, where the credibility signals contained in users’ social behaviors such as forwarding and commenting have not been fully explored [25].
Compared with Contrast-BERT [26], the BBHL model proposed in this paper does not focus on biomedical relation extraction tasks and use contrastive learning to improve the text representation of BERT. Instead, it is targeted at the fake news detection task. Unlike GAMC [8], BBHL is not an unsupervised fake news detection method. It does not rely on graph autoencoders and masking operations, nor does it use news propagation context to construct self-supervised signals. Instead, it adopts a supervised learning paradigm and fuses binary cross-entropy (BCE) loss with contrastive loss to enhance the model’s discriminative ability and generalization performance for fake news text features. Compared with MIGCL [27], BBHL is not dedicated to multimodal fake news detection, and does not explore inter-modal relationships through cross-modal alignment between images and text or hierarchical graph contrastive learning. Instead, it focuses on the text unimodal fake news detection task and mines key semantic features from text data to judge the authenticity of news.
Overall, the text feature extraction architecture and hybrid loss function design adopted in this paper demonstrate different ideas and advantages compared with the aforementioned models in the text unimodal fake news detection task.

2.2. Application of Hybrid Loss Functions in Fake News Detection

The loss function is the “baton” of model training, and its design directly affects the direction of feature learning. Traditional fake news detection mostly adopts a single loss function, which is difficult to cope with complex scenarios. Therefore, hybrid loss functions have become a research hotspot in recent years.
BCE loss is widely used in binary classification tasks due to its simplicity in implementation, but it has significant drawbacks: it only focuses on the difference between the predicted probability of a single sample and the true label, ignoring the relative relationships between samples. For example, in data imbalance scenarios (where fake news accounts for <20%), BCE loss will make the model biased towards the majority class (real news), leading to a sharp drop in the recall rate of fake news. To solve this problem, researchers have introduced contrastive loss to enhance discriminability by constraining the distance between samples in the feature space. InfoNCE loss is a commonly used variant of contrastive loss, which enables the model to learn more robust features by narrowing the distance between positive sample pairs (of the same class) and widening the distance between negative sample pairs (of different classes). The TTEC framework weighted fuses BCE loss with InfoNCE loss, increasing the F1-score by 5.2% on multimodal data [12]. In addition to contrastive loss, researchers have explored various hybrid loss strategies:
(1)
KL divergence constraint: The MVACLNet model uses KL divergence to limit the distribution difference between virtual samples and real samples in virtual augmented contrastive learning, improving the model’s resistance to adversarial attacks by 20% [5];
(2)
Reconstruction loss: The GAMC model combines the reconstruction loss of a graph autoencoder with contrastive loss to achieve unsupervised fake news detection, outperforming traditional unsupervised methods by 4.49% in accuracy on the PolitiFact dataset [8];
(3)
Evidential theory loss: The MDF-FND model designs a dynamic fusion loss based on Dempster-Shafer evidential theory, adaptively adjusting weights according to modal quality (e.g., text clarity, image resolution), and outperforming fixed-weight fusion on noisy data [28].
Although existing hybrid loss methods provide ideas for fake news detection, they still have two limitations: first, the lack of targeting in sample selection. When TTEC [12] weighted and fused BCE with InfoNCE, positive and negative samples were randomly selected from the current training batch, which easily introduced noise and weakened the effect of contrastive learning; second, loss fusion was mostly mechanical superposition. For example, although SupCon [29] optimized contrastive loss using label supervision signals, it did not design a collaborative logic combined with the semantic characteristics of fake news text, and the weight ratio lacked experimental verification, making it difficult to adapt to text unimodal detection tasks.
The hybrid loss design of the BBHL model in this paper specifically addresses the above issues: in terms of sample selection, it abandons random sampling and adopts Locality-Sensitive Hashing (LSH) to select the top-5 highly similar positive samples and top-5 lowly similar negative samples to the input sample from the entire training set. Cosine similarity ranking is used to ensure sample relevance and reduce noise interference; in terms of loss collaboration, instead of blind weighting, it is based on the characteristics of the fake news detection task, and a loss weight ratio more suitable for fake news detection is obtained through experiments, rather than arbitrary weighting.
In summary, multimodal feature fusion and hybrid loss optimization have become the two core technical paths for fake news detection. However, existing methods still have room for improvement in mining deep cross-modal associations and dynamic loss adjustment. The BBHL model proposed in this paper is an attempt to address these issues.

3. Methodology

In this section, we first introduce the three components of the proposed BBHL model: the text feature extractor, the BCE loss module, and the contrastive loss module. Then, we elaborate on the specific experimental details of each component.

3.1. Problem Statment

In this paper, our ultimate goal is to detect fake news on social media platforms. Specifically, we input text T into the model, which then makes predictions on the text to output an authenticity label y   ϵ   { 0,1 } , where y = 0 indicates real news and y = 1 Indicates fake news.

3.2. Model Overview

The goal of our model is to accurately extract text features and optimize the loss function, thereby improving performance in text-based fake news detection. As shown in Figure 1, the model mainly integrates three core components: a text feature extractor, a BCE loss module, and a contrastive loss module. Firstly, with raw text (Text), a stopword file (Stop_words.txt, used to filter meaningless words), and a feature description file (features.json, assisting in regulating text features) as inputs, text preprocessing and batch loading are completed through “creating a data loader”. Subsequently, the text flows into the main body of the model: first, the BERT model mines the semantic associations of the text to generate initial features; then, the BiLSTM layer learns the contextual sequence information of the text to enrich the feature dimensions; finally, in the Attention layer, the attention scores of each time step are calculated by means of a linear layer, converted into weights via softmax, and combined with the output of BiLSTM to obtain a sentence-level text feature vector that can focus on key information.
After obtaining the text features, the process proceeds to the loss calculation stage. On one hand, the text features are input into the BCE loss module, where a classifier maps them to predicted probabilities. The BCE Loss module then calculates the BCE loss based on these probabilities to measure the error between the classification results and the true labels. On the other hand, the features flow into the contrastive loss module, which uses Locality-Sensitive Hashing (LSH) to quickly retrieve similar samples. InfoNCE loss is computed based on these similar samples to enhance feature discriminability, making similar text features more aggregated and dissimilar ones more dispersed. Finally, the BCE loss and InfoNCE loss are weighted and summed to obtain the total loss. Through backpropagation, the model is guided to optimize, enabling simultaneous improvement in text feature extraction and classification performance, thus adapting to text analysis scenarios such as fake news detection.

3.3. Text Preprocessing

To ensure that the input data is compatible with the text feature extraction process of the BBHL model and lay a foundation for subsequent hybrid loss optimization, this study designs a targeted text preprocessing workflow, which mainly includes the following steps:
First, we conduct dataset parsing and valid sample screening. The raw data is parsed in a structured manner to extract the core data pairs of “news text” and “authenticity label”. During this process, invalid samples with garbled characters, empty text, or missing labels are filtered out to avoid interfering with model training.
Next, text normalization and encoding are carried out. The screened text is input into a pre-trained BERT Tokenizer (bert-base-chinese for Chinese text, and bert-base-uncased for English text) for standardization. The specific operations include: adding special tokens ([CLS] at the start of the text and [SEP] at the end) to clarify text boundaries; adopting a dynamic padding/truncation strategy to unify the text length to 128 (verified through pre-experiments to balance semantic retention and computational efficiency); and then generating two types of outputs, namely input_ids: (text encoding) and attention mask: (used to distinguish real samples from padded samples). The encoded data is converted into tensor format, which can be directly input to the subsequent text feature extraction module.

3.4. Text Feature Extractor

To extract text features, we use a pre-trained and widely adopted language representation model, namely BERT. This series of models consists of 12 layers of Transformer encoders with a hidden layer dimension of 768, which can capture deep-level textual associations through its pre-trained bidirectional semantic modeling capability. This model can be directly used for extracting text features. The input to the text encoder is a fixed-length word sequence, denoted as W = [ w 1 , w 2 , , w n ] , where n represents the corresponding length of the word sequence, and w i denotes the token of the i -th word. The word sequence W is then fed into a pre-trained BERT model and encoded. Equation (1) is as follows:
e i w = B E R T w i , m a s k i       ( i = 1,2 , , n )
where w denotes the dimension of word embedding, e i w R 768 is the BERT embedding vector of the i -th word with a hidden layer dimension of 768, and m a s k i is the attention mask used to distinguish real words from padding words. The final output is E w = [ e 1 w , e 2 w , , e n w ]   ϵ   R n × 768 . After obtaining word vectors through the BERT model, they are then fed into the BiLSTM model. The BiLSTM module adopts a 1-layer network structure. Its input dimension is consistent with the word embedding dimension of the BERT output, and the hidden layer dimension of the unidirectional LSTM is 256. Owing to the adoption of a bidirectional processing mechanism, the output vectors of the forward and backward LSTMs are concatenated, leading to a final output dimension of 512. with the formula as follows:
h i = L S T M f o r w a r d ( e i w , h i 1 )
h i = L S T M b a c k w a r d ( e i w , h i + 1 )
h i = [ h i ; h i ] R 512
where L S T M f o r w a r d and L S T M b a c k w a r d represent the forward and backward LSTM units, respectively. Next, the attention scores are calculated as follows:
a i = L i n e a r h i = W a h i + b a ( i = 1,2 , , n )
where W a and b a are parameters of the linear layer, and a i R is the attention score of the i -th word. Subsequently, the attention weights are calculated as follows:
α i = e x p ( a i ) j = 1 n e x p ( a j )
where α i is the attention weight of the i -th word, satisfying i = 1 n α i = 1 . Finally, the sentence representation is obtained by weighted summation of the BiLSTM output and the attention weights:
s = i = 1 n α i h i R 512
where s is the vector representation of the entire sentence, obtained by weighted summation of the BiLSTM outputs using attention weights.

3.5. BCE Loss Module

In the text feature extractor module, the vector representation s of the sentence is obtained. Then, a fully connected layer with a sigmoid activation function is applied for binary classification, mapping the sentence vector to a probability value to obtain the predicted value. The BCE loss formula used is as follows:
L d = 1 N i = 1 N [ y i log y i ^ + ( 1 y i ) log 1 y i ^ ]
where N is the number of samples, y i is the true label of the i -th sample, and y i ^ is the predicted probability of the i -th sample.

3.6. Contrastive Loss Module

BCE loss only focuses on the correctness of individual sample classification results and does not impose constraints on the relative distribution of samples in the feature space. This makes it difficult for the model to capture the essential differences between true and fake news at the feature level; if the number of true and fake samples is imbalanced, the model tends to favor the majority class, affecting detection performance.
The contrastive learning mechanism, on the other hand, aims to cluster features of the same class and separate those of different classes in the feature space. Through this strategy, the model can learn more discriminative feature representations, enhance generalization ability, and reduce the risk of overfitting. In the proposed scheme, Locality-Sensitive Hashing (LSH) is used to select the k most similar positive samples and k least similar negative samples from the training set and input samples. Combined with the InfoNCE loss function, the model is guided to optimize features: increasing similarity among positive samples and decreasing similarity among negative samples. The specific steps are as follows:
In the data preparation phase, contrastive learning is only applied in the model training process. The input data comes from the training set samples processed by the text feature extraction module, using the first training data instead of real-time selected data. Specifically, throughout the training process, the data required for contrastive learning is fixed as the sample set from the first training, rather than being re-selected from the training set according to the input samples of the current batch in each training iteration. This method can provide stable and consistent basic data for the construction of positive and negative samples, enabling the model to learn based on a fixed initial data distribution during the training process and ensuring the stability and repeatability of training.
Hash Function Construction Stage. To achieve efficient retrieval of similar samples, random projection hashing is adopted as the core hash function in this stage. By projecting high-dimensional features into a low-dimensional hash space through random projection, this function can not only preserve the similarity structure between samples but also has the advantages of being suitable for high-dimensional text features and high computational efficiency. Compared with other hash functions, it is more compatible with text data processing and large-scale training requirements. The specific implementation process is as follows: First, 10 independent hash tables are initialized, and each hash table corresponds to a random projection matrix with dimensions [8, 512] (where 8 is the length of the hash code and 512 is consistent with the dimension of the sentence vector output by the text feature extractor) and elements following a standard normal distribution. Then, for the 512-dimensional text feature vectors in the training set that have undergone text feature extraction processing, 8-dimensional projection vectors are obtained by multiplying with the projection matrix. Hash codes are generated through sign quantization and binary-to-decimal conversion operations, ultimately completing the construction of the hash index.
Meanwhile, the learning process of this LSH hash function features fixed parameters: the random projection matrix is generated once during the model initialization stage and does not participate in backpropagation updates during training. The rationality of this design lies in the fact that the core function of LSH is to quickly retrieve similar samples rather than learn feature mapping relationships. Fixing the projection parameters can avoid the interference of hash function instability on retrieval results, and at the same time, it eliminates the need for optimizing hash parameters, effectively reducing the complexity of model training.
Positive and Negative Sample Selection Stage. Based on the aforementioned hash index and the prepared training set data, the selection of positive and negative samples follows a clear process: First, all samples in the training set are traversed, and the training set samples are divided into a positive candidate set and a negative candidate set according to the consistency between the sample labels and the label of the current input sample. Subsequently, cosine similarity is used to calculate the similarity between the input sample and candidate samples. The positive candidate set is sorted in descending order of cosine similarity, and the top k = 5 samples with the highest similarity are selected as the final positive samples; for the negative candidate set, the reciprocal of similarity is calculated, the set is sorted in descending order of this value, and the top k = 5 samples with the lowest similarity are selected as the final negative samples, providing accurate sample pairs for the calculation of contrastive loss. The formula is as follows:
L s = 1 2 k ( S p ϵ S p x log e x p ( s i m ( x , s p ) / T ) e x p ( s i m ( x , s p ) / T ) + S n ϵ S n x e x p ( s i m ( x , s n ) / T ) )
Herein, S p x represents the set of k positive samples, and S n x denotes the set of k negative samples, where s p and s n refer to positive and negative samples, respectively; s i m ( x , s p ) measures the similarity between the input sample x and the positive sample, and T is the temperature parameter. Finally, the total loss is obtained by weighted fusion of the BCE loss L d and the contrastive loss L s . The formula for the total loss is as follows:
L = α L d + β L s
In the formula, α and β are the weight coefficients of BCE loss and contrastive loss, which optimize the model training objective by balancing their contributions.

4. Materials and Methods

In this section, we first introduce the datasets used in the experiments, followed by an introduction to the benchmark models for fake news detection, and then present the model parameters and evaluation metrics.

4.1. Datasets

To verify the model performance, this experiment employs three public datasets, namely Weibo, Twitter, and Fakeddit, as the experimental data. As presented in Table 1, the three datasets encompass text from different social platforms, including the counts of rumorous and non-rumorous samples. Particularly, the Fakeddit dataset has a sufficient sample size, which enables a comprehensive verification of the model’s reliability in the fake news detection task.
Weibo dataset [30]. This dataset is derived from the Chinese corpus of Sina Weibo’s Misinformation Reporting Platform. The classification of rumorous and non-rumorous information is determined from four dimensions: the authenticity of information, the purpose and nature of publication, the labeling of information sources, and the professionalism of domain-specific information. Specifically, fake information, maliciously misleading content, the spread of harmful information, and untrue professional information are categorized as rumors; in contrast, information that is authentic, compliant with laws and regulations, and in line with public order and good customs is classified as non-rumors. The dataset includes the original content of Weibo posts as well as repost and comment information. For this experiment, focus is placed on the original Weibo text, and only the original Weibo text and corresponding labels are extracted for model training and testing.
Twitter dataset [31]. This dataset is constructed based on the MediaEval Multimedia Verification Benchmark, integrating and reconstructing the Twitter15 and Twitter16 datasets. The criteria for classifying rumorous and non-rumorous content adhere to the original authoritative standard logic of the public dataset. The labeling relies on verification results from third-party authoritative fact-checking organizations (e.g., https://www.snopes.com (accessed on 18 August 2025)), and each tweet is assigned a “rumor” or “non-rumor” label through factual authenticity verification. Within this dataset, rumors refer to tweets that have been verified as false through fact-checking, or tweets whose authenticity is questionable and lack reliable evidence support; non-rumors refer to tweets whose content has been verified as true by authoritative sources. The original labels in the dataset include four fine-grained categories: non-rumor, false rumor, true rumor, and unverified rumor. Among these, false rumors and unverified rumors are merged into the “rumor” category, while non-rumors and true rumors are merged into the “non-rumor” category.
Pheme dataset [32]. This dataset is collected from the Twitter platform and contains 5089 tweets related to 9 breaking news events. There are 4022 rumors and 1067 non-rumors in the original data (with an imbalanced category distribution). To balance the samples, 1067 rumors and 1067 non-rumors were selected from them. Only the text content and labels were extracted.

4.2. Baseline Model

EANN [33]. The original model consists of a multimodal feature extractor, a fake news detector, and an event discriminator. It learns transferable general representations by stripping event-specific features and retaining cross-event shared features, thereby enhancing generalization ability. When adapted to text tasks, the image feature extraction branch is removed, while the text feature processing, event discrimination, and detection logic are retained to verify its adaptability in pure text scenarios.
MCNN [16]. This model is designed with five modules: text feature extraction, visual semantic feature extraction, visual tampering feature extraction, similarity measurement, and multimodal fusion. It realizes fake news detection by fusing the semantic and physical features of text and images. In the adaptation experiment, only the text feature processing flow is retained, and all image-related modules (such as visual feature extraction and tampering detection) are removed to focus on the text unimodal detection capability.
CAFE [34]. As a multimodal fake news detection method, its model architecture includes modality-specific encoders to encode text and images, respectively. Through cross-modal alignment, features are brought into a shared space. It evaluates and controls feature fusion through cross-modal ambiguity learning (using KL divergence to quantify the ambiguity between text and image modalities), then integrates modal features via cross-modal fusion (attention mechanism), and finally makes predictions through a classifier. To adapt to the pure text detection scenario, when selecting it as a baseline model in this study, only the text detection-related parts such as text feature encoding and text feature attention mechanism are retained, while the image modality and cross-modal interaction modules are removed.
DAMMFND [35]. To establish a reasonable comparison in the pure text fake news detection task, this study selects the multimodal multi-domain fake news detection model DAMMFND as a baseline model and makes targeted adjustments to it. The original architecture of DAMMFND realizes multimodal multi-domain fake news detection through the collaboration of multi-view feature extraction and aggregation, domain decoupling, domain-aware discrimination, and a decision layer. Its text processing flow relies on BERT for text encoding and TextCNN for feature extraction. To adapt to the pure text scenario, this study retains only the text feature processing pipeline, reuses the BERT text encoding and TextCNN feature extraction modules, and removes image encoding, cross-modal interaction, and multimodal association components in domain decoupling, ensuring “alignment of pure text input and text feature extraction processes” with the model to be compared (both using BERT as the base encoder). The core logic for selecting this baseline is that the text branch of DAMMFND represents a classic paradigm (BERT + TextCNN) for text processing in multimodal models, which can verify the performance upper limit of the text sub-module of multimodal models in pure text tasks. Meanwhile, its text domain decoupling-related logic is retained to explore the impact of multi-domain text adaptation capability on single-domain text detection, providing a reference anchor for “text processing capability of multimodal models” for comparative experiments. In the experiment, the adjusted text branch of DAMMFND and the proposed model are strictly aligned in terms of text preprocessing, training parameters (learning rate, optimizer), and loss function to ensure the fairness of the comparison. Subsequent result analysis will focus on dimensions such as the depth of text feature mining and task adaptability to explain the attribution of performance differences.

4.3. Model Parameters

In the text feature extraction module, we split the training set and test set in a ratio of 7:3. A pre-trained BERT model is used with an output dimension of 768, and the input requires text word vectors and masks. In the BiLSTM model, the hidden dimension of the fully connected layer is 256, and the output dimension after bidirectional processing is 512. In the attention layer, attention scores and attention weights are calculated, which are then multiplied by the text features output by BiLSTM to obtain the text feature sequence focusing on key parts. The training batch size is set to 32, the number of training epochs is 300, and the learning rate is 0.00001. The weight of BCE loss α is 0.7, and the weight of contrastive loss β is 0.3. Model training employs the Adam optimizer for parameter updates, with the optimizer’s hyperparameters set to PyTorch (version 2.5.1+cu124)’s default values: the first-moment estimation decay coefficient β 1 = 0.9 , the second-moment estimation decay coefficient β 2 = 0.999 , and the numerical stability parameter ε = 1 × 10 8 No learning rate scheduler is used during the training process, and the learning rate is kept constant at 0.00001 to avoid interference from additional parameter adjustments on the stability of model convergence. The temperature value T for contrastive loss is 0.1, and the number of positive and negative samples obtained by locality-sensitive hashing in contrastive learning is 5 each.

4.4. Evaluation Metrics

To comprehensively evaluate the model performance, this experiment selects four metrics: Accuracy, Precision, Recall, and F1-score, to compare the performance of the proposed model with four baseline models, and assess the model’s advantages and disadvantages from multiple dimensions. Accuracy is used to measure the overall correctness of the model’s predictions, calculating the proportion of “correctly judged samples” among all prediction results, with the formula as follows:
A c c u r a c y = T P + T N T P + T N + F P + F N
Here, TP represents true positives; TN represents true negatives; FP represents false positives; FN represents false negatives. Precision focuses on the samples predicted as “positive” by the model, calculating the proportion of “true positives” among them, which reflects the reliability of predicted positives. The formula is as follows:
P r e c i s i o n = T P T P + F P
Here, TP and FP are defined the same as above. Recall focuses on the samples that are actually “positive”, calculating the proportion of those correctly identified as positive by the model, which reflects the model’s ability to capture positive instances. The formula is as follows:
R e c a l l = T P T P + F N
The F1-score integrates Precision and Recall through a harmonic mean to balance their trade-offs and provide a comprehensive evaluation of model performance. The formula is as follows:
F 1 = 2 × P r e c i s i o n × R e c a l l P r e c i s i o n + R e c a l l
Through the above metrics, the effectiveness of the model in text-based fake news detection can be systematically evaluated from dimensions such as overall correctness, positive instance prediction accuracy, positive instance coverage, and comprehensive performance.

5. Results

5.1. Overall Performance Comparison

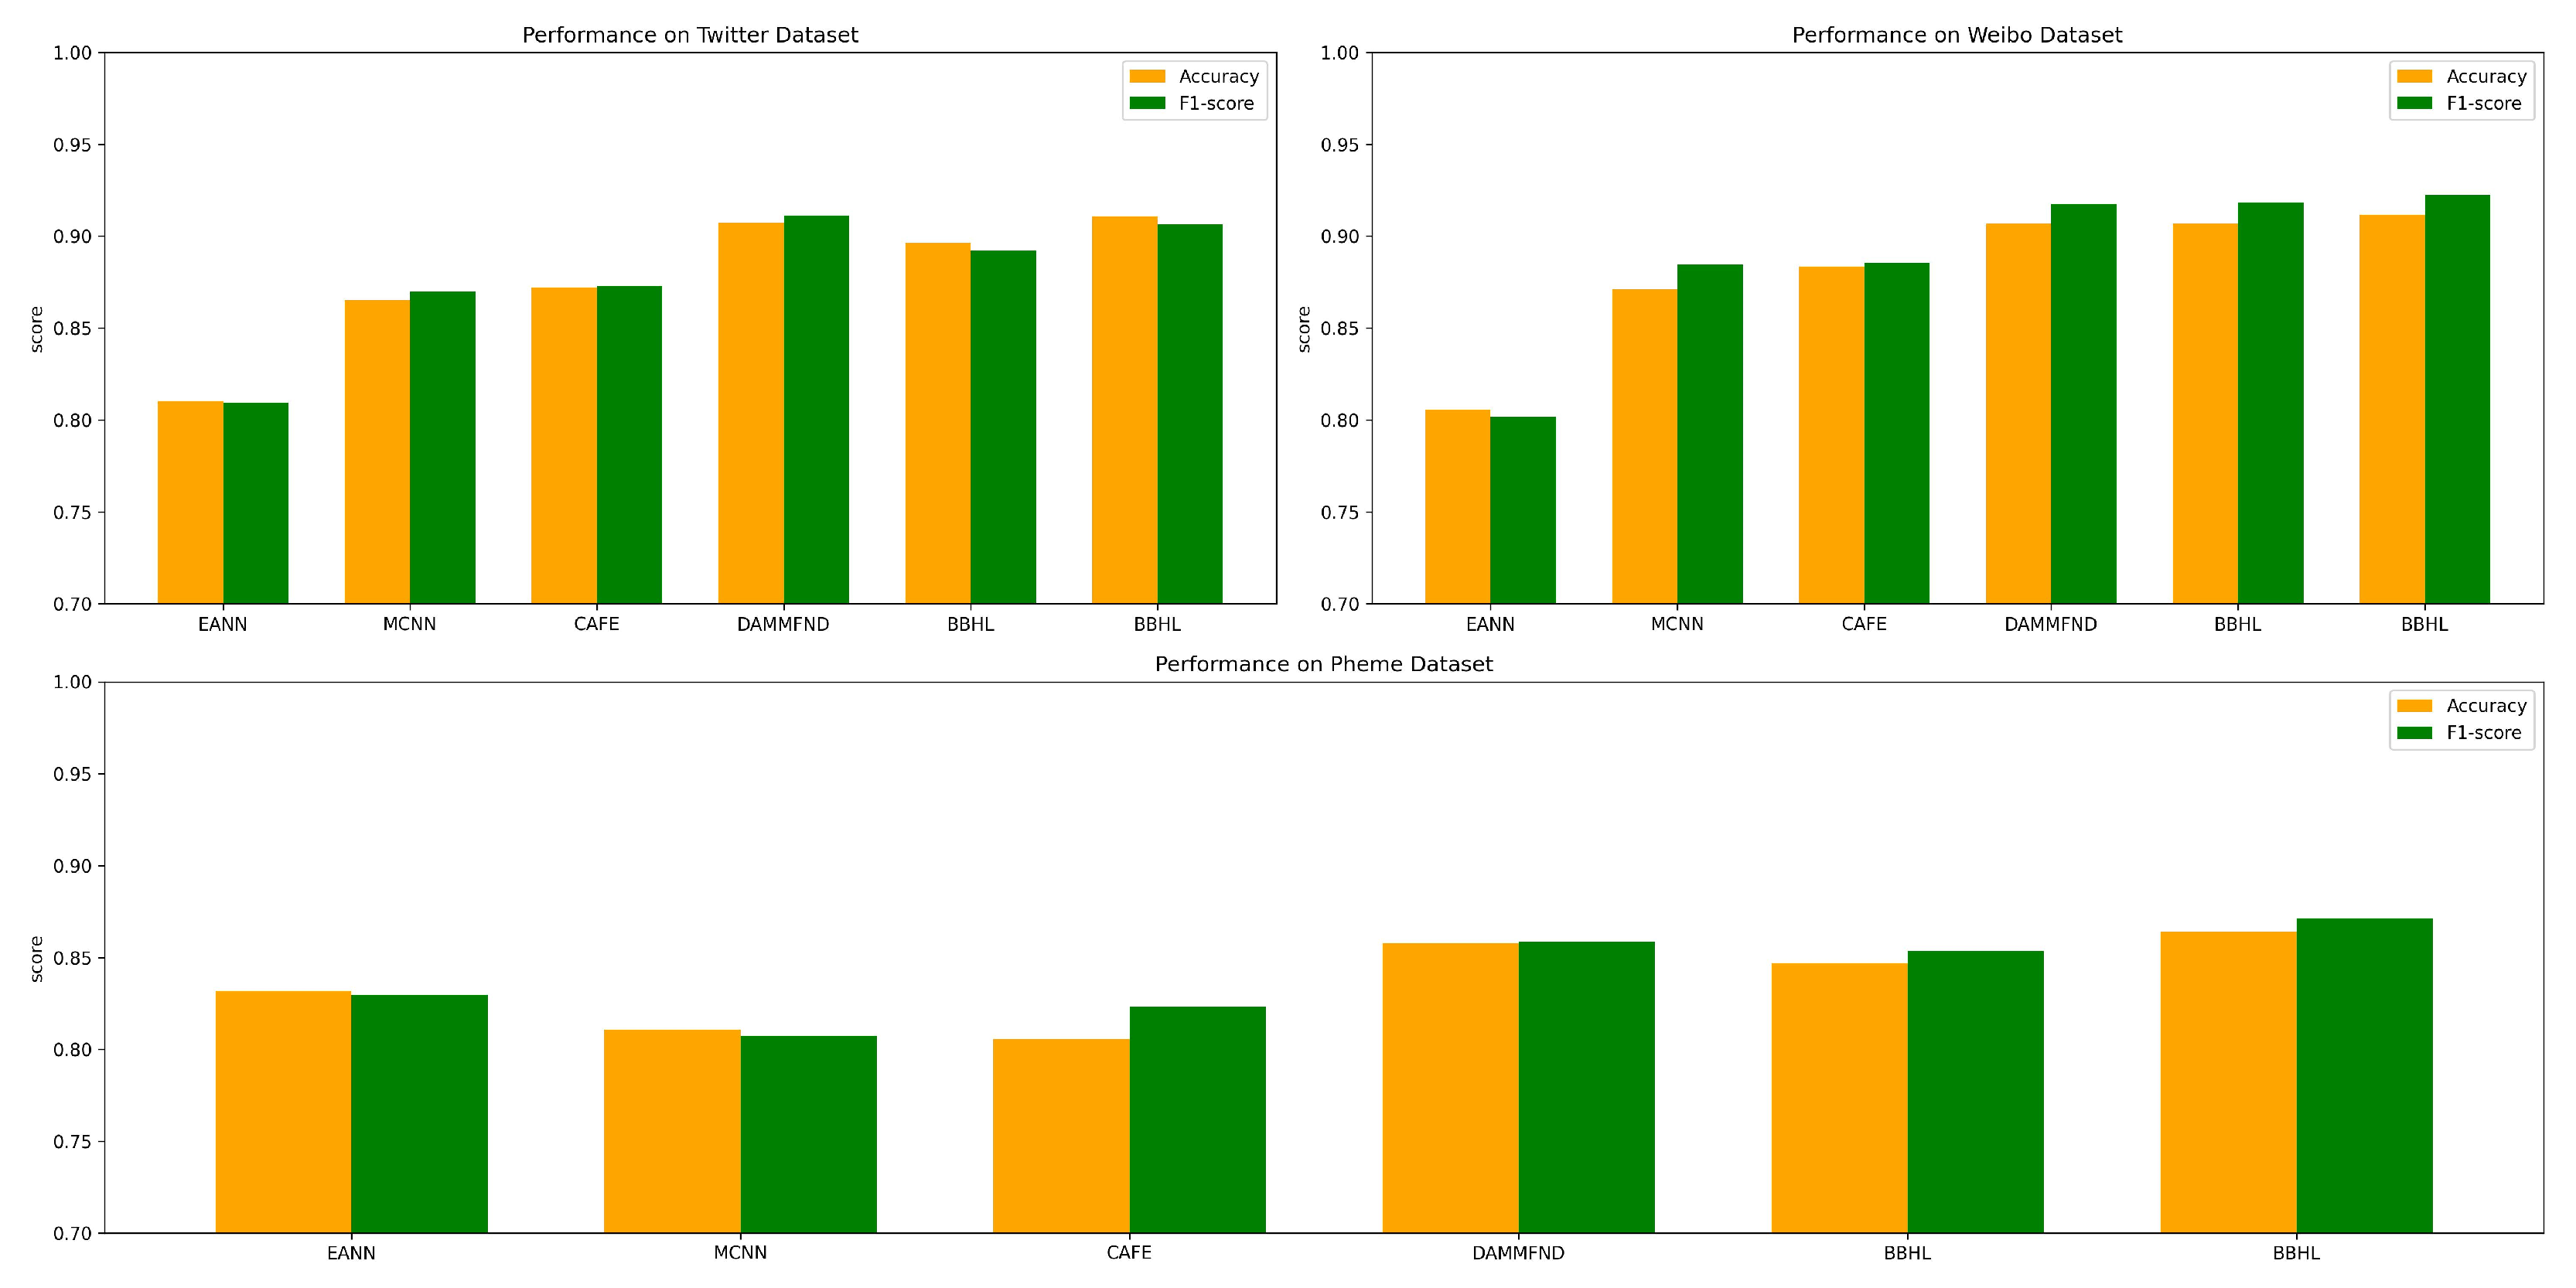
Table 2 and Figure 2 comprehensively compare the performance of our proposed BBHL model with various baseline methods on the Twitter, Weibo, and Pheme datasets, using four core evaluation metrics: Accuracy, Precision, Recall, and F1-score. Experimental results show that the BBHL model outperforms all baseline models (including EANN and MCNN) across all three datasets, and significantly surpasses the BBHL- model (with contrastive loss removed). This fully validates the effectiveness of the proposed hybrid loss optimization and feature extraction mechanism.
On the Twitter dataset, BBHL achieves an Accuracy of 0.9107, which is not only higher than that of traditional models such as EANN (0.8103) and MCNN (0.8652) but also exceeds the performance of the relatively advanced DAMMFND (0.9073) and BBHL- (0.8963). Its Precision reaches 0.9554, far outperforming other models (e.g., DAMMFND: 0.9158; BBHL-: 0.9313), and its F1-score of 0.9063 also maintains a leading position. This advantage stems from BBHL’s integrated architecture of BERT + Bi-LSTM + attention mechanism, which enables in-depth mining of semantic details in short texts. Additionally, the hybrid loss enhances the discriminability of features for real and fake news by forcing the aggregation of homogeneous features and the separation of heterogeneous features. In contrast, EANN’s event adversarial mechanism overlooks deep textual correlations; MCNN fails to extract comprehensive features due to the absence of contrastive loss; DAMMFND, despite its relatively strong performance, lacks an attention mechanism to focus on key information; and BBHL- suffers from insufficient feature discriminability as a result of removing contrastive loss.
On the Weibo dataset, BBHL’s advantages are even more pronounced: it achieves an Accuracy of 0.9118, which is higher than all baseline models (MCNN: 0.8712; DAMMFND: 0.9068), and its F1-score of 0.9224 significantly outperforms MCNN (0.8846), DAMMFND (0.9176), and BBHL- (0.9185). The average text length on Weibo is approximately 10 times that of Twitter; BBHL’s attention mechanism can accurately focus on key information in long texts, while the hybrid loss further enhances the distinguishability of features. In contrast, although MCNN uses BERT + BiGRU to process temporal information, it lacks the constraint of contrastive loss, leading to insufficient feature generalization. EANN, which ignores deep semantic correlations, only achieves an Accuracy of 0.8058, far lower than that of BBHL.
On the Pheme dataset—characterized by strong subjectivity in annotations, ambiguous rumor boundaries, and the need for cross-event analysis—BBHL still delivers outstanding performance: it achieves an Accuracy of 0.8641 (surpassing EANN: 0.8318; MCNN: 0.8107; DAMMFND: 0.8578) and an F1-score of 0.8715, which is significantly better than all other models. This is because the hybrid loss of BBHL improves the model’s adaptability to complex data: MCNN struggles to handle cross-event data with ambiguous annotations due to its simple feature concatenation approach; EANN retains shared features but lacks the enhancement of feature discriminability by contrastive loss; in contrast, BBHL, through optimization via contrastive loss, can still learn more robust feature representations even in scenarios with complex data, thus achieving superior performance.
To further verify the robustness of the model’s conclusions, in addition to the aforementioned 7:3 fixed data partitioning experiment, a 5-fold cross-validation experiment was additionally conducted on the model. The Weibo, Twitter, and Pheme datasets were each divided into 5 subsets of equal size according to the category proportion. Each time, 4 subsets were used as the training set and 1 subset as the test set. After repeating this process 5 times, the mean, standard deviation, and error interval of each indicator were calculated to ensure that the results were not affected by the contingency of a single data partition. The random seed was fixed before the 5-fold division to ensure the reproducibility of the experiment. All model parameters for the cross-validation experiments were exactly the same as those in the 7:3 partitioning experiment to prove the comparability of the results.
It should be noted that 5-fold experiments were not conducted on the baseline models in this section. The original 7:3 partitioning experiment has already completed the horizontal performance comparison between the BBHL model and the baseline models, and the 7:3 partitioning results are sufficient to support the conclusion that the proposed BBHL model exhibits superior performance.
Table 3 presents the 5 fold cross validation results of the BBHL model on three datasets. The model performs stably on all datasets, with the standard deviations of all evaluation metrics basically being 0.02 and narrow error intervals, which indicates that it has strong robustness.

5.2. Ablation Experiments

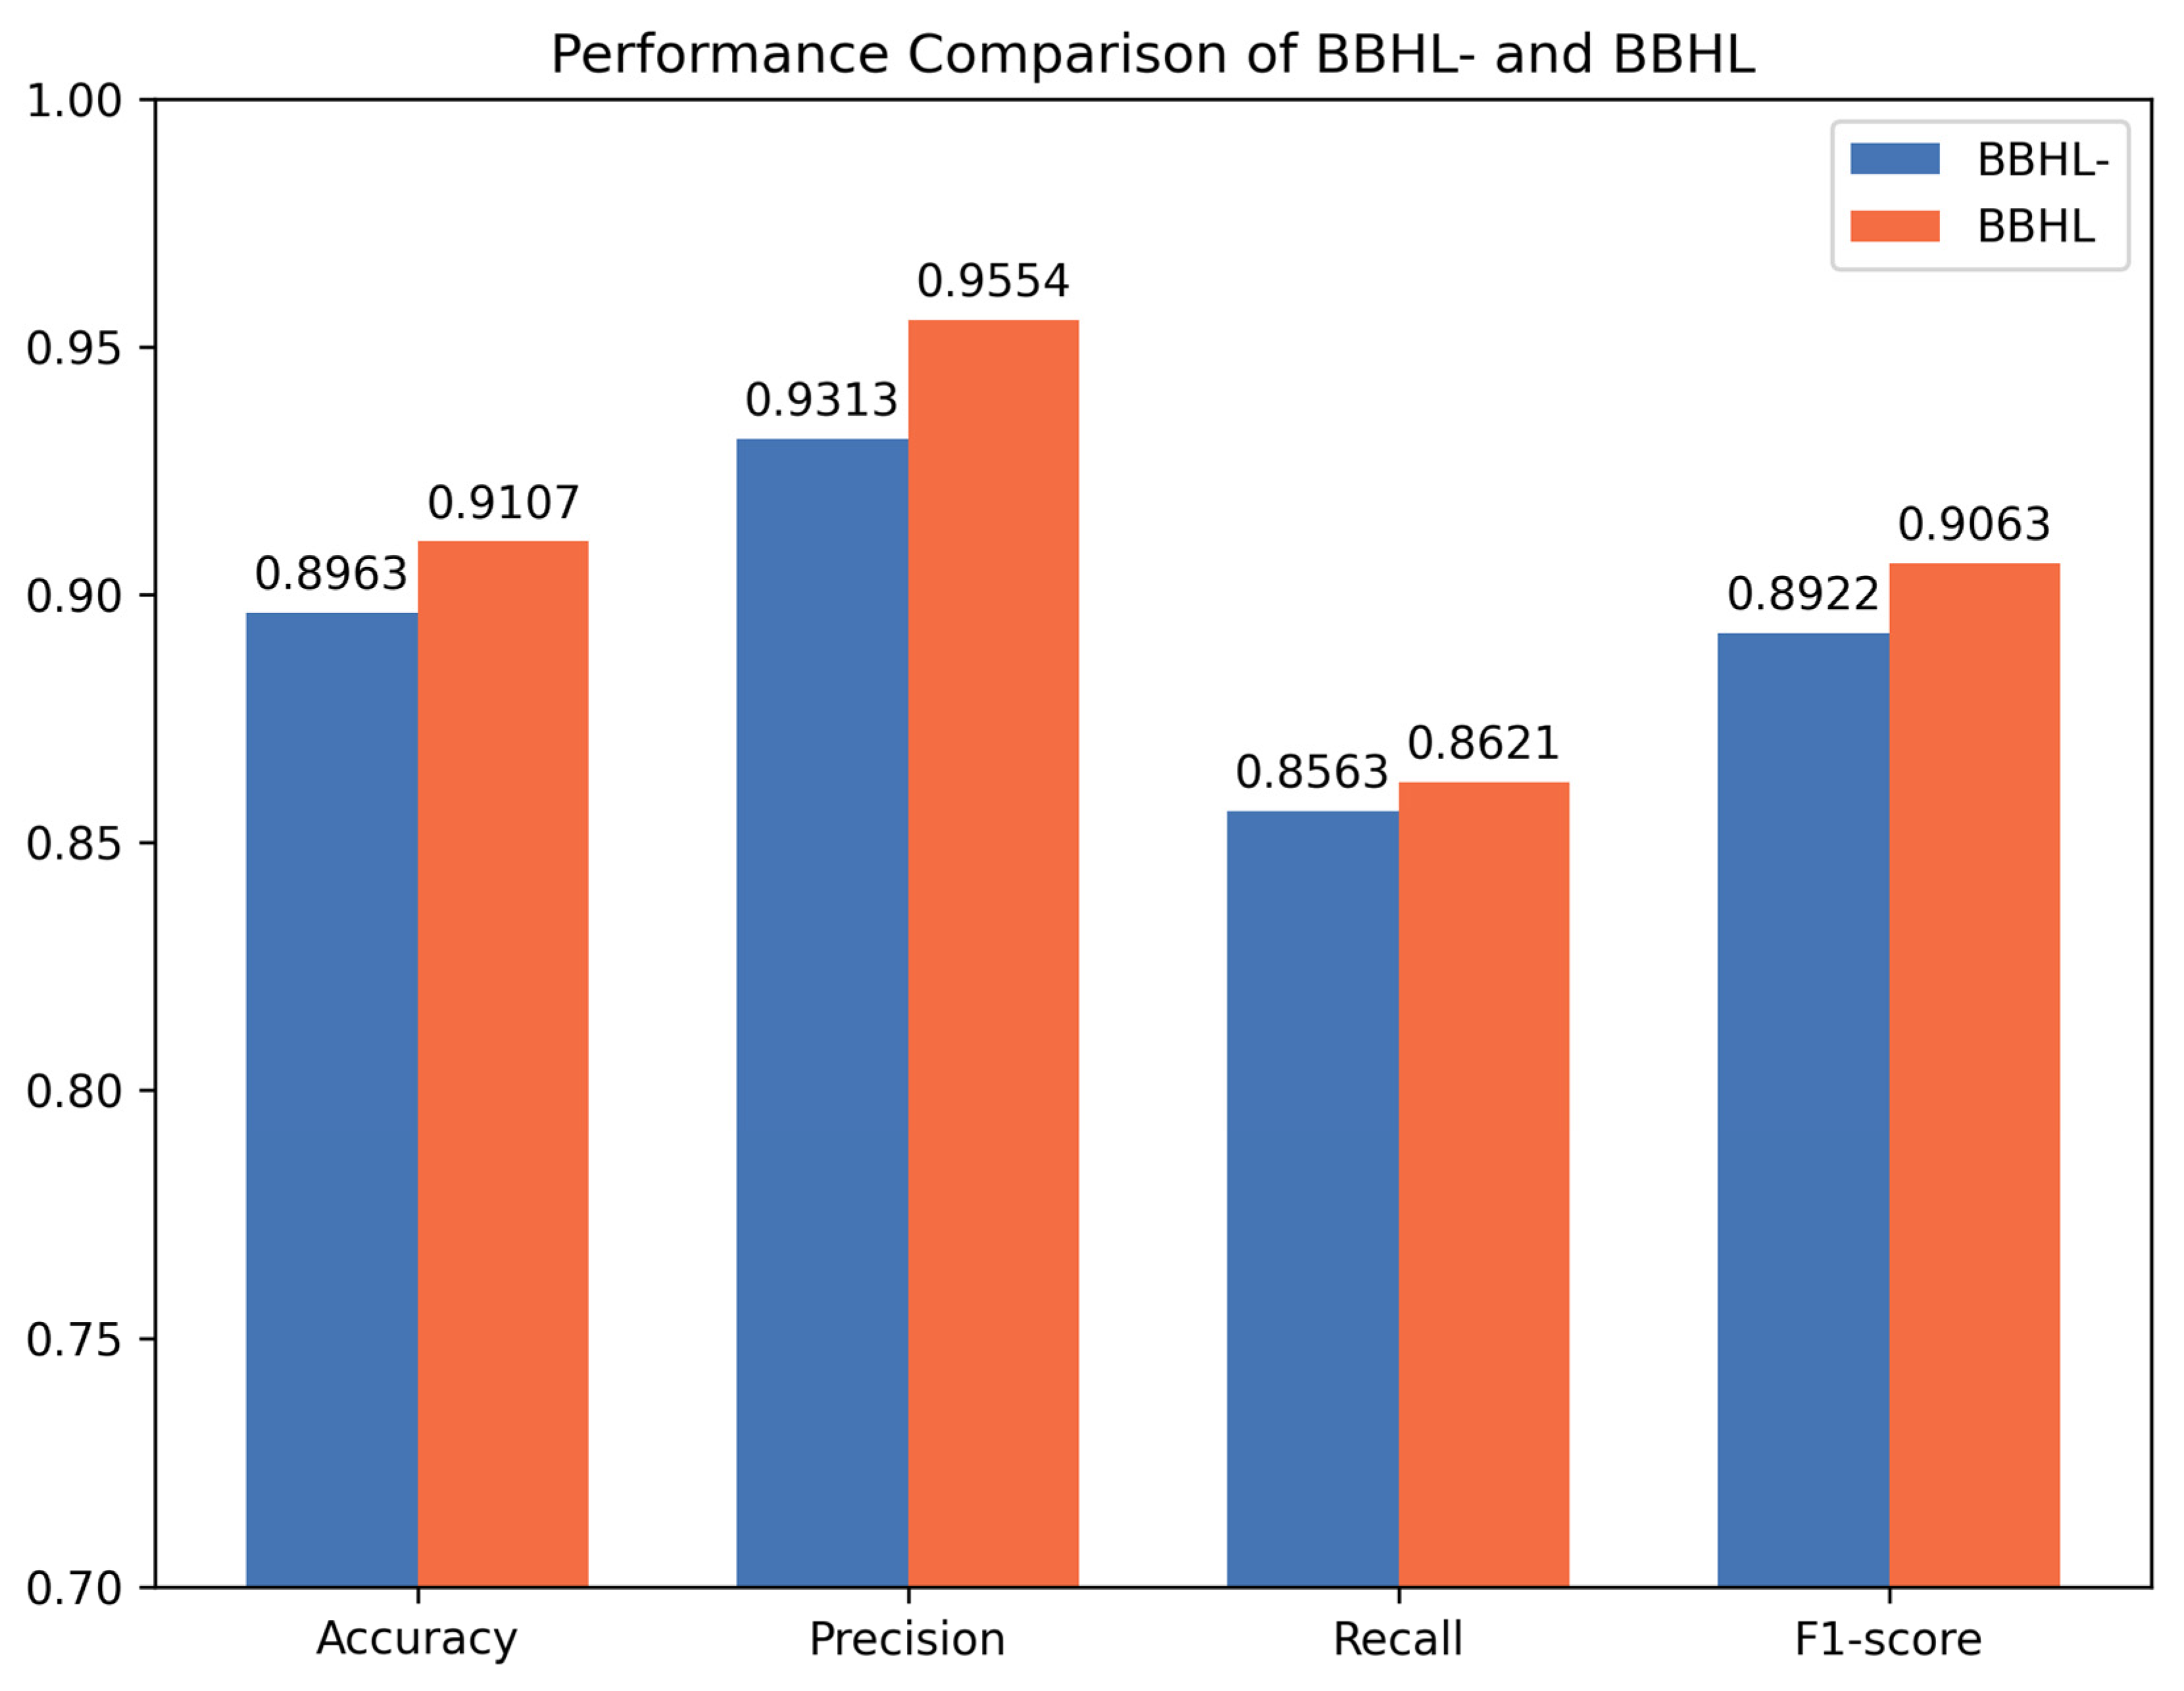
Quantitative analysis. To intuitively illustrate the importance of using contrastive loss in the proposed model, we conducted the following experiment. The experiment was performed on the Twitter dataset, using models both with and without the contrastive loss module. Figure 3 shows the scores of the two models on the four evaluation metrics. The abscissa represents the four evaluation metrics, namely Accuracy, Precision, Recall, and F1-score, while the ordinate represents the scores. BBHL- denotes the model without contrastive loss, and BBHL denotes the model with contrastive loss.
From Figure 3, we can observe that the model with contrastive loss (BBHL) outperforms the model without contrastive loss (BBHL-) in all four metrics, indicating that the introduction of contrastive loss has overall improved the classification performance of the model. The core function of contrastive loss is to enhance feature distinguishability. In classification tasks, it reduces the distance between features of samples from the same class and increases the distance between features of samples from different classes, enabling the model to learn more discriminative features. From the perspective of metrics, the improvements in F1-score and Accuracy confirm that the model’s classification ability has been enhanced after optimizing feature distinguishability. The increase in Recall indicates that contrastive loss has a more obvious optimization effect on positive samples. The significant improvement in Precision shows that adding contrastive loss has enhanced the reliability of positive class predictions.
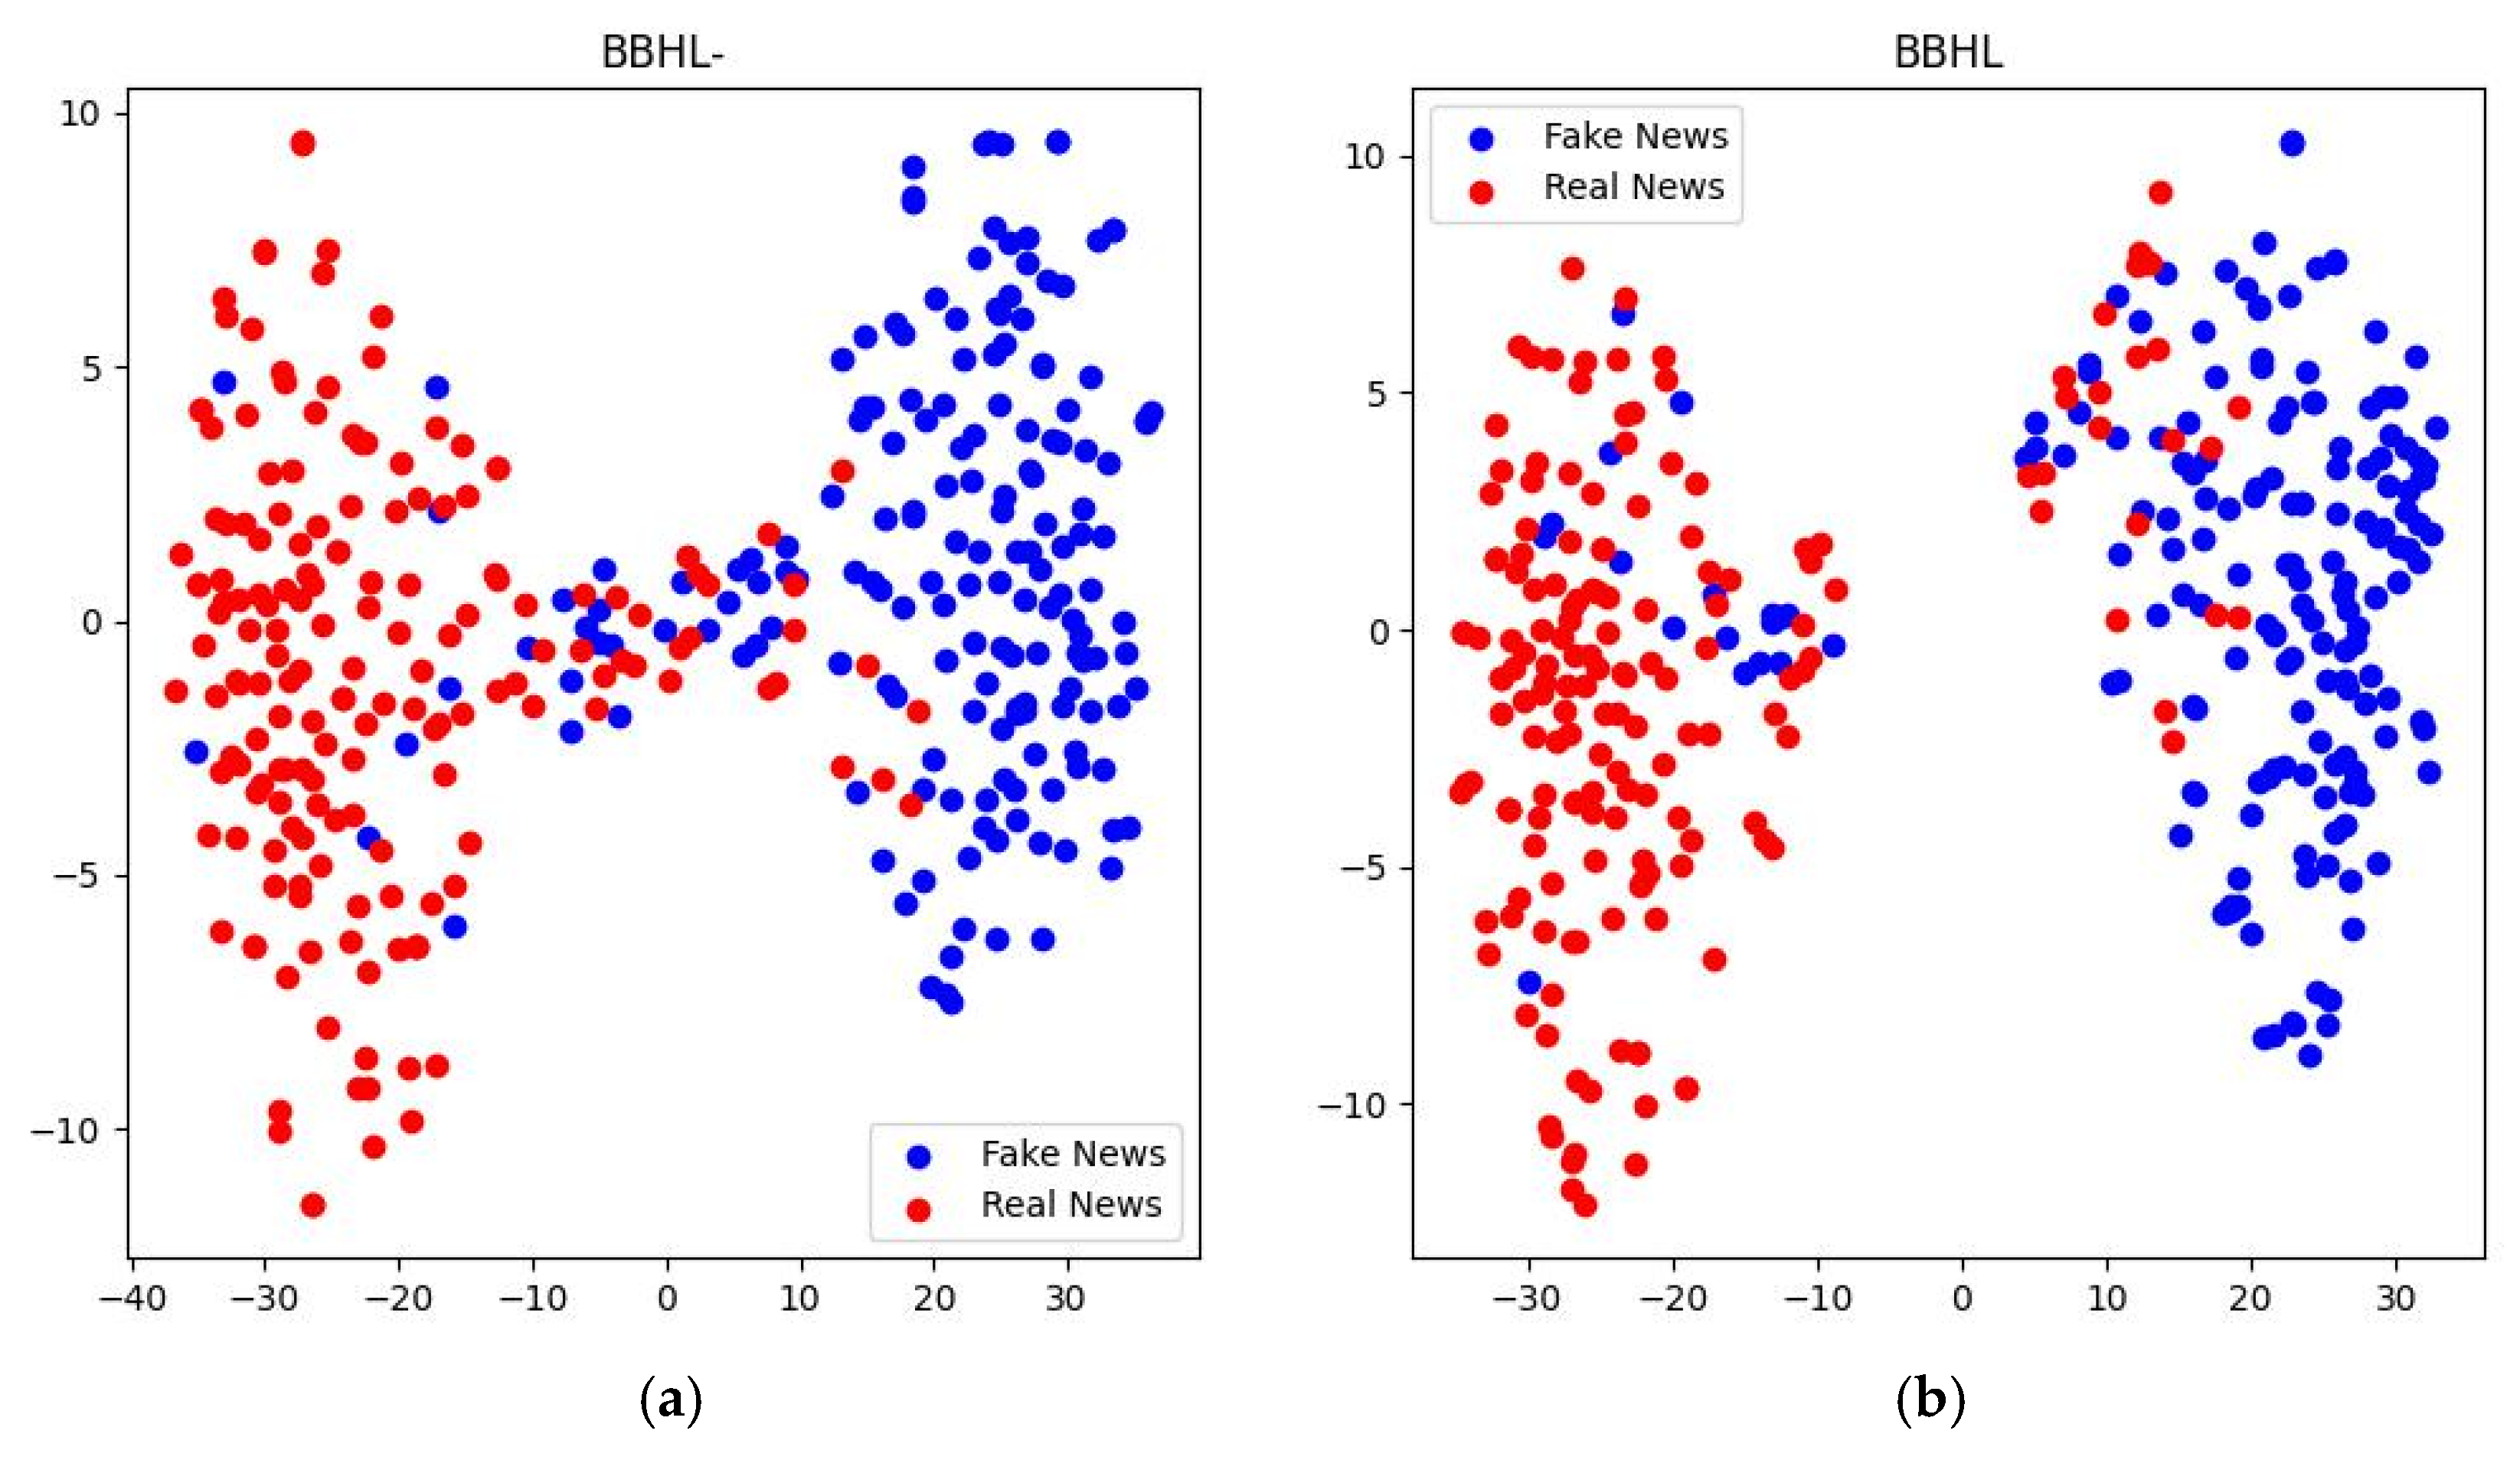
Qualitative analysis. As shown in Figure 4, to further analyze the effectiveness of adding the contrastive loss module, we used the t-SNE [36] method to qualitatively visualize the text features learned by BBHL- and BBHL on the Twitter dataset. The points in the figure represent texts, with blue indicating fake news and red indicating real news.
As can be observed from Figure 4, contrastive loss makes the feature distribution more separable, and the model’s classification ability is significantly improved. In the left figure, the features of fake news and real news overlap severely, especially in the middle area (the horizontal axis range of −10 to 10), where the two types of points are mixed together. This makes it difficult for the model to distinguish between fake and real news, resulting in a blurred classification boundary. In the right figure, the feature clusters of fake news and real news are clearly separated. Blue points and red points each form more compact clusters, and the overlapping area is greatly reduced. Contrastive loss makes the features more discriminative, enabling the model to more easily distinguish between the two types of samples. However, if the random sampling or simple weighting of existing methods is adopted, the feature separation effect will be significantly weakened. This indicates that the hybrid loss of BBHL can more efficiently optimize the distribution of text features through accurate sample selection and optimal weight ratio, thereby improving the detection performance.

5.3. BCE Loss Weight and Temperature Value Setting

This section aims to illustrate that the proposed model achieves the best performance in fake news detection when the BCE loss weight α = 0.7 (corresponding to the parameter in Equation (10)) and the contrastive T e m p e r a t u r e = 0.1 (corresponding to the parameter T in Equation (9)).
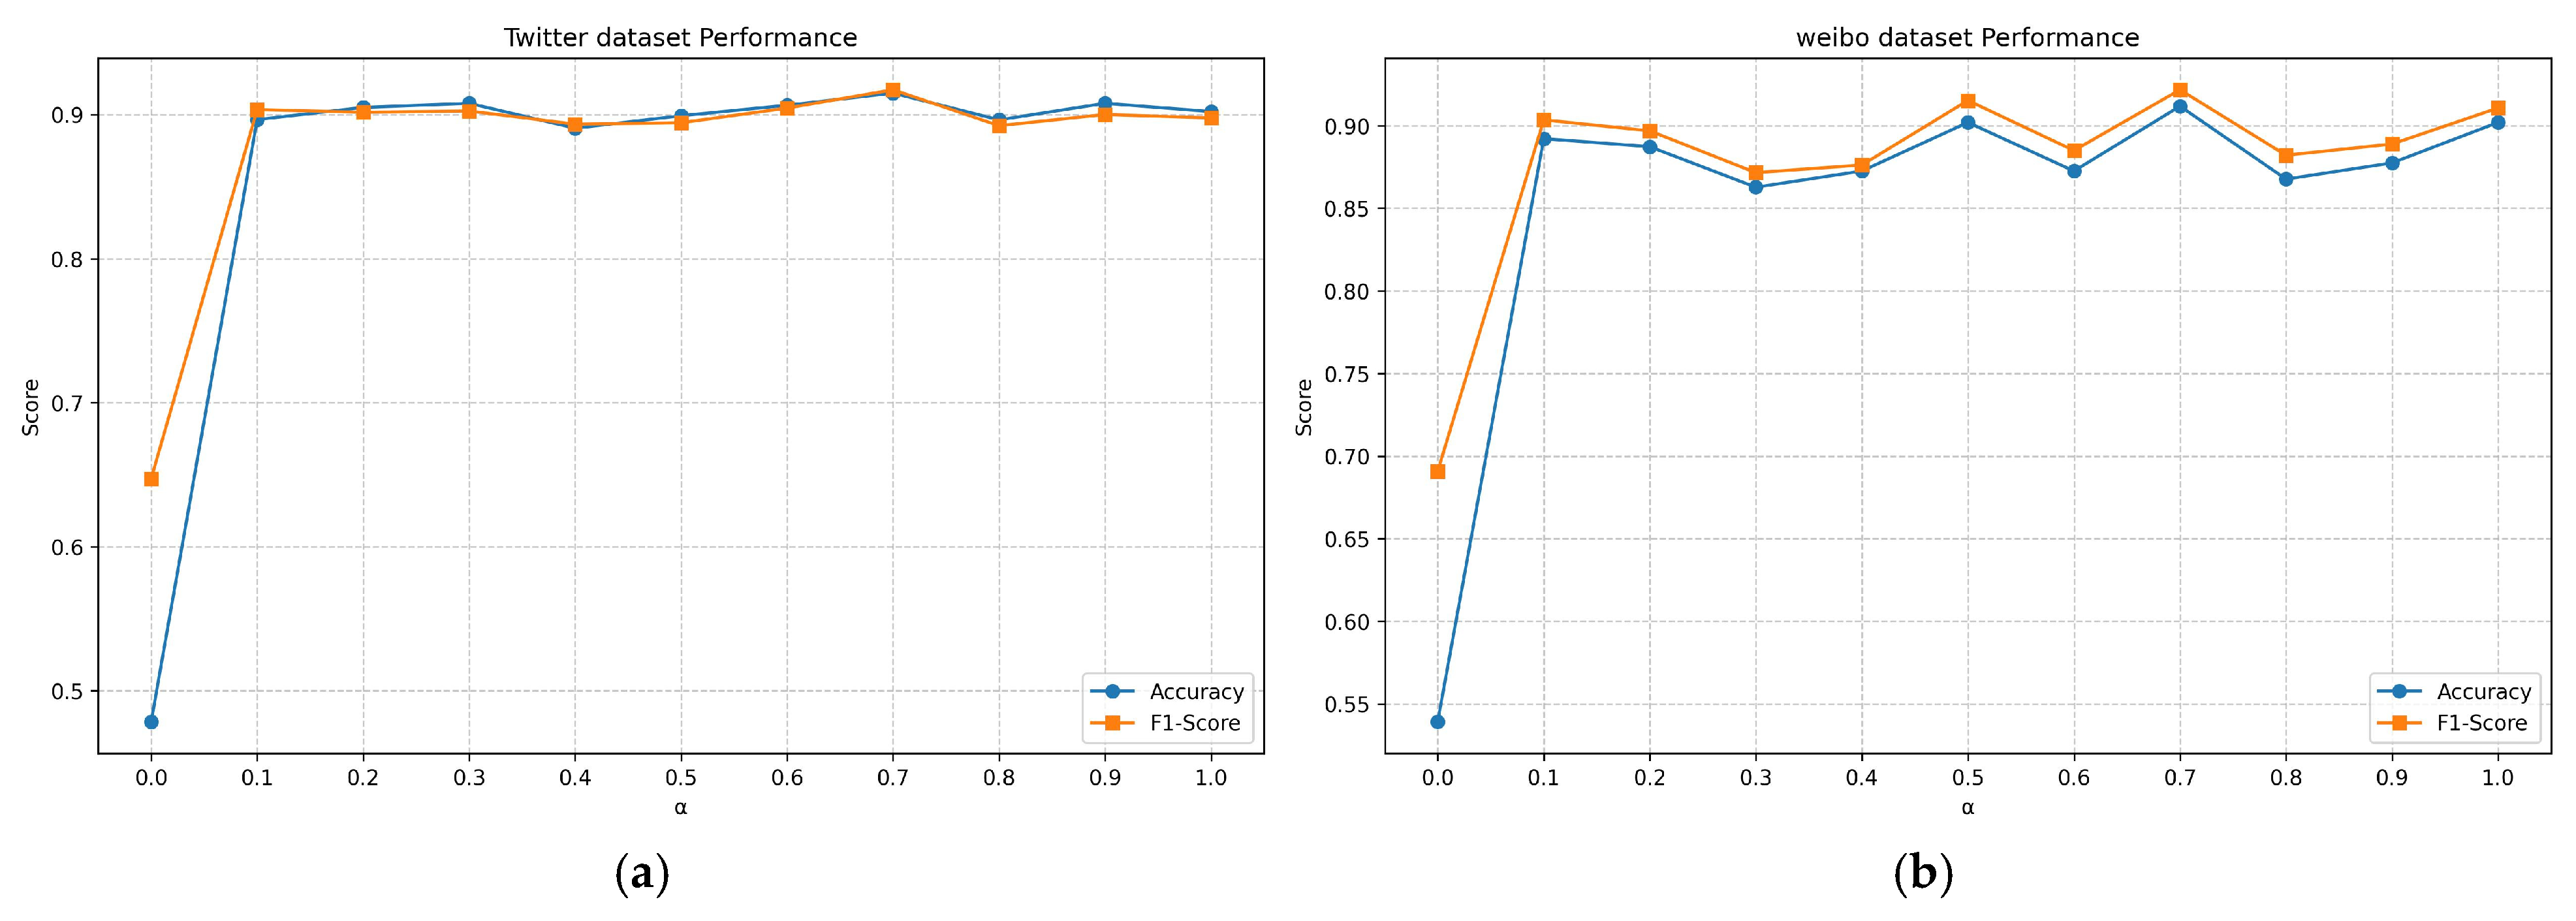
Setting of BCE loss weight. As shown in Figure 5, the abscissa represents the BCE loss weight α , and the contrastive loss weight is denoted as β , where α + β = 1 . By observing the performance changes under different α values, it can be seen that when α = 0.7 (i.e., β = 0.3 ), the model achieves the highest accuracy and F1-score on both datasets.
Setting of contrastive temperature value. As shown in Figure 6, the abscissa represents the temperature value, with a range from 0.01 to 1. The temperature values are mainly concentrated in the interval of 0.01 to 0.3, as the temperature in this range has the most significant impact on the model’s ability to distinguish feature similarities. By observing the performance changes under different temperature values, it can be seen that when the temperature T = 0.1 , the model attains the optimal accuracy and F1-score on the Twitter dataset.

5.4. Convergence Analysis

To explore the training process of the proposed BBHL model, Figure 7 shows the variation in loss values on the training set. During the training process, as the number of iterations increases, the loss value gradually decreases and converges within a range close to 0, which indicates that the model has achieved a certain degree of balance.

5.5. Discussion on the Necessity of Multimodal Extension

With the continuous evolution of content forms on social media, fake news has gradually shifted from a single text form to a multimodal dissemination model of “text + image/video”. Relying solely on text will lead to a decline in the detection performance of multimodal data. For example, during the 2023 global flood disasters, multiple fake news stories claiming “a dam collapse in a certain area” spread through methods such as spliced satellite images and tampered on-site videos. The text descriptions of such content are mostly logically consistent and have no obvious flaws. If only text-only detection models are relied on, it is highly likely to misclassify such fake news as real information due to the inability to capture forgery traces in the visual modality.
Furthermore, text-only models have the following limitations: they cannot identify the problem of semantic conflict between text and vision, struggle to deal with short-video fake news that has extremely concise text but forged visuals, and exhibit insufficient detection robustness for low-quality text samples.
From the perspective of the BBHL model’s architectural design, it inherently has the feasibility of multimodal extension. At the feature extraction layer, additional image and video feature extraction branches are added. At the feature fusion layer, the attention mechanism in the BBHL text feature extractor is reused to construct a text-visual bidirectional attention module. At the loss function layer, the original hybrid framework of BCE loss and contrastive loss is retained, and the constraint scope of contrastive loss is extended to cross-modal features.
From the perspective of application value, multimodal extension is a crucial step for the BBHL model to move from academic research to industrial implementation. Multimodal extension can significantly improve the detection scenario coverage of the BBHL model.

6. Conclusions

In this study, we conducted a review of research papers related to fake news detection. The main challenges in fake news detection lie in incomplete feature extraction and the use of a single loss function design. To address these issues, we propose a fake news detection framework with hybrid loss optimization. Through contrastive learning, the model can mine more discriminative features, prompting it to learn more generalizable feature representations and reduce the risk of overfitting. Extensive experiments conducted on three datasets collected from social platforms demonstrate that the proposed model is effective and can improve the performance of fake news detection.

6.1. Method Reflection

Although this model has achieved good performance, there are still limitations in its method design.
There is room for optimization in the LSH sample selection mechanism. The model uses LSH to screen positive and negative samples for efficiency improvement, but its random projection matrix remains fixed after initialization and does not change with the dynamic shifts in data distribution during the training process. This may lead to a decrease in the retrieval accuracy of similar samples, weaken the optimization effect of contrastive loss, and make it impossible to fully verify the optimality of LSH in terms of sample selection efficiency and accuracy.
There is a limitation in single-modal application. The model only processes text features and does not incorporate multi-modal information such as images and videos that are common in the spread of fake news. In practical scenarios, relying solely on text features is likely to cause the model to make misjudgments.
The robustness of the model under extreme samples has not been verified. In the three datasets used, the number of real and fake samples is relatively balanced. Whether the model’s performance can remain unchanged when using datasets where there is a significant difference between real and fake samples needs to be verified in future work.

6.2. Future Research Directions

To address the above limitations and in combination with the practical needs of fake news detection technology, future research will focus on the following three aspects to improve the applicability and robustness of the model. First, improve the static parameter design of LSH, incorporate the random projection matrix into the model training process to enable it to be iteratively updated according to the distribution of sample features, adopt multiple sample selection methods, and conduct horizontal comparisons of the differences between each method in terms of sample selection efficiency and performance. Second, break through the limitation of text single-modality, add a new visual feature branch, reuse the attention mechanism of the BBHL model, design a cross-modal bidirectional attention module to achieve accurate alignment between text semantics and visual content, and introduce inter-modal contrastive loss to solve the problem of semantic conflict identification in multi-modal fake news. Third, introduce adversarial training to test the robustness of the model under extreme samples.

Author Contributions

Conceptualization, M.T., J.Z., P.L., X.B. and J.W.; methodology, M.T., J.Z., P.L., X.B. and J.W.; software, M.T., J.Z. and P.L.; validation, J.Z., X.B. and J.W.; formal analysis, M.T. and J.Z.; investigation, M.T., J.Z., P.L., X.B. and J.W.; resources, M.T.; data curation, M.T., J.Z., P.L., X.B. and J.W.; writing—original draft preparation, M.T., J.Z., P.L., X.B. and J.W.; writing—review and editing, M.T. and J.Z.; visualization, J.Z.; supervision, M.T.; project administration, M.T., J.Z., P.L., X.B. and J.W.; funding acquisition, M.T. All authors have read and agreed to the published version of the manuscript.

Funding

This research was funded by Key R&D and Transformation Plan of Qinghai Province: 2025-GX-143.

Institutional Review Board Statement

Not applicable.

Informed Consent Statement

Not applicable.

Data Availability Statement

The dataset used in this study is sourced from public datasets. For the preprocessed dataset (if required), further inquiries can be directed to the corresponding author.

Acknowledgments

We would like to thank the expert evaluators, research participants, and reviewers for their support of our work; their feedback has greatly improved this study.

Conflicts of Interest

The authors declare no conflicts of interest.

References

  1. Zhang, L.; Zhang, X.; Zhou, Z.; Zhang, X.; Wang, S.; Yu, P.S.; Li, C. Early Detection of Multimodal Fake News via Reinforced Propagation Path Generation. IEEE Trans. Knowl. Data Eng. 2025, 37, 613–625. [Google Scholar] [CrossRef]
  2. Allcott, H.; Gentzkow, M. Social media and fake news in the 2016 election. J. Econ. Perspect. 2017, 31, 211–234. [Google Scholar] [CrossRef]
  3. Garg, S.; Sharma, D.K. Linguistic features based framework for automatic fake news detection. Comput. Ind. Eng. 2022, 172, 108432. [Google Scholar] [CrossRef]
  4. Ge, W.; Hong, Z.; Luo, Y. Online detection of Weibo rumors based on Naive Bayes algorithm. In Proceedings of the 2020 Asia-Pacific Conference on Image Processing, Electronics and Computers, Dalian, China, 14–16 April 2020; pp. 22–25. [Google Scholar]
  5. Liu, X.; Pang, M.; Li, Q.; Zhou, J.; Wang, H.; Yang, D. MVACLNet: A Multimodal Virtual Augmentation Contrastive Learning Network for Rumor Detection. Algorithms 2024, 17, 199. [Google Scholar] [CrossRef]
  6. Liu, Z.; Wei, Z.; Zhang, R. Rumor detection based on convolutional neural network. J. Comput. Appl. 2017, 37, 3053–3056+3100. [Google Scholar]
  7. Li, L.; Cai Gu Pan, J. Weibo rumor event detection method based on C-GRU. J. Shandong Univ. (Eng. Sci.) 2019, 49, 102–106+115. [Google Scholar]
  8. Yin, S.; Zhu, P.; Wu, L.; Gao, C.; Wang, Z. GAMC: An Unsupervised Method for Fake News Detection Using Graph Autoencoder with Masking. Proc. AAAI Conf. Artif. Intell. 2024, 38, 347–355. [Google Scholar] [CrossRef]
  9. Khattar, D.; Goud, J.S.; Gupta, M.; Varma, V. MVAE: Multimodal Variational Autoencoder for Fake News Detection. In Proceedings of the World Wide Web Conference, San Francisco, CA, USA, 13–17 May 2019; pp. 2915–2921. [Google Scholar]
  10. Han, H.; Ke, Z.; Nie, X.; Dai, L.; Slamu, W. Multimodal Fusion with Dual-Attention Based on Textual Double-Embedding Networks for Rumor Detection. Appl. Sci. 2023, 13, 4886. [Google Scholar] [CrossRef]
  11. Hao, R.; Luo, H.; Li, Y. Multi-Modal Fake News Detection Enhanced by Fine-Grained Knowledge Graph. IEICE Trans. Inf. Syst. 2025, E108D, 604–614. [Google Scholar] [CrossRef]
  12. Hua, J.; Cui, X.; Li, X.; Tang, K.; Zhu, P. Multimodal fake news detection through data augmentation-based contrastive learning. Appl. Soft Comput. 2023, 136, 110125. [Google Scholar] [CrossRef]
  13. Wang, J.; Qian, S.; Hu, J.; Hong, R. Positive Unlabeled Fake News Detection via Multi-Modal Masked Transformer Network. IEEE Trans. Multimed. 2024, 26, 234–244. [Google Scholar] [CrossRef]
  14. Devlin, J.; Chang, M.W.; Lee, K.; Toutanova, K. BERT: Pre-training of deep bidirectional transformers for language understanding. arXiv 2018, arXiv:1810.04805. [Google Scholar]
  15. Lauw, H.W.; Lee, M.L.; Lim, E.P. Deep learning for fake news detection: A survey. AI Open 2022, 3, 133–155. [Google Scholar] [CrossRef]
  16. Xue, J.; Wang, Y.; Tian, Y.; Li, Y.; Shi, L.; Wei, L. Detecting fake news by exploring the consistency of multimodal data. Inf. Process. Manag. 2021, 58, 102610. [Google Scholar] [CrossRef]
  17. Zhou, X.; Wu, J.; Zafarani, R. SAFE: Similarity-Aware MultiModal Fake News Detection. arXiv 2020, arXiv:2003.04981. [Google Scholar]
  18. Asghar, M.Z.; Habib, A.; Habib, A.; Khan, A.; Ali, R.; Khattak, A. Exploring deep neural networks for rumor detection. J. Ambient. Intell. Hum.-Comput. Interact. 2021, 12, 4315–4333. [Google Scholar] [CrossRef]
  19. He, K.; Zhang, X.; Ren, S.; Sun, J. Deep residual learning for image recognition. In Proceedings of the IEEE Conference on Computer Vision and Pattern Recognition, Las Vegas, NV, USA, 27–30 June 2016; pp. 770–778. [Google Scholar]
  20. Simonyan, K.; Zisserman, A. Very deep convolutional networks for large-scale image recognition. arXiv 2014, arXiv:1409.1556. [Google Scholar]
  21. Cao, B.; Wu, Q.; Cao, J.; Liu, B.; Gui, J. External Reliable Information-enhanced Multimodal Contrastive Learning for Fake News Detection. Proc. AAAI Conf. Artif. Intell. 2025, 39, 31–39. [Google Scholar] [CrossRef]
  22. Ying, Q.; Hu, X.; Zhou, Y.; Qian, Z.; Zeng, D.; Ge, S. Bootstrapping Multi-View Representations for Fake News Detection. Proc. AAAI Conf. Artif. Intell. 2023, 37, 5384–5392. [Google Scholar] [CrossRef]
  23. Chen, J.; Jia, C.; Zheng, H.; Chen, R.; Fu, C. Is Multi-Modal Necessarily Better? Robustness Evaluation of Multi-Modal Fake News Detection. IEEE Trans. Netw. Sci. Eng. 2023, 10, 3144–3158. [Google Scholar] [CrossRef]
  24. Sun, L.; Rao, Y.; Lan, Y.; Xia, B.; Li, Y. HG-SL: Jointly Learning of Global and Local User Spreading Behavior for Fake News Early Detection. Proc. AAAI Conf. Artif. Intell. 2023, 37, 5248–5256. [Google Scholar] [CrossRef]
  25. Silva, A.; Han, Y.; Luo, L.; Karunasekera, S.; Leckie, C. Propagation2Vec: Embedding partial propagation networks for explainable fake news early detection. Inf. Process. Manag. 2021, 58, 102618. [Google Scholar] [CrossRef]
  26. Su, P.; Peng, Y.; Vijay-Shanker, K. Improving BERT Model Using Contrastive Learning for Biomedical Relation Extraction. arXiv 2021, arXiv:2104.13913. [Google Scholar] [CrossRef]
  27. Cui, W.; Shang, M. MIGCL: Fake news detection with multimodal interaction and graph contrastive learning networks. Appl. Intell. 2025, 55, 78. [Google Scholar] [CrossRef]
  28. Lv, H.; Yang, W.; Yin, Y.; Wei, F.; Peng, J.; Geng, H. MDF-FND: A dynamic fusion model for multimodal fake news detection. Knowl.-Based Syst. 2025, 317, 113417. [Google Scholar] [CrossRef]
  29. Khosla, P.; Teterwak, P.; Wang, C.; Sarna, A.; Tian, Y.; Isola, P.; Maschinot, A.; Liu, C.; Krishnan, D. Supervised Contrastive Learning. Adv. Neural Inf. Process. Syst. 2020, 33, 18661–18673. [Google Scholar]
  30. Song, C.; Tu, C.; Yang, C.; Chen, H.; Liu, Z.; Sun, M. CED: Credible Early Detection of Social Media Rumors. arXiv 2018, arXiv:1811.04175. [Google Scholar] [CrossRef]
  31. Yuan, C.; Ma, Q.; Zhou, W.; Han, J.; Hu, S. Jointly embedding the local and global relations of heterogeneous graph for rumor detection. In Proceedings of the 19th IEEE International Conference on Data Mining, Beijing, China, 8–11 November 2019. [Google Scholar]
  32. Zubiaga, A.; Liakata, M.; Procter, R.; Hoi, G.W.S.; Tolmie, P.; Masuda, N. Analysing How People Orient to and Spread Rumours in Social Media by Looking at Conversational Threads. PLoS ONE 2016, 11, e0150989. [Google Scholar] [CrossRef]
  33. Wang, Y.; Ma, F.; Jin, Z.; Yuan, Y.; Xun, G.; Jha, K.; Su, L.; Gao, J. EANN: Event Adversarial Neural Networks for Multi-Modal Fake News Detection. In Proceedings of the 24th ACM SIGKDD International Conference on Knowledge Discovery & Data Mining, London, UK, 19–23 August 2018; pp. 849–857. [Google Scholar]
  34. Chen, Y.; Li, D.; Zhang, P.; Sui, J.; Lv, Q.; Tun, L.; Shang, L. Cross-modal ambiguity learning for multimodal fake news detection. In Proceedings of the ACM Web Conference 2022, Lyon, France, 25–29 April 2022; pp. 2897–2905. [Google Scholar]
  35. Lu, W.; Tong, Y.; Ye, Z. DAMMFND: Domain-Aware Multimodal Multi-view Fake News Detection. Proc. AAAI Conf. Artif. Intell. 2025, 39, 559–567. [Google Scholar] [CrossRef]
  36. van der Maaten, L.; Hinton, G. Visualizing data using t-SNE. J. Mach. Learn. Res. 2008, 9, 2579–2605. [Google Scholar]
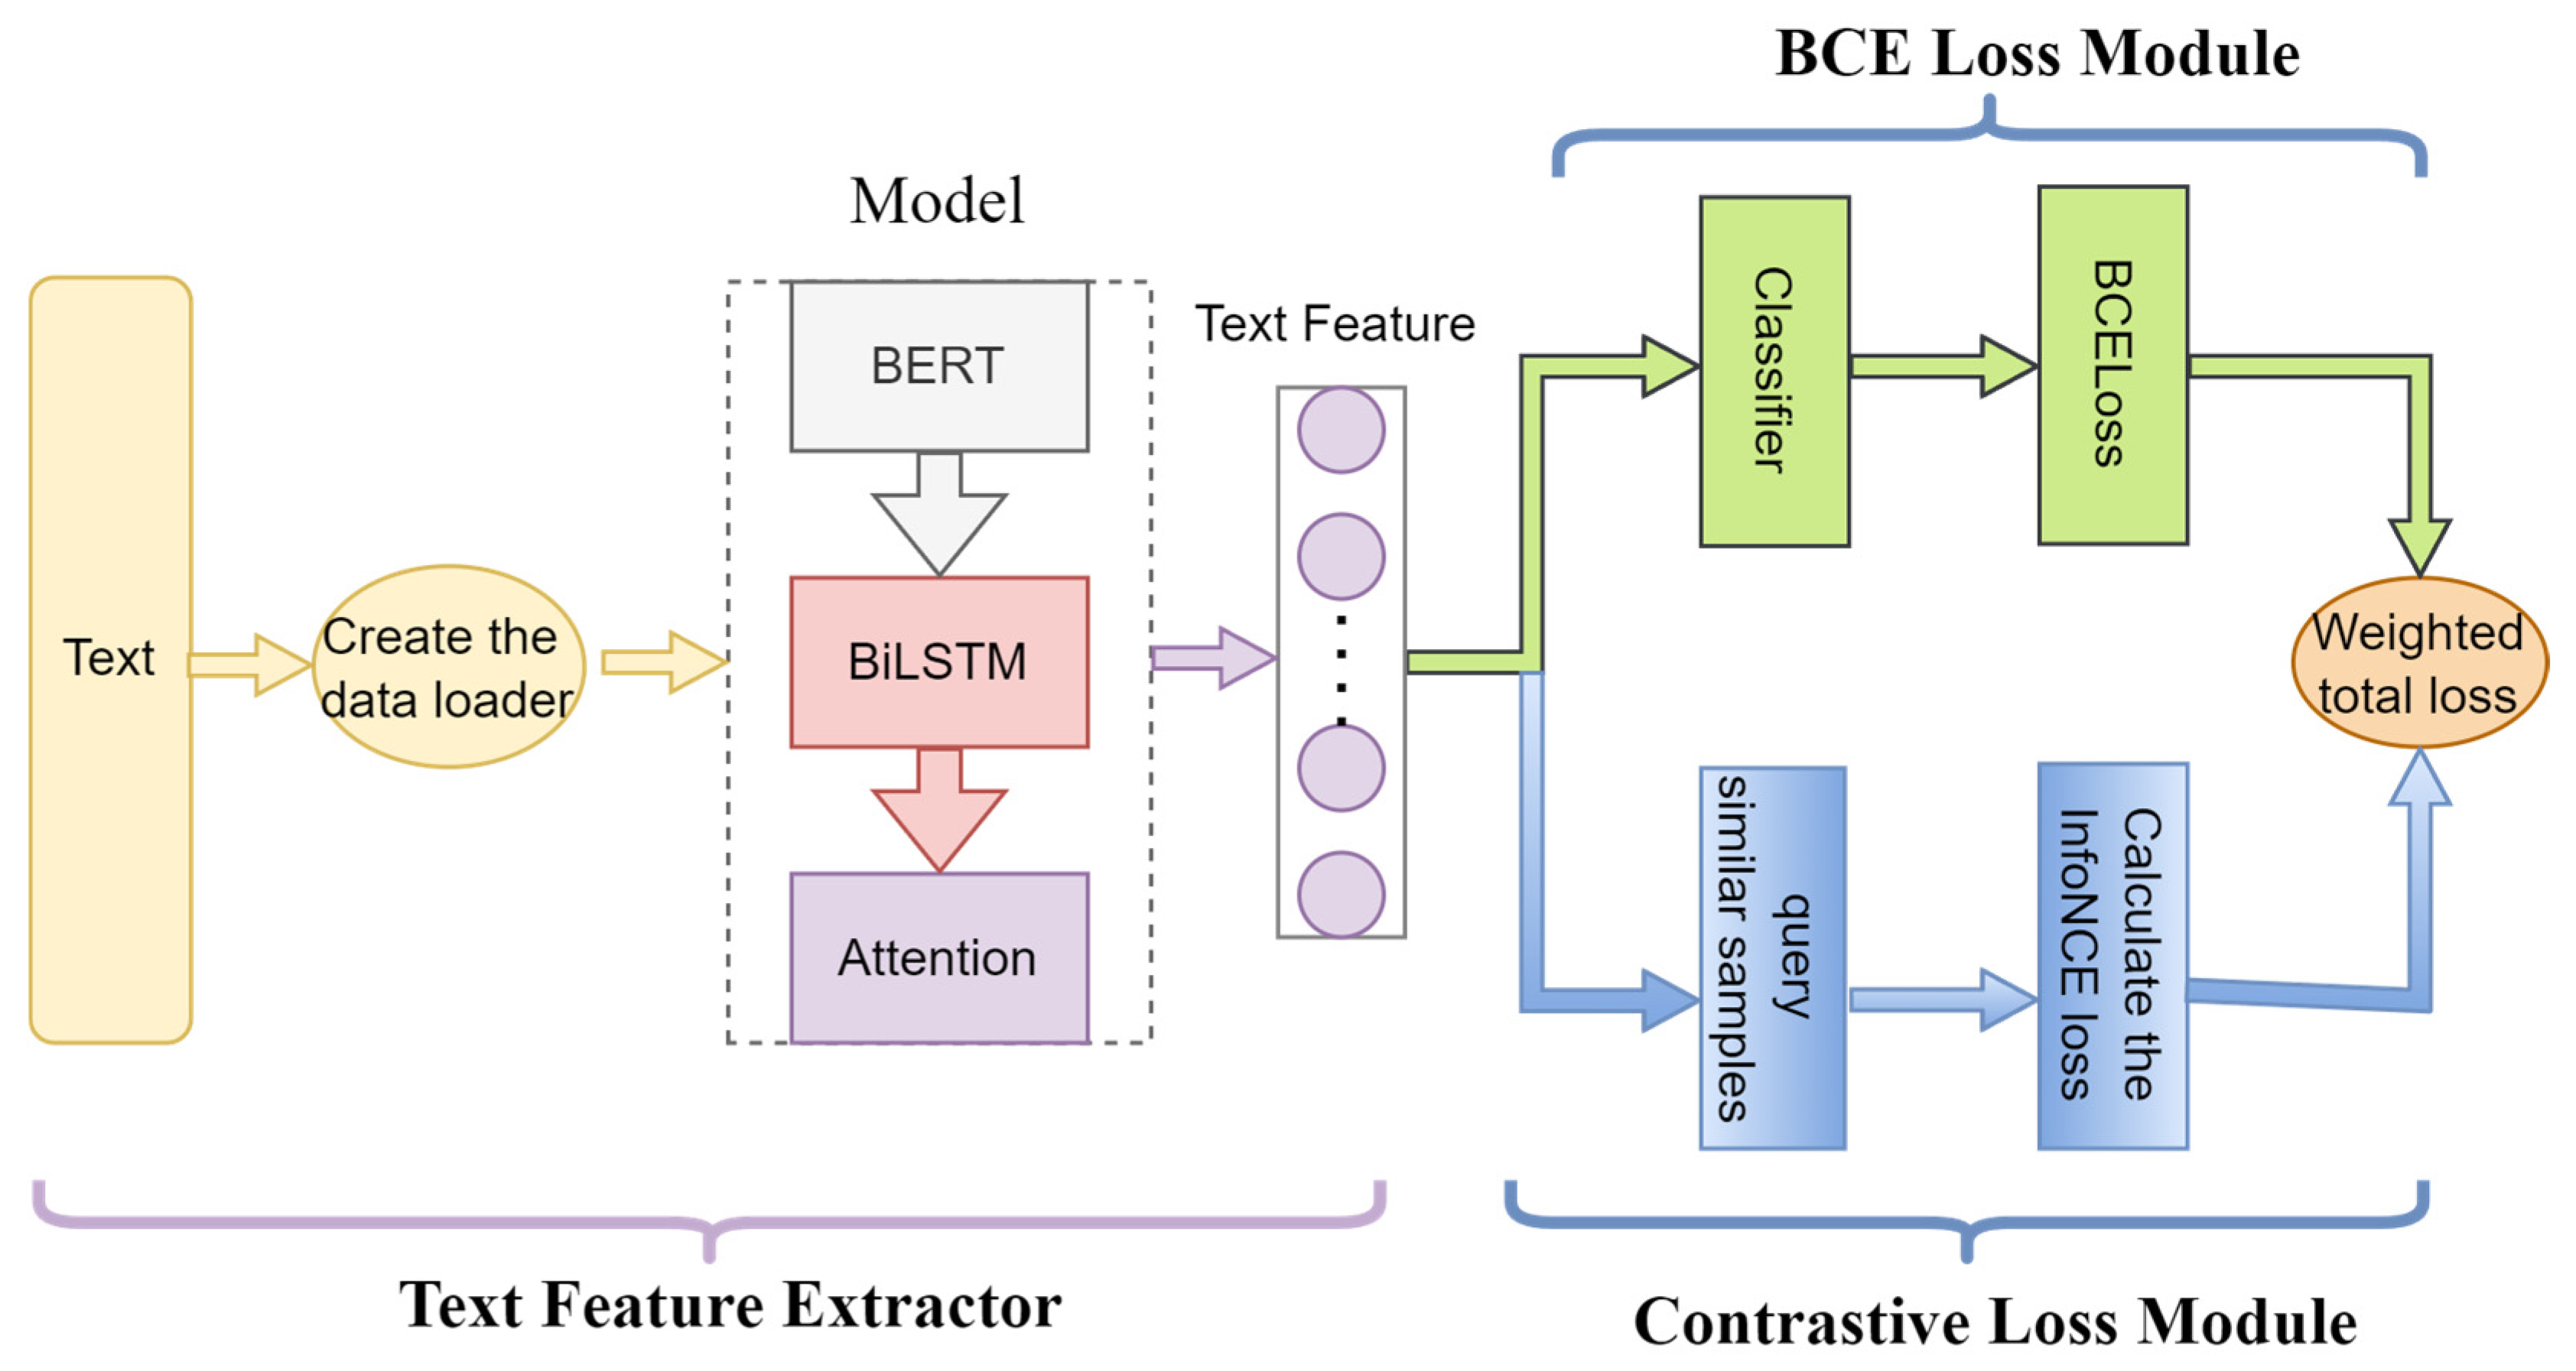
Figure 1. Architecture of the BBHL Model Based on Hybrid Loss Optimization.
Applsci 15 10028 g001
Figure 2. Performance comparison of six representative models on three datasets.
Applsci 15 10028 g002
Figure 3. Comparison of model performance with and without contrastive loss. In the figure, BBHL- (blue) represents the model without adding the contrastive loss, and BBHL (orange) represents the model with the contrastive loss added.
Applsci 15 10028 g003
Figure 4. Visualization of text feature representations. Figure (a) shows the scatter plot without the contrastive loss module added; Figure (b) shows the scatter plot with the contrastive loss module added.
Applsci 15 10028 g004
Figure 5. Performance comparison under different α values. Figure (a) presents the experimental results on the Twitter dataset; Figure (b) shows those on the Weibo dataset.
Applsci 15 10028 g005
Figure 6. Performance comparison of different Temperature values on the Twitter dataset.
Applsci 15 10028 g006
Figure 7. Training loss values. Figure (a) shows the training loss without adding the contrastive loss; Figure (b) shows the training loss with the contrastive loss added.
Applsci 15 10028 g007
Table 1. Statistics of the real data.
DatasetSourceRumorsNon-Rumors
Weibo DatasetCrawled from the False Information Reporting Platform of Sina Weibo1538 items1849 items
Twitter DatasetAll from tweets on the Twitter platform579 items576 items
Pheme DatasetDerived from tweets related to 9 breaking news events on the Twitter platform1067 items1067 items
Table 2. Performance comparison of main data collection methods.
DatasetMethodAccuracyPrecisionRecallF1
TwitterEANN0.81030.81280.80910.8094
MCNN0.86520.87980.86980.8698
CAFE0.87210.88340.86310.8729
DAMMFND0.90730.91580.90680.9113
BBHL-0.89630.93130.85630.8922
BBHL0.91070.95540.86210.9063
WeiboEANN0.80580.80020.80380.8016
MCNN0.87120.87620.89320.8846
CAFE0.88340.87560.89320.8854
DAMMFND0.90680.91320.92180.9176
BBHL-0.90690.90680.93040.9185
BBHL0.91180.91450.93040.9224
PhemeEANN0.83180.83020.82950.8298
MCNN0.81070.79810.81730.8076
CAFE0.80560.83450.81240.8233
DAMMFND0.85780.85340.86340.8584
BBHL-0.84690.85630.85120.8537
BBHL0.86410.86510.87800.8715
Table 3. Robustness Verification via 5-Fold Cross-Validation of BBHL Model on Three Datasets.
DatasetAccPreRecallF1
Twitter0.93 ± 0.020.94 ± 0.020.91 ± 0.040.93 ± 0.03
(0.91–0.95)(0.92–0.96)(0.87–0.95)(0.90–0.96)
Weibo0.90 ± 0.020.92 ± 0.020.89 ± 0.030.90 ± 0.02
(0.88–0.92)(0.90–0.94)(0.86–0.92)(0.88–0.92)
Pheme0.85 ± 0.020.85 ± 0.020.87 ± 0.020.86 ± 0.02
(0.83–0.87)(0.83–0.87)(0.85–0.89)(0.84–0.88)
Disclaimer/Publisher’s Note: The statements, opinions and data contained in all publications are solely those of the individual author(s) and contributor(s) and not of MDPI and/or the editor(s). MDPI and/or the editor(s) disclaim responsibility for any injury to people or property resulting from any ideas, methods, instructions or products referred to in the content.