Research on Navigation Risks in Waterway Tunnels Based on Measurement of the Cognitive Load of Ship Officers
Abstract
1. Introduction
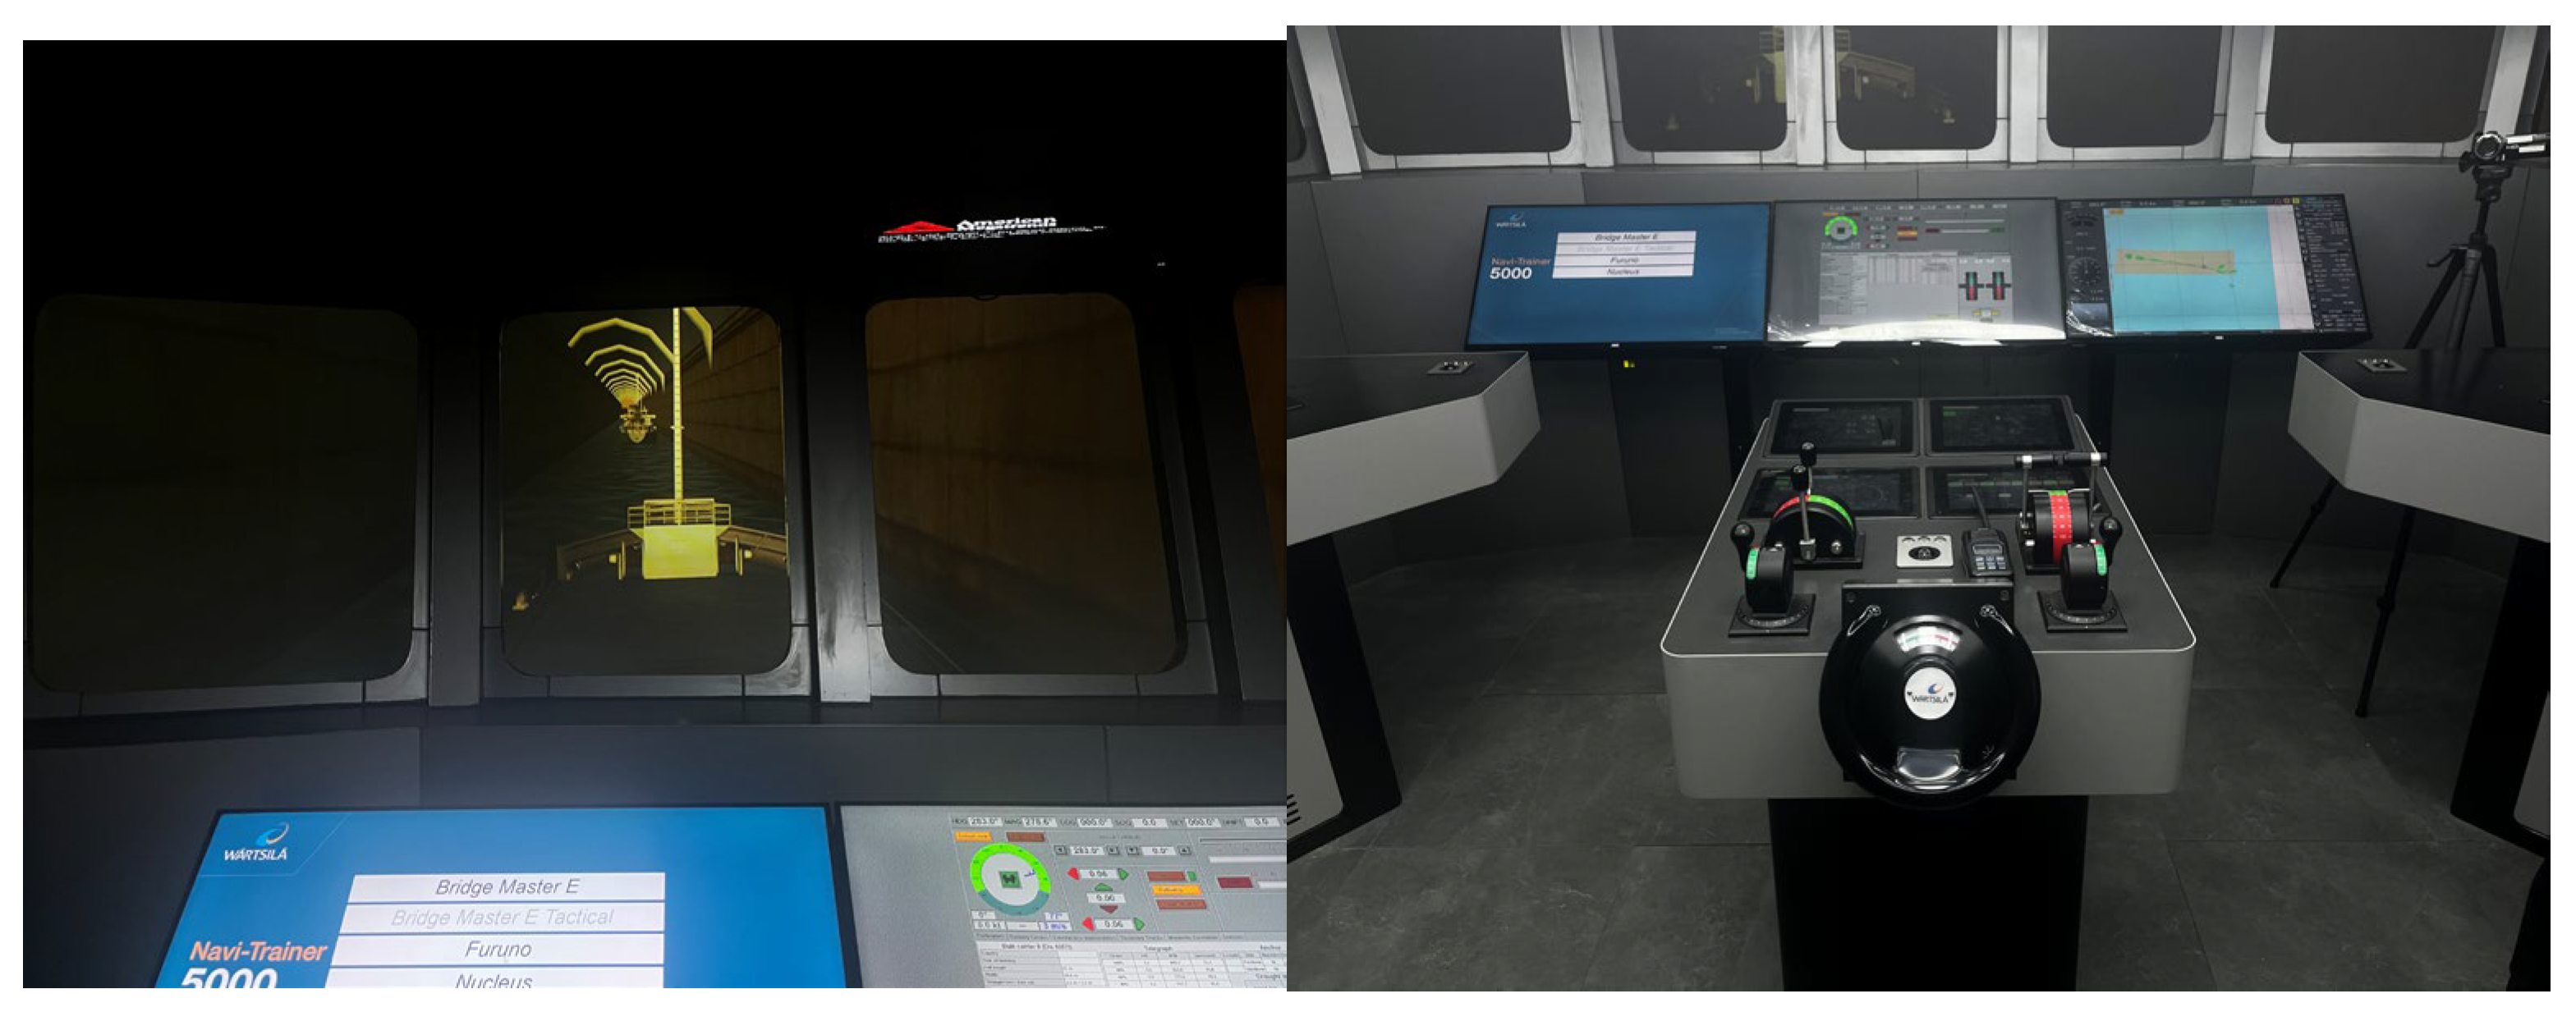
2. Construction of Ship Maneuvering Simulation Scene
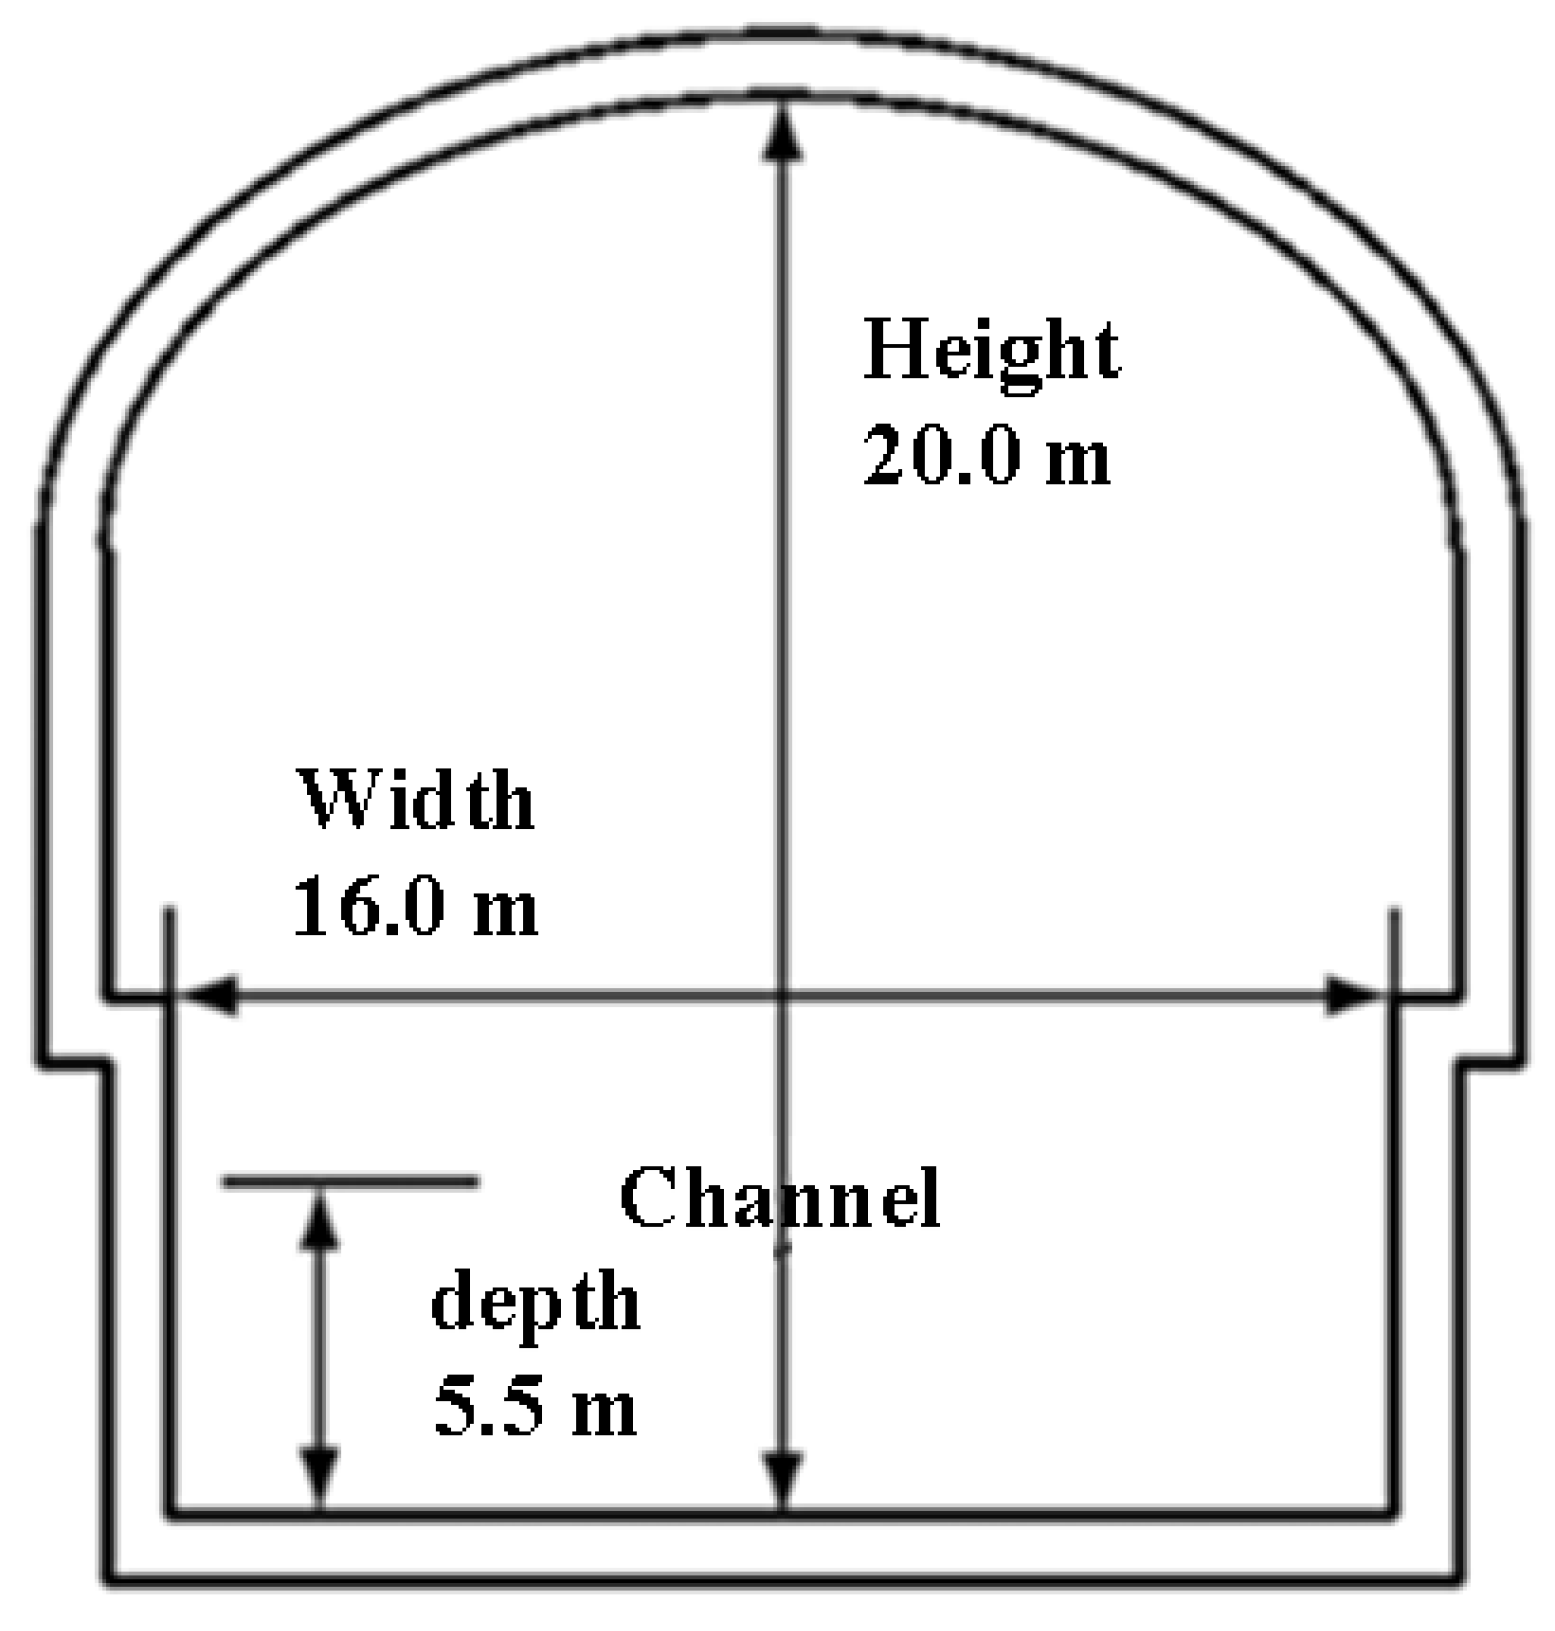
2.1. Visual Scene Modeling of Waterway Tunnel
2.2. Representative Ship Model
3. Design and Implementation of Psychological Monitoring Experiment
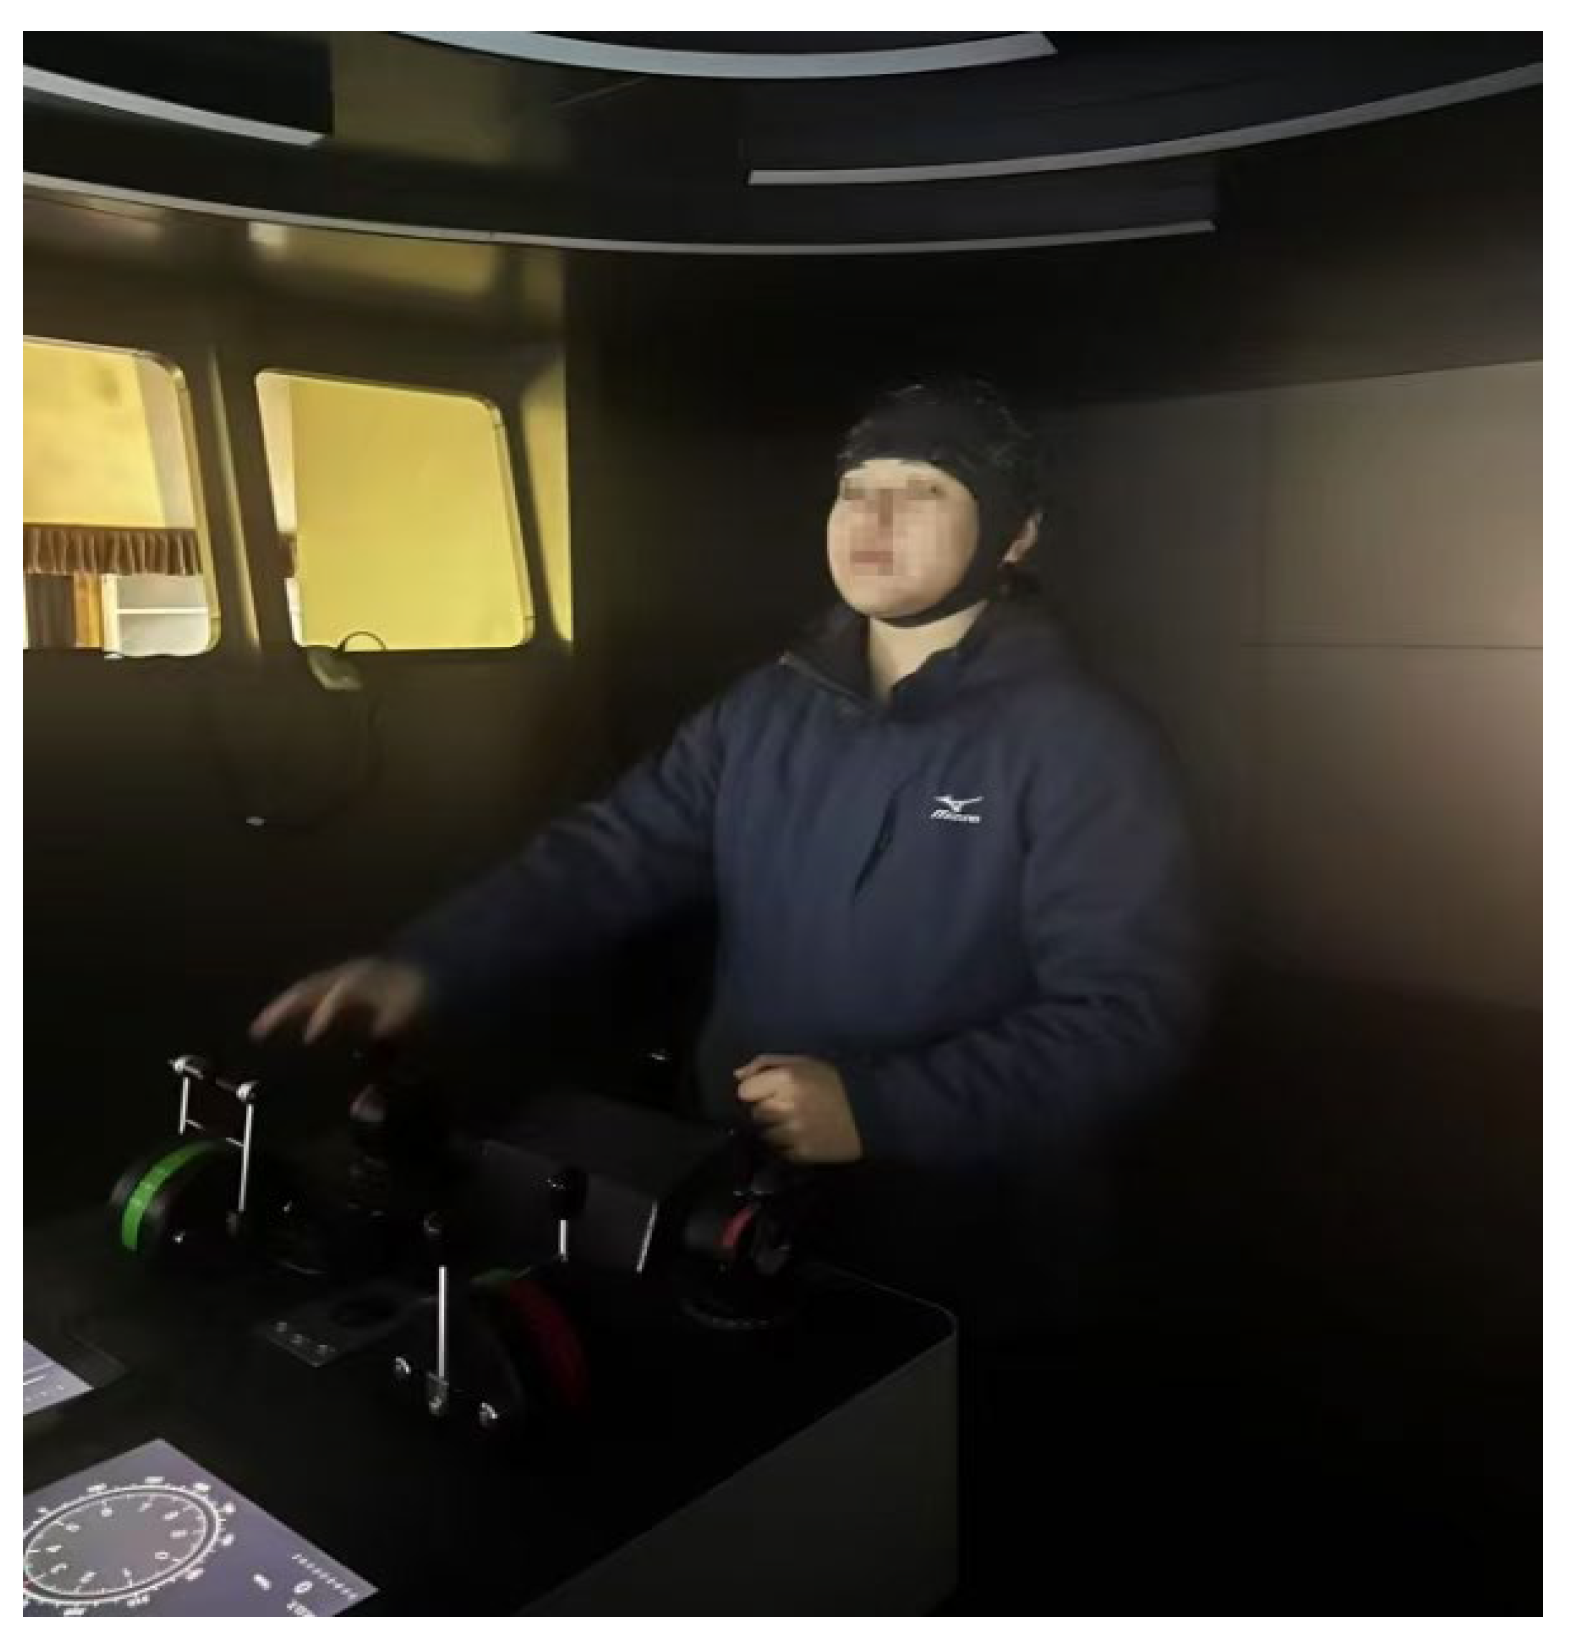
3.1. Preparation of Monitoring Equipment
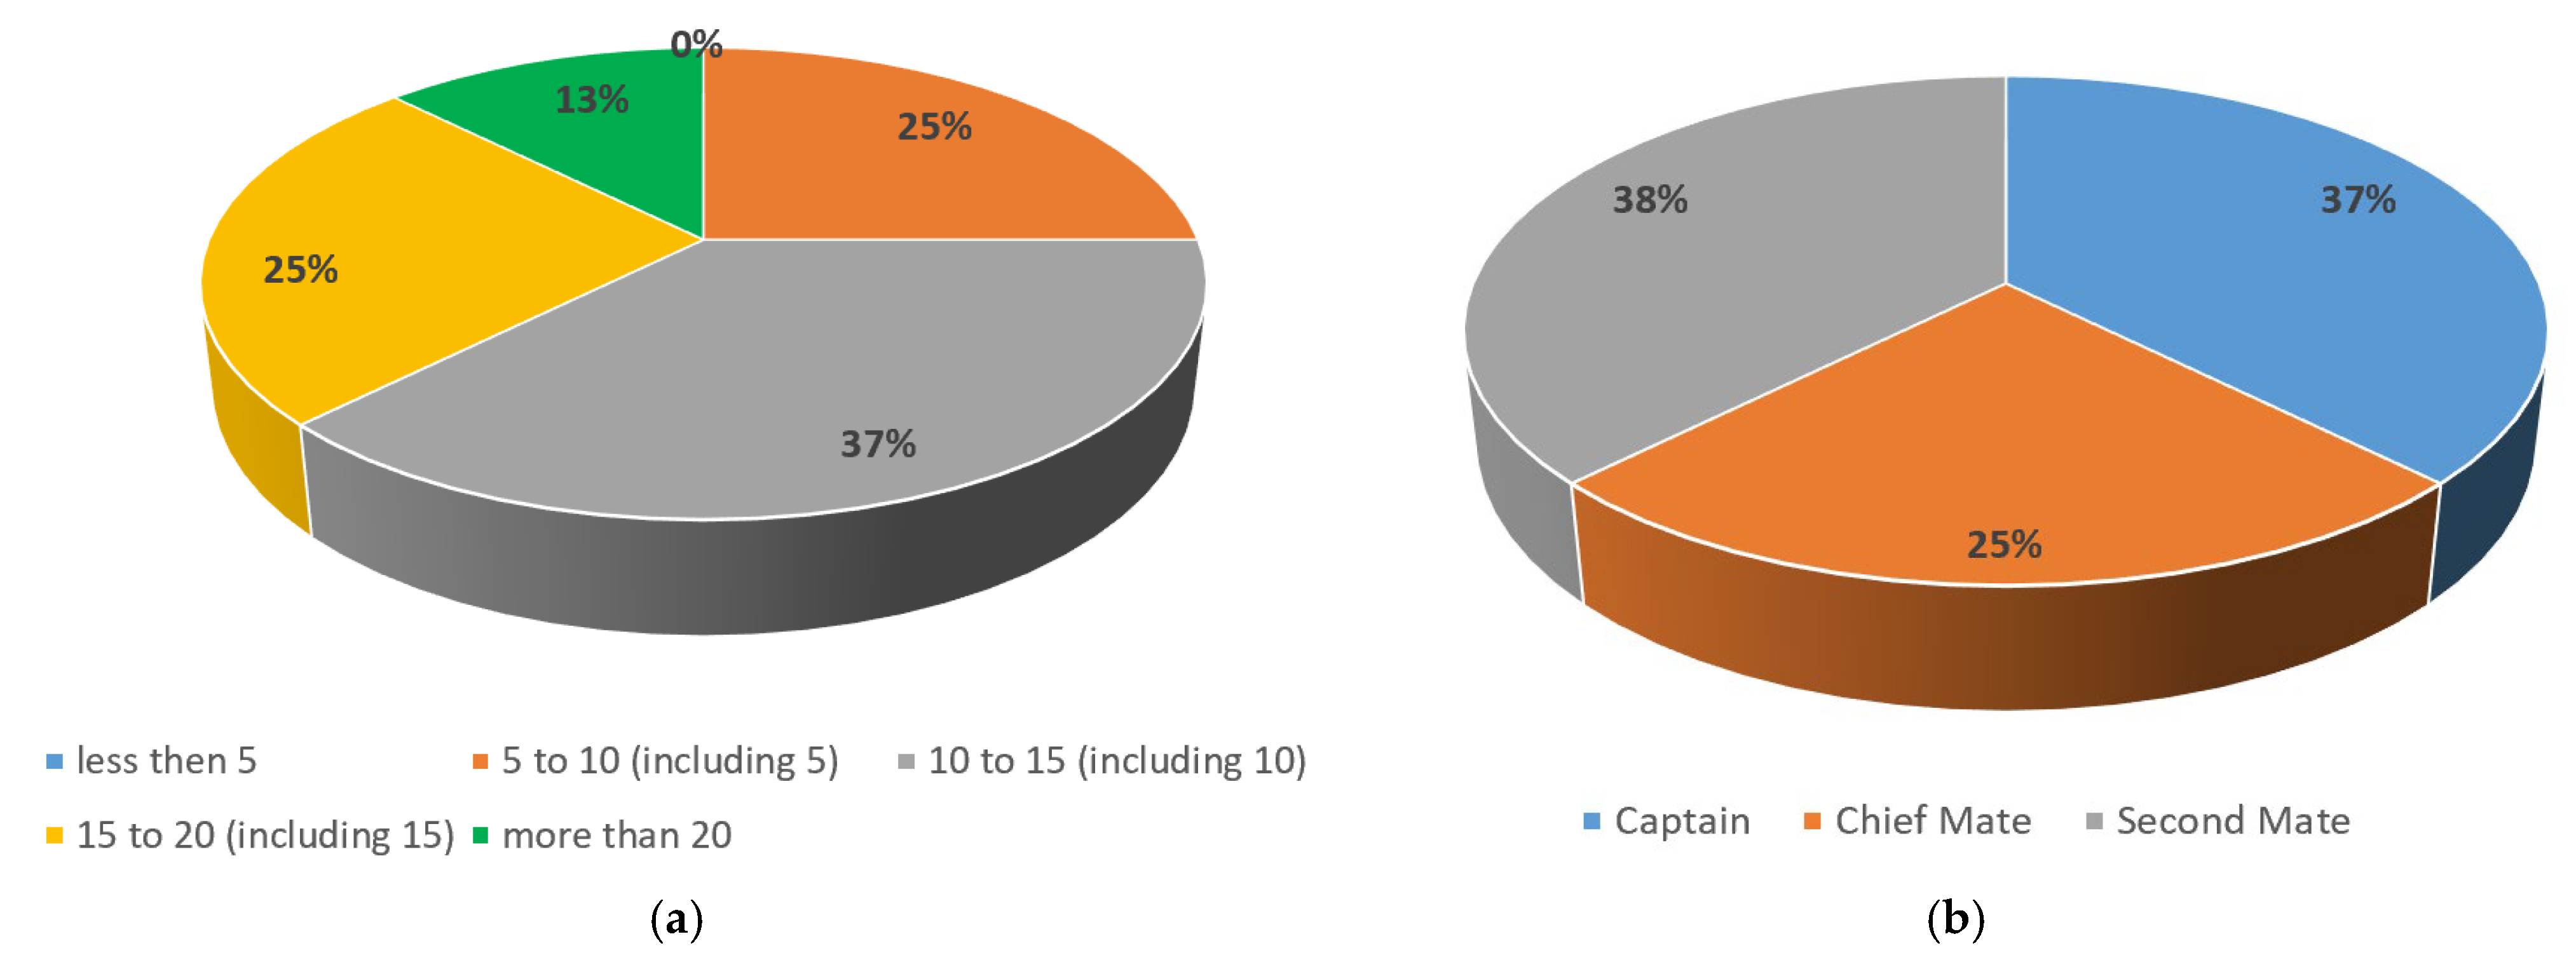
3.2. Preparation of Experimenters
3.3. Experimental Condition Settings
4. Analysis of Physiological Characteristics and Navigational Behavior
4.1. EEG Indicator Variations
4.2. ECG Indicator Variations
- (1)
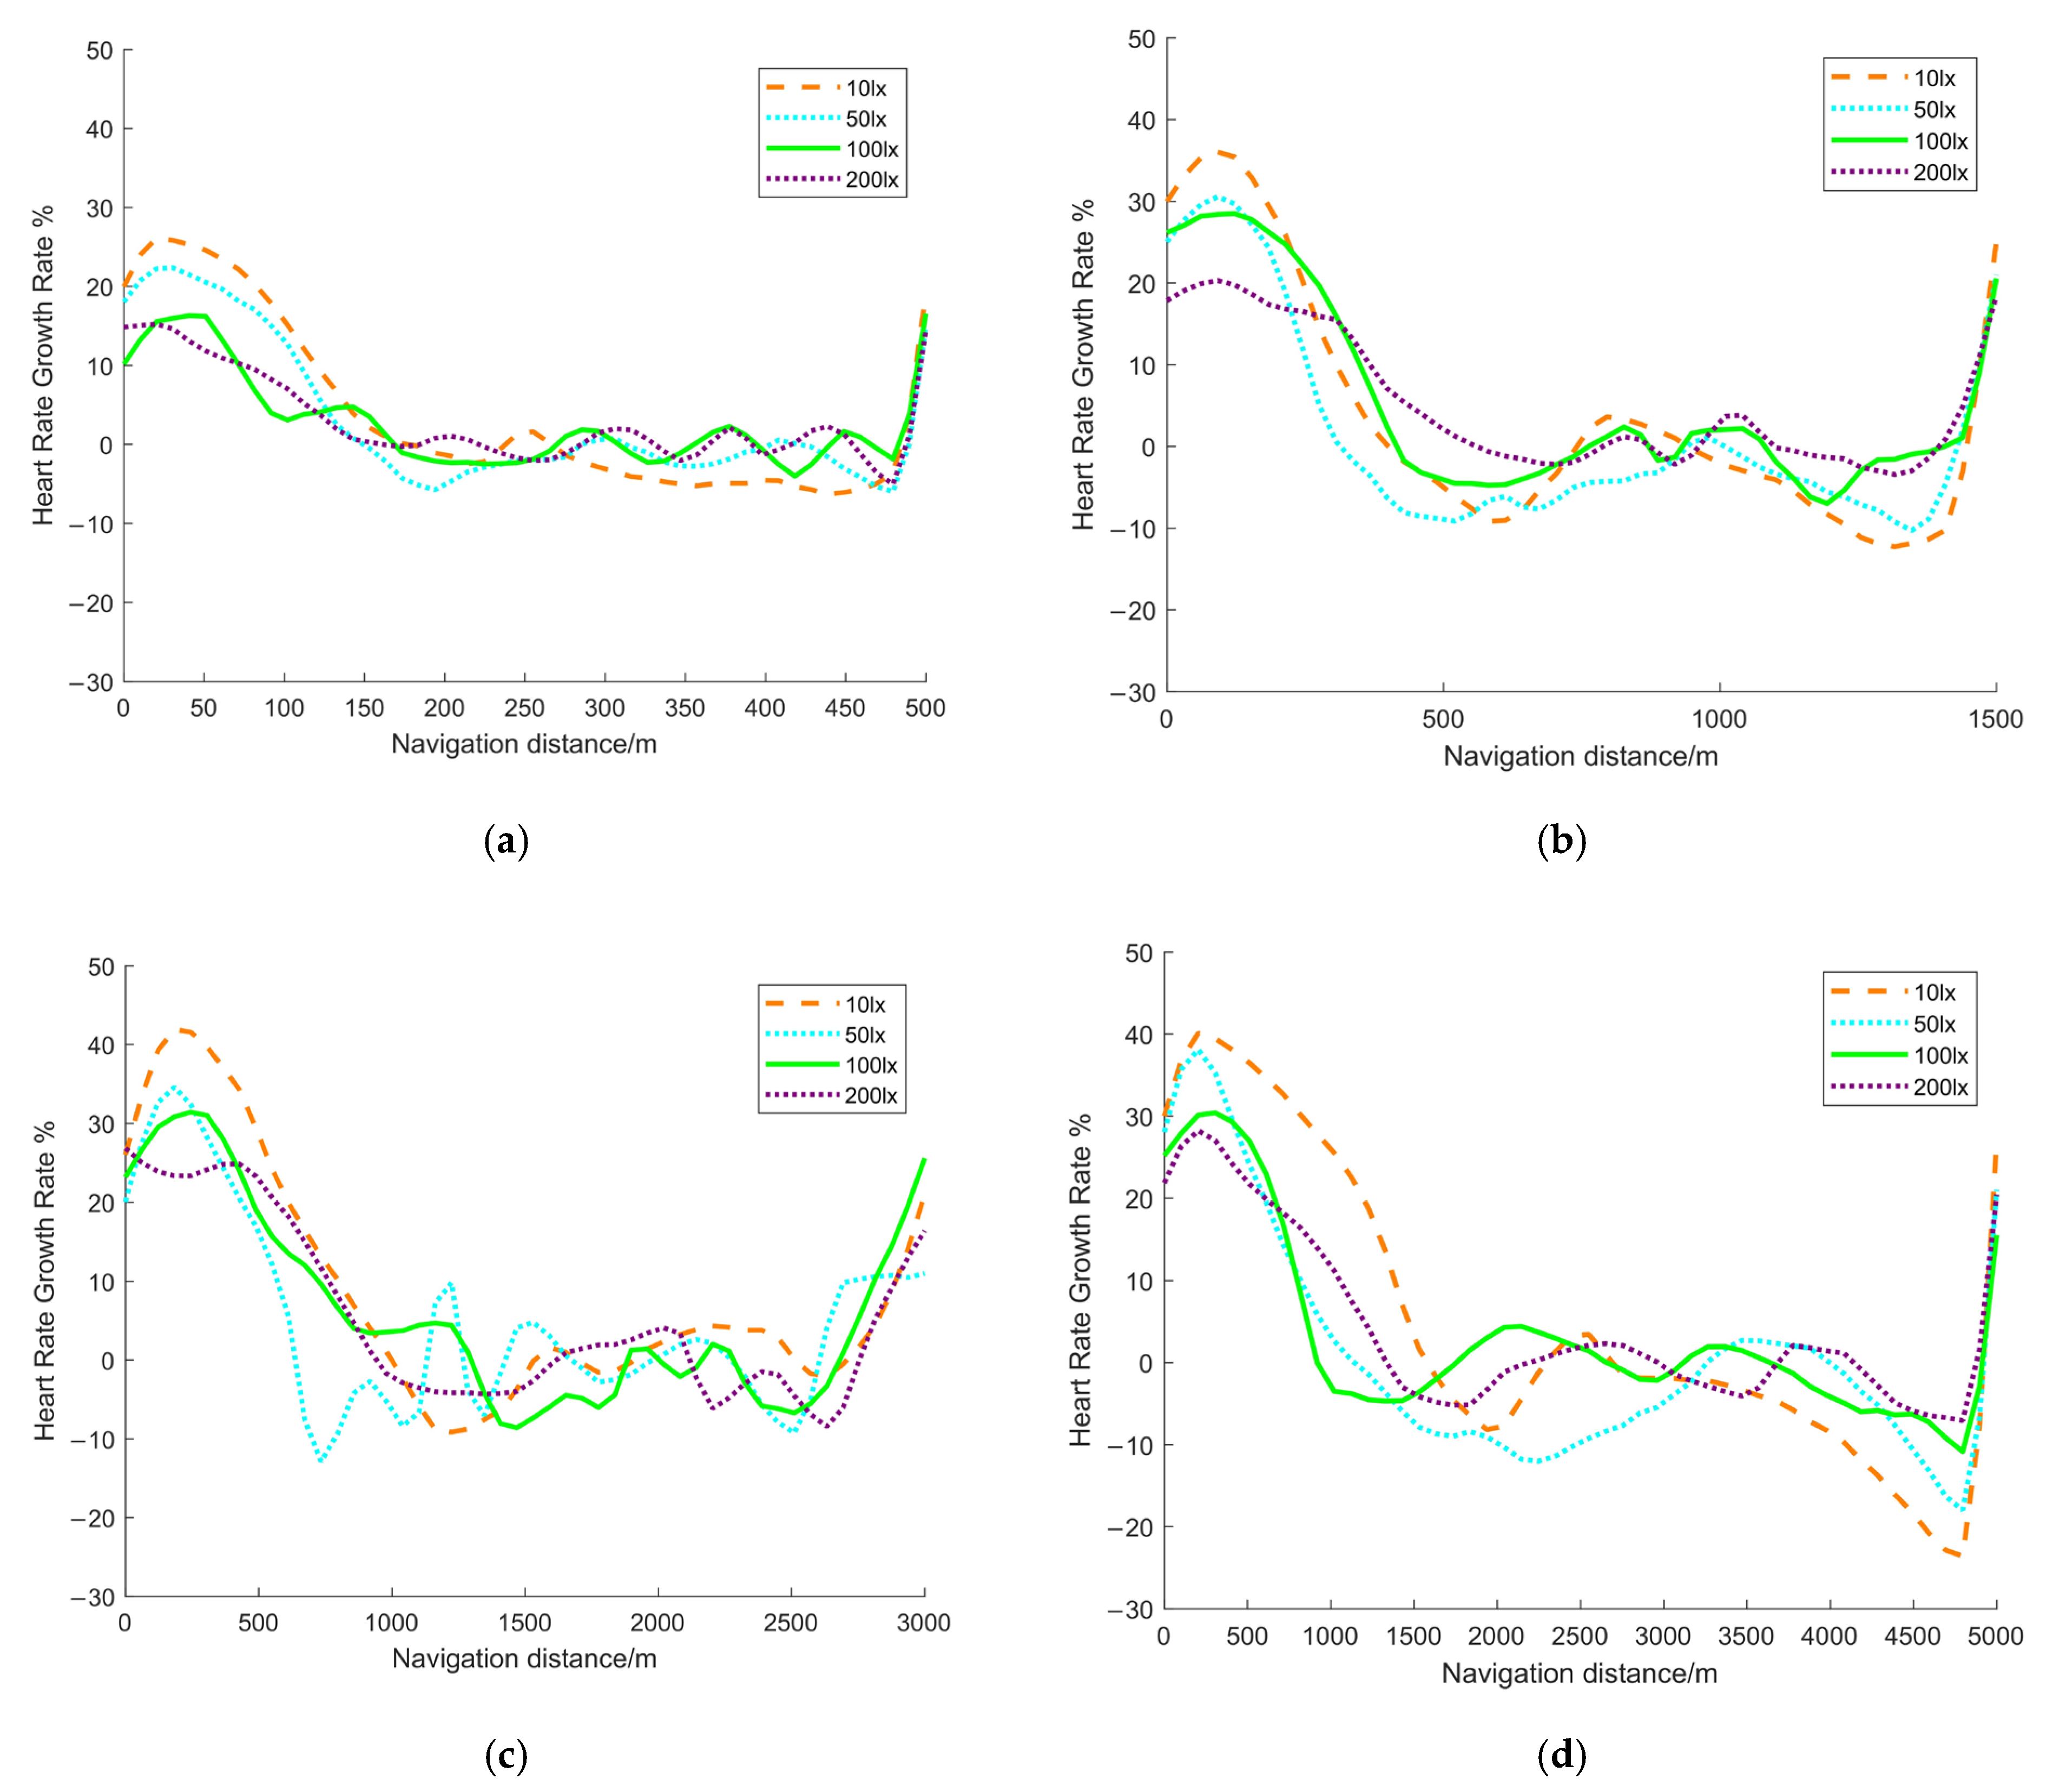
- Heart rate growth rate (HRGR)
- (2)
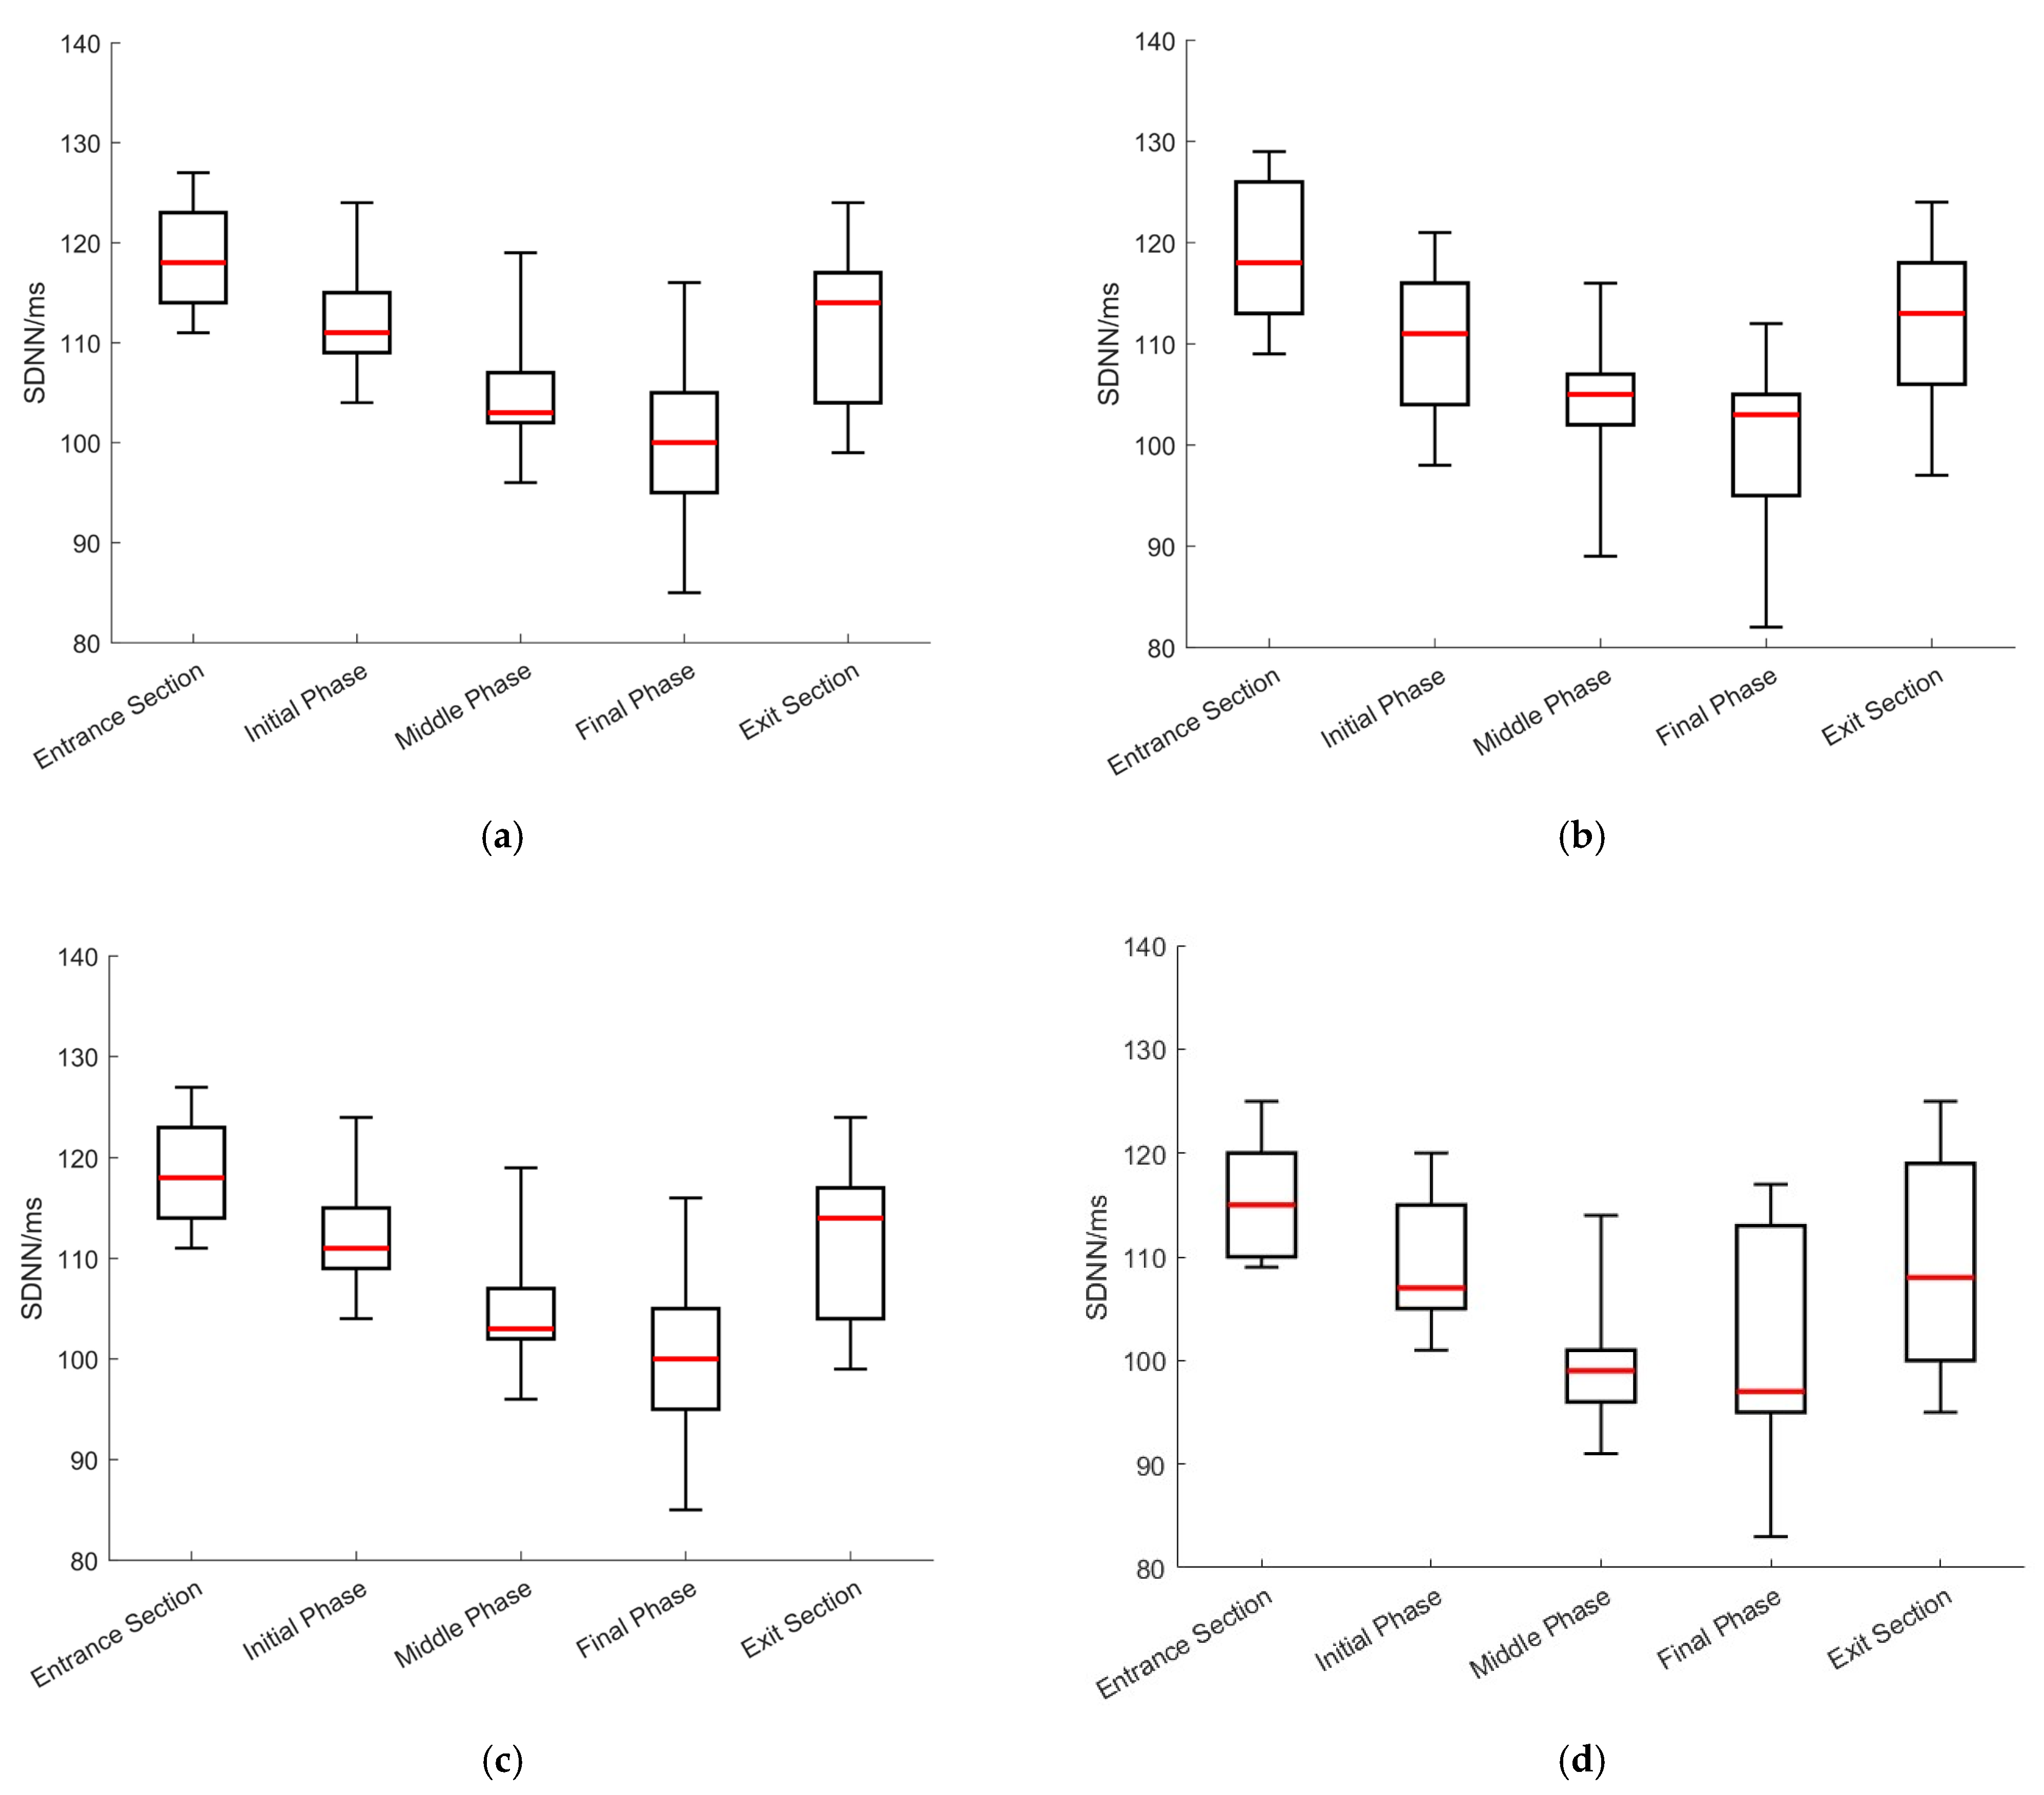
- Variations in SDNN
- (3)
- Variations in RMSSD
5. Construction and Validation of Cognitive Load Quantification Model
6. Determination of Risk Zones Based on Cognitive Load Measurement
6.1. Analysis Methodology of Navigation Risk Zone Classification
- (1)
- Data preparation and indicator selection
- (2)
- Data standardization and entropy weight calculation
- (3)
- Closeness and risk score calculation
- (4)
- Risk level classification and spatial visualization
6.2. Calculation of Navigation Risk Values
6.3. Classification of Navigation Risk Zone for Tunnels of Different Lengths
- (1)
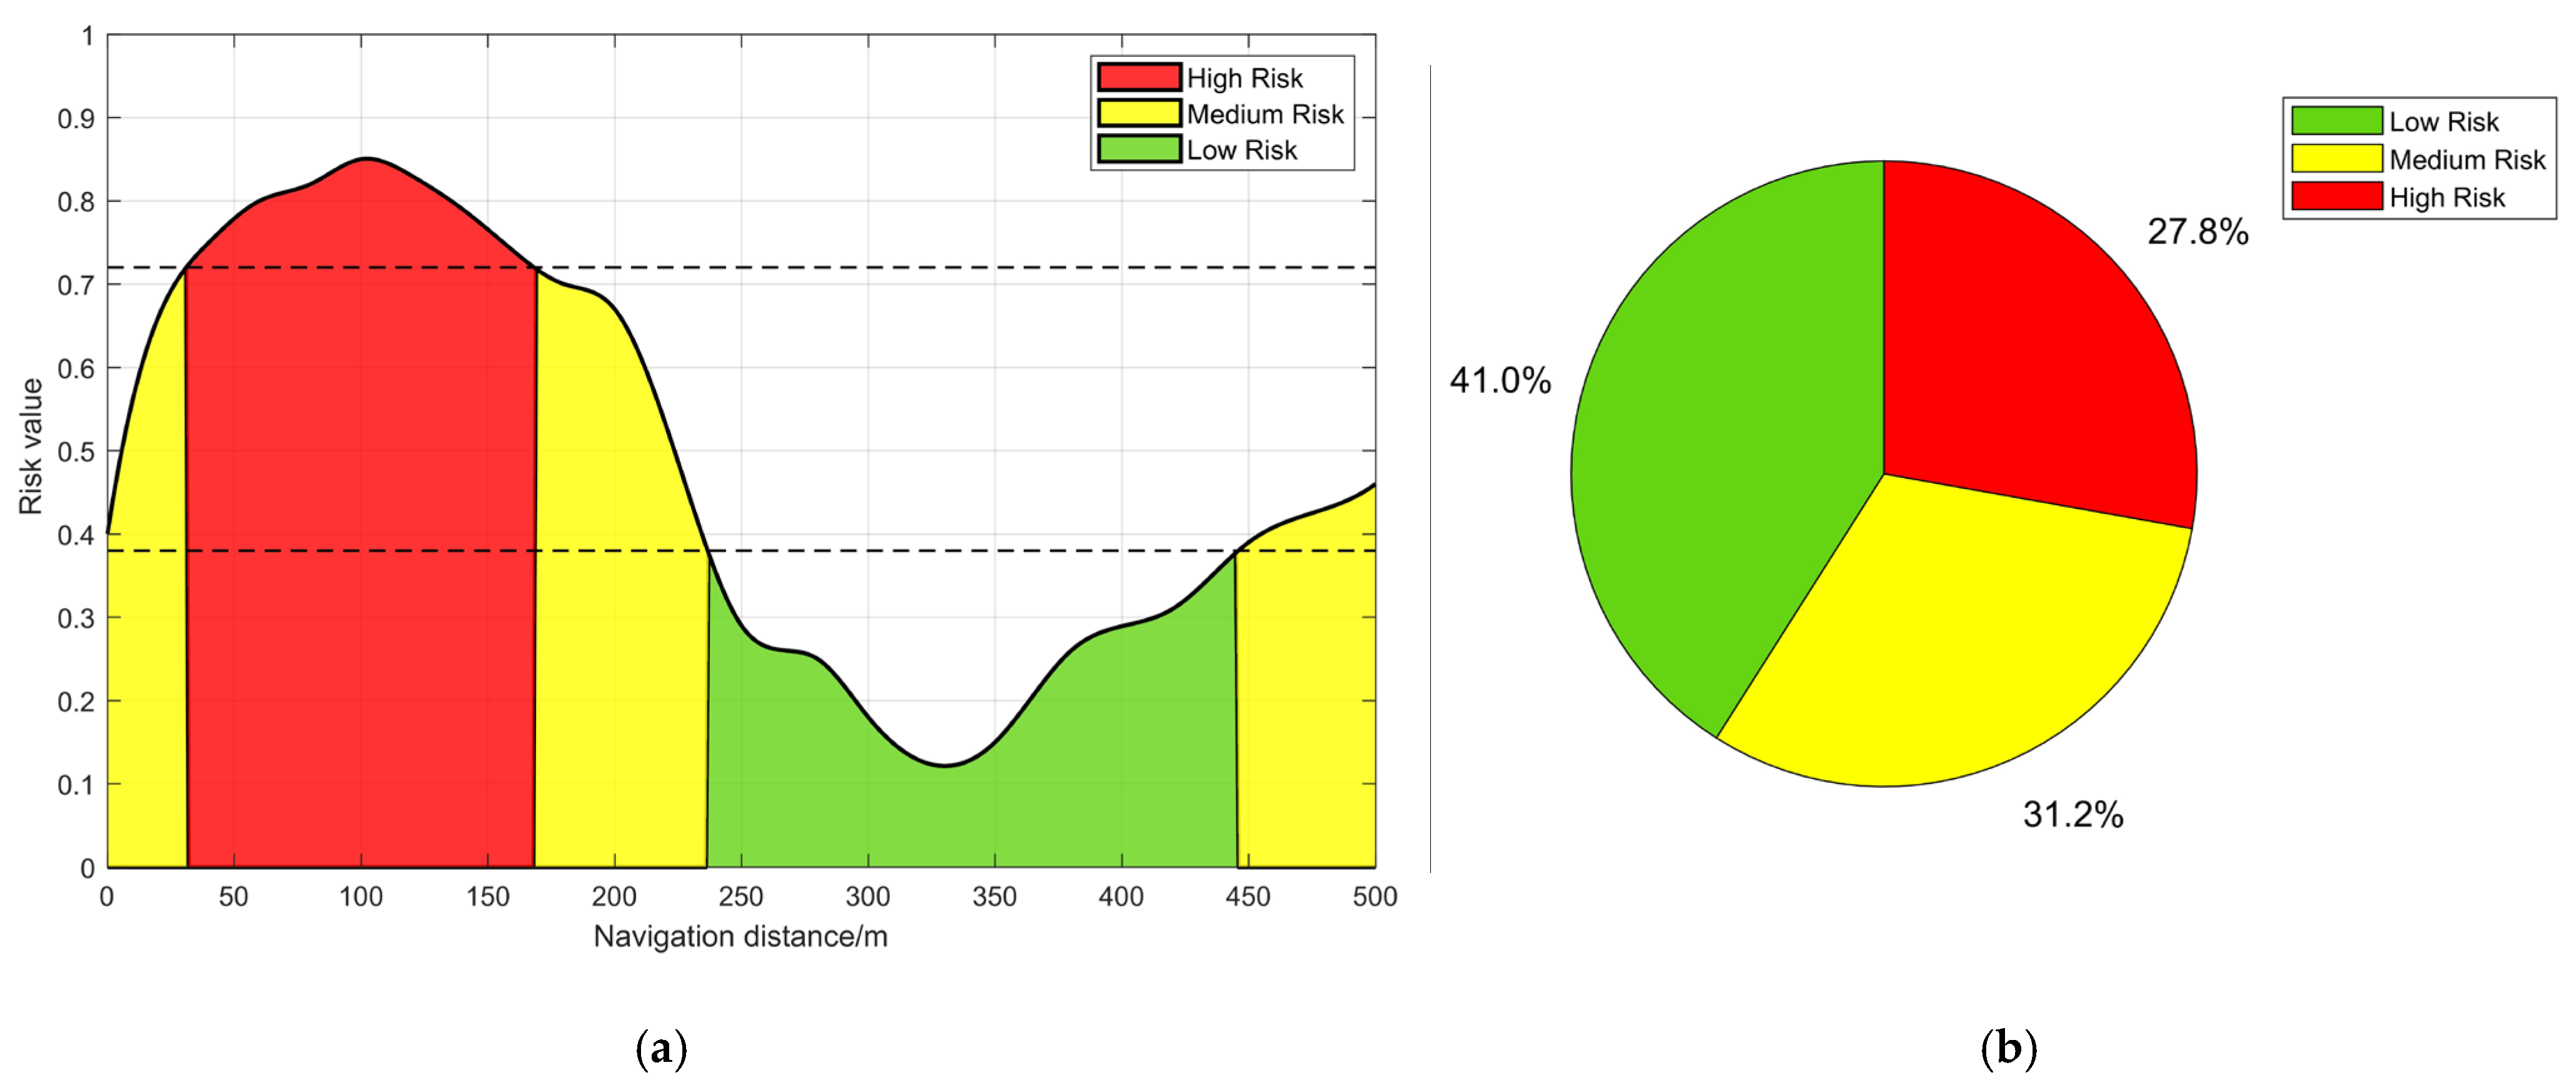
- Analysis of risk zones in 500 m tunnel
- (2)
- Analysis of risk zones in 1500 m tunnel
- (3)
- Analysis of risk zones in 3000 m tunnel
- (4)
- Analysis of risk zones in 5000 m tunnel
7. Conclusions and Discussion
- (1)
- The impact of changes in tunnel length on the physiological characteristics of a ship officer is reflected in the accumulation of fatigue and work load caused by changes in navigation time. Increasing the tunnel length prolongs the time navigating a monotonous environment in the internal section, and the fatigue accumulation effect initially appears, leading to an increase in EEG theta waves and cumulative changes in heart rate and heart rate variability. The impact of changes in tunnel illumination on the physiological characteristics of the ship officer is reflected in high-contrast visual stimuli and immediate stress responses during the entrance and exit sections of tunnel. Poor illumination leads to an increase in EEG beta waves in physiological indicators, rapid fluctuations in heart rate, inhibition of parasympathetic nervous activity, and short-term imbalance in heart rate variability. Especially in long tunnels over 3000 m and with dim illumination below 50 lx, the increase in cognitive load is particularly significant, reflecting the typical characteristics of induced risk effects in ultra-long tunnels.
- (2)
- Based on the structural segmentation of the tunnel entrance section, internal section, and exit section, combined with the time series evolution of risk indicators, it is found that ship officers had significant stress responses in the tunnel entrance section, with significant fluctuations in physiological indicators and a rapid increase in cognitive load. The cognitive load of the tunnel is relatively stable, but it remains consistently high in the ultra-long tunnel. The exit section of the tunnel exhibits a certain degree of relaxation. Under tunnels of different lengths, there are significant differences in the peak risk and cognitive load response time points of each segment, indicating that the design of navigation tunnel length has an important impact on the phased load distribution of the ship officer’s navigation process.
- (3)
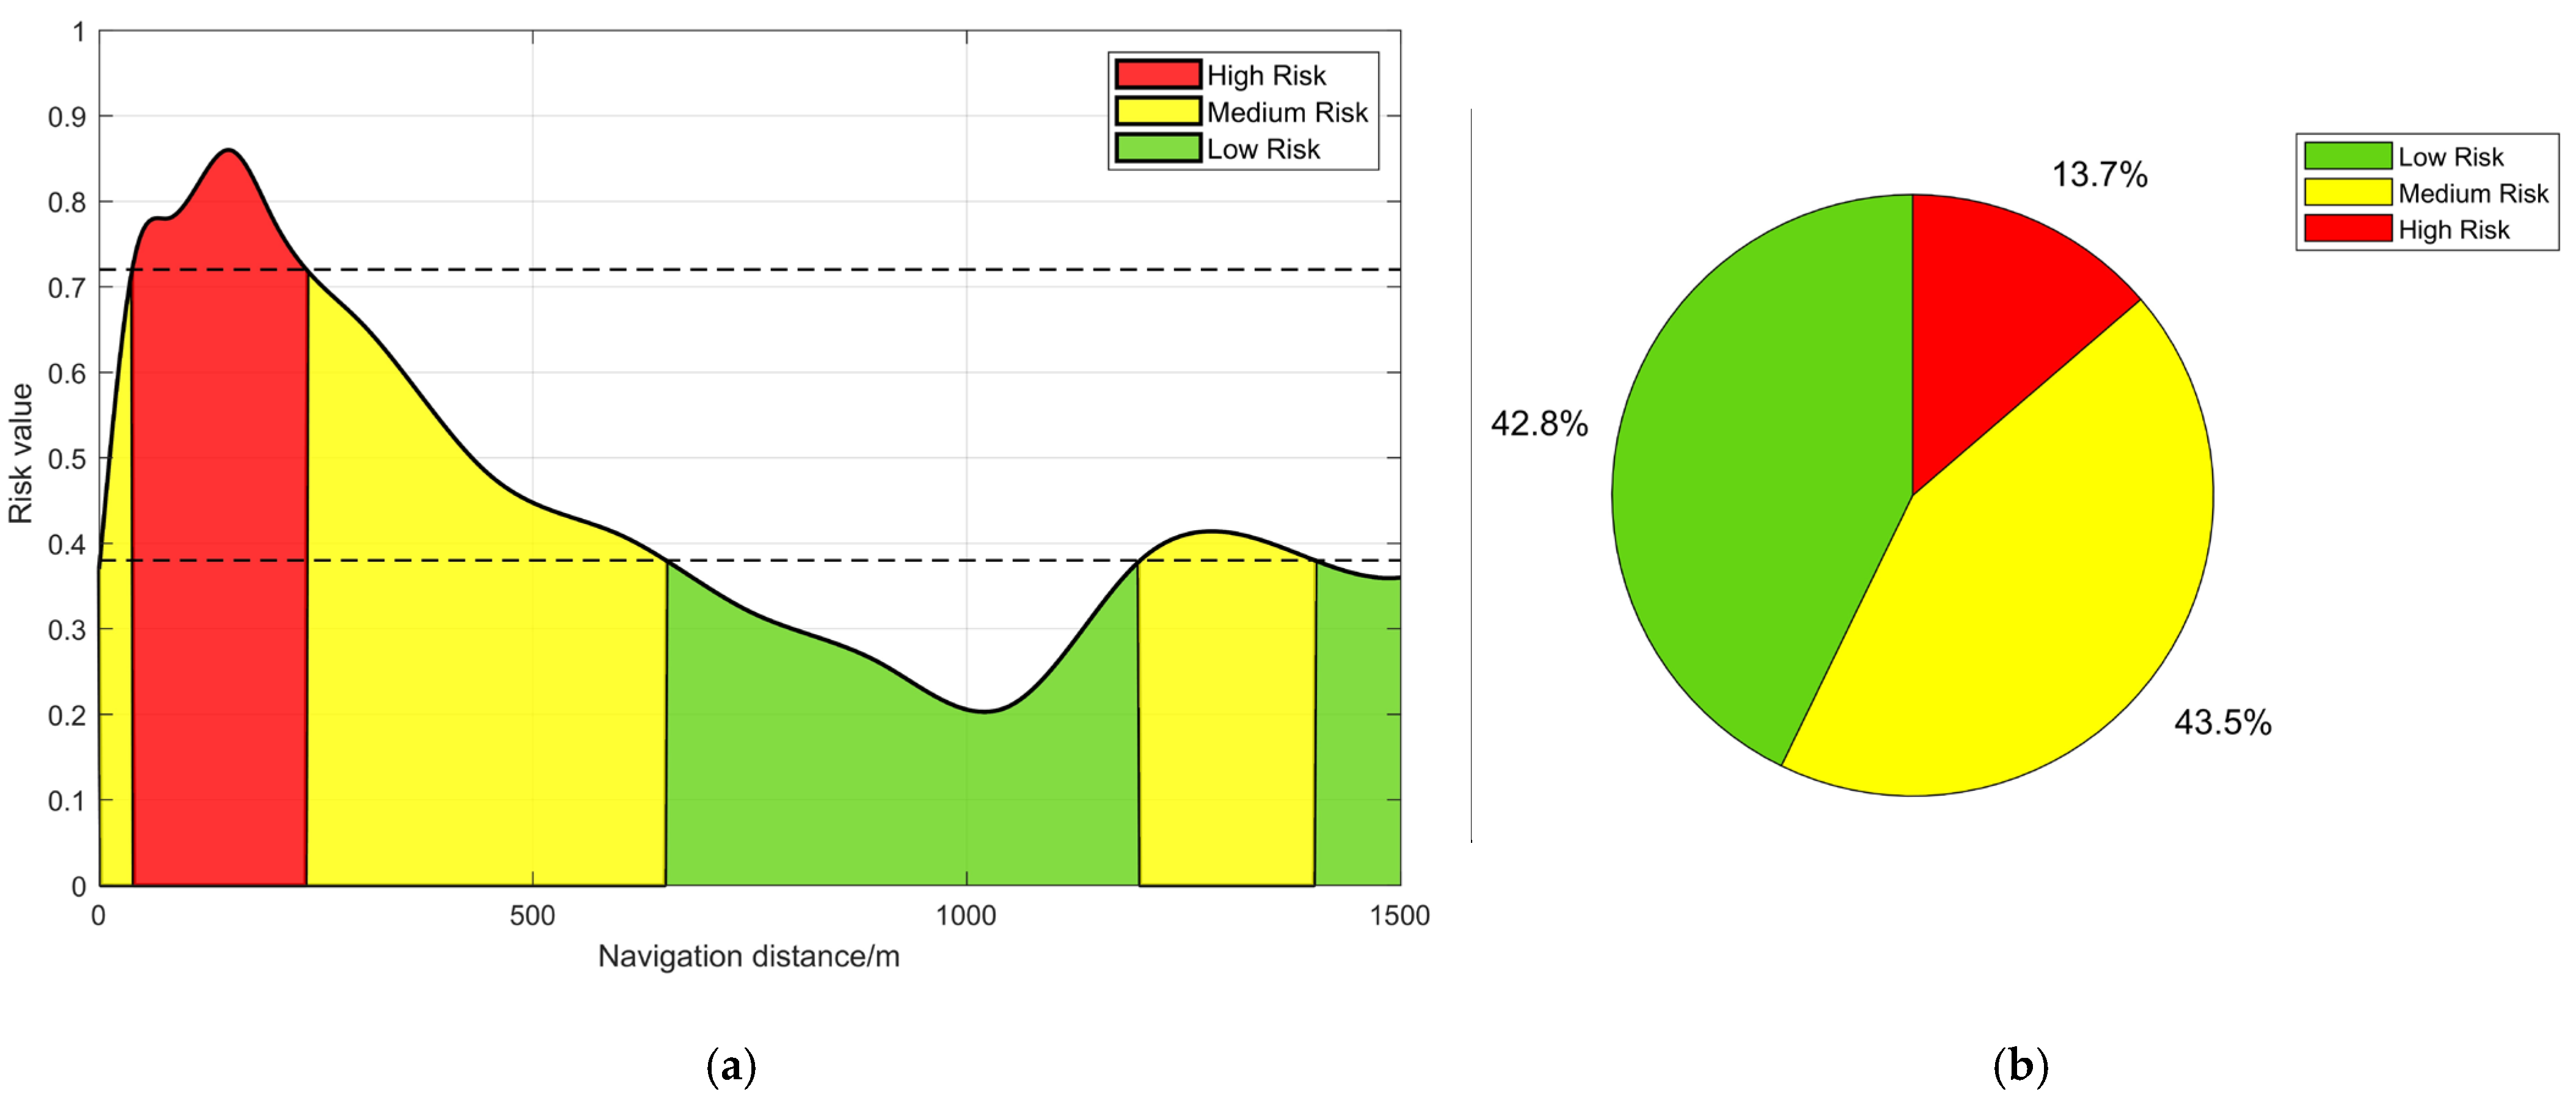
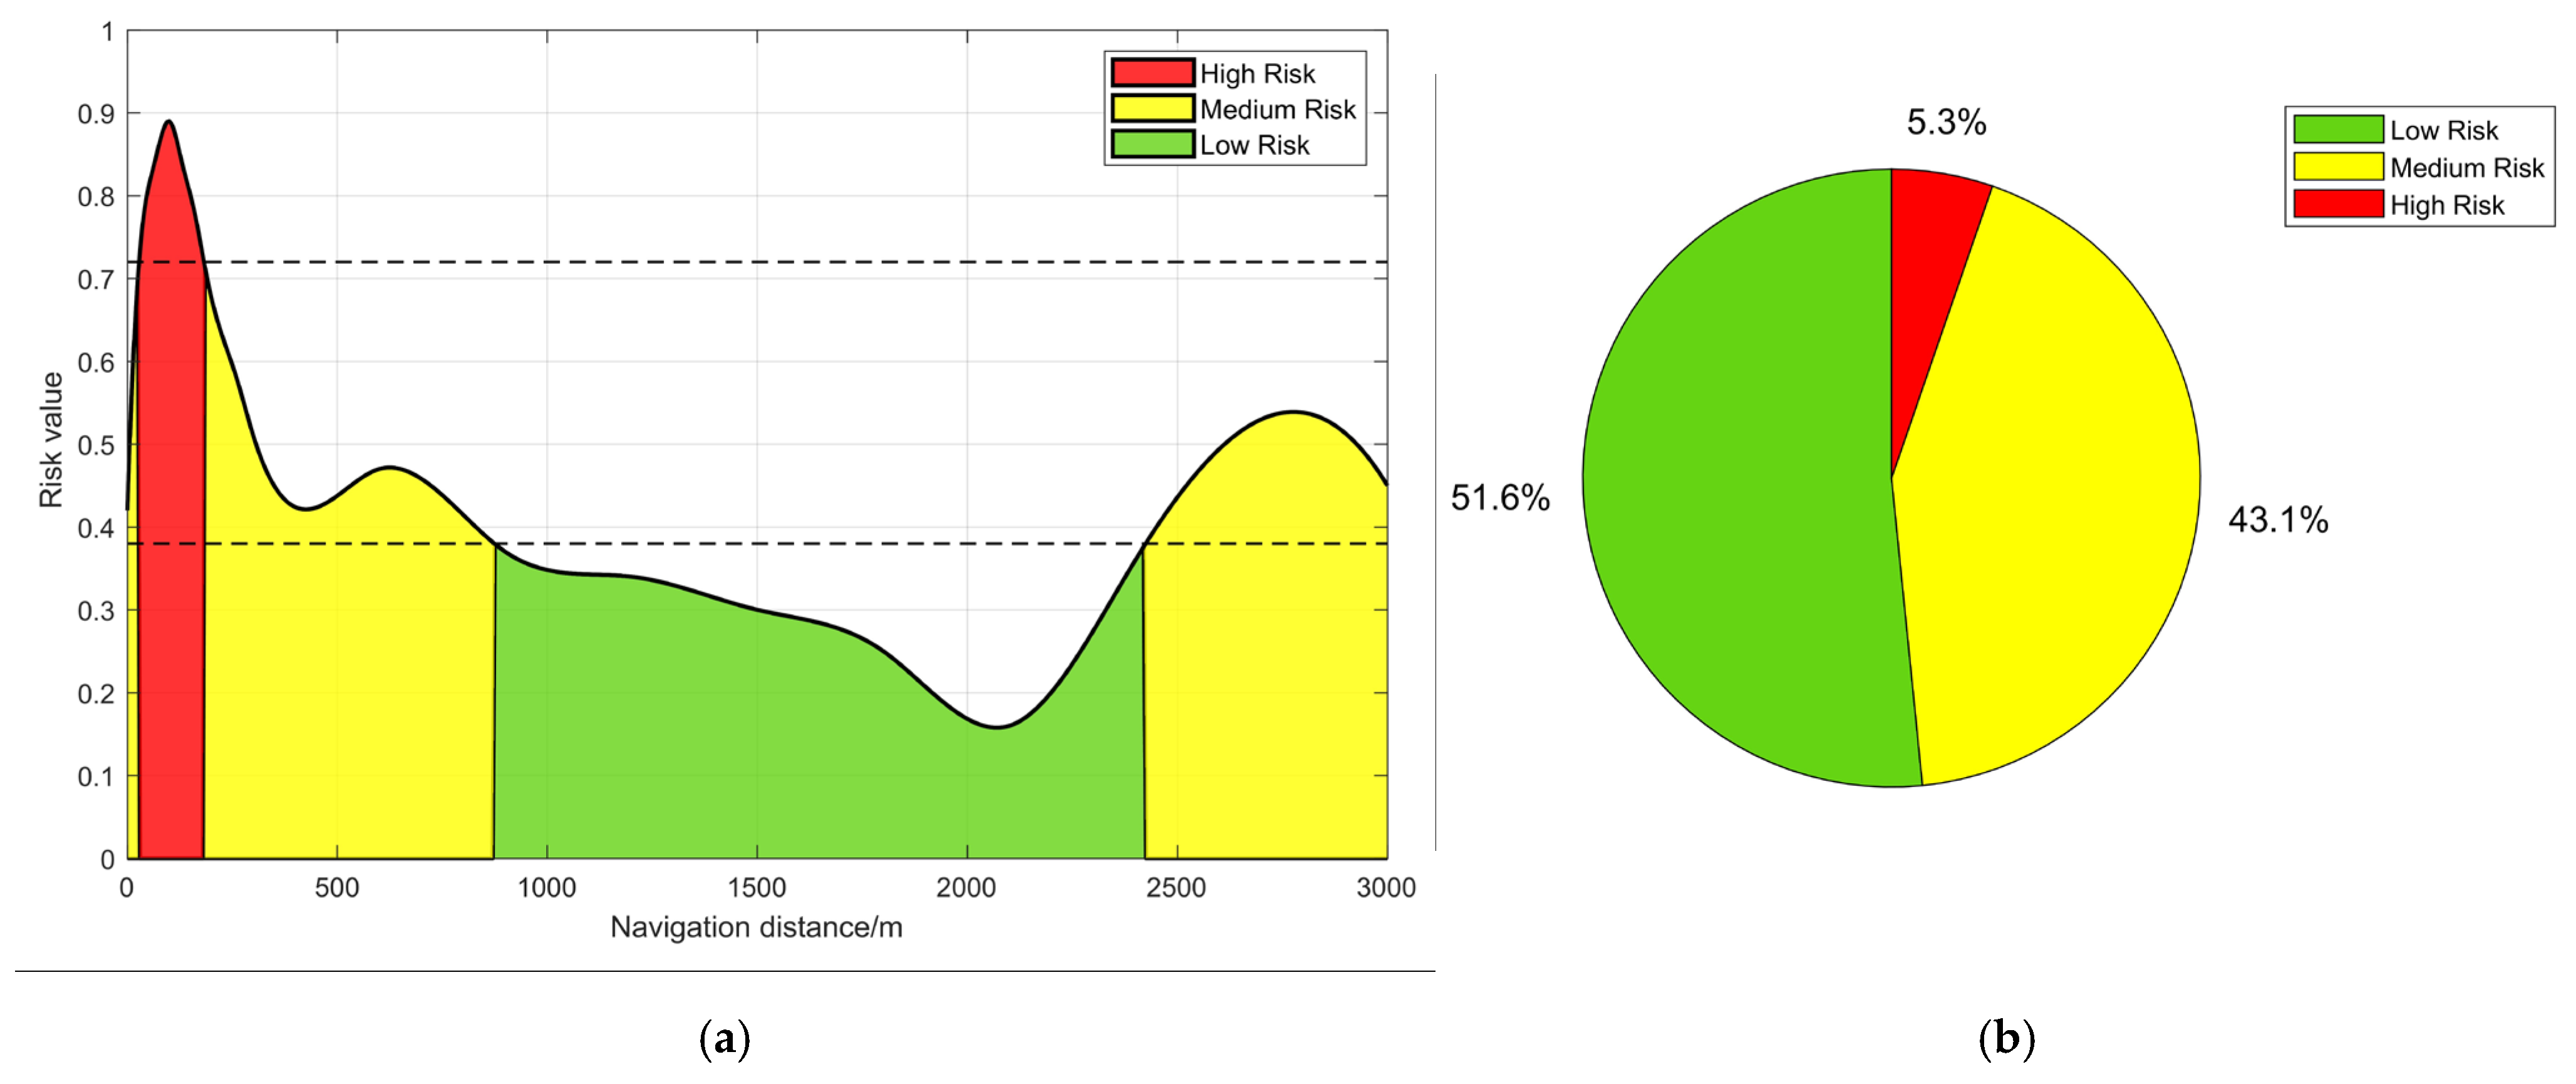
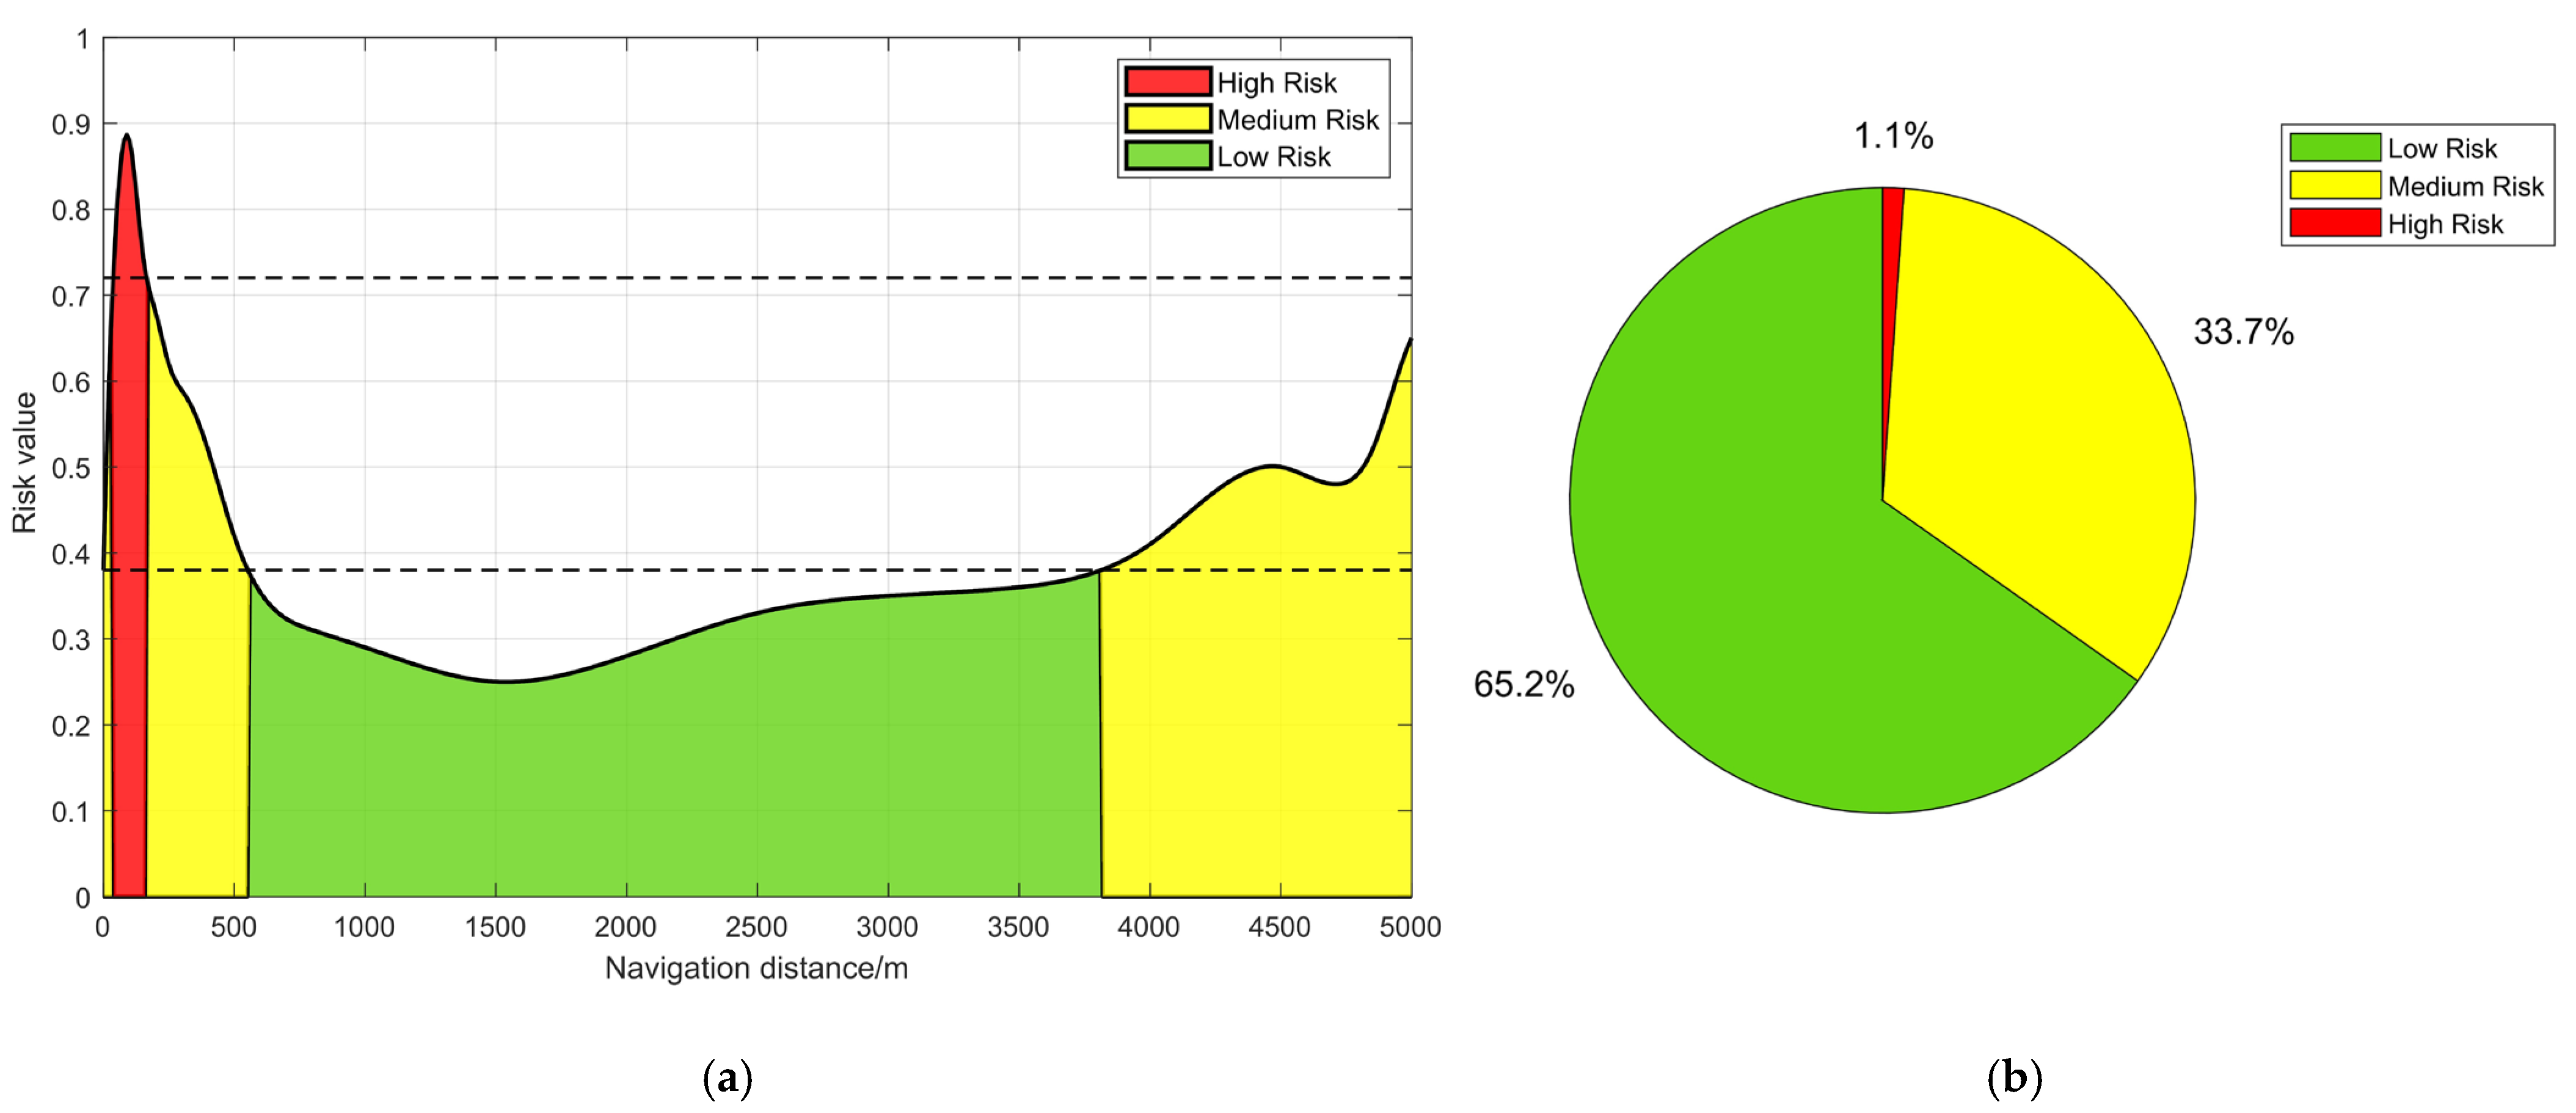
- By calculating the cognitive load values of each time segment in four different lengths of tunnels, the entropy weight TOPSIS method is used to obtain the tunnel navigation risk value and risk section division. The analysis shows that the navigation risk levels of each tunnel are highest, respectively, at the first 168 m, first 242 m, first 185 m, and first 170 m segments. This indicates that under the experimental conditions, the ship officer should maintain high vigilance in the first 100–200 m segment of the tunnel, concentrate their attention in the first 1–2 min of tunnel navigation, and adjust the steering direction in a timely manner. The navigation risk within 300 m of the exit in a 1500 m tunnel slowly increased, while the navigation risk level in a 3000 m tunnel began to rise after the 2500 m section.
- (4)
- For an ultra-long tunnel like the 5000 m tunnel, the navigation risk level also increased to medium risk after the 4000 m section. Based on the analysis of the data results from this simulation experiment, it can be concluded that the ship officer may need to guard against navigation risks caused by fatigue accumulation and other factors during 4/5 of the sailing voyage when navigating in long tunnels with a navigation time exceeding tens of minutes. At this time, it is appropriate to increase the duty lookout to reduce the continuous cognitive load of the ship officer. Transitional light strips or visually flat areas can also be set up at this location to reduce navigation fatigue.
- (5)
- This study extracts key indicators reflecting the cognitive load and physiological response characteristics of ship officers, including EEG power ratio β/(α + θ), heart rate growth rate, and heart rate variability time-domain indicators SDNN and RMSSD. The concepts of Stress Load Factor and Physiological Regulation Factor are proposed, and a quantitative model for the cognitive load of a ship officer in waterway tunnels is constructed. The effectiveness of the model is verified by the changes in LF/HF indicators, and finally a comprehensive risk assessment method of entropy weight TOPSIS is used to calculate and visualize the risk values of each section in waterway tunnels. The results show that high-risk periods are mostly concentrated in the areas with sudden changes in illumination at the entrance and inside the tunnel, with certain stages and sudden patterns. The research results of this study provide a scientific basis for the assessment of the load status of officer in waterway tunnel scenarios, and are also of great significance for risk warning and risk control of waterway tunnels.
Author Contributions
Funding
Data Availability Statement
Conflicts of Interest
References
- Ge, H.M.; Bo, Y.Y.; Zang, W.K.; Zhou, L.; Dong, L. Literature review of driving risk identification research based on bibliometric analysis. J. Traffic Transp. Eng. 2023, 10, 560–577. [Google Scholar] [CrossRef]
- Xie, C.; Huang, L.; Wang, R.; Deng, J.; Shu, Y. Ship fire modelling and evacuation simulation in navigation tunnel. Tunn. Undergr. Space Technol. 2022, 126, 104546. [Google Scholar] [CrossRef]
- Gould, K.S.; Røed, B.K.; Saus, E.R.; Koefoed, V.F.; Bridger, R.S.; Moen, B.E. Effects of navigation method on workload and performance in simulated high-speed ship navigation. Appl. Ergon. 2009, 40, 103–114. [Google Scholar] [CrossRef] [PubMed]
- Zhu, J.; Wang, Y.; La, R.; Zhan, J.; Niu, J.; Zeng, S.; Hu, X. Multimodal mild depression recognition based on EEG EM synchronization acquisition network. IEEE Access 2019, 7, 28196–28210. [Google Scholar] [CrossRef]
- Jap, B.T.; Lal, S.; Fischer, P.; Bekiaris, E. Using EEG spectral components to assess algorithms for detecting fatigue. Expert Syst. Appl. 2009, 36, 2352–2359. [Google Scholar] [CrossRef]
- Chuang, C.H.; Huang, C.S.; Ko, L.W.; Lin, C.T. An EEG-based perceptual function integration network for application to drowsy driving. Knowl.-Based Syst. 2015, 80, 143–152. [Google Scholar] [CrossRef]
- Chen, F.; Wang, J.J.; Deng, Y.J. Road safety risk evaluation by means of improved entropy TOPSIS–RSR. Saf. Sci. 2015, 79, 39–54. [Google Scholar] [CrossRef]
- Liang, B.; Qin, C.; Niu, J.A.; Xiao, J.; Wen, S. Psychological Load of Drivers in Entrance Zone of Road Tunnel Based on TOPSIS Improved Factor Analysis Method. Transp. Res. Rec. 2024, 2678, 163–177. [Google Scholar] [CrossRef]
- Zhang, W.J.; Zhang, Y.J. Navigation Risk Assessment of Autonomous Ships Based on Entropy-TOPSIS-Coupling Coordination Model. J. Mar. Sci. Eng. 2023, 11, 422. [Google Scholar] [CrossRef]
- Wang, X.H.; Yang, S.H.; Chen, G.Q. Design and Implement on Intelligent Target Ship for Ship Handling Simulator. Appl. Mech. Mater. 2011, 1448, 256–287. [Google Scholar]
- Ross, A.; Bruyat, A.; Aspelund, L.; Hassani, V.; Simanesew, A. Ship Manoeuvring Study of a Vessel Transiting a Ship Tunnel. International Conference on Offshore Mechanics and Arctic Engineering. Am. Soc. Mech. Eng. 2024, 87837, V05BT06A024. [Google Scholar]
- Deng, J.; Liao, F.D.; Xie, C.; Guan, H.; Yan, Q. Study on Navigation Safety in Narrow and Long Navigable Tunnels Based on Ship Handling Simulation. Navig. China 2021, 44, 7–12. [Google Scholar]
- Alcaide, J.I. Modelling the relationship between performance and ship-handling simulator. J. Marit. Res. 2020, 17, 68–73. [Google Scholar]
- Yusuf, V.A. Utilization of Full-Mission Ship-Handling Simulators for Navigational Risk Assessment: A Case Study of Large Vessel Passage through the Istanbul Strait. J. Mar. Sci. Eng. 2022, 10, 659. [Google Scholar]
- Zhang, S.; Cheng, H.; Deng, Z.; Mei, L.; Ding, L.; Guo, C.; Wang, X.; Zhao, G. Navigational Safety Assessment of Ten-Thousand-Ton Vessels in Ship Tunnels by Ship Simulations. Water 2023, 15, 3584. [Google Scholar] [CrossRef]
- Ding, J.; Jiang, J. Tunnel flow of a planing trimaran and effects on resistance. Ocean Eng. 2021, 237, 109458. [Google Scholar] [CrossRef]
- Tjolleng, A.; Jung, K.; Hong, W.; Lee, W.; Lee, B.; You, H.; Son, J.; Park, S. Classification of a Driver’s cognitive workload levels using artificial neural network on ECG signals. Appl. Ergon. 2017, 59, 326–332. [Google Scholar] [CrossRef]
- Kresojevic, M.; Ristic Vakanjac, V. Ship Maneuvering Using a Ship Simulator in Search and Rescue Operation. In Smart Rivers; Springer Nature: Singapore, 2022; pp. 969–977. [Google Scholar]
- Kim, H.S.; Yoon, D.; Shin, H.S.; Park, C.H. Predicting the EEG level of a driver based on driving information. IEEE Trans. Intell. Transp. Syst. 2018, 20, 1215–1225. [Google Scholar] [CrossRef]
- Ma, J.; Wu, Y.; Rong, J.; Zhao, X. A systematic review on the influence factors, measurement, and effect of driver workload. Accid. Anal. Prev. 2023, 192, 107289. [Google Scholar] [CrossRef]
- Sammito, S.; Böckelmann, I. Reference values for time-and frequency-domain heart rate variability measures. Heart Rhythm 2016, 13, 1309–1316. [Google Scholar] [CrossRef]
- Biondi, F.; Coleman, J.R.; Cooper, J.M.; Strayer, D.L. Average heart rate for driver monitoring systems. Int. J. Hum. Factors Ergon. 2016, 4, 282–291. [Google Scholar] [CrossRef]
- Buendia, R.; Forcolin, F.; Karlsson, J.; Arne Sjöqvist, B.; Anund, A.; Candefjord, S. Deriving heart rate variability indices from cardiac monitoring—An indicator of driver sleepiness. Traffic Inj. Prev. 2019, 20, 249–254. [Google Scholar] [CrossRef] [PubMed]
- Burlacu, A.; Brinza, C.; Brezulianu, A.; Covic, A. Accurate and early detection of sleepiness, fatigue and stress levels in drivers through Heart Rate Variability parameters: A systematic review. Rev. Cardiovasc. Med. 2021, 22, 845–852. [Google Scholar] [CrossRef]
- Ma, Y.; Liu, Q.; Yang, L. Exploring seafarers’ workload recognition model with EEG, ECG and task scenarios’ complexity: A bridge simulation study. J. Mar. Sci. Eng. 2022, 10, 1438. [Google Scholar] [CrossRef]
- Olson, D.L. Comparison of weights in TOPSIS models. Math. Comput. Model. 2004, 40, 721–727. [Google Scholar] [CrossRef]
- Çelikbilek, Y.; Tüysüz, F. An in-depth review of theory of the TOPSIS method: An experimental analysis. J. Manag. Anal. 2020, 7, 281–300. [Google Scholar] [CrossRef]


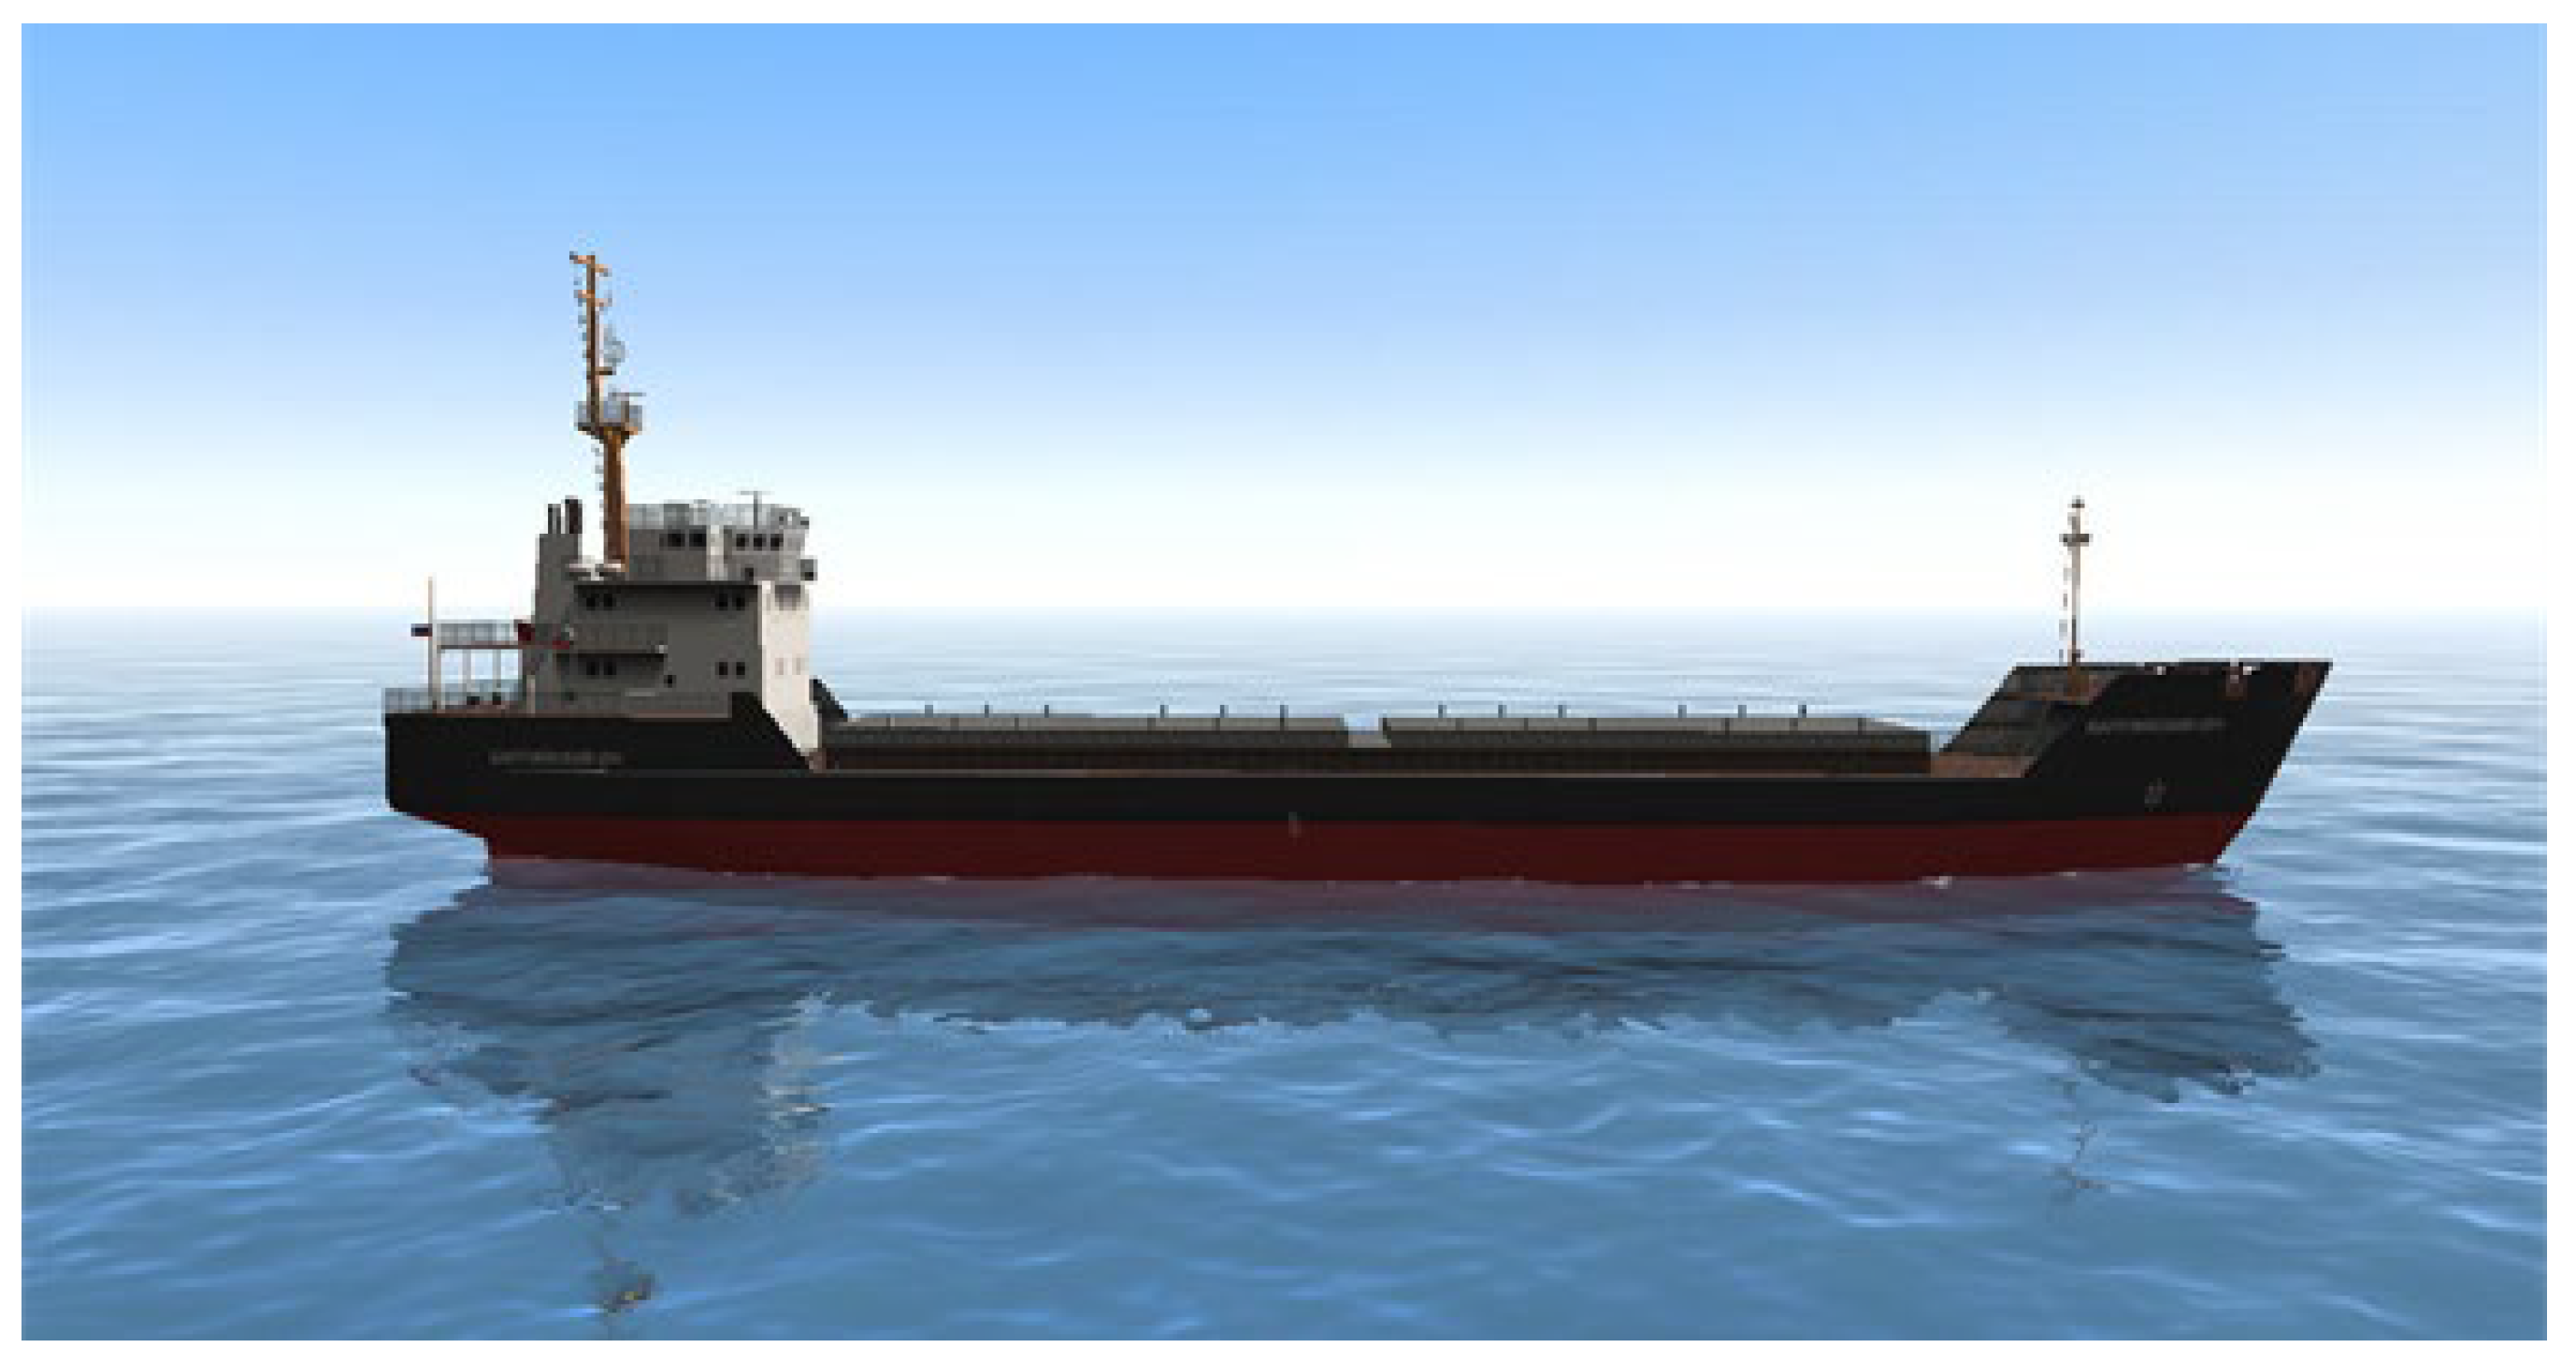



| Ship Type | Length | Beam | Full-Load Draft | Displacement Volume | Block Coefficient |
|---|---|---|---|---|---|
| 1000 DWT bulk carrier | 58 m | 11 m | 2.5 m | 1033 m3 | 0.771 |
| Scenario | Water Depth (m) | Tunnel Width (m) | Sailing Speed (m/s) | Tunnel Length (m) | Tunnel Illuminance (lx) |
|---|---|---|---|---|---|
| Scenario 1 | 5.5 | 16 | 1.5 | 500 | 10 |
| Scenario 2 | 5.5 | 16 | 1.5 | 500 | 50 |
| Scenario 3 | 5.5 | 16 | 1.5 | 500 | 100 |
| Scenario 4 | 5.5 | 16 | 1.5 | 500 | 200 |
| Scenario 5 | 5.5 | 16 | 1.5 | 1500 | 10 |
| Scenario 6 | 5.5 | 16 | 1.5 | 1500 | 50 |
| Scenario 7 | 5.5 | 16 | 1.5 | 1500 | 100 |
| Scenario 8 | 5.5 | 16 | 1.5 | 1500 | 200 |
| Scenario 9 | 5.5 | 16 | 1.5 | 3000 | 10 |
| Scenario 10 | 5.5 | 16 | 1.5 | 3000 | 50 |
| Scenario 11 | 5.5 | 16 | 1.5 | 3000 | 100 |
| Scenario 12 | 5.5 | 16 | 1.5 | 3000 | 200 |
| Scenario 13 | 5.5 | 16 | 1.5 | 5000 | 10 |
| Scenario 14 | 5.5 | 16 | 1.5 | 5000 | 50 |
| Scenario 15 | 5.5 | 16 | 1.5 | 5000 | 100 |
| Scenario 16 | 5.5 | 16 | 1.5 | 5000 | 200 |
| Tunnel Length | Navigation Time (min) | Relative Position (m) | Closeness Coefficient Ci | Risk Value | Ranking |
|---|---|---|---|---|---|
| 500 m | 0 | 0 | 0.599 | 0.401 | 6 |
| 0.5 | 50 | 0.221 | 0.779 | 2 | |
| 1.0 | 100 | 0.149 | 0.851 | 1 | |
| … | … | … | … | … | |
| 3.5 | 350 | 0.847 | 0.153 | 11 | |
| 4.0 | 400 | 0.711 | 0.289 | 9 | |
| 4.5 | 450 | 0.608 | 0.392 | 7 | |
| 5.0 | 500 | 0.544 | 0.456 | 5 |
| Tunnel Length | Navigation Time (min) | Relative Position (m) | Closeness Coefficient Ci | Risk Value | Ranking |
|---|---|---|---|---|---|
| 1500 m | 0 | 0 | 0.608 | 0.392 | 16 |
| 0.5 | 50 | 0.235 | 0.765 | 4 | |
| 1.0 | 100 | 0.202 | 0.798 | 2 | |
| 1.5 | 150 | 0.143 | 0.857 | 1 | |
| … | … | … | … | … | |
| 13.5 | 1350 | 0.599 | 0.401 | 15 | |
| 14.0 | 1400 | 0.620 | 0.380 | 18 | |
| 14.5 | 1450 | 0.633 | 0.367 | 20 | |
| 15.0 | 1500 | 0.637 | 0.363 | 21 |
| Tunnel Length | Navigation Time (min) | Relative Position (m) | Closeness Coefficient Ci | Risk Value | Ranking |
|---|---|---|---|---|---|
| 3000 m | 0 | 0 | 0.579 | 0.421 | 28 |
| 0.5 | 50 | 0.191 | 0.809 | 2 | |
| 1.0 | 100 | 0.113 | 0.887 | 1 | |
| 1.5 | 150 | 0.199 | 0.801 | 3 | |
| … | … | … | … | … | |
| 28.5 | 2850 | 0.470 | 0.530 | 9 | |
| 29.0 | 2900 | 0.487 | 0.513 | 12 | |
| 29.5 | 2950 | 0.514 | 0.486 | 19 | |
| 30.0 | 3000 | 0.547 | 0.453 | 23 |
| Tunnel Length | Navigation Time (min) | Relative Position (m) | Closeness Coefficient Ci | Risk Value | Ranking |
|---|---|---|---|---|---|
| 5000 m | 0 | 0 | 0.617 | 0.383 | 63 |
| 0.5 | 50 | 0.208 | 0.792 | 2 | |
| 1.0 | 100 | 0.116 | 0.884 | 1 | |
| 1.5 | 150 | 0.244 | 0.756 | 3 | |
| … | … | … | … | … | |
| 48.5 | 4850 | 0.474 | 0.526 | 26 | |
| 49.0 | 4900 | 0.438 | 0.562 | 19 | |
| 49.5 | 4950 | 0.383 | 0.617 | 14 | |
| 50.0 | 5000 | 0.351 | 0.649 | 12 |
Disclaimer/Publisher’s Note: The statements, opinions and data contained in all publications are solely those of the individual author(s) and contributor(s) and not of MDPI and/or the editor(s). MDPI and/or the editor(s) disclaim responsibility for any injury to people or property resulting from any ideas, methods, instructions or products referred to in the content. |
© 2025 by the authors. Licensee MDPI, Basel, Switzerland. This article is an open access article distributed under the terms and conditions of the Creative Commons Attribution (CC BY) license (https://creativecommons.org/licenses/by/4.0/).
Share and Cite
Deng, J.; Huang, X.; Guan, H.; Wang, R.; Liu, S.; Xie, C. Research on Navigation Risks in Waterway Tunnels Based on Measurement of the Cognitive Load of Ship Officers. Appl. Sci. 2025, 15, 10014. https://doi.org/10.3390/app151810014
Deng J, Huang X, Guan H, Wang R, Liu S, Xie C. Research on Navigation Risks in Waterway Tunnels Based on Measurement of the Cognitive Load of Ship Officers. Applied Sciences. 2025; 15(18):10014. https://doi.org/10.3390/app151810014
Chicago/Turabian StyleDeng, Jian, Xiong Huang, Hongxu Guan, Rui Wang, Shaoyong Liu, and Cheng Xie. 2025. "Research on Navigation Risks in Waterway Tunnels Based on Measurement of the Cognitive Load of Ship Officers" Applied Sciences 15, no. 18: 10014. https://doi.org/10.3390/app151810014
APA StyleDeng, J., Huang, X., Guan, H., Wang, R., Liu, S., & Xie, C. (2025). Research on Navigation Risks in Waterway Tunnels Based on Measurement of the Cognitive Load of Ship Officers. Applied Sciences, 15(18), 10014. https://doi.org/10.3390/app151810014


