Article

A Deep Reinforcement Learning Framework for Multi-Fleet Scheduling and Optimization of Hybrid Ground Support Equipment Vehicles in Airport Operations

1
College of Transportation, Tongji University, 4800 Cao’an Road, Shanghai 201804, China
2
Institute of High Performance Computing (IHPC), Agency for Science, Technology and Research (A*STAR), 1 Fusionopolis Way, Singapore 138632, Singapore
*
Authors to whom correspondence should be addressed.
These authors contributed equally to this work.
Appl. Sci. 2025, 15(17), 9777; https://doi.org/10.3390/app15179777
Submission received: 27 July 2025 / Revised: 20 August 2025 / Accepted: 24 August 2025 / Published: 5 September 2025
(This article belongs to the Topic AI-Enhanced Techniques for Air Traffic Management)

Abstract

The increasing electrification of Ground Support Equipment (GSE) vehicles promotes sustainable airport operations but introduces new challenges in task scheduling, energy management, and hybrid fleet coordination. To address these issues, we develop an end-to-end Deep Reinforcement Learning (DRL) framework and evaluate it under three representative deployment scenarios with 30%, 50%, and 80% electric fleet proportions through case studies at Singapore’s Changi Airport. Experimental results show that the proposed approach outperforms baseline models, achieves more balanced state-of-charge (SoC) distributions, reduces overall carbon emissions, and improves real-time responsiveness under operational constraints. Beyond these results, this work contributes a unified DRL-based scheduling paradigm that integrates electric and fuel-powered vehicles, adapts Proximal Policy Optimization (PPO) to heterogeneous fleet compositions, and provides interpretable insights through Gantt chart visualizations. These findings demonstrate the potential of DRL as a scalable and robust solution for smart airport logistics.

1. Introduction

With the continuous growth of global air transport demand, carbon emissions from the aviation sector have drawn increasing attention. The International Civil Aviation Organization (ICAO) has set a target of achieving net-zero carbon emissions by 2050, urging member states to develop detailed emission reduction timelines [1]. In 2023, ACI EUROPE announced that European airports aim to achieve net-zero carbon emissions by 2050 and proposed a five-step roadmap to guide this transition [2]. In China, the 14th Five-Year Plan for Green Development of Civil Aviation promotes decarbonization through low-carbon strategies, technological innovation, and coordinated policy instruments to reduce carbon intensity [3].
In airport operations, Ground Support Equipment (GSE), which directly participates in aircraft taxiing, baggage handling, and passenger and cargo transport, is a major source of ground emissions, playing a critical role in advancing low-carbon airport transitions. GSE represents a significant source of airport-related carbon emissions, accounting for approximately 13% of total gasoline and diesel energy consumption at airports and contributing around 15% of overall airport carbon emissions [4]. Specifically, GSE accounts for 5%–9% of total NOx emissions across the airport system. When focusing solely on the apron area, GSE contributes 63% of NOx, 75% of particulate matter (PM), and 24% of total fuel consumption, underscoring its significant environmental impact [5]. These environmental concerns highlight the increasing need for more dynamic and efficient scheduling of airport ground support operations that coordinate both fuel-powered and electric fleets.

1.1. Airport Ground Support Scheduling for Fuel and Electric Fleets

In recent years, vehicle electrification has become the dominant trend in sustainable airport development, with many countries and major hub airports proposing visions of “100% electric ground support fleets.” Since 2017, Changi Airport Group (CAG) has installed over 100 charging stations to support the electrification of ground handling vehicles. As a result, all baggage tractors at Changi Airport are now fully electric, with Singapore’s national decarbonization roadmap targeting a full transition of the airside vehicle fleet to cleaner energy sources by 2040 [6].
However, in practice, a full replacement of fuel-powered vehicles remains unrealistic. On the one hand, electric vehicles (EVs) face limitations in driving range and charging infrastructure, which constrain their ability to perform continuous high-intensity tasks. On the other hand, a large number of conventional fuel-powered vehicles are still in use, and phasing them out immediately would result in substantial costs. As a result, most airports currently operate under a “mixed-energy fleet,” where both electric and fuel-powered vehicles coexist in a transitional phase [4]. This study starts from the main challenge of efficiently scheduling and allocating resources in a hybrid fleet scenario where vehicles differ in energy type, availability, and operational constraints.
In the field of traditional fuel-powered airport ground vehicle scheduling, optimization models have evolved to incorporate multi-objective integer programming, graph-based methods, and stochastic modeling to improve operational efficiency and robustness. Research objectives include minimizing service costs and time losses [7], reducing the number of vehicles required during peak hours [8], minimizing the weighted sum of flight delays [9], and minimizing both the total extra dispatch cost and fleet size [10]. In terms of modeling and solution approaches, Simple Temporal Networks (STNs) are introduced to enable decentralized coordination between departments [11]; service-sharing networks are used to convert the problem into a maximum flow formulation [8]; Unrelated Parallel Machine Scheduling (UPMS) models with Variable Neighborhood Search (VNS) are employed for ferry vehicle allocation [9]. To handle uncertainties in flight arrivals and service demands, some studies apply chance constraints and Monte Carlo simulations to enhance solution robustness [7,12]. Furthermore, a decomposition approach using a multi-chromosome non-dominated sorting genetic algorithm is proposed to optimize multi-type special vehicle dispatching [10]. Recent advances have also explored integrating multiple objectives into transportation decision-making beyond traditional reward shaping. For example, explainable data envelopment analysis (DEA) has been applied to public transport systems, combining DEA with explainable AI techniques to evaluate efficiency across origin–destination pairs and uncover the relative importance of different transport modes [13]. Similarly, performance-based transportation planning frameworks have been developed, where multiple performance metrics are consolidated into a single score to guide strategic planning and provide actionable insights for system improvement [14]. These studies provide a solid foundation for modeling and solving more complex hybrid fleet scheduling problems.
The transition from fuel-powered to electric ground support equipment (e-GSE) vehicles has prompted extensive research into the distinctive challenges of operating and managing energy for electric vehicles. Common optimization goals include minimizing vehicle travel distances and balancing service times [15], reducing total operational and energy costs [16,17], and aligning charging activities with renewable energy availability [18]. To address battery capacity limitations and charging constraints, various modeling and solution techniques have been developed. These include bi-objective integer programming solved by NSGA2-LNS hybrid metaheuristics [15], reformulations of mixed-integer nonlinear programs into mixed-integer linear programs for improved tractability [16], and rollout-based dynamic control methods to optimize cost under uncertainty [18]. Alternative strategies explore cooperative scheduling to balance driver workload and energy consumption using column generation [19], as well as the use of adaptive large neighborhood search for routing autonomous electric dollies in complex baggage handling scenarios [20].

1.2. Modeling and Optimization for Hybrid Fleet Operations

Under the ongoing electrification of airport ground support operations, hybrid fleets comprising both fuel-powered and electric vehicles remain common in real-world scenarios, introducing new complexities in scheduling and resource coordination. The scheduling system exhibits a high degree of coupling, requiring simultaneous management of multiple vehicle types, diverse task categories, strict time windows, and energy replenishment processes [21]. The hybrid vehicle scheduling problem is complicated by the need to model diverse energy consumption mechanisms and incorporate the non-negligible charging processes of electric vehicles, which increases the number of constraints and significantly raises the computational difficulty of the model [4]. Therefore, developing scheduling methods that can account for heterogeneous energy characteristics and dynamically respond to task interdependencies has become a critical requirement in building intelligent airport ground support systems. During the transition toward full electrification, the scheduling of hybrid fleets has gained increasing attention. Research objectives include operational cost minimization, carbon emission reduction, and coordinated planning of charging infrastructure.
In terms of objective design, some studies focus on co-optimizing operational and environmental costs [22], while others propose integrated frameworks that jointly optimize charging infrastructure location, fleet composition, and vehicle schedules to minimize total system cost [23]. Life-cycle cost-based planning models for zero-emission systems have also been explored [24].
Modeling approaches commonly adopt Mixed Integer Programming (MIP) frameworks capable of handling multi-type fleets (e.g., diesel, battery electric, hydrogen), multiple depots, and multi-route networks [25,26]. To solve large-scale, complex problems, many studies incorporate decomposition-based heuristics such as Adaptive Large Neighborhood Search (ALNS) [25], simulated annealing [23], or multi-objective particle swarm optimization with constraint-handling mechanisms [22].
Application domains include urban transit systems [22,24,26] and urban freight logistics, where routing and fleet replacement decisions are jointly optimized [27,28]. Studies show that adopting mixed-route strategies and partial recharging can significantly reduce fleet size and operational cost while improving scheduling flexibility.
Recent studies have also examined coordinated control strategies for heterogeneous vehicle fleets, emphasizing the potential of mixed vehicle formations in improving energy and traffic efficiencies. Dong et al. [29] studied mixed vehicle platoons of connected automated vehicles (CAVs) and human-driven vehicles (HDVs), showing that platoon formation, size, and CAV penetration significantly affect energy and traffic efficiency. Their findings highlight how coordinated spatial distribution of heterogeneous vehicles can improve fleet-level performance, offering insights relevant for hybrid GSE scheduling and control.
In summary, current research has demonstrated the feasibility and benefits of hybrid fleet scheduling in real-world systems. However, most existing studies focus on public transit or freight systems, with minimal exploration of the scheduling complexities and integrated energy considerations in airports.

1.3. Reinforcement Learning in Fleet Scheduling and Management

In recent years, reinforcement learning (RL) has been widely regarded as a model-free method for sequential and dynamic decision-making problems, enabling agents to gradually learn optimal control strategies through repeated interactions with the environment without prior knowledge. Additionally, as an online learning approach, RL effectively utilizes increasing environmental data to capture system uncertainties and adapt to diverse state dynamics in real time. Finally, once trained, RL policies can be directly deployed to new test environments with millisecond-level latency and without further system identification [30]. Therefore, RL is an efficient tool for real-time automatic control in EV dispatch problems.
In electric vehicle scheduling and charging management, RL has been widely applied in electric vehicle scheduling and charging management to balance energy consumption, grid stability, and user-side costs. Some studies aim to minimize expected energy usage under uncertain routing and consumption conditions while also mitigating the risk of en-route battery depletion [31]. Others focus on minimizing individual charging costs under dynamic electricity pricing and stochastic travel behaviors by using deep policy-gradient methods, where LSTM networks capture temporal patterns and DDPG learns continuous charging actions [32]. To improve coordination among multiple vehicles, RL-based scheduling strategies often incorporate neural network function approximation and prioritized experience replay to stabilize training and balance charging loads [33]. Additionally, Double DQN has been employed to reduce action value overestimation, enabling scalable smart charging coordination for large EV fleets [34]. In more complex traffic environments, perception-augmented RL policies have been developed by integrating visual and spatial features to enhance energy decision-making for autonomous vehicles [35].
In the latest studies, the scope of RL-based methods for fleet and energy management has expanded considerably. Data-driven approaches have emerged to bridge the gap between simulations and real-world deployment, where offline reinforcement learning leverages large-scale vehicle operation data to optimize energy consumption and reduce system degradation, achieving performance close to theoretical optima in real-world scenarios [36]. For hybrid vehicles, advanced deep reinforcement learning strategies have been developed by integrating the thermal characteristics of batteries and motors into the control framework, thereby improving efficiency and extending component lifetime under diverse driving conditions [37]. Multi-agent reinforcement learning has also been widely adopted to address supply–demand imbalances in shared autonomous EV systems, where dynamic clustering and cooperative policies significantly improve relocation efficiency and operator profit [38]. In addition, systematic performance analyses have been conducted to evaluate algorithm design choices, perception granularity, and reward formulations in RL-based energy management systems, offering guidance for more stable and efficient policy learning [39]. Beyond traditional RL, imitation reinforcement learning has been applied to accelerate training and reduce battery degradation costs in vehicles with hybrid energy storage, effectively combining expert knowledge and online exploration to achieve robust energy allocation [40].
Together, these studies demonstrate the adaptability, flexibility, and real-time efficiency of RL in fleet scheduling and management problems, especially under large-scale and uncertain conditions. Despite growing interest in EV dispatching, RL specifically designed for hybrid electric-fuel airport fleets remains extremely limited. Most existing approaches assume a purely electric setting and fail to address the operational coupling and resource conflicts arising from a realistic hybrid-energy environment.
To address this issue, this study proposes an end-to-end deep reinforcement learning (DRL) scheduling framework for dispatching hybrid fleets of electric and fuel-powered airport vehicles, as shown in Figure 1. In this framework, the agent is a centralized decision-maker controlling a hybrid fleet of electric and fuel-powered GSE vehicles. The environment includes flight schedules, energy states, task demands, and infrastructure status. The reward function balances energy sustainability, operational constraints, and system efficiency. Performance is evaluated by metrics such as task timeliness, energy usage, and resource utilization. Leveraging a case study involving flight schedules and associated vehicle operation requirements at Singapore’s Changi Airport as an experimental scenario, we conduct extensive evaluations under various electric fleet ratios (e.g., 30%, 50%, and 80%). The Proximal Policy Optimization (PPO) algorithm is tailored to solve the DRL model, with performance metrics including task completion rate, fuel cost, and charging stability. The main contributions of this study are as follows:
  • An end-to-end DRL framework is proposed for dispatching hybrid fleets consisting of both electric and fuel-powered airport ground support vehicles. By abstracting the complex operational environment into a Markov Decision Process (MDP), the framework improves adaptability in EV scheduling under hybrid energy constraints.
  • The framework supports large-scale and multi-type vehicle fleets, capturing the diverse operational demands of airport ground services. This design enhances the model’s scalability and applicability to real-world scheduling scenarios.
  • A multi-objective coordination mechanism is embedded within the DRL model to dynamically balance task execution and energy replenishment. The model jointly optimizes service punctuality, fleet utilization, carbon emission reduction, and grid load smoothing, enabling intelligent and sustainable hybrid operations in airports.
The remainder of this paper is organized as follows. Section 2 introduces the overall methodology and problem formulation. Section 3 presents the deep reinforcement learning approach for hybrid fleet scheduling, covering the environment setup, action space, reward design, and the PPO-based learning algorithm. Section 4 describes the experimental settings and evaluation metrics. Section 5 discusses the results, including comparative performance analysis, carbon emission decomposition, and integrated optimization effects. Finally, Section 6 concludes this study with key insights and future research directions.

2. Methodology

Overview

In this study, we propose a reinforcement learning-based framework for optimizing the joint scheduling and energy management of a hybrid-energy fleet of airport GSE vehicles. The fleet consists of both electric and fuel-powered vehicles operating within a dynamic and flight-driven environment. The RL agent serves as a centralized decision-maker, continuously interacting with the system to learn task allocation and energy replenishment strategies that balance operational efficiency and sustainability.
In the hybrid fleet setting, heterogeneity arises from the distinct operational profiles of electric and fuel-powered GSE vehicles. Electric vehicles are modeled with battery capacity, charging/discharging power, and state-of-charge (SoC) constraints, which directly affect their task availability and introduce charging conflicts when multiple units operate simultaneously. Fuel-powered vehicles, in contrast, are not restricted by energy replenishment but incur higher carbon emissions. By integrating these differentiated dynamics into the scheduling environment, the framework captures the trade-offs between operational efficiency, energy sustainability, and emission reduction, thereby reflecting the heterogeneous effects of mixed fleet operations.
The framework takes as input a variety of heterogeneous data sources, including flight schedules, vehicle specifications, task requirements, energy constraints, and infrastructure availability. These inputs are pre-processed into structured representations such as task timelines, spatial mobility patterns, charger and fuel station distributions, and predicted energy demand profiles. At each decision point, the policy network outputs action probabilities for every vehicle, deciding whether to remain idle, initiate charging or refueling, or perform a specific ground operation task.
A separate value network estimates the expected future reward based on current system conditions, encouraging policies that satisfy multiple objectives: maintaining electric vehicle battery levels above 30% state-of-charge (SoC), avoiding fuel depletion in fuel-powered vehicles, balancing charger and fuel station utilization, ensuring timely flight servicing, and minimizing unnecessary vehicle dispatch or congestion.
Following offline training, the policy can be deployed to generate real-time, high-frequency control decisions that adapt swiftly to disruptions such as delayed aircraft arrivals or charger unavailability. This enables scalable, energy-aware fleet orchestration in hybrid airport GSE systems, promoting both carbon reduction and operational reliability.
From the reinforcement learning perspective, the agent autonomously identifies key sensitivity factors through the reward function. In our environment, variations in battery/fuel levels, task–vehicle assignments, and charging availability significantly affect the rewards. As a result, the agent implicitly treats these elements as critical decision-making signals, adjusting its scheduling policy accordingly. This design ensures that the learned strategy is robust to energy fluctuations and task heterogeneity.

3. Deep Reinforcement Learning Method for Hybrid Fleet Scheduling Problem

3.1. Environment and State

The environment in this study simulates the operational behaviors and energy requirements of a heterogeneous GSE fleet composed of both electric and fuel-powered vehicles in an airport airside setting. At each discrete time step t, the environment provides a state representation for each vehicle, depending on its energy type. Specifically:
  • For electric vehicles:
    -
    current battery level S o C t ;
    -
    time until the vehicle’s next assigned task T t ;
    -
    estimated energy demand for the upcoming task E t ;
    -
    availability status of charging stations C t ;
    -
    current operational mode (e.g., charging, idle, working).
  • For fuel-powered vehicles:
    -
    current fuel level F t ;
    -
    time until the vehicle’s next assigned task T t ;
    -
    estimated fuel demand for the upcoming task E t ;
    -
    refueling station availability R t ;
    -
    current operational mode (e.g., refueling, idle, working).
These state variables provide the agent with sufficient information to make energy-aware and task-efficient decisions, such as dispatching vehicles to tasks, sending them to recharge/refuel, or keeping them idle. The hybrid-energy setting introduces additional complexity, requiring the agent to balance between low-emission operation and timely task fulfillment.

3.2. Agent and Action

In this framework, we model the agent as a centralized decision-maker responsible for managing the operations of a heterogeneous GSE fleet consisting of both electric and fuel-powered vehicles within the airport’s airside domain. Despite the diversity in vehicle types and functions, we employ a single-agent reinforcement learning paradigm, which enables unified control over the entire system.
At each discrete time step, the agent receives a comprehensive observation vector that concatenates the state features of all vehicles. This includes energy indicators (battery or fuel level), current task assignments, operational modes (e.g., charging, working, idle), and the availability of energy replenishment infrastructure such as charging or fueling stations. This global state representation allows the policy to exploit fleet-wide information for coordinated decision-making.
The action space is defined discretely on a per-vehicle basis and includes the following options:
  • a t = 0 : direct the vehicle to remain inactive or return to the standby area in preparation for subsequent tasks.
  • a t = 1 : initiate the vehicle’s energy replenishment process:
    -
    electric vehicles: move to the nearest charging point and begin recharging;
    -
    fuel-powered vehicles: proceed to the designated fueling area for refueling.
  • a t = 2 : execute the vehicle’s currently assigned service task.
  • a t = 3 : redirect the vehicle to perform an alternative task type, such as high-priority towing in the case of airtugs.
Each vehicle v V selects an individual action a t v from the set { 0 , 1 , 2 , 3 } at every time step t, resulting in a fleet-level action vector. The centralized policy outputs this vector based on full-system observability, enabling the agent to jointly optimize task scheduling, energy usage, and operational efficiency.
Although training assumes centralized control with access to global state information, the resulting policy can be deployed in practice under distributed or partially observable settings, assigning decisions locally while maintaining system-level coordination.

3.3. Reward

To achieve energy-efficient scheduling and maintain operational reliability in a heterogeneous GSE fleet, the reward function is designed with three components: (1) a quadratic term to regulate battery levels of electric vehicles, (2) linear penalties on energy consumption for both electric and fuel-powered vehicles, and (3) discrete penalty terms for vehicles operating under critical energy thresholds.
The total reward at time step t is defined as:
r t = v V e λ 1 · 360 0.1 S o C t v S o C * Δ 2 Battery health shaping ( quadratic ) v V e λ 2 · E ˜ t v Electric energy consumption v V g λ 3 · F ˜ t v Fuel energy consumption v V λ 4 · I [ E t v < E min ] Low energy penalty .
where:
  • V e and V g denote the sets of electric and fuel-powered vehicles, respectively;
  • S o C t v is the current battery level (state of charge) of electric vehicle v at time t;
  • S o C * is the desired battery level (e.g., 60%) where the quadratic reward is maximized;
  • Δ is the scaling factor that defines the sensitivity of the battery reward shape;
  • E ˜ t v and F ˜ t v denote the normalized electricity and fuel consumption of vehicle v at time t;
  • I [ · ] is an indicator function equal to 1 when the condition is true;
  • E t v is the remaining energy (SoC or fuel) for vehicle v at time t;
  • E min is the safety threshold for low battery or fuel;
  • λ 1 , λ 2 , λ 3 , λ 4 are weighting coefficients that balance the components.
Battery Health Reward: The first term shapes the battery reward using a normalized quadratic function centered at S o C * (typically 60%), encouraging electric vehicles to maintain charge levels within a healthy range. The reward reaches its maximum when S o C t v = S o C * and decreases symmetrically on either side.
Energy Consumption Penalties: The second and third terms impose linear penalties based on the normalized energy usage of electric ( E ˜ t v ) and fuel-powered ( F ˜ t v ) vehicles. The normalization ensures consistent scale across energy types, allowing the reward weights λ 2 and λ 3 to implicitly account for differing emission factors.
Critical Energy Penalty: The final term applies a fixed penalty λ 4 to any vehicle whose current energy level drops below the predefined threshold E min , penalizing unsafe operation and enforcing timely charging or refueling behaviors.
This reward structure jointly promotes carbon-efficient behavior, operational robustness, and long-term energy sustainability while remaining tractable and learnable under the reinforcement learning framework.

3.4. PPO Algorithm Architecture

Algorithm 1 presents a tailored implementation of the Proximal Policy Optimization (PPO) algorithm, specifically adapted to the unique challenges of airport ground support scheduling. While PPO is a widely used on-policy reinforcement learning method that balances policy stability and sample efficiency through clipped surrogate objectives, our approach incorporates domain-specific enhancements to address the energy characteristics, operational constraints, and spatiotemporal task dynamics inherent in this setting.
Algorithm 1 PPO for Airport Ground Service Vehicle Scheduling Optimization
1. for episode = 1 to MAX_EPISODES do
2.      s env . reset ( )      # Reset all vehicle states
3.     for  t = 1  to T do
4.          # Policy network generates actions
5.           a t π θ ( s t )    # select actions for all vehicles
6.          # Environment executes actions
7.          for each vehicle type v V  do
8.              for each vehicle q Q v  do
9.                 if  a t [ q ] = = charge  then
10.                     d compute_distance_to_charger(D)
11.                    charge_time = (P.max_charge − q.battery)/P.charge_rate
12.                    q.schedule(charge, d, charge_time)
13.               elif  a t [ q ] = = task1  then
14.                    assign_nearest_task(F)
15.                     d compute_task_distance(D)
16.                    q.schedule(task1, d, P.task1_time)
17.               elif  a t [ q ] = = task2  then
18.                    if v supports task2:
19.                       assign_towing_task(F)
20.                        d compute_special_distance(D)
21.                       q.schedule(task2, d, P.task2_time)
22.                    end if
23.                end if
24.              end for
25.          end for
26.          # State transition and reward calculation
27.           s t + 1  update_all_vehicles()
28.           r t reward _ function ( s t , a t , s t + 1 )
29.          # Check episode termination
30.           done ( t = = T ) or major _ failure ( s t + 1 )
31.          # Store experience for PPO
32.          Store transition ( s t , a t , r t , s t + 1 , done )
33.          if update_condition:
34.               θ  PPO.update(collected_rollouts)
35.          end if
36.     end for
37. end for
In each episode, the environment is reset and all vehicles are initialized to their starting positions and energy states. At every time step, the policy network π θ receives the current joint state observation and generates discrete actions for each vehicle, selecting whether to perform a task, proceed to charging, or remain idle.
The environment then executes these actions by simulating distance-based movement, energy updates, and task assignment. Specifically, vehicles assigned to charge are routed to available charging stations, while those assigned to tasks such as baggage handling or towing are scheduled accordingly. After execution, the environment updates all vehicles’ states, including battery levels, fuel levels, task status, and locations.
The reward for each time step is calculated based on task completion energy usage, SoC, and penalties for low energy states. Transitions ( s t , a t , r t , s t + 1 , done ) are collected and stored until the update condition is met. PPO then updates the policy by optimizing the clipped surrogate loss, improving long-term reward while maintaining policy stability. The episode continues until a maximum time step or terminal condition (e.g., scheduling failure) is reached.

4. Experiments

4.1. Dataset and Pre-Processing

The experimental scenario is designed as a representative case study of operations at Terminal 3 of Singapore Changi Airport (IATA: SIN), one of Asia’s largest and busiest international air hubs, located in the eastern region of Singapore (1.3644° N, 103.9915° E). Historical flight data were collected from open-access Changi Airport records via the Aviationstack API [41], which provides real-time and historical flight status, schedules, and route information for global aviation systems. The experimental setup is implemented in a simulated environment that mirrors the real-world layout of Terminal 3, incorporating aircraft stands and charging stations distributed around the terminal area.

4.2. Performance Metrics

To evaluate the environmental impact of scheduling strategies, we define performance metrics based on the energy consumption of heterogeneous vehicles in the fleet. Specifically, carbon emissions are estimated separately for electric and fuel-powered vehicles and then aggregated to obtain the total system-level emission.
  • Electric Vehicle Carbon Emission: For each electric vehicle, carbon emission is estimated based on its electricity consumption. Given the energy usage E t e (in kWh) at time step t, the emission is computed as:
    C t elec = κ e · E t e ,
    where κ e is the carbon intensity coefficient of the electricity grid (e.g., kg CO2 per kWh).
  • Fuel-Powered Vehicle Carbon Emission: For fuel-powered vehicles, the emission is calculated using the consumed fuel volume F t g (in liters) and the fuel-specific carbon factor:
    C t fuel = κ g · F t g ,
    where κ g is the emission factor for fuel combustion (e.g., kg CO2 per liter).
  • Total Carbon Emission: The overall carbon footprint of the system at time t is the sum of both components:
    C t total = C t elec + C t fuel .
All energy consumption values are obtained directly from the environment simulation, and emission coefficients κ e and κ g are adopted from standard emission inventories or empirical energy studies. This indirect emission estimation method provides a consistent and scalable way to evaluate sustainability across different fleet configurations and scheduling policies.

5. Results and Discussion

5.1. Performance Comparison

To evaluate the effectiveness of the proposed DRL framework under a balanced 50% fuel-powered and 50% electric vehicle fleet, we compare PPO with four policy-gradient baselines: A2C, TRPO, IMPALA, and APPO. We report four metrics: (a) average episode reward, (b) total carbon emissions, (c) electricity-related emissions, and (d) fuel-combustion emissions in Figure 2.
For reward in Figure 2a, PPO attains the highest level with the fastest and most stable convergence. IMPALA is the second best, improving steadily but plateauing below PPO. APPO and TRPO are relatively stable at lower reward, while A2C shows large variance and lacks sustained stability despite occasional high values.
For total emissions in Figure 2b, PPO achieves the lowest and steadily decreasing trajectory. TRPO stabilizes at a higher level than PPO yet remains below A2C. IMPALA and APPO are higher than PPO and generally flat. A2C exhibits the highest and most volatile total emissions, indicating inefficient environmental performance.
For electricity-side emissions in Figure 2c, PPO remains stable with a slight downward trend. TRPO, IMPALA, and APPO are comparatively flat and higher. Although A2C sometimes shows low electricity-related emissions, this is offset by excessive fuel usage, effectively shifting emissions from the grid to combustion.
For fuel-combustion emissions in Figure 2d, PPO is the lowest and continues to decline. TRPO is moderate and stable. IMPALA and APPO are higher and relatively flat. A2C is markedly higher and highly variable, reflecting over-reliance on fuel vehicles.
Overall, across all four metrics, PPO provides the best trade-off: it dominates in reward while achieving the lowest total emissions. The additional baselines reinforce this conclusion, as IMPALA is competitive in reward but cannot match PPO on emissions, and APPO/TRPO are more stable than A2C yet remain inferior to PPO in both efficiency and environmental impact.

5.2. Sensitivity to Reward Weights

We conducted a 3 × 3 sensitivity study on the reward weights, varying the energy-related weight λ 1 across three levels (High→Mid→Low) and jointly scaling the emission weights ( λ 2 , λ 3 ) by a factor s { 0.8 , 1.0 , 1.2 } while keeping their ratio fixed; λ 4 remained a fixed feasibility/safety penalty, as shown in Table 1. We report total emissions (lower is better) and take ( λ 1 = Mid , s = 1.0 ) as the baseline (837.8). Strengthening emission penalties generally helps when the energy term is not underweighted: at λ 1 = High , emissions decrease monotonically from 817.1 ( s = 0.8 ) and 815.8 ( s = 1.0 ) to 798.9 ( s = 1.2 ), a 4.6% reduction versus baseline. With λ 1 = Mid , both s = 0.8 and s = 1.2 improve over baseline (808.1 and 820.1; +3.5% and +2.1%), indicating a broad near-optimal region. In contrast, underweighting λ 1 degrades performance even as s increases (826.9 → 908.3 → 1007.8 for s = 0.8 , 1.0 , 1.2 ), up to 20.3% worse than baseline. Overall, increasing s is beneficial provided λ 1 is at least moderate, while excessively small λ 1 undermines results by undervaluing battery state in scheduling. These trends are smooth, and the best performance is not dependent on a single setting, supporting the robustness of our conclusions to reasonable weight perturbations.

5.3. Carbon Emission Evolution and Gantt Chart in Different Fleet Configurations

To evaluate the carbon performance of the proposed DRL scheduling framework under varying energy configurations, we simulate three distinct fleet compositions: 30% electric and 70% fuel-powered, 50% electric and 50% fuel-powered, and 80% electric and 20% fuel-powered. In each case, the Proximal Policy Optimization (PPO) agent is trained from scratch, and the evolution of both electricity-induced and fuel-based carbon emissions is recorded throughout the training episodes.

5.3.1. 50% Eletric Fleet

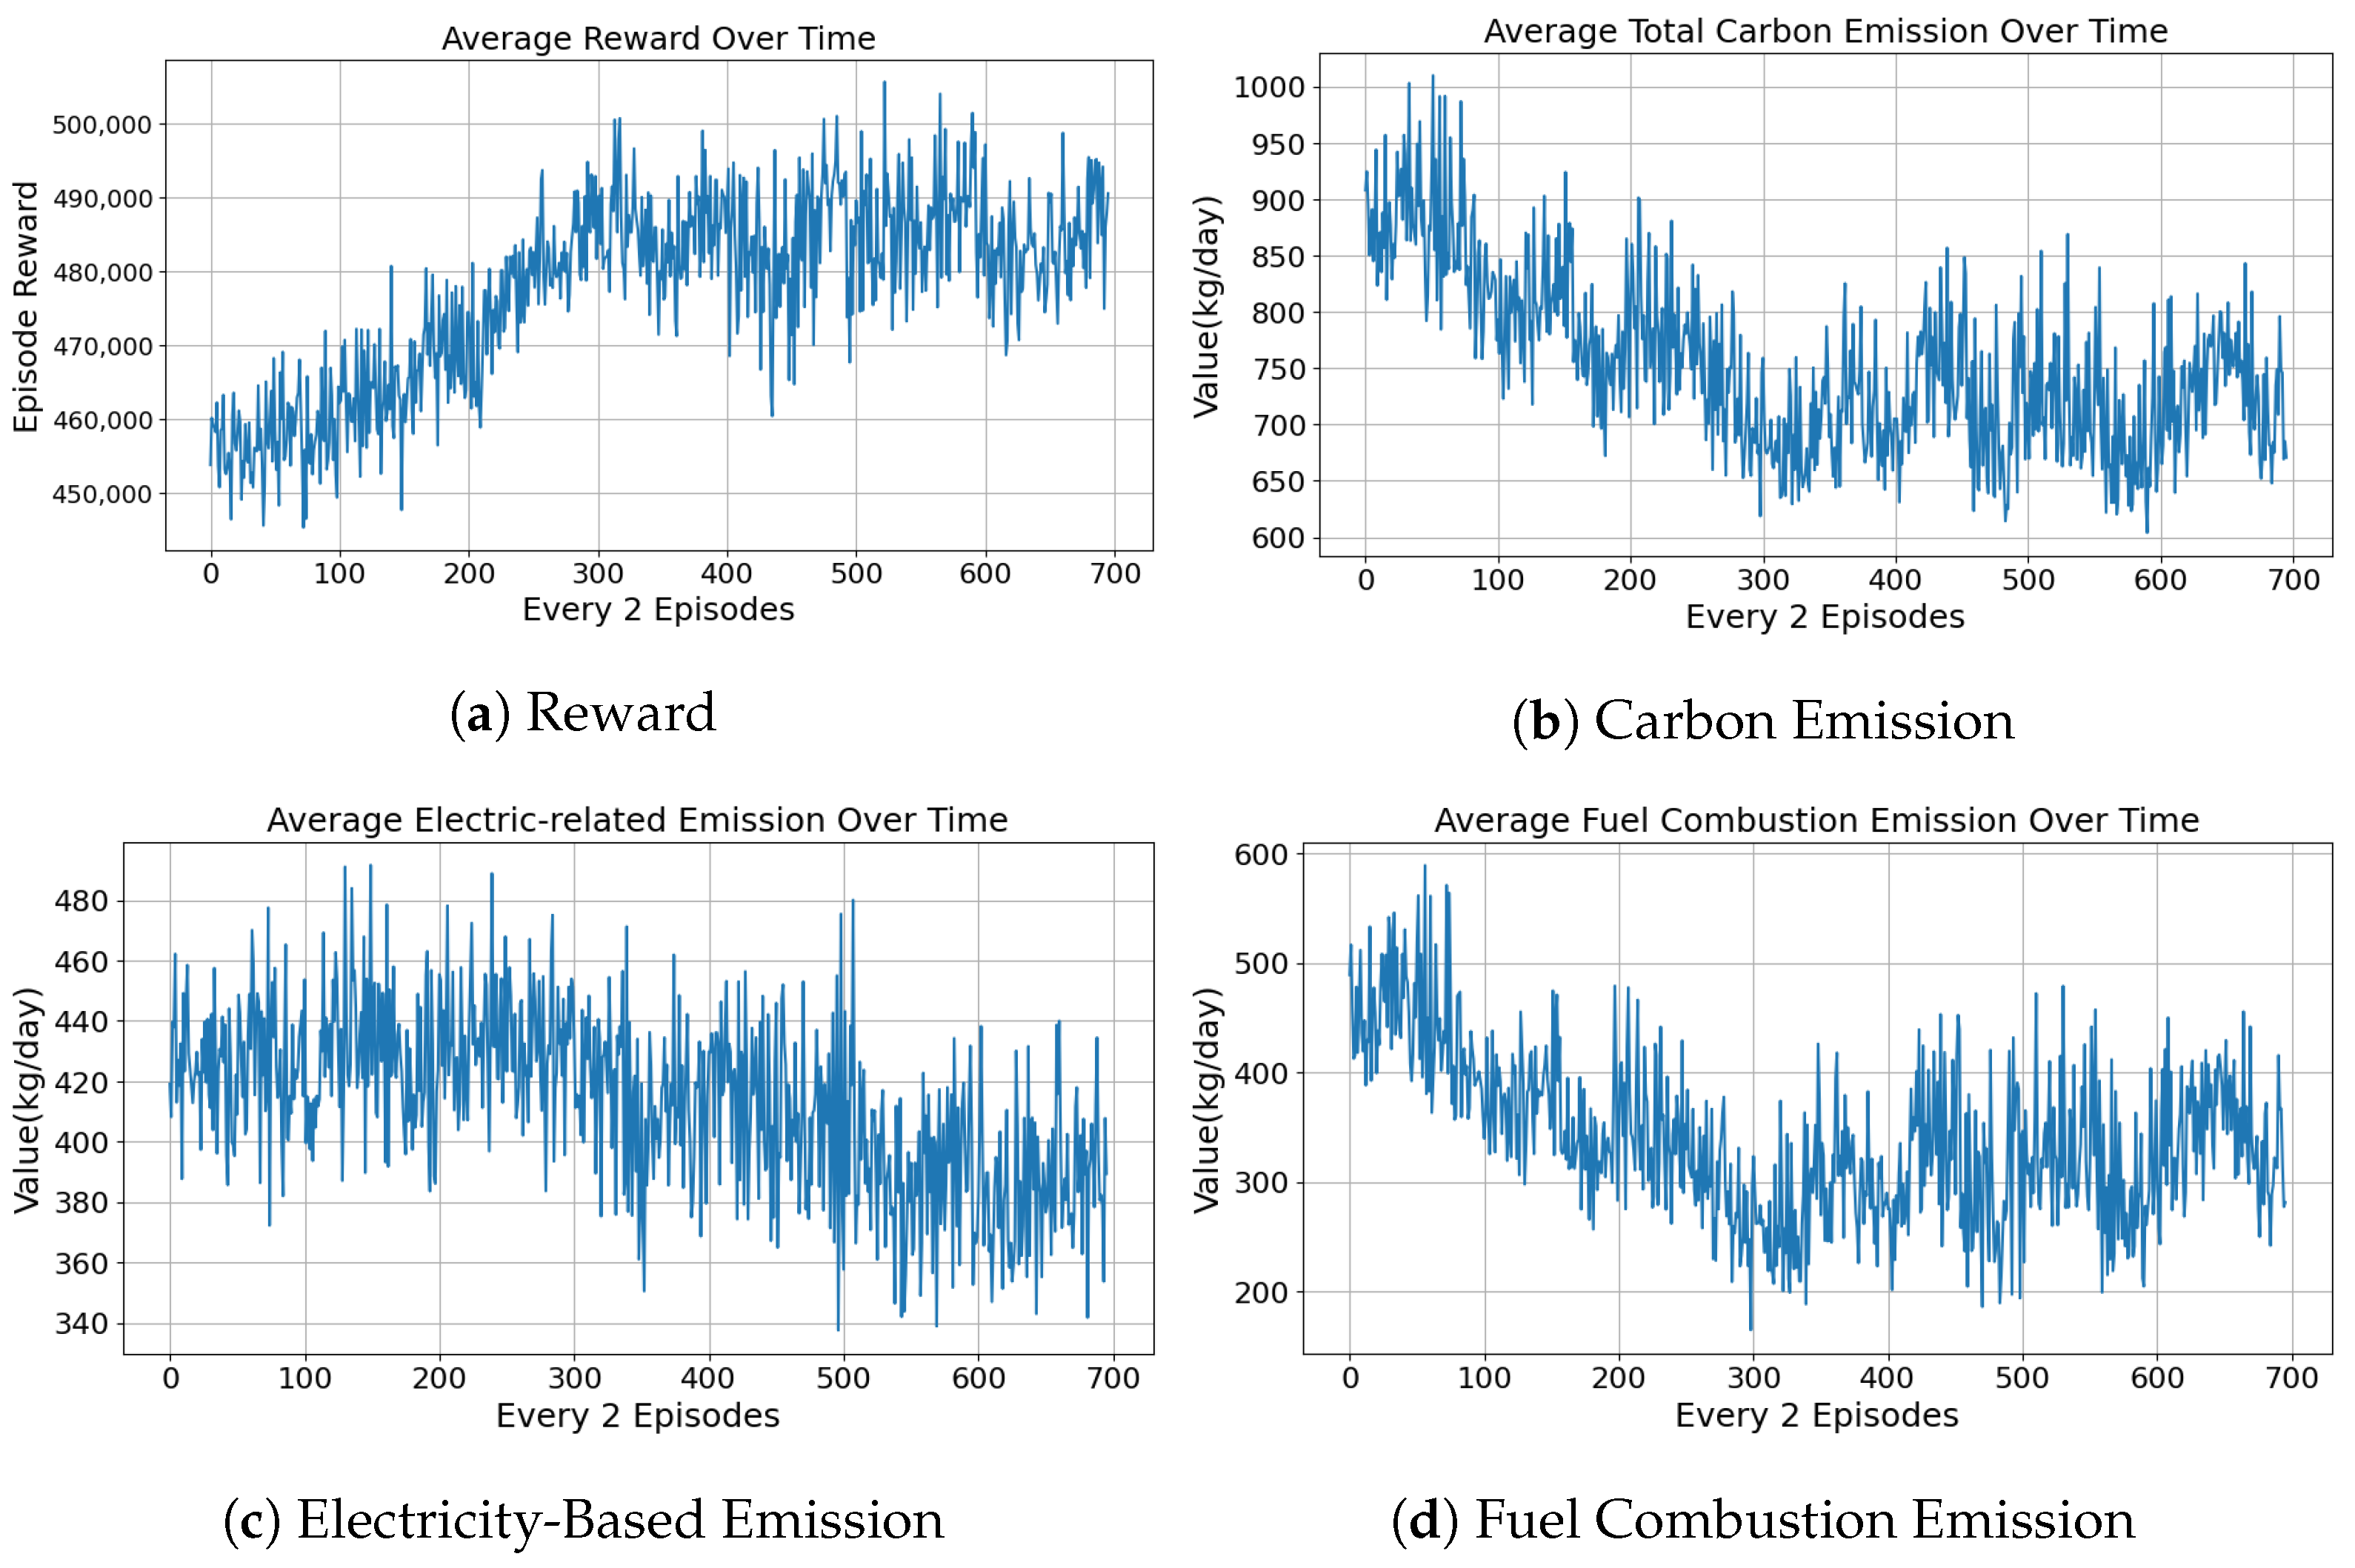
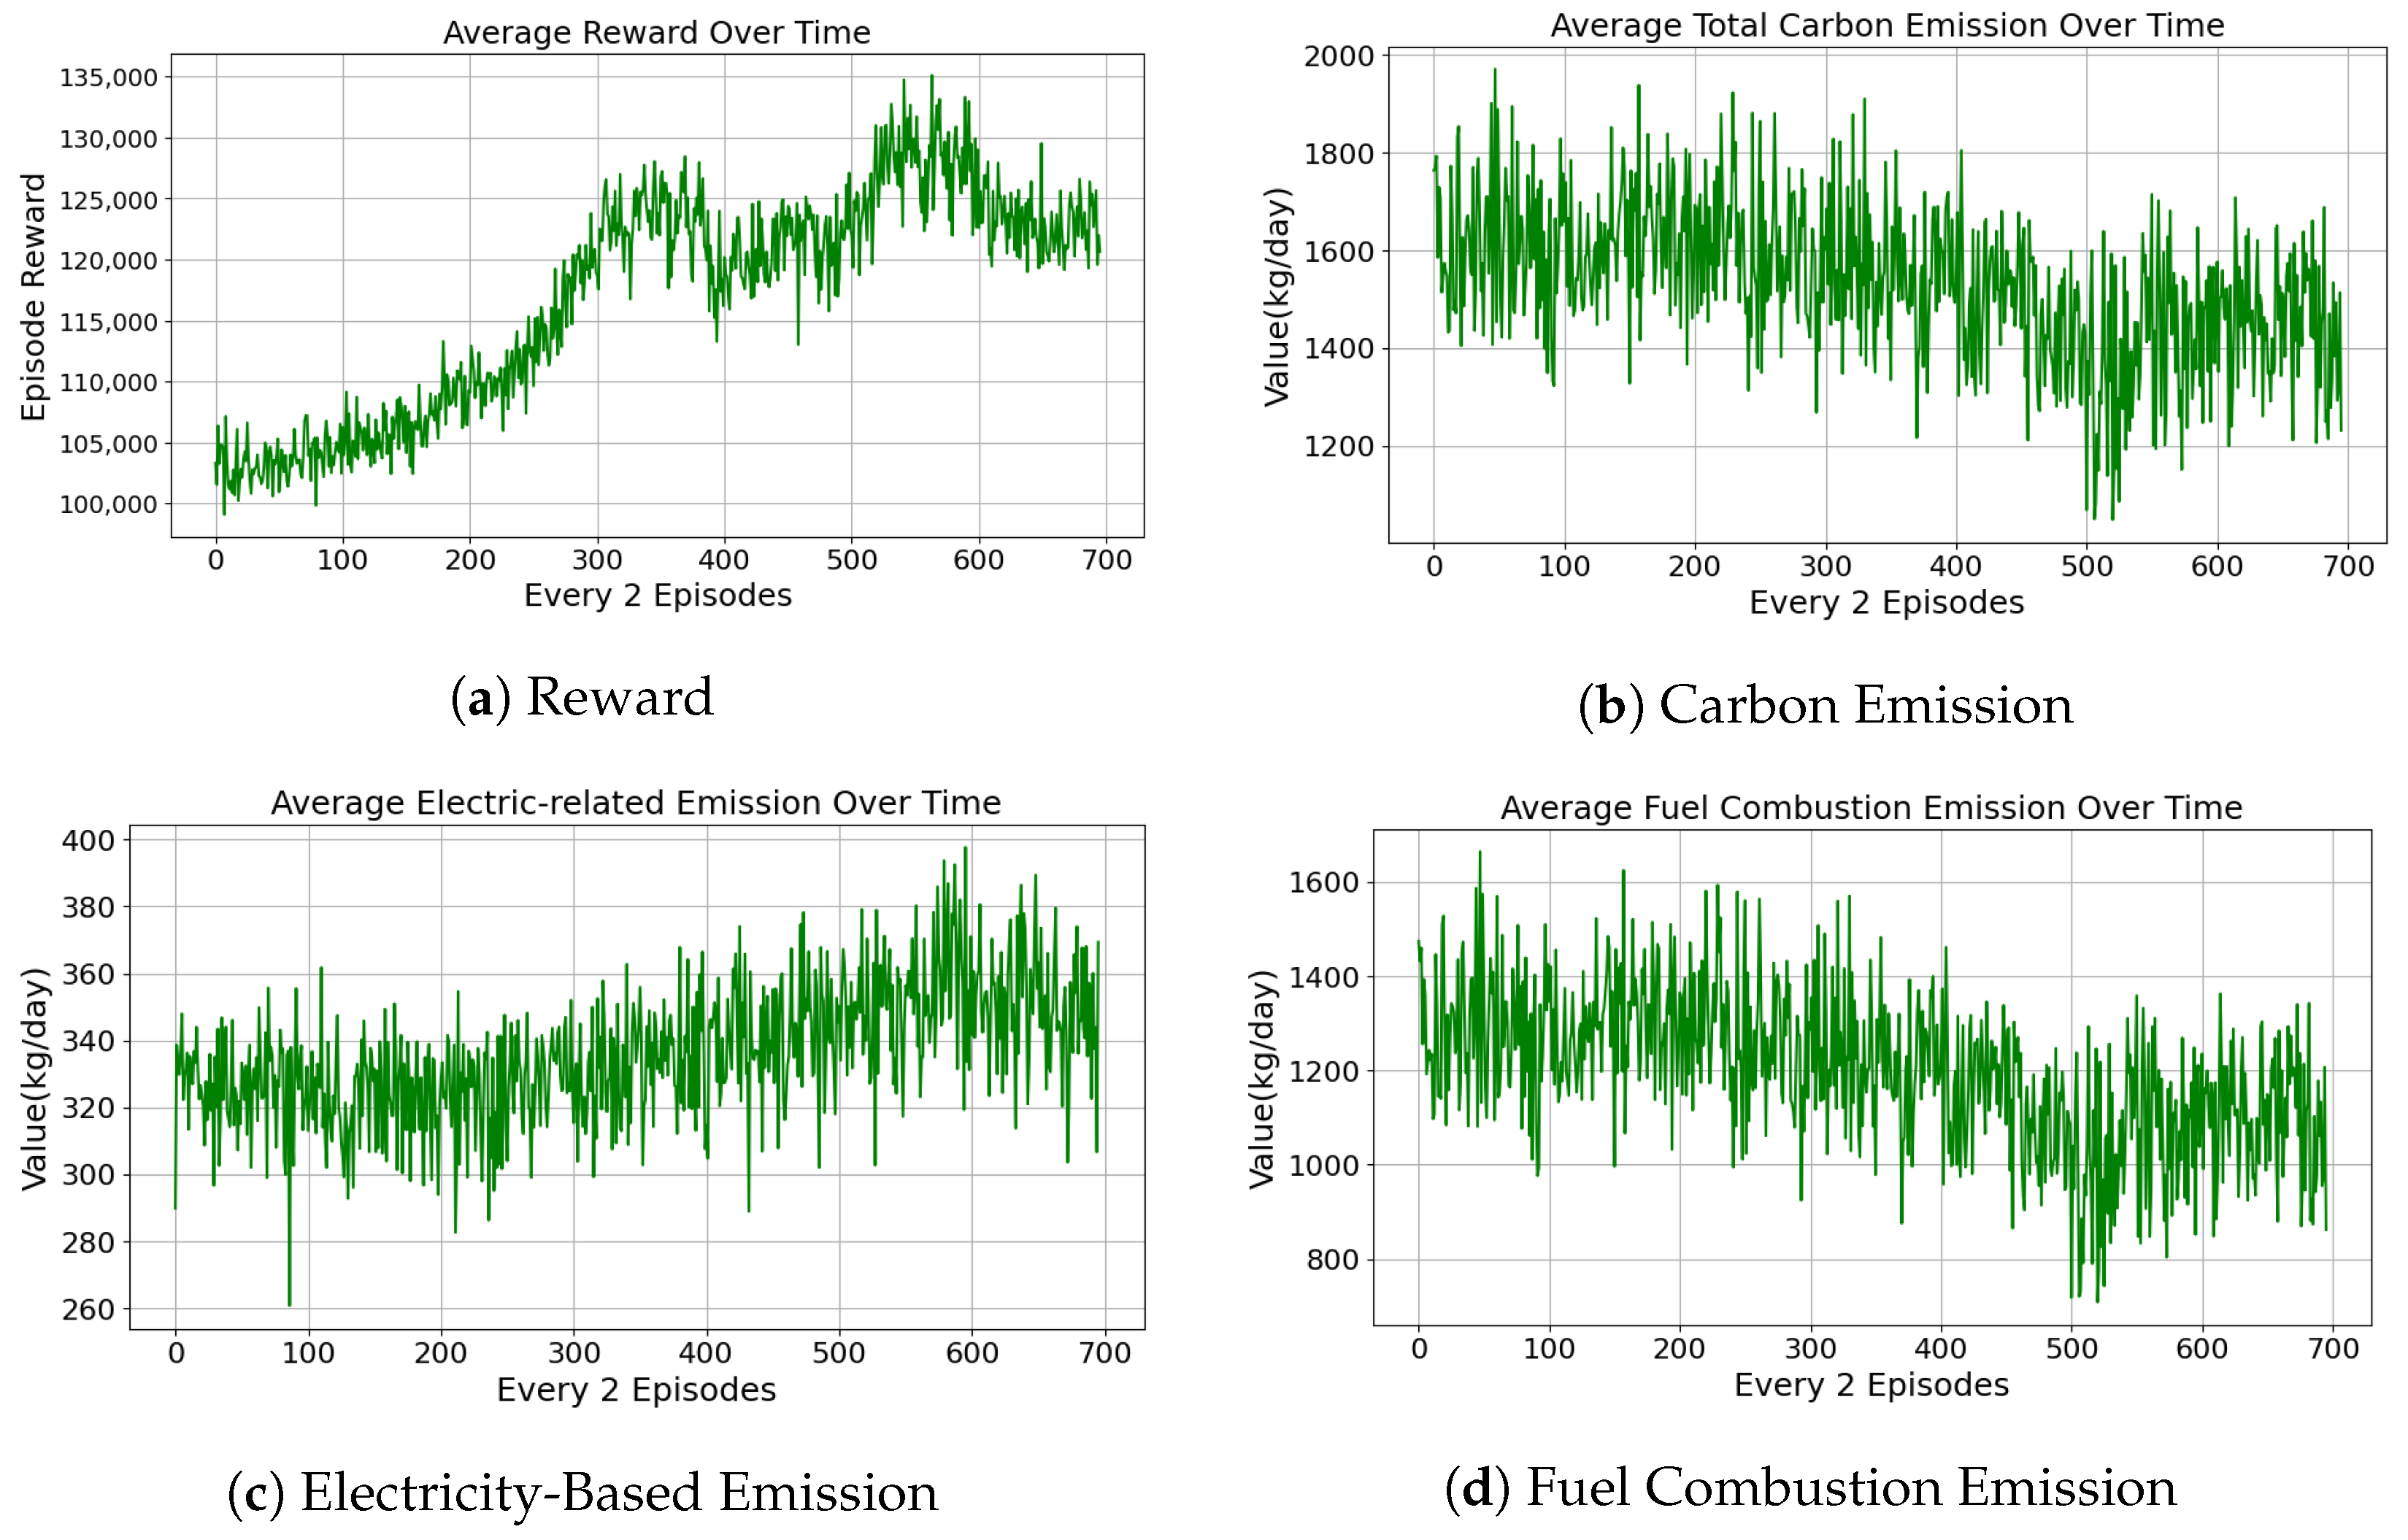
Figure 3 presents the performance trends of the proposed DRL framework under a balanced fleet composition, where 50% of the vehicles are electric and the remaining 50% are fuel-powered. In Figure 3a, the average episodic reward exhibits a clear upward trajectory during training, indicating effective policy learning. The agent progressively improves its ability to schedule tasks and manage charging operations efficiently, leading to more favorable long-term outcomes.
Figure 3b illustrates the evolution of total carbon emissions over time. A downward trend is evident, suggesting that the policy not only improves operational efficiency but also results in environmentally beneficial outcomes. The carbon reduction stems from improved coordination between the two energy sources, as the agent learns to prioritize energy-saving decisions.
Figure 3c and Figure 3d provides a decomposition of carbon emissions into electricity-related and fuel-related components, respectively. The electricity-induced emissions in Figure 3c show a steady upward trend as electric vehicles become more utilized over time. This increase, however, is accompanied by a steeper decline in fuel combustion emissions shown in Figure 3d, which suggests that the agent gradually shifts task loads from fuel-intensive vehicles to cleaner electric alternatives. This substitution effect supports the hypothesis that reinforcement learning can promote low-carbon task assignments without compromising operational performance.
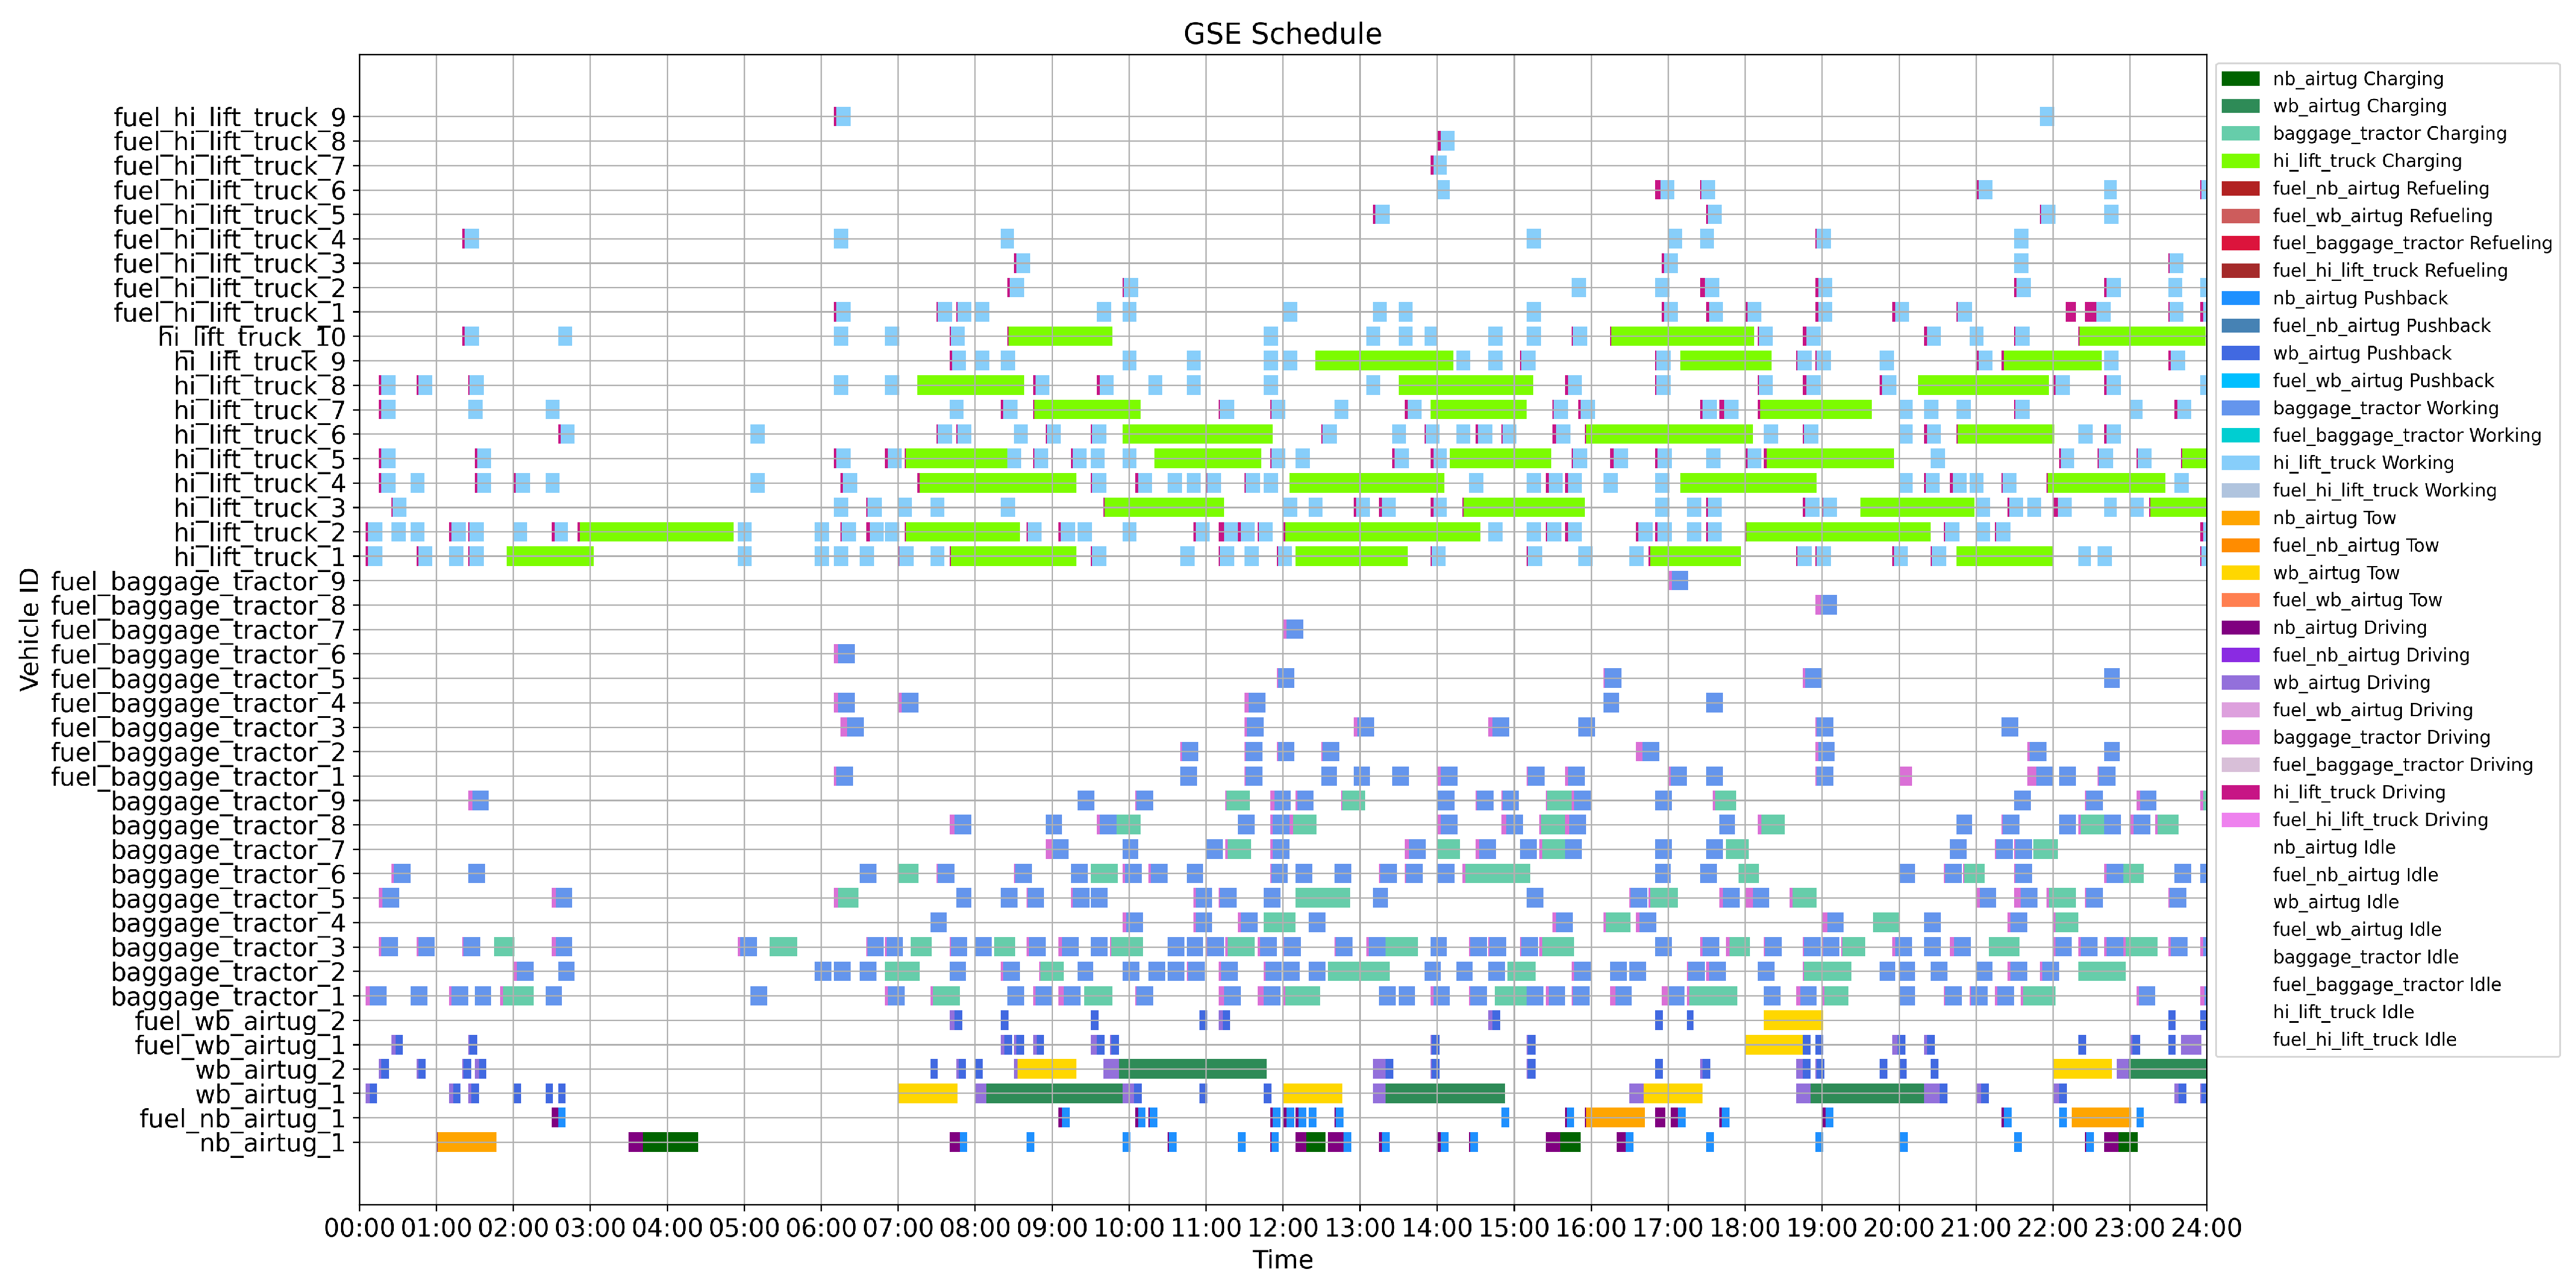
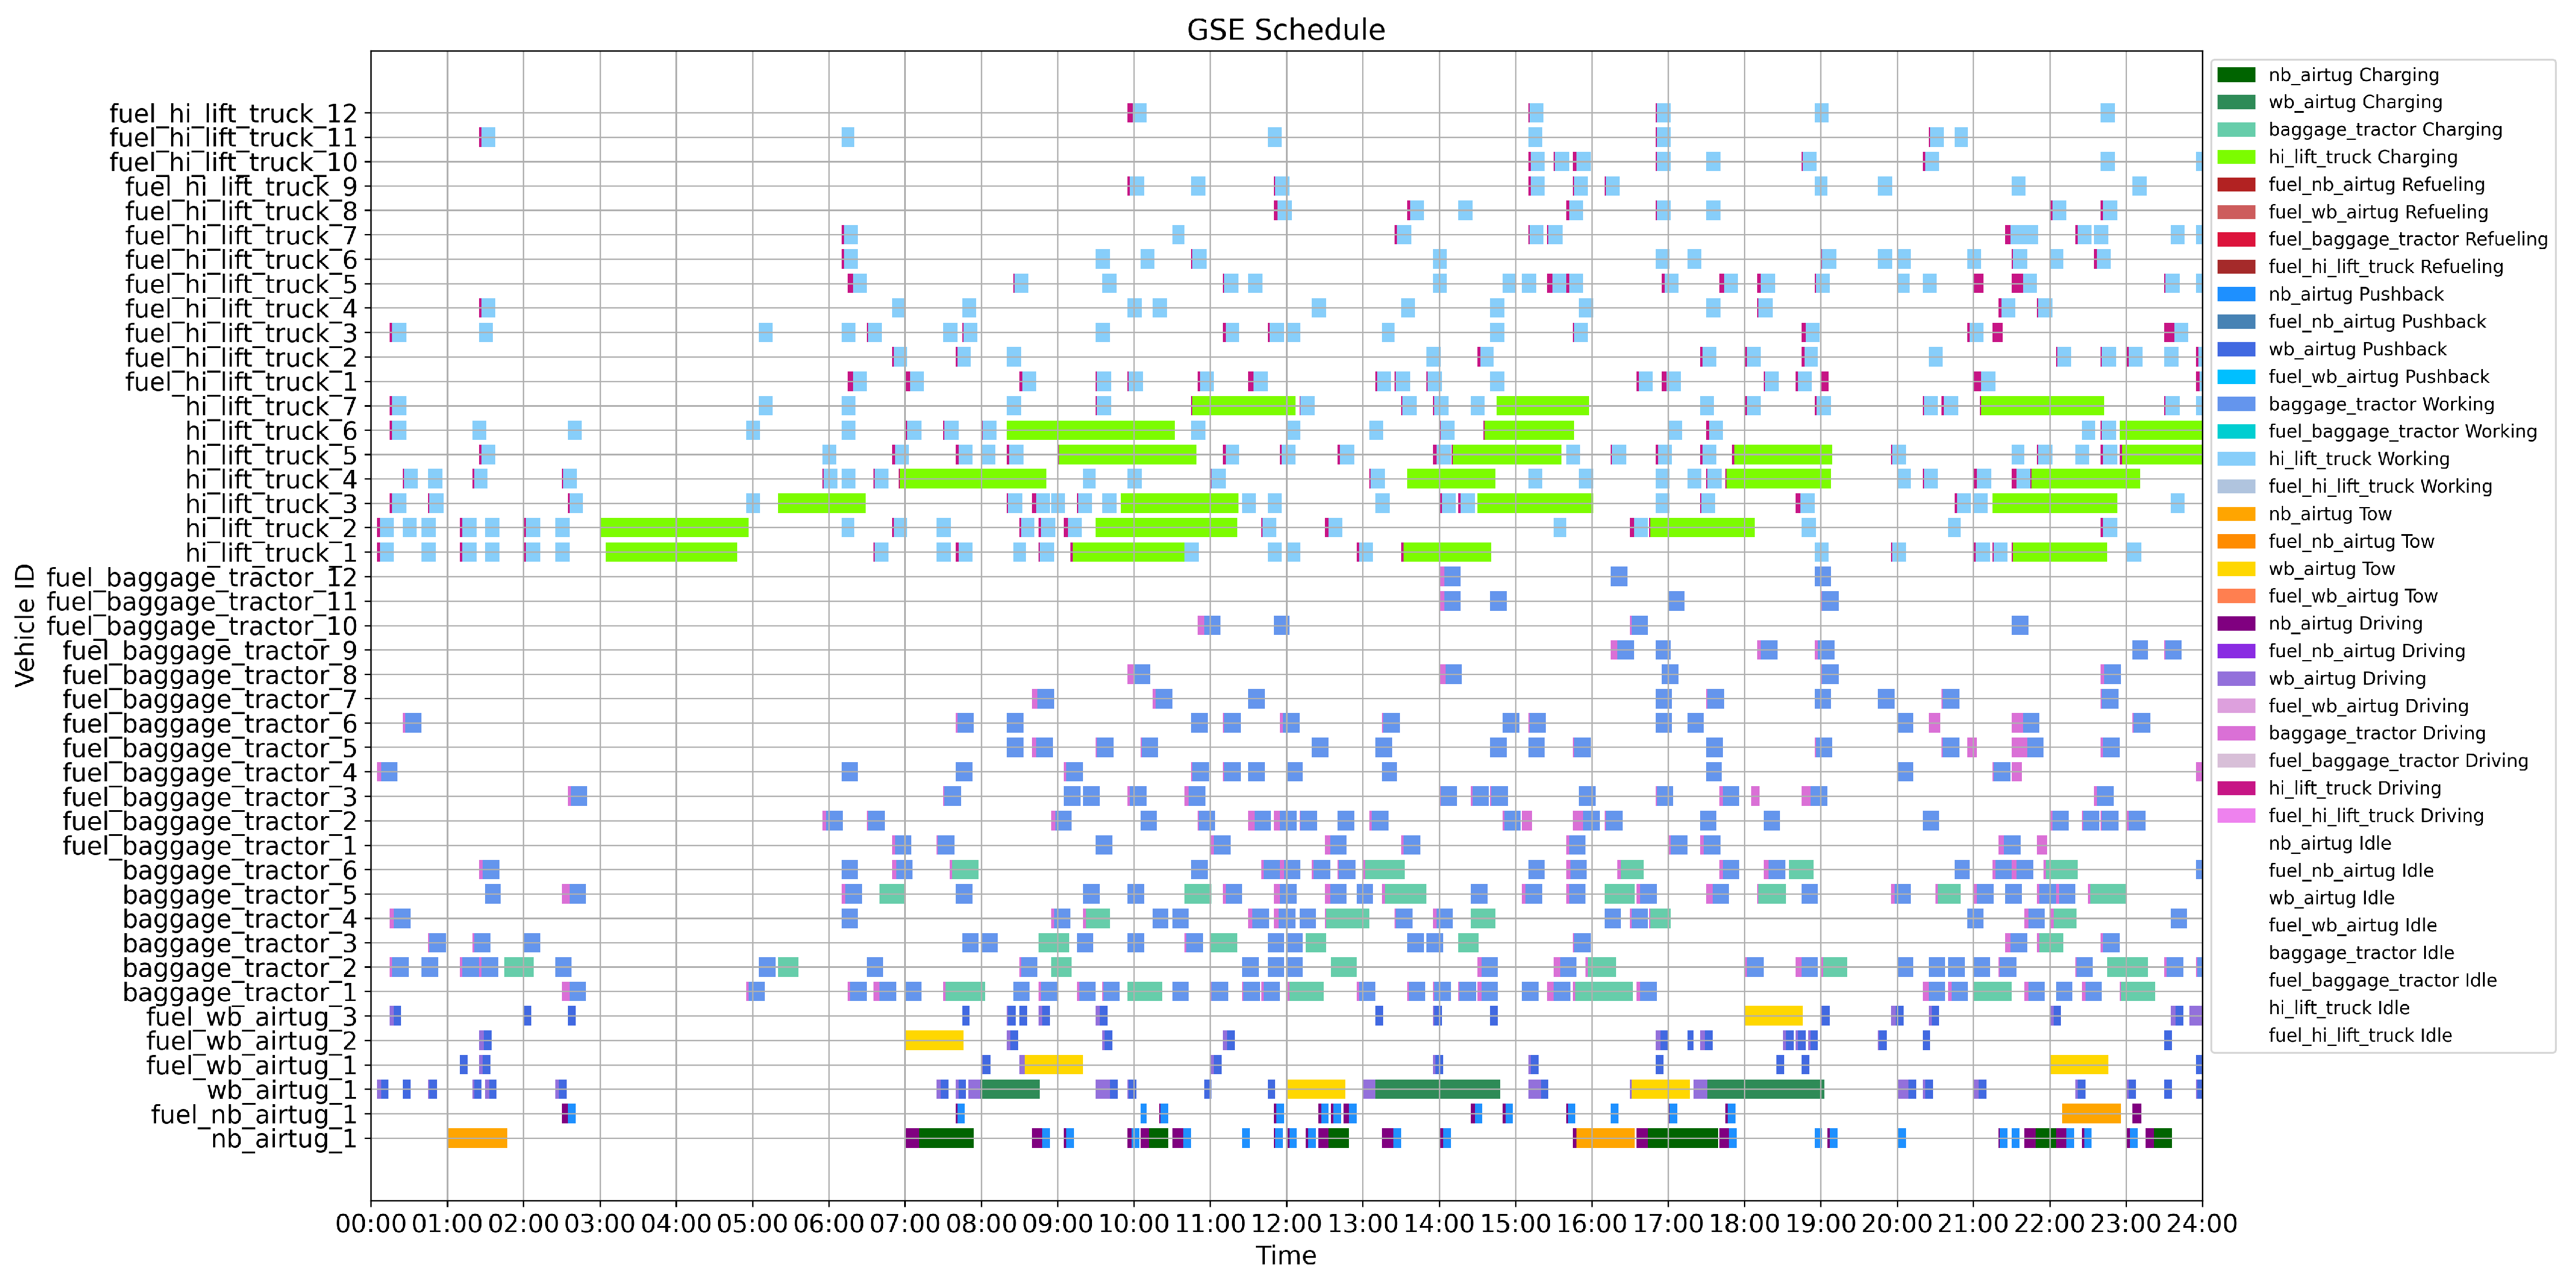
In Figure 4, the Gantt chart for the 50% electric fleet configuration illustrates a relatively balanced utilization of both electric and fuel-powered GSE vehicles throughout the operational day. Vehicles are actively engaged in a variety of tasks, such as towing, baggage handling, and lift operations, with minimal prolonged idle durations. Notably, electric vehicles exhibit moderate and regularly distributed charging sessions, indicating effective energy replenishment scheduling without significant overlap or congestion.
Fuel-powered vehicles complement the workload, providing additional operational flexibility. Refueling activities are relatively sparse and short in duration, demonstrating that fuel vehicles can cover high-demand tasks without excessive downtime. The overall task distribution across different GSE types appears well coordinated, with alternating patterns of work and energy supply. This balanced deployment facilitates consistent service performance while preventing excessive strain on charging infrastructure.

5.3.2. 80% Electric Fleet

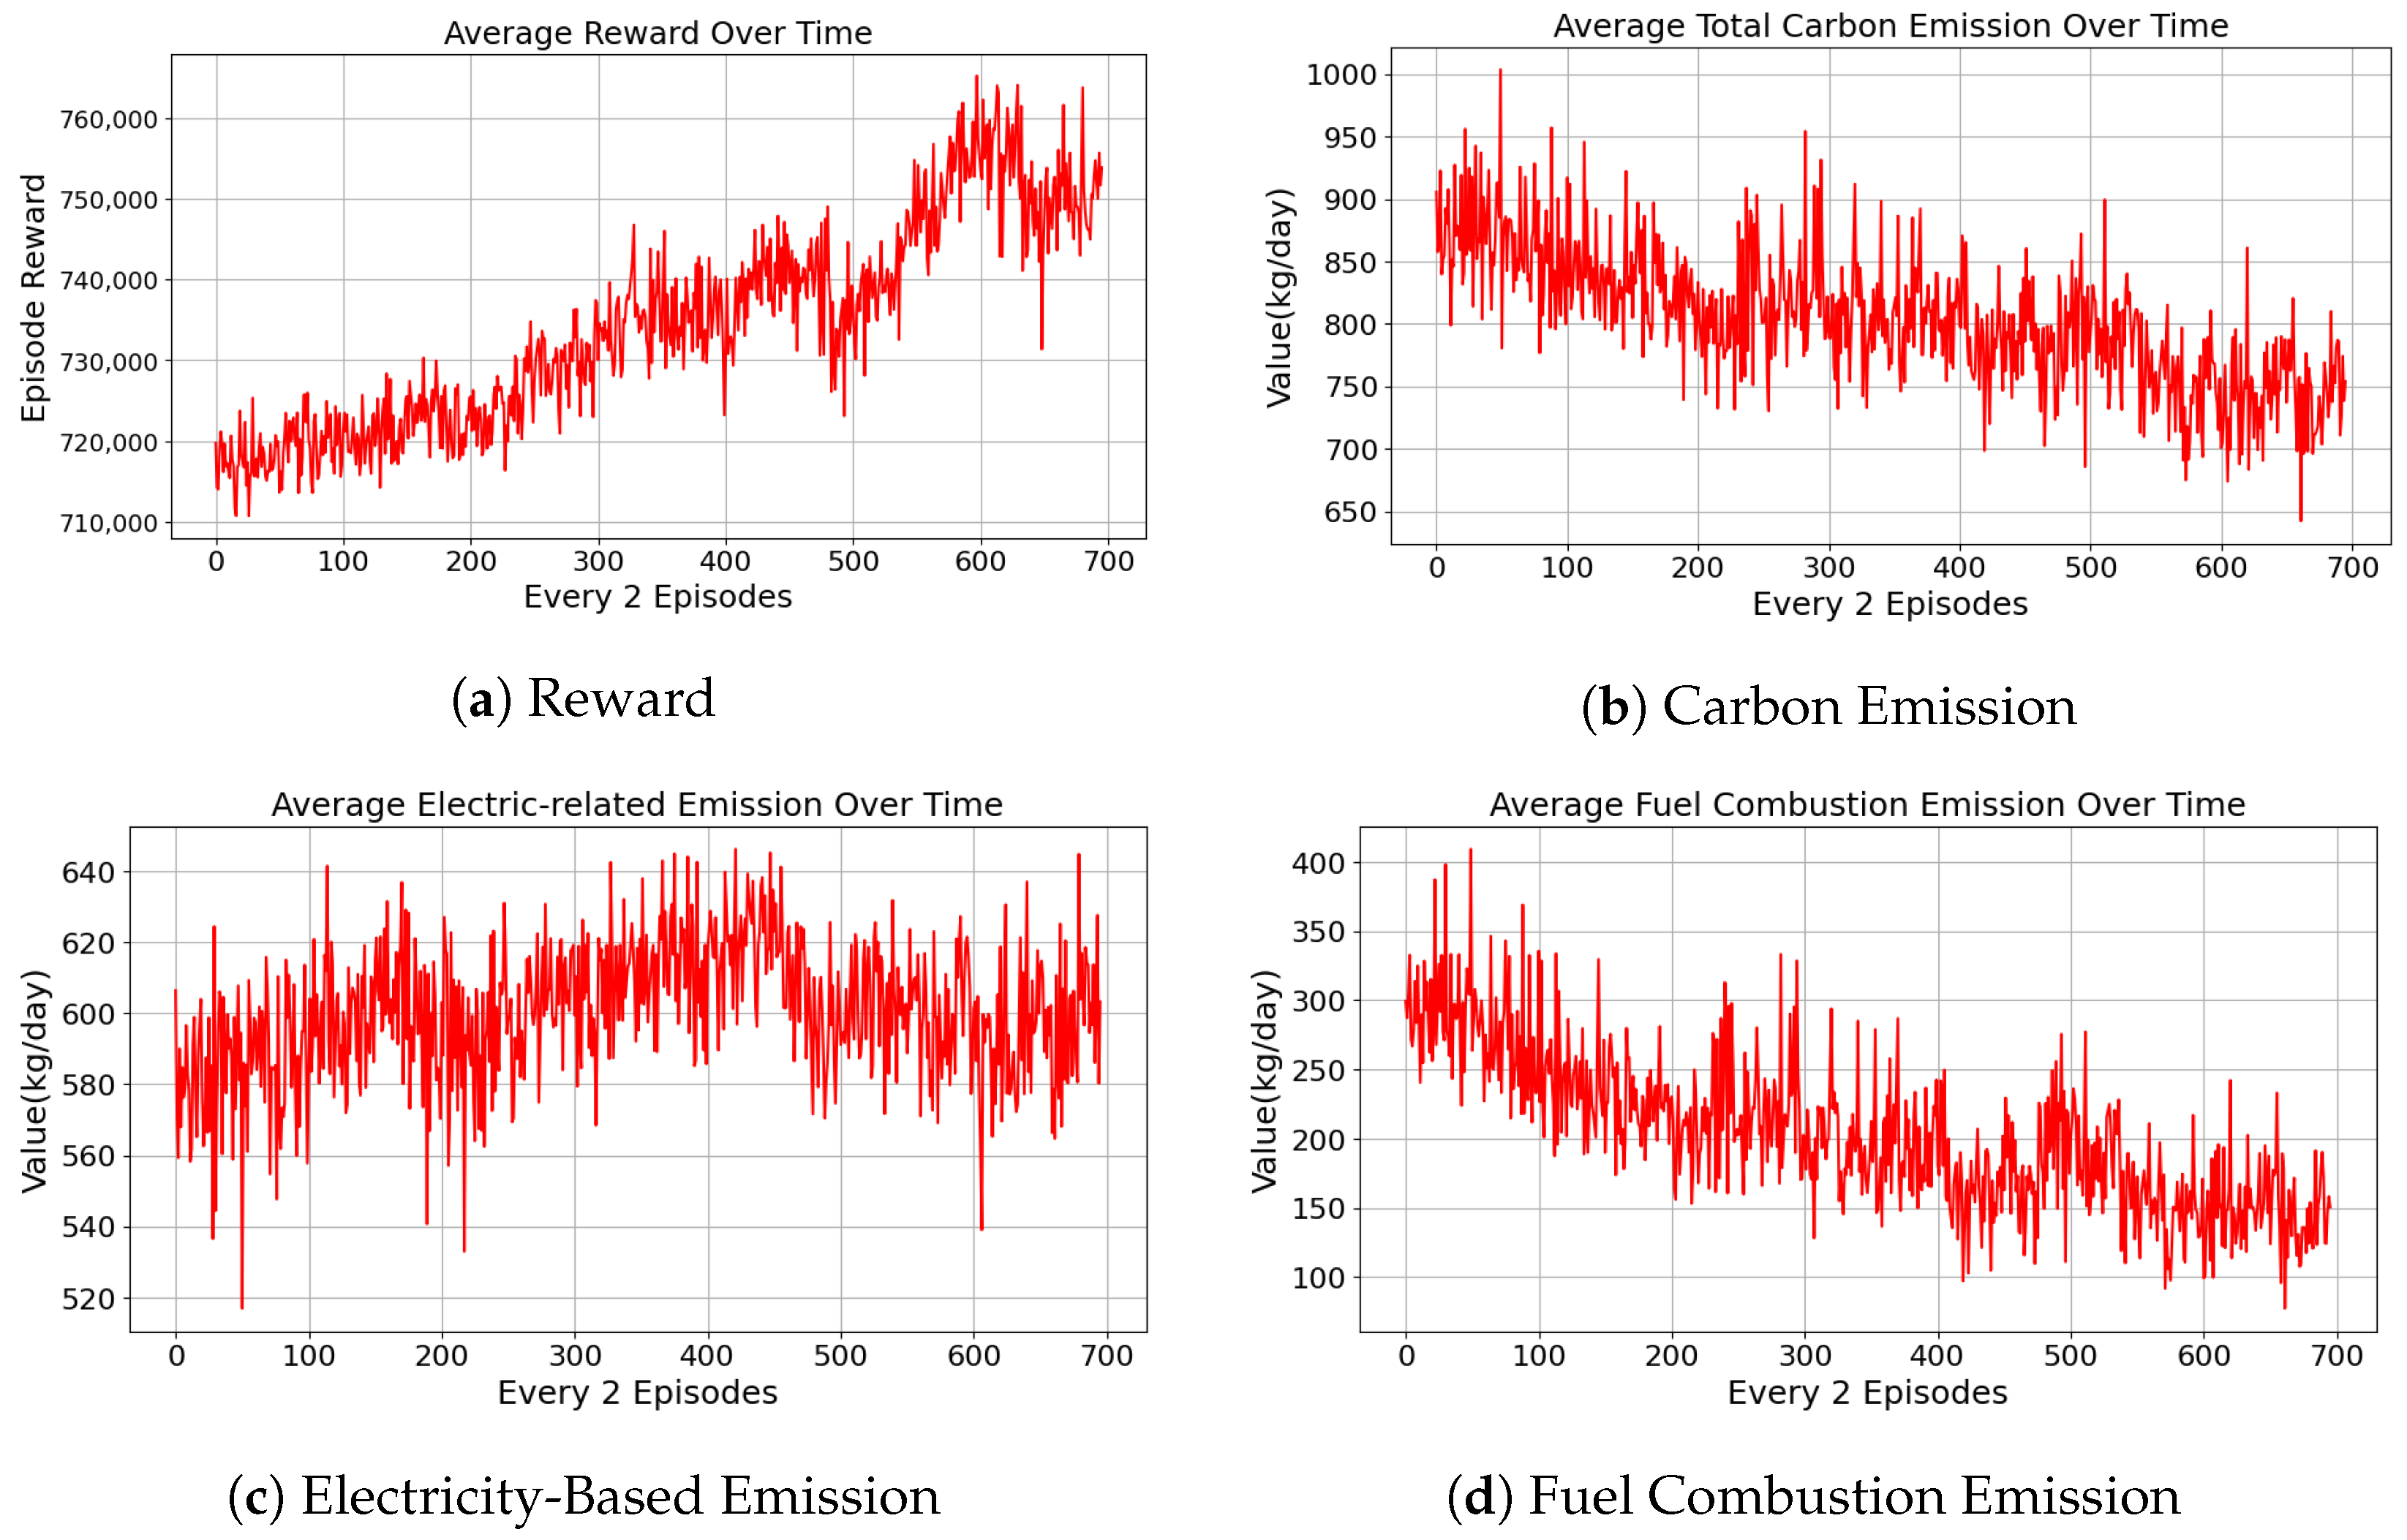
Figure 5 illustrates the training dynamics under a highly electrified fleet configuration, where 80% of the vehicles are electric. In Figure 5a, the average episode reward shows a clear and stable upward trajectory throughout training, indicating that the PPO-based agent effectively learns to optimize scheduling and energy decisions in this electric-dominant environment.
The trend in total carbon emissions, as presented in Figure 5b, reveals a steady and significant decline over time. This suggests that the high electrification ratio, combined with intelligent scheduling, yields substantial environmental benefits. The agent effectively leverages the low-emission nature of electric vehicles to reduce overall carbon output without compromising operational performance.
Figure 5c focuses on electricity-induced carbon emissions. The curve remains relatively stable, with minor fluctuations around a slightly increasing trend. This is expected, as electric vehicles handle the majority of tasks, causing a higher baseline in electricity consumption. However, since electricity-related emissions are inherently lower than those from fossil fuels, the environmental impact remains manageable.
In contrast, Figure 5d shows a pronounced and continuous reduction in fuel-related emissions, approaching minimal levels by the end of training. This indicates that the agent effectively minimizes the use of fuel-intensive vehicles, reserving them for only critical or overflow tasks when electric capacity is insufficient.
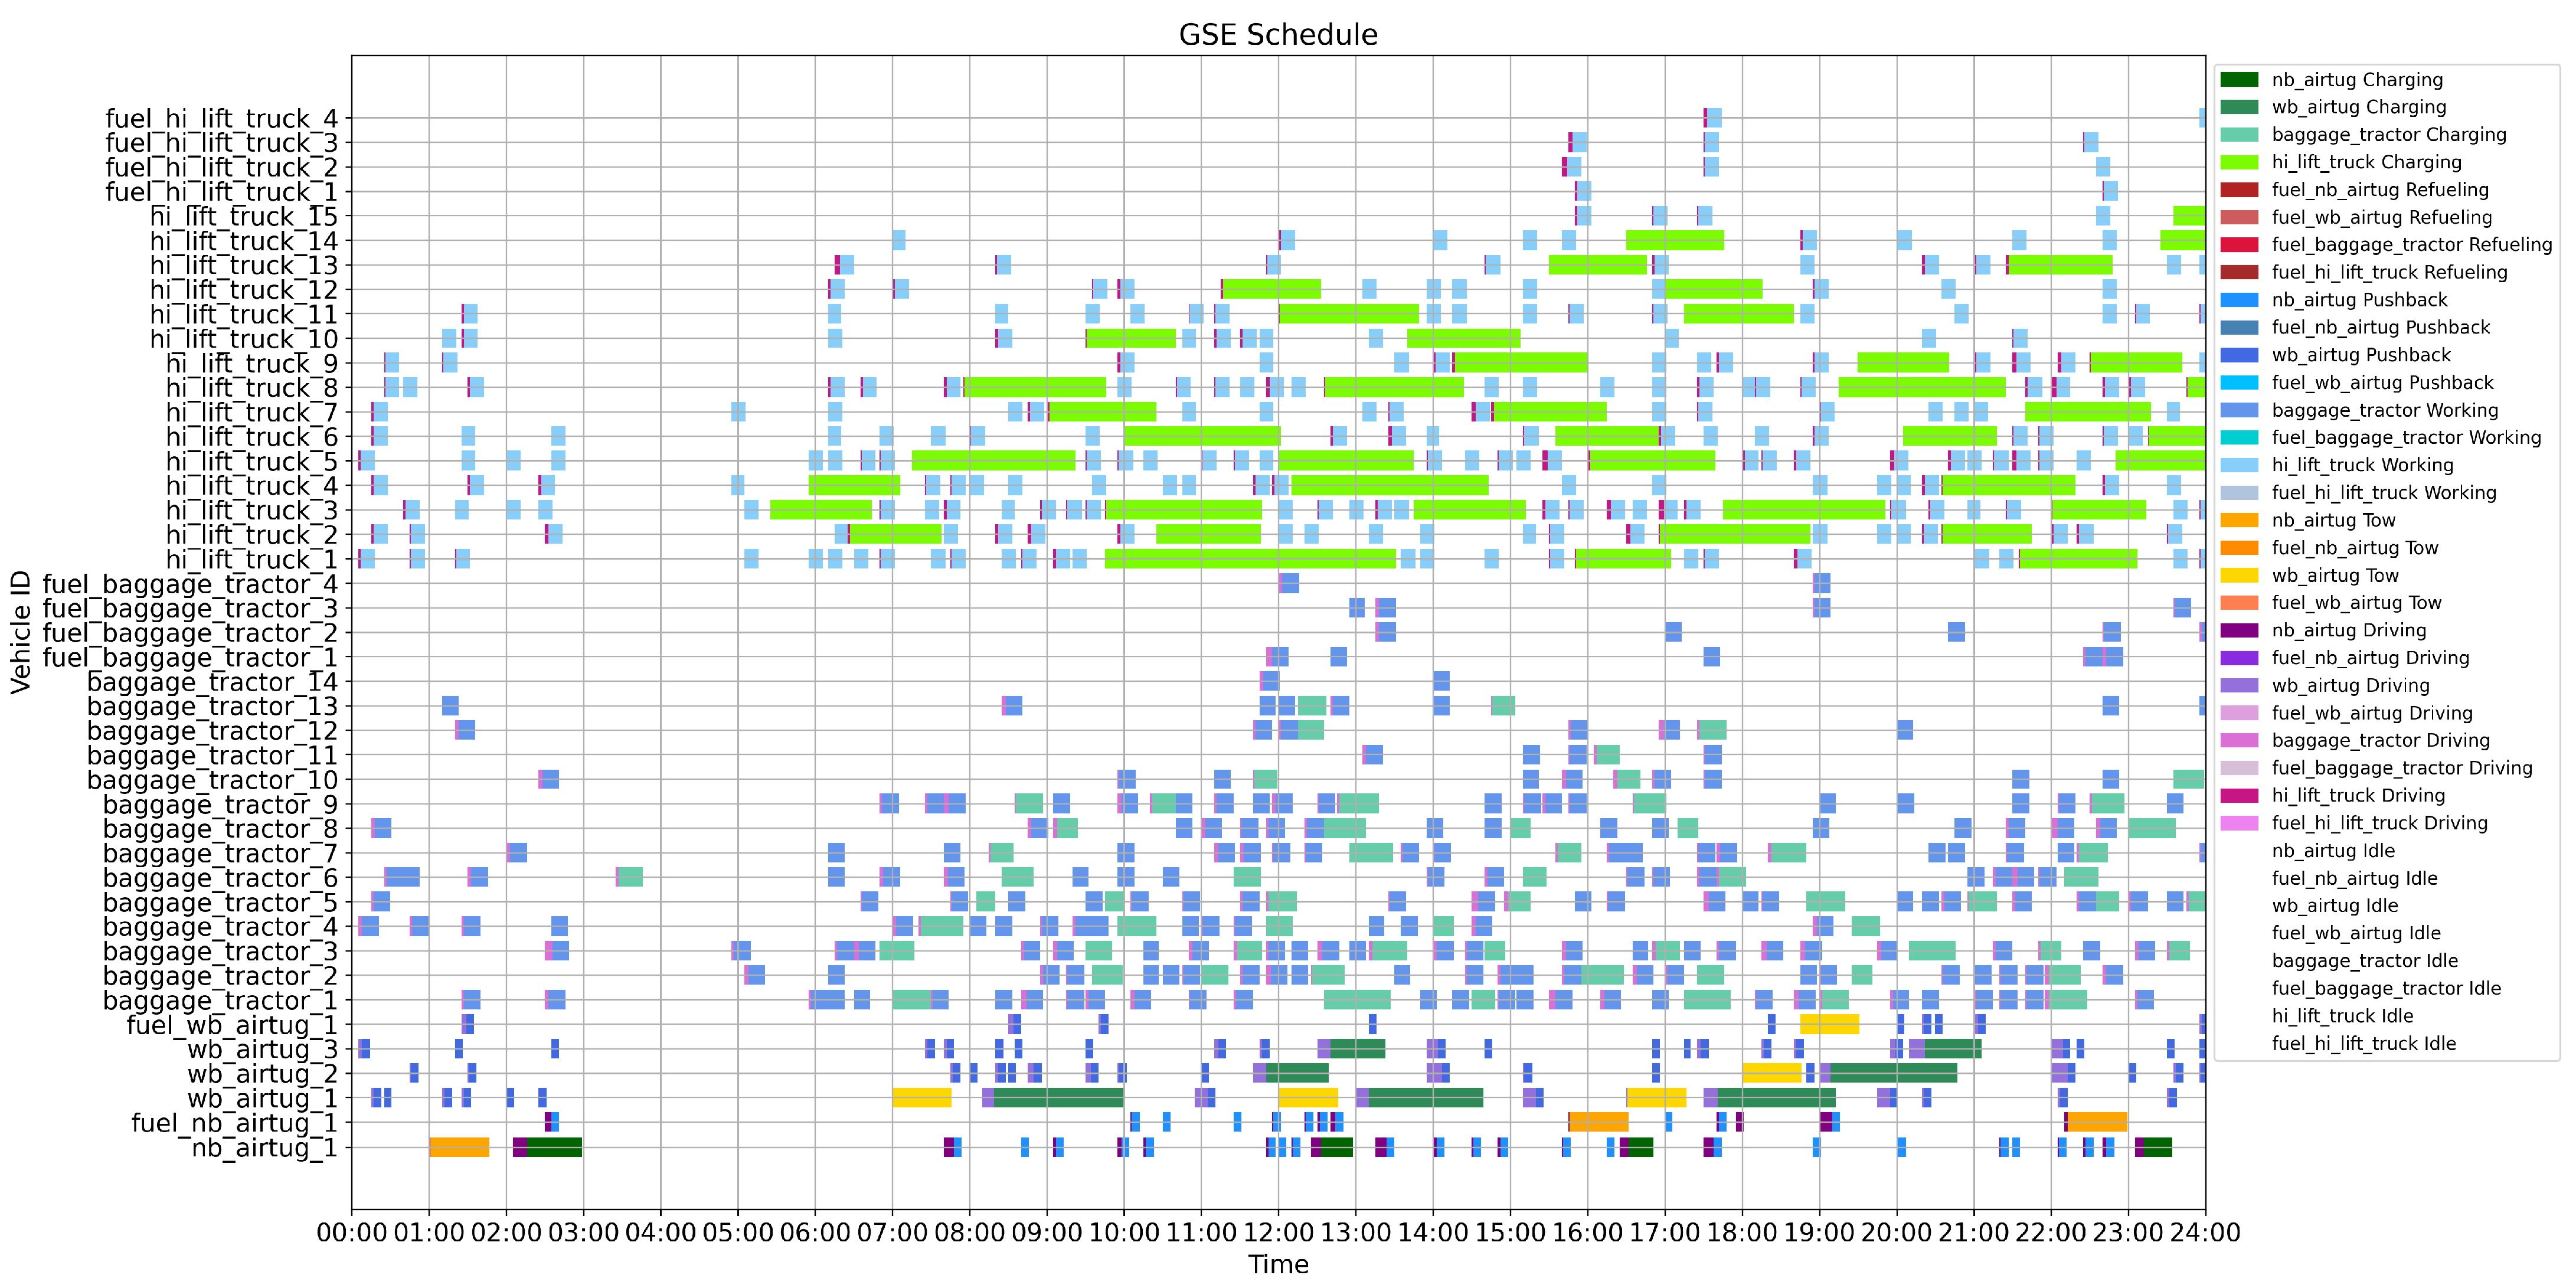
In the 80% electric fleet configuration shown in Figure 6, the Gantt chart reveals an increased reliance on electric vehicles, which dominate task execution across the operational timeline. Charging activities are noticeably more frequent and sometimes prolonged, especially among high-consumption GSE vehicle types such as hi-lift trucks. The denser scheduling of charging periods, occasionally overlapping with peak task hours, suggests elevated demand on charging infrastructure and a more constrained scheduling environment.
Despite the heavy use of electric vehicles, task allocation remains well maintained, with service, driving, and idle periods clearly structured. However, some vehicles show extended waiting or idle times, potentially due to limited charger availability or contention among multiple units. Refueling operations are minimal, confined to a few fuel-based vehicles that serve as supplementary resources.

5.3.3. 30% Electric Fleet

Under the 30% electric vehicle deployment scenario, the proposed reinforcement learning model demonstrates steady performance improvements over time. As shown in Figure 7a, the average reward increases progressively with training, indicating that the agent effectively learns to balance operational objectives such as task completion and energy management. Correspondingly, Figure 7b shows a downward trend in overall carbon emissions, suggesting the framework’s ability to optimize mixed-fleet scheduling for environmental benefit, even with a limited share of electric GSE vehicles.
In terms of emission decomposition, Figure 7c illustrates that electricity-based emissions remain relatively stable with a slight upward trend, attributable to the increased utilization of electric vehicles. Meanwhile, Figure 7d shows a gradual decline in fuel combustion emissions, reflecting more efficient fuel-powered vehicle deployment and reduced idle times. These results confirm the model’s capability to coordinate hybrid fleets in a way that both meets operational demands and contributes to carbon reduction.
The corresponding Gantt chart in Figure 8 highlights the scheduling pattern across all vehicle types. Refueling tasks are more prevalent and distributed throughout the day, while charging events are relatively sparse and localized to a few electric baggage tractors and hi-lift trucks. Frequent task fragmentation and interleaved idle states suggest a higher scheduling burden on fuel-based units, which exhibit increased driving and task-switching frequency. Despite this, the model ensures a feasible allocation of all task types, demonstrating its robustness in low-electrification environments.

5.3.4. Comparative Analysis Across Electrification Scenarios

A cross-scenario comparison of the 30%, 50%, and 80% electric fleet configurations reveals distinct patterns in system performance, emission dynamics, and operational behavior. As the proportion of electric vehicles increases, the reinforcement learning agent exhibits improved convergence efficiency and optimization quality, as shown in Figure 9. In particular, the 80% electric scenario achieves the most significant reductions in both total and fuel-related carbon emissions, demonstrating the effectiveness of electrification when paired with intelligent scheduling.
The 50% scenario represents a balanced transition stage, where reward growth is consistent and emissions decline steadily, especially from fuel combustion. Notably, electricity-related emissions show an upward trend as electric vehicles undertake more tasks, but the overall emission profile remains favorable compared to the baseline.
In contrast, the 30% electric fleet scenario exhibits slower convergence and more pronounced fluctuations in both reward and emission metrics. As shown in the training curves, the reward increases gradually but is accompanied by noticeable variance, while carbon emissions decline less consistently compared to higher-electrification cases. The limited availability of electric vehicles reduces the agent’s scheduling flexibility, leading to heavier reliance on fuel-powered GSE vehicles. This constraint introduces greater complexity in optimizing the fleet, particularly in managing energy supply and task assignments.
Visual analysis of the Gantt schedules confirms these trends: the 80% configuration achieves compact, efficient task grouping and minimized idle periods; the 50% setup maintains operational balance with moderate task overlap; while the 30% system suffers from scattered task assignments, heightened idling, and denser refueling patterns.
These results underscore the synergy between fleet electrification and intelligent control policies: higher electrification not only enhances environmental performance but also enables more efficient and stable scheduling, reducing operational strain and supporting sustainability goals.

5.4. Operational Performance Under Different Fleet Compositions

The evaluation considers three key operational metrics: (a) Delay Rate, defined as the proportion of delayed tasks to the total number of tasks. (b) Average Response Time, measuring the mean time between task release and the moment a vehicle begins execution. (c) Vehicle Utilization, calculated as the ratio of working time to the total of working and idle time, reported separately for electric vehicles and fuel-powered vehicles.
Table 2 summarizes the performance of mixed fleets with different electric vehicle proportions. Under a 50% electric vehicle fleet, the delay rate is 4.5% with an average response time of 1.71 min, and electric vehicles achieve a utilization of 48.3% compared to 11.3% for fuel-powered vehicles. When the electric vehicle share decreases to 30%, the delay rate slightly increases to 5.5% and response time to 1.82 min, while electric vehicles utilization rises to 54.1% and fuel-powered vehicles utilization to 15.7%. Conversely, with 80% electric vehicle penetration, the delay rate is 5.4%, average response time 1.76 min, and electric vehicle utilization decreases to 42.5%, with fuel-powered vehicles utilized at 10.1%.
Overall, the 50% electric vehicle fleet achieves the lowest delay rate and the fastest response time, indicating a balanced operational efficiency between electric vehicles and fuel-powered vehicles. A smaller electric vehicle share (30%) results in higher utilization of both electric vehicles and fuel-powered vehicles but at the cost of a higher delay rate and slower response. In contrast, when the electric vehicle share increases to 80%, the system maintains a moderate delay rate and response time, but electric vehicle utilization drops considerably, suggesting potential underuse of electric vehicles. These results imply that a balanced fleet composition, rather than extreme electric vehicle dominance or scarcity, may provide the most stable and efficient ground service operations.

5.5. Energy Consumption Patterns Across Fleet Compositions

The energy consumption analysis reveals clear trends corresponding to the proportion of electric and fuel-powered vehicles. In the 30% electrification scenario, electric vehicles exhibit moderate energy usage with higher variance throughout the day, indicating occasional peak charging events likely caused by constrained infrastructure or irregular dispatching. Fuel-powered vehicles, on the other hand, maintain low but steady consumption with a few sharp spikes during peak demand hours, reflecting infrequent but high-load refueling behavior.
With a 50% electric vehicle ratio, electric energy usage becomes more pronounced and evenly distributed, suggesting improved load balancing and better integration of charging schedules with operational demands. The fuel-powered vehicle energy profile remains similar but shows reduced magnitude and frequency of spikes, implying partial workload offloading to the electric fleet.
In the 80% electrification scenario, electric energy consumption increases significantly, with a notable rise in both median and upper quartile values. This reflects a higher overall system dependency on electric resources, supported by coordinated charging strategies that mitigate the risk of overloading. Meanwhile, fuel energy usage drops to minimal levels, with almost negligible variance, indicating that fuel vehicles are primarily reserved for backup or niche operational roles. These findings confirm that higher electrification levels lead to more efficient and smoother energy distribution across the fleet.

5.6. Scalability Evaluation

We train the model in two new scenarios to evaluate its adaptability in resource-constrained situations: (i) reduced fleet size (50% fewer vehicles) and (ii) reduced heterogeneity (50% fewer vehicle types). As shown in Figure 10, Figure 11 and Figure 12, the agent continues to learn under both disturbances. In Scenario 1 (fleet downsizing), the reward curve rises steadily and plateaus at a lower level than the nominal case, consistent with capacity scarcity; the accompanying Gantt chart shows denser charging windows and more fragmented task segments, yet the policy maintains temporal feasibility by reallocating vehicles and staggering charging. In Scenario 2 (reduced heterogeneity), the reward reaches a higher peak before tapering late in training, indicating that limited substitution across vehicle types induces bottlenecks as the day progresses; the Gantt chart reveals longer contiguous stretches of type-critical operations and tighter overlaps around charging slots. Overall, these disturbance experiments exhibit graceful degradation and adaptability, as no prolonged idleness or infeasible backlogs emerge, which demonstrates that the learned scheduler remains robust when capacity is reduced or operational flexibility is constrained.

6. Conclusions

The growing adoption of electric ground support equipment vehicles at airports offers a promising pathway toward sustainable operations but also brings new challenges in operational planning, resource allocation, and multi-energy fleet integration. This study proposes an end-to-end Deep Reinforcement Learning (DRL) framework to schedule and optimize hybrid fleets consisting of both electric and fuel-powered GSE vehicles in airport operations. The model integrates real-time information on vehicle state-of-charge, fuel levels, task requirements, and operational constraints, formulating the scheduling task as a Markov Decision Process. Through a carefully designed reward function, the system achieves efficient task execution, effective energy allocation, reduced carbon emissions, and balanced charger utilization.
The framework is evaluated through case studies involving flight schedules and synthetic vehicle operation data that reflect the operational characteristics of Singapore’s Changi Airport under three electric fleet ratio scenarios: 30%, 50%, and 80%. A tailored Proximal Policy Optimization (PPO) algorithm is proposed and evaluated based on task completion, fuel cost, and charging performance. Results show that the tailored PPO outperforms baseline models, adapts effectively to different fleet compositions, achieves more balanced SOC distributions, and significantly reduces overall carbon emissions.
This study reveals the following key insights across electrification scenarios: (1) A higher electric vehicle proportion of 80% improves scheduling efficiency and emission reduction, reflecting strong synergy between electrification and intelligent control. (2) The 50% scenario provides a smooth transition, balancing performance gains with operational flexibility. (3) In the 30% scenario, limited electric vehicles restrict scheduling potential, resulting in slower convergence, higher variability, and increased dependence on fuel-powered vehicles. Visualizations confirm that the learned policy coordinates task and energy distribution effectively, even under charger congestion or equipment heterogeneity.
Beyond methodological contributions, the findings of this study hold practical implications for airport managers and policymakers. The demonstrated capability of DRL-based scheduling to reduce carbon emissions and improve operational efficiency provides valuable decision support for formulating airport electrification roadmaps. In particular, the identified transition patterns across different electric fleet ratios (30%, 50%, 80%) can guide fleet replacement strategies, charging infrastructure planning, and resilience assessment under varying operational loads. These insights contribute to shaping future airport electrification strategies, supporting a sustainable and adaptive transition toward net-zero ground operations.
Future directions include three main aspects. First, we will incorporate more detailed operational constraints and objectives to better coordinate mixed fleets of electric and fuel-powered vehicles. Second, the framework will be extended to support an expanded fleet size and a broader range of specialized vehicles. Third, we aim to develop improved algorithms such as enhanced versions of PPO or other advanced algorithms to separately optimize scheduling for electric and fuel vehicles. These efforts will provide critical modeling capabilities and decision-support tools to support the complex transition toward large-scale electrification in airport operations.

Author Contributions

Conceptualization, H.-W.W. and Y.X.; methodology, H.-W.W.; software, F.W.; validation, F.W.; formal analysis, F.W.; investigation, H.-W.W.; resources, H.-W.W. and Y.X.; data curation, F.W.; writing—original draft preparation, M.Z.; writing—review and editing, H.-W.W., Y.X., and Y.P.; visualization, M.Z. and Z.C.; supervision, Y.X. and H.-W.W.; project administration, Y.X. and Y.P.; funding acquisition, Y.X and Y.P. All authors have read and agreed to the published version of the manuscript.

Funding

This research was funded by the National Natural Science Foundation of China (Grant No. 52302440), the Natural Science Foundation of Shanghai (Grant No. 22ZR1465500), and the Wuhan Pilot Program for the Construction of a Strong Transportation Nation through Science and Technology Joint Research Projects (Grant No. 2024-2-1).

Data Availability Statement

The data presented in this study are available in the Aviationstack repository at https://aviationstack.com/. These data were derived from the following public domain resource: Aviationstack API–Real-Time Flight Status & Global Aviation Data.

Conflicts of Interest

The authors have no conflicts of interest to declare. All co-authors have seen and agree with the contents of the manuscript and there is no financial interest to report. We certify that the submission is original work and is not under review at any other publication.

References

  1. ICAO. States Adopt Net-Zero 2050 Global Aspirational Goal for International Flight Operations. 2022. Available online: https://www2023.icao.int/Newsroom/NewsDoc2022/COM.49.22.EN.pdf (accessed on 23 August 2025).
  2. ACI-EUROPE. Repository of Airports’ Net Zero Carbon Roadmaps. 2023. Available online: https://www.aci-europe.org/netzero/repository-of-roadmaps.html (accessed on 25 July 2025).
  3. CAAC. The Civil Aviation Administration of China Has Issued the “14th Five Year Plan for Green Development of Civil Aviation”. 2021. Available online: https://www.caac.gov.cn/XXGK/XXGK/FZGH/202201/t20220127_211345.html (accessed on 25 July 2025).
  4. Bao, D.W.; Zhou, J.Y.; Zhang, Z.Q.; Chen, Z.; Kang, D. Mixed fleet scheduling method for airport ground service vehicles under the trend of electrification. J. Air Transp. Manag. 2023, 108, 102379. [Google Scholar] [CrossRef]
  5. Winther, M.; Kousgaard, U.; Ellermann, T.; Massling, A.; Nøjgaard, J.K.; Ketzel, M. Emissions of NOx, particle mass and particle numbers from aircraft main engines, APU’s and handling equipment at Copenhagen Airport. Atmos. Environ. 2015, 100, 218–229. [Google Scholar] [CrossRef]
  6. Changi Airport Group. Tackling Emissions in the Air and on the Ground. 2025. Available online: https://www.changiairport.com/en/corporate/our-sustainability-efforts/environment/tackling-emissions.html (accessed on 25 July 2025).
  7. Zhu, S.; Sun, H.; Guo, X. Cooperative scheduling optimization for ground-handling vehicles by considering flights’ uncertainty. Comput. Ind. Eng. 2022, 169, 108092. [Google Scholar] [CrossRef]
  8. Zhao, P.; Han, X.; Wan, D. Evaluation of the airport ferry vehicle scheduling based on network maximum flow model. Omega 2021, 99, 102178. [Google Scholar] [CrossRef]
  9. Lv, L.; Deng, Z.; Shao, C.; Shen, W. A variable neighborhood search algorithm for airport ferry vehicle scheduling problem. Transp. Res. Part C Emerg. Technol. 2023, 154, 104262. [Google Scholar] [CrossRef]
  10. Liu, Y.; Wu, J.; Tang, J.; Wang, W.; Wang, X. Scheduling optimisation of multi-type special vehicles in an airport. Transp. B Transp. Dyn. 2022, 10, 954–970. [Google Scholar] [CrossRef]
  11. Feng, X.; Zuo, H.; Sun, Q. Research on collaborative scheduling of aircraft ground service vehicles based on simple temporal network. In Proceedings of the 2021 IEEE 3rd International Conference on Civil Aviation Safety and Information Technology (ICCASIT), Changsha, China, 20–22 October 2021; pp. 263–269. [Google Scholar]
  12. Guimarans, D.; Padrón, S. A stochastic approach for planning airport ground support resources. Int. Trans. Oper. Res. 2022, 29, 3316–3345. [Google Scholar] [CrossRef]
  13. Lee, E.H. eXplainable DEA approach for evaluating performance of public transport origin-destination pairs. Res. Transp. Econ. 2024, 108, 101491. [Google Scholar] [CrossRef]
  14. Lee, E.H.; Prozzi, J.; Lewis, P.G.T.; Draper, M.; Kim, B. From scores to strategy: Performance-based transportation planning in Texas. Eval. Program Plan. 2025, 111, 102611. [Google Scholar] [CrossRef]
  15. Fu, W.; Li, J.; Liao, Z.; Fu, Y. A bi-objective optimization approach for scheduling electric ground-handling vehicles in an airport. Complex Intell. Syst. 2025, 11, 209. [Google Scholar] [CrossRef]
  16. Jin, Z.; Ng, K.K.; Wang, H.; Wang, S.; Zhang, C. Electric airport ferry vehicle scheduling problem for sustainable operation. J. Air Transp. Manag. 2025, 123, 102711. [Google Scholar] [CrossRef]
  17. Brevoord, J.M. Electric Vehicle Routing Problems: The Operations of Electric Towing Trucks at an Airport Under Uncertain Arrivals and Departures. Master’s Thesis, University of Twente, Enschede, The Netherlands, 2021. [Google Scholar]
  18. Wei, R.; Zhou, F.; Wang, Y. Energy management of airport service electric vehicles to match renewable generation through rollout approach. Electr. Power Syst. Res. 2024, 235, 110739. [Google Scholar] [CrossRef]
  19. Tang, Y.; Wang, L.; Kang, W.; Liu, W.; Zhuang, Y. Cooperative scheduling of airport ground electric service vehicles considering workload balance: A column generation approach. Comput. Ind. Eng. 2025, 200, 110773. [Google Scholar] [CrossRef]
  20. Zhang, X.; Wang, X.; Dong, W.; Xu, G. Adaptive large neighborhood search for autonomous electric vehicle scheduling in airport baggage transport service. Comput. Oper. Res. 2025, 182, 107086. [Google Scholar] [CrossRef]
  21. Zhou, P.; Shen, Y.; Zheng, Y.; Zheng, Y.; Guo, B.; Du, Y. A comprehensive review of ground support equipment scheduling for aircraft ground handling services. Transp. Res. Part E Logist. Transp. Rev. 2025, 203, 104341. [Google Scholar] [CrossRef]
  22. Wang, J.; Wang, H.; Chang, A.; Song, C. Collaborative optimization of vehicle and crew scheduling for a mixed fleet with electric and conventional buses. Sustainability 2022, 14, 3627. [Google Scholar] [CrossRef]
  23. Soltanpour, A.; Ghamami, M.; Nicknam, M.; Ganji, M.; Tian, W. Charging infrastructure and schedule planning for a public transit network with a mixed fleet of electric and diesel buses. Transp. Res. Rec. 2023, 2677, 1053–1071. [Google Scholar] [CrossRef]
  24. Frieß, N.M.; Pferschy, U. Planning a zero-emission mixed-fleet public bus system with minimal life cycle cost. Public Transp. 2024, 16, 39–79. [Google Scholar] [CrossRef]
  25. Zhang, A.; Li, T.; Zheng, Y.; Li, X.; Abdullah, M.G.; Dong, C. Mixed electric bus fleet scheduling problem with partial mixed-route and partial recharging. Int. J. Sustain. Transp. 2022, 16, 73–83. [Google Scholar] [CrossRef]
  26. Duda, J.; Karkula, M.; Puka, R.; Skalna, I.; Fierek, S.; Redmer, A.; Kisielewski, P. Multi-objective optimization model for a multi-depot mixed fleet electric vehicle scheduling problem with real-world constraints. Transp. Probl. 2022, 17, 137–149. [Google Scholar] [CrossRef]
  27. Al-dal’ain, R.; Celebi, D. Planning a mixed fleet of electric and conventional vehicles for urban freight with routing and replacement considerations. Sustain. Cities Soc. 2021, 73, 103105. [Google Scholar] [CrossRef]
  28. Zhao, P.; Liu, F.; Guo, Y.; Duan, X.; Zhang, Y. Bi-Objective Optimization for Vehicle Routing Problems with a Mixed Fleet of Conventional and Electric Vehicles and Soft Time Windows. J. Adv. Transp. 2021, 2021, 9086229. [Google Scholar] [CrossRef]
  29. Dong, H.; Shi, J.; Zhuang, W.; Li, Z.; Song, Z. Analyzing the impact of mixed vehicle platoon formations on vehicle energy and traffic efficiencies. Appl. Energy 2025, 377, 124448. [Google Scholar] [CrossRef]
  30. Qiu, D.; Wang, Y.; Hua, W.; Strbac, G. Reinforcement learning for electric vehicle applications in power systems: A critical review. Renew. Sustain. Energy Rev. 2023, 173, 113052. [Google Scholar] [CrossRef]
  31. Basso, R.; Kulcsár, B.; Sanchez-Diaz, I.; Qu, X. Dynamic stochastic electric vehicle routing with safe reinforcement learning. Transp. Res. Part E Logist. Transp. Rev. 2022, 157, 102496. [Google Scholar] [CrossRef]
  32. Li, S.; Hu, W.; Cao, D.; Dragičević, T.; Huang, Q.; Chen, Z.; Blaabjerg, F. Electric vehicle charging management based on deep reinforcement learning. J. Mod. Power Syst. Clean Energy 2021, 10, 719–730. [Google Scholar] [CrossRef]
  33. Tuchnitz, F.; Ebell, N.; Schlund, J.; Pruckner, M. Development and evaluation of a smart charging strategy for an electric vehicle fleet based on reinforcement learning. Appl. Energy 2021, 285, 116382. [Google Scholar] [CrossRef]
  34. Sultanuddin, S.; Vibin, R.; Kumar, A.R.; Behera, N.R.; Pasha, M.J.; Baseer, K. Development of improved reinforcement learning smart charging strategy for electric vehicle fleet. J. Energy Storage 2023, 64, 106987. [Google Scholar] [CrossRef]
  35. Wu, J.; Song, Z.; Lv, C. Deep reinforcement learning-based energy-efficient decision-making for autonomous electric vehicle in dynamic traffic environments. IEEE Trans. Transp. Electrif. 2023, 10, 875–887. [Google Scholar] [CrossRef]
  36. Wang, Y.; Wu, J.; He, H.; Wei, Z.; Sun, F. Data-driven energy management for electric vehicles using offline reinforcement learning. Nat. Commun. 2025, 16, 2835. [Google Scholar] [CrossRef]
  37. Qin, J.; Huang, H.; Lu, H.; Li, Z. Energy management strategy for hybrid electric vehicles based on deep reinforcement learning with consideration of electric drive system thermal characteristics. Energy Convers. Manag. 2025, 332, 119697. [Google Scholar] [CrossRef]
  38. Liu, C.; Wang, Z.; Liu, Z.; Huang, K. Multi-agent reinforcement learning framework for addressing demand-supply imbalance of shared autonomous electric vehicle. Transp. Res. Part E Logist. Transp. Rev. 2025, 197, 104062. [Google Scholar] [CrossRef]
  39. Hu, J.; Lin, Y.; Li, J.; Hou, Z.; Chu, L.; Zhao, D.; Zhou, Q.; Jiang, J.; Zhang, Y. Performance analysis of AI-based energy management in electric vehicles: A case study on classic reinforcement learning. Energy Convers. Manag. 2024, 300, 117964. [Google Scholar] [CrossRef]
  40. Liu, W.; Yao, P.; Wu, Y.; Duan, L.; Li, H.; Peng, J. Imitation reinforcement learning energy management for electric vehicles with hybrid energy storage system. Appl. Energy 2025, 378, 124832. [Google Scholar] [CrossRef]
  41. Aviationstack. Aviationstack API—Real-Time Flight Status & Global Aviation Data. 2024. Available online: https://aviationstack.com/ (accessed on 15 April 2025).
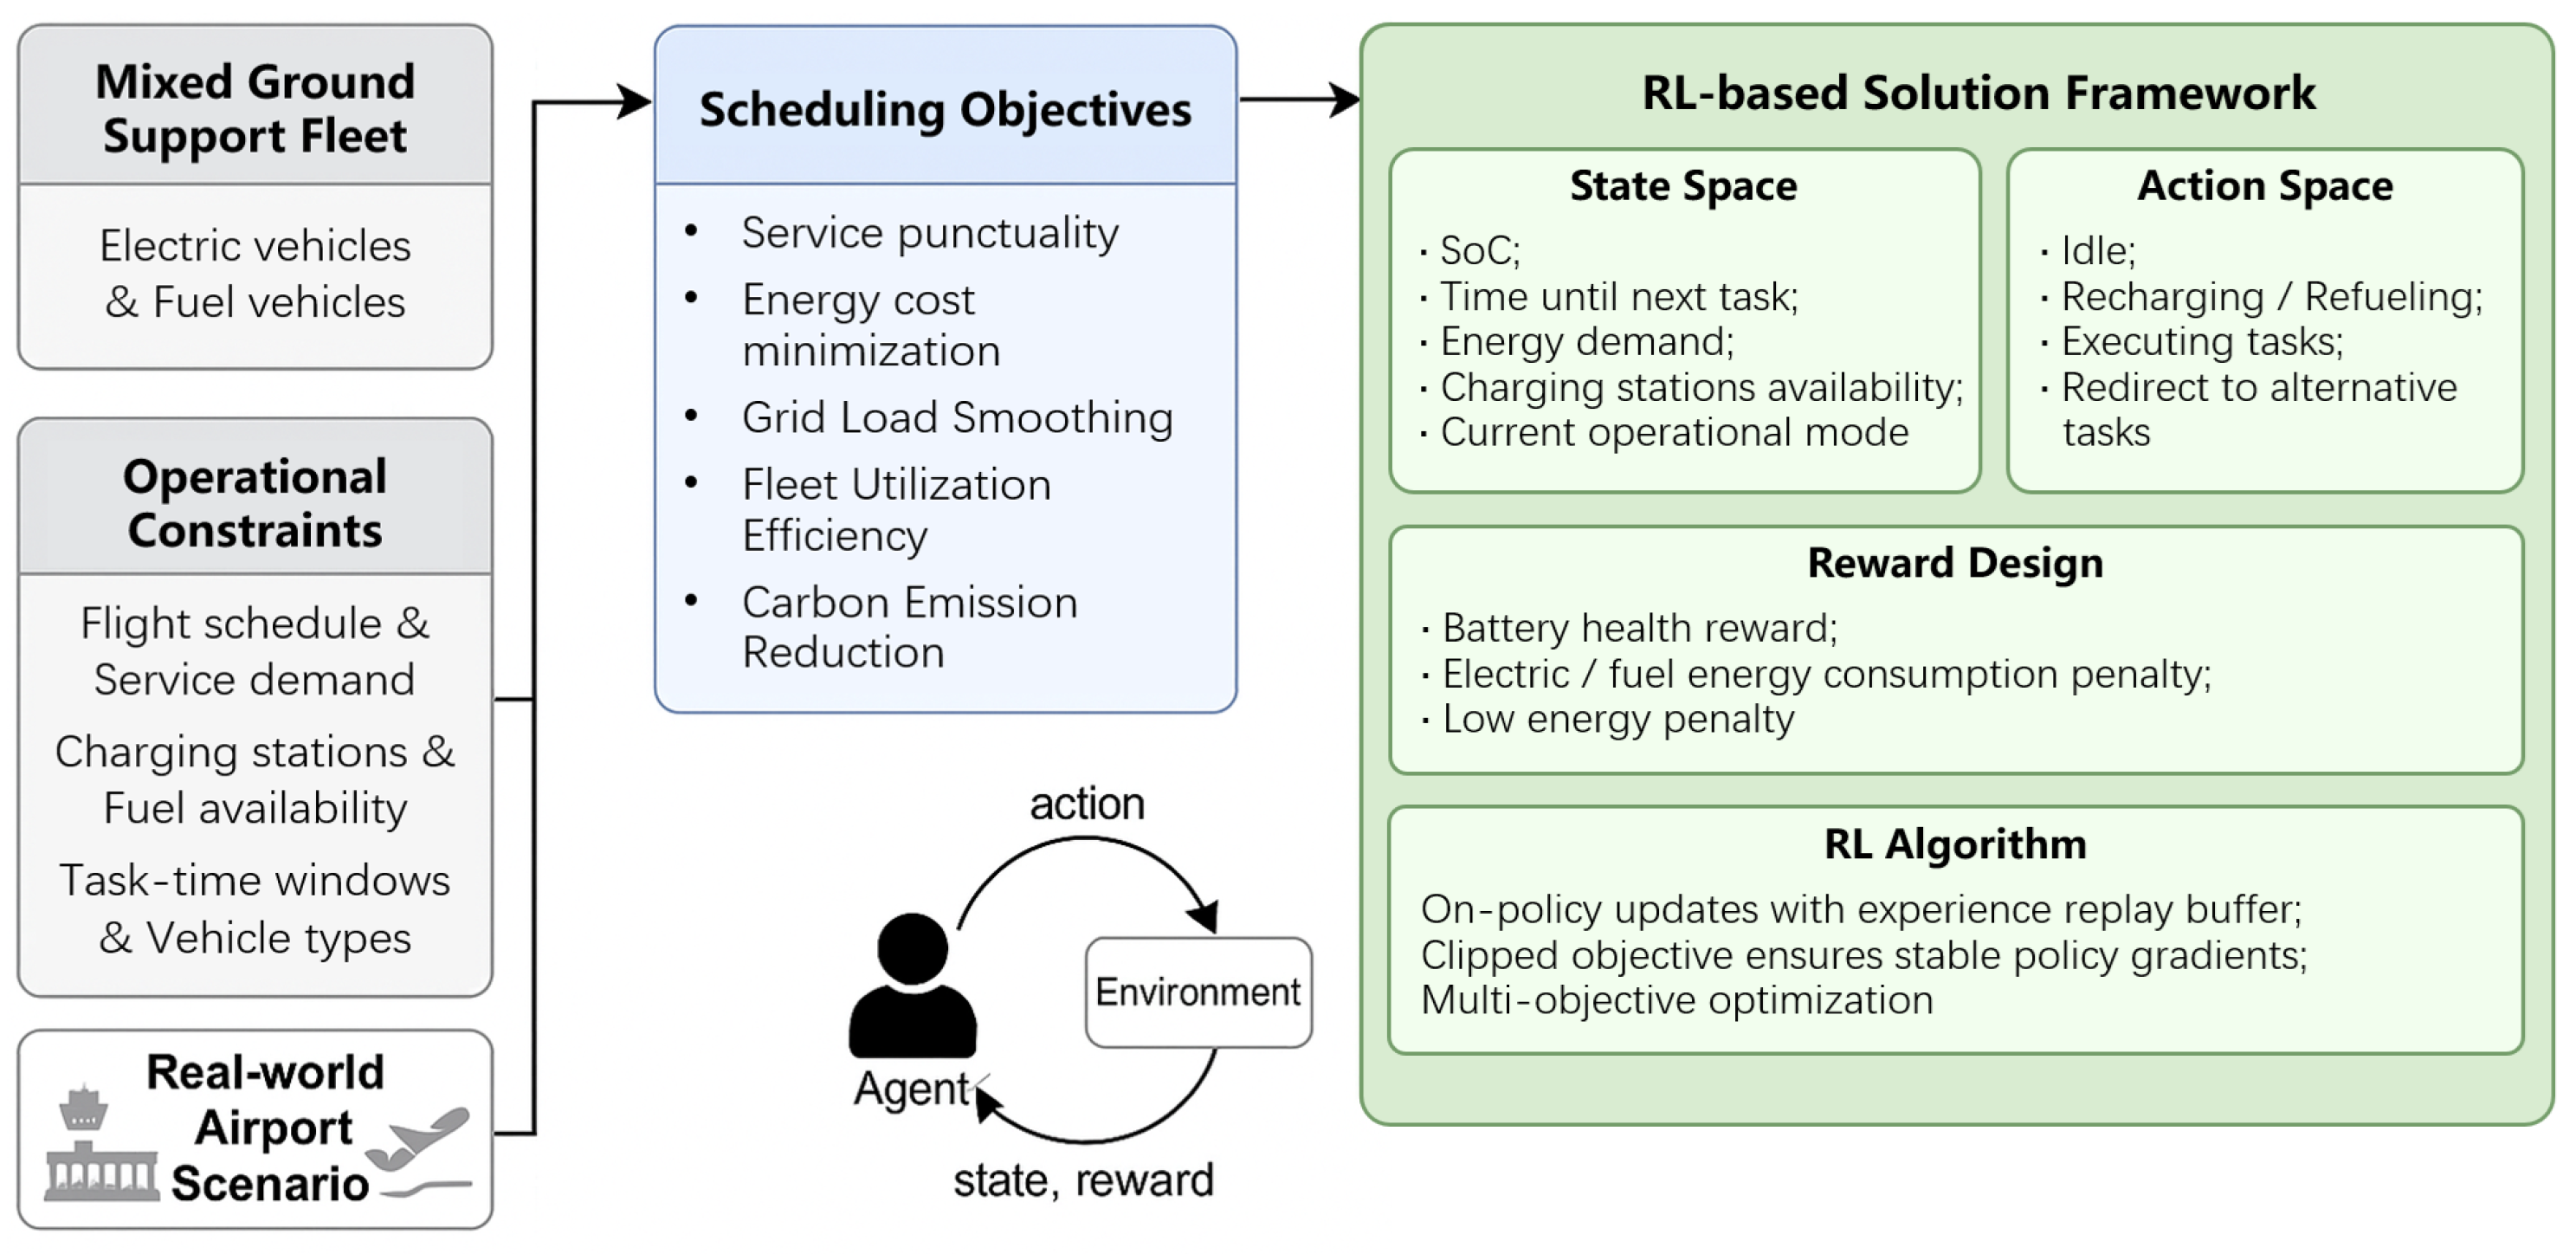
Figure 1. Overview of the DRL-based hybrid fleet scheduling framework.
Applsci 15 09777 g001
Figure 2. Performance comparison under different algorithms.
Applsci 15 09777 g002
Figure 3. Training performance for 50% electric fleet.
Applsci 15 09777 g003
Figure 4. Gantt chart for 50% electric fleet.
Applsci 15 09777 g004
Figure 5. Training performance for 80% electric fleet.
Applsci 15 09777 g005
Figure 6. Gantt chart for 80% electric fleet.
Applsci 15 09777 g006
Figure 7. Training performance for 30% electric Fleet.
Applsci 15 09777 g007
Figure 8. Gantt chart for 30% electric fleet.
Applsci 15 09777 g008
Figure 9. Energy consumption patterns under different fleet configurations.
Applsci 15 09777 g009
Figure 10. Reward under different scenarios.
Applsci 15 09777 g010
Figure 11. Gantt chart in Scenario 1: half fleet size.
Applsci 15 09777 g011
Figure 12. Gantt chart in Scenario 2: half vehicle types.
Applsci 15 09777 g012
Table 1. Sensitivity to reward weights.
λ 1 Scaling Factor s for ( λ 2 , λ 3 )
s = 1 . 2 s = 1 . 0 s = 0 . 8
1.2817.1 (+2.5%)815.8 (+2.6%)798.9 (+4.6%)
1.0808.1 (+3.5%)837.8 (0.0%)820.1 (+2.1%)
0.8826.9 (+1.3%)908.3 (−8.4%)1007.8 (−20.3%)
Table 2. Performance under different EV fleet proportions.
ScenarioDR (%)RT (min)EU (%)FU (%)
50% EV fleet4.51.7148.311.3
30% EV fleet5.51.8254.115.7
80% EV fleet5.41.7642.510.1
DR: Delay Rate; RT: Average Response Time; EU: Electric Vehicle Utilization; FU: Fuel-Powered Vehicle Utilization.
Disclaimer/Publisher’s Note: The statements, opinions and data contained in all publications are solely those of the individual author(s) and contributor(s) and not of MDPI and/or the editor(s). MDPI and/or the editor(s) disclaim responsibility for any injury to people or property resulting from any ideas, methods, instructions or products referred to in the content.