Abstract
To investigate the impact of Integrated Mining-Backfill-Roof Contact (IMBR) synergy on strata subsidence in metallic deposits and analyze strata/surface movement patterns, this study enables safe, efficient, environmentally conscious, and sustainable mining development. Focusing on a representative metal mine, we integrated laboratory testing, theoretical analysis, and numerical modeling to determine experimental parameters. Utilizing MIDAS GTS NX, numerical models incorporated four orebody dip angles (30°, 50°, 70°, 90°), five stress release coefficients (20–100%), and contacted/uncontacted conditions to assess IMBR’s control efficacy on surrounding rock stability and surface subsidence. By examining strata/surface movement under variable dip angles and stress release coefficients, displacement control mechanisms were quantified, revealing strata movement evolution principles. Key findings indicate: (1) For all dip angles, the increase rate of displacement progressively intensifies as the excavation stress release coefficient decreases. Notably, at a 30° dipping angle, the most pronounced reduction occurs under declining stress release coefficients, with overall displacement reduction rates reaching 17% for ground surface and 18% for surrounding rock, respectively. (2) Surface displacement impacts intensify as dip angles flatten. (3) Shallower dips induce more pronounced stress disturbance, expanding overburden movement domains and exacerbating surface impacts. Finite element numerical modeling enables accurate and effective analysis of strata and ground movement patterns under varying orebody dipping angles and mining-backfill stress release coefficients. Findings demonstrate that IMBR technology, compared to conventional roof-contacted backfilling methods, achieves timely roof support through immediate backfill-roof contact, significantly reduces overburden fracture propagation depth, and offers valuable insights for controlling surface subsidence in complex mining conditions—particularly for mining under surface structures.
1. Introduction
The development of the mining industry plays a crucial role in the national economy. In China, metal mines are primarily underground. Effective control of goaf surrounding rock instability and surface subsidence constitutes one of the critical research topics in mining operations of metal ore deposits [1,2]. Mining methods have a direct impact on the economic efficiency, survival, and development of mines. Whether the mining methods adopted by a mine are reasonable and appropriate plays a central role in underground mining operations [3]. Traditional mining methods treat mining, backfilling, and support as separate processes, resulting in backfilling lagging behind mining by 2–3 cycles. The roof has undergone irreversible deformation, and the support strength design did not account for the collaborative load-bearing capacity of the backfill material, often leading to varying degrees of subsidence at the surface. This significantly impacts the stability of the surrounding rock in the goaf, causing widespread deformation or even collapse of the overlying strata, and posing numerous adverse effects on the surrounding environment, buildings, transportation, and subsequent mining operations [4,5,6,7,8,9]. In contrast, the Coordinated Mining Method emphasizes the harmonization, collaboration, and synchronization among all mining elements. Through a macro-level perspective, it optimizes and coordinates operations across functional units, facilitating the transformation from non-cooperative to cooperative relationships among multiple innovative entities. This approach highlights the synergistic attributes of mining components and their resultant comprehensive benefits, thereby enhancing holistic mining efficiency and outcomes [10,11]. Rational coordination of the ‘Excavation-Backfill-Roof Contacting’ sequence facilitates orderly stress transfer, mitigating dynamic disasters such as rock burst that may result from abrupt stress release [12]. Concurrently, backfill serves to buffer and support during stress redistribution, retarding deformation and failure rates in rock masses while prolonging stope stability duration [13,14].
Investigating surrounding rock deformation and surface movement during extraction constitutes the fundamental basis for safe and efficient orebody mining [15]. In recent years, researchers globally have achieved remarkable progress in numerical simulation of coordinated subsidence control [16]. Regarding the integration of engineering cases with numerical simulations, Rui, L. [17] examined the effects of backfill ratios, overlying loess thickness, and slope spans on surface subsidence, while validating the accuracy of theoretical calculations. Guo, J. et al. [18] investigated load-bearing conditions of the backfill-pillar system under varying backfill-roof contact percentage, deriving a computational expression for pillar safety factors. Results demonstrate that higher backfill ratios not only enhance pillar stability but also reduce surface subsidence and ecological disturbance. Cheng, G. et al. [19] employed geomechanical methodologies to investigate strata movement mechanisms in the floor strata and surface deformation patterns at Chengchao Iron Mine, and they systematically analyzed the temporal evolution of rock mass responses and surface displacement during extraction, establishing a theoretical framework for predicting and preventing mining-induced surface hazards. Furthermore, the study proposed risk mitigation through optimized extraction sequences and support design modifications. Zhao, Y. et al. [20] conducted a case study at Shirengou Iron Mine, employing the Rock Mass Rating (RMR) classification system and kinematic analysis to investigate failure progression mechanisms during the transition from open-pit to underground mining. Utilizing FLAC3D, Zaicheng, X. et al. [21] established a goaf numerical model to systematically analyze driving factors and developmental patterns of ground subsidence in gypsum mines based on deformation gradients and evolutionary trends, providing a theoretical-technical framework for safe mining and hazard mitigation. Ming, T. et al. [22] systematically analyzed the regulatory mechanism of backfill-roof contact percentage on stope stability during two-step extraction. The study further proposed a staged backfill optimization strategy based on an arching model, providing significant references for safe and efficient mining in deep operations.
Backfill mining converts waste rock and tailings into cemented paste backfill pumped into goafs, thereby mitigating mining-induced geohazards [23,24,25,26]. As a core methodology for green mine development, backfill mining demonstrates significant advantages including environmental sustainability, operational safety, production efficiency, and low-carbon footprint, proving essential for achieving surface subsidence control, safe extraction, and ecological conservation [27,28]. Nan, Z. et al. [29] proposed a roadway backfilling methodology for longwall mining operations, conducting mechanical property testing on backfill materials to determine optimal mix proportions under longwall-induced ground conditions. Yaodong, J. et al. [30] established through 60+ numerical models with varying coal pillar heights and backfill ratios that coal pillar strength increases proportionally with roadway backfill volume. Jixiong, Z. et al. [31] established a ground subsidence numerical model based on actual surface infrastructure types and subsidence patterns, demonstrating that solid waste backfill mining technology effectively mitigates surface settlement and deformation while preserving infrastructure integrity. Tesarik, D. et al. [32] revealed through long-term monitoring of mine roofs and pillars during stope extraction that cemented backfill masses significantly improved goaf stability. Jianxin, Y. et al. [2] investigated subsurface backfill mining impacts on surface stability through practical mining engineering, demonstrating that backfill methods effectively control surface subsidence while reducing impacts on overlying structural stability. Fangrui, L. et al. [10] methodically elucidated the efficacy of coordinated extraction using multiple backfill techniques to comprehensively investigate mine fault stability. Pengfei, W. et al. [33] conducted proportioning tests on paste backfill simulants (coal gangue, fly ash, cement) with compressive strength as the control parameter, determining that backfill ratio and stope span are primary governing factors for preventing overlying strata failure; higher backfill ratios reduce strata stress/displacement, whereas larger stope spans amplify these changes. Current research on backfill-roof contact has reached relative maturity domestically and internationally; however, studies concerning stress release rates and their coupling mechanisms with backfill-roof contact ratios remain limited.
This study investigates a large-scale iron mine under actual operational conditions. Utilizing Midas-GTS NX (2019 v1.2) numerical simulation software and the stress reversal method, we established numerical models incorporating four orebody dip angles, five mining-backfill stress release coefficients, and both roof-contacted/non-contacted scenarios to evaluate coordinated subsidence control in the ‘Integrated Mining-Backfill-Roof Contacting’ system. The analysis characterizes strata and surface displacement variations across different dip angles, stress release coefficients, and roof contact conditions, further revealing the evolutionary mechanisms of coordinated ground movement. This research provides a theoretical foundation for optimizing the coordinated subsidence control technology in the ‘Excavation-Backfill-Roof Contacting’ system, ensuring operational stability and safety during metal ore extraction while minimizing environmental impacts. These advancements hold significant practical implications for advancing sustainable development in the metal mining industry. Figure 1 shows the IMBR research process flow chart.
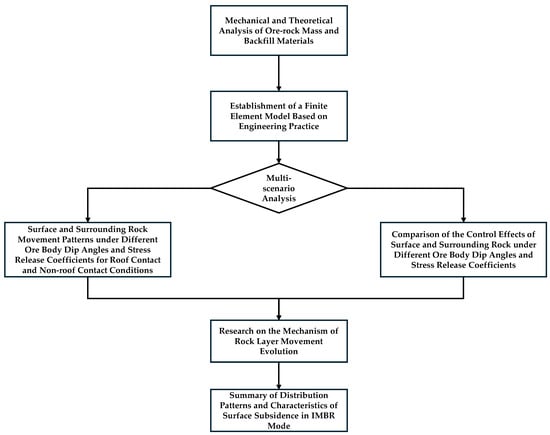
Figure 1.
IMBR research flowchart.
2. Materials and Methods
2.1. Mechanical Parameters of Ore-Rock Mass and Backfill Materials
2.1.1. Ore-Rock Mass Mechanical Parameters
Table 1 presents the mechanical parameters of ore-rock masses and Quaternary formations. Representative samples of surrounding rock and ore were collected from a typical mine, with specimen processing and mechanical testing conducted at the Rock Mechanics Laboratory of North China University of Science and Technology (Figure 2). Parameters for ore-rock masses were determined based on GB/T 23561.7-2009 standard [34] and references [35,36], applying the Hoek–Brown criterion [37,38,39], while Quaternary formation parameters were established with reference to [40].

Table 1.
Geotechnical parameters.
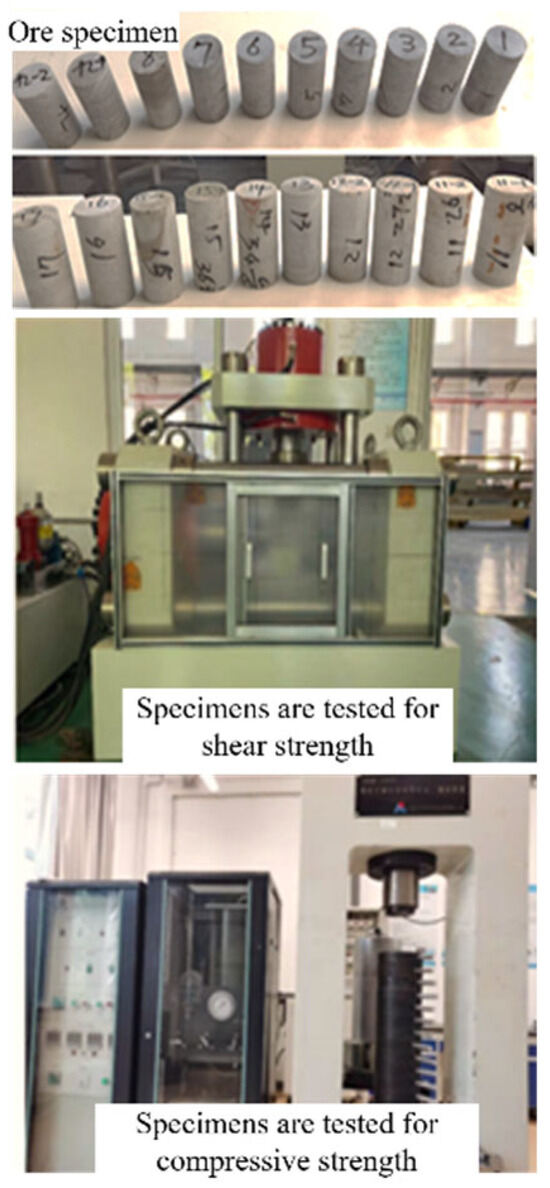
Figure 2.
Rock mass mechanical properties testing.
2.1.2. Backfill Material Mechanical Parameters
Tailings were sourced from the discharge launder of a mine thickener underflow. Using slag micropowder and activators as cementitious materials, uniaxial and triaxial compression tests (Figure 3) were conducted at the University of Science and Technology Liaoning to determine mechanical parameters. A slurry concentration of 72%, activator-to-slag ratio of 1:4, and binder-to-tailings ratios of 1:6 and 1:10 served as fundamental computational parameters [41,42]. Detailed backfill mechanical properties are provided in Table 2.
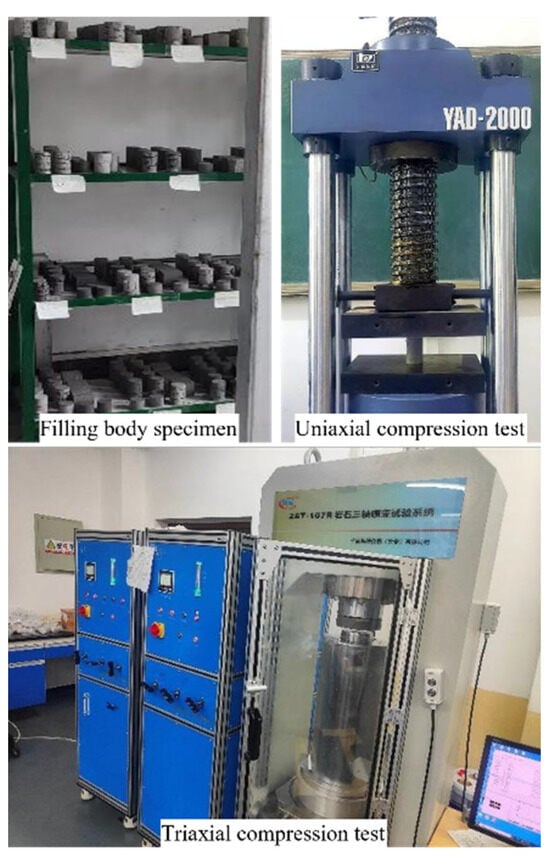
Figure 3.
Filling mechanical parameter testing.
Table 2.
Filling mechanics parameters.
2.2. Coordinated Excavation-Backfill Theoretical Analysis Methodology
2.2.1. Initial Geostress Calculation
The primary components of in situ stress fields comprise gravitational stress fields and tectonic stress fields. The geostress can be expressed as:
where —geostatic stress (MPa), —tectonic stress (MPa), —magnitude of stress produced by unit tectonic movement (MPa), —weighting coefficient of effective tectonic movement corresponding to σ, and n—fundamental tectonic kinematic modes.
For horizontal ground surfaces free from surcharge loads, Equation set (2) yields:
where —vertical stress component (MPa), —unit weight of rock mass (MN/m3), —depth below ground surface (m), —horizontal stress component (MPa), —poisson’s ratio of rock mass, —coefficient of lateral earth pressure, and —shear stress component on the xz-plane.
The tectonic stress field refers to stresses within the Earth’s crust induced by crustal movements. As a spatiotemporal function, it can be approximated as a stress field that varies spatially while remaining temporally stable [43]. Under the assumption of the following holds:
2.2.2. Post-Stope-Excavation and Post-Backfill Stress Analysis
After the excavation of the mine room, the stress redistribution state of the surrounding rock can be divided into two types: elastic and plastic [44,45,46,47,48,49].
- (1)
- Elastic secondary stress solution
Assuming that the mine chamber is in a bidirectional unequal pressure state , the non-axisymmetric external loads in the x and z directions are and , the load is , as shown in Figure 4.
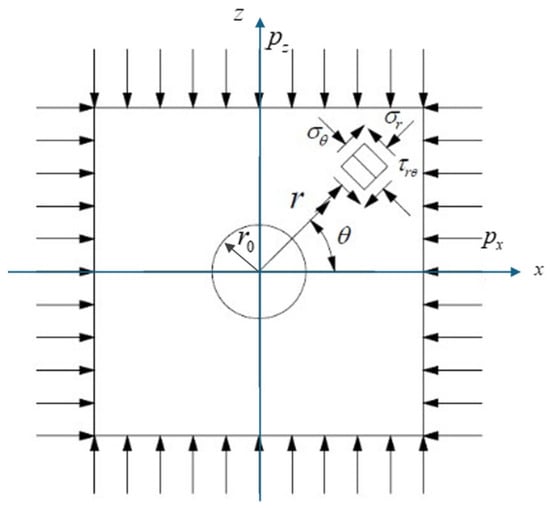
Figure 4.
Stress calculation diagram for mine cross-section.
Using polar coordinates for calculation, and for isotropic linear elastic rock, the general equation for the elastic quadratic stress at any point in the rock mass is:
Radial stress:
Circumferential stress:
Shear stress:
Radial displacement:
Tangential displacement:
where —the inner radius (m), —the outer radius (m), —the angle of internal friction, q—the radial inner load (MPa), τ—the shear (MPa), and E—the deformation modulus (MPa).
After excavation, the structure is subjected to non-axisymmetric external loads and no internal loads, so the internal load q = 0 and the shear τ = 0.
- (2)
- Plastic secondary stress solution
Rock masses in the plastic zone must still satisfy the equilibrium conditions. For axisymmetric problems after excavation [48,49], if volume forces are not considered, the equilibrium equation and the Mohr–Coulomb yield criterion are as follows, respectively.
where —the radial stress (MPa), —the circumference stress (MPa), —the theoretical uniaxial compressive strength , c—cohesion of rock mass (MPa), and is the rate of the intensity line, . When Equations (9) and (10) are solved, the general formula for the plastic secondary stress solution is:
Radial stress:
Circumference stress:
where —the bracing stress (MPa).
Shear stress:
At the interface between the plastic zone and the elastic zone (), under bidirectional isobaric conditions , the radius of the plastic zone can be obtained as:
Radial displacement:
After excavation, the structure is subjected to axisymmetric external loads and is unbraced, so the bracing stress .
2.2.3. Stress Release Ratio Determination
Assuming the stress state after time t under unfilled conditions is , the stress release ratio is given by:
2.3. Coordinated Excavation-Backfill-Roof Contacting Numerical Analysis Method
2.3.1. Model Construction
Operated as a major iron mine in eastern Hebei, this deposit is characterized by a steeply dipping metamorphic basement overlain by gently inclined sedimentary rocks and Quaternary loam cover. The monoclinal-structured mining area hosts parallel banded ore bodies striking approximately N-S with westward dips, exhibiting an average true thickness of 60 m. Comprehensively considering the geological formation conditions, crown pillar configuration, and boundary effects of the computational model, the orebody height is set to 120 m (equivalent to 4 sublevel heights). The overlying rock mass height is 120 m, the underlying rock extends 200 m, and the Quaternary layer is 30 m, resulting in a total model height of 470 m. The orebody width is defined by its thickness of 60 m, with 300 m extensions on both lateral sides. Model widths vary by dip angle: 660 m for 90°, 705 m for 70°, 760 m for 50°, and 868 m for 30°. The stope length adopts a panel width of 100 m, with 500 m front/rear extensions, yielding a total length of 1100 m. Primary stopes (20 m) employ high-strength cemented backfill (binder-to-sand ratio = 1:6), while secondary stopes (20 m) use low-strength cemented backfill (ratio = 1:10). Mining progresses upward through the 120 m orebody with 30 m sublevel heights, incorporating a 0.5 m uncontacted roof gap. The rock mass and Quaternary strata are modeled using the Drucker–Prager constitutive model, with mechanical parameters calibrated for each backfill type. The 3D Continuum Numerical Model for Mining-Backfill-Roof Contact Synergistic Subsidence Control and the mesh model is illustrated in Figure 5 and Figure 6.
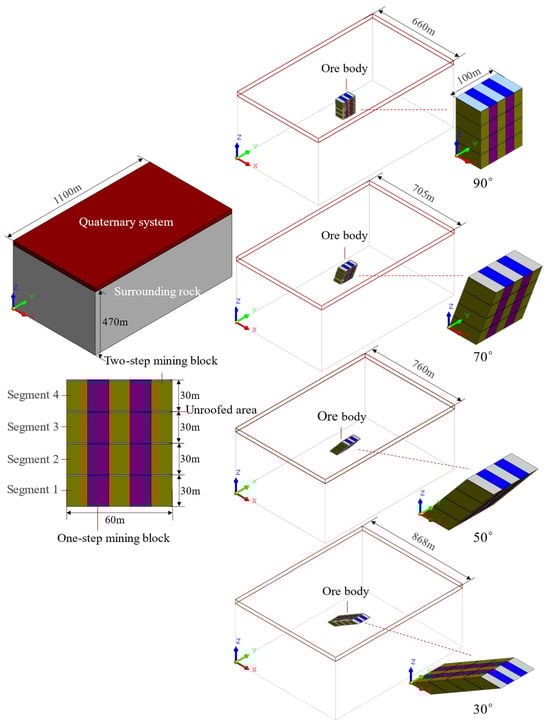
Figure 5.
The 3D continuum numerical model for Mining-Backfill-Roof Contact synergistic subsidence control.
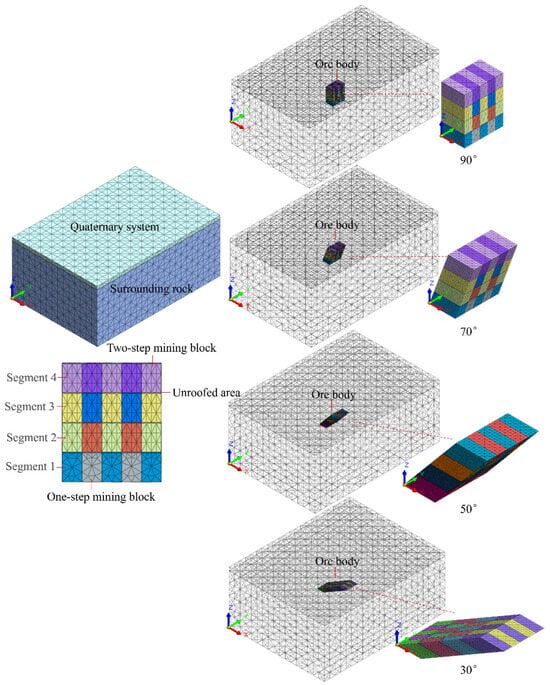
Figure 6.
The 3D mesh model for Mining-Backfill-Roof Contact synergistic subsidence control.
The calculation uses static linear solving, stress thresholds, and a tetrahedral mesh model. Mesh quality critically determines the accuracy of numerical analysis results. Through iterative refinement, the optimal element size was established as 3 m for zones of unroofed backfill, roof-contacted backfill, backfill mass, and adjacent ore-rock interfaces. Around the stope, the maximum-to-minimum element size ratio was rigorously controlled, with the maximum element size set at 14 m. For distant surrounding rock—characterized by substantial thickness and minimal influence on the target area—boundary elements were coarsened to 30 m. The model employed a hexahedron-dominant hybrid mesh for rapid convergence and high precision, ultimately discretized into 110,596 nodes, 152,355 elements, and 331,788 DOFs (degrees of freedom).
During computation, boundary constraints were applied as follows: the ground surface was treated as a free boundary without any restraints; the front and back boundaries of the model were subjected to displacement constraints along the y-axis, the left and right boundaries to displacement constraints along the x-axis, and the base boundary to displacement constraints along the z-axis.
2.3.2. Orebody Excavation and Backfill Simulation Methodology
Prior to excavation, all points on the future excavation boundary remain in their initial equilibrium state. Upon excavation, the sudden removal of constraints around the newly formed free surface causes redistribution of the initial stress and displacement fields. This excavation process is simulated using the ‘Reversed Stress Method’ proposed by Duncan and Dunlop in 1969, wherein initial stresses at boundary nodes are converted into equivalent nodal forces and applied in reverse direction to the excavation surface (Figure 7). To better simulate actual excavation conditions and determine the impact of geostress release rates on surface subsidence, during the simulation of ore body excavation and backfilling processes, the node forces are divided into two stages—excavation and backfilling—based on the reversed stress method. Specifically, the properties of the excavated ore body are set to empty cells, and the node forces at the excavation boundary are multiplied by a coefficient (1-A). which is then reversed and applied to the points of action on the excavation boundary interface. After backfilling, all node stresses are fully released, where A represents the stress release coefficient.
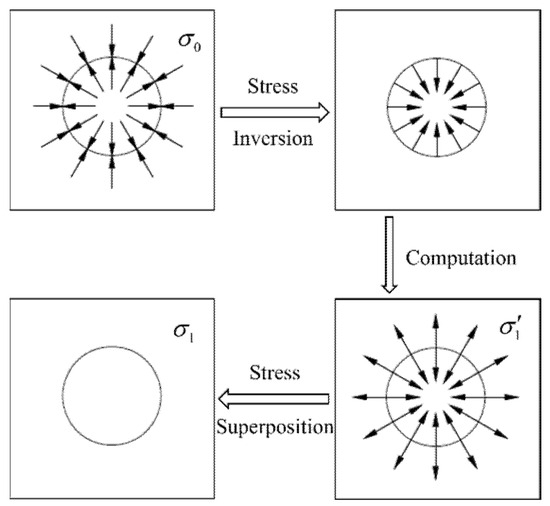
Figure 7.
Schematic diagram of stress release method.
2.3.3. Computational Scheme
The geostress field is modeled as an initial gravitational stress field. The simulation procedure initiates with the computation of the in situ stress equilibrium (primary stress state). Prior to orebody excavation, the strata exist in this primary stress state. Following excavation, stress redistribution and localized release of residual crustal stresses induce displacement and relaxation, establishing a transient equilibrium termed the secondary stress state. The stress condition after backfill support implementation constitutes the tertiary stress state. This mechanical evolution is simulated using load release coefficients. To determine optimal excavation-backfill sequencing, five release schemes are implemented during stope extraction: 100%, 80%, 60%, 40%, and 20% load release coefficients.
3. Results
3.1. Maximum Displacements of Ground Surface and Surrounding Rock with and Without Backfill-Roof Contact Under Different Stress Release Coefficients
Numerical model calculations yielded displacement nephograms (contour plots) of the ground surface and surrounding rock for various stress release coefficients, both with and without backfill-roof contact. Figure 8 and Figure 9 present representative overall displacement nephograms. Figure 8 shows the overall displacement nephograms for the ground surface and surrounding rock with a 30° orebody dip angle under a 100% stress release coefficient, comparing scenarios with and without backfill-roof contact. Figure 9 presents the corresponding nephograms under a 20% stress release coefficient. The maximum overall displacements extracted from these nephograms for different stress release coefficients and contact conditions are detailed in Table 3, Table 4, Table 5 and Table 6.
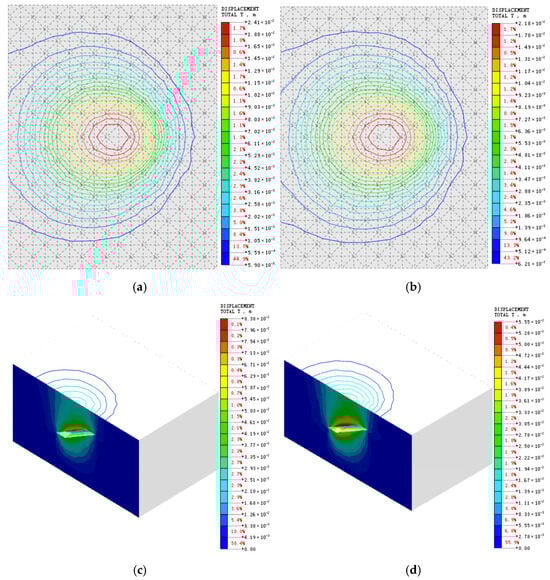
Figure 8.
Displacement contour plots under 100% stress release coefficient at 30° dip angle for non-roof contact and roof contact conditions: (a) surface under non-roof contact conditions; (b) surface under roof contact conditions; (c) surrounding rock under non-roof contact conditions; (d) surrounding rock under roof contact conditions.
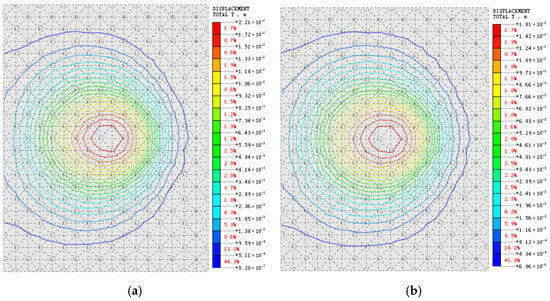
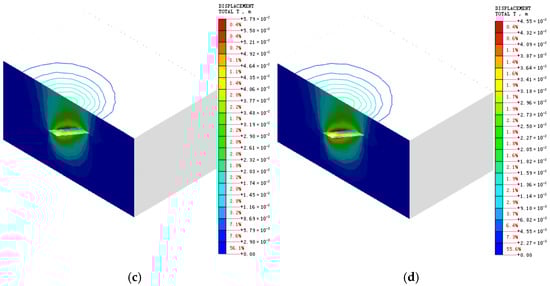
Figure 9.
Displacement contour plots under 20% stress release coefficient at 30° dip angle for non-roof contact and roof contact conditions: (a) surface under non-roof contact conditions; (b) surface under roof contact conditions; (c) surrounding rock under non-roof contact conditions; (d) surrounding rock under roof contact conditions.
Table 3.
Maximum displacements of ground surface and surrounding rock under non-roof contact and roof contact conditions with different stress release coefficients for the 30° dip angle orebody.
Table 4.
Maximum displacements of ground surface and surrounding rock under non-roof contact and roof contact conditions with different stress release coefficients for the 50° dip angle orebody.
Table 5.
Maximum displacements of ground surface and surrounding rock under non-roof contact and roof contact conditions with different stress release coefficients for the 70° dip angle orebody.
Table 6.
Maximum displacements of ground surface and surrounding rock under non-roof contact and roof contact conditions with different stress release coefficients for the 90° dip angle orebody.
3.2. Synergistic Ground Control Effect of “Mining-Filling”
The displacement reduction rate () under different ore body dip angles and excavation stress release rates is based on the maximum displacement values (U100%) of the surface and surrounding rock after excavation, where the stress release rate is 100%. First, calculate the difference between the overall displacement extremes (Ui, where i = 80%, 60%, 40%, 20%) under different stress release rates and the baseline data. Then, calculate the percentage of the difference relative to the baseline data to obtain the displacement reduction rate. As shown in Formula (17):
The displacement reduction rates for surface and surrounding rock under different stress release coefficients and ore body inclinations, for both non-roof contact conditions and roof contact conditions, are shown in Figure 10 and Figure 11.
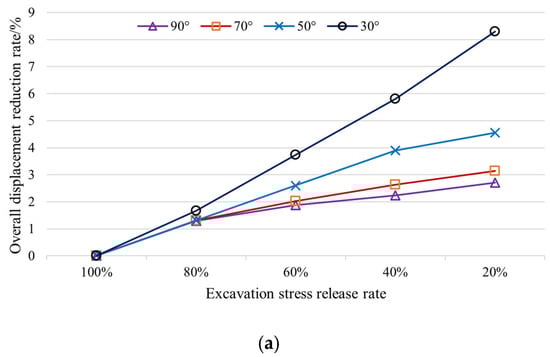
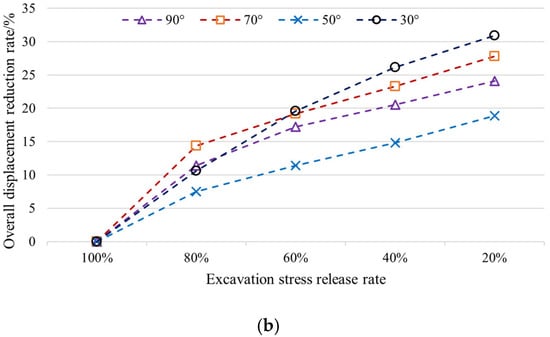
Figure 10.
Reduction rate of surface and surrounding rock displacement under non-roof contact conditions for various stress release coefficients and orebody dip angles: (a) surface; (b) surrounding rock.
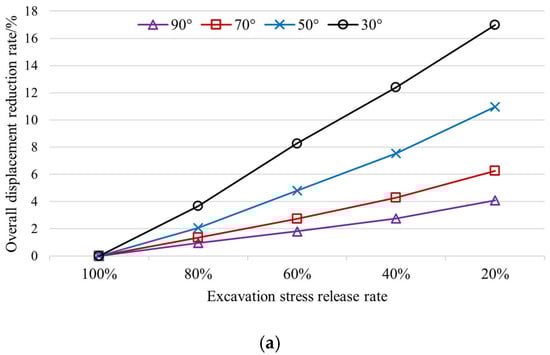
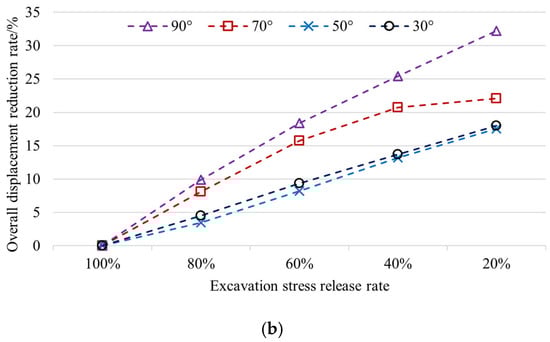
Figure 11.
Reduction rate of surface and surrounding rock displacement under roof contact conditions for various stress release coefficients and orebody dip angles: (a) surface; (b) surrounding rock.
Under non-roof contact conditions, as the excavation-induced stress release coefficient decreases, the reduction rate of overall surface displacement increases; as the orebody dip angle decreases, the reduction rate of overall surface displacement increases. At 30° dip angle, the growth slope exhibits minimal change; for other dip angles, as the excavation-induced stress release coefficient decreases, the growth slope gradually reduces.
Under non-roof contact conditions, as the excavation-induced stress release coefficient decreases, the reduction rate of overall surrounding rock displacement increases. Within the 90–70° dip angle range, as the dip angle decreases, the overall displacement reduction rate decreases. However, at 30° dip angle when stress release coefficients are ≤60%, the displacement reduction rate exceeds the value observed at 90° dip angle. For different dip angles, as the excavation-induced stress release coefficient decreases, the growth slope progressively reduces.
Under roof contact conditions, as the excavation stress release coefficient decreases, the overall surface displacement reduction rate increases; as the ore body dip angle decreases, the overall surface displacement reduction rate increases. When the ore body dip angle is 30°, the growth slope changes little; for other ore body dip angles, as the excavation stress release coefficient decreases, the growth slope gradually decreases.
Under roof contact conditions, as the excavation stress release coefficient decreases, the overall rock mass displacement reduction rate increases; When the ore body dip angle is between 90° and 70°, as the dip angle decreases, the overall displacement reduction rate decreases; however, when the dip angle is 30°, after the stress release coefficient is less than or equal to 60%, the displacement reduction rate exceeds the value at a dip angle of 90°. For different dip angles, as the excavation stress release coefficient decreases, the growth slope gradually decreases.
3.3. Synergistic Ground Control Effect of IMBR
The subsidence control efficacy of Coordinated Excavation-Backfill-Roof Contacting is quantified by the percentage reduction in total surface displacement between roof-contacted and non-contacted scenarios across varying stress release rates and orebody dip angles (). First, compute the difference between peak displacements in non-contacted and contacted cases under identical stress release rates and dip angles (, where i = 100%, 80%, 60%, 40%, 20%). Then, express this difference as a percentage of the peak displacement in the non-contacted scenario. As formulated in Equation (18):
The displacement reduction rates for surface and surrounding rock between roof-contacted and non-contacted scenarios under varying stress release coefficients and orebody dip angles, calculated via the formula, are graphically represented in Figure 12.
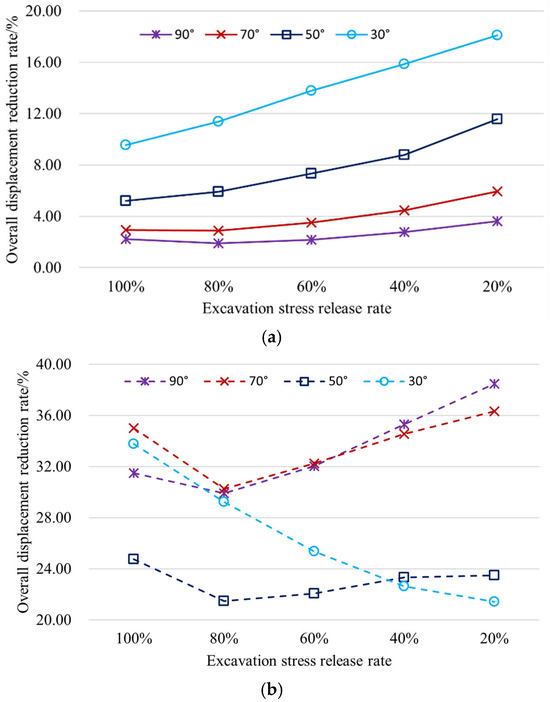
Figure 12.
Displacement reduction rates under varying stress release coefficients and orebody dip angles for roof-contact and non-roof-contact backfill conditions: (a) surface; (b) surrounding rock.
The resultant surface displacement reduction rate increases with decreasing excavation-induced stress release coefficient. Concurrently, this rate amplifies as the orebody dip angle diminishes. For varying dip angles, the growth slope of reduction rate versus stress release coefficient steepens progressively with reduced coefficient values. Conversely, the rate augmentation attenuates with declining dip angles.
With decreasing excavation-induced stress release coefficient, the resultant displacement reduction rate of surrounding rock initially declines then increases at orebody dip angles of 90°, 70°, and 50°, while monotonically decreases at 30°. The variation patterns and magnitudes of reduction rates are similar between 90° and 70° dips. At 50° dip, the reduction rate reaches its minimum when stress release rate exceeds 40%. For 30° dip, the reduction rate converges with 90°/70° values above 80% release rate; within 40–80% release range, it exceeds the 50° dip rate but remains lower than 90°/70° values; below 40%, it demonstrates the lowest reduction rate among all dip configurations.
4. Discussion
4.1. Characterization of Strata Movement in IMBR
Under identical conditions, the kinematic patterns of surrounding rock and surface movement exhibit similarity between contacted and uncontacted scenarios, differing primarily in displacement magnitude control. Extracting the 100% stress release rate case, typical displacement profiles and isosurfaces of strata movement under contacted conditions across varying orebody dip angles are analyzed to characterize the synergistic evolution of IMBR.
Figure 13 shows typical cross-sections and contour maps of rock layer displacement under different ore body dip angle conditions (the contour lines in the figure represent the contour lines of strongly disturbed areas at the surface). Based on the rock layer displacement distribution cloud map in the cross-section diagram, the areas are divided into four zones: strong, moderate, low, and slight displacement disturbance (I, II, III, IV), thereby obtaining the displacement zoning of typical cross-sections of rock layer movement under different ore body dip angle conditions. as shown in Figure 14.
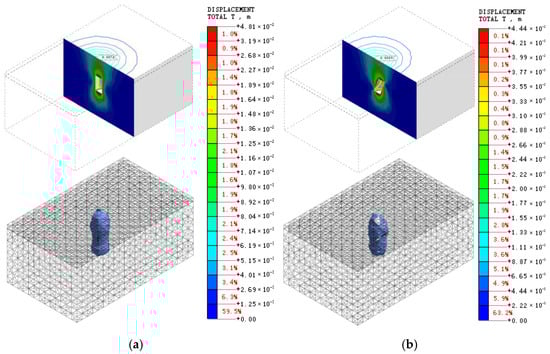
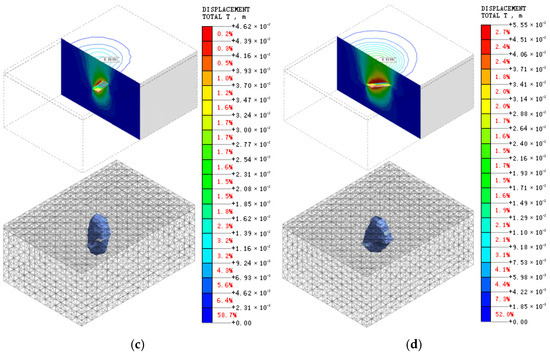
Figure 13.
Typical cross-sectional profiles and isosurfaces of rock strata movement under different orebody dip angle roof contact conditions: (a) ore body dip 90°; (b) ore body dip 70°; (c) ore body dip 50°; (d) ore body dip 30°.
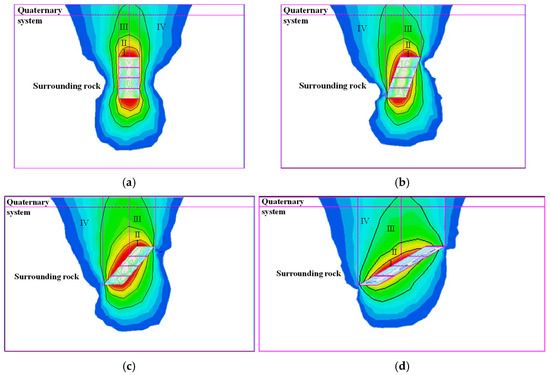
Figure 14.
Displacement zoning of typical cross-sectional profiles of rock strata movement under different orebody dip angle roof contact conditions: (a) ore body dip 90°; (b) ore body dip 70°; (c) ore body dip 50°; (d) ore body dip 30°.
Ore body dip angle 90°: Strongly disturbed areas are symmetrically distributed on the roof and floor; moderately disturbed areas are distributed on the roof, floor, and side walls of the upper and lower benches, appearing approximately symmetrically; weakly disturbed areas are symmetrically distributed on the side walls of the upper and lower benches. The disturbed area on the roof is larger than that on the floor, extending from the surrounding rock to the surface, forming a strongly disturbed area at the surface; other areas are weakly disturbed. The top positions of the isocontours of the strongly, moderately, and weakly disturbed zones are approximately aligned with the centerline of the mining area.
Ore body dip angle 70°: Strongly disturbed zones are distributed in the roof, floor, upper part of the upper bench sidewall, and lower part of the lower bench sidewall, with the disturbed zone in the upper part of the upper bench sidewall being larger than that in the lower part of the lower bench sidewall. Moderately disturbed zones are distributed in the roof, floor, upper part of the upper bench sidewall, and lower part of the lower bench sidewall, with the disturbed zone in the upper part of the upper bench sidewall being larger than that in the lower part of the lower bench sidewall. Low-disturbance zones are distributed in the roof, floor, and upper and lower bench sidewall areas, with the roof and upper bench sidewall areas being larger than the floor and lower bench areas. The roof disturbance zone extends to the surface, forming a strong disturbance zone at the surface; other areas are micro-disturbance zones. The top positions of the strong and moderate disturbance zone isocontours are approximately aligned with the centerline of the mine.
Ore body dip angle of 50°: Strongly disturbed zones are distributed on the left side of the roof, the right side of the floor, the upper part of the upper bench sidewall, and the lower part of the lower bench sidewall. The disturbed zone in the upper part of the upper bench sidewall is larger than that in the lower part of the lower bench sidewall. Moderately disturbed areas are distributed on the roof, floor, upper part of the upper bench sidewall, and lower part of the lower bench sidewall, with the disturbed area on the upper part of the upper bench sidewall being larger than that on the lower part of the lower bench sidewall. Weakly disturbed areas are distributed on the roof, floor, and upper and lower bench sidewall regions, with the roof and upper bench sidewall regions being larger than the floor and lower bench regions. The disturbed area on the roof extends to the surface, forming a strongly disturbed area at the surface. Other areas are classified as low-disturbance zones. The top positions of the isopleths for the strong and moderate disturbance zones are approximately aligned with the centerline of the mine.
Ore body dip angle 30°: Strongly disturbed areas are only distributed in the central region of the upper bench sidewall; moderately disturbed areas are distributed on the left side of the roof, the right side of the floor, the upper bench sidewall, and the lower part of the lower bench sidewall, with the disturbed area in the upper part of the upper bench sidewall being larger than that in the lower part of the lower bench sidewall. Low-disturbance zones are distributed in the roof, floor, and upper and lower bench sidewall areas, with the roof and upper bench sidewall areas being larger than the floor and lower bench areas. The roof disturbance zone extends to the surface, forming a strongly disturbed surface zone; other areas are weakly disturbed zones.
To quantitatively analyze the disturbance zones of different ore body inclinations, the areas of positive influence on surface subsidence displacement were quantified for the roof and upper plate influence zones. This yielded quantitative data on the displacement zones of typical rock layer movement profiles under different ore body inclinations, as shown in Figure 15, Figure 16, Figure 17 and Figure 18. The data in the figures were extracted to produce a quantitative table of displacement zones for typical rock layer movement profiles under different ore body inclinations. Table 7 presents the quantified displacement zone areas of typical stratigraphic movement profiles under different ore body dip angles.
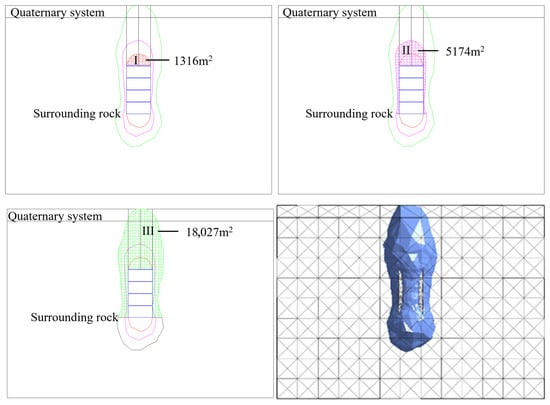
Figure 15.
Quantitative displacement zoning of typical cross-sectional profiles of rock strata movement with orebody dip angle of 90°.
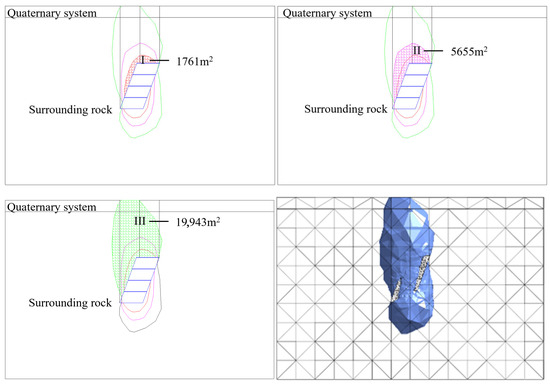
Figure 16.
Quantitative displacement zoning of typical cross-sectional profiles of rock strata movement with orebody dip angle of 70°.
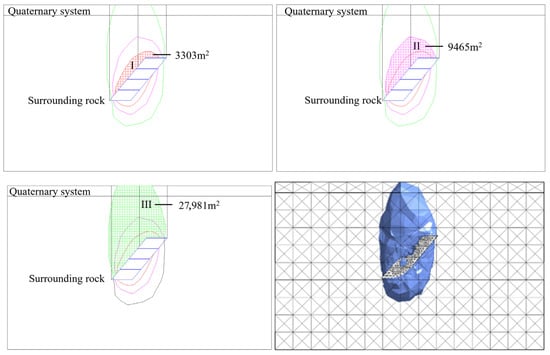
Figure 17.
Quantitative displacement zoning of typical cross-sectional profiles of rock strata movement with orebody dip angle of 50°.
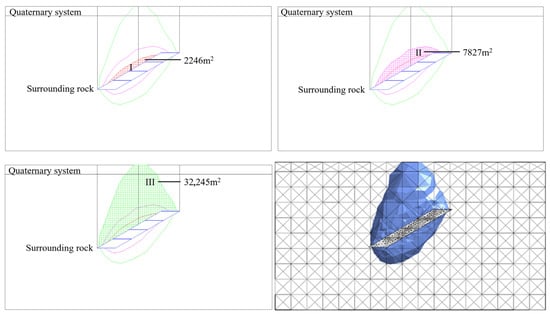
Figure 18.
Quantitative displacement zoning of typical cross-sectional profiles of rock strata movement with orebody dip angle of 30°.
Table 7.
Quantitative analysis of displacement zoning area in typical cross-sectional profiles of rock strata movement under different orebody dip angles.
As the orebody dip angle flattens, the areal extent of both intense and low-disturbance zones progressively increases, amplifying surface displacement impacts. Quantitatively, surface displacements in intense disturbance zones measure: 7.2 mm at 90° dip, 8.7 mm at 70°, 13.0 mm at 50°, and 19.0 mm at 30°.
4.2. Essential Mechanism Analysis of Strata Movement in IMBR
Surface displacement exhibits a negative correlation with orebody dip angle, attributable to distinct stress field distributions induced by stope geometry variations across dip angles. To further reveal the underlying mechanism of this phenomenon, this study used the Mathews stability diagram method, focusing on systematic analysis through the gravity adjustment factor C and the mine shape factor S [50,51,52,53,54].
The design process of the Mathews stability diagram method is based on two factors: stability number N and mine shape coefficient S. After determining the stability index N, the value of S can be determined based on the extended Mathews stability diagram. As evidenced by Mathews stability analysis in Figure 19, stope stability shows positive correlation with Mathews stability number N, while demonstrating negative correlation with the logarithmic function of the shape factor S.
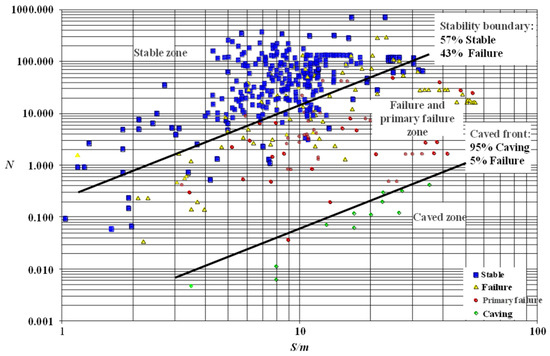
Figure 19.
Mathews method stability chart [51].
The stability number N is calculated as:
where Q′—rock mass quality index, A—stress reduction factor, B—joint orientation correction factor, and C—gravitational adjustment coefficient.
The stability index N is positively correlated with the gravity adjustment coefficient. The calculation method for the gravity adjustment coefficient is shown in Figure 20. It can be concluded that: the roof C is 1, the upper side wall 30° C is 1.94, 50° C is 3.50, 70° C is 5.61, and 90° C is 8.00.
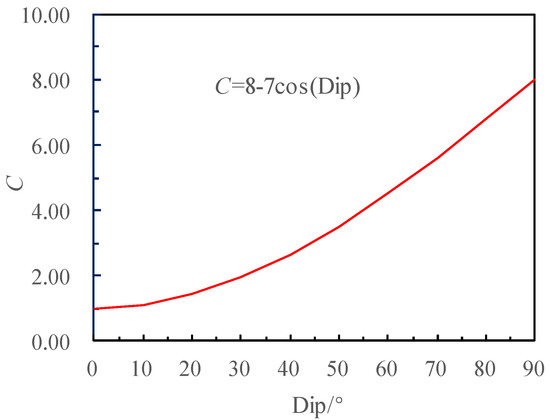
Figure 20.
Gravity adjustment coefficient calculation diagram.
The stope shape factor S is calculated as:
where X—stope width (m) and Y—stope length (m).
The top plate S is 18.75 m, the upper side wall 30° S is 35.29 m, 50° S is 30.54 m, 70° S is 27.97 m, and 90° S is 27.27 m.
With flattening orebody dip angles, the gravitational adjustment coefficient of the roof gradually decreases, with the gravitational adjustment coefficient C showing a significant reduction, directly leading to a decrease in the stability factor N, which is detrimental to the local stability of the mining area; simultaneously, the shape factor S increases as the dip angle decreases, with its logarithm logS correspondingly increasing, further exerting a negative impact on stability. The combined trends of these two parameters indicate that during the mining of gently dipping ore bodies, the roof and upper bench of the mining area are more prone to instability, and the stress disturbance effects after backfilling become more pronounced, leading to an expanded range of movement in the overlying strata and exacerbating surface displacement and stability risks.
5. Conclusions
Numerical modeling via Midas GTS NX was employed to analyze the synergistic ground control performance of IMBR. Based on displacement characteristics of strata and surface under varying orebody dip angles, stress release coefficients, and contacted/uncontacted conditions, the following conclusions are derived:
- (1)
- The resultant surface displacement reduction rate increases with decreasing excavation-induced stress release coefficients, while amplifying as dip angle diminishes. For distinct dip angles, the growth slope of reduction rate versus stress release coefficients steepens progressively with stress release coefficients reduction. Conversely, the rate augmentation attenuates with declining dip angles.
- (2)
- Flattening dip angles progressively expand the areal extent of both intense and low-disturbance zones in strata, consequently enhancing surface displacement impacts.
- (3)
- Shallower dips reduce the gravitational adjustment coefficient of hanging walls while increasing the stope shape factor S. Post-mining backfilling demonstrates that reduced dip angles intensify stress disturbance effects, thereby enlarging overburden movement domains and exacerbating surface impacts.
- (4)
- Controlled management of the stress relief rate post-mining, coupled with timely backfilling ensuring roof contact, effectively mitigates surface strata movement and ground deformation. In practical mining operations, a stress relief rate of 60% is recommended. This rate should be dynamically calibrated through displacement monitoring data, enabling prompt backfilling and roof contact treatment of mined-out areas.
Author Contributions
Methodology, H.L.; formal analysis, C.M., S.L. and H.L.; resources, T.Y.; data curation, T.Y. and S.L.; writing—original draft, S.L., H.L. and X.C.; writing—review and editing, H.L., S.L. and X.C.; visualization, T.Y. and C.M.; funding acquisition, H.L. All authors have read and agreed to the published version of the manuscript.
Funding
This work is supported by the Key Technology Project of Hebei Iron and Steel Group (NO. HG2023215), Central Guiding Local Technology Development Funding (NO. 246Z4101G) and the Basic Research Foundation of Hebei Provincial Universities (NO. JJC2024071).
Institutional Review Board Statement
Not applicable.
Informed Consent Statement
Not applicable.
Data Availability Statement
The data presented in this study are available on request from the corresponding author. The data are not publicly available due to privacy.
Conflicts of Interest
Author Sheng Li was employed by Luanxian Sijiaying Iron Ore Co., Ltd., Hebei Iron and Steel Group. The remaining authors declare that the research was conducted in the absence of any commercial or financial relationships that could be construed as a potential conflict of interest.
References
- Sun, W.; Wang, H.; Hou, K. Control of waste rock-tailings paste backfill for active mining subsidence areas. J. Clean. Prod. 2018, 171, 567–579. [Google Scholar] [CrossRef]
- Yu, J.X.; Liu, S.Y.; Zhou, Z.B.; Jiao, H.Z.; Wang, J.X.; Zhou, L.H. Influence of filling mining on ground stability in a metal mine. Arab. J. Geosci. 2023, 17, 18. [Google Scholar] [CrossRef]
- Adelsohn, E.; Iannacchione, A.; Winn, R. Investigations on longwall mining subsidence impacts on Pennsylvania highway alignments. Int. J. Min. Sci. Technol. 2020, 30, 85–92. [Google Scholar] [CrossRef]
- Zha, J.F.; Guo, G.L.; Feng, W.K.; Wang, Q. Mining subsidence control by solid backfilling under buildings. Trans. Nonferrous Met. Soc. China 2011, 21, 670–674. [Google Scholar] [CrossRef]
- Pu, H.; Zhang, J. Research on protecting the safety of buildings by using backfill mining with solid. Procedia Environ. Sci. 2012, 12, 191–198. [Google Scholar] [CrossRef][Green Version]
- Wang, C.; Zhang, B.; Lu, Y.; Liao, C.; Lu, W. Failure law of floor during strip mining backfill with paste-tailings over confined aquifer: A case study in China mine. Case Stud. Constr. Mater. 2024, 20, e02806. [Google Scholar] [CrossRef]
- Guo, Y.H.; Hou, K.P. Study on Surface Subsidence Law Induced by Deep Mining of Large Steep Metal Deposit. Appl. Mech. Mater. 2013, 2301, 2902–2905. [Google Scholar] [CrossRef]
- Xu, K.; Chen, Y.; Li, M.; Zhang, Y.; Zhang, P.; Chen, T. Research on the mechanism of deformation and instability of surrounding rock in goaf under dynamic loading and the mechanism of active coordinated control. Front. Earth Sci. 2025, 13, 1535868. [Google Scholar] [CrossRef]
- Chang, X.; Wang, R.; Zhang, J. Characteristic Analysis of Surface Subsidence in Deep Mining. In Proceedings of the Taishan Academic Forum—Project on Mine Disaster Prevention and Control, Qingdao, China, 17–19 October 2014. [Google Scholar]
- Li, F.; Guo, J.; Ma, F.; Li, G.; Song, Y. The Influence of Different Sublevel Heights on the Stability of Faults under Sublevel-Filled Synergistic Mining. Appl. Sci. 2023, 13, 12906. [Google Scholar] [CrossRef]
- Chen, S.; Yin, D.; Liu, X.; Wang, H.; Pu, Z. Collaborative mining using different equipment for a coal seam varying in thickness in a long wall working face. Int. J. Oil Gas Coal Technol. 2016, 13, 73–86. [Google Scholar] [CrossRef]
- Zhang, L.; Hu, J.; Wang, X.; Chai, X.; Zhao, L. Collaborative Mining Sequence Optimization for Multiple Stopes under Intensive Mining. Adv. Civ. Eng. 2021, 2021, 6683157. [Google Scholar] [CrossRef]
- Li, H.; Guo, Z.; Hua, X.; Dai, B.; Zeng, X.; Zhao, Y. Research on the Influence of Backfilling Mining in an Iron Mine with Complex Mining Conditions on the Stability of Surface Buildings. Sustainability 2023, 15, 14733. [Google Scholar] [CrossRef]
- Li, M.; Peng, Y.; Ding, L.; Zhang, J.; Ma, D.; Huang, P. Analysis of Surface Deformation Induced by Backfill Mining Considering the Compression Behavior of Gangue Backfill Materials. Appl. Sci. 2022, 13, 160. [Google Scholar] [CrossRef]
- Qian, D.; Deng, J.; Wang, S.; Yang, X.; Cui, Q.; Li, Z.; Jin, S.; Liu, W. Deformation Characteristics and Control Countermeasures for Surrounding Rock of Deep Roadway under Mining Disturbance: A Case Study. Shock Vib. 2022, 2022, 9878557. [Google Scholar] [CrossRef]
- Zhang, L.; Huang, G.; Luo, J.; Zhang, X. A Surrounding Rock Stress Distribution Model for Deep Mining. Indian J. Geo-Mar. Sci. 2018, 47, 2407–2414. [Google Scholar]
- Liu, R. The Mechanical Model on Surface Subsidence Caused by Backfilling Mined-Out Area on Thick Loose Loess Layer: Taking a Sedimentary Bauxite Mine as an Example. Geotech. Geol. Eng. 2022, 41, 1083–1099. [Google Scholar] [CrossRef]
- Guo, J.; Yang, W.; Zhao, Y.; Zhang, W. Stability Analysis of a Mine Wall Based on Different Roof-Contact Filling Rates. Minerals 2024, 14, 673. [Google Scholar] [CrossRef]
- Cheng, G.; Chen, C.; Ma, T.; Liu, H.; Tang, C. A Case Study on the Strata Movement Mechanism and Surface Deformation Regulation in Chengchao Underground Iron Mine. Rock Mech. Rock Eng. 2017, 50, 1011–1032. [Google Scholar] [CrossRef]
- Zhao, Y.; Yang, T.; Bohnhoff, M.; Zhang, P.; Yu, Q.; Zhou, J.; Liu, F. Study of the Rock Mass Failure Process and Mechanisms During the Transformation from Open-Pit to Underground Mining Based on Microseismic Monitoring. Rock Mech. Rock Eng. 2018, 51, 1473–1493. [Google Scholar] [CrossRef]
- Xu, Z.; Xu, W.; Zhu, Z.; Zhao, J. Research on monitoring and stability evaluation of ground subsidence in gypsum mine goaf. Front. Environ. Sci. 2023, 10, 1097874. [Google Scholar] [CrossRef]
- Tao, M.; Zhao, Y.; Guo, J. Arch model of roof and optimization of roof-contacted filling rate in two-step mining. Trans. Nonferrous Met. Soc. China 2023, 33, 1893–1905. [Google Scholar] [CrossRef]
- Lu, H.; Qi, C.; Chen, Q.; Gan, D.; Xue, Z.; Hu, Y. A new procedure for recycling waste tailings as cemented paste backfill to underground stopes and open pits. J. Clean. Prod. 2018, 188, 601–612. [Google Scholar] [CrossRef]
- Xue, G.; Yilmaz, E.; Wang, Y. Progress and prospects of mining with backfill in metal mines in China. Int. J. Miner. Metall. Mater. 2023, 30, 1455–1473. [Google Scholar] [CrossRef]
- Cai, M.; Li, P.; Tan, W.; Ren, F. Key Engineering Technologies to Achieve Green, Intelligent, and Sustainable Development of Deep Metal Mines in China. Engineering 2021, 7, 1513–1517. [Google Scholar] [CrossRef]
- Wang, J.; Xiao, B.; Liu, X.; Ruan, Z. Trends and Applications of Green Binder Materials for Cemented Paste Backfill Mining in China. Minerals 2025, 15, 97. [Google Scholar] [CrossRef]
- Wu, A.; Wang, Y.; Ruan, Z.E.; Xiao, B.; Wang, J.; Wang, L. Key theory and technology of cemented paste backfill for green mining of metal mines. Green Smart Min. Eng. 2024, 1, 27–39. [Google Scholar] [CrossRef]
- Hou, J.; Li, C.; Yuan, L.; Li, J.; Liu, F. Study on green filling mining technology and its application in deep coal mines: A case study in the Xieqiao coal mine. Front. Earth Sci. 2023, 10, 1110093. [Google Scholar] [CrossRef]
- Zhou, N.; Li, M.; Zhang, J.; Gao, R. Roadway backfill method to prevent geohazards induced by room and pillar mining: A case study in Changxing coal mine, China. Nat. Hazards Earth Syst. Sci. 2016, 16, 2473–2484. [Google Scholar] [CrossRef]
- Jiang, Y.D.; Wang, H.W.; Zhao, Y.X.; Zhu, J.; Pang, X.F. The Influence of Roadway Backfill on Bursting Liability and Strength of Coal Pillar by Numerical Investigation. Procedia Eng. 2011, 26, 1125–1143. [Google Scholar] [CrossRef]
- Sun, Q.; Zhou, N.; Song, W.J.; Zhao, X. Risk Assessment and Prevention of Surface Subsidence under Buildings by Cemented Paste Filling and Strip Mining Methods: A Case Study. Adv. Civ. Eng. 2021, 2021, 9965279. [Google Scholar] [CrossRef]
- Tesarik, D.R.; Seymour, J.B.; Yanske, T.R. Long-term stability of a backfilled room-and-pillar test section at the Buick Mine, Missouri, USA. Int. J. Rock Mech. Min. Sci. 2008, 46, 1182–1196. [Google Scholar] [CrossRef]
- Wu, P.; Zhao, J.; Jin, J. Similar simulation of overburden movement characteristics under paste filling mining conditions. Sci. Rep. 2023, 13, 12550. [Google Scholar] [CrossRef]
- GB/T 23561.7-2009; Methods for Determining the Physical and Mechanical Properties of Coal and Rock—Part 7: Methods for Determining the Uniaxial Compressive Strength and Counting Softening Coefficient. China Standards Press: Beijing, China, 2009.
- Hu, J.; Xiang, R.; Wen, G.; Ma, S.; Pang, L. Study on the Influence of Shear Indenter Parameters on the In Situ Shear Strength Test. Minerals 2022, 12, 618. [Google Scholar] [CrossRef]
- He, Z.; Wu, G.; Zhu, J. Mechanical properties of rock under uniaxial compression tests of different control modes and loading rates. Sci. Rep. 2024, 14, 2164. [Google Scholar] [CrossRef]
- Yin, N. Analysis on Surrounding Rock Mass Plastic Zone of Deep Underground Chamber Based on Hoek-Brown Criterion. Adv. Mater. Res. 2013, 838–841, 741–746. [Google Scholar] [CrossRef]
- Paramita, B.; Puja, D. Stability of Twin Elliptical Tunnels in Hoek–Brown Rock Mass. Arab. J. Sci. Eng. 2023, 48, 13987–14015. [Google Scholar]
- Cao, Z.; Xu, B.; Cai, Y.; Galindo, R.A. Application of the modified Hoek-Brown criterion in the analysis of the ultimate bearing capacity at the tip of a pile in inclined rocks. Int. J. Rock Mech. Min. Sci. 2022, 160, 105276. [Google Scholar] [CrossRef]
- Nan, S.Q.; Zhang, J.X.; Guo, X.Z.; Yang, T.H. Calculation and Optimization of Soil Slope Stability on One Iron Mine. Appl. Mech. Mater. 2014, 3468, 1998–2002. [Google Scholar] [CrossRef]
- Fall, M.; Benzaazoua, M.; Saa, E.G. Mix proportioning of underground cemented tailings backfill. Tunn. Undergr. Space Technol. Inc. Trenchless Technol. Res. 2006, 23, 80–90. [Google Scholar] [CrossRef]
- Jung, S.J.; Biswas, K. Review of Current High Density Paste Fill and Its Technology. Miner. Resour. Eng. 2002, 11, 165–182. [Google Scholar] [CrossRef]
- Bhasin, R.; Grimstad, E. The use of stress-strength relationships in the assessment of tunnel stability. Tunn. Undergr. Space Technol. 1996, 11, 93–98. [Google Scholar] [CrossRef]
- Yasuda, N.; Tsukada, K.; Asakura, T. Elastic solutions for circular tunnel with void behind lining. Tunn. Undergr. Space Technol. Inc. Trenchless Technol. Res. 2017, 70, 274–285. [Google Scholar] [CrossRef]
- Guo, X.-F.; Zhao, Z.; Gao, X.; Ma, Z.-K.; Ma, N.-J. Directional Sharp-Point Failure Mechanism of Rocks Surrounding Underground Circular Cavities Subjected to Large-Scale Failure. Math. Probl. Eng. 2019, 2019, 1415387. [Google Scholar] [CrossRef]
- Li, G.; Li, N.; Bai, Y.; Yang, M. An new elastic–plastic analytical solution of circular tunnel under non-axisymmetric conditions. Sci. Rep. 2022, 12, 4367. [Google Scholar] [CrossRef]
- Park, K.-H.; Tontavanich, B.; Lee, J.-G. A simple procedure for ground response curve of circular tunnel in elastic-strain softening rock masses. Tunn. Undergr. Space Technol. Inc. Trenchless Technol. Res. 2007, 23, 151–159. [Google Scholar] [CrossRef]
- Carranza-Torres, C.; Fairhurst, C. Application of the Convergence-Confinement method of tunnel design to rock masses that satisfy the Hoek-Brown failure criterion. Tunn. Undergr. Space Technol. Inc. Trenchless Technol. Res. 2000, 15, 187–213. [Google Scholar] [CrossRef]
- Sharan, S.K. Exact and approximate solutions for displacements around circular openings in elastic–brittle–plastic Hoek–Brown rock. Int. J. Rock Mech. Min. Sci. 2005, 42, 542–549. [Google Scholar] [CrossRef]
- Mawdesley, C.; Trueman, R.; Whiten, W.J. Extending the Mathews stability graph for open–stope design. Min. Technol. 2001, 110, 27–39. [Google Scholar] [CrossRef]
- Vallejos, J.A.; Delonca, A.; Fuenzalida, J.; Burgos, L. Statistical analysis of the stability number adjustment factors and implications for underground mine design. Int. J. Rock Mech. Min. Sci. 2016, 87, 104–112. [Google Scholar] [CrossRef]
- Mortazavi, A.; Osserbay, B. The Consolidated Mathews Stability Graph for Open Stope Design. Geotech. Geol. Eng. 2022, 40, 2409–2424. [Google Scholar] [CrossRef]
- Papaioanou, A.; Suorineni, F.T. Development of a generalised dilution-based stability graph for open stope design. Min. Technol. 2016, 125, 121–128. [Google Scholar] [CrossRef]
- Sainsbury, B.; Sainsbury, D.; Vakili, A. Discrete analysis of open stope stability. In Design Methods 2015, Proceedings of the International Seminar on Design Methods in Underground Mining, Perth, Australia, 17–19 November 2015; Potvin, Y., Ed.; Australian Centre for Geomechanics: Perth, Australia, 2015; pp. 79–94. [Google Scholar]
Disclaimer/Publisher’s Note: The statements, opinions and data contained in all publications are solely those of the individual author(s) and contributor(s) and not of MDPI and/or the editor(s). MDPI and/or the editor(s) disclaim responsibility for any injury to people or property resulting from any ideas, methods, instructions or products referred to in the content. |
© 2025 by the authors. Licensee MDPI, Basel, Switzerland. This article is an open access article distributed under the terms and conditions of the Creative Commons Attribution (CC BY) license (https://creativecommons.org/licenses/by/4.0/).