Article

A Lightweight Instance Segmentation Model for Simultaneous Detection of Citrus Fruit Ripeness and Red Scale (Aonidiella aurantii) Pest Damage

by
İlker Ünal
1 and
Osman Eceoğlu
2,*
1
Department of Mechanical Engineering, Faculty of Engineering and Architecture, Burdur Mehmet Akif Ersoy University, 15030 Burdur, Türkiye
2
Department of Control and Automation, Technical Science Vocational School, Akdeniz University, 07070 Antalya, Türkiye
*
Author to whom correspondence should be addressed.
Appl. Sci. 2025, 15(17), 9742; https://doi.org/10.3390/app15179742
Submission received: 31 July 2025 / Revised: 2 September 2025 / Accepted: 3 September 2025 / Published: 4 September 2025
(This article belongs to the Section Agricultural Science and Technology)

Abstract

Early detection of pest damage and accurate assessment of fruit ripeness are essential for improving the quality, productivity, and sustainability of citrus production. Moreover, precisely assessing ripeness is crucial for establishing the optimal harvest time, preserving fruit quality, and enhancing yield. The simultaneous and precise early detection of pest damage and assessment of fruit ripeness greatly enhance the efficacy of contemporary agricultural decision support systems. This study presents a lightweight deep learning model based on an optimized YOLO12n-Seg architecture for the simultaneous detection of ripeness stages (unripe and fully ripe) and pest damage caused by Red Scale (Aonidiella aurantii). The model is based on an improved version of YOLO12n-Seg, where the backbone and head layers were retained, but the neck was modified with a GhostConv block to reduce parameter size and improve computational efficiency. Additionally, a Global Attention Mechanism (GAM) was incorporated to strengthen the model’s focus on target-relevant features and reduce background noise. The improvement procedure improved both the ability to gather accurate spatial information in several dimensions and the effectiveness of focusing on specific target object areas utilizing the attention mechanism. Experimental results demonstrated high accuracy on test data, with mAP@0.5 = 0.980, mAP@0.95 = 0.960, precision = 0.961, and recall = 0.943, all achieved with only 2.7 million parameters and a training time of 2 h and 42 min. The model offers a reliable and efficient solution for real-time, integrated pest detection and fruit classification in precision agriculture.

1. Introduction

Citrus fruits are among the most popular and widely cultivated fruit crops throughout the world and have high economic value, with global exports reaching approximately 16 million metric tons. Fifty-two percent of citrus exports originate in the Mediterranean region, primarily Spain, South Africa, Türkiye, and Egypt. According to the most recent data published by the Food and Agriculture Organization of the United Nations (FAO), world citrus production is at the level of 169 million tons. As of 2024, Türkiye produced 7.9 million tons of citrus. These data show that Türkiye is a major player in world citrus production [1]. However, citrus diseases and pests are among the main problems that seriously affect fruit yield and quality and threaten global citrus cultivation [2]. In citrus production, various types of diseases and pests routinely affect the health of trees, causing significant yield and quality losses and even tree death. The rapid spread of diseases to healthy plants causes major economic losses and damages sustainable production in citrus farming [3].
The ripening process of fruits involves a series of physiological and biochemical transformations, including peel softening, reduction in cell wall strength, changes in water content, and shifts in metabolic activity. These structural and metabolic changes often increase fruit susceptibility to biotic stress factors, particularly piercing–sucking pests. The Red Scale, an armored scale insect, feeds by extracting sap from host tissues and injecting toxic enzymes, thereby causing both physiological and cosmetic damage. Early infestations typically result in permanent rind depressions (pitting), whereas heavy infestations at advanced fruit stages may lead to encrustation, tissue necrosis, premature fruit drop, yield loss, and a reduction in commercial value [4,5].
Furthermore, during late stages of fruit ripeness, environmental stresses such as high temperature and water deficit exacerbate the visible effects of Red Scale feeding, including yellowing, rind breakdown, and metabolic impairment [5]. Although direct studies linking ripeness stages to Red Scale damage severity are limited, research on comparable biotic stressors indicates that advanced fruit maturity generally increases susceptibility to both mechanical injuries and pathogen infections. For instance, peaches at later maturity stages exhibit higher levels of bruising, decay, and fungal infection compared to less mature fruit [6]. These findings suggest that while fully ripened fruit may not necessarily attract Red Scale more than immature fruit, the structural fragility and physiological sensitivity associated with advanced ripeness amplify the severity and visibility of damage. Therefore, understanding the interaction between fruit maturity and pest infestation dynamics is critical for mitigating quality loss and reducing economic damage in citrus production systems.
The yield and quality of citrus fruits are seriously threatened by citrus pests. Early pest prevention is crucial for economic savings, environmental pollution reduction, and sustainable citrus farming. Traditional disease detection methods are mostly based on manual visual identification, which is time-consuming, labor-intensive, inefficient, and costly, making it difficult for farmers to identify and manage infections in a timely manner [7]. In contrast, deep learning-based automatic detection systems enable real-time and large-scale monitoring in agricultural areas, reduce dependence on manual control, and support environmental sustainability by optimizing pesticide usage. In recent years, deep learning-based YOLO (You Only Look Once) algorithms have come to the fore in agricultural applications and have become widely used in the rapid simultaneous detection of plant diseases and pests [8]. Additionally, the most common problems faced in fruit detection on the trees are illumination variation and leaf overlap. For this reason, some researchers have also proposed Synthetic Aperture Radar (SAR) based on edge deformable convolution and point set representation for complex environments [9].
Object detection is a key function of computer vision, a significant branch of artificial intelligence focused on finding and locating the precise locations of objects within an image or video [10]. Computer vision uses machine learning and neural networks to teach computers and systems to derive meaningful information from digital images, videos, and other visual input and to make recommendations or take action when they see defects or problems [11]. There are three processes involved in traditional object detection: (1) proposal generation to guide the search for objects and avoid exhaustive sliding window searches across images, (2) feature extraction to extract relevant features from images and signals, and (3) classification to identify the most critical objects and prioritize protecting sensitive data [12]. Despite the increasing application of deep learning techniques in horticulture, the performance of existing models for the detection of small targets of citrus pests is limited due to information bottlenecks that arise, especially during information transfer. Due to the situation described above, standard deep learning methods are insufficient to fully automate the detection of citrus pests [13]. In addition, existing YOLO models commonly have drawbacks such as multi-scale training, foreground–background class imbalance, and detection of relatively smaller objects, necessity of large datasets and computational power, smaller-sized datasets, and inaccurate localization during predictions [14].
Many researchers have suggested different techniques to improve standard YOLO algorithms for solving the issues mentioned above. Zhang et al. [15] proposed a deep learning algorithm that integrates multi-scale feature fusion into the YOLOv4 model, enabling more accurate small object detection. Hu et al. [16] increased the ability of the YOLOv5 model to adapt to different environments with data augmentation and transfer learning methods. Similarly, Xu et al. [17] applied layer pruning in the YOLOv4-Tiny model, reducing the number of parameters and presenting a more efficient structure in terms of speed. Li et al. [18] developed a lighter and faster model by integrating attention mechanisms and loss function optimization and achieved high accuracy even in low-equipment systems. However, these developed lightweight models still have some limitations in terms of small object detection accuracy and generalization ability. For this reason, multi-task learning and model aggregation approaches have attracted attention in recent research. Song et al. [19] developed an algorithm by improving model success that combines object detection, classification, and segmentation. Li et al. [20] stated that combining multiple YOLO models with ensemble learning strategies can increase accuracy and stability. Soeb et al. [21] successfully applied the YOLOv7 model to tea leaf diseases and achieved high performance. Dai et al. [2] used the improved version of YOLOv8 to develop a lighter and more effective model for the detection of citrus diseases. In recent studies, it has been observed that the YOLOv11 model provides high speed and accuracy in orchard conditions and is more successful than many existing models [22,23].
This study aims to detect different ripeness stages and Red Scale damage in citrus fruits by a deep learning-based object segmentation method. In the study, a lighter and faster structure was created by developing the YOLO12n-Seg model to successfully identify small objects, especially under complex garden conditions. It is expected that this developed model will contribute to more efficient use of time, cost, and labor for producers by being integrated into early-warning systems in citrus orchards.

1.1. Related Work

Early detection of plant diseases is critical to preventing disease spread, ensuring the sustainability of agricultural production, minimizing yield losses, and assisting farmers. In recent years, computer vision and deep learning-based approaches have offered effective solutions in this area. The YOLO models have shown promising results for their real-time object detection capabilities. Kumar et al. [24] integrated a YOLOv5-based framework and a bidirectional feature attention pyramid network (Bi-FAPN) to detect rice leaf diseases at an early stage and on multiple scales. The proposed model showed high performance with 94.87% accuracy and a 92.45% F1 score. Islam et al. [25] comparatively tested multiple models, including YOLOv5, YOLOv7, and YOLOv8, on seven different leafy vegetables and their seven disease types grown in Bangladesh. They obtained satisfactory results in classification and segmentation tasks with their original datasets, named LeafyVclassify7BD and LeafyVdisease7BD.
Yue et al. [26] improved the YOLOv8s-Seg model with modules such as RepBlock and SimConv instead of C2f in the discrimination of healthy and diseased samples in tomato plants and achieved a segment mAP value of 92.2% @0.5. Khan et al. [27] detected diseases such as Blight, Sugarcane Mosaic Virus, and Leaf Spot of maize plants at different developmental stages with 99.04% accuracy using the YOLOv8n model. Li et al. [20] proposed a high-performance model enriched with the Inception module and clustering algorithm by combining YOLO-based single-stage and Faster-RCNN-based two-stage structures as a solution to the challenges encountered in small object detection. The YOLO-Tea model proposed by Xue et al. [28] solved the shadow and small object problems in tea leaf images taken in natural environments with modules such as ACmix, RFB, and GCNet and achieved an improvement of 0.3–15% compared to the traditional YOLOv5 model. Soeb et al. [21] classified five different tea leaf diseases with 97.3% accuracy using the YOLOv7-based YOLO-T model and developed a structure that can be integrated into IoT devices. Sapkota et al. [22] evaluated all versions from YOLOv8 to YOLOv12 in the context of detection and counting of apple fruits and showed that the YOLOv12l model had the highest accuracy and the YOLOv10x model had the highest precision. The YOLOv8-GABNet model developed by Dai et al. [29] was proposed for the detection of citrus diseases and nutritional deficiencies and provided 4.3% higher average accuracy with 43.6% fewer parameters. The D-YOLO model developed by Wu et al. [30] was built on YOLOv8s and supported by components such as MobileNetv3, BiFPN, and contextual attention mechanisms, providing 90.5% test sensitivity and a 75.1% processing load reduction in the detection of strawberry diseases. The SAW-YOLO model [11] achieved 90.3% overall success in the detection of citrus pests with the SPD module and AFFD heading structure, which increased the accuracy of small targets. In studies on pomegranate production, Wang et al. [31] proposed the YOLO11-PGM model, developing a lightweight system with 92.3% accuracy and only 1.63 M parameters, with multi-scale edge enhancement and high-level elimination modules that reduced leaf and fruit overlaps.
Overall, all these studies demonstrate that deep learning, and particularly YOLO-based models, offers high accuracy and speed in disease and pest detection across various plant species. Specific design changes to the YOLO model architecture, transfer learning strategies, multi-scale feature fusion structures, and attention mechanisms significantly increased the overall performance of the systems. Furthermore, by enabling integration with mobile devices with low computational overhead, they enabled practical applications in agricultural fields.

1.2. Motivation

Monitoring the phenological stages of plants and developing effective strategies to combat diseases and pests are of paramount importance in achieving the desired yield and quality in sustainable agricultural production practices [32]. The Red Scale (Aonidiella aurantii), a major pest causing significant damage to the leaves, fruits, and branches of citrus plants, can severely impact both yield and quality, leading to considerable economic losses [13]. Early detection of this pest in citrus orchards is thus critical for implementing effective control measures. Traditional methods for pest and disease detection in plants primarily rely on visual inspections and field surveys, which are often time-consuming and subject to human error due to their dependence on expert knowledge [33,34]. The increasing use of image processing techniques in agricultural applications has offered substantial contributions in this regard. Deep learning has recently gained prominence in agricultural research due to its capability to extract meaningful information from large datasets [35,36].
The main motivation of this study lies in the detection of different ripeness stages and Red Scale infestation in citrus fruits using a deep learning-based instance segmentation approach. The developed deep learning model is designed for integration into early warning systems in citrus orchards and offers a lightweight and high-performance architecture suitable for operation under limited hardware conditions. This enables efficient use of time, cost, and labor for growers while also aiming to minimize the environmental impact caused by unnecessary chemical applications. Furthermore, the proposed model, developed specifically for the Mediterranean region, an important citrus producing area, relies on an original dataset and thus addresses a significant gap in the existing literature.

1.3. Contribution

Red Scale is among the most detrimental pests encountered in citrus cultivation, causing severe damage across nearly all parts of the plant. Timely detection and the implementation of appropriate integrated control strategies are crucial for sustainable agriculture. If the population of Red Scale in citrus orchards increases beyond manageable levels, it inevitably leads to substantial losses in terms of fruit appearance, quality, and yield. This study focuses on the detection of different fruit classes on citrus trees, including ripe, unripe, and Red Scale-infested fruits, using deep learning techniques. The study offers several noteworthy contributions to the existing literature: (i) The training datasets consist of fruits at different ripeness levels and Red Scale-infected fruits collected from the same tree, enhancing model robustness; (ii) Red Scale-infested fruits can be identified at an earlier stage with high accuracy using deep learning, allowing for timely interventions and optimized biological control strategies by reducing unnecessary and excessive chemical pesticide use; and (iii) the model supports sustainable orchard management by contributing to accurate yield estimation on a per-tree basis. In addition, the model developed in this study offers a valuable decision support tool for pest management within future agricultural policies related to citrus production.

2. Materials and Methods

2.1. Red Scale (Aonidiella aurantii (Maskell) (Hemiptera: Diaspididae))

Damage caused by pests on plants negatively affects growth, development, and yield potential, leading to significant losses in agricultural production. Armored scale insects (Hemiptera: Coccomorpha: Diaspididae), which are important pests on plants, are insects that suck plant sap and generally continue their life hidden on the plant. Approximately 2600 species of Diaspididae have been reported worldwide. These insects, which are among the world’s most invasive species, have spread over a wide area because they can be easily transmitted through plants [37,38,39]. One of these insects is Red Scale (Aonidiella aurantii), which is an important citrus pest (Figure 1a). Red Scale causes significant negative impacts on citrus fruits worldwide, particularly in Australia, Northwest Mexico, North America, and the Eastern Mediterranean [40]. Red Scale is a serious production pest that can survive in all conditions where citrus fruits can grow and damages the trunk, branches, shoots, leaves, and fruits of the tree (Figure 1b). Red Scale can settle in all organs of the citrus canopy and feed on plant tissues. If this pest is not adequately combated, it can cause citrus fruit to be aesthetically damaged, dirty, and small when its population is high [41,42].
Red Scale can kill heavily infested citrus trees, and its presence on fruit causes the market value of the product to decrease and significant economic losses to occur [43,44]. Various control methods are implemented to minimize product damage and economic losses. In this context, although chemical methods have been applied successfully, the basis for combating this pest is to protect and support natural enemies by increasing biological diversity [41]. Natural enemies of Red Scale in the Mediterranean basin are ectoparasitoids Aphytis chrysomphali Mercet (Hymenoptera: Aphelinidae), A. melinus [44,45,46], endoparasitoids, and generalist predators [46,47]. Integrated biological methods developed with natural enemies are frequently used because the pest develops resistance to insecticides over time [48]. Nowadays, it is important to apply early detection methods to overcome the difficulties encountered in both chemical and biological control of Red Scale in citrus fruits. These early detection methods can be used to control citrus pest populations effectively and quickly.

2.2. Data Acquisition

In this study, all data were collected from an orange grove in the Manavgat district of Antalya, Türkiye (36°46′00″ N and 31°28′00″ E), between 14–15 December and 21 December. The study field is 43 m above sea level. The orange area for harvest is 3.94 ha. A total of 3089 images were obtained using Xiaomi POCO X3 Pro (Xiaomi Inc., Beijing, China) and Xiaomi Redmi Note 8 Pro (Xiaomi Inc., Beijing, China) smartphones. Images were saved in jpeg format with a 1:1 aspect ratio and resolutions of 3000 × 3000 and 3472 × 3472 pixels. To increase the success and generalization ability of the deep learning algorithm, images were captured under various natural lighting conditions. The image acquisition process was carried out in trees where there were no visible damage or external factors that could affect the dataset. Additionally, no pesticides or chemicals were applied to the study field prior to the image collection process.

2.3. Data Preprocessing, Annotation, and Augmentation

In this study, the Roboflow platform was used for image preprocessing, labeling, and data augmentation. Three label classes were defined for the dataset, namely “Unripe,” “Full Ripe,” and “Red Scale,” as shown in Figure 2. Before training, all images with original resolutions of 3000 × 3000 and 3472 × 3472 pixels were resized to a fixed input size of 640 × 640 pixels to be compatible with the network input size using Roboflow. The dataset was then split into 70% training, 20% validation, and 10% testing datasets. While advanced augmentation strategies may further enhance robustness, excessive data expansion could increase computational load and inference latency on resource-constrained real-time systems (Raspberry Pi, Jetson Nano vb.). Therefore, in this study, only basic augmentation techniques (horizontal flip and 90° rotation) were applied to avoid introducing synthetic bias; as a result, the 2162 training images were increased to 4675 images. After labeling and data splitting, the dataset was exported in compressed (zip) YOLO format for model training.
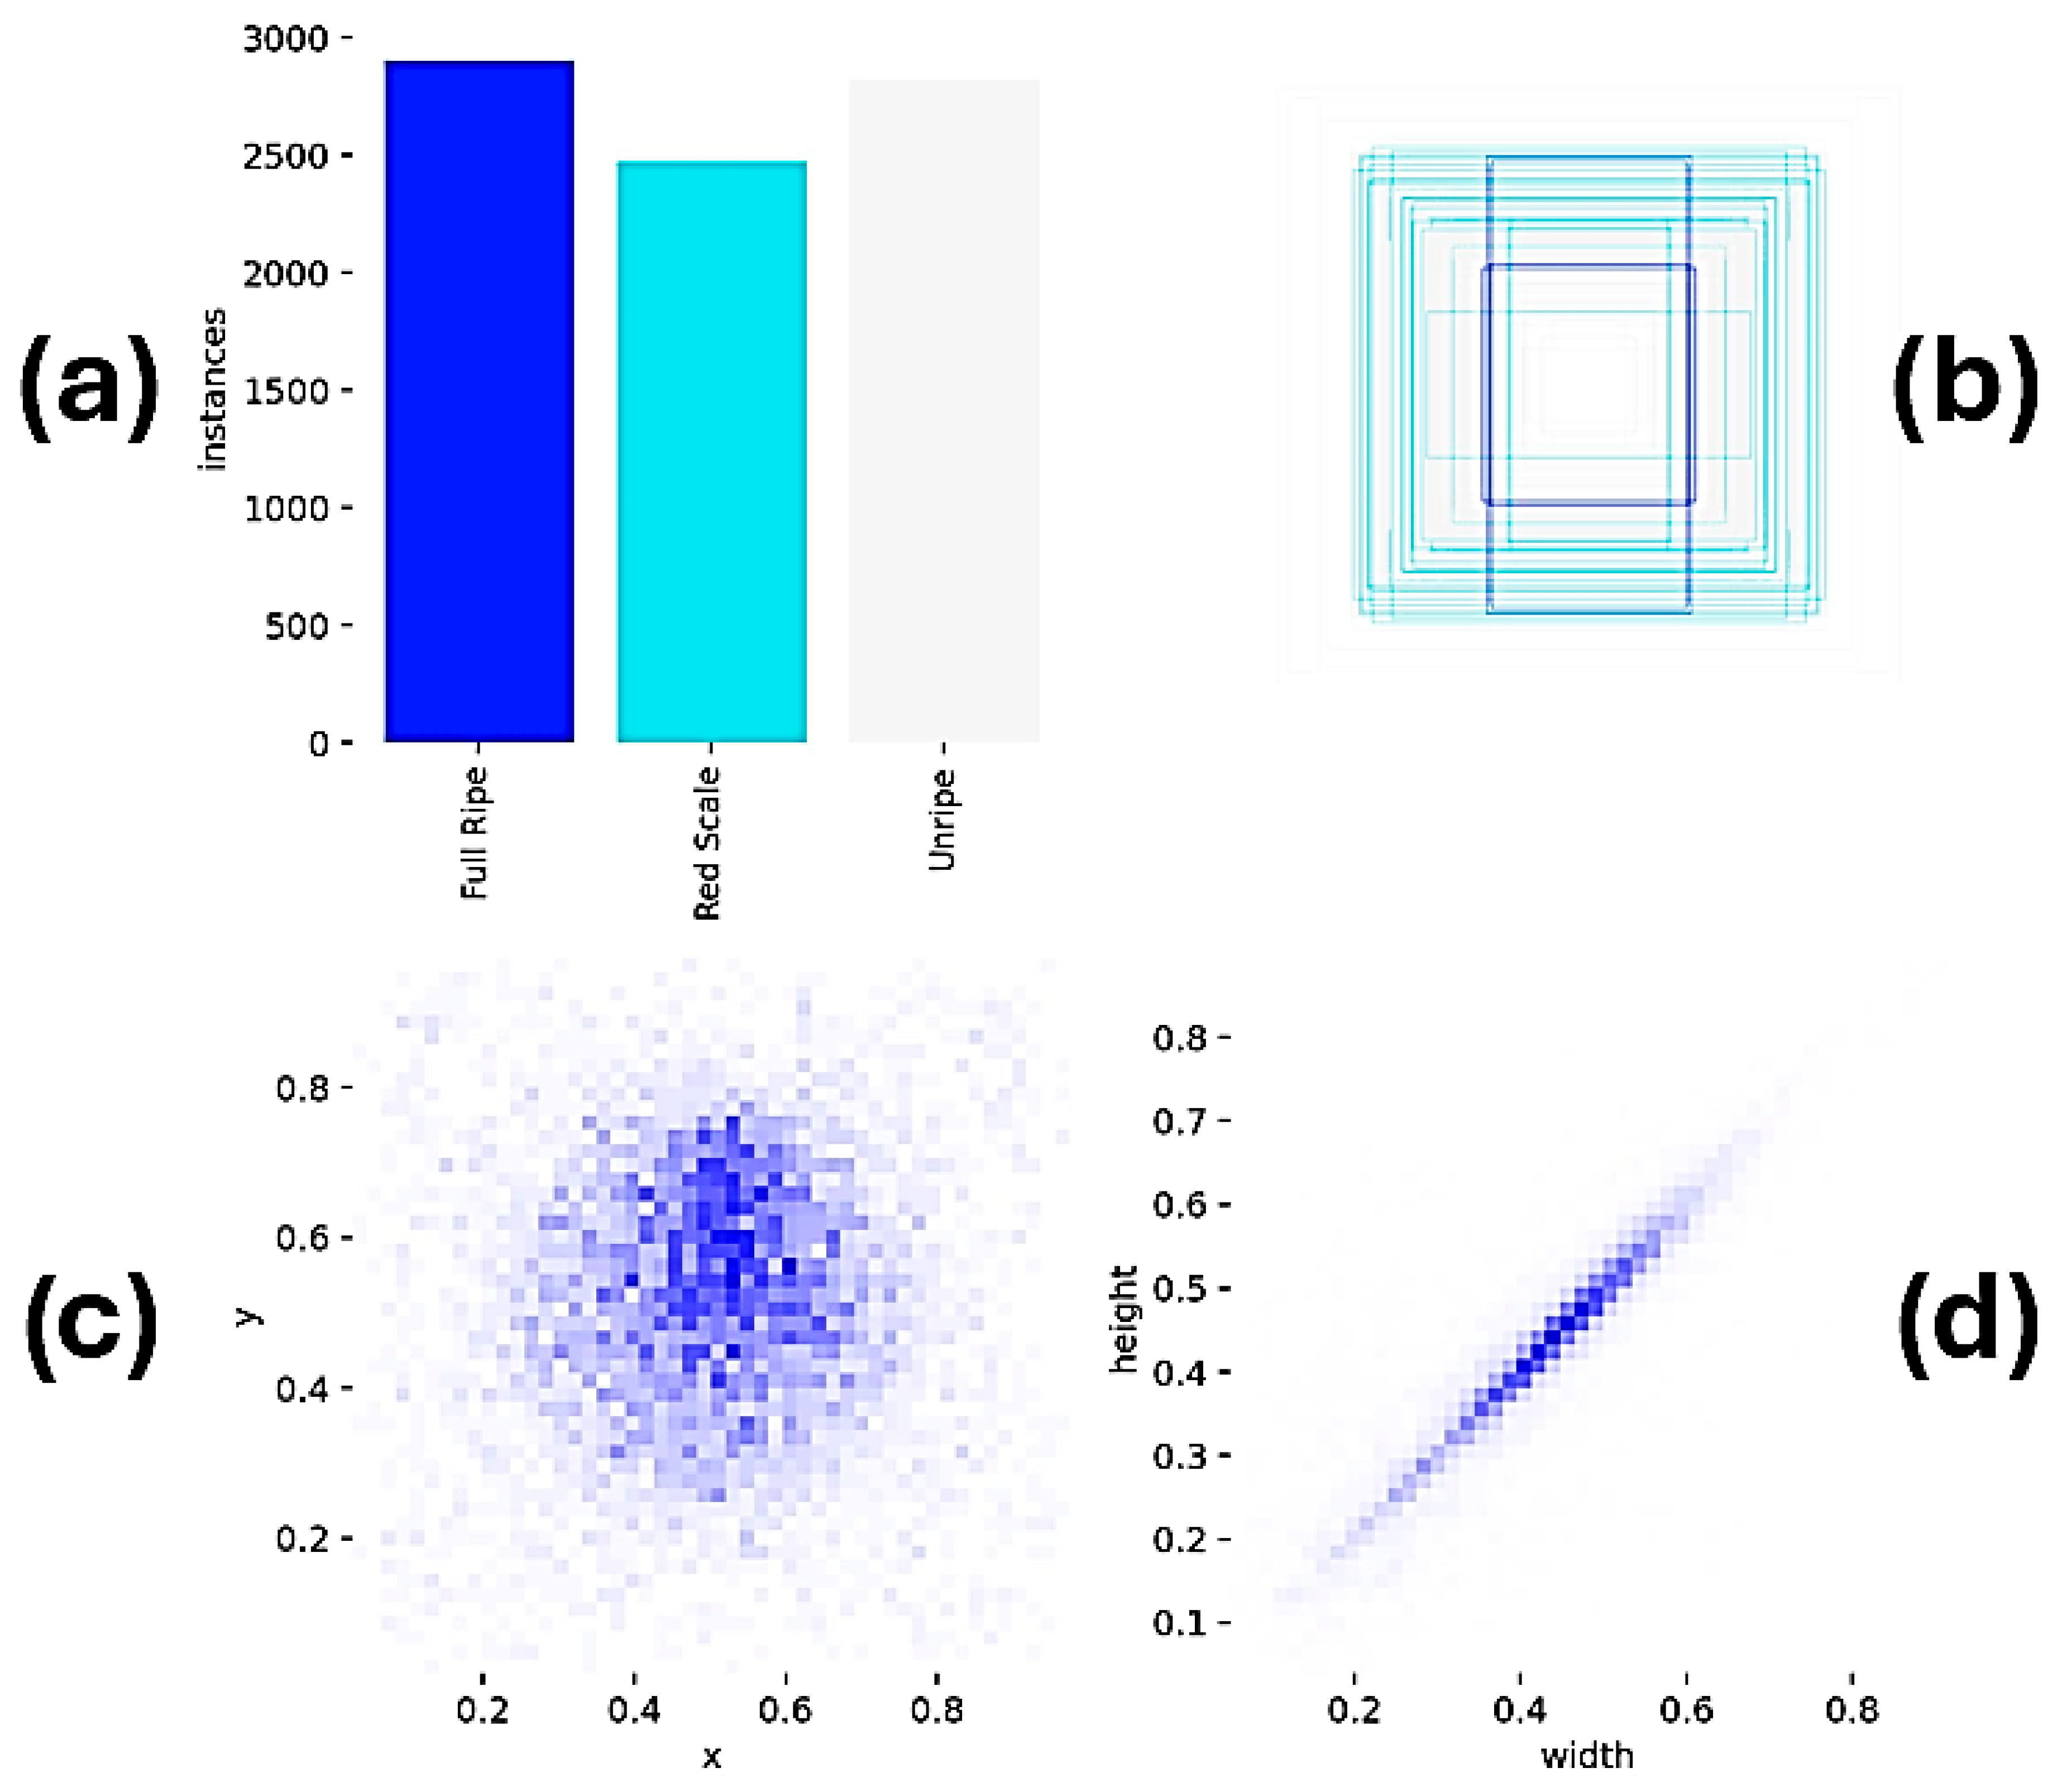
The image labeling process was first performed manually using the bounding box tool for labeling. Statistical analyses were performed to evaluate the accuracy and distribution of the labeled dataset, and the results are presented in Figure 3. Figure 3a shows the number of samples belonging to each class across the entire dataset (train, validation, and test), revealing a balanced representation of the ‘Unripe,’ ‘Full Ripe,’ and ‘Red Scale’ categories. Since a single image may contain multiple fruit instances, the counts represent bounding box annotations rather than image numbers, and slight variations between splits may occur. For the Red Scale class in particular, pest damage intensity was not quantified; instead, samples exhibiting visible symptoms of pest damage were directly included in this category. Figure 3b shows the bounding box dimensions and provides information about the variability in object sizes. Figure 3c presents the normalized location distribution of labeled objects and visualizes the spread of labels over the image. Figure 3d shows the distribution of the normalized label size, revealing a linear relationship between width and height, with smaller border boxes being more densely populated. These analyses help assess the consistency of the dataset and ensure that the labels meet model training requirements.

2.4. Improved Instance Segmentation Model

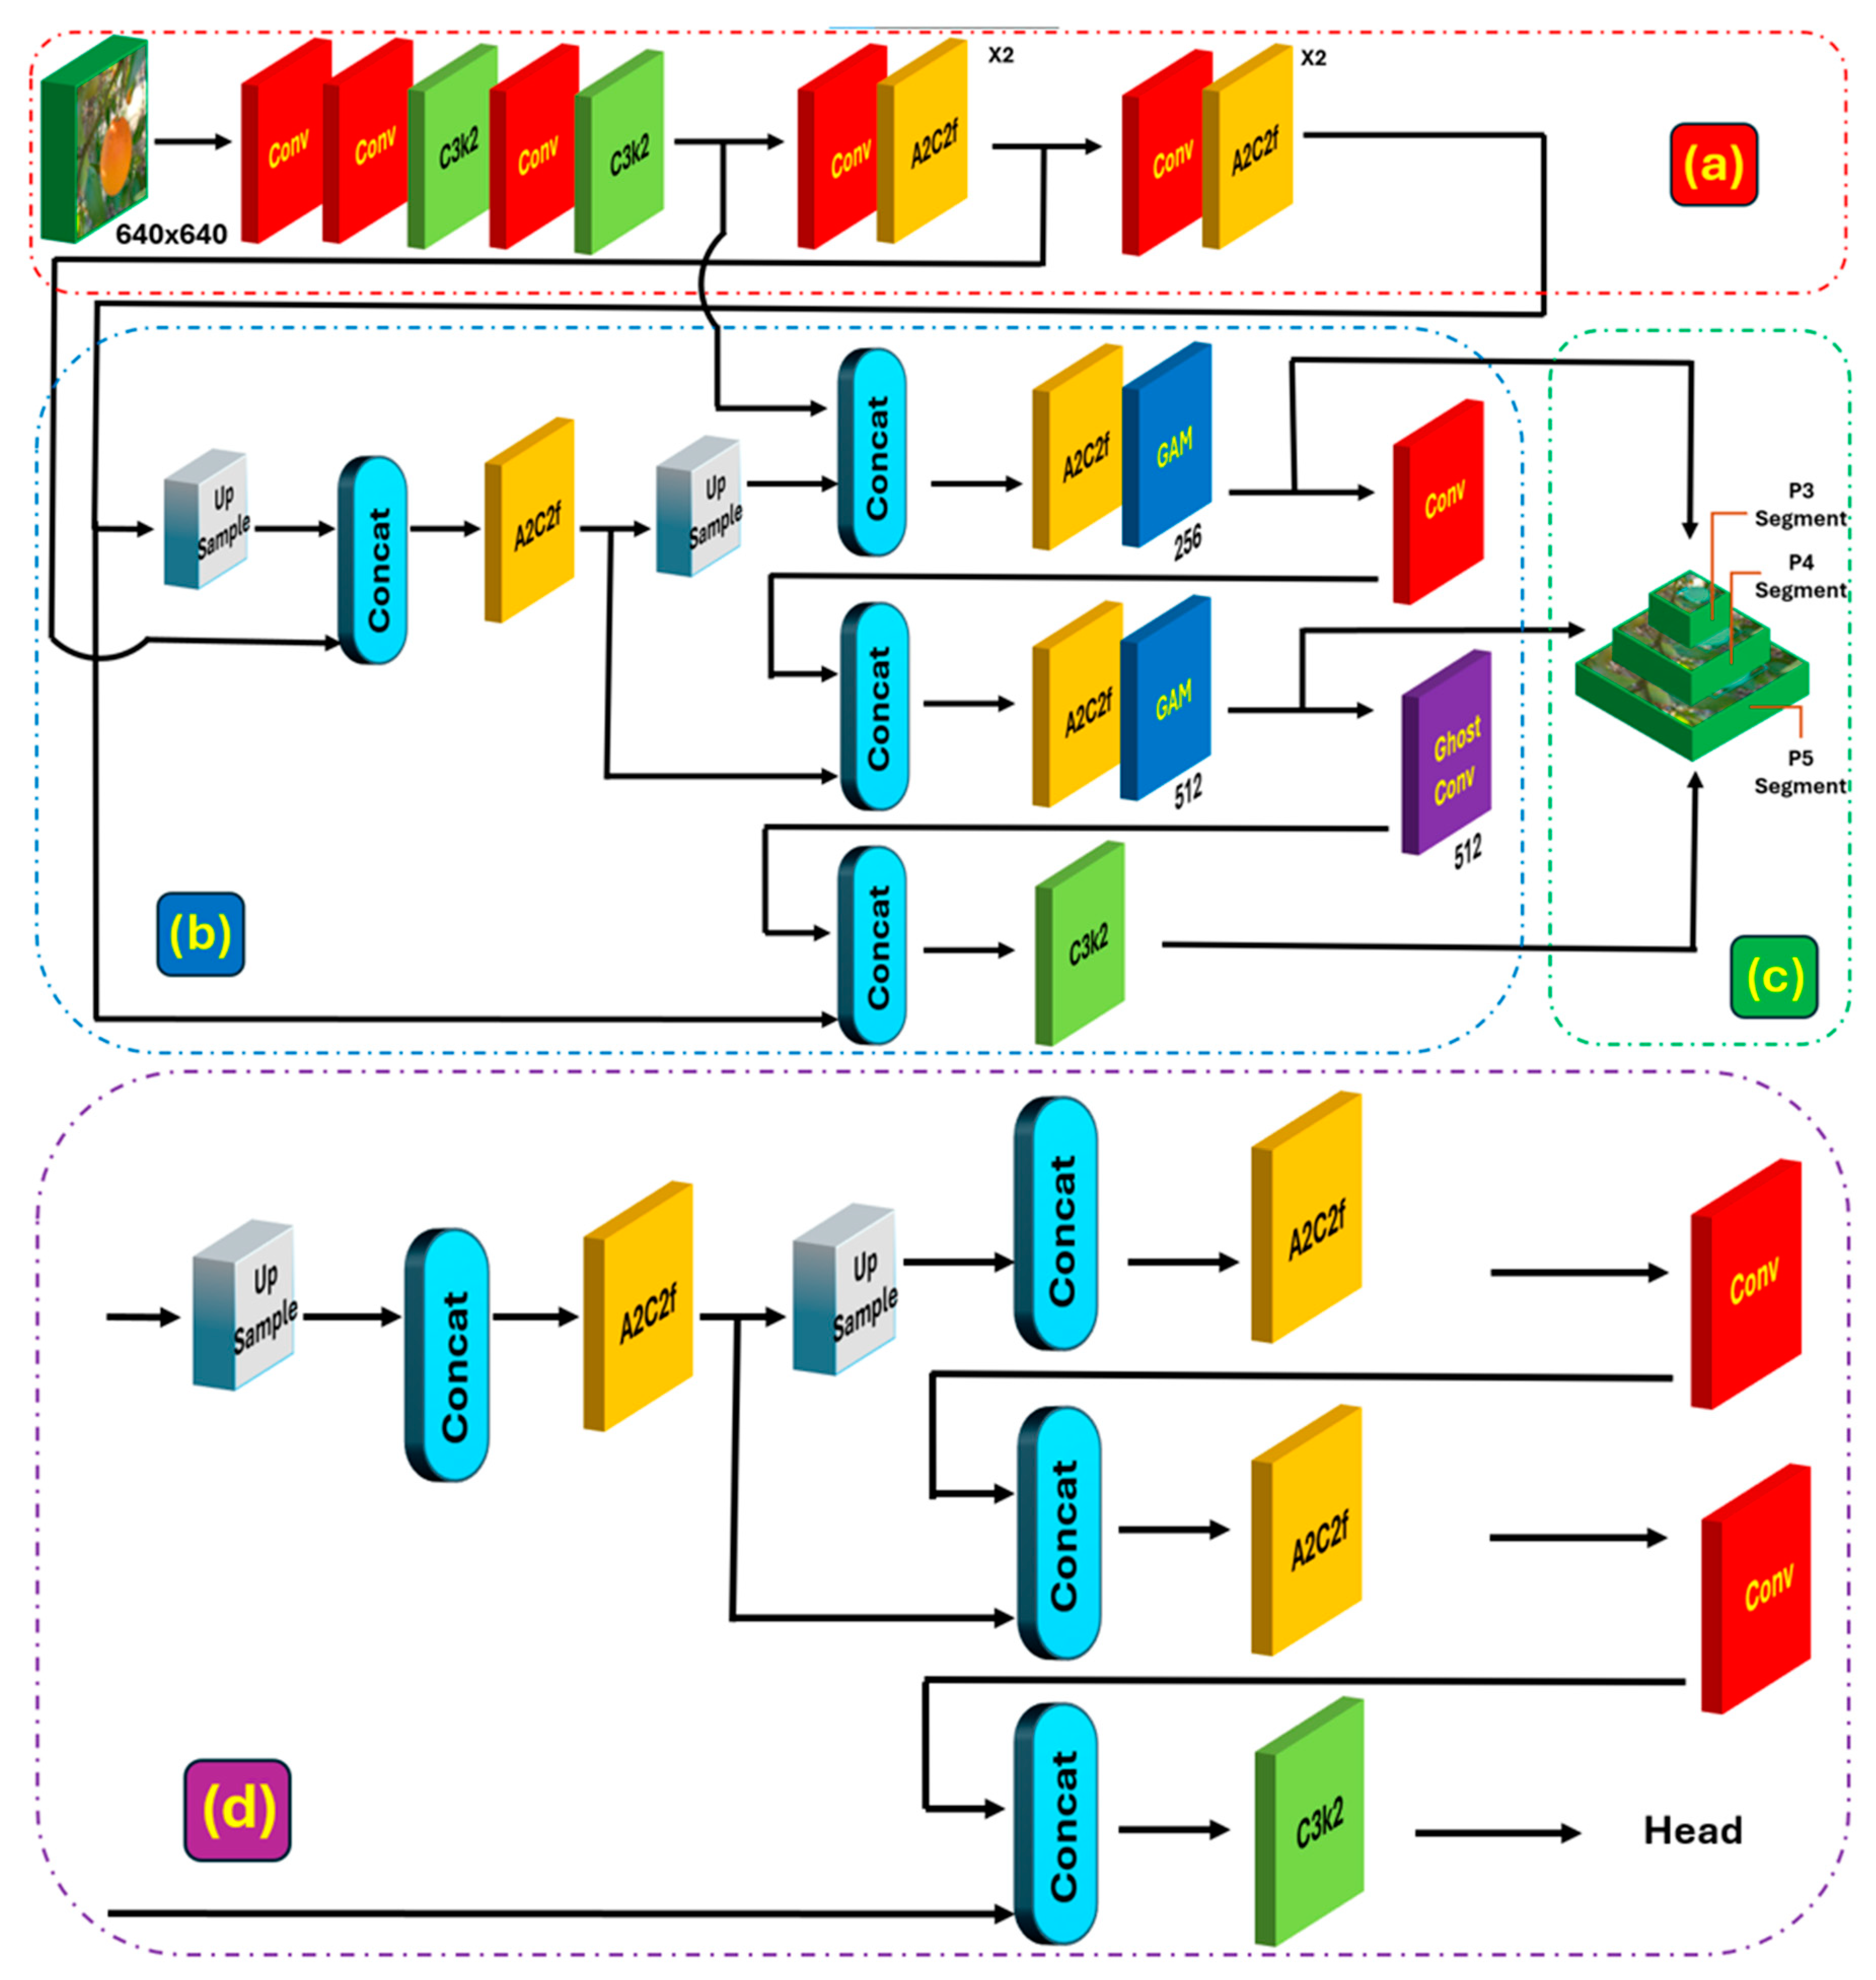
YOLO12, which was used as the basis for model development in the study, is the most current YOLO version, introduced in February 2025. The YOLO12 architecture not only achieves higher accuracy than common real-time detectors such as Faster R-CNN [49], RetinaNet [50], and Detectron2 [51], but also reaches the state-of-the-art performance level with innovative attention methods, Residual Efficient Layer Aggregation Networks (R-ELAN), and various architectural improvements [52]. The model is available in five different variants scaled to different performance and computational requirements: YOLO12n, YOLO12s, YOLO12m, YOLO12l, and YOLO12x [53]. In the study, the smallest YOLO model with “n” scale was used, and some additions and changes were made to the existing architecture. As seen in Figure 4a, the backbone layer was preserved as is since it is the structure from which the first features were extracted. Similarly, no changes were made to the detection head layer shown in Figure 4c. Due to the input and output image sizes being 640 × 640, the multi-scale P3, P4, and P5 detection head structures were used. As shown in Figure 4d, the neck layer of the standard YOLO12n-Seg model is presented. The modifications were implemented on this layer, resulting in the improved neck structure illustrated in Figure 4b. In this section, two GAM modules with channel sizes of 256 and 512 were added immediately after the A2C2f modules, and a GhostConv layer was integrated after the 512-channel GAM module to further reduce computational cost and parameter size. When the figures are examined, the architectural differences between the standard and improved models become evident. The 256-channel GAM module contained 193 parameters, whereas the 512-channel GAM module had 385 parameters. However, the main reduction in the parameter count of the architecture was achieved by replacing the standard convolution with the GhostConv operation. In this modification, the standard convolution layer with 147,712 parameters was replaced by a GhostConv layer containing only 75,584 parameters. As a result of these changes, the parameter size of the segmentation head decreased from 684,025 in the standard model to 623,929 in the improved model. As a result of all these changes, the number of parameters has been reduced from 2.8 M in the standard to 2.7 M in the model. The next section provides specifics about the additional modules and levels.

2.4.1. Global Attention Mechanism (GAM) Module

For the attention mechanism, the GAM was adopted instead of alternatives such as SE or CBAM [54]. While SE focuses solely on channel attention and CBAM combines channel and spatial dimensions, both approaches overlook the interdependencies across different feature axes. In contrast, GAM captures interactions along channel, height, and width simultaneously, thereby mitigating cross-dimensional information loss and enhancing feature extraction efficiency. This property makes GAM particularly suitable for agricultural vision tasks, where objects often exhibit high occlusion, irregular shapes, and low contrast with the background [55]. The most important change made in the backbone network of the developed model to increase feature detection performance was the addition of the GAM module [56] (Figure 5c). GAM is an attention mechanism module that extracts relevant information by selectively focusing on the desired parts of the desired channels and areas to increase recognition accuracy [57]. The GAM module consists of two attention sub-modules: spatial attention (SAM) and channel attention (CAM). In SAM (Figure 5b), first, a convolution process with a 7 × 7 kernel size is performed to process the input features. As the GAM module proposed by [56] employs a standard 7 × 7 kernel size in the SAM component, this study retained the same configuration without any modification to the kernel size. This process converts the size of the feature map from C × W × H to C/r × W × H, reducing the number of channels and the amount of computation. Additionally, a different 7 × 7 kernel size convolution was also implemented to increase the number of channels, ensure consistency, and preserve the number of channels. Finally, the feature map is produced as output through the sigmoid function. In CAM (Figure 5a), the input is first dimensionally transformed in the feature map. It is then fed to the 3D Multi-Layer Perceptron (MLP). The image fed into the MLP is converted back to its original size, and the output is produced after passing through the sigmoid process.
When these processes are explained with formulas, in Equation (1), F1 ∈ RC × H × W, and ‘MC’ represents the way CAM processes the input vector F1 to obtain the output vector F3. Here, ‘⊗’ is the tensor product of the processed vector and the input vector F1. In Equation (2), ‘MS’ refers to the way SAM processes vector F2. Here, ‘⊗’ represents the tensor product of the processed vector and the input vector F2 [58].
F2 = MC (F1) ⊗ F1
F3 = MS (F2) ⊗ F2

2.4.2. GhostConv

GhostConv [59] uses two methods to generate output feature maps. The first method produces intrinsic feature maps using standard convolution (Figure 6a). The second method transforms intrinsic feature maps into ghost feature maps with linear operations using group convolution (Figure 6b) [60]. GhostConv maintains performance by reducing the number of parameters and calculations in the convolution process by using simple linear transformation and combination operations to achieve a lightweight design [61,62]. The main purpose of the backbone network is to extract richer features. When directly replacing standard convolution layers with ghost convolution layers in the backbone, it inevitably leads to performance degradation in the network, since only half of the features are used in ghost convolution layers [63].

2.5. Experimental Environment and Parameters

To assess the performance of the study, a MacBook Pro 2012 (Apple Inc., Cupertino, California, CA, USA) and a Google Colab (Mountain View, California, CA, USA) notebook were utilized as the deep learning environment. The experimental setup was implemented within Colab, leveraging a virtual Nvidia Tesla A100 GPU (Santa Clara, California, CA, USA) for accelerated computations. Both model training and testing were performed in the same Colab environment to ensure hardware consistency and reproducibility of the experiments. The detailed configuration of the experimental environment is presented in Table 1.
In line with previous studies on citrus fruit ripeness detection, the input images were resized to 640 × 640 pixels and the training was conducted with a batch size of 16 using the Stochastic Gradient Descent (SGD) optimizer. Similar configurations have been consistently reported in the literature [64,65,66,67], where a batch size of 16 and the SGD optimizer were adopted, with some studies further specifying 100 training epochs [67]. Following this common practice, the same hyperparameters were employed in the present study to ensure consistency and comparability with related works, as also summarized in Table 2.

2.6. Model Evaluation Indicators

In the experimental phase of the study, the model’s box and mask accuracy were evaluated using mAP@0.5 and mAP@0.5:0.95 metrics. The calculations were performed based on Equation (3) for mAP@0.5 and Equation (4) for mAP@0.5:0.95, ensuring a comprehensive assessment of detection and segmentation performance [68,69].
m A P 0.5 = 1 n c 0 1 P R d R
m A P 0.5 0.95 = a v g m A P i , i = 0.5 : 0.05 : 0.95
In the equation, “nc” denotes the number of classes, “P” represents precision, and “R” stands for recall. The precision (P) is computed using Equation (5), while the recall (R) is determined based on Equation (6) [69].
P = T P T P + F P
R = T P T P + F N
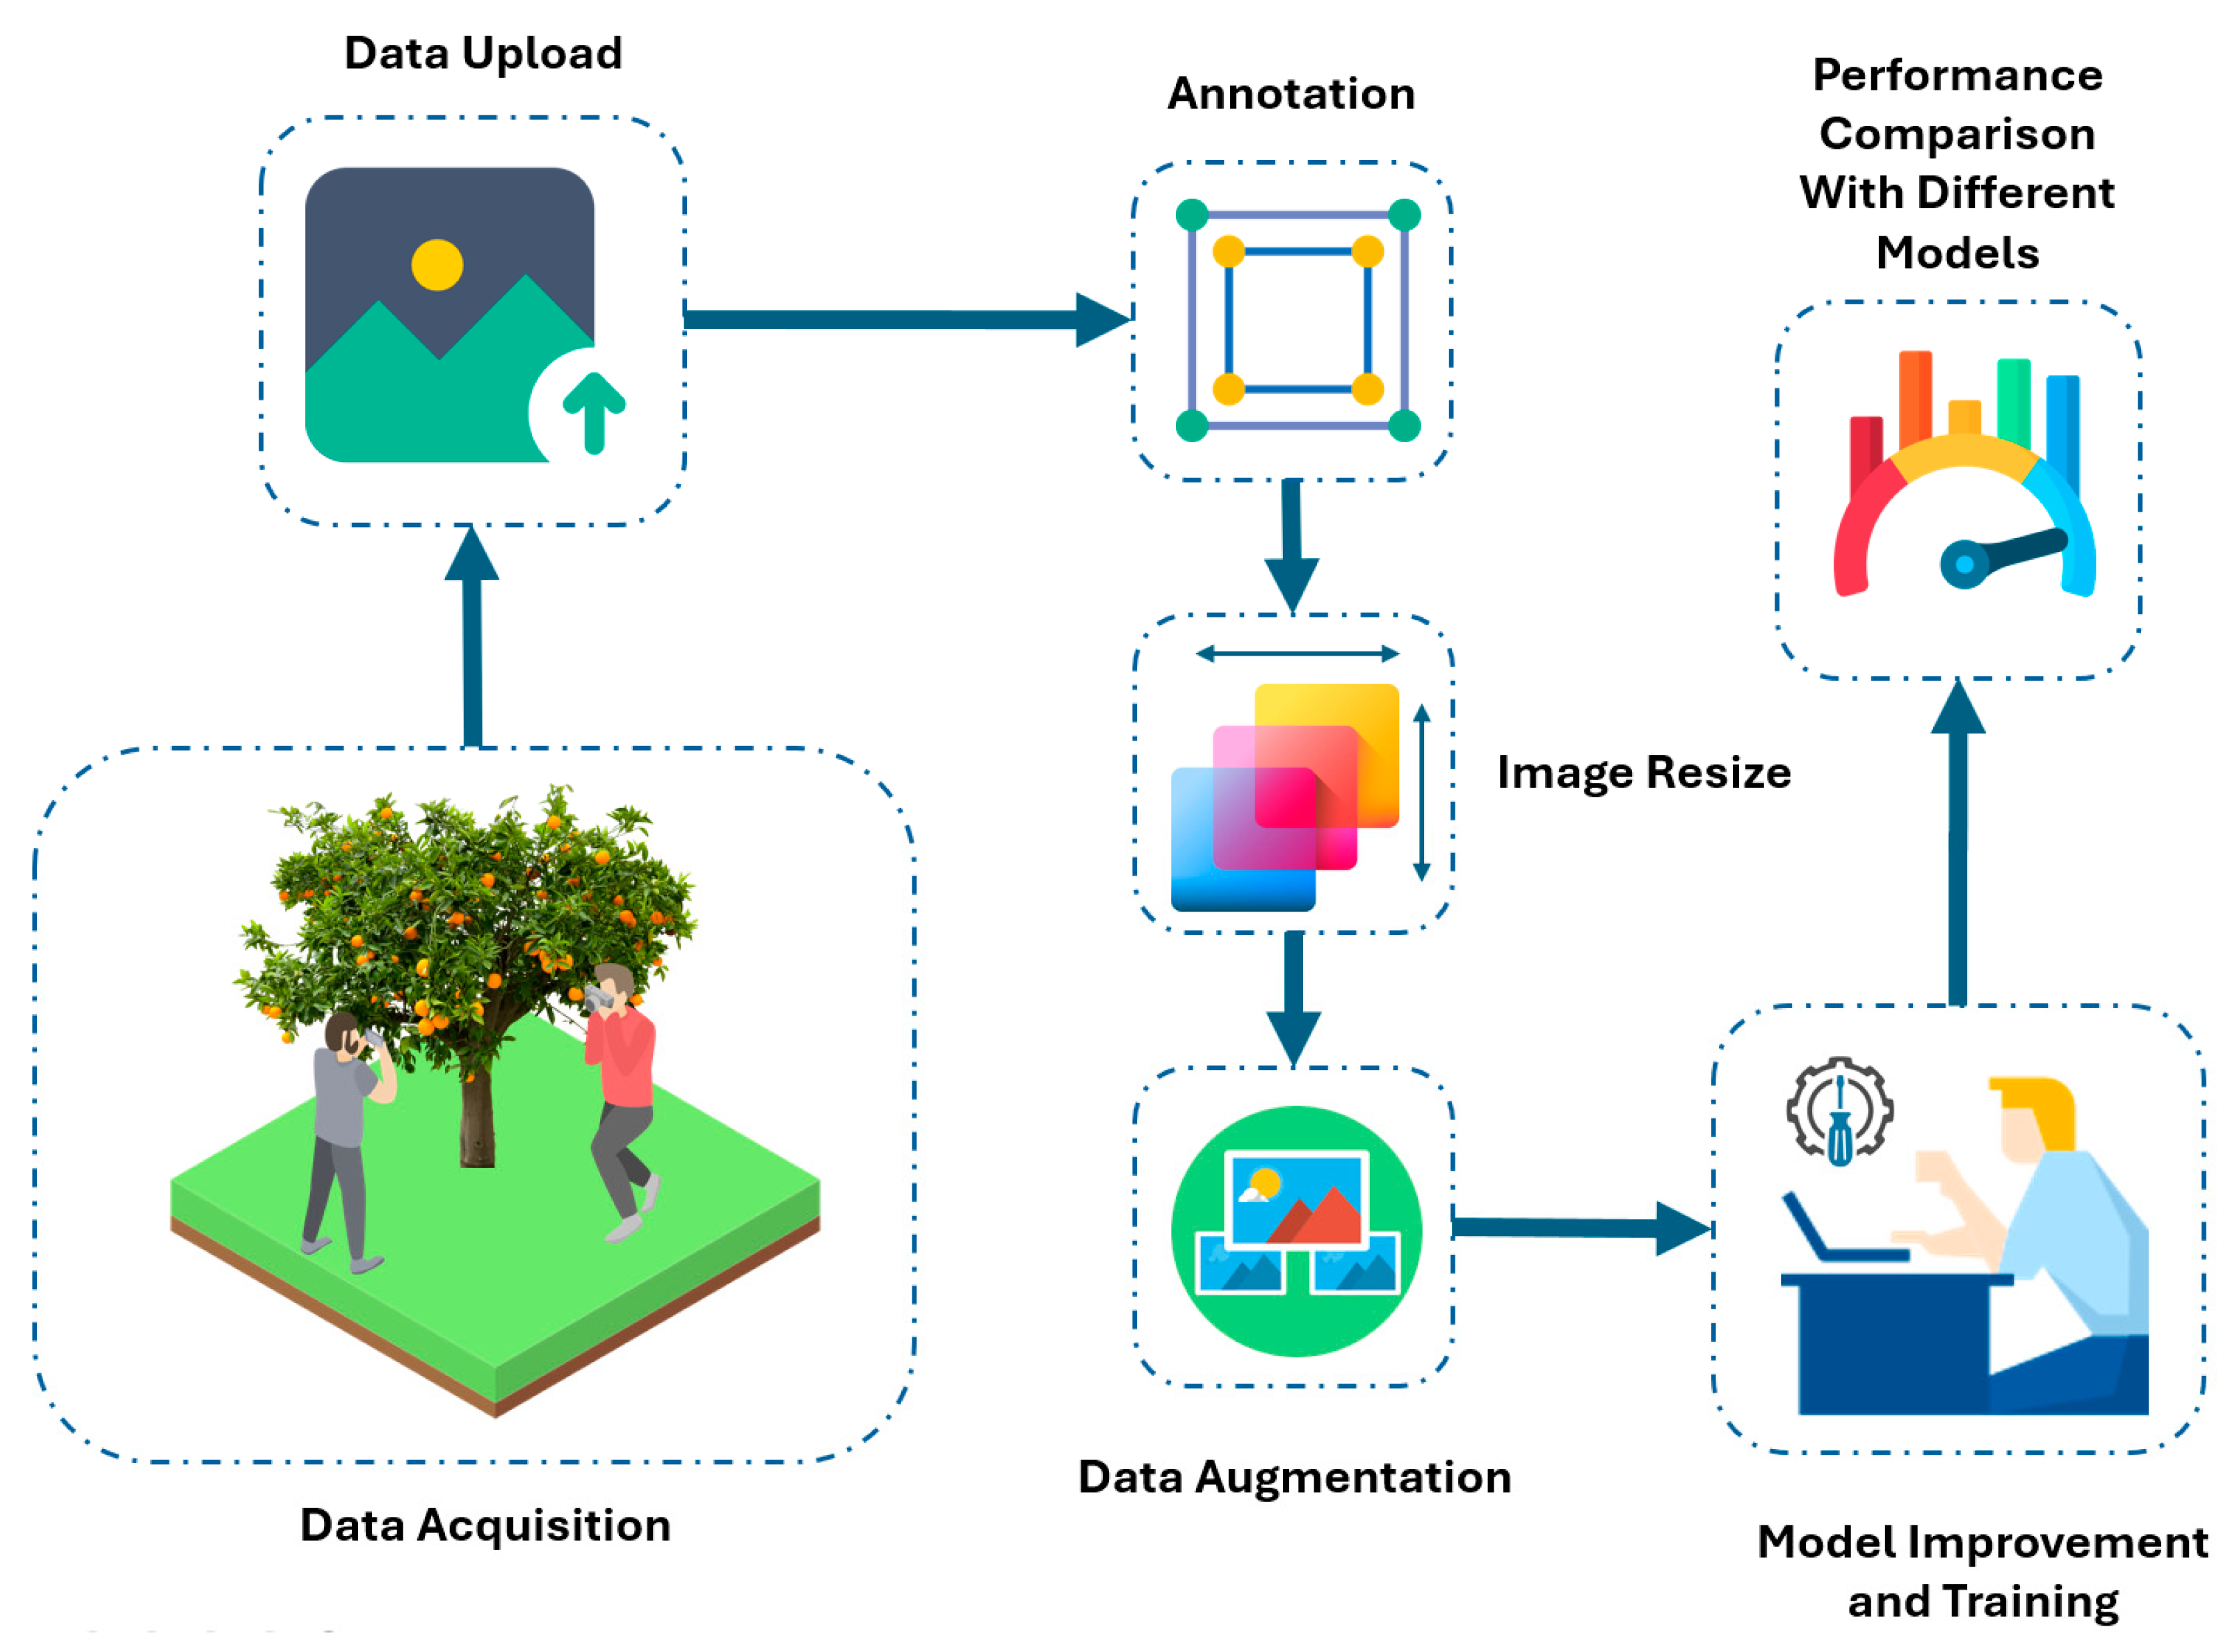
TP (True Positive) refers to correctly detected objects, representing the number of predicted bounding boxes with IoU > 0.5. FP (False Positive) indicates incorrectly detected objects, including prediction boxes with an IoU ≤ 0.5. FN (False Negative) represents undetected labels, indicating missed objects in the images. These metrics are essential for evaluating the model’s effectiveness in accurately detecting and segmenting objects [70]. As shown in Figure 7, the model training and improvement process was completed after the data collection, loading, labeling, dimensioning, and data augmentation steps. In the next section, the comparative performance analysis results of the developed model with those of different models are presented.

3. Experimental Results and Discussion

3.1. Model Results

Class-based mask performance results of the developed model are presented in Table 3. The classes were evaluated in three different categories: Full Ripe, Red Scale, and Unripe. Precision (P), Recall (R), mAP@0.5, and mAP@0.5:0.95 were used as performance metrics.
When the overall results are considered, the model demonstrated high accuracy in both object detection and segmentation across the entire dataset, achieving Precision: 0.961, Recall: 0.943, mAP@0.5:0.980, and mAP@0.5:0.95:0.960. These outcomes highlight the model’s strong generalization capability under varying visual conditions. Class-wise evaluation revealed that the highest performance was attained in the Red Scale class, with Precision: 0.982, Recall: 0.971, mAP@0.5:0.992, and mAP@0.5:0.95:0.984, indicating the model’s ability to effectively identify pest-damaged fruits. Similarly, the Unripe class also yielded strong results (mAP@0.5:0.982, Precision: 0.936, Recall: 0.933), suggesting that the model was capable of distinguishing low-contrast unripe fruits with high accuracy. In contrast, the Full Ripe class exhibited slightly lower performance (Recall: 0.926, mAP@0.5:0.95:0.946), which may be attributed to visual occlusion caused by overlapping fruits or leaves, or to the limitations of certain imaging conditions. In the test split, the class distribution consisted of 224 images for Unripe, 221 for Full Ripe, and 212 for Red Scale. Although the counts are not perfectly equal, the variation between the largest and smallest class is less than 6% and was therefore not considered a critical imbalance. Additionally, while the recall for Full Ripe (0.926) was slightly lower than that of Red Scale (0.971), the difference (<5%) is relatively small. This variation may be due to the more distinctive visual cues of pest-damaged fruits, combined with occasional occlusions or high similarity between fully ripened fruits and the background, rather than a systematic detection bias.
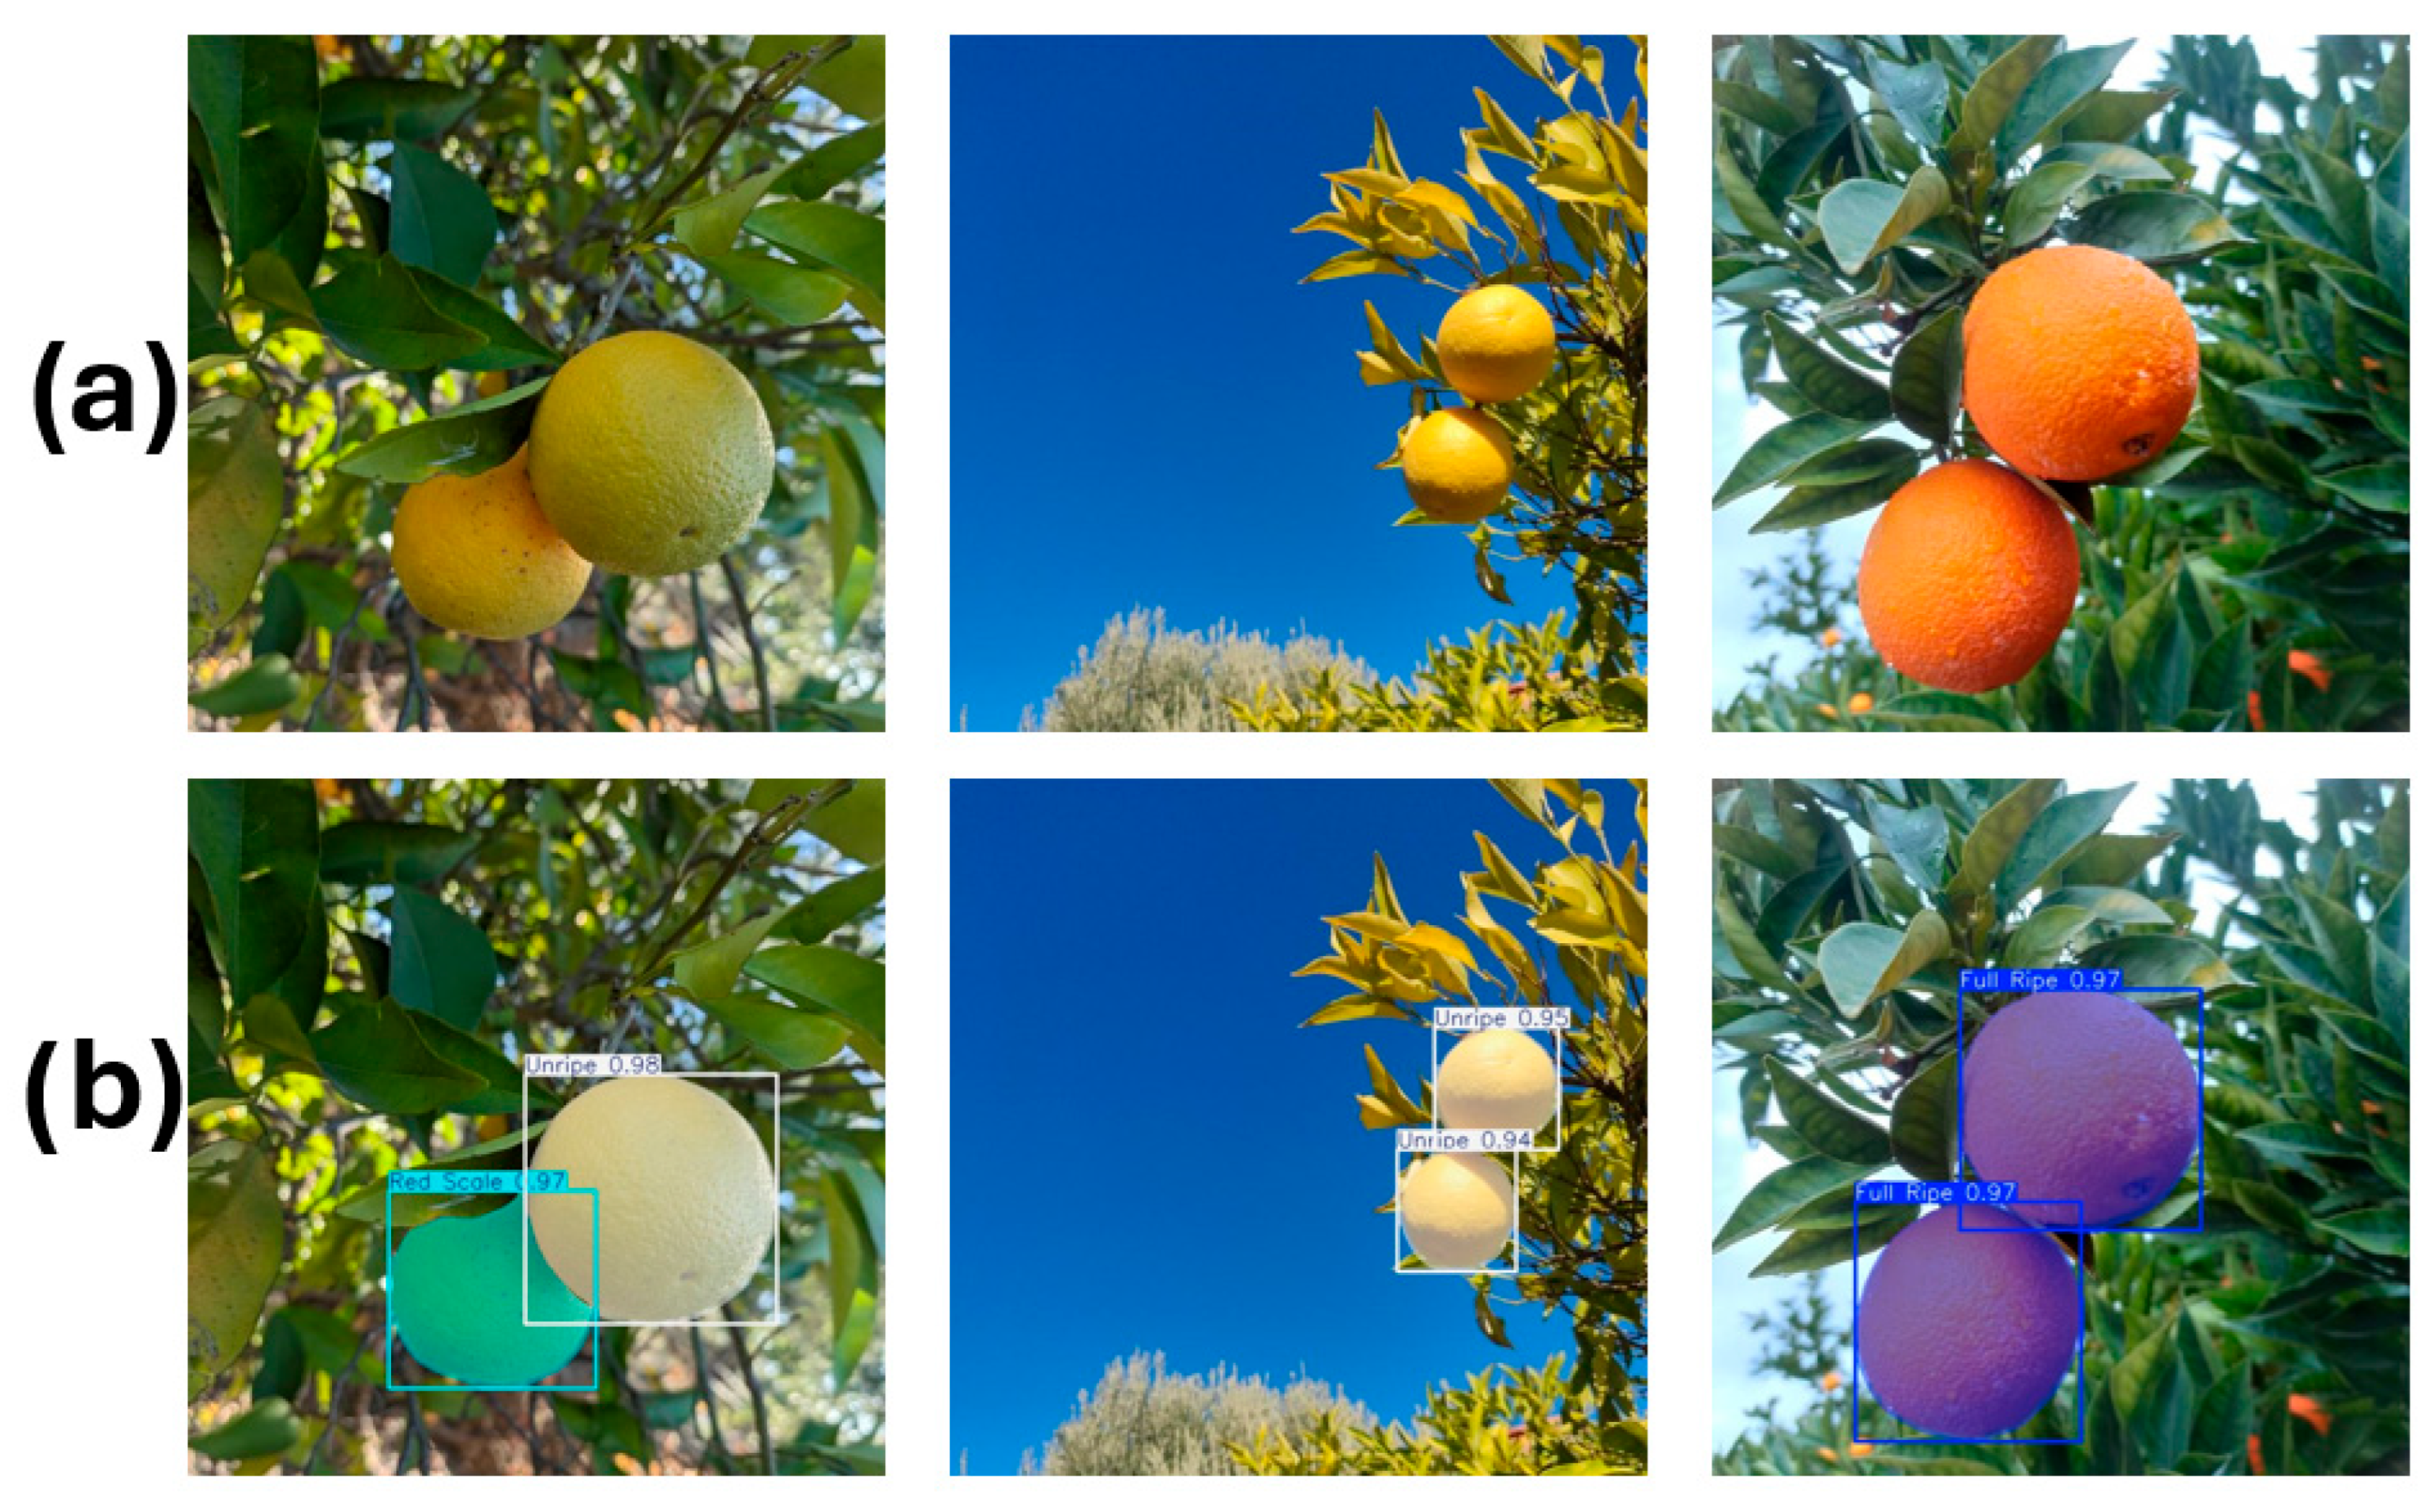
Figure 8 illustrates the detection results of the proposed model on fruits with varying ripeness levels. The top row (a) presents the original images, while the bottom row (b) displays the model’s predictions and classifications. As can be observed, the model successfully distinguishes between the Unripe, Red Scale, and Full Ripe classes, accurately labeling each instance. Despite variations in lighting and background conditions, the high accuracy of these predictions demonstrates the model’s strong generalization capability across diverse visual scenarios.

3.2. Ablation Studies

To isolate the contribution of each component, we started from YOLO12n-Seg and added GhostConv and/or GAM under the same training protocol (Table 4). The models were trained and evaluated under consistent experimental conditions, with precision, recall, mAP@0.5, and mAP@0.5:0.95 used as performance metrics.
The baseline achieved P/R = 0.958/0.941, mAP@0.5 = 0.977, mAP@0.5:0.95 = 0.949. Introducing GhostConv alone slightly sharpened precision (0.962, +0.4 pp) while marginally reducing recall (0.933, −0.8 pp), yielding mAP@0.5 = 0.978 and mAP@0.5:0.95 = 0.959; this variant also lowered the parameter count due to the substitution of standard convolutions with GhostConv, reducing the overall model size to approximately 2.7 M parameters. Adding GAM alone preserved precision (0.959) but improved recall (0.945, +0.4 pp), with mAP@0.5 = 0.979 and mAP@0.5:0.95 = 0.955, indicating better robustness under occlusion and low-contrast cases. This is consistent with the fact that GAM generally enhances spatial and channel-wise feature modeling, which tends to support recall by improving sensitivity to subtle targets. GAM was found useful in overlapping fruits and low-contrast regions, where it helped recover missed detections and slightly boosted recall. Combining GhostConv + GAM produced the best overall performance (P/R = 0.961/0.943, mAP@0.5 = 0.980, mAP@0.5:0.95 = 0.960), demonstrating complementary effects: GhostConv provides efficiency and sharper features, while GAM strengthens feature discrimination under challenging conditions without increasing model size.

3.3. Comparison with Different Instance Segmentation Algorithm

Since the primary objective of this study was to develop a lightweight, single-stage model with low computational cost for deployment in real-time systems, nano versions of YOLO and its successors were selected for comparison. Accordingly, two-stage models such as Mask R-CNN [71] and U-Net [72] were not considered, as their higher computational demands make them less suitable for real-time applications. Table 5 presents a comparative evaluation of different YOLO-based instance segmentation models in terms of computational complexity (GFLOPs), number of parameters, training time, and segmentation performance metrics (mAP@0.5, mAP@0.5:0.95, precision, and recall). Although all models exhibit comparable GFLOPs values, the improved model, which has the lowest number of parameters (2.749 M) and the shortest training time (2 h and 42 min), clearly outperforms the others in terms of accuracy. This model achieved the highest accuracy scores, with mAP@0.5 reaching 0.980 and mAP@0.5:0.95 reaching 0.960, along with precision and recall values of 0.961 and 0.943, respectively, indicating superior performance in both precision and coverage. The YOLOv8n-Seg model ranked second with mAP@0.5 of 0.978 and mAP@0.5:0.95 of 0.955; however, these results were obtained at the cost of a higher parameter count (3.264 M) and a longer training time (3 h and 21 min). Despite requiring more training time than the improved model, YOLO12n-Seg and YOLO11n-Seg yielded similar or even lower performance levels. Among all models, YOLOv5n-Seg achieved the lowest mAP@0.5:0.95 value (0.951), reflecting relatively limited performance compared to the others. The proposed model outperformed YOLOv5 by 3.2% in mAP@0.5 and reduced parameter size by 18%. In addition to these results, the YOLO12n-Seg model achieved an inference time of 1.7 ms during training and 17 ms during testing, with preprocessing times of 0.2 ms during training and 1.7 ms during testing. In comparison, the improved model achieved 1.2 ms during training and 16.6 ms during testing, with preprocessing times of 0.1 ms during training and 1.7 ms during testing. These findings confirm that the proposed architecture balances accuracy, efficiency, and adaptability for practical smart farming applications.
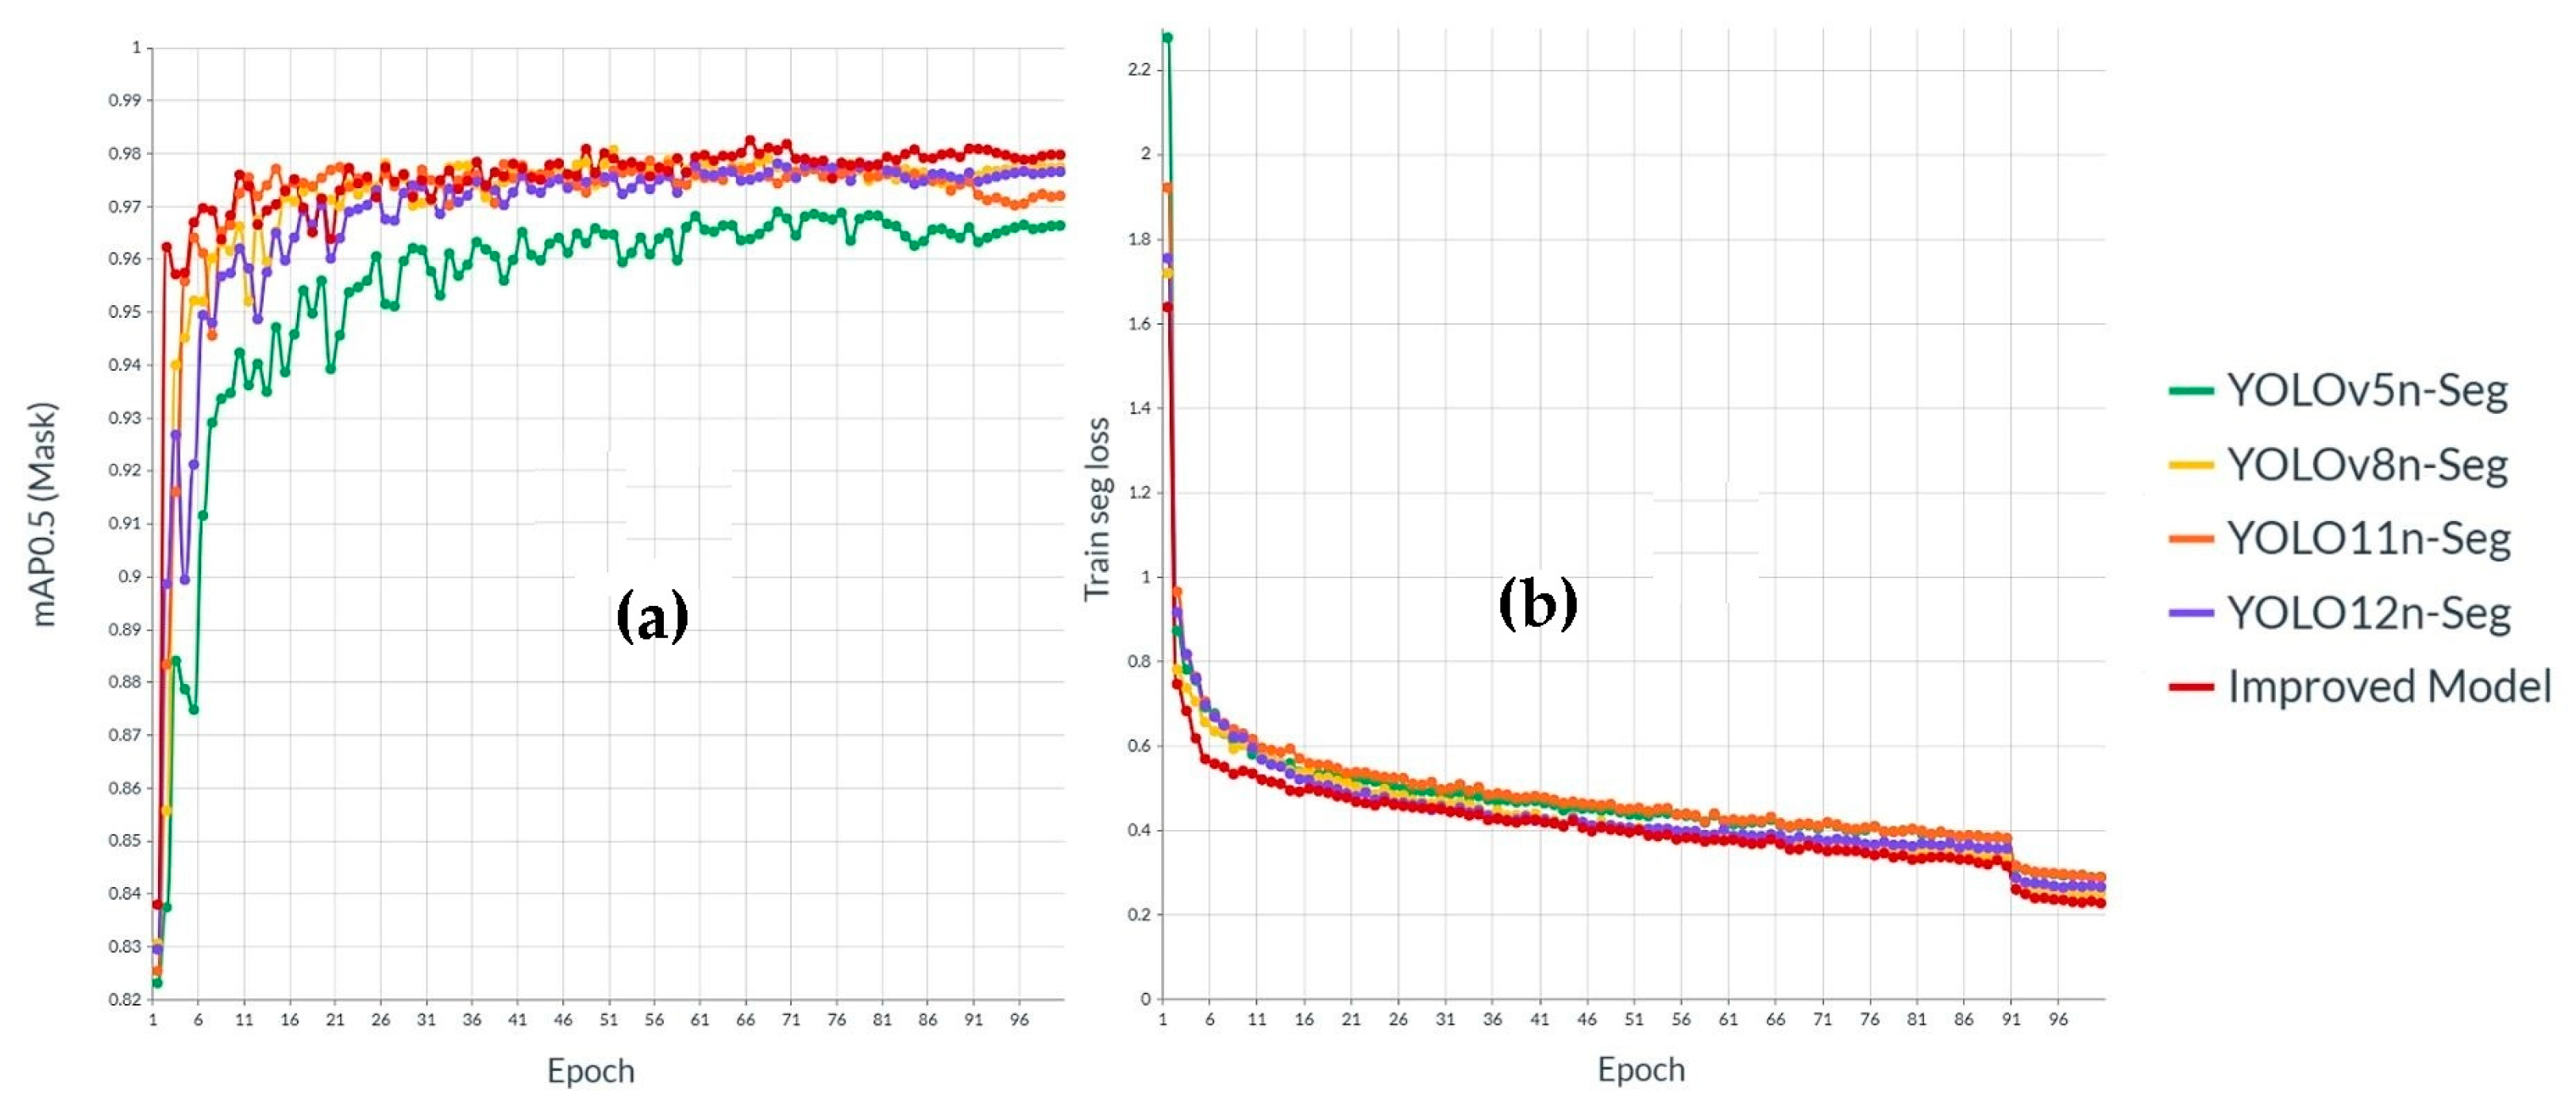
Figure 9 illustrates the epoch-wise variations of two key metrics—mask mAP@0.5 (Figure 9a) and training segmentation loss (Figure 9b)—during the training process of different YOLO-based segmentation models. As observed in Figure 9a, all models exhibit a rapid increase in accuracy within the first few epochs, followed by a plateau phase where the accuracy stabilizes. The Improved Model (in red) consistently maintained the highest accuracy, reaching approximately 0.98 mAP@0.5. While YOLO12n-Seg, YOLO11n-Seg, and YOLOv8n-Seg also demonstrated strong performance, they exhibited noticeable fluctuations throughout the training process. In contrast, YOLOv5n-Seg showed the lowest performance, suggesting a comparatively limited learning capacity. In Figure 9b, the training segmentation loss curves for all models declined sharply during the early epochs. Toward the end of the training, the proposed model consistently achieved lower loss values, indicating not only faster learning but also more accurate segmentation with reduced error. By the final epoch, the improved model reached a loss value of approximately 0.22, whereas other models converged within the 0.25–0.30 range. These results confirm that the proposed model excels not only in segmentation accuracy but also in minimizing error, making it a more efficient and reliable solution.
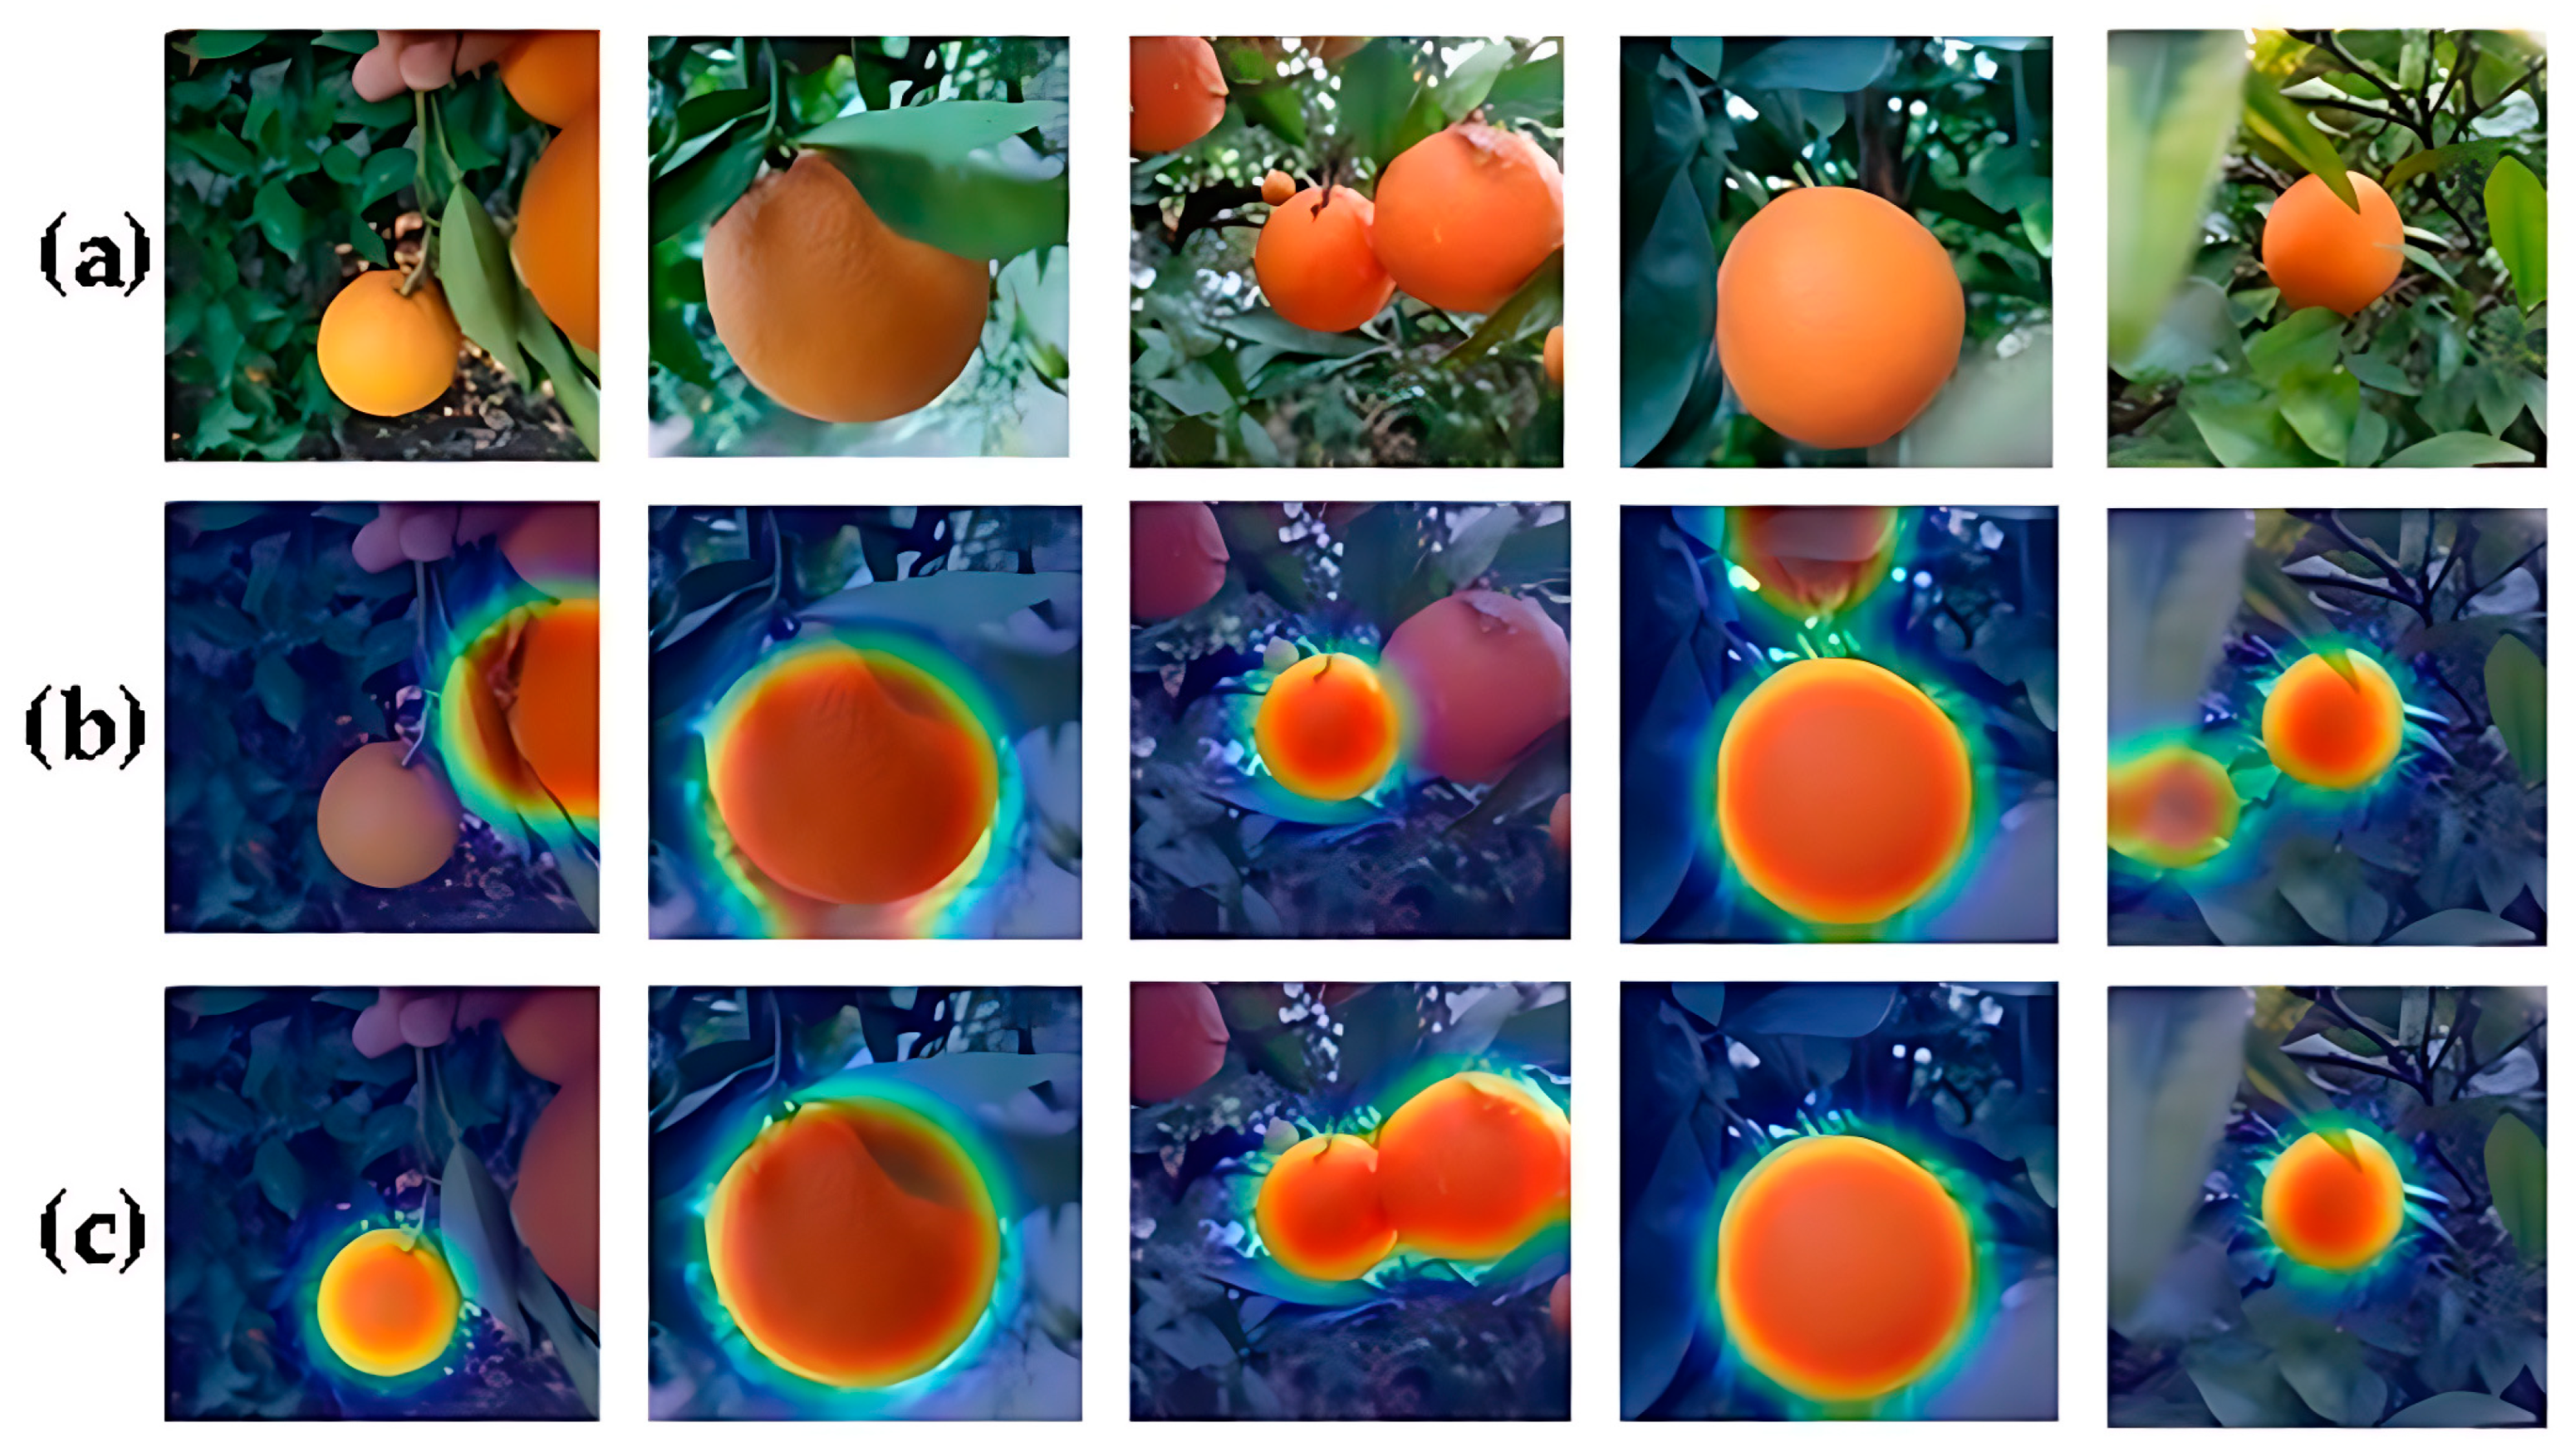
Figure 10 presents visual attention heat maps generated using the Grad-CAM method. The first row (a) displays the original images, the second row (b) shows the attention regions identified by the YOLO12n-Seg model, and the third row (c) illustrates those produced by the Improved Model. Grad-CAM analysis is particularly valuable for understanding which regions of an image the models focus on when making decisions. As seen in the figure, the YOLO12n-Seg model exhibits a relatively broad focus around the object (orange), but also occasionally disperses attention to surrounding leaves and background areas. This suggests that the model may rely on broader, and at times irrelevant, contextual cues when performing classification. In contrast, the attention maps of the improved model are more precise and sharply concentrated on the target object (orange), with minimal focus on non-essential regions such as leaves, branches, or background. These findings indicate that the improved model possesses a more focused, discrete, and consistent attention mechanism during the decision-making process, enhancing both interpretability and reliability in segmentation tasks. In line with prior studies, Grad-CAM has predominantly been employed as a qualitative interpretability tool in YOLO-based models [64,73,74]. Similarly, this study also adopts a qualitative perspective, presenting representative heat maps for visual analysis.
The experimental results confirm that the proposed YOLO12n-Seg model, enhanced with GhostConv and GAM, achieves a favorable trade-off between accuracy and computational efficiency. Compared with existing lightweight segmentation frameworks, the model demonstrates superior detection capability while maintaining low parameter complexity, making it highly suitable for deployment on resource-constrained agricultural platforms. In addition to the quantitative results, Grad-CAM visualizations were employed to illustrate the regions of interest that the proposed model attends to during segmentation. It should be noted that these visualizations are qualitative in nature, serving primarily as supportive evidence rather than quantitative evaluation. Furthermore, although the proposed architecture achieved promising accuracy and efficiency, systematic hyperparameter optimization was not the primary focus of this study. Future research could explore advanced optimization strategies to further enhance the robustness and generalizability of the model.

4. Discussion

The proposed model, developed based on the YOLO12n-Seg architecture and enhanced through the integration of GhostConv layers and GAM modules, demonstrates significant improvements in both segmentation accuracy and architectural efficiency. With only 2.749 million parameters and a relatively short training time of 2 h and 42 min, the model achieved remarkable performance on a test dataset comprising 2162 images: mAP@0.5: 0.980, mAP@0.5:0.95: 0.960, Precision: 0.961, and Recall: 0.943. These results indicate that the model can deliver high detection and segmentation performance even under challenging conditions, such as partially overlapping fruits and low-contrast imagery.
Notably, class-wise evaluations revealed that the highest detection accuracy was achieved for the “Red Scale” class—representing pest-induced damage—with mAP@0.5:0.992 and mAP@0.5:0.95:0.984. This underscores the model’s ability to learn and differentiate subtle texture changes caused by pest infestation effectively.
When benchmarked against recent studies, the superiority of the proposed model becomes evident. For instance, the YOLOv5-NMM model trained on 3000 images by Zhou et al. [75] reported mAP@0.5:0.942, Precision: 0.932, and Recall: 0.896. Similarly, in a study [76], YOLOv8-Seg models trained on 800 images to detect Tuta absoluta damage on tomato leaves achieved a peak mAP@0.5 of 0.935. However, those studies focused on single-task frameworks (i.e., pest detection only), whereas the current model successfully performs simultaneous detection of both pest-induced damage and fruit ripeness stages with high precision.
The findings from the experimental evaluation confirm that the proposed model delivers high performance in both ripeness classification and pest detection tasks while maintaining low computational complexity. The integration of GhostConv and the Global Attention Mechanism proved effective in improving spatial feature refinement and reducing background noise. A noteworthy observation is the model’s adaptability across different illumination conditions and complex orchard environments. Unlike traditional object detection models, which often struggle with background interference, the proposed architecture consistently distinguished between citrus fruits and Red Scale-affected areas, even in visually cluttered settings. Furthermore, the deployment results on embedded systems validate the practicality of the model for real-time applications. Devices such as Jetson Nano or Raspberry Pi 4—commonly used in low-cost agricultural robotics and mobile devices—can execute the model with acceptable frame rates, demonstrating a significant step toward accessible AI solutions in precision agriculture. The model’s performance against standard baselines further highlights its superiority. While YOLOv5 and Mask R-CNN are popular for object detection and segmentation, their higher computational demands limit their usability in edge computing environments. In contrast, the proposed model preserves detection accuracy while significantly reducing model size and inference time. However, the study has some limitations. The dataset was collected under controlled field conditions, and generalization across different regions or citrus varieties was not tested. Additionally, the model’s robustness under occlusion scenarios—where parts of the fruit or pest region are obscured—requires further evaluation.
This study introduced YOLO12n-Seg, a lightweight segmentation model incorporating GhostConv and GAM modules to improve feature extraction and computational efficiency. The proposed approach demonstrated strong performance in terms of both accuracy and speed, highlighting its suitability for real-time applications in precision agriculture. While the results are highly encouraging, future work may focus on systematic hyperparameter optimization to achieve further performance improvements and extend the applicability of the model to broader agricultural scenarios. In future work, the dataset can be expanded to include multiple citrus species, seasonal variations, and cross-orchard conditions. Moreover, the model architecture could benefit from advanced attention mechanisms (e.g., transformer-based modules) and lightweight post-processing for even greater inference efficiency.

5. Conclusions

This study presents the development of a lightweight, optimized, and high-accuracy deep learning model capable of simultaneously detecting both ripeness stages and Red Scale damage in citrus fruits. Built upon the YOLO12n-Seg architecture, the model retains the original backbone and segmentation head, while the neck structure has been enhanced with GhostConv layers and GAM modules. These additions enable the model to better capture multi-scale spatial features, thereby improving detection performance in complex visual environments.
Trained on a dataset of 3089 images, the model achieved excellent performance metrics during testing: mAP@0.5:0.980, mAP@0.5:0.95:0.960, Precision: 0.961, and Recall: 0.943. Considering its low parameter count (2.7 M) and short training time (2 h 42 min), the model stands out for its ability to balance segmentation accuracy with computational efficiency.
One of the primary challenges addressed in this study was the visual similarity between ripeness stages and pest damage. Additionally, occlusions from leaves, light reflections, and fruit overlaps often complicated the detection process. However, the integration of attention mechanisms significantly mitigated these issues, allowing the model to maintain robust and distinctive performance even in cluttered scenes. The experimental results validate the proposed model’s robustness and practicality for real-time agricultural applications, particularly in embedded systems used for orchard monitoring. The model’s compact size, rapid inference speed, and high detection accuracy make it an excellent candidate for integration into mobile agricultural platforms such as autonomous robots and UAVs.
Future research will focus on expanding the dataset to include additional citrus species and diverse field conditions, enhancing the model’s generalizability. Moreover, further architectural optimizations and the integration of advanced attention modules will be explored to push the boundaries of performance and real-time deployment feasibility in precision agriculture.

Author Contributions

Conceptualization, İ.Ü. and O.E.; methodology, İ.Ü. and O.E.; formal analysis, İ.Ü.; resources, İ.Ü.; data curation, İ.Ü.; writing—original draft preparation, İ.Ü.; writing—review and editing, O.E.; project administration, İ.Ü. All authors have read and agreed to the published version of the manuscript.

Funding

This research received no external funding.

Data Availability Statement

The raw data supporting the conclusions of this article will be made available by the authors on request.

Conflicts of Interest

The authors declare no conflicts of interest.

References

  1. USDA. Citrus: World Markets and Trade; United States Department of Agriculture: Washington, DC, USA, 2024.
  2. Dai, Q.; Liang, S.; Li, Z.; Lyu, S.; Xue, X.; Song, S.; Huang, Y.; Zhang, S.; Fu, J. YOLOv11-RDTNet: A Lightweight Model for Citrus Pest and Disease Identification Based on an Improved YOLOv11n. Agronomy 2025, 15, 1252. [Google Scholar] [CrossRef]
  3. Peng, K.; Ma, W.; Lu, J.; Tian, Z.; Yang, Z. Application of Machine Vision Technology in Citrus Production. Appl. Sci. 2023, 13, 9334. [Google Scholar] [CrossRef]
  4. Life Stages of California Red Scale and Its Parasitoids. Available online: https://anrcatalog.ucanr.edu/pdf/21529E.pdf (accessed on 20 August 2025).
  5. Red Scale. Available online: https://www.crop.bayer.com.au/pests/pests/red-scale (accessed on 20 August 2025).
  6. Sun, Y.; Wang, X.; Pan, L.; Hu, Y. Influence of maturity on bruise detection of peach by structured multispectral imaging. Curr. Res. Food Sci. 2023, 6, 100476. [Google Scholar] [CrossRef]
  7. Chohan, M.; Khan, A.; Chohan, R.; Katpar, S.H.; Mahar, M.S. Plant Disease Detection Using Deep Learning. Int. J. Recent Technol. Eng. 2020, 9, 909–914. [Google Scholar] [CrossRef]
  8. Guan, H.; Fu, C.; Zhang, G.; Li, K.; Wang, P.; Zhu, Z. A Lightweight Model for Efficient Identification of Plant Diseases and Pests Based on Deep Learning. Front. Plant Sci. 2023, 14, 1227011. [Google Scholar] [CrossRef]
  9. Guan, T.; Chang, S.; Deng, Y.; Xue, F.; Wang, C.; Jia, X. Oriented SAR Ship Detection Based on Edge Deformable Convolution and Point Set Representation. Remote Sens. 2025, 17, 1612. [Google Scholar] [CrossRef]
  10. Murthy, C.B.; Hashmi, M.F.; Bokde, N.D.; Geem, Z.W. Investigations of Object Detection in Images/Videos Using Various Deep Learning Techniques and Embedded Platforms—A Comprehensive Review. Appl. Sci. 2020, 10, 3280. [Google Scholar] [CrossRef]
  11. Matsuzaka, Y.; Yashiro, R. AI-Based Computer Vision Techniques and Expert Systems. AI 2023, 4, 289–302. [Google Scholar] [CrossRef]
  12. Trigka, M.; Dritsas, E. A Comprehensive Survey of Machine Learning Techniques and Models for Object Detection. Sensors 2025, 25, 214. [Google Scholar] [CrossRef] [PubMed]
  13. Wu, X.; Liang, J.; Yang, Y.; Li, Z.; Jia, X.; Pu, H.; Zhu, P. SAW-YOLO: A Multi-Scale YOLO for Small Target Citrus Pests Detection. Agronomy 2024, 14, 1571. [Google Scholar] [CrossRef]
  14. Zeng, T.; Li, S.; Song, Q.; Zhong, F.; Wei, X. Lightweight Tomato Real-Time Detection Method Based on Improved YOLO and Mobile Deployment. Comput. Electron. Agric. 2023, 205, 107625. [Google Scholar] [CrossRef]
  15. Zhang, X.; Xun, Y.; Chen, Y. Automated Identification of Citrus Diseases in Orchards Using Deep Learning. Biosyst. Eng. 2022, 223, 249–258. [Google Scholar] [CrossRef]
  16. Hu, W.; Xiong, J.; Liang, J.; Xie, Z.; Liu, Z.; Huang, Q.; Yang, Z. A Method of Citrus Epidermis Defects Detection Based on an Improved YOLOv5. Biosyst. Eng. 2023, 227, 19–35. [Google Scholar] [CrossRef]
  17. Xu, L.; Wang, Y.; Shi, X.; Tang, Z.; Chen, X.; Wang, Y.; Zou, Z.; Huang, P.; Liu, B.; Yang, N. Real-Time and Accurate Detection of Citrus in Complex Scenes Based on HPL-YOLOv4. Comput. Electron. Agric. 2023, 205, 107590. [Google Scholar] [CrossRef]
  18. Li, K.; Wang, J.; Jalil, H.; Wang, H. A Fast and Lightweight Detection Algorithm for Passion Fruit Pests Based on Improved YOLOv5. Comput. Electron. Agric. 2023, 204, 107534. [Google Scholar] [CrossRef]
  19. Song, Z.; Wang, D.; Xiao, L.; Zhu, Y.; Cao, G.; Wang, Y. DaylilyNet: A Multi-Task Learning Method for Daylily Leaf Disease Detection. Sensors 2023, 23, 7879. [Google Scholar] [CrossRef] [PubMed]
  20. Li, M.; Cheng, S.; Cui, J.; Li, C.; Li, Z.; Zhou, C.; Lv, C. High-Performance Plant Pest and Disease Detection Based on Model Ensemble with Inception Module and Cluster Algorithm. Plants 2023, 12, 200. [Google Scholar] [CrossRef] [PubMed]
  21. Soeb, M.J.A.; Jubayer, M.F.; Tarin, T.A.; Al Mamun, M.R.; Ruhad, F.M.; Parven, A.; Mubarak, N.M.; Karri, S.L.; Meftaul, I.M. Tea Leaf Disease Detection and Identification Based on YOLOv7 (YOLO-T). Sci. Rep. 2023, 13, 6078. [Google Scholar] [CrossRef]
  22. Sapkota, R.; Meng, Z.; Churuvija, M.; Du, X.; Ma, Z.; Karkee, M. Comprehensive Performance Evaluation of YOLOv12, YOLO11, YOLOv10, YOLOv9 and YOLOv8 on Detecting and Counting Fruitlet in Complex Orchard Environments. arXiv 2024. [Google Scholar] [CrossRef]
  23. Sharma, A.; Kumar, V.; Longchamps, L. Comparative Performance of YOLOv8, YOLOv9, YOLOv10, YOLOv11 and Faster R-CNN Models for Detection of Multiple Weed Species. Smart Agric. Technol. 2024, 9, 100648. [Google Scholar] [CrossRef]
  24. Kumar, V.S.; Jaganathan, M.; Viswanathan, A.; Umamaheswari, M.; Vignesh, J. Rice Leaf Disease Detection Based on Bidirectional Feature Attention Pyramid Network with YOLO v5 Model. Environ. Res. Commun. 2023, 5, 065014. [Google Scholar] [CrossRef]
  25. Islam, A.; Sama Raisa, S.R.; Khan, N.H.; Rifat, A.I. A Deep Learning Approach for Classification and Segmentation of Leafy Vegetables and Diseases. In Proceedings of the 2023 International Conference on Next-Generation Computing, IoT and Machine Learning (NCIM), Gazipur, Bangladesh, 16–17 June 2023; pp. 1–6. [Google Scholar] [CrossRef]
  26. Yue, X.; Qi, K.; Na, X.; Zhang, Y.; Liu, Y.; Liu, C. Improved YOLOv8-Seg Network for Instance Segmentation of Healthy and Diseased Tomato Plants in the Growth Stage. Agriculture 2023, 13, 1643. [Google Scholar] [CrossRef]
  27. Khan, F.; Zafar, N.; Tahir, M.N.; Aqib, M.; Waheed, H.; Haroon, Z. A Mobile-Based System for Maize Plant Leaf Disease Detection and Classification Using Deep Learning. Front. Plant Sci. 2023, 14, 1079366. [Google Scholar] [CrossRef]
  28. Xue, Z.; Xu, R.; Bai, D.; Lin, H. YOLO-Tea: A Tea Disease Detection Model Improved by YOLOv5. Forests 2023, 14, 415. [Google Scholar] [CrossRef]
  29. Dai, Q.; Xiao, Y.; Lv, S.; Song, S.; Xue, X.; Liang, S.; Huang, Y.; Li, Z. YOLOv8-GABNet: An Enhanced Lightweight Network for the High-Precision Recognition of Citrus Diseases and Nutrient Deficiencies. Agriculture 2024, 14, 1964. [Google Scholar] [CrossRef]
  30. Wu, E.; Ma, R.; Dong, D.; Zhao, X. D-YOLO: A Lightweight Model for Strawberry Health Detection. Agriculture 2025, 15, 570. [Google Scholar] [CrossRef]
  31. Wang, R.; Chen, Y.; Zhang, G.; Yang, C.; Teng, X.; Zhao, C. YOLO11-PGM: High-Precision Lightweight Pomegranate Growth Monitoring Model for Smart Agriculture. Agronomy 2025, 15, 1123. [Google Scholar] [CrossRef]
  32. Angon, P.B.; Mondal, S.; Jahan, I.; Datto, M.; Antu, U.B.; Ayshi, F.J.; Islam, M.S. Integrated Pest Management (IPM) in Agriculture and Its Role in Maintaining Ecological Balance and Biodiversity. Adv. Agric. 2023, 2023, 5546373. [Google Scholar] [CrossRef]
  33. Wadhwa, D.; Malik, K. A Generalizable and Interpretable Model for Early Warning of Pest-Induced Crop Diseases Using Environmental Data. Comput. Electron. Agric. 2024, 227, 109472. [Google Scholar] [CrossRef]
  34. Sankhe, S.R.; Ambhaikar, A. Plant Disease Detection and Classification Techniques: A Review. Multiagent Grid Syst. 2025, 20, 265–282. [Google Scholar] [CrossRef]
  35. Albahar, M. A Survey on Deep Learning and Its Impact on Agriculture: Challenges and Opportunities. Agriculture 2023, 13, 540. [Google Scholar] [CrossRef]
  36. Lei, L.; Yang, Q.; Yang, L.; Shen, T.; Wang, R.; Fu, C. Deep Learning Implementation of Image Segmentation in Agricultural Applications: A Comprehensive Review. Artif. Intell. Rev. 2024, 57, 149. [Google Scholar] [CrossRef]
  37. Normark, B.B.; Morse, G.E.; Krewinski, A.; Okusu, A. Armored Scale Insects (Hemiptera: Diaspididae) of San Lorenzo National Park, Panama, with Descriptions of Two New Species. Ann. Entomol. Soc. Am. 2014, 107, 37–49. [Google Scholar] [CrossRef]
  38. García Morales, M.; Denno, B.D.; Miller, D.R.; Miller, G.L.; Ben-Dov, Y.; Hardy, N.B. ScaleNet: A Literature-Based Model of Scale Insect Biology and Systematics. Database 2016, 2016, bav118. [Google Scholar]
  39. Golan, K.; Kot, I.; Kmieć, K.; Górska-Drabik, E. Approaches to Integrated Pest Management in Orchards: Comstockaspis Perniciosa (Comstock) Case Study. Agriculture 2023, 13, 131. [Google Scholar] [CrossRef]
  40. Roelofs, W.L.; Gieselmann, M.J.; Cardé, A.M.; Tashiro, H.; Moreno, D.S.; Henrick, C.A.; Anderson, R.J. Sex Pheromone of the California Red Scale, Aonidiella Aurantii. Nature 1977, 267, 698–699. [Google Scholar] [CrossRef] [PubMed]
  41. Aytaş, M.; Yumruktepe, R.; Mart, C. Using Pheromone Traps to Control California Red Scale Aonidiella Aurantii (Maskell)(Hom.: Diaspididae) in the Eastern Mediterranean Region. Turk. J. Agric. For. 2001, 25, 97–110. [Google Scholar]
  42. Fonte, A.; Garcerá, C.; Tena, A.; Chueca, P. Volume Rate Adjustment for Pesticide Applications Against Aonidiella Aurantii in Citrus: Validation of CitrusVol in the Growers’ Practice. Agronomy 2021, 11, 1350. [Google Scholar] [CrossRef]
  43. Jacas, J.A.; Karamaouna, F.; Vercher, R.; Zappalà, L. Citrus Pest Management in the Northern Mediterranean Basin (Spain, Italy and Greece). In Integrated Management of Arthropod Pests and Insect Borne Diseases; Springer: Dordrecht, The Netherlands, 2010; pp. 3–27. [Google Scholar]
  44. Pekas, A.; Aguilar, A.; Tena, A.; Garcia-Marí, F. Influence of Host Size on Parasitism by Aphytis Chrysomphali and A. Melinus (Hymenoptera: Aphelinidae) in Mediterranean Populations of California Red Scale Aonidiella Aurantii (Hemiptera: Diaspididae). Biol. Control 2010, 55, 132–140. [Google Scholar] [CrossRef]
  45. Rodrigo, E.; Troncho, P.; García-Marí, F. Parasitoids (Hym.: Aphelinidae) of Three Scale Insects (Hom.: Diaspididae) in a Citrus Grove in Valencia, Spain. Phytoparasitica 1996, 24, 273–280. [Google Scholar] [CrossRef]
  46. Pina, T. Control Biológico del Piojo Rojo de California, Aonidiella Aurantia (Maskell) (Hemiptera: Diaspididae) y Estrategias Reproductivas de su Principal Enemigo Natural Aphytis Chrysomphali (Mercet) (Hymenoptera: Aphelinidae). Ph.D. Thesis, Universitat de València, Valencia, Spain, 2007. [Google Scholar]
  47. Vanaclocha, P.; Urbaneja, A.; Verdú, M.J. Mortalidad Natural del Piojo Rojo de California, Aonidiella Aurantii, en Cítricos de la Comunidad Valenciana y sus Parasitoides Asociados. Bol. Sanid. Veg. Plagas 2009, 35, 59–71. [Google Scholar]
  48. Vacas, S.; Alfaro, C.; Primo, J.; Navarro-Llopis, V. Deployment of Mating Disruption Dispensers Before and After First Seasonal Male Flights for the Control of Aonidiella Aurantii in Citrus. J. Pest Sci. 2015, 88, 321–329. [Google Scholar] [CrossRef]
  49. Ren, S.; He, K.; Girshick, R.; Sun, J. Faster R-CNN: Towards Real-Time Object Detection with Region Proposal Networks. arXiv 2015. [Google Scholar] [CrossRef]
  50. Lin, T.-Y.; Goyal, P.; Girshick, R.; He, K.; Dollár, P. Focal Loss for Dense Object Detection. arXiv 2017. [Google Scholar] [CrossRef]
  51. Wu, Y.; Kirillov, A.; Massa, F.; Lo, W.-Y.; Girshick, R. Detectron2 [Computer Software]. Available online: https://github.com/facebookresearch/detectron2 (accessed on 2 September 2025).
  52. Sapkota, R.; Flores-Calero, M.; Qureshi, R.; Badgujar, C.; Nepal, U.; Poulose, A.; Zeno, P.; Vaddevolu, U.B.P.; Khan, S.; Shoman, M.; et al. YOLO Advances to Its Genesis: A Decadal and Comprehensive Review of the You Only Look Once (YOLO) Series. Artif. Intell. Rev. 2025, 58, 274. [Google Scholar] [CrossRef]
  53. Tian, Y.; Ye, Q.; Doermann, D. YOLOv12: Attention-Centric Real-Time Object Detectors. arXiv 2025. [Google Scholar] [CrossRef]
  54. Woo, S.; Park, J.; Lee, J.; Kweon, I.S. CBAM: Convolutional Block Attention Module. arXiv 2018. [Google Scholar] [CrossRef]
  55. Wang, L.; Xiao, J.; Peng, X.; Tan, Y.; Zhou, Z.; Chen, L.; Tang, Q.; Cheng, W.; Liang, X. Mango Inflorescence Detection Based on Improved YOLOv8 and UAVs-RGB Images. Forests 2025, 16, 896. [Google Scholar] [CrossRef]
  56. Liu, Y.; Shao, Z.; Hoffmann, N. Global Attention Mechanism: Retain Information to Enhance Channel-Spatial Interactions. arXiv 2021. [Google Scholar] [CrossRef]
  57. Liu, S.; Wang, Y.; Yu, Q.; Liu, H.; Peng, Z. CEAM-YOLOv7: Improved YOLOv7 Based on Channel Expansion and Attention Mechanism for Driver Distraction Behavior Detection. IEEE Access 2022, 10, 129116–129124. [Google Scholar] [CrossRef]
  58. Wang, Z.; Yuan, G.; Zhou, H.; Ma, Y.; Ma, Y. Foreign-Object Detection in High-Voltage Transmission Line Based on Improved YOLOv8m. Appl. Sci. 2023, 13, 12775. [Google Scholar] [CrossRef]
  59. Han, K.; Wang, Y.; Tian, Q.; Guo, J.; Xu, C.; Xu, C. GhostNet: More Features from Cheap Operations. In Proceedings of the IEEE/CVF Conference Computer Vision and Pattern Recognition (CVPR), Seattle, WA, USA, 13–19 June 2020; pp. 1580–1589. [Google Scholar]
  60. Wang, T.; Zhang, S. DSC-Ghost-Conv: A Compact Convolution Module for Building Efficient Neural Network Architectures. Multimed. Tools Appl. 2023, 83, 36767–36795. [Google Scholar] [CrossRef]
  61. Qiu, Z.; Bai, H.; Chen, T. Special Vehicle Detection from UAV Perspective via YOLO-GNS Based Deep Learning Network. Drones 2023, 7, 117. [Google Scholar] [CrossRef]
  62. Yang, X.; Ji, W.; Zhang, S.; Song, Y.; He, L.; Xue, H. Lightweight Real-Time Lane Detection Algorithm Based on Ghost Convolution and Self Batch Normalization. J. Real-Time Image Process. 2023, 20, 69. [Google Scholar] [CrossRef]
  63. Cao, J.; Bao, W.; Shang, H.; Yuan, M.; Cheng, Q. GCL-YOLO: A GhostConv-Based Lightweight YOLO Network for UAV Small Object Detection. Remote Sens. 2023, 15, 4932. [Google Scholar] [CrossRef]
  64. Huang, Z.; Li, X.; Fan, S.; Liu, Y.; Zou, H.; He, X.; Xu, S.; Zhao, J.; Li, W. ORD-YOLO: A Ripeness Recognition Method for Citrus Fruits in Complex Environments. Agriculture 2025, 15, 1711. [Google Scholar] [CrossRef]
  65. Lin, Y.; Huang, Z.; Liang, Y.; Liu, Y.; Jiang, W. AG-YOLO: A Rapid Citrus Fruit Detection Algorithm with Global Context Fusion. Agriculture 2024, 14, 114. [Google Scholar] [CrossRef]
  66. Liao, Y.; Li, L.; Xiao, H.; Xu, F.; Shan, B.; Yin, H. YOLO-MECD: Citrus Detection Algorithm Based on YOLOv11. Agronomy 2025, 15, 687. [Google Scholar] [CrossRef]
  67. Cai, Z.; Zhang, Y.; Li, J.; Zhang, J.; Li, X. Synchronous detection of internal and external defects of citrus by structured-illumination reflectance imaging coupling with improved YOLO v7. Postharvest Biol. Technol. 2025, 227, 113576. [Google Scholar] [CrossRef]
  68. Wu, Y.; Han, Q.; Jin, Q.; Li, J.; Zhang, Y. LCA-YOLOv8-Seg: An Improved Lightweight YOLOv8-Seg for Real-Time Pixel-Level Crack Detection of Dams and Bridges. Appl. Sci. 2023, 13, 10583. [Google Scholar] [CrossRef]
  69. Zhang, L.; Ding, G.; Li, C.; Li, D. DCF-YOLOv8: An Improved Algorithm for Aggregating Low-Level Features to Detect Agricultural Pests and Diseases. Agronomy 2023, 13, 2012. [Google Scholar] [CrossRef]
  70. Mohana Sri, S.; Swetha, S.; Aouthithiye Barathwaj, S.R.Y.; Sai Ganesh, C.S. Intelligent Debris Mass Estimation Model for Autonomous Underwater Vehicle. arXiv 2023. [Google Scholar] [CrossRef]
  71. He, K.; Gkioxari, G.; Dollár, P.; Girshick, R. Mask R-CNN. arXiv 2017. [Google Scholar] [CrossRef]
  72. Ronneberger, O.; Fischer, P.; Brox, T. U-NET: Convolutional Networks for Biomedical Image Segmentation. arXiv 2015. [Google Scholar] [CrossRef]
  73. Zhu, X.; Chen, F.; Zheng, Y.; Chen, C.; Peng, X. Detection of Camellia oleifera fruit maturity in orchards based on modified lightweight YOLO. Comput. Electron. Agric. 2024, 226, 109471. [Google Scholar] [CrossRef]
  74. Wang, Y.; Ouyang, C.; Peng, H.; Deng, J.; Yang, L.; Chen, H.; Luo, Y.; Jiang, P. YOLO-ALW: An Enhanced High-Precision Model for Chili Maturity Detection. Sensors 2025, 25, 1405. [Google Scholar] [CrossRef] [PubMed]
  75. Zhou, B.; Wu, K.; Chen, M. Detection of Gannan Navel Orange Ripeness in Natural Environment Based on YOLOv5-NMM. Agronomy 2024, 14, 910. [Google Scholar] [CrossRef]
  76. Uygun, T.; Ozguven, M.M. Determination of Tomato Leafminer: Tuta Absoluta (Meyrick) (Lepidoptera: Gelechiidae) Damage on Tomato Using Deep Learning Instance Segmentation Method. Eur. Food Res. Technol. 2024, 250, 1837–1852. [Google Scholar] [CrossRef]
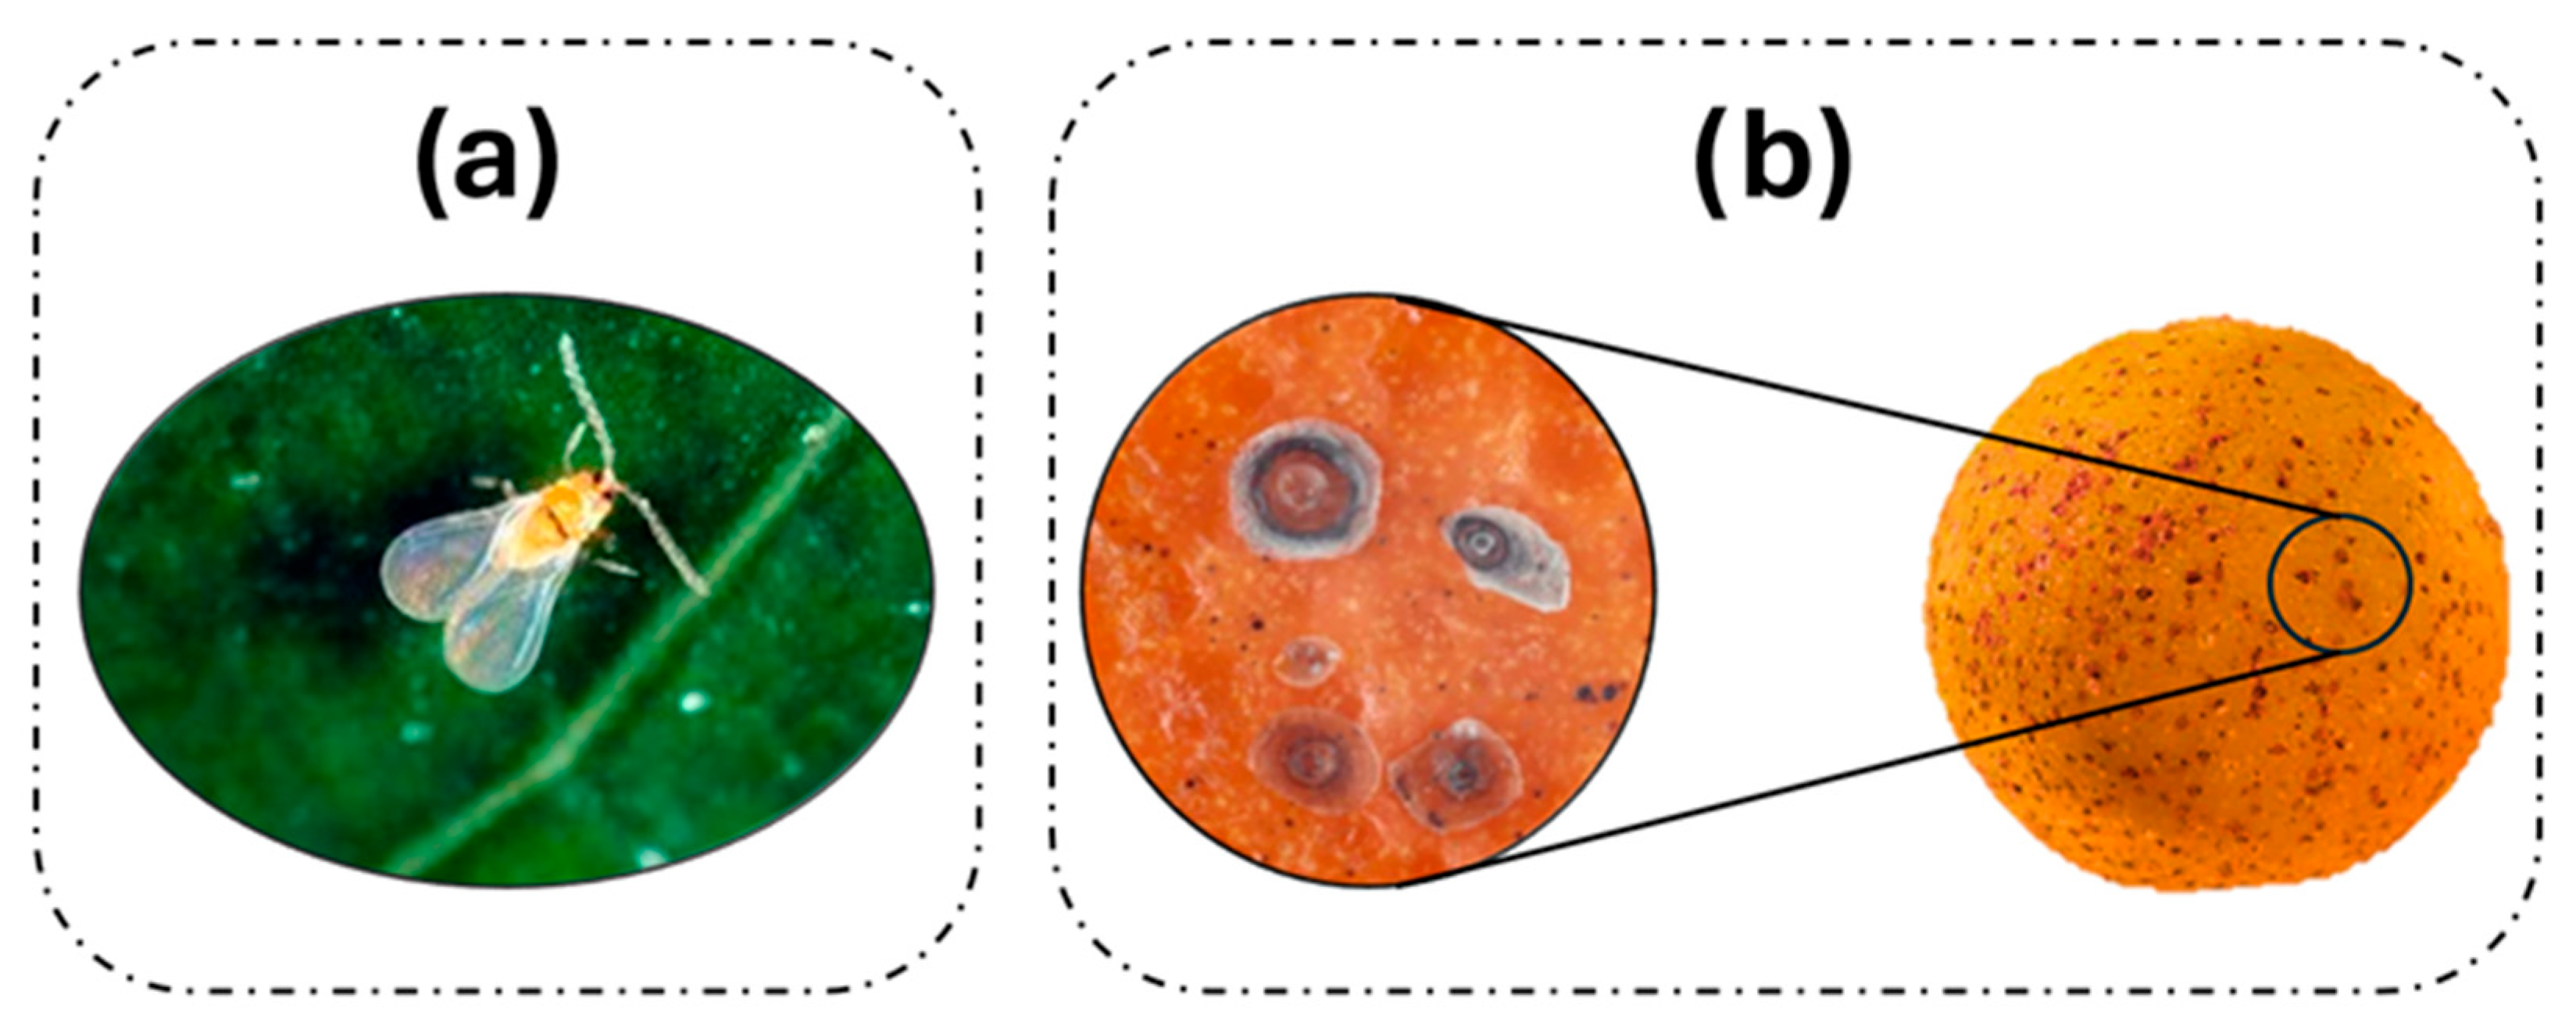
Figure 1. Red Scale: (a) Pest; (b) damage to the fruit.
Applsci 15 09742 g001
Figure 2. The acquired sample data and dataset class structure.
Applsci 15 09742 g002
Figure 3. Statistical analyses of the boundary box labels in the dataset: (a) Total number of labels for each class; (b) distribution of label sizes; (c) normalized location map of labeled targets; (d) normalized size distribution of labeled objects.
Applsci 15 09742 g003
Figure 4. Improved model architecture: (a) Backbone layer; (b) neck layer; (c) segment head; (d) YOLO12n-Seg model neck layer.
Applsci 15 09742 g004
Figure 5. (a) CAM sub-module; (b) SAM sub-module; (c) GAM module.
Applsci 15 09742 g005
Figure 6. (a) Standard convolution; (b) GhostConv layer.
Applsci 15 09742 g006
Figure 7. Methodological flow diagram of the study.
Applsci 15 09742 g007
Figure 8. Detection results of the model developed on the test data: (a) Original images; (b) simultaneous ripeness and pest damage detections made by the model.
Applsci 15 09742 g008
Figure 9. Different YOLO-based segmentation models; (a) mask mAP@0.5; (b) train segmentation loss.
Applsci 15 09742 g009
Figure 10. Grad-CAM heatmap results: (a) Original; (b) YOLO12n-Seg; (c) Improved Model.
Applsci 15 09742 g010
Table 1. Experimental configuration and training environment.
Device and SoftwareEnvironmental ParameterValue
Apple MacBook Pro 2012 (Apple Inc., Cupertino, California, CA, USA)Operating systemWindows 10 (Microsoft Corporation, Redmond, WA, USA)
CPUIntel Core i5 (Microsoft Corporation, Redmond, WA, USA)
RAM16 G-LPDDR3L
Google Colab (Mountain View, California, CA, USA)Deep learning frameworkPytorch 1.10 (Meta AI, Menlo Park, CA, USA)
Programming languagePython3.10 (Python Software Foundation, Wilmington, DE, USA)
Virtual RAM90 GB
Virtual storage250 GB
Virtual GPU (NVIDIA Tesla A100) (NVIDIA Corporation, Santa Clara, CA, USA)Memory40 GB
Bandwidth1555 GB/sec
Cuda Core6912
Table 2. The parameter settings for model training.
ParametersValue
Image-size640 × 640
Epochs100
Batch-size16
Momentum0.937
lrAuto
OptimizerSGD
Activation functionSiLU
Weight_decay0.0005
Warmup_epochs3
Warmup_momentum0.8
Warmup_bias_lr0.1
Table 3. Mask performance results of the improved model on a class basis.
ClassImages Mask
PRmAP@0.5mAP@0.5:0.95
All6140.9610.9430.9800.960
Full Ripe2210.9630.9260.9660.946
Red Scale2120.9820.9710.9920.984
Unripe2240.9360.9330.9820.949
Table 4. Performance comparisons of ablation studies.
Baseline ModelGhostConvGAMmAP@0.5mAP@0.5:0.95PR
YOLO12n-Seg--0.9770.9490.9580.941
YOLO12n-Seg-0.9780.9590.9620.933
YOLO12n-Seg-0.9790.9550.9590.945
YOLO12n-Seg0.9800.9600.9610.943
Table 5. Performance comparison with different instance segmentation models.
ModelGFLOPSParameterTrain TimeMask
mAP@0.5mAP@0.5:0.95PR
YOLOv5n-Seg112.761 M2 h, 51 m0.9690.9510.9490.931
YOLOv8n-Seg12.13.264 M3 h, 21 m0.9780.9550.9600.927
YOLO11n-Seg10.22.843 M3 h, 2 m0.9710.9490.9500.921
YOLO12n-Seg10.32.855 M3 h, 9 m0.9770.9490.9580.941
Improved Model10.42.749 M2 h, 42 m0.9800.9600.9610.943
Disclaimer/Publisher’s Note: The statements, opinions and data contained in all publications are solely those of the individual author(s) and contributor(s) and not of MDPI and/or the editor(s). MDPI and/or the editor(s) disclaim responsibility for any injury to people or property resulting from any ideas, methods, instructions or products referred to in the content.