Article

Research on Estimation of State of Charge for Lithium-Ion Batteries Based on TRNN-CTA

1
The School of Mechanical and Electrical Engineering, Hainan University, Haikou 570228, China
2
The School of Mechanical and Electrical Engineering, Hainan Vocational University of Science and Technology, Haikou 571126, China
*
Author to whom correspondence should be addressed.
Appl. Sci. 2025, 15(17), 9653; https://doi.org/10.3390/app15179653
Submission received: 3 August 2025 / Revised: 30 August 2025 / Accepted: 30 August 2025 / Published: 2 September 2025

Abstract

To address the issue of insufficient coordination of local contextual information in lithium-ion battery state-of-charge (SOC) estimation, this paper proposes a two-branch contextual temporal attention model based on a modified recurrent neural network (TRNN-CTA). This model combines a bidirectional recurrent neural network (BIRNN) branch structure with a contextual temporal attention (CTA) mechanism, effectively addressing the limited generalization capabilities of traditional models in conditions such as operating-condition switching, temperature variations, and capacity differences. Experiments on the CALCE dataset demonstrate that the TRNN-CTA model significantly outperforms traditional models in SOC estimation under the US06 operating condition, with R2, RMSE, and MAE values of 0.99987, 0.263%, and 0.199%, respectively. Further feature dimension expansion, model simplification, and model generalization experiments verify that the TRNN-CTA model can stably and accurately estimate battery SOC across various operating conditions, temperatures, and capacities. Specifically, when the feature dimension is expanded from 2 to 6, the accuracy improves by approximately 30%, while the TRNN-CTA model achieves a 70% reduction in error compared to the baseline model. In summary, the TRNN-CTA model proposed in this paper provides a new solution for predicting the SOC of lithium-ion batteries in hybrid electric vehicles. This research result will provide certain technical support in this field.

1. Introduction

The rapid advancement of new energy technologies has led to the increasing market adoption of new energy vehicles. Among the various energy storage solutions, lithium-ion batteries are widely used in these vehicles due to their high energy density, long cycle life, and relatively low cost [1]. Consequently, it is crucial to monitor battery status and manage energy flow through an efficient battery management system (BMS) during both energy storage and supply processes. As a key parameter in the energy management system of new energy vehicles, the accurate estimation of the state of charge (SOC) is essential for reducing energy consumption and enhancing the overall efficiency of battery utilization [2].
Currently, the primary methods for estimating the SOC include experimental testing methods, model-based approaches, and data-driven techniques. Among these, experimental testing methods were developed earlier and mainly encompass the amperage integration method, the open-circuit voltage (OCV) method, and related techniques. For instance, Lee et al. observed that the Coulomb counting method is relatively sensitive to initial value settings and proposed an approach to update the initial SOC using the OCV method based on internal battery resistance. This improvement reduced the charging and discharging cycle error by 0.27–0.39% [3]. Fazel Mohammadi developed a more accurate SOC estimation method capable of evaluating uncertainty over a decade. This mathematical model enhances the Coulomb counting approach and achieves a maximum error of only 0.3% [4]. Ko noted that most SOC estimation studies rely on offline data and proposed an online SOC monitoring method based on enhanced Coulomb counting and an adaptive Kalman filter (AKF) [5]. While these studies primarily focused on improving the Coulomb counting method, Wang et al. enhanced SOC estimation accuracy from the perspective of OCV. They proposed a method to estimate the OCV-SOC curve across different temperatures by integrating cloud-based and offline data and analyzed the effect of battery aging on the OCV-SOC curve. Experimental results validated the effectiveness and superiority of their approach [6]. In addition, Qi et al. recognized the strong nonlinear relationship between OCV and SOC and were the first to propose an OCV-SOC model based on fractional calculus. This model effectively captures the nonlinear behavior of lithium-ion batteries while maintaining high accuracy with a relatively modest increase in computational complexity [7].
Although this estimation method is easy to implement, its open-loop control nature results in poor accuracy under complex operating conditions, making it difficult to capture nonlinear behaviors and accurately estimate SOC when influenced by environmental variations. In contrast, model-based methods are currently more widely adopted due to their closed-loop control structure, which offers higher estimation accuracy compared to experimental testing methods [8]. These approaches typically involve constructing a battery model to simulate its operational state and applying control algorithms to estimate SOC accurately. However, their performance is highly dependent on the accuracy of the battery model and its parameterization [9]. Data-driven methods, on the other hand, estimate SOC by extracting relevant real-time parameters of battery operation, such as current, voltage, temperature, power, and energy, and training these inputs using deep learning models. This allows for the establishment of a mapping relationship between operating conditions and SOC without the need for complex physical modeling, providing strong adaptability across different working conditions and battery types [10]. Moreover, deep learning-based approaches can address challenges such as local optima and overfitting during the estimation process [11]. Among deep learning techniques, convolutional neural networks (CNNs) and recurrent neural networks (RNNs) are commonly used for SOC estimation [12,13,14]. CNNs are particularly effective in handling time series data. For example, Fan et al. developed a CNN with a U-Net architecture for SOC estimation. Their method mitigates the boundary effects of standard CNNs, supports variable-length input data, and outputs SOC predictions of consistent length. Furthermore, optimization of the loss function significantly enhances estimation stability and reduces error [15]. RNNs can retain and process historical information, but it is difficult for RNNs to handle long-distance dependency problems in time series data. Based on this, the long short-term memory neural network (LSTM) and the gated recurrent unit (GRU) neural network have improved RNNs. Chen et al. [16] proposed a SOC estimation method based on LSTM-RNN, which solved the network vanishing problem in the RNN and introduced an additional input (average voltage) to improve the adaptability of the model when the working conditions change significantly. Jiao et al. [17] proposed a SOC estimation method based on GRU-RNN, which effectively avoided the gradient explosion and gradient vanishing problems in the RNN and improved the accuracy and speed of SOC estimation. In summary, RNN is widely used in the field of SOC estimation and shows advantages.
In short, deep learning algorithms can effectively process sequence data and easily capture the time dependency of the SOC. However, most current models have certain limitations in gradually extracting local features and abstracting high-level features from long time series data, and their generalization ability is insufficient and needs to be improved urgently. Therefore, this study proposes a TRNN model framework that integrates the advantages of multiple RNNs and uses the contextual temporal attention (CTA) mechanism to balance sequence information, thereby improving the accuracy of the SOC estimation model.

2. Materials and Methods

2.1. Description of the SOC Dataset

The dataset used in this study is the CALCE dataset from the Center for Advanced Lifecycle Engineering at the University of Maryland (CALCE dataset for short). This dataset was collected and preprocessed by the CALCE Battery Research Group [18]. The data URL is https://calce.umd.edu/battery-data, accessed on 1 April 2010. The group selected the INR 18650-20R battery dataset with a rated capacity of 2000 mAh, which contains data for four operating conditions, three temperatures, and two initial and final capacities. A total of 24 sets of experimental data were used. The specific information is shown in Table 1.
To enable the model to effectively capture both the original and dynamic characteristics of the voltage and current time series, a feature expansion operation was performed. Specifically, moving average values of the voltage and current were calculated using a three-point sliding window, resulting in two new features: Voltage_MA and Current_MA. Additionally, the rate of change for both voltage and current was computed to generate the features Voltage_Delta and Current_Delta. The three-point window was selected to achieve an optimal balance between computational efficiency and the sensitivity to capture rapid transient behaviors in battery dynamics, a common practice in the related literature for BMS applications [18]. As a result, the model’s input comprises six independent variables: I, U, Voltage_MA, Current_MA, Voltage_Delta, and Current_Delta. The distributions of the four additional features after training set expansion are illustrated in Figure 1.
Therefore, the specific feature variables and target dependent variable information of the dataset are shown in Table 2. There are a total of 6 input variables and the target value SOC.

2.2. TRNN-CTA

2.2.1. Overall Framework

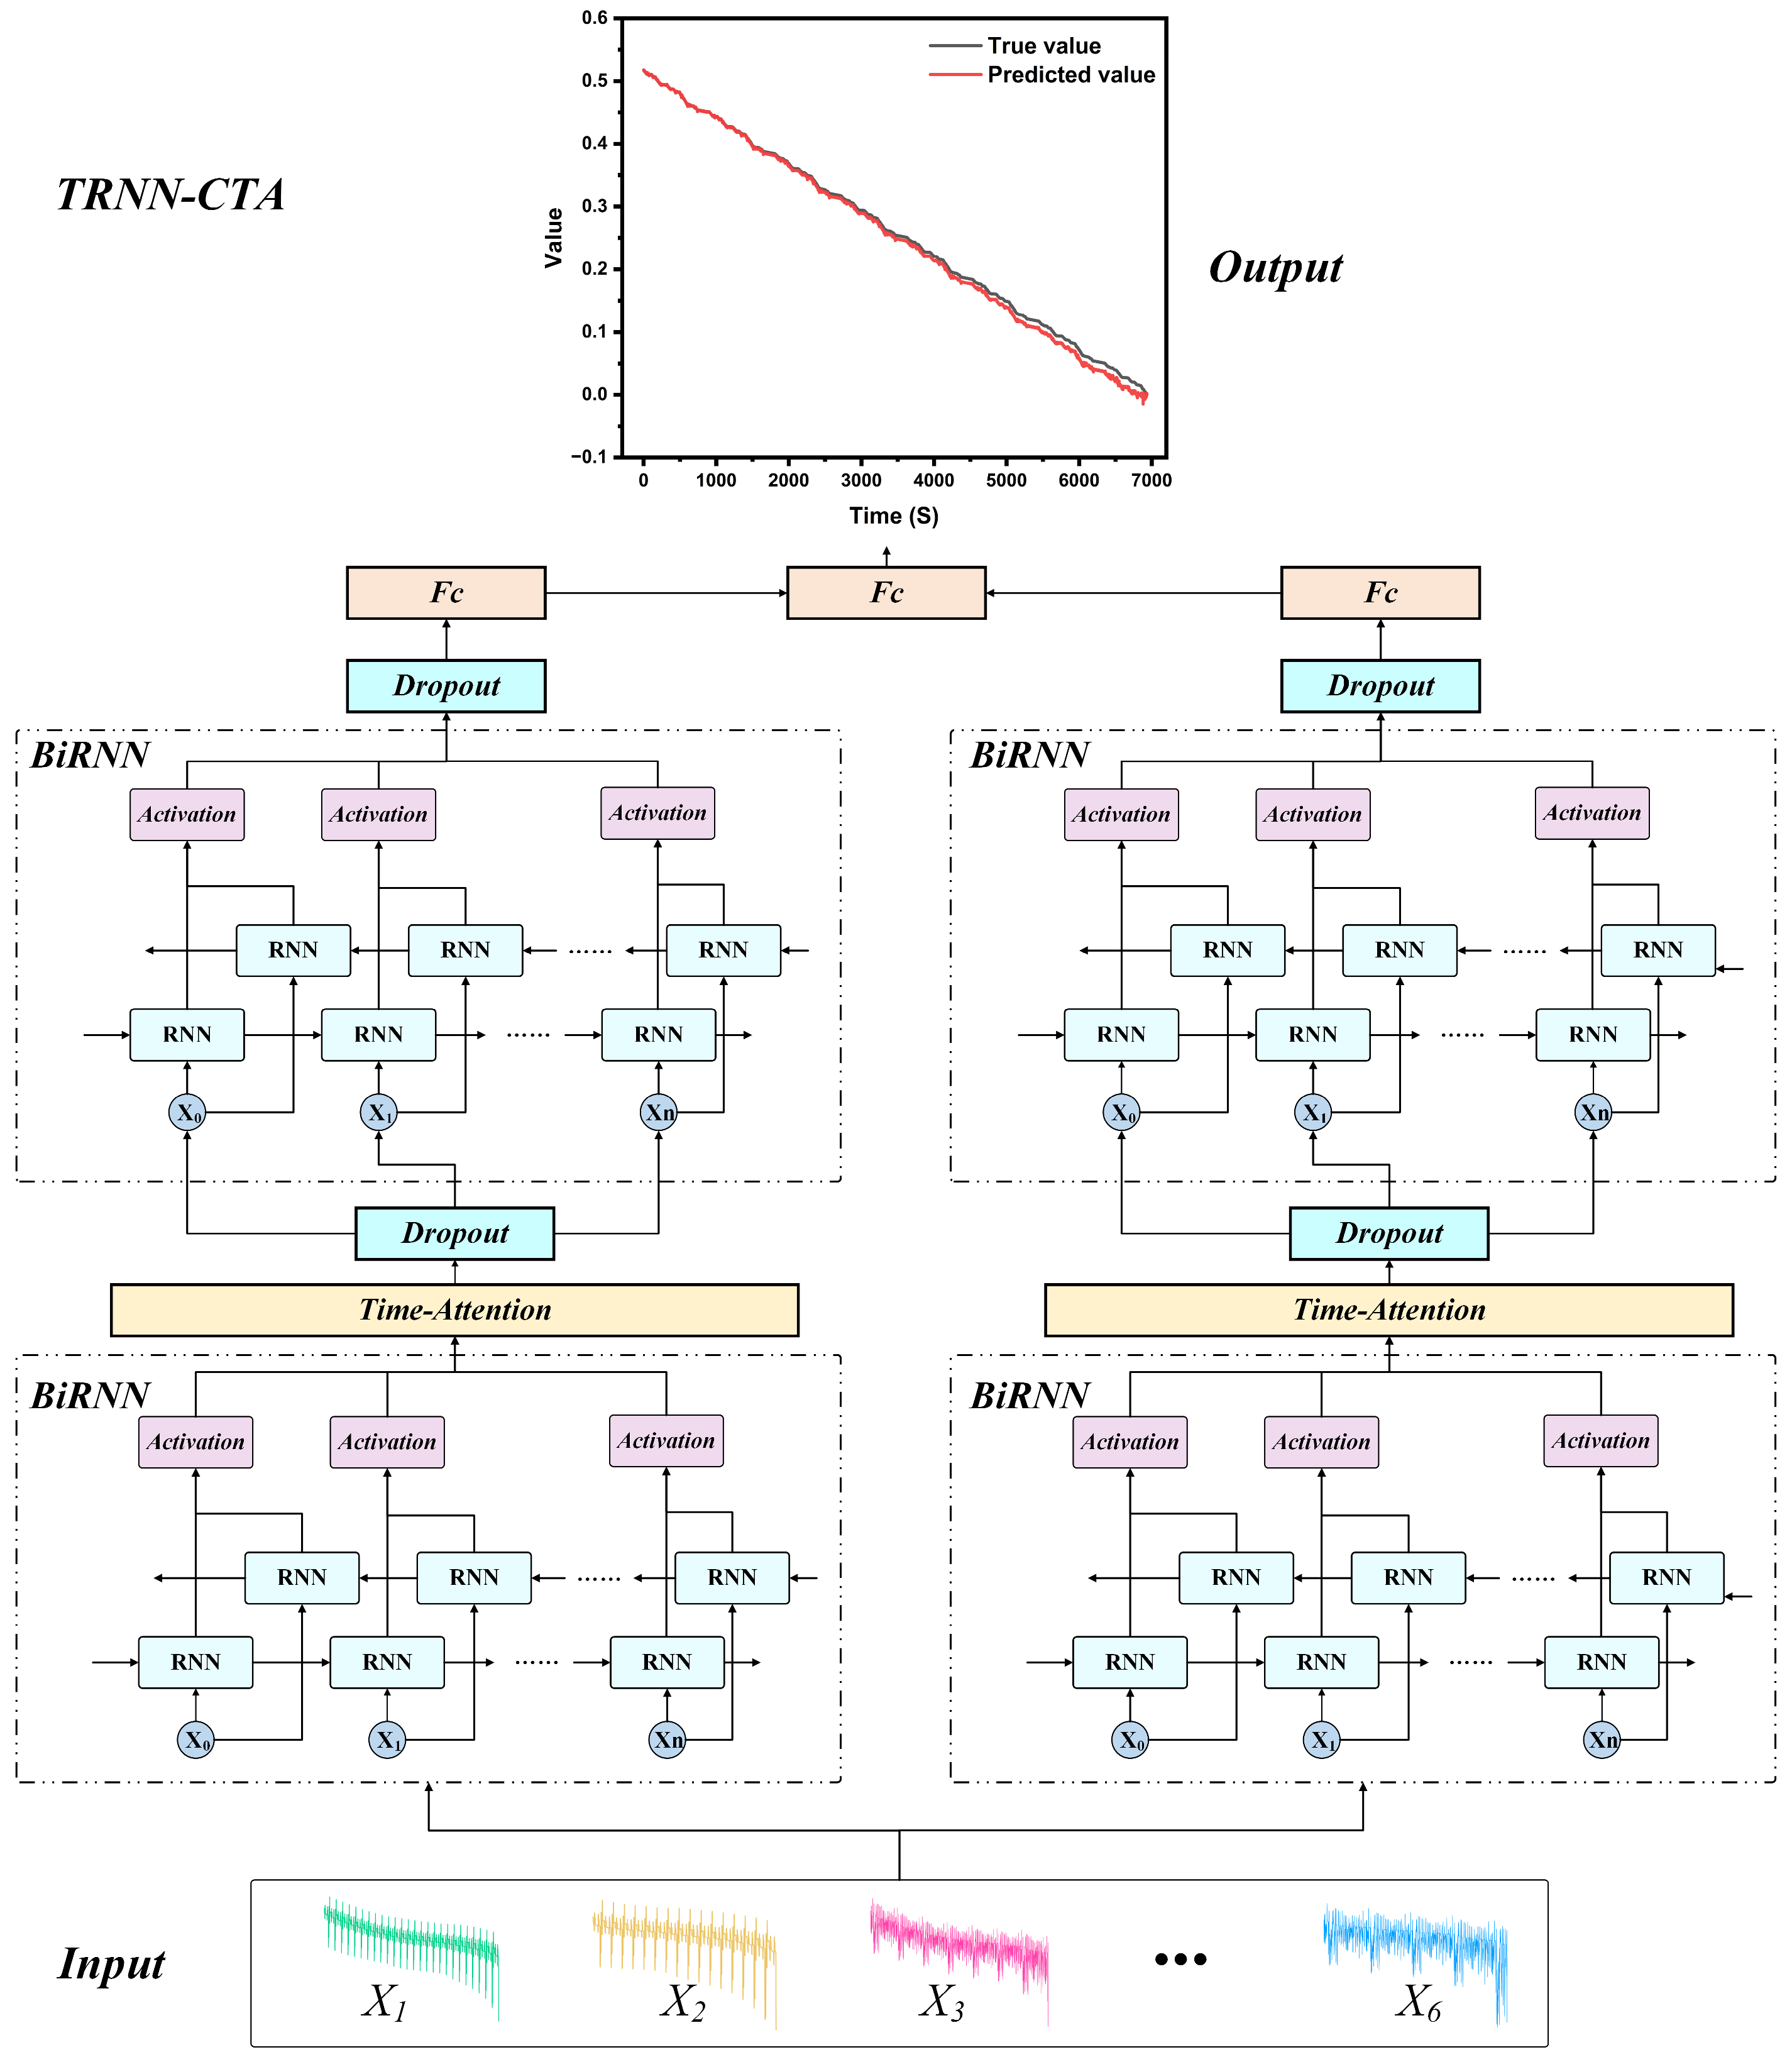
The architecture of the proposed TRNN-CTA network is illustrated in Figure 2. The TRNN-CTA model is primarily composed of a dual-branch structure and an innovative CTA mechanism. Each of the two branches adopts a similar architecture, structured as BiRNN-CTA-BiRNN, where BiRNN denotes a bidirectional RNN and can utilize variants such as BiLSTM or BiGRU. A CTA is added to the middle layer of each branch to extract multi-scale temporal attention features and adopt the idea of different processing at different scales. Meanwhile, in order to ensure the generalization ability of the model, a dropout layer is introduced to randomly lose neurons. Therefore, the model mainly includes the following structural features: (1) a dual-branch structure; (2) a multi-scale temporal attention mechanism; (3) and a bidirectional RNN model.
Firstly, compared with most traditional single-branch SOC estimation models, TRNN-CTA adopts a dual-branch structure. Although both branches adopt a similar BiRNN-CTA-BiRNN structure, they can process input data from different perspectives. For example, the BiRNN models used by the two branches may be different, or when the model is the same, the number of layers used may also be different. This method enables the entire model to obtain more comprehensive and rich input information, and can further extract the deep temporal information of all features, thereby learning more complex patterns in the input sequence and deeper relationships with SOC. At the same time, it also improves the sensitivity and dynamic generalization ability of the RNN model to time series data, avoiding the one-sidedness and information loss problems in the traditional single model processing path [19].
Secondly, the CTA mechanism is introduced in the context, aiming to focus on the time step features or time segment features that are more important for the SOC prediction task in the time series features extracted by the previous BiRNN model. The TA here is also a multi-scale branch structure with convolutional residual connections. By assigning different levels of weight to the aforementioned key time information, it can more effectively utilize the relevant information at different levels of the time feature information for prediction. In addition, after improving the ability of the SOC prediction model to extract and perceive important time series features, it can avoid the complex pattern analysis caused by the fluctuation changes of time series data at different scales. Therefore, by adopting a multi-scale feature extraction method, the long-term dependency and short-term fluctuation feature patterns in voltage, current, and their feature extension data can be analyzed, thereby helping the model to stabilize and generalize to other datasets. Therefore, the CTA proposed in this study introduces the attention mechanism into the overall structure based on the fact that the RNN structure can learn time series, thereby enhancing the model performance of the traditional RNN structure.
Finally, BiRNN is committed to achieving bidirectional information fusion, enabling the BiRNN model to consider past and future time series information at the same time [20]. This is particularly useful for time series prediction tasks such as predicting SOC using voltage, current, and their generalized features. Past voltage, current, and even SOC data can provide historical trends, while future data can help the SOC prediction model better understand input features and their importance at the current time step, thereby obtaining a deeper and more accurate feature map. Specifically, BiRNN can adopt BiLSTM or BiGRU, and different BiRNN models have different characteristics. Therefore, when processing different data information and prediction targets, the bidirectional flow recurrent model can be flexibly selected to achieve accurate, end-to-end SOC estimation tasks.

2.2.2. CTA Mechanism

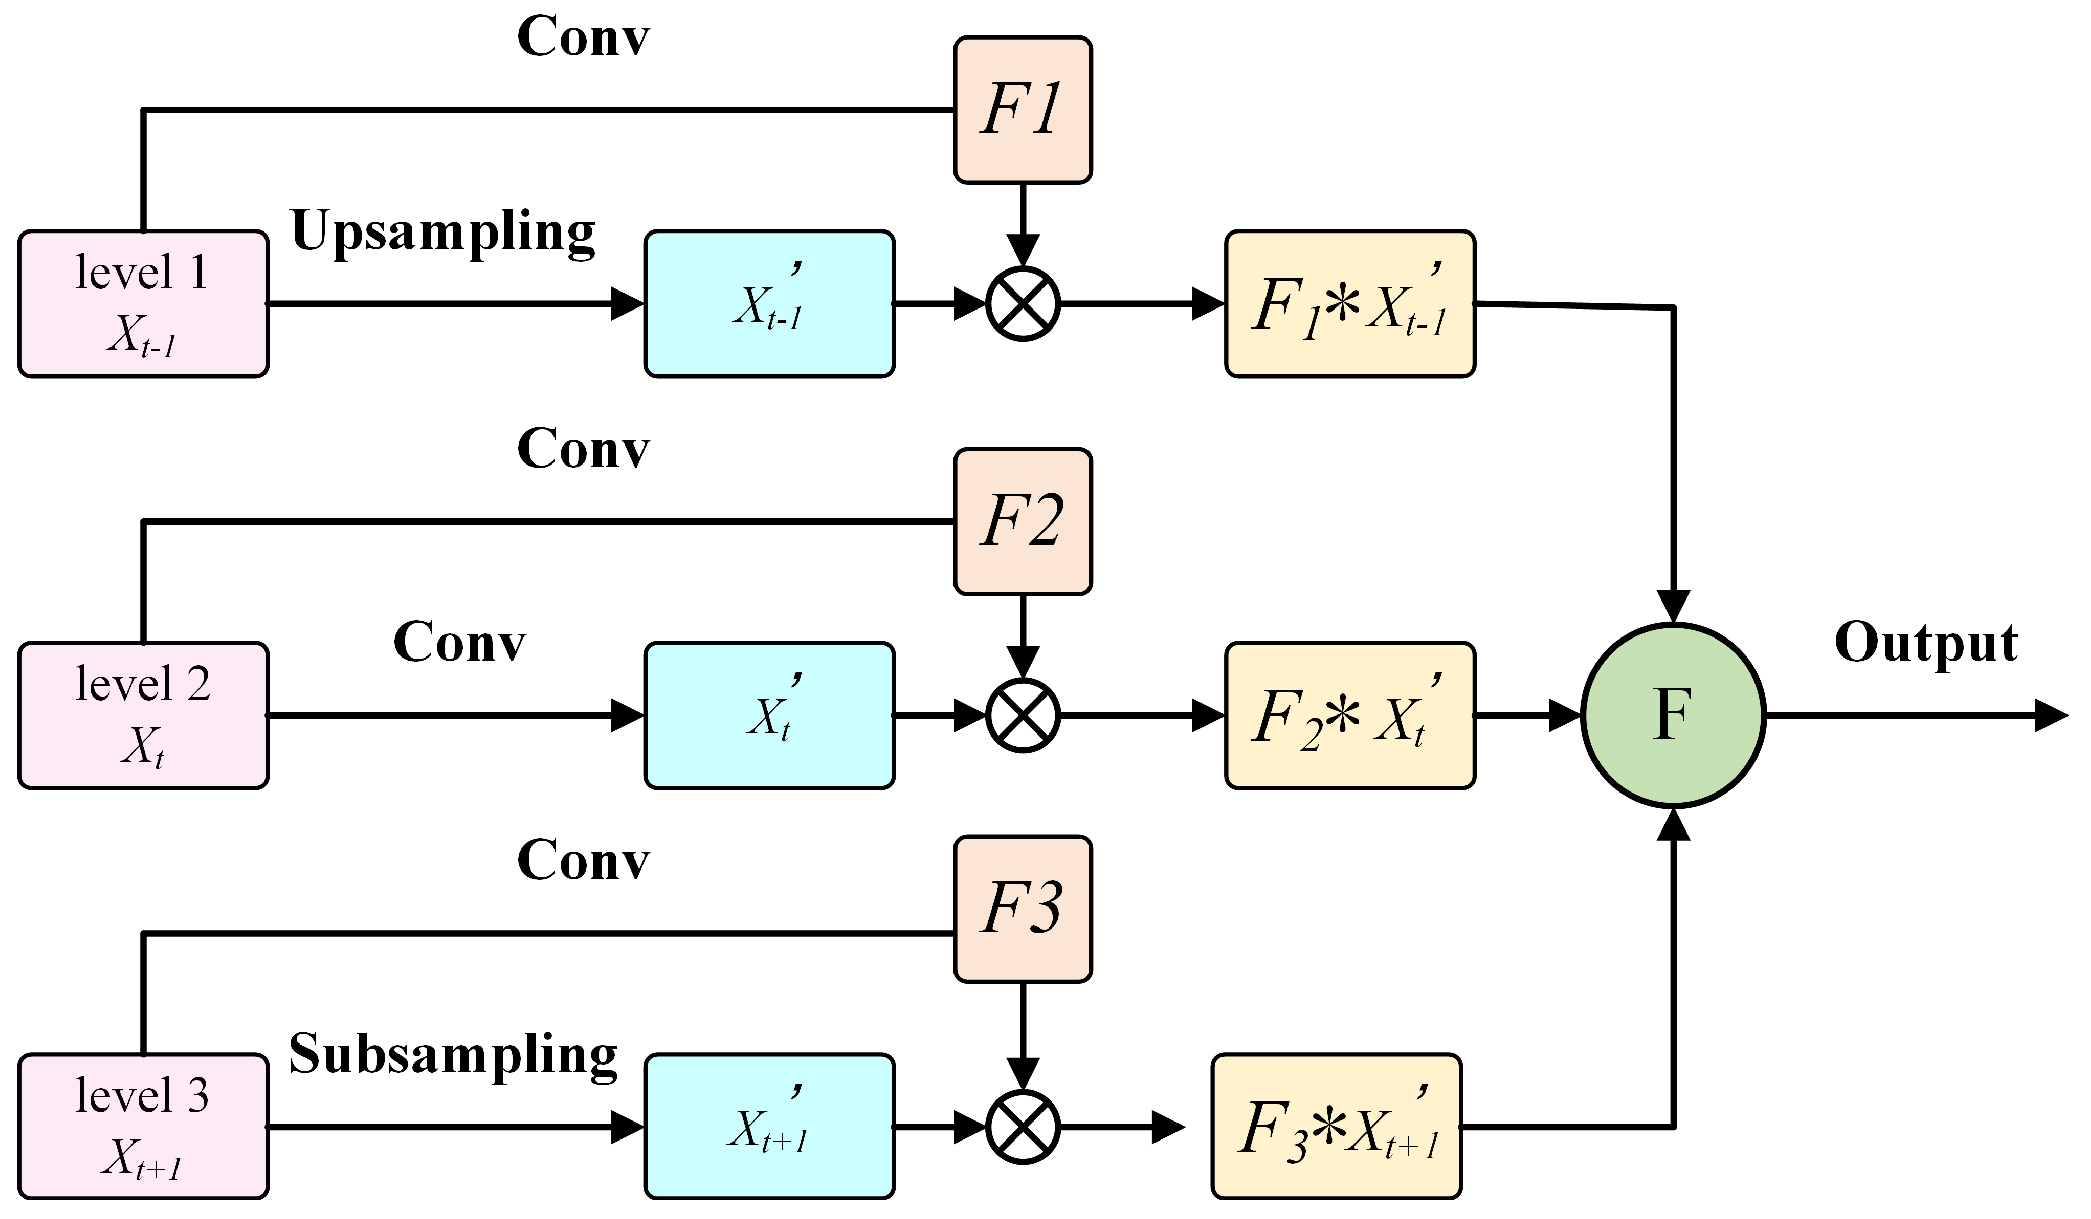
The CTA network framework mentioned in Section 2.2.1 is shown in Figure 3. CTA mainly consists of three branches for extracting features at different time scales: the current moment branch, the previous moment branch, and the next moment branch. Different branches use different processing methods, and ultimately, the feature information at these moments is connected in series to obtain the CTA output. This multi-scale feature extraction mode can process data at different moments separately and capture feature information at different scales in the time series. At the same time, the fusion of feature information at different moments can comprehensively consider the overall change trend of voltage, current, etc., in the time series, improving the SOC estimation model’s ability to understand the input time series data, thereby enhancing the battery SOC prediction ability.
For the previous branch (Level 1: Xt1), the convolution operation, upsampling, and feature weighted fusion are calculated according to the following formulas:
X t 1 = U p s a m p l i n g   X t 1
F 1 = C o n v X t 1
F t - 1 = F 1 X t 1
Here, Upsampling adopts the operation of first performing simple linear interpolation to align the time steps and then using transposed convolution for feature upsampling.
For the current moment branch (Level 2: Xt), the corresponding calculation formulas for the two convolution operations and feature weighted fusion are as follows:
X t = C o n v   X t
F 2 = C o n v X t
F t = F 2 X t
For the next moment branch (Level 3: Xt+1), the convolution operation, downsampling operation, and feature weighted fusion are calculated according to the following formulas:
X t + 1 = S u b s a m p l i n g   X t + 1
F 3 = C o n v X t + 1
F t + 1 = F 3 X t + 1
Here, Subsampling is achieved through average pooling.
Finally, feature fusion and output operations are carried out, and the weighted features obtained from the three branches are fused together:
O u t p u t = C o n c a t ( F t 1 + F t + F t + 1 )

2.3. Experimental Environment and Evaluation Iindicators

All data processing and modeling operations in this study were completed in Pycharm 2025.1.1, using Python 3.10 as the programming language and PyTorch 2.4.1 as the deep learning framework. In the experiment, the random seed was fixed to 42, the batch size was 32, the dropout rate was 0.1, the learning rate was set to 0.1, and the cosine annealing strategy was used for learning rate adjustment. SGD was used as the optimizer. In addition, ten-fold cross-validation is used to assess the generalization ability of the model and to avoid evaluation biases caused by the data partitioning method.
All models were evaluated using the three evaluation indicators R2, RMSE, and MAE commonly used in SOC estimation [21,22,23]. The value range of R2 is 0~1. The closer the value is to 1, the better the prediction effect of the model. The value range of RMSE and MAE is 0~m, that is, the smaller the value, the smaller the error of the model and the better the fitting effect. The calculation formulas of the three evaluation indicators are as follows:
R 2 = 1 i = 1 n y i y ^ i 2 i = 1 n y i y ¯ i 2
RMSE = 1 n i = 1 n y i y i 2
MAE = 1 n i = 1 n | y ^ i y i |
Here, y ^ i is the predicted value, y i is the actual value, and y is the average of the predicted values.

3. Results and Analysis

3.1. Feature Expansion Experiment

To evaluate the effectiveness of the feature expansion strategy, the BiLSTM-BiGRU-CTA model within the TRNN-CTA framework was employed for experimental analysis. Two sets of input features, two training sets, and two test sets were designed, resulting in a total of eight experimental configurations. The performance results of these experiments are summarized in Table 3.
As shown in Table 3, the feature expansion strategy significantly improves the model’s performance. When only two feature variables are used as input, the model exhibits noticeable variation in performance across different training and test sets. For instance, when the training set is DST+FUDS (0 °C-50% SOC), the model achieves an R2 of 0.99816, RMSE of 1.167%, and MAE of 0.878% on the BJDST test set. However, on the US06 test set, the performance drops, with an R2 of 0.99588, RMSE of 1.482%, and MAE of 4.360%. In contrast, when the model is trained with the expanded set of six input features, its performance improves considerably across both test sets. Specifically, using the DST+FUDS (0 °C-80% SOC) training set, the model achieves an R2 of 0.99984, RMSE of 0.287%, and MAE of 0.219% on the BJDST test set. On the US06 test set, the results are even more impressive, with an R2 of 0.99987, RMSE of 0.263%, and MAE of 0.199%. These results indicate that the TRNN-CTA model, when using the expanded six-variable input, is better able to capture complex temporal dynamics and nonlinear relationships in the time series data, thereby significantly improving SOC prediction accuracy.
Moreover, the study demonstrates that the choice of training set influences model performance. Regardless of whether two or six features are used, models trained on DST+FUDS (0 °C-80% SOC) consistently outperform those trained on DST+FUDS (0 °C-50% SOC). This may be attributed to the fact that the 80% SOC condition inherently includes the 50% SOC range, allowing the model to learn a more diverse and comprehensive set of feature representations. Consequently, the model becomes more robust and generalizable across different test conditions.

3.2. Ablation Experiment

To evaluate the effectiveness of the proposed TRNN-CTA framework and its CTA mechanism, a comprehensive modeling study was conducted using the optimal test set, US06 (0 °C-80% SOC), as identified in Section 3.1. Three experimental configurations were designed for comparison: a single-branch RNN model, a dual-branch RNN model, and the TRNN-CTA framework introduced in this study. The results of these experiments are summarized in Table 4.
As shown in Table 4, the introduction of the CTA mechanism significantly enhances SOC prediction accuracy in the single-branch models. Specifically, when comparing the BiGRU model to the BiGRU-CTA variant, the R2 value improved from 0.99385 to 0.99655. Additionally, the RMSE decreased by 34% (from 1.905% to 1.257%), and the MAE dropped by 21% (from 2.099% to 1.658%). Similarly, the BiLSTM-CTA model demonstrated improved performance over the base BiLSTM, with an increase in R2 and a 23% reduction in both RMSE (from 2.062% to 1.591%) and MAE. These results validate the effectiveness of the CTA mechanism proposed in this study, confirming its ability to enhance the model’s SOC estimation performance by capturing more informative temporal features. Furthermore, the dual-branch RNN models generally outperformed their single-branch counterparts. However, even the best-performing dual-branch model (BiLSTM-BiGRU) achieved a maximum R2 of 0.99621, which was still lower than that of the TRNN-CTA models. In comparison, the proposed BiGRU-BiLSTM-CTA model within the TRNN-CTA framework achieved the highest R2 of 0.99987, with RMSE and MAE reduced to 0.263% and 0.199%, respectively. These results represent an error reduction of 78% (RMSE) and 88% (MAE) relative to the best dual-branch baseline model, clearly demonstrating the superior performance of the TRNN-CTA approach. Additionally, all variants of the TRNN-CTA model outperformed the traditional dual-branch structures, further verifying the robustness and effectiveness of the proposed framework. Among them, the BiGRU-BiLSTM-CTA model emerged as the most optimal architecture for the SOC estimation task and was therefore selected for subsequent comparative and generalization experiments.

3.3. Model Comparison Experiment

Furthermore, a comparative experiment was conducted to evaluate the performance of the proposed TRNN-CTA model against several mainstream models under the highly dynamic and complex US06 operating condition. The baseline models included CNN [24], LSTM, and GRU [25], BiLSTM and BiGRU [26], Transformer [27], and temporal convolutional network (TCN) [28]. Furthermore, for the above model, we keep the random seed and batch size the same as those of TRNN-CTA. Other parameters are randomly searched within a larger parameter range. For the TRNN-CTA model, the BiGRU-BiLSTM-CTA variant, identified as the optimal architecture in previous experiments, was used for evaluation. The results of the comparison are presented in Table 5. The TRNN-CTA model achieved the highest performance, with an R2 of 0.99987, an RMSE of 0.263%, and an MAE of 0.199%. In comparison, the next-best-performing model, TCN, exhibited higher error metrics. Specifically, TRNN-CTA reduced RMSE by 58% and MAE by 77% relative to TCN. Moreover, when benchmarked against other widely adopted time series models known for their robust predictive capabilities, TRNN-CTA consistently outperformed all models across all evaluation metrics. These results strongly confirm the superior ability of TRNN-CTA to extract and model complex temporal features in battery SOC prediction tasks.
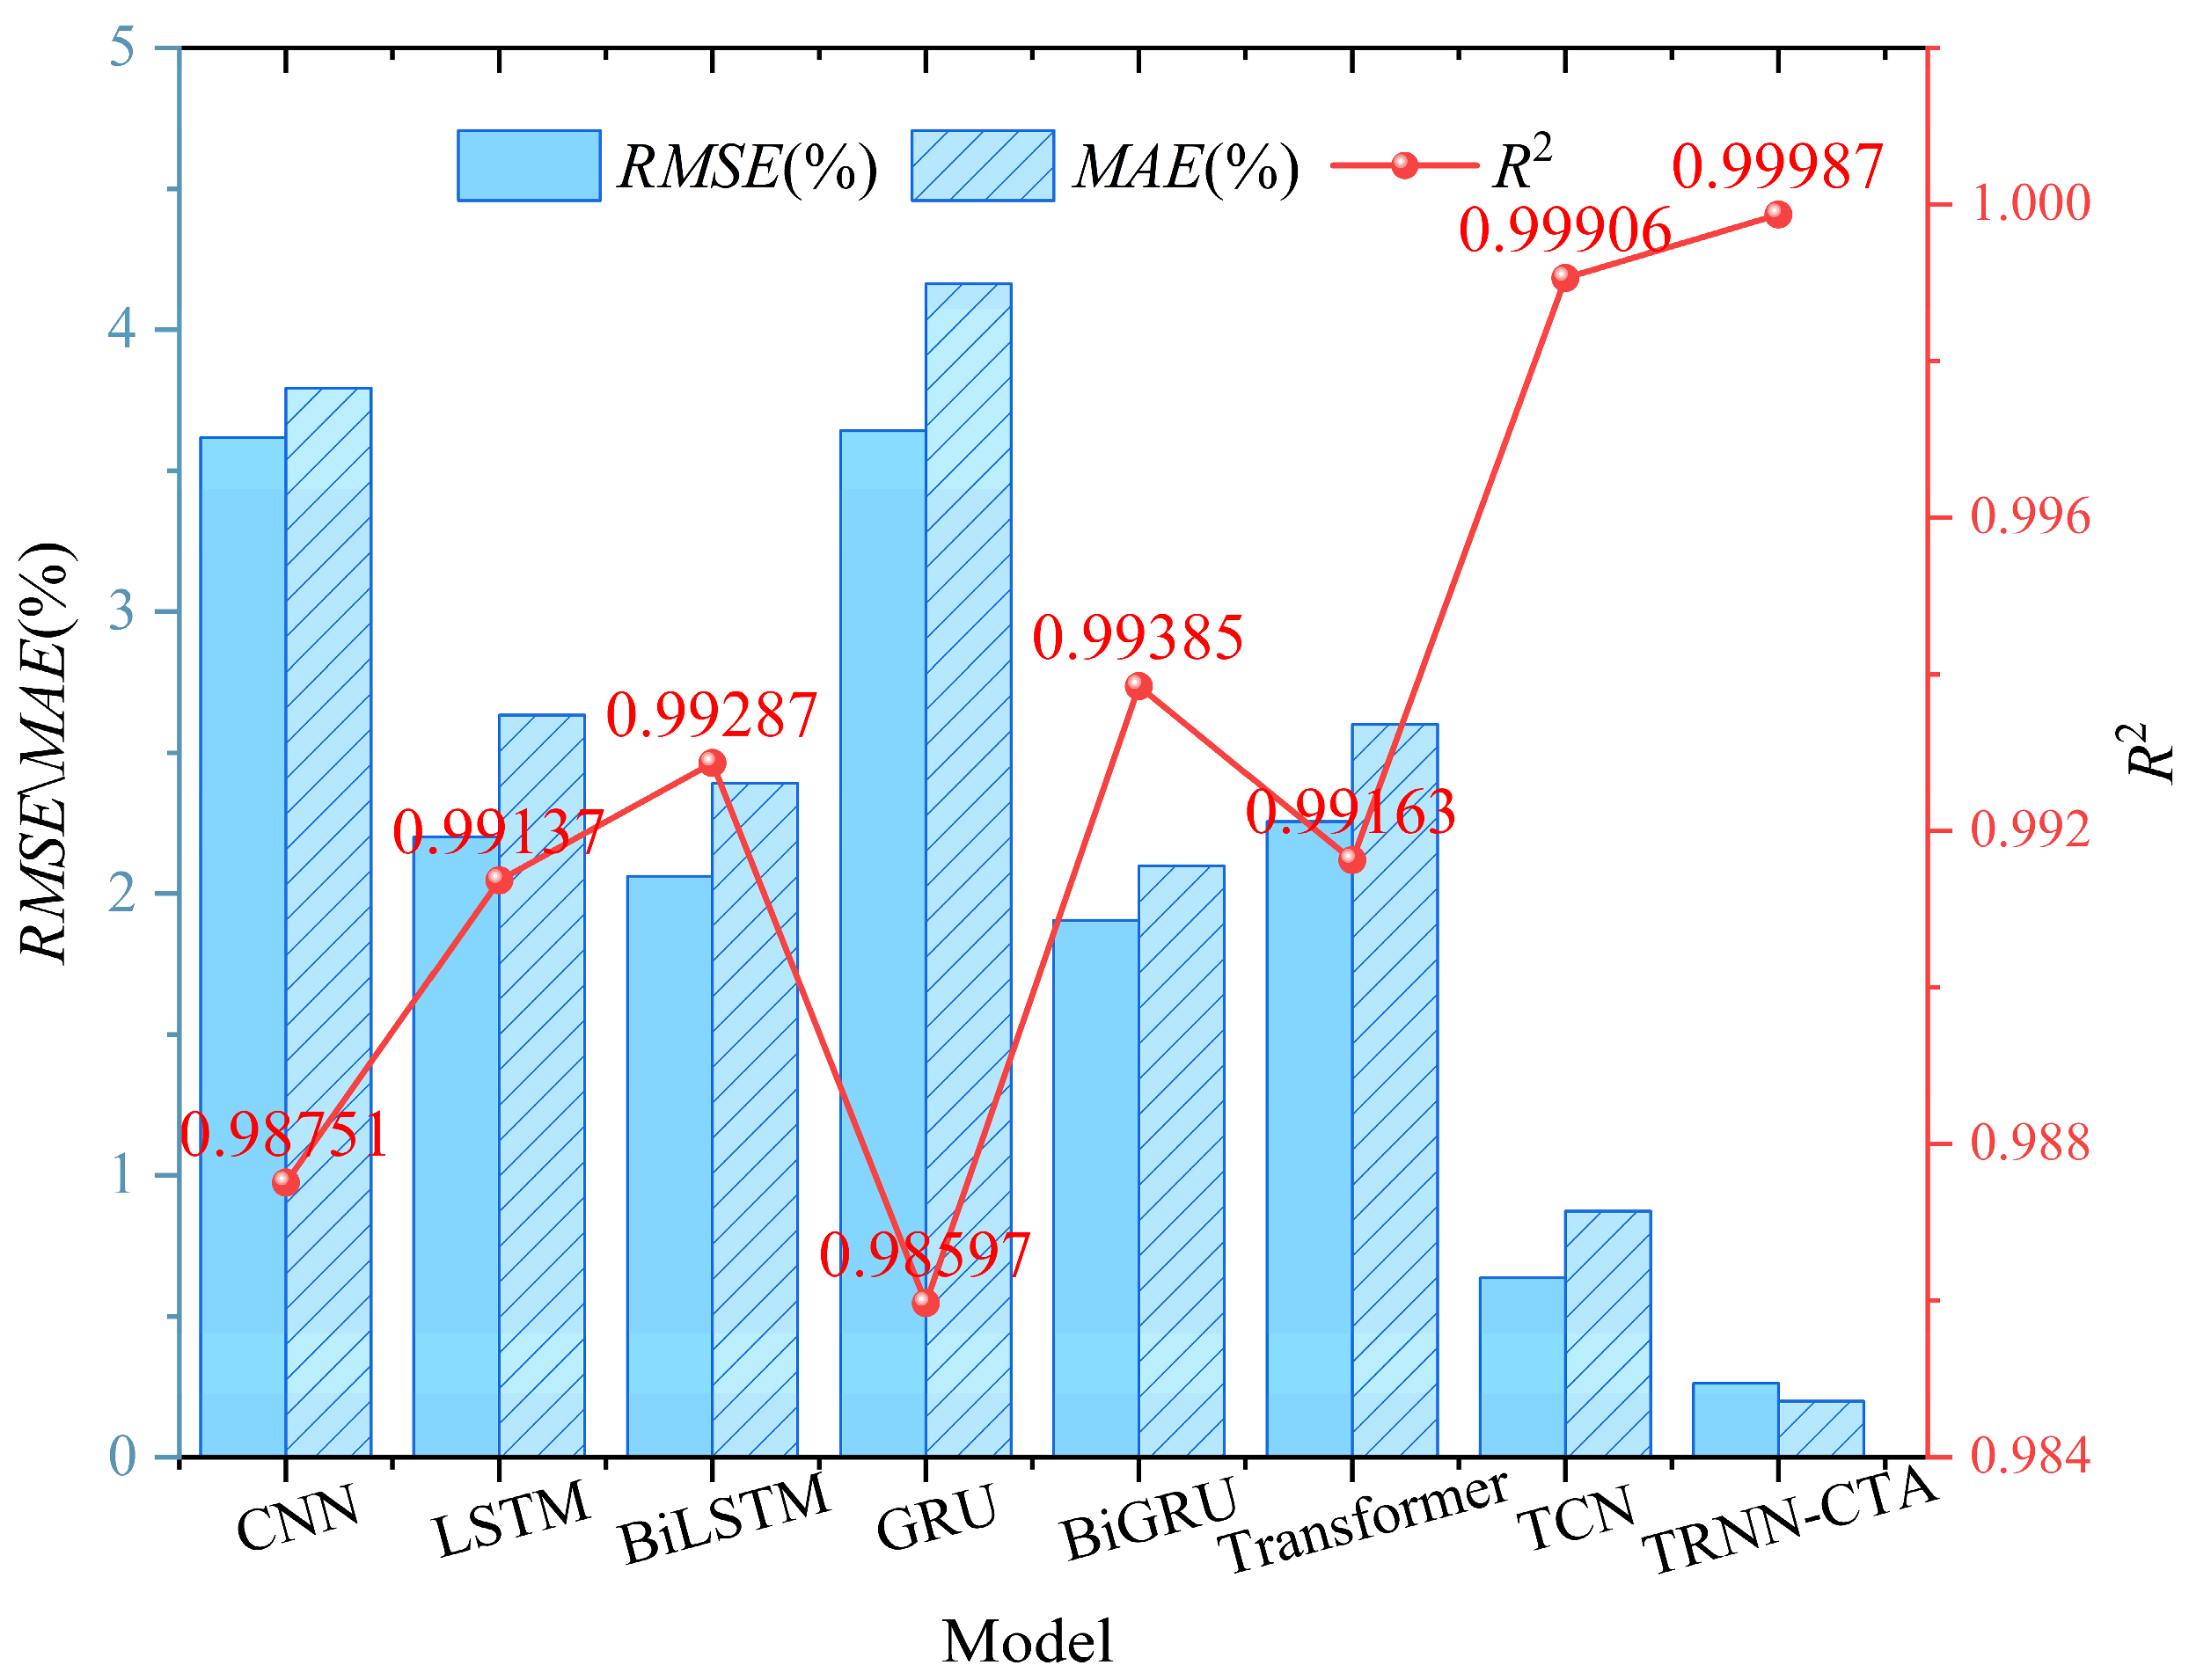
To intuitively illustrate the advantages of the proposed model, a visualized bar chart of the comparative results is presented in Figure 4. As shown, the traditional CNN exhibits the weakest modeling capability due to its inability to effectively extract temporal dependencies, resulting in an R2 value below 0.99. Although the unidirectional LSTM and GRU models demonstrate some capacity to capture temporal information, their performance remains limited by their failure to account for bidirectional temporal dependencies. For example, the GRU model still records an R2 lower than 0.99. In contrast, bidirectional RNN models show notable improvements in accuracy. While BiLSTM achieves a slightly lower R2 than LSTM, it shows enhanced error metrics, with RMSE decreasing from 2.201% to 2.062% and MAE from 2.634% to 2.392%. The BiGRU model, in particular, demonstrates a more substantial reduction in error indicators compared to its unidirectional counterpart. However, even these enhanced models exhibit RMSE values that are 6–8 times higher than those achieved by the proposed TRNN-CTA framework, underscoring its superior modeling performance. In summary, TRNN-CTA leverages a dual-branch feature extraction and fusion structure to facilitate multi-scale temporal feature integration. Coupled with the context-based CTA mechanism, which dynamically focuses attention on key temporal segments, the model effectively addresses the limitations of traditional RNNs, particularly their challenges in capturing long-term dependencies and detecting localized fluctuations. These experimental findings further reinforce the effectiveness and advancement of the proposed TRNN-CTA framework through a comprehensive horizontal model comparison.

3.4. Model Generalization Experiment

The dataset utilized in the preceding section was limited to four operating conditions, DST, FUDS, BJDST, and US06, all conducted at 0 °C, resulting in relatively constrained experimental conditions. To further evaluate the generalization capability of the proposed TRNN-CTA framework, generalization tests were conducted using two initial capacity levels across four operating conditions at elevated temperatures of 25 °C and 45 °C, based on the CACLE dataset. The results of these tests are summarized in Table 6. As shown, the model exhibited outstanding predictive performance under both temperature conditions. In all scenarios, the R2 values exceeded 0.999, indicating a high degree of agreement between the predicted SOC values and the ground truth for 50% SOC capacity. Moreover, the error metrics RMSE and MAE remained consistently low, both below 0.35%, across all operating conditions and temperatures, underscoring the accuracy, stability, and robustness of the TRNN-CTA model.
Further analysis of performance across different operating conditions revealed that the model performed most effectively under the BJDST condition. At 45 °C, the R2, RMSE, and MAE reached 0.99953, 0.329%, and 0.314%, respectively, the best results among all eight test scenarios. While minor fluctuations were observed across the other three conditions at both temperatures, these variations were minimal and well within acceptable limits. Overall, The results presented in Table 6 confirm that the TRNN-CTA framework, based on a 50% capacity, still exhibits strong generalization ability when used for the SOC prediction task under different thermal environments and operating conditions. This validates its potential for practical deployment in real-world BMSs, where operating conditions and ambient temperatures can fluctuate considerably.
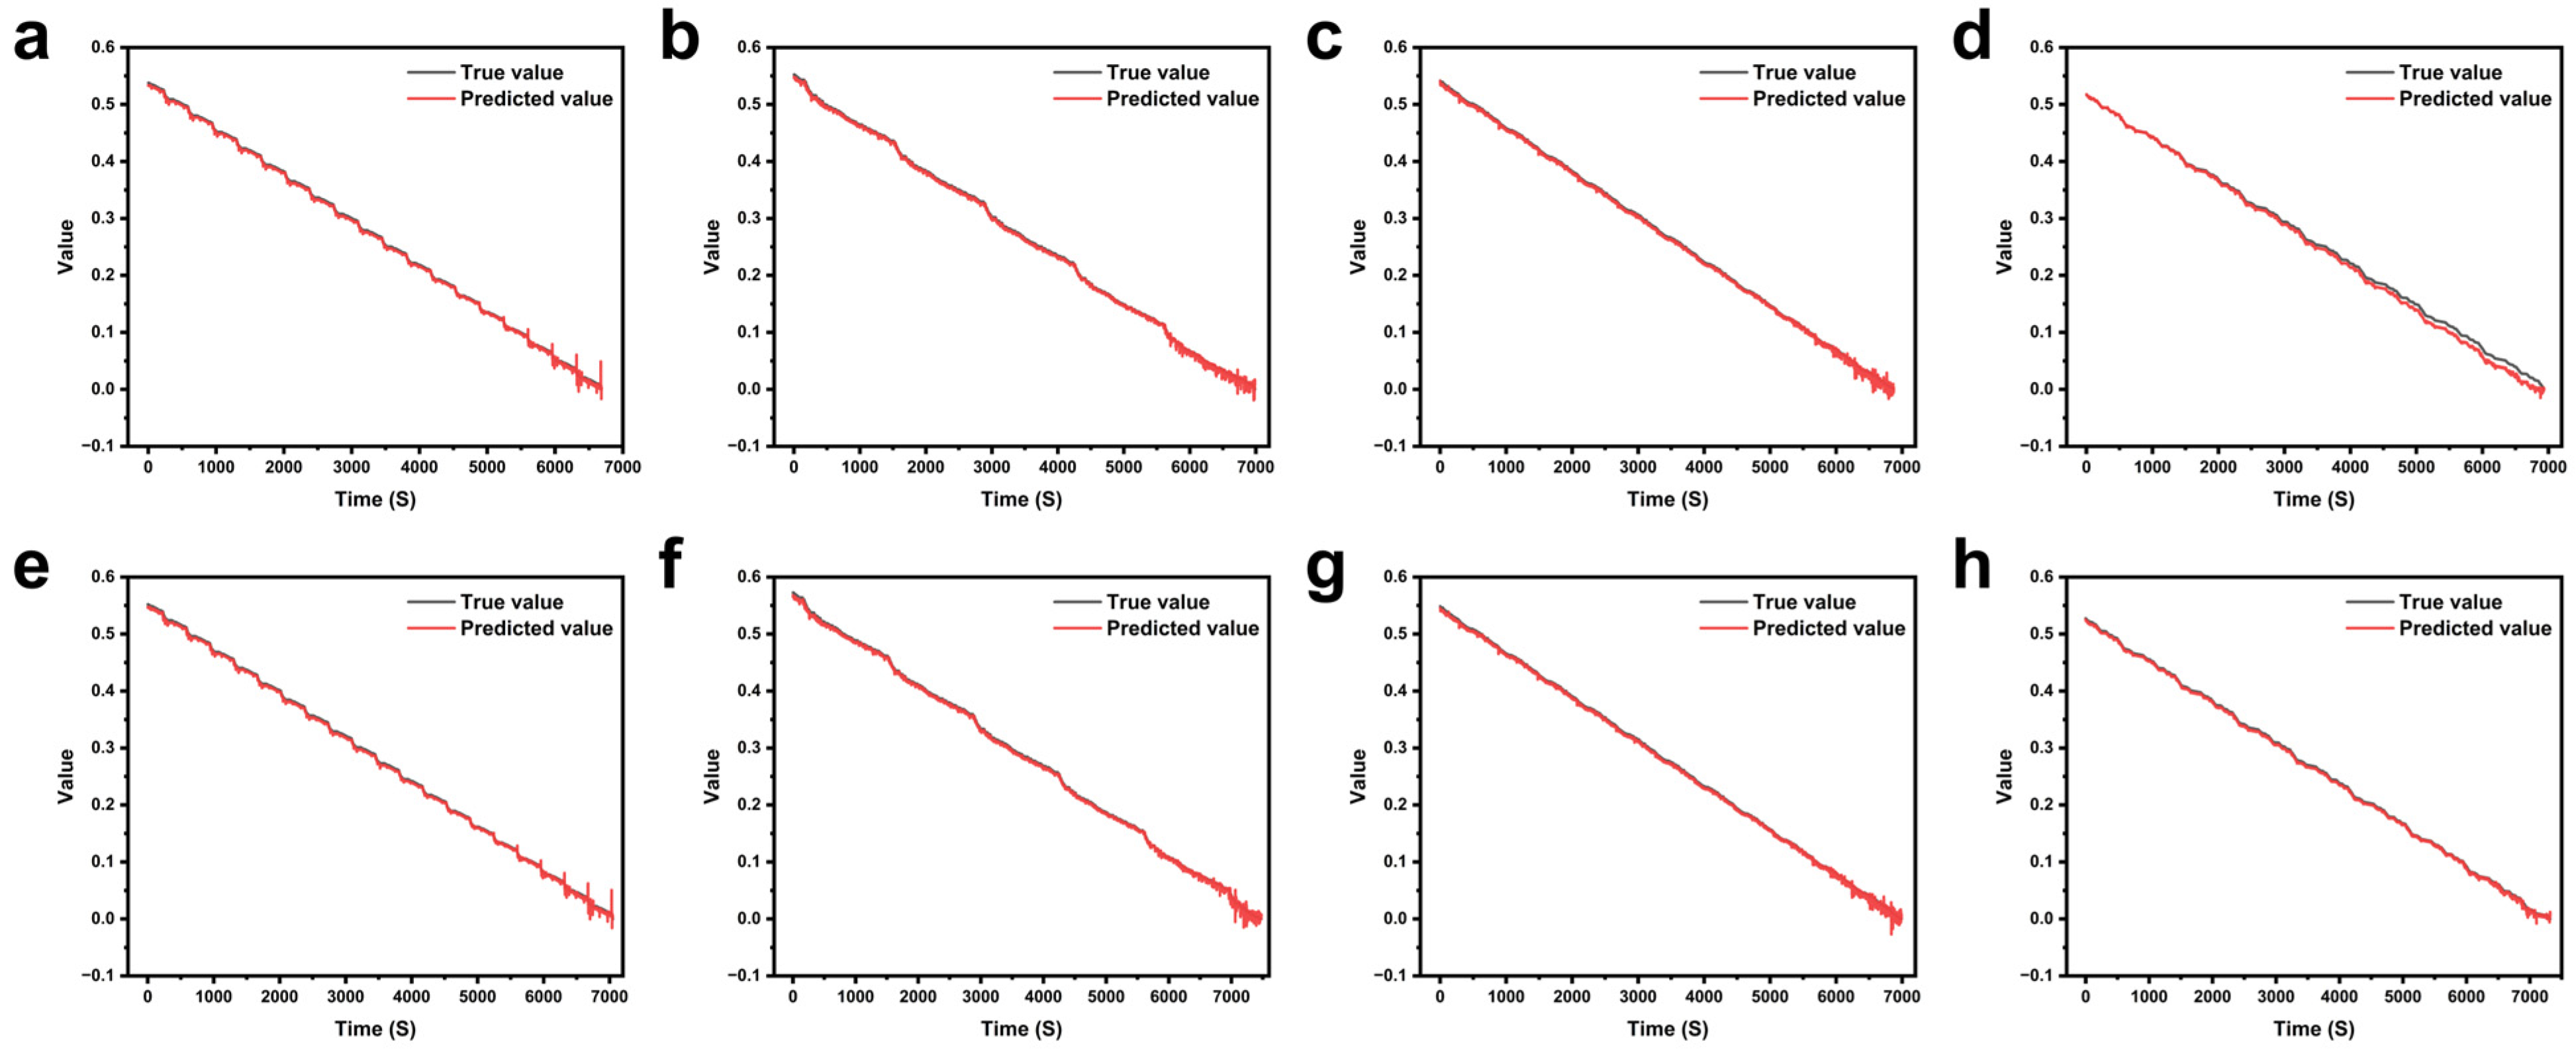
To provide an intuitive understanding of the model’s predictive performance, the predicted values and true values for all eight experimental scenarios were plotted, with time represented on the horizontal axis. The results are illustrated in Figure 5. As shown, the model demonstrates a strong overall fitting performance under all tested conditions, indicating that the SOC prediction accuracy at 50% capacity is high. However, a closer examination reveals tail-end fluctuations in the prediction results across all conditions. This phenomenon is attributed to the nonlinear instability of battery SOC behavior when the SOC falls below 20%, a known challenge in battery modeling. As a result, many prior studies adopt a 20% SOC cut-off as a standard threshold for reliable prediction and evaluation [29].
Furthermore, Table 7 presents the generalization performance of the TRNN-CTA framework under different operating conditions and temperatures at 80% SOC capacity. Overall, the R2 values for all scenarios are above 0.997, demonstrating that the model maintains strong predictive performance, with predictions closely aligned with actual values. Additionally, the RMSE and MAE metrics remain at low levels across different operating conditions and temperatures (RMSE < 1.1, MAE < 0.86), indicating that the TRNN-CTA framework achieves high accuracy in SOC estimation.
However, the model’s performance shows variation when comparing 80% SOC to 50% SOC under specific operating conditions. The model proposed in this study has an estimation error of 50% SOC that is three times or more than that at 80% SOC. This indicates that the different initial capacities have a certain impact on the model’s performance. The discussion Section 4 will provide a detailed explanation. The results indicate that the TRNN-CTA model performs relatively better in the DST and FUDS conditions, where higher R2 values and lower error rates are observed. This may be attributed to the greater similarity in temporal sequence patterns between these two conditions, as well as the model’s enhanced ability to capture battery capacity dynamics and voltage/current variations in these scenarios. In contrast, under US06 and BJDST conditions, the model exhibits slightly higher SOC prediction errors. For instance, in the BJDST condition, the MAE reached 0.851% at both temperatures. This suggests that, although the TRNN-CTA model maintains a reasonable level of accuracy under more complex and variable conditions with larger capacity, there is still room for improvement in further enhancing its robustness and adaptability.
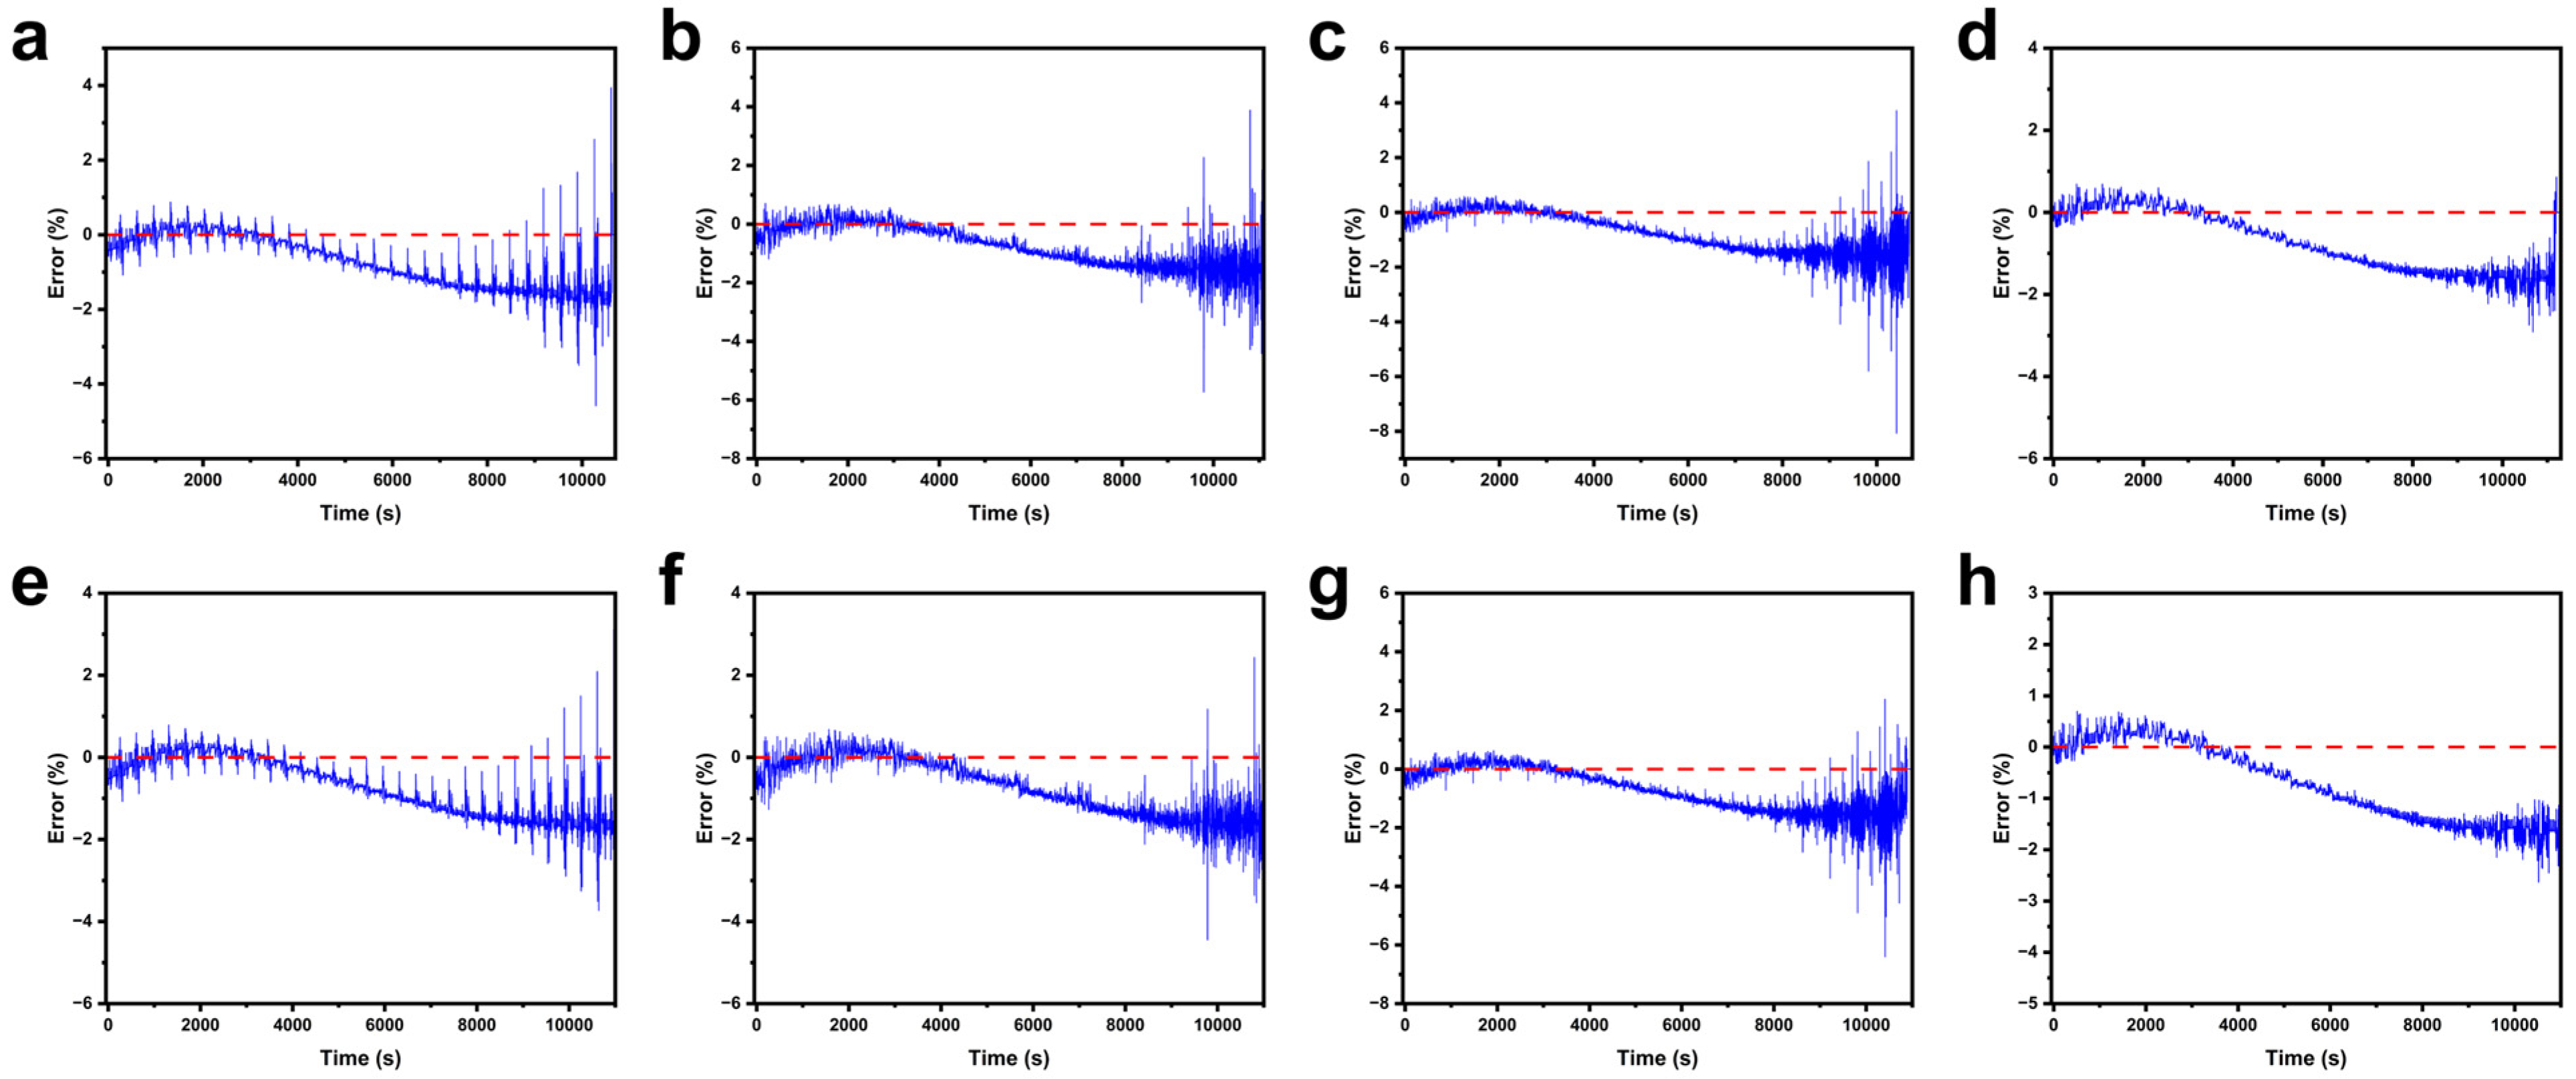
Figure 6 illustrates the discrepancies between the predicted SOC values and the actual values presented in Table 7. A consistent pattern can be observed across all scenarios: The model tends to overestimate the SOC during the initial period (approximately 0–3000 s), and underestimate it in the subsequent phase (3000–9000 s). Beyond 9000 s, the prediction errors exhibit increased fluctuation, with the error values initially remaining relatively stable before gradually increasing. This trend suggests that the model’s prediction accuracy decreases over extended time periods, possibly due to accumulated temporal drift or increased complexity in battery behavior at later stages of operation.

4. Discussion

This study proposed a dual-branch CTA (TRNN-CTA) model based on enhanced RNNs for estimating the SOC in batteries. By integrating a BiRNN branch structure with a multi-scale temporal attention mechanism, the model effectively addresses the limitations of traditional approaches in terms of generalization under real-time changes in operating conditions, temperature variations, and capacity differences. Experimental validation using the CALCE dataset demonstrated that under the US06 operating condition, the TRNN-CTA model significantly outperformed conventional models, achieving an R2 of 0.99987, an RMSE of 0.263%, and an MAE of 0.199%.
The feature expansion experiments revealed that introducing multi-dimensional temporal state variables enhanced the model’s ability to capture complex operational dynamics. Moreover, expanding the training data to cover a broader range (80% SOC) improved the model’s robustness across diverse test scenarios. Based on these findings, the model trained with a combination of six features and the “0°C-80% SOC” dataset was selected as the final configuration for subsequent studies. Ablation experiments further confirmed the effectiveness of the CTA mechanism. By modeling temporal contextual correlations, CTA alleviates the limitations of traditional RNNs in short-term sequence modeling. The integration of CTA with RNN architectures significantly enhances the model’s capacity to capture temporal dependencies across different real-world operating conditions by optimizing the temporal feature weights of various inputs. Finally, the superiority of the TRNN-CTA framework became evident. By combining dual-branch feature interaction with context-aware temporal attention, the model demonstrated stronger feature fusion capabilities in complex environments compared to the baseline TRNN architecture. This resulted in notable improvements in estimation accuracy, highlighting the advantages of complementary bidirectional temporal features and enhanced sensitivity to contextual time information within the TRNN-CTA architecture.
By comparing the generalization experimental results at 50% SOC (Table 6) and 80% SOC (Table 7), the following conclusions can be drawn: (1) SOC level significantly affects model performance: At 50% SOC, the TRNN-CTA framework demonstrates superior performance, with R2 values exceeding 0.999 and both RMSE and MAE below 0.385%. However, at 80% SOC, the R2 drops to a range of 0.99796 to 0.99821, and RMSE and MAE increase to 1.013–1.058% and 0.811–0.851%, respectively. This indicates that the model’s prediction difficulty increases and performance decreases in high SOC states, likely due to the battery’s more pronounced nonlinear dynamic behavior at these levels. (2) Model robustness across operating conditions and temperatures remains stable: Across different temperatures (25 °C and 45 °C) and the four operating conditions, the TRNN-CTA model maintains consistently low error fluctuations. This stability suggests that the model maintains a high level of adaptability to complex working environments and dynamic temperature variations. (3) Extreme operating conditions pose greater challenges: Errors under the more complex US06 and BJDST conditions are higher compared to DST and FUDS, particularly at high SOC levels. These scenarios involve highly dynamic or non-steady-state operating profiles, which still limit the model’s accuracy.
Additionally, Figure 6 reveals a key trend in the model’s performance prediction for batteries: an initial overestimation followed by a gradually worsening underestimation. We identify two primary contributing factors: First, during the training process, deep learning models learn statistical patterns inherent in the data. In the early discharge stage, as the SOC begins to decrease from a high initial level, the training dataset contains a large number of data points representing high SOC states. During model training, this leads to a tendency to generate predictions close to the average value of the high SOC region in the training set, resulting in a predicted decline rate slower than the actual rate and consequently causing overestimation. As discharge progresses, the model learns the average discharge rate from the data. When the actual SOC declines more rapidly, the model’s predictions, which are based on average conditions, fail to keep pace with the actual values, leading to underestimation. Second, battery behavior exhibits strong nonlinearity across different charging and discharging stages. The battery’s voltage curve typically shows nonlinear characteristics when fully charged or nearly depleted, while appearing relatively linear in the intermediate stage. Furthermore, when the battery is at a low charge level, its internal chemical state becomes more unstable, and its voltage becomes more sensitive to load, temperature, and aging conditions. This significant increase in behavioral complexity and randomness makes accurate prediction by the model more challenging.
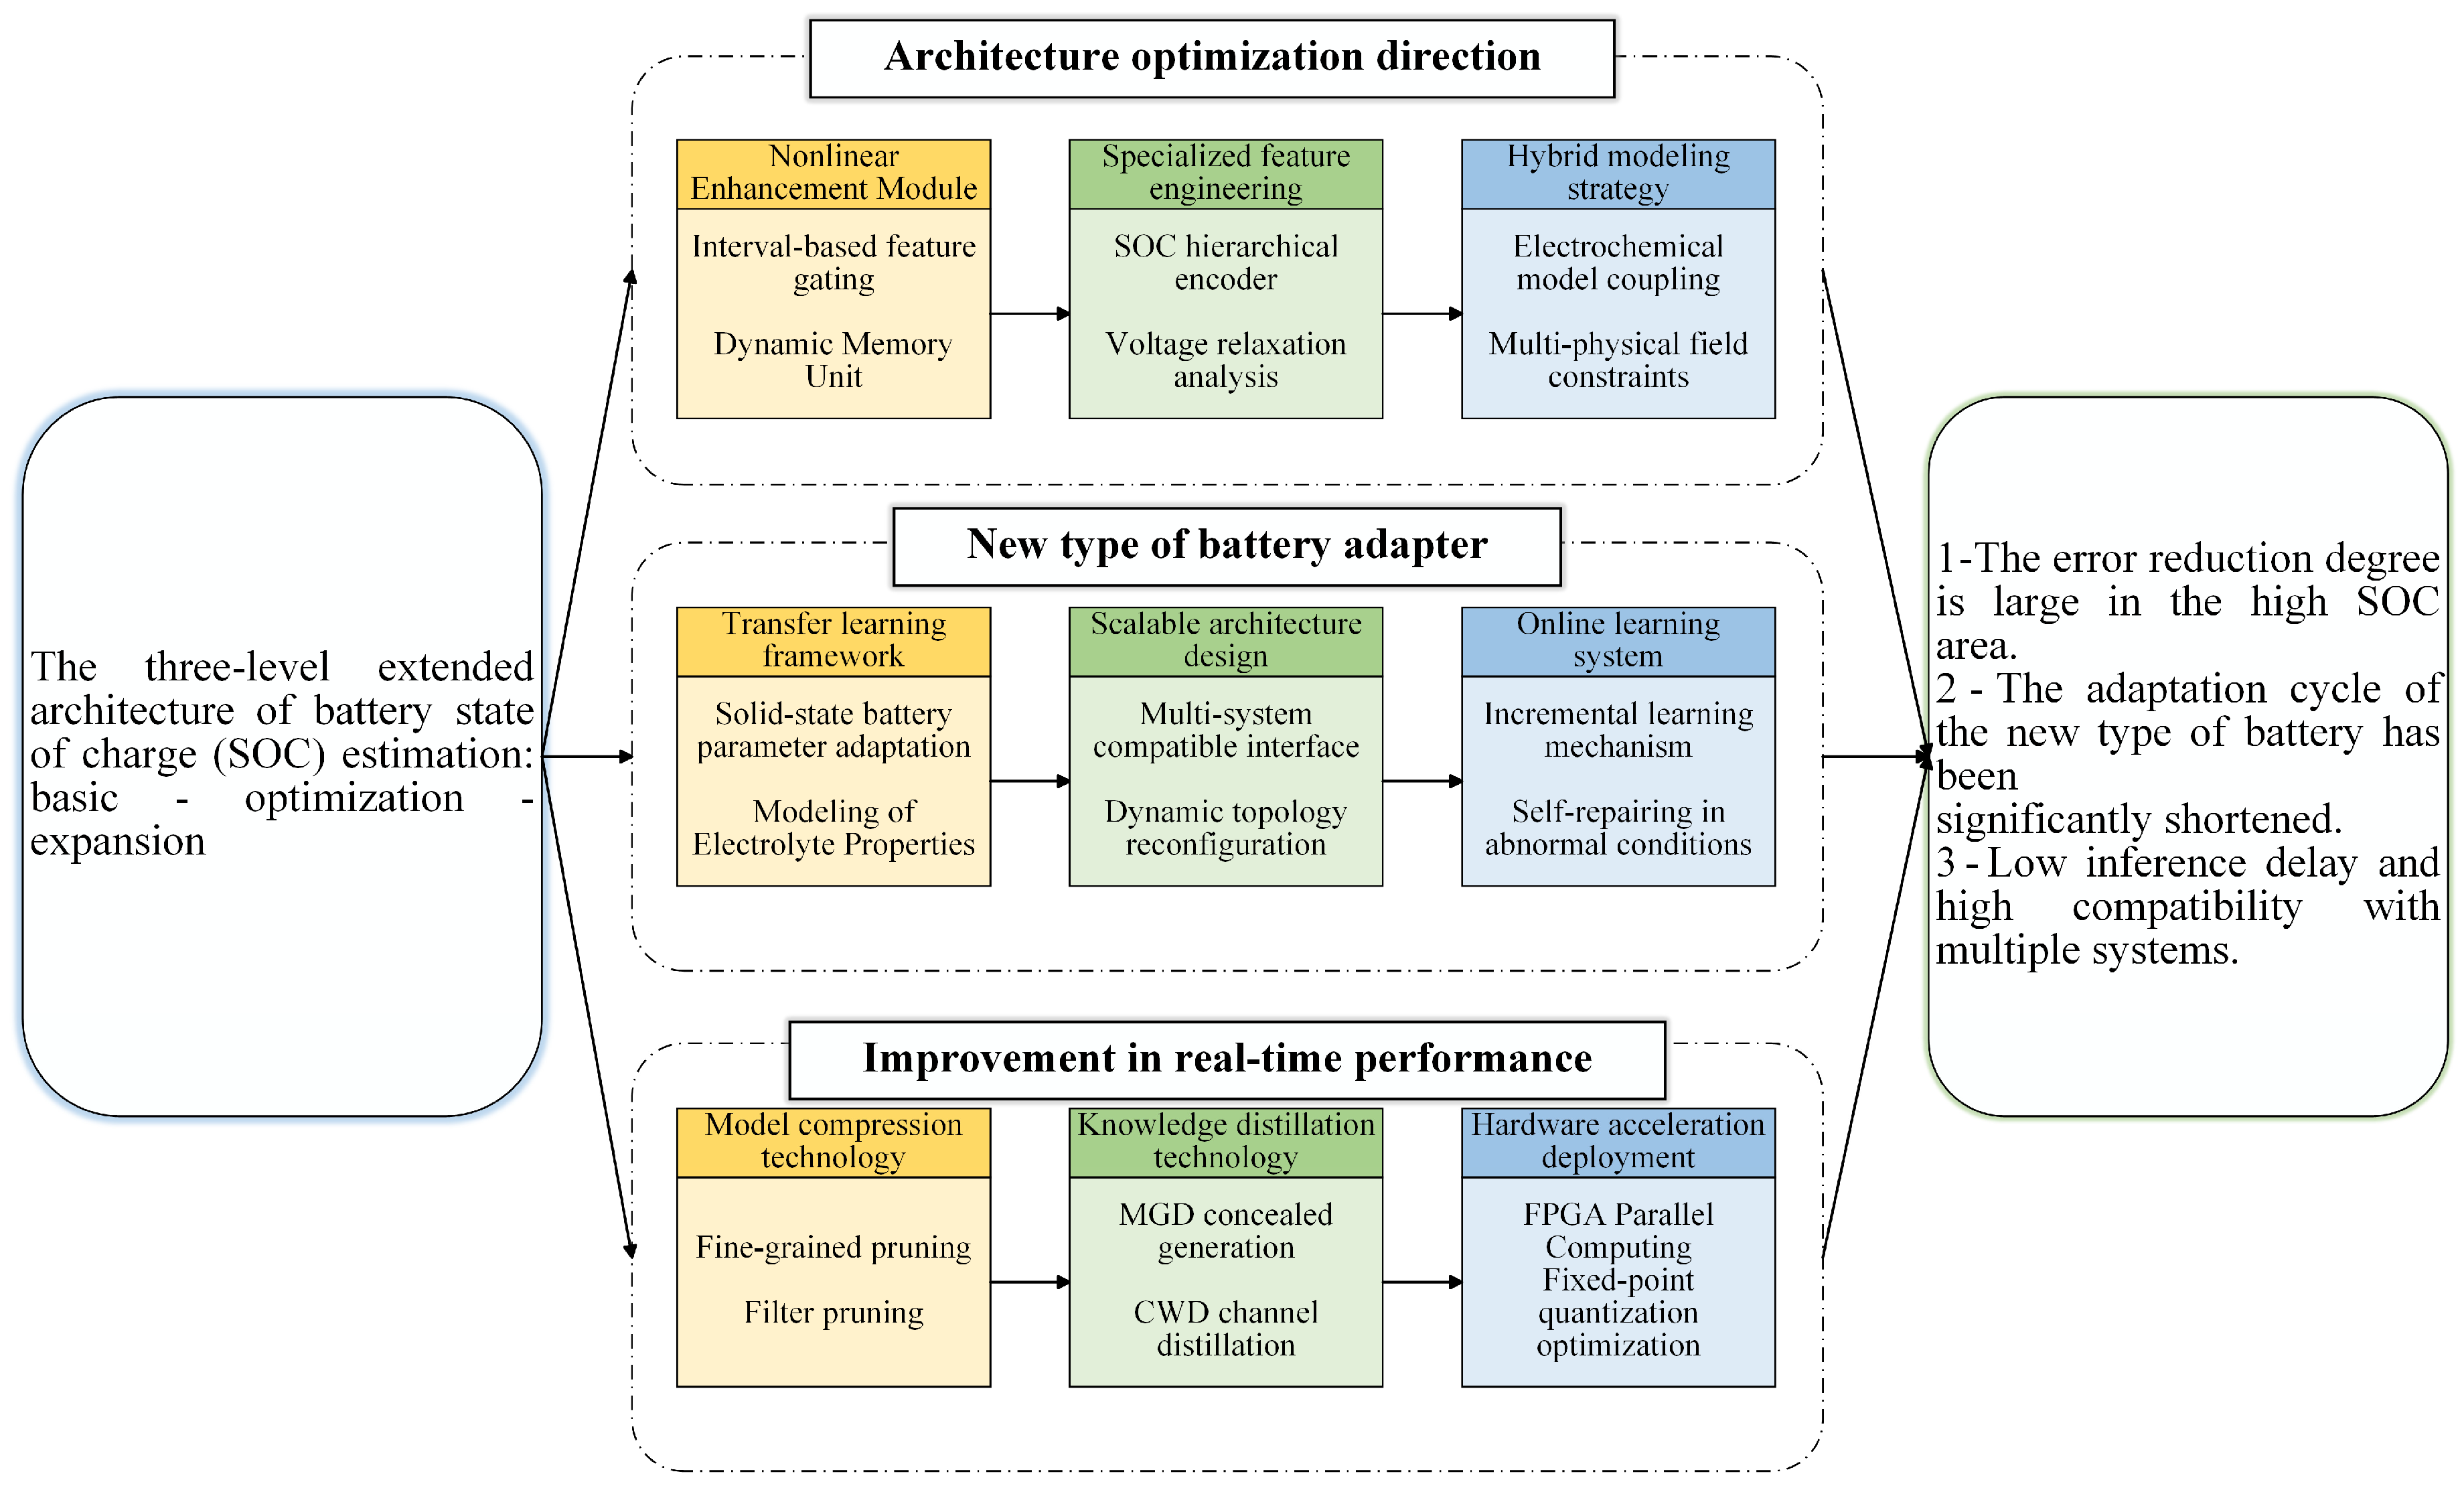
Although the TRNN-CTA framework exhibits excellent performance in terms of SOC estimation accuracy and generalization, there remains room for improvement when dealing with nonlinear dynamics at high SOC levels. Future work will focus on further optimizing the model architecture, incorporating specialized feature extraction modules or nonlinear enhancement mechanisms tailored to high SOC ranges. Moreover, a deeper investigation into the intrinsic behavior of batteries under high SOC conditions is needed to enhance estimation accuracy and model stability across the full SOC spectrum. To meet real-time application requirements, model compression and quantization strategies will also be explored, such as knowledge distillation and pruning techniques [30]. Specifically, fine-grained, vector-level, kernel-level, and filter-level pruning methods may be employed to reduce complexity [31,32]. For knowledge distillation, techniques such as masked generative distillation (MGD) and channel-wise distillation (CWD), which are effective in dense prediction tasks, can be considered [33,34]. Figure 7 summarizes the aspects that can be further explored in depth. At the data level, this study only used a single dataset to demonstrate the superiority of the model. However, the generalization ability under different types of battery chemical components, manufacturers, etc., has not been fully proven. Therefore, in the future, consideration will be given to using transfer learning and using the fine-tuning strategy to verify the generalization ability, and also considering combining the traditional model method with advanced data-driven methods to leverage the advantages of both and be able to estimate across datasets. These efforts aim to achieve the following goals: a substantial error reduction in high SOC regions, faster adaptation to new batteries, low inference latency, and broad compatibility across different systems and platforms.

5. Conclusions

This chapter addresses the challenge of insufficient accuracy in estimating the SOC of lithium-ion batteries by proposing a dual-branch CTA model (TRNN-CTA) based on an improved RNN. By integrating a BiRNN structure with a multi-scale CTA mechanism, the model effectively captures multi-scale temporal features. This architecture enhances the model’s generalization capability under real-time condition transitions, dynamic temperature changes, and varying battery capacities. The following conclusions can be drawn:
(1) Superior performance under dynamic conditions: Based on the CALCE dataset, the TRNN-CTA model achieved an R2 value of 0.99987 under the complex dynamic US06 condition, with RMSE and MAE as low as 0.263% and 0.199%, respectively. These results represent a 58–88% error reduction compared to traditional models. Compared with conventional approaches such as CNN, LSTM, and GRU, TRNN-CTA consistently yielded the lowest RMSE and MAE, validating the technical advantage of its dual-branch interaction and capacity for modeling both long- and short-term temporal dependencies.
(2) Effectiveness of feature expansion and architectural design: Feature expansion experiments showed that incorporating the moving average and rate of change of voltage (U) and current (I) significantly improved the model’s ability to capture nonlinear dynamics. With six feature inputs, the TRNN-CTA model’s accuracy was approximately 30% higher than the version using only two inputs. Ablation studies further confirmed the contributions of the dual-branch structure and the CTA mechanism: adding the CTA module alone reduced error by more than 30%, while the dual-branch architecture further reduced the error to 70–80% of the baseline.
(3) Robust generalization under varied conditions: Generalization experiments across different temperatures (25 °C and 45 °C), initial capacities, and driving conditions demonstrated that the TRNN-CTA model maintained an RMSE below 0.37% at 50% SOC and below 1.05% at 80% SOC. These results highlight the model’s robust performance and adaptability under complex and extreme scenarios. However, the model’s capacity to capture nonlinear dynamics at high SOC levels remains limited, posing an avenue for future improvement.
In conclusion, this chapter presents a highly accurate and generalizable SOC estimation framework for electric vehicles, effectively addressing the shortcomings of traditional methods in complex environments. The TRNN-CTA model offers a promising technical foundation for further enhancing SOC estimation precision under diverse operating conditions.

Author Contributions

Conceptualization, Y.W. and J.Z.; data curation, Y.W., F.Z. and X.C.; formal analysis, Y.W.; funding acquisition, J.Z.; investigation, J.Z. and F.Z.; methodology, Y.W., J.Z. and L.L.; project administration, J.Z.; software, L.L.; supervision, J.Z., P.L. and X.C.; validation, L.L., F.Z. and X.C.; visualization, Y.W. and P.L.; writing—review and editing, F.Z. and P.L. All authors have read and agreed to the published version of the manuscript.

Funding

This research was not funded by any grants. At the same time, we would like to express our sincere thanks to the relevant professors who provided guidance for this research.

Institutional Review Board Statement

Not applicable.

Informed Consent Statement

Not applicable.

Data Availability Statement

The code used in this study can be obtained from the corresponding authors. The dataset comes from https://calce.umd.edu/battery-data, accessed on 1 April 2010. The core code is located at https://github.com/MARCH442529/TRNN-CTA, accessed on 27 July 2025.

Acknowledgments

The authors want to thank the editor and anonymous reviewers for their valuable suggestions for improving this paper.

Conflicts of Interest

The authors declare no conflicts of interest.

References

  1. Zhou, L.; Li, S.; Jain, A.; Sun, G.; Chen, G.; Guo, D.; Kang, J.; Zhao, Y. Optimization of Thermal Non-Uniformity Challenges in Liquid-Cooled Lithium-Ion Battery Packs Using NSGA-II. J. Electrochem. Energy Convers. Storage 2024, 22, 041002. [Google Scholar] [CrossRef]
  2. Chan, H.T.J.; Rubeša-Zrim, J.; Pichler, F.; Salihi, A.; Mourad, A.; Šimić, I.; Časni, K.; Veas, E. Explainable Artificial Intelligence for State of Charge Estimation of Lithium-Ion Batteries. Appl. Sci. 2025, 15, 5078. [Google Scholar] [CrossRef]
  3. Lee, J.; Won, J. Enhanced Coulomb Counting Method for SoC and SoH Estimation Based on Coulombic Efficiency. IEEE Access 2023, 11, 15449–15459. [Google Scholar] [CrossRef]
  4. Mohammadi, F. Lithium-ion battery State-of-Charge estimation based on an improved Coulomb-Counting algorithm and uncertainty evaluation. J. Energy Storage 2022, 48, 104061. [Google Scholar] [CrossRef]
  5. Ko, Y.; Cho, K.; Kim, M.; Choi, W. A Novel Capacity Estimation Method for the Lithium Batteries Using the Enhanced Coulomb Counting Method With Kalman Filtering. IEEE Access 2022, 10, 38793–38801. [Google Scholar] [CrossRef]
  6. Wang, L.; Sun, J.; Cai, Y.; Lian, Y.; Jin, M.; Zhao, X.; Wang, R.; Chen, L.; Chen, J. A novel OCV curve reconstruction and update method of lithium-ion batteries at different temperatures based on cloud data. Energy 2023, 268, 126773. [Google Scholar] [CrossRef]
  7. Zhang, Q.; Cui, N.; Li, Y.; Duan, B.; Zhang, C. Fractional calculus based modeling of open circuit voltage of lithium-ion batteries for electric vehicles. J. Energy Storage 2020, 27, 100945. [Google Scholar] [CrossRef]
  8. Tong, L.; Li, Y.; Xu, Y.; Fang, J.; Wen, C.; Zheng, Y.; Zhang, H.; Peng, B.; Yang, F.; Zhang, J.; et al. A combined method for state-of-charge estimation for lithium-ion batteries based on IGWO-ASRCKF and ELM under various aging levels. J. Energy Storage 2025, 124, 116843. [Google Scholar] [CrossRef]
  9. Zhang, L.; Wang, L.; Zhang, J.; Wu, Q.; Jiang, L.; Shi, Y.; Lyu, L.; Cai, G. Fault diagnosis of energy storage batteries based on dual driving of data and models. J. Energy Storage 2025, 112, 115485. [Google Scholar] [CrossRef]
  10. Tian, J.; Xiong, R.; Shen, W.; Lu, J. State-of-charge estimation of LiFePO4 batteries in electric vehicles: A deep-learning enabled approach. Appl. Energy 2021, 291, 116812. [Google Scholar] [CrossRef]
  11. Shen, S.; Sadoughi, M.; Li, M.; Wang, Z.; Hu, C. Deep convolutional neural networks with ensemble learning and transfer learning for capacity estimation of lithium-ion batteries. Appl. Energy 2020, 260, 114296. [Google Scholar] [CrossRef]
  12. Wang, Q.; Ye, M.; Wei, M.; Lian, G.; Li, Y. Deep convolutional neural network based closed-loop SOC estimation for lithium-ion batteries in hierarchical scenarios. Energy 2023, 263, 125718. [Google Scholar] [CrossRef]
  13. Hu, C.; Cheng, F.; Zhao, Y.; Guo, S.; Ma, L. State of charge estimation for lithium-ion batteries based on data augmentation with generative adversarial network. J. Energy Storage 2024, 80, 110004. [Google Scholar] [CrossRef]
  14. Chunli, L.; Jianrui, S.; Kun, Z.; Kai, W. Bidirectional LSTM RNN for precise predict remaining useful life of supercapacitors. In Proceedings of the 2021 IEEE International Conference on Electrical Engineering and Mechatronics Technology (ICEEMT), Qingdao, China, 2–4 July 2021; pp. 56–59. [Google Scholar]
  15. Fan, X.; Zhang, W.; Zhang, C.; Chen, A.; An, F. SOC estimation of Li-ion battery using convolutional neural network with U-Net architecture. Energy 2022, 256, 124612. [Google Scholar] [CrossRef]
  16. Chen, J.; Zhang, Y.; Wu, J.; Cheng, W.; Zhu, Q. SOC estimation for lithium-ion battery using the LSTM-RNN with extended input and constrained output. Energy 2022, 262, 125375. [Google Scholar] [CrossRef]
  17. Jiao, M.; Wang, D.; Qiu, J. A GRU-RNN based momentum optimized algorithm for SOC estimation. J. Power Sources 2020, 459, 228051. [Google Scholar] [CrossRef]
  18. Hasib, S.A.; Islam, S.; Chakrabortty, R.K.; Ryan, M.J.; Saha, D.K.; Ahamed, H.; Moyeen, S.I.; Das, S.K.; Ali, F.; Islam, R.; et al. A comprehensive review of available battery datasets, RUL prediction approaches, and advanced battery management. IEEE Access 2021, 9, 86166–86193. [Google Scholar] [CrossRef]
  19. Avola, D.; Cascio, M.; Cinque, L.; Foresti, G.L.; Massaroni, C.; Rodola, E. 2-D skeleton-based action recognition via two-branch stacked LSTM-RNNs. IEEE Trans. Multimed. 2019, 22, 2481–2496. [Google Scholar] [CrossRef]
  20. Li, H.; Chen, C.; Wei, J.; Chen, Z.; Lei, G.; Wu, L. State of Health (SOH) Estimation of Lithium-Ion Batteries Based on ABC-BiGRU. Electronics 2024, 13, 1675. [Google Scholar] [CrossRef]
  21. Peng, Z.; Li, L.; Chang, C.; Tang, R.; Zheng, G.; Wan, M.; Jiang, J.; Zhou, S.; Tian, Z.; Liu, Z. Dual-Branch Luminance–Chrominance Attention Network for Hydraulic Concrete Image Enhancement. Appl. Sci. 2025, 15, 7762. [Google Scholar] [CrossRef]
  22. Wang, B.; Chen, Z.; Zhang, P.; Deng, Y.; Li, B. The Lithium-Ion Battery Temperature Field Prediction Model Based on CNN-Bi-LSTM-AM. Sustainability 2025, 17, 2125. [Google Scholar] [CrossRef]
  23. Wei, Z.; Sun, X.; Li, Y.; Liu, W.; Liu, C.; Lu, H. A Joint Estimation Method for the SOC and SOH of Lithium-Ion Batteries Based on AR-ECM and Data-Driven Model Fusion. Electronics 2025, 14, 1290. [Google Scholar] [CrossRef]
  24. Zheng, M.; Luo, X. Joint estimation of state of charge (SOC) and state of health (SOH) for lithium ion batteries using support vector machine (SVM), convolutional neural network (CNN) and long sort term memory network (LSTM) models. Int. J. Electrochem. Sci. 2024, 19, 100747. [Google Scholar] [CrossRef]
  25. Song, X.; Yang, F.; Wang, D.; Tsui, K.-L. Combined CNN-LSTM network for state-of-charge estimation of lithium-ion batteries. IEEE Access 2019, 7, 88894–88902. [Google Scholar] [CrossRef]
  26. Wu, L.; Wei, X.; Lin, C.; Huang, Z.; Fan, Y.; Liu, C.; Fang, S. Battery SOC estimation with physics-constrained BiLSTM under different external pressures and temperatures. J. Energy Storage 2025, 117, 116205. [Google Scholar] [CrossRef]
  27. Kumar, C.; Zhu, R.; Buticchi, G.; Liserre, M. Sizing and SOC management of a smart-transformer-based energy storage system. IEEE Trans. Ind. Electron. 2017, 65, 6709–6718. [Google Scholar] [CrossRef]
  28. Hu, C.; Cheng, F.; Ma, L.; Li, B. State of charge estimation for lithium-ion batteries based on TCN-LSTM neural networks. J. Electrochem. Soc. 2022, 169, 030544. [Google Scholar] [CrossRef]
  29. Zhang, Q.-Z.; Wang, X.-Y.; Yuan, H.-M. Estimation for SOC of Li-ion battery based on two-order RC temperature model. In Proceedings of the 2018 13th IEEE Conference on Industrial Electronics and Applications (ICIEA), Wuhan, China, 31 May–2 June 2018; pp. 2601–2606. [Google Scholar]
  30. Ge, Y.; Ma, J.; Sun, G. A structural pruning method for lithium-ion batteries remaining useful life prediction model with multi-head attention mechanism. J. Energy Storage 2024, 86, 111396. [Google Scholar] [CrossRef]
  31. Park, D.H.; Jang, H.-D.; Chang, D.E. Optimized Network Pruning Method for Li-ion Batteries State-of-charge Estimation on Robot Embedded System. J. Korea Robot. Soc. 2023, 18, 88–92. [Google Scholar] [CrossRef]
  32. Nampeera, J.; Recepoğlu, Y.K.; Yuksel, A. Valorization of olive tree pruning waste for potential utilization in lithium recovery from aqueous solutions. Biomass-Convers. Biorefin. 2024, 14, 4975–4987. [Google Scholar] [CrossRef]
  33. Liu, Q.; Gao, H.; Cao, A. Battery capacity correction method for electric vehicles based on knowledge distillation and multi-feature coupling. J. Power Sources 2025, 643, 236909. [Google Scholar] [CrossRef]
  34. Xu, J.; Qu, J. Capacity estimation of lithium-ion battery based on soft dynamic time warping, stratified random sampling and pruned residual neural networks. Eng. Appl. Artif. Intell. 2024, 138, 109278. [Google Scholar] [CrossRef]
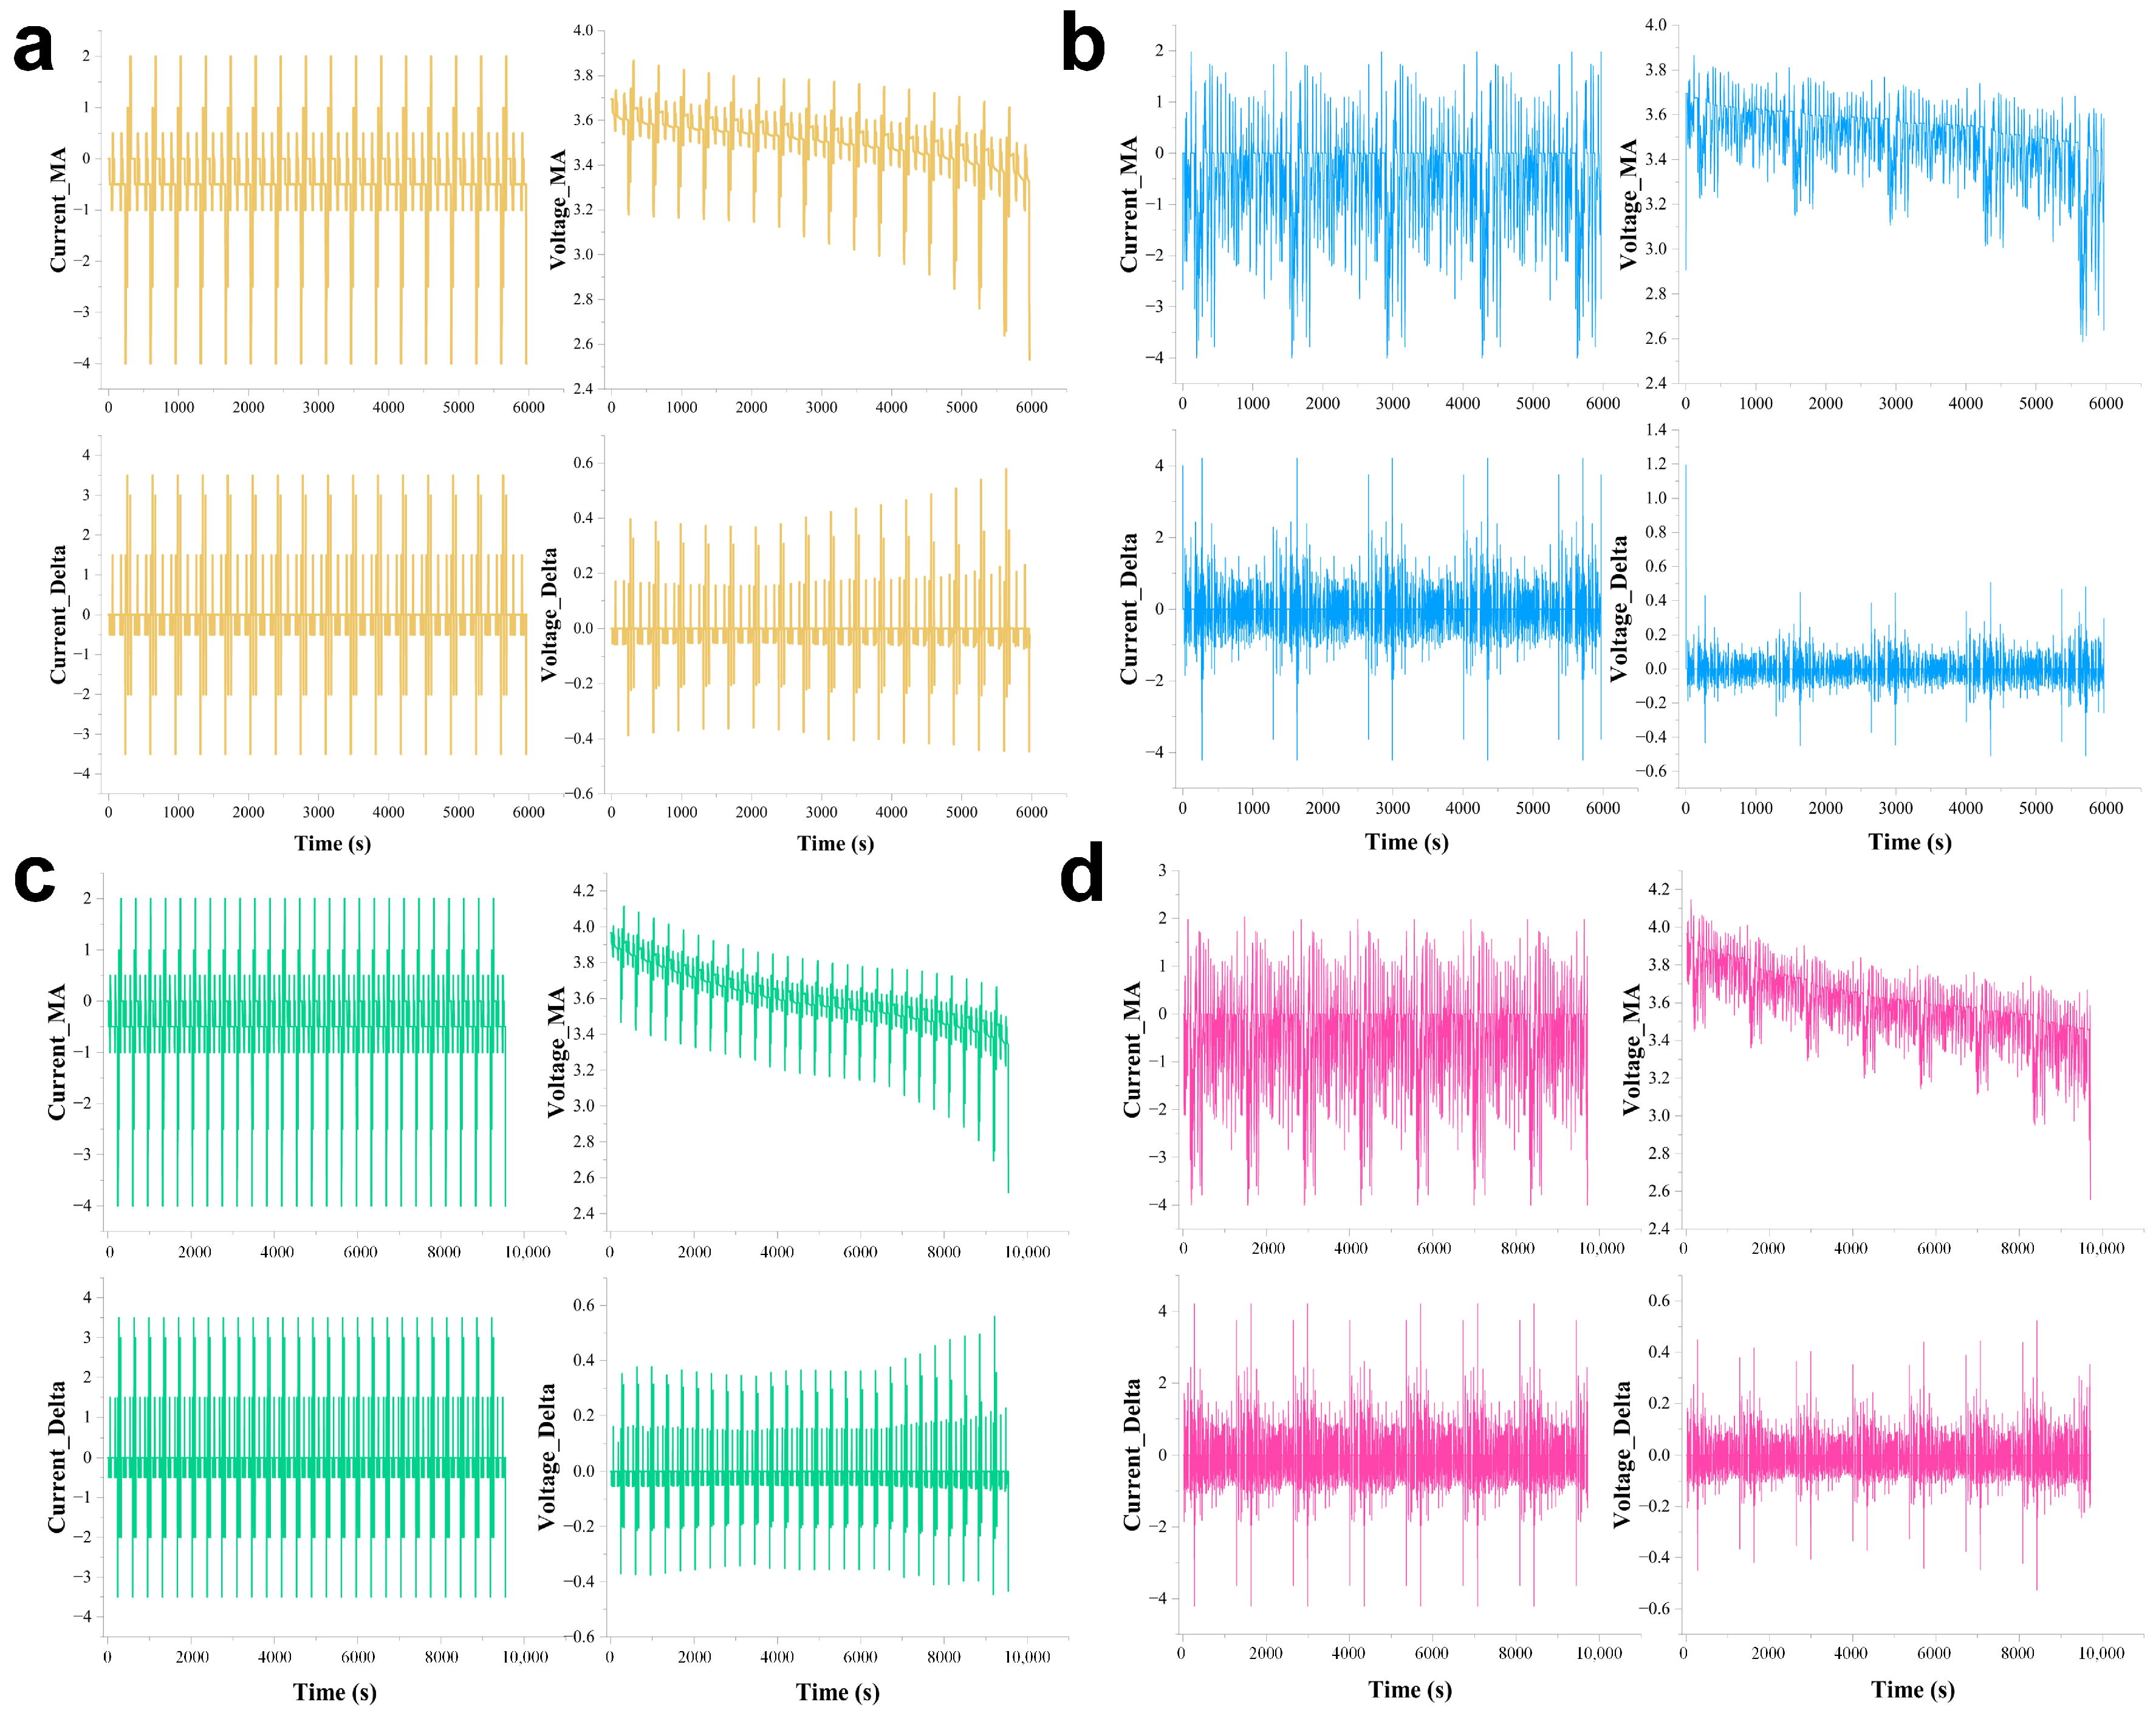
Figure 1. Data information of training set, (a): DST-50%SOC, (b): FUDS-50%SOC, (c): DST-80%SOC, (d): FUDS-80%SOC.
Applsci 15 09653 g001
Figure 2. TRNN-CTA network structure.
Applsci 15 09653 g002
Figure 3. Network structure of time attention mechanism.
Applsci 15 09653 g003
Figure 4. Comparison results of mainstream models.
Applsci 15 09653 g004
Figure 5. Visualization of SOC model prediction results. (a): DST-25C; (b): FUDS-25C; (c): US06-25C; (d): BJDST-25C; (e): DST-45C; (f): FUDS-45C; (g): US06-45C; (h): BJDST-45C.
Applsci 15 09653 g005
Figure 6. Error visualization of SOC model prediction results. (a): DST-25C; (b): FUDS-25C; (c): US06-25C; (d): BJDST-25C; (e): DST-445C; (f): FUDS-445C; (g): US06-45C; (h): BJDST-45C.
Applsci 15 09653 g006
Figure 7. Schematic diagram of the three-level expansion architecture of basic–optimization–expansion for battery charge state SOC estimation.
Applsci 15 09653 g007
Table 1. CALCE dataset information.
Operating Condition NameTemperature (°C)Initial/Maximum Capacity (%)Description of Operating Conditions
BJDST0, 25, 4550/0, 80/0The Beijing Dynamic Stress Test Condition is a dynamic condition that simulates the driving of a vehicle in the Beijing area.
FUDS0, 25, 4550/0, 80/0The US Federal Urban Driving Condition is used to simulate the driving condition on urban roads.
US060, 25, 4550/0, 80/0One of the conditions used in the testing standards of the US Environmental Protection Agency, used to supplement and reflect the motivating driving condition.
DST0, 25, 4550/0, 80/0The Dynamic Stress Test Condition is used to evaluate the comprehensive performance of the battery under actual usage conditions.
Table 2. Dataset variable information.
Parameter TypeNameCalculation Formula
Input parametersVoltage, U-
Current, I-
Voltage_MA, VMA V M A i = U i + U i 1 + U i n + 1 n
Current_MA, CMA C M A i = I i + I i 1 + I i n + 1 n
Voltage_Delta, VD V D i = U i U i 1
Current_Delta, CD C D i = I i I i 1
Output parametersState of Charge, SOC-
Table 3. Model evaluation results before and after feature expansion.
FeatureTraining SetTesting SetR2RMSE (%) ↓MAE (%) ↓
Raw
(2 features)
DST+FUDS
(0 °C-50%soc)
BJDST0.998161.1670.878
US060.995881.4824.360
DST+FUDS
(0 °C-80%soc)
BJDST0.997621.1280.828
US060.999830.2990.216
Raw
(6 features)
DST+FUDS
(0 °C-50%soc)
BJDST0.997981.1922.182
US060.996931.2740.951
DST+FUDS
(0 °C-80%soc)
BJDST0.999840.2870.219
US060.999870.2630.199
Table 4. Results of ablation experiment.
Model TypeModelR2RMSE (%) ↓MAE (%) ↓
Single branchBiLSTM0.992872.0622.392
BiGRU0.993851.9052.099
BiLSTM-CTA0.995781.5911.800
BiGRU-CTA0.996551.2571.658
Double branchBiLSTM-BiGRU0.996211.2261.726
BiLSTM-BiLSTM0.994811.4951.979
BiGRU-BiGRU0.992441.8802.253
Ours (TRNN-CTA)BiGRU-BiGRU-CTA0.998350.8201.024
BiLSTM-BiLSTM-CTA0.998370.8881.138
BiLSTM-BiGRU-CTA0.999870.2630.199
Table 5. Comparison experiment of mainstream models.
ModelR2RMSE (%) ↓MAE (%) ↓
CNN0.987513.6173.792
LSTM0.991372.2012.634
BiLSTM0.992872.0622.392
GRU0.985973.6414.162
BiGRU0.993851.9052.099
Transformer0.991632.2562.601
TCN0.999060.6370.873
TRNN-CTA (Ours)0.999870.2630.199
Table 6. The 50% SOC capacity model generalization results under different working conditions.
Operating ConditionsTemperature (°C)R2RMSE (%) ↓MAE (%) ↓
DST250.999480.3540.323
450.999470.3660.335
FUDS250.999420.3750.330
450.999440.3850.336
US06250.999380.3720.327
450.999400.3730.329
BJDST250.999510.3480.316
450.999530.3290.314
Table 7. The 80% SOC capacity model generalization results under different working conditions.
Operating ConditionTemperature (°C)R 2RMSE (%) ↓MAE (%) ↓
DST250.998171.0130.811
450.998211.0210.821
FUDS250.998151.0230.815
450.998171.0230.813
US06250.998001.0580.830
450.998061.0470.826
BJDST250.997961.0500.851
450.998011.0460.851
Disclaimer/Publisher’s Note: The statements, opinions and data contained in all publications are solely those of the individual author(s) and contributor(s) and not of MDPI and/or the editor(s). MDPI and/or the editor(s) disclaim responsibility for any injury to people or property resulting from any ideas, methods, instructions or products referred to in the content.