Article

Development and Analysis of a Fast-Charge EV-Charging Station Model for Power Quality Assessment in Distribution Systems

by
Pathomthat Chiradeja
1,
Suntiti Yoomak
2,*,
Panu Srisuksai
3,
Jittiphong Klomjit
4,
Atthapol Ngaopitakkul
2 and
Santipont Ananwattanaporn
5
1
Faculty of Engineering, Srinakharinwirot University, Bangkok 10110, Thailand
2
School of Engineering, King Mongkut’s Institute of Technology Ladkrabang, Bangkok 10520, Thailand
3
Substation Testing and Commissioning Division, Provincial Electricity Authority, Bangkok 10900, Thailand
4
Provincial Electricity Authority Area 2 (North), Phitsanulok 65000, Thailand
5
School of International and Interdisciplinary Engineering, School of Engineering, King Mongkut’s Institute of Technology Ladkrabang, Bangkok 10520, Thailand
*
Author to whom correspondence should be addressed.
Appl. Sci. 2025, 15(17), 9645; https://doi.org/10.3390/app15179645
Submission received: 31 July 2025 / Revised: 26 August 2025 / Accepted: 28 August 2025 / Published: 2 September 2025
(This article belongs to the Topic Innovation, Communication and Engineering)

Abstract

With the rapid rise in electric vehicle (EV) adoption, the deployment of EV charging infrastructure—particularly fast-charging stations—has expanded significantly to meet growing energy demands. While fast charging offers the advantage of reduced charging time and improved user convenience, it imposes considerable stress on existing power distribution systems due to its high power and current requirements. This study investigated the impact of EV fast charging on power quality within Thailand’s distribution network, emphasizing compliance with accepted standards such as IEEE Std 519-2014. We developed a control-oriented EV-charging station model in power systems computer-aided design and electromagnetic transients, including DC (PSCAD/EMTDC), which integrates grid-side vector control with DC fast-charging (CC/CV) behavior. Active/reactive power setpoints were mapped onto d q current references via Park’s transformation and regulated by proportional integral (PI) controllers with sinusoidal pulse-width modulation (SPWM) to command the voltage source converter (VSC) switches. The model enabled dynamic studies across battery state-of-charge and staggered charging schedules while monitoring voltage, current, and total harmonic distortion (THD) at both transformer sides, charger AC terminals, and DC adapters. Across all scenarios, the developed control achieved grid-current THDi of <5% and voltage THD of <1.5%, thereby meeting IEEE 519-2014 limits. These quantitative results show that the proposed, implementation-ready approach maintains acceptable power quality under diverse fast-charging patterns and provides actionable guidance for planning and scaling EV fast-charging infrastructure in Thailand’s urban networks.

1. Introduction

The global adoption of electric vehicles (EVs) has grown steadily over the past decade, driven by environmental concerns, advancements in battery technology, and supportive government policies. According to the International Energy Agency, EV sales exceeded 10 million units in 2024 and are projected to reach 17 million by the end of 2025, emphasizing an accelerating shift toward electric vehicles worldwide [1]. In Thailand, this growing EV penetration necessitates robust and widespread charging infrastructure, particularly DC fast-charging stations, to meet increasing demand and enable efficient vehicle utilization [2]. However, the large-scale integration of DC fast chargers poses significant technical challenges to existing distribution grids. High-power EV charging involves substantial currents and rapid electrical energy transfers, leading to potential issues such as voltage fluctuations, increased harmonic distortion, transformer overload, and equipment degradation. Thus, detailed assessment and effective mitigation strategies are essential for ensuring reliable power distribution and sustainable expansion of EV infrastructure.
Electric vehicle (EV)-charging systems in Thailand are governed by a coordinated regulatory framework involving several key agencies. The Thai Industrial Standards Institute (TISI) is responsible for establishing national standards for EV-related equipment, while the Metropolitan Electricity Authority (MEA) and Provincial Electricity Authority (PEA) provide technical guidelines for system installation and connection. The Energy Regulatory Commission (ERC) oversees compliance with power quality and safety standards, referencing IEEE Std 519-2014 [3], which stipulates that total harmonic distortion must not exceed 5%. As summarized in Table 1, this multi-agency framework ensures safe operation, interoperability with the power grid, and the reliability of EV-charging systems for users and utility networks alike.
To enable the successful integration and sustainable expansion of electric vehicle (EV)-charging infrastructure within power distribution systems, this paper presents a comprehensive simulation model of a fast-charging EV station. The objective is to investigate the power quality and electrical impacts associated with various charging scenarios. This study focuses on the dynamic behavior of EV charging loads and their interaction with key components of the distribution network, particularly under high-power, short-duration charging conditions typically found in DC fast-charging environments. The proposed model incorporates multiple fast-charging units operating under different load profiles, battery states of charge (SOCs), and connection schedules to reflect realistic user behavior. The system is simulated under time-varying load conditions, allowing for detailed analysis of transient and steady-state electrical phenomena.

1.1. Related EV Charging Literature Review

Numerous studies have investigated the multifaceted impacts of electric vehicle (EV) charging on power systems. Recent research highlights several critical dimensions essential for supporting the widespread adoption of EVs. These include analyses of user charging behavior and EV adoption trends [11,12,13,14,15,16,17,18]. In parallel, a significant body of work has focused on evaluating the impact of EV charging on distribution networks, along with the development of advanced mitigation techniques [19,20,21,22,23,24,25,26,27,28,29,30,31,32]. Moreover, smart-charging strategies and coordinated control mechanisms have been proposed to improve charging efficiency and reduce grid stress [33,34,35,36,37,38,39,40,41]. Power quality concerns, particularly related to harmonic distortion, have also been addressed through filtering and compensation methods aimed at maintaining system stability and compliance with standards [42,43,44,45,46,47,48,49,50,51,52]. Together, these research efforts underscore the importance of a holistic understanding of technical, economic, and behavioral factors in order to achieve effective and sustainable integration of EV-charging infrastructure into modern power distribution systems.
EV adoption is increasingly influenced by socioeconomic and behavioral factors, especially in urban contexts. Studies have shown that higher-income and suburban households are more likely to adopt EVs due to their financial capacity and access to home charging, raising concerns about equity in electromobility access [11]. Behavioral disparities become even more pronounced during societal disruptions. For instance, ref. [12] presents a behavioral model illustrating how high EV penetration during crises (e.g., pandemics or extreme weather) can cause uneven energy demand due to mismatches between vehicle ownership and charging infrastructure availability. Incorporating real-world user behavior into charging infrastructure planning is, thus, essential. Ref. [13] reviews demand distribution models and advocates for behavioral integration in siting and sizing strategies. Urban infrastructure accessibility remains a key adoption driver, as demonstrated in Bangkok, where convenient and reliable charging stations boost user confidence, while their absence amplifies range anxiety [14].
From a technical perspective, integrating behavioral data enhances forecasting and system design. Ref. [15] used bottom–up load simulations, revealing that full EV adoption could increase household electricity demand by 19% and peak loads by 35%, although these can be mitigated with simple rule-based charging. Complementary research incorporates environmental and mobility behaviors to improve demand prediction and charging infrastructure optimization [16]. Lastly, a geographically detailed model [17] forecasts the EV energy demand through to 2050, incorporating variables such as charging speed, location preferences, and vehicle type, providing critical insights for voltage stability and capacity planning in long-term EV infrastructure development. Additionally, co-locating public and fleet EV-charging stations in high-traffic areas increases infrastructure utilization, cuts average wait times, and lowers construction costs [18].
Blockchain-enabled peer-to-peer (P2P) energy trading is emerging as a decentralized, transparent framework for EV-charging transactions [19]. Grid capacity studies show that up to 40% EV penetration is feasible without breaching voltage or reliability limits; beyond this, grid stress increases significantly [20]. To manage demand, data-driven demand response and vehicle-to-grid (V2G) strategies help reduce peak loads and enhance system flexibility [21,22]. Scheduling V2G charging can further alleviate curtailment and reduce infrastructure costs [23]. System-wide resilience is strengthened by optimizing V2G across voltage levels and adapting control strategies to various grid types [24,25]. Advanced control methods—such as hybrid real-time frameworks using algorithms like Dragonfly and Deep Q Networks—enable dynamic EV load balancing based on grid conditions [26]. Heavy-duty EV charging requires smart integration of PV, storage, and smart charging to minimize costs while maintaining grid stability [27]. In rural regions, location-specific risks like undervoltage and transformer overloads demand tailored mitigation [28]. Transportation-integrated energy models reveal how factors like market penetration and charger density affect grid load, emissions, and charging delays [29]. Time-of-use (TOU) tariffs effectively shift charging to off-peak periods, improving asset management and reducing stress on transformers [30]. Decentralized control strategies using energy-monitoring units (EMU/EMUC) can manage up to 95% of local EV demand with minimal backup support [31]. Lastly, stochastic modeling using Monte Carlo methods highlights the importance of coordinated EV charging to avoid grid instability, especially in capacity-limited areas [32].
Effective management of EV-charging loads is vital for maintaining stability and efficiency in distribution networks. Smart energy management systems (SEMSs), intelligent control frameworks, and decentralized coordination have emerged as key solutions. At the residential level, integrating SEMS with EVs, heat pumps, and rooftop PVs can yield annual energy savings of EUR 900–EUR 1200 [33], while flexible user charging behavior can reduce electricity procurement costs (EPC) by up to 50% [34]. Advanced control algorithms further enhance system performance. A hierarchical mixed-integer programming model aligned with IEC standards has been validated to reduce peak loads and prevent grid overloads [35]. For dynamic load forecasting, the EGAT-LSTM model combines spatial–temporal dependencies with line impedance to improve accuracy in large-scale networks [36].
Grid congestion and infrastructure stress are mitigated through coordinated strategies. Smart routing systems [37] and highway-based load-balancing models [38] help optimize station usage and lower infrastructure costs. Multi-objective optimization frameworks balance the goals of distribution network operators and EV users, reducing power losses and operational costs [39]. Decentralized strategies are increasingly important in managing diverse EV clusters. Soft open point (SOP)-based coordination, with privacy-preserving protocols, supports secure and autonomous charging decisions [40]. Lastly, hierarchical control methods integrating day-ahead scheduling and real-time control improve PV hosting capacity and voltage regulation in unbalanced low-voltage networks [41].
As EV adoption intensifies, maintaining power quality and grid reliability becomes critical, especially with the rapid deployment of fast and ultrafast charging stations. High charging power introduces harmonic distortion and transformer stress, leading to overheating and reduced equipment lifespan [42,43]. Probabilistic models such as Monte Carlo simulations help quantify risks like overloading and voltage violations under varying user behaviors and EV penetration levels [44,45]. To support strategic planning, composite indicators integrating load, harmonic distortion, and short-circuit capacity have been proposed for assessing grid hosting capacity [46]. Fast-charging infrastructure, particularly in areas with weak grids, presents technical and regulatory challenges. These include elevated total harmonic distortion (THD), thermal overload, and operational instability due to power electronic converters [47,48,49]. Mitigation technologies such as solid-state transformers (SSTs) and active compensation harmonic reduction (ACHR) filters offer precise voltage control and effective harmonic suppression [50]. Furthermore, advanced planning tools—including stochastic optimization and hybrid algorithms like DOA-CHGNN—enable optimal siting, capacity sizing, and forecasting, balancing grid stability, economic feasibility, and service quality [51,52]. In our study, an electric vehicle (EV)-charging simulation model was developed to conduct a comprehensive engineering analysis of the impact of EV charging on power quality—particularly harmonic distortion—within a distribution system representative of Thailand’s electrical grid. In addition, an EV-charging station model using vector control, where active and reactive power setpoints (P and Q) were transformed into dq-axis reference currents via Park’s transformation, was developed. This study also investigated various EV-charging behaviors under different conditions, including staggered charging times and variations in battery capacity or state of charge (SoC). These factors were examined for their influence on key system components, such as the distribution transformer, charging units, and charging adapters.
Furthermore, the comprehensive research reviewed demonstrates that effective electric vehicle (EV) integration relies on the synergy of technical innovation, behavioral insights, and grid resilience, as detailed in Table 2. The key findings highlight the importance of charging strategies, real-time control frameworks, and coordinated infrastructure planning to manage load variability and address power quality issues.

1.2. Contribution

The key findings of this research underscore the critical importance of assessing the impacts of increased electric vehicle (EV) penetration—particularly fast charging—on power quality and the operational stability of distribution networks. As fast-charging infrastructure scales up to meet growing EV demand, diverse user charging behaviors introduce dynamic and unpredictable load conditions, which can adversely affect voltage stability, harmonic distortion, and the performance of grid-connected components.
In summary, this research aimed to contribute to the development of sustainable and resilient transportation infrastructure in Thailand and beyond. The significant contributions of this study are summarized as follows:
  • Assessment of grid impact and power quality standards in a real Thai distribution system. This work investigated the influence of EV fast charging on the electrical distribution network using a Thailand case study parameterized with utility-representative data (e.g., 24-kV MV feeders and 24/0.4-kV Δ–Y transformers). Compliance with accepted power quality standards—particularly harmonic distortion per IEEE Std 519-2014—was evaluated, providing evidence-based guidance for the strategic expansion of EV fast-charging stations in Thailand.
  • Development of a control-oriented EV fast-charging station model built from standard PSCAD/EMTDC components and calibrated with Thai network parameters. The station model uses library VSC/transformer/feeder and DC–DC buck elements calibrated to local (MEA-consistent) parameters. Grid-side vector control maps to dq-axis current references are tracked by proportional–integral (PI) loops and synthesized via sinusoidal pulse-width modulation (SPWM) for the voltage-source converter (VSC), while the DC side enforces CC–CV charging.
  • Model validation and system-wide power-quality evaluation. Validation was performed through PSCAD/EMTDC simulations spanning a matrix of battery state-of-charge (SoC) levels and staggered/simultaneous charging schedules, together with a multi-node assessment at the transformer secondary, charger AC terminals, and DC adapters. Monitored quantities include active power, current, voltage, and THDi/THDv to quantify disturbances and identify potential reliability constraints. Across all cases, the system maintains THDi ≤ 5% and THDv ≤ 1.5%—even under concurrent multi-EV sessions—confirming compliance with IEEE Std 519-2014 and practical deployability.

1.3. Organization

The rest of this paper is structured as follows. Section 2 presents the electric vehicle-charging station model, including the configuration of the EV-charging infrastructure, the characteristics of the EV load model, and the control strategies applied for fast-charging operation. Section 3 discusses the simulation results and provides an in-depth analysis of the power quality and electrical impacts associated with various EV-charging scenarios. Section 4 discusses a comparative analysis of existing EV fast-charging grid-interface solutions versus this work. Finally, the conclusions and key findings are summarized in Section 5.

2. Electric Vehicle-Charging Station

2.1. Mathematical Charger Model

An electric vehicle charger employs a three-phase voltage source converter (VSC) based on IGBT modules to convert the utility AC supply to a regulated DC bus. On the AC side, each phase of the converter is interfaced to the grid through a series R L branch that represents the aggregate line/transformer impedance and the input filter. The DC side includes a link capacitor C that smooths the DC-bus voltage and reduces ripple. Parasitic losses of the reactor and capacitor may be represented by R L and R C , respectively. Because the converter operates by high-frequency switching, transient responses of voltages and currents—such as overshoots and undershoots—can arise, depending on the R L C parameters and the control action. Proper selection of these parameters and the control strategy is, therefore, essential to meet power-quality constraints.

2.1.1. AC-Side Model of the Three-Phase Voltage-Source Converter

Figure 1 defines the phase variables: the three-phase grid (or source/load) voltages e a , e b , e c ; the line currents i a , i b , i c ; and the converter phase voltages v a , v b , v c at the AC terminals of the VSC.
The balanced three-phase source is described by
e a = E c o s ( ω t )
e b = E c o s ω t 2 π 3
e c = E c o s ( ω t 4 π 3 )
where E is the peak phase voltage, and ω = 2 π f is the angular frequency.
Applying KVL to each phase of the AC interface yields the governing circuit equations:
e a = R i a + L d i a d t + v a
e b = R i b + L d i b d t + v b
e c = R i c + L d i c d t + v c
To reduce the analytical complexity and to design controllers in a decoupled fashion, the three-phase variables in the stationary a b c frame are mapped first onto the stationary α β frame (Clarke transformation) and then onto the synchronously rotating d q frame (Park transformation), as illustrated in Figure 2.
Assuming a balanced three-phase source with peak phase voltage E and electrical angular frequency ω = 2 π f , and neglecting any zero-sequence component, applying the Clarke transformation to Equations (1)–(3) produces the stationary α β components.
e α   = E c o s ( ω t )
e β   = E s i n ( ω t )
Using the Park transformation with the synchronous angle θ t = ω d t , and aligning the d -axis with the grid voltage vector, the rotating-frame voltages become
e d = E
e q = 0
Let R and L denote the aggregated series resistance and inductance between the grid and the converter AC terminals, and v α , β , v d , q the converter phase voltages referred to each frame. Applying KVL gives the following:
The stationary α β frame:
e α   = R i α   + L d i α   d t + v α  
e β   = R i β   + L d i β   d t + v β  
The synchronous d q frame:
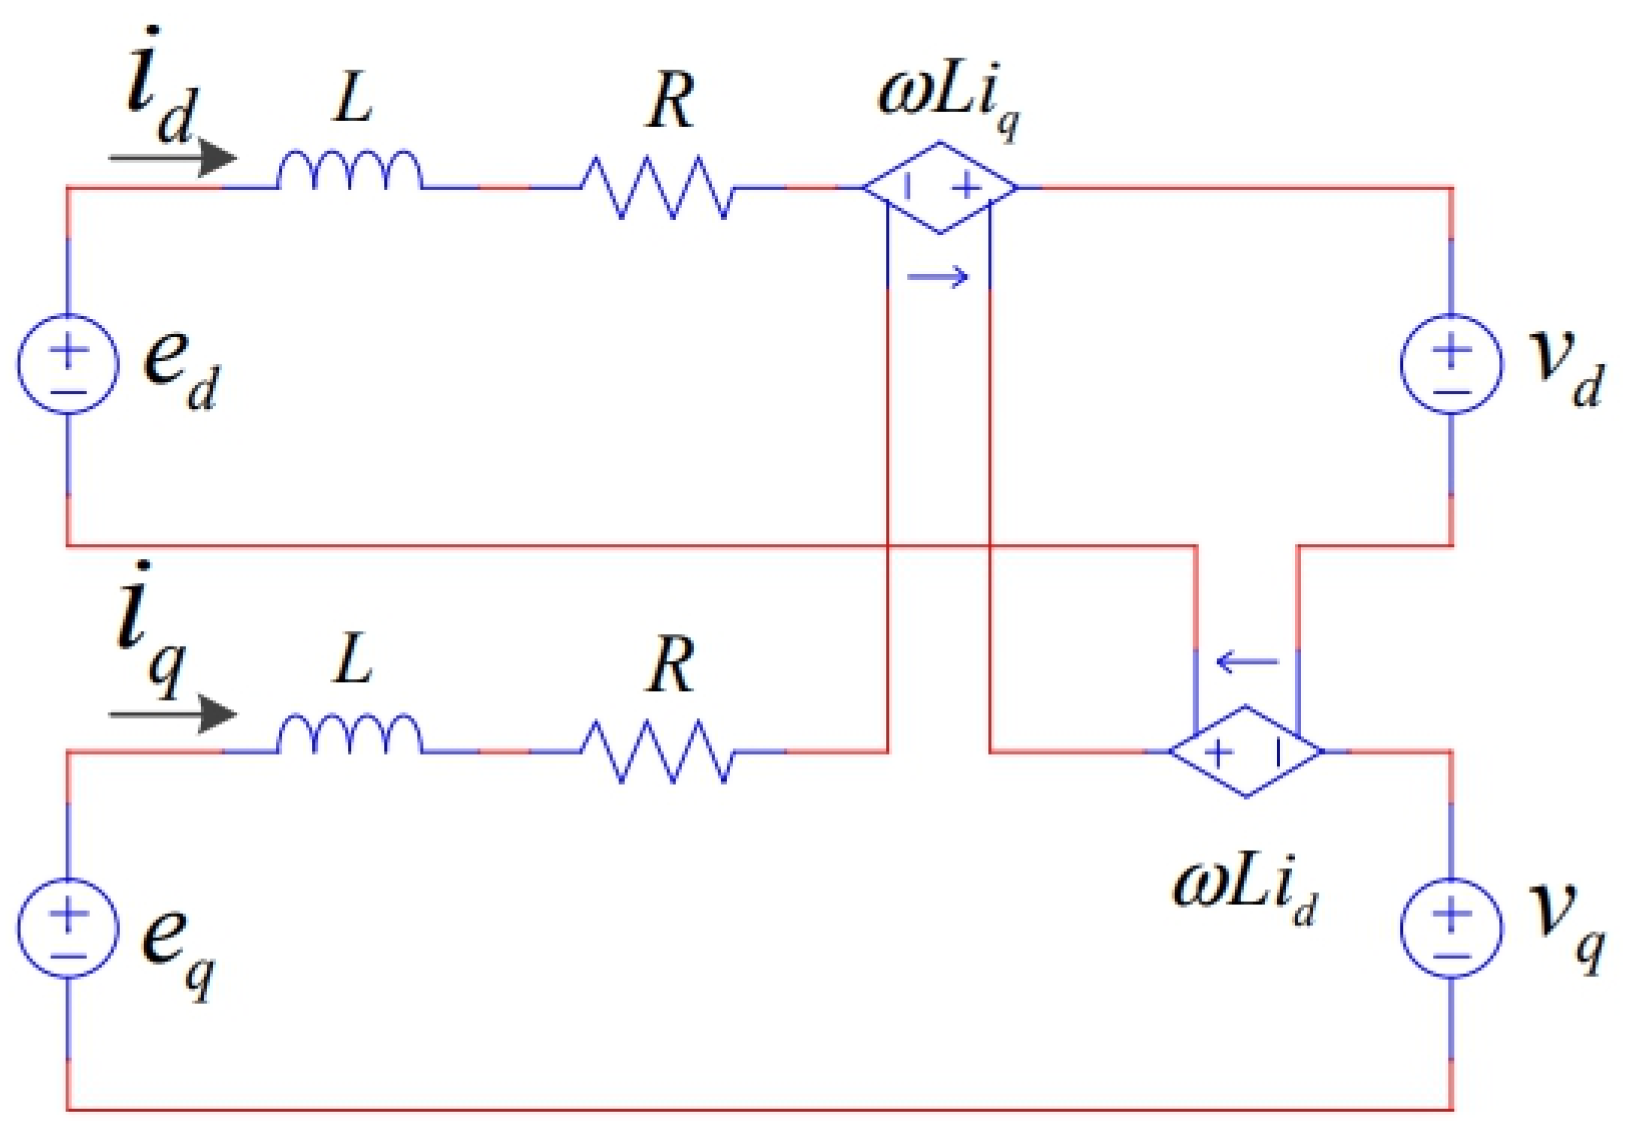
e d = R i d + L d i d d t ω L i q + v d
e q = R i q + L d i q d t + ω L i d + v q
The coupling terms ± ω L arise from the rotational transformation and explicitly appear as back-EMF-like components in the d q model. Figure 3 depicts the equivalent d q circuit, making the cross-coupling channels evident.
Let S = P + j Q denote the instantaneous complex power, with P being the instantaneous active power and Q the instantaneous reactive power. Using the phase voltages/currents e a , e b , e c and i a , i b , i c on the grid side, the complex power can be written as (per three-phase set)
S e = ( e a i a + e b i b + e c i c ) + j 1 3 ( e b c i a + e c a i b + e a b i c )
S e = P e + j Q e
Applying the Clarke transformation (zero sequence neglected) gives the stationary α β form:
S e = ( e α i α + e β i β ) + j ( e β i α e α i β )
Mapping further to the synchronously rotating d q frame with electrical angle θ , the complex power becomes
S e = 3 2 ( e d i d + e q i q + j ( e q i d e d i q ) )
When the d -axis is aligned with the grid voltage vector, Equation (18) reduces to
S e = 3 2 ( e d i d j e d i q )
P e = 3 2 e d i d
Q e = 3 2 e d i q
Here P e > 0 indicates the power delivered by the source to the converter. With the above alignment, i q < 0 corresponds to capacitive behavior (reactive power injection; Q e > 0 ), whereas i q > 0 corresponds to inductive behavior ( Q e < 0 ).
On the converter AC terminals, using the converter voltages ( v d , v q ) and the same d q currents ( i d , i q ) , the instantaneous complex power is
S v = 3 2 ( v d i d + v d i q + j ( v q i d v d i q ) )
from which
P v = 3 2 ( v d i d + v d i q )
Q v = 3 2 ( v q i d v d i q )
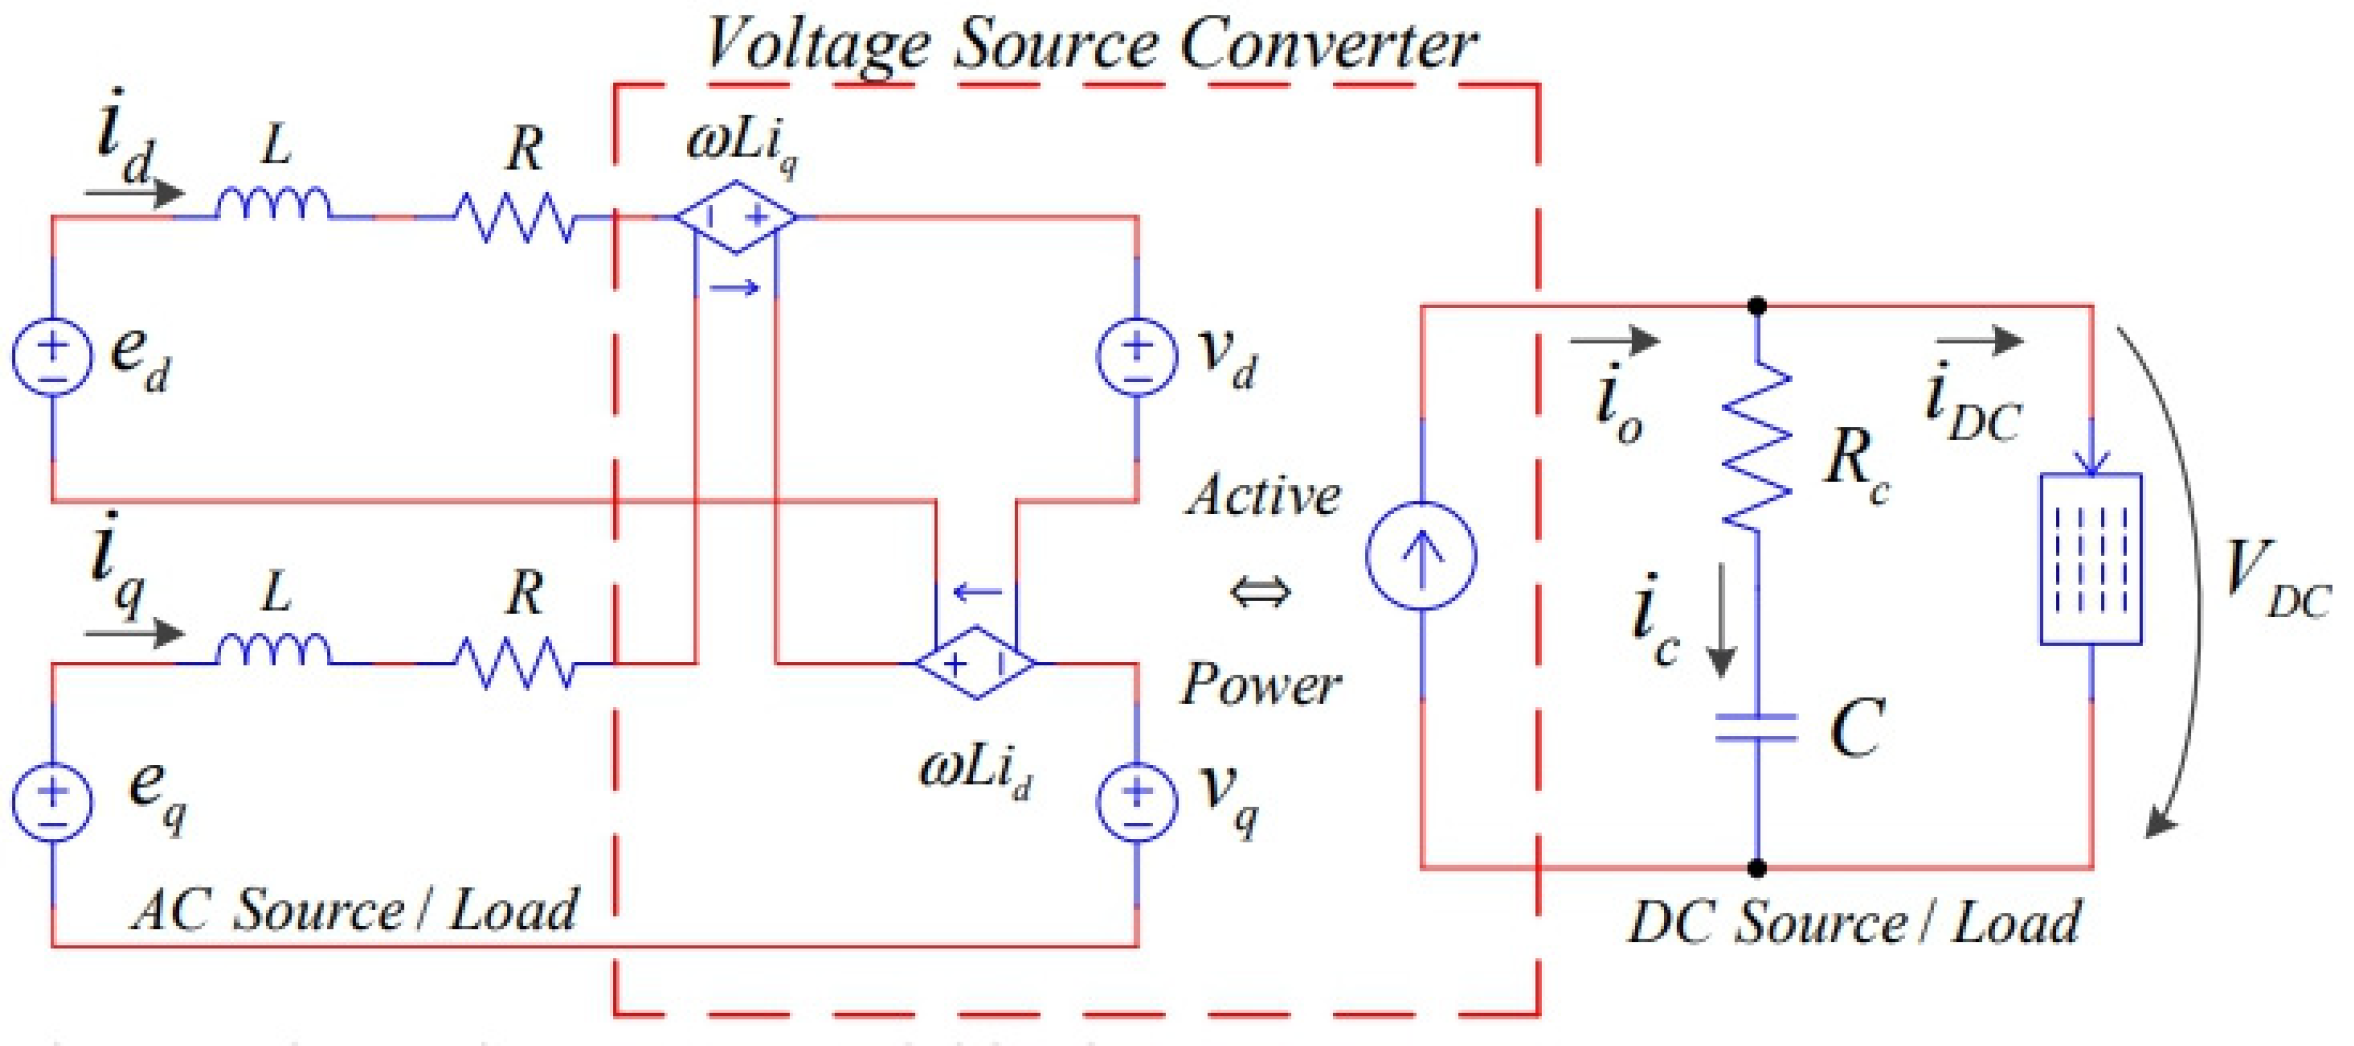
On the DC side of the voltage-source converter (VSC), only active power is exchanged. Neglecting losses, the instantaneous active power processed by the converter is conserved between the AC and DC sides; thus,
P v = P c o n v _ A C = P c o n v _ D C = P D C
Here, P v denotes the AC-side active power at the converter terminals, and P D C is the DC-side power delivered to the external DC source/load.
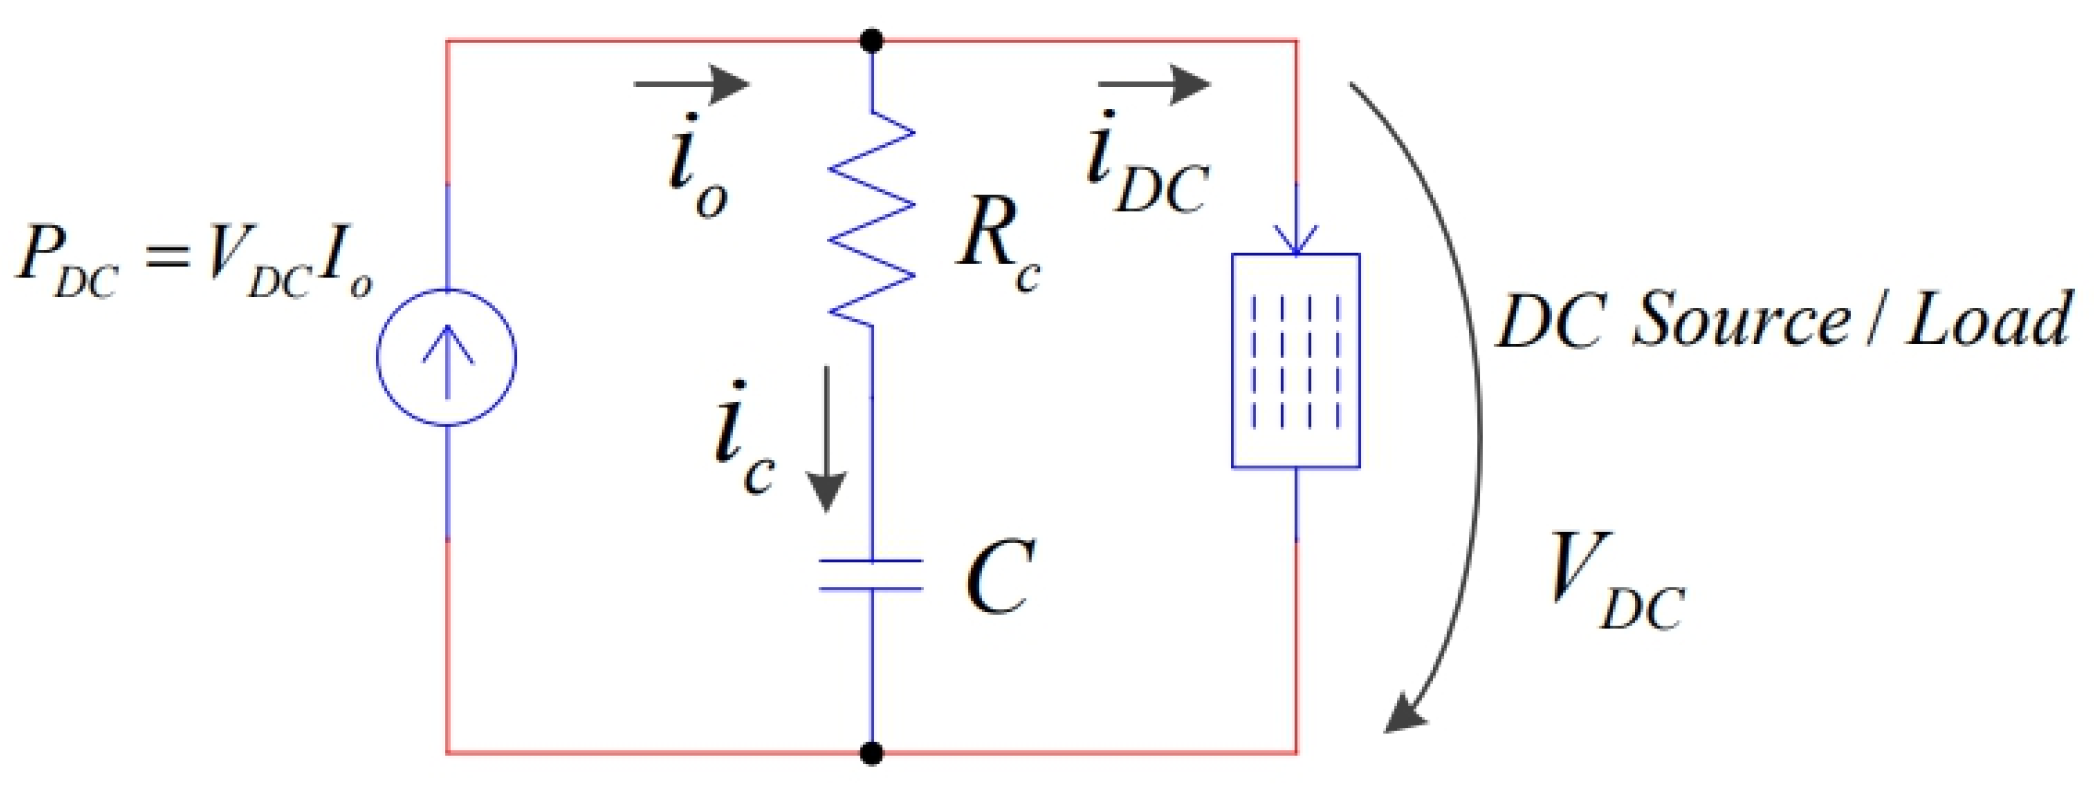
The DC bus is modeled by a link capacitor C with equivalent series resistance R c (ESR). The converter output current is i D C , the load current is i o , and the capacitor current is i c indicated polarities in Figure 4.
The instantaneous DC-side power delivered to the external port is
P D C = V D C I o
Combining (2.23) with (2.26) yields the standard AC–DC power balance:
3 2 ( v d i d + v d i q ) = V D C I o
Figure 5 gathers the AC-side d q model and the DC-link into a single averaged representation of the voltage-source converter (VSC), highlighting the flow of active power from the AC terminals to the DC port.

2.1.2. Converter Voltage Control

Assume the grid-phase voltages e = e d , e q and the DC-link voltage V D C are maintained at their nominal values (or vary slowly around them), so that the converter operates under quasi-steady-state conditions. From Equations (19)–(21), the instantaneous active and reactive powers are primarily determined by the d q currents. Accordingly, the control objective is to synthesize the converter AC voltages v d and v q that drive ( i d , i q ) to their references while compensating for the R L dynamics and the cross-coupling due to the synchronous rotation. Rearranging the d q -frame circuit Equations (13) and (14) yields the decoupling/feed-forward form for the commanded converter voltages:
v d   =   e d   R i d L d i d d t + ω L i q
v q   = e q   R i q L d i q d t + ω L i d
The objective of the current controller is to generate the converter AC voltages so that the line currents track the synchronous-frame references i d and i q . In the d q frame, these references directly regulate active and reactive power, respectively; therefore, accurate tracking is essential for power flow control and power quality compliance.
To obtain nearly decoupled first-order plants per axis, we employ feed-forward compensation for the stator resistance and of synchronous cross-coupling terms ± ω L . The commanded converter voltages are written as a feed-forward part plus a feedback correction:
v d   =   e d   R i d + ω L i q v d  
v q   = e q   R i q ω L i d v q  
Here, e d and e d q are the grid-voltage components. The feedback corrections v d and v q are generated by PI regulators acting on the current-tracking errors:
v d   =   k p   i d i d + k i i d i d d t
v q   = k p   i q i q + k i i q i q d t
With the feed-forward terms in Equations (30) and (31), the closed-loop dynamics of each axis are approximately first order, which enables straightforward bandwidth selection and phase-margin control via k p   and k i . Anti-windup is implemented by integrator back-calculation under PWM saturation, and measured currents are low-pass-filtered to attenuate switching ripple. The complete structure is depicted in Figure 6, where the resistance and ± ω L paths provide decoupling, and the PI blocks provide error-driven regulation.

2.1.3. Buck Converter Governing the Battery Charger

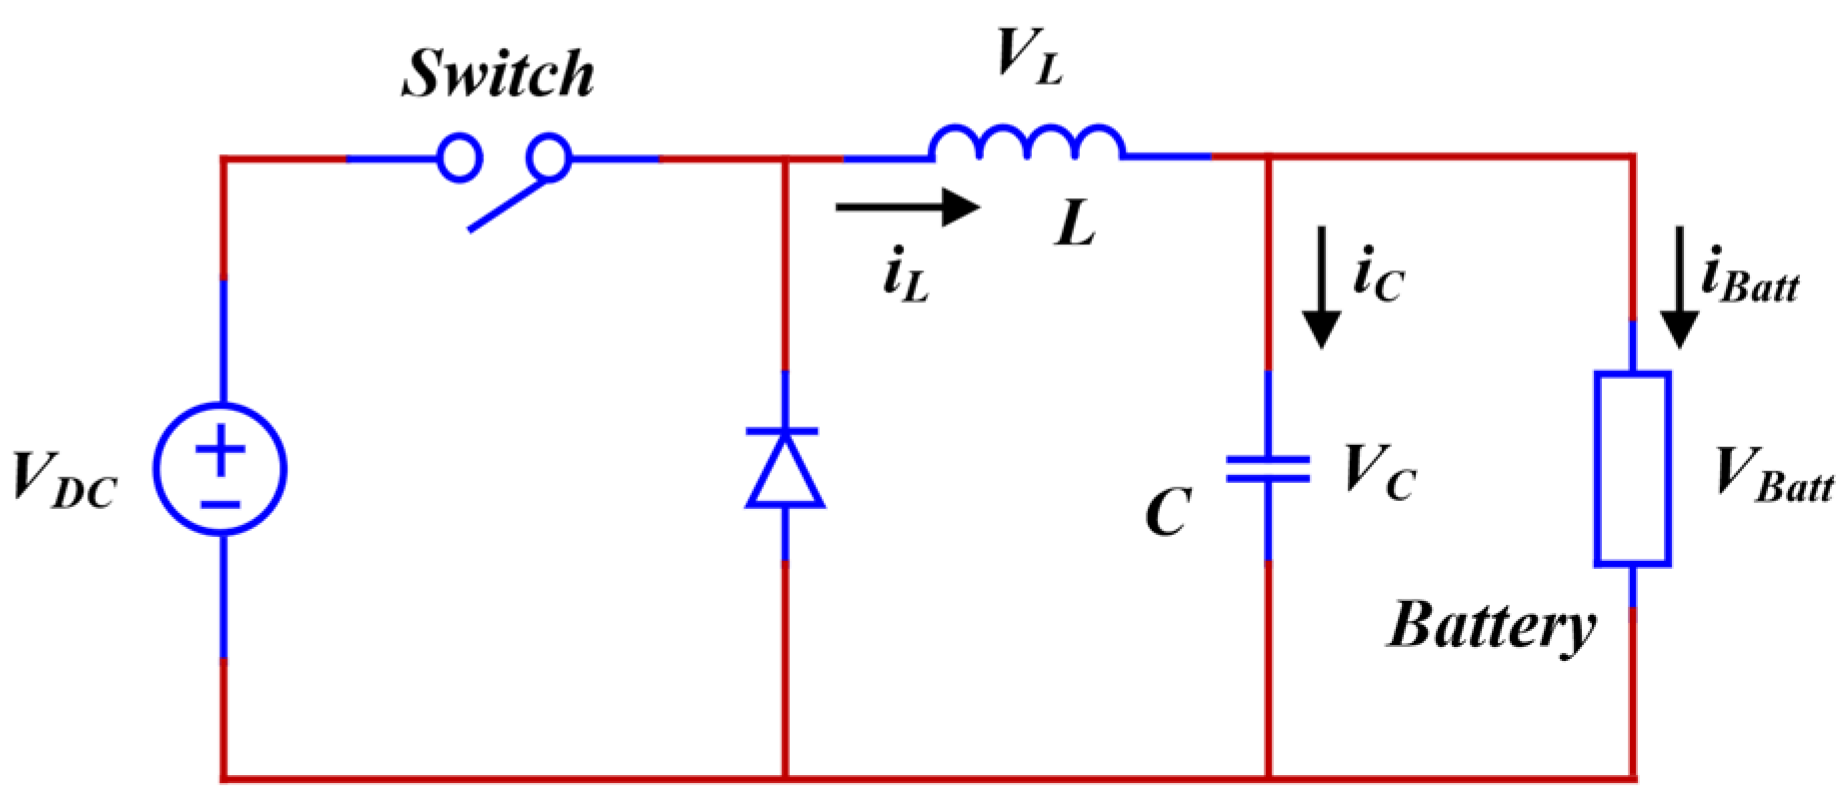
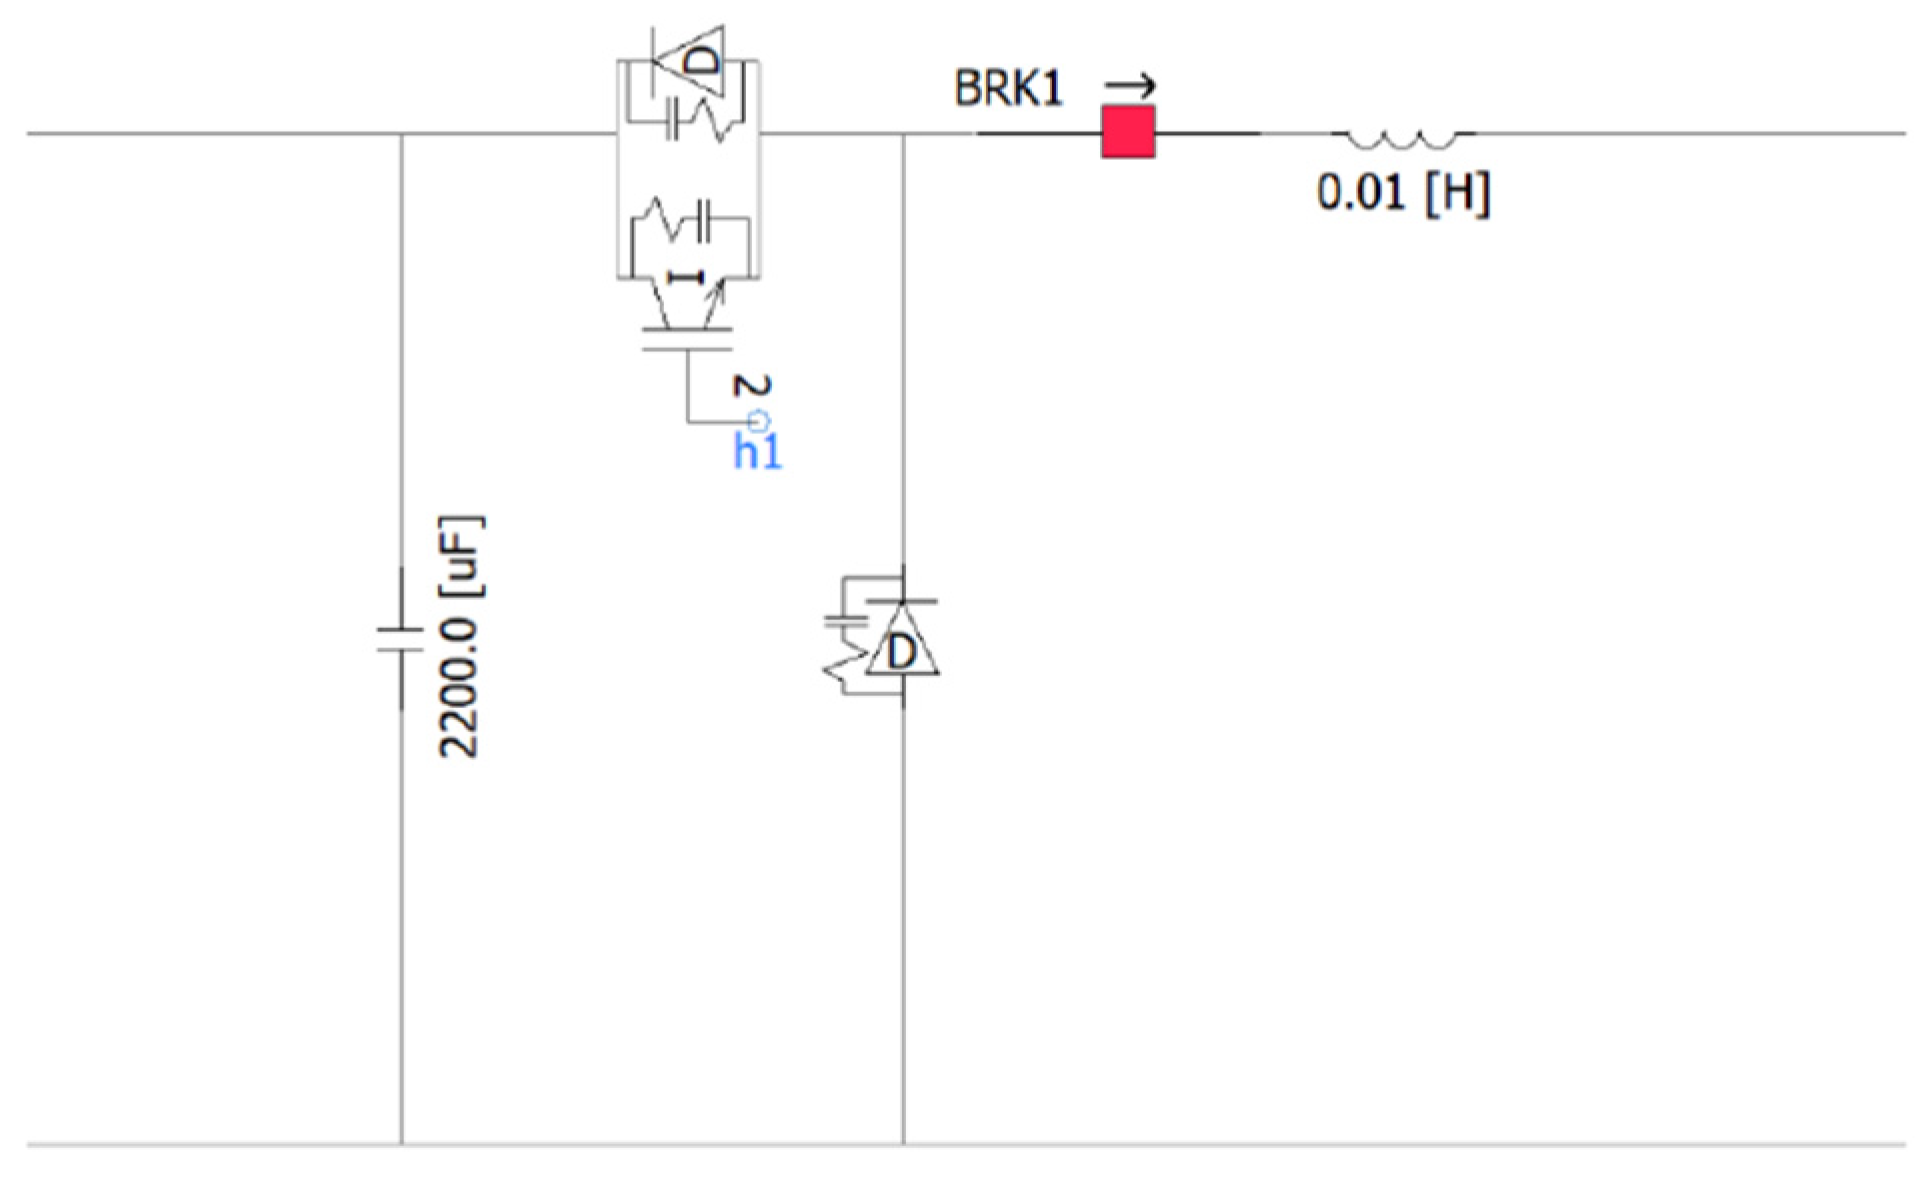
In the DC–DC stage, a step-down (buck) converter regulates the battery terminal through an L C output filter, as depicted in Figure 7. With the input V D C and the switch duty ratio D , the averaged output voltage in continuous-conduction mode satisfies
V B a t t = D V D C
Under standard ripple-small assumptions, the time-domain averaged model is
d i L d t = 1 L D V D C V B a t t
d V B a t t d t = 1 C i L i B a t t
where i L is the inductor current (approximately the battery current i B a t t after the filter), and V B a t t is the battery-port voltage.
Charging typically proceeds in two modes. In constant-current (CC) operation, the duty cycle D is adjusted so that the battery current tracks i B a t t = I r e f , where I r e f is the current reference set by the BMS/charger (bounded by cell chemistry, C-rate, temperature, and safety limits). In constant-voltage (CV) operation, as the terminal voltage approaches its setpoint v B a t t = V r e f , where V r e f is the voltage reference corresponding to the manufacturer-specified charge/float voltage (often temperature-compensated and SoC-dependent), D is regulated to hold v B a t t = V r e f . The charging current then naturally tapers, ensuring a safe termination of the cycle.

2.2. Electric Vehicle-Charging Station Model

This study focused on the design and simulation of a DC fast-charging station comprising three 100 kW chargers, each with two output ports, enabling simultaneous charging of up to six EVs. The total rated power demand of the station can reach 300 kW under full operation.
As depicted in Figure 8, the station is connected to the medium-voltage (MV) distribution network of the Metropolitan Electricity Authority (MEA) through an isolation step-down transformer, which reduces the voltage from 24 kV to 400 V, suitable for EV chargers. Each charger then converts AC to DC to deliver fast charging directly to EV batteries. The station was simulated using power flow analysis and transient load modeling using PSCAD/EMTDC. The following aspects were assessed:
  • Voltage drop and transformer loading: At full load (300 kW), the transformer approaches 100% capacity, inducing measurable voltage drops across the 400 V bus.
  • Power quality: High current switching of DC fast chargers introduces harmonics, particularly if pulse-width modulation (PWM)-based converters are used. IEEE Std 519-2014 recommends limiting THD < 5%.
  • Energy losses and efficiency: Power losses in cables and the transformer were evaluated to determine system efficiency and thermal stress.
  • Charging time and SoC dynamics: Based on EV battery ratings and charger power, charging durations were estimated (e.g., 30 min for 0–80% SoC at 100 kW).
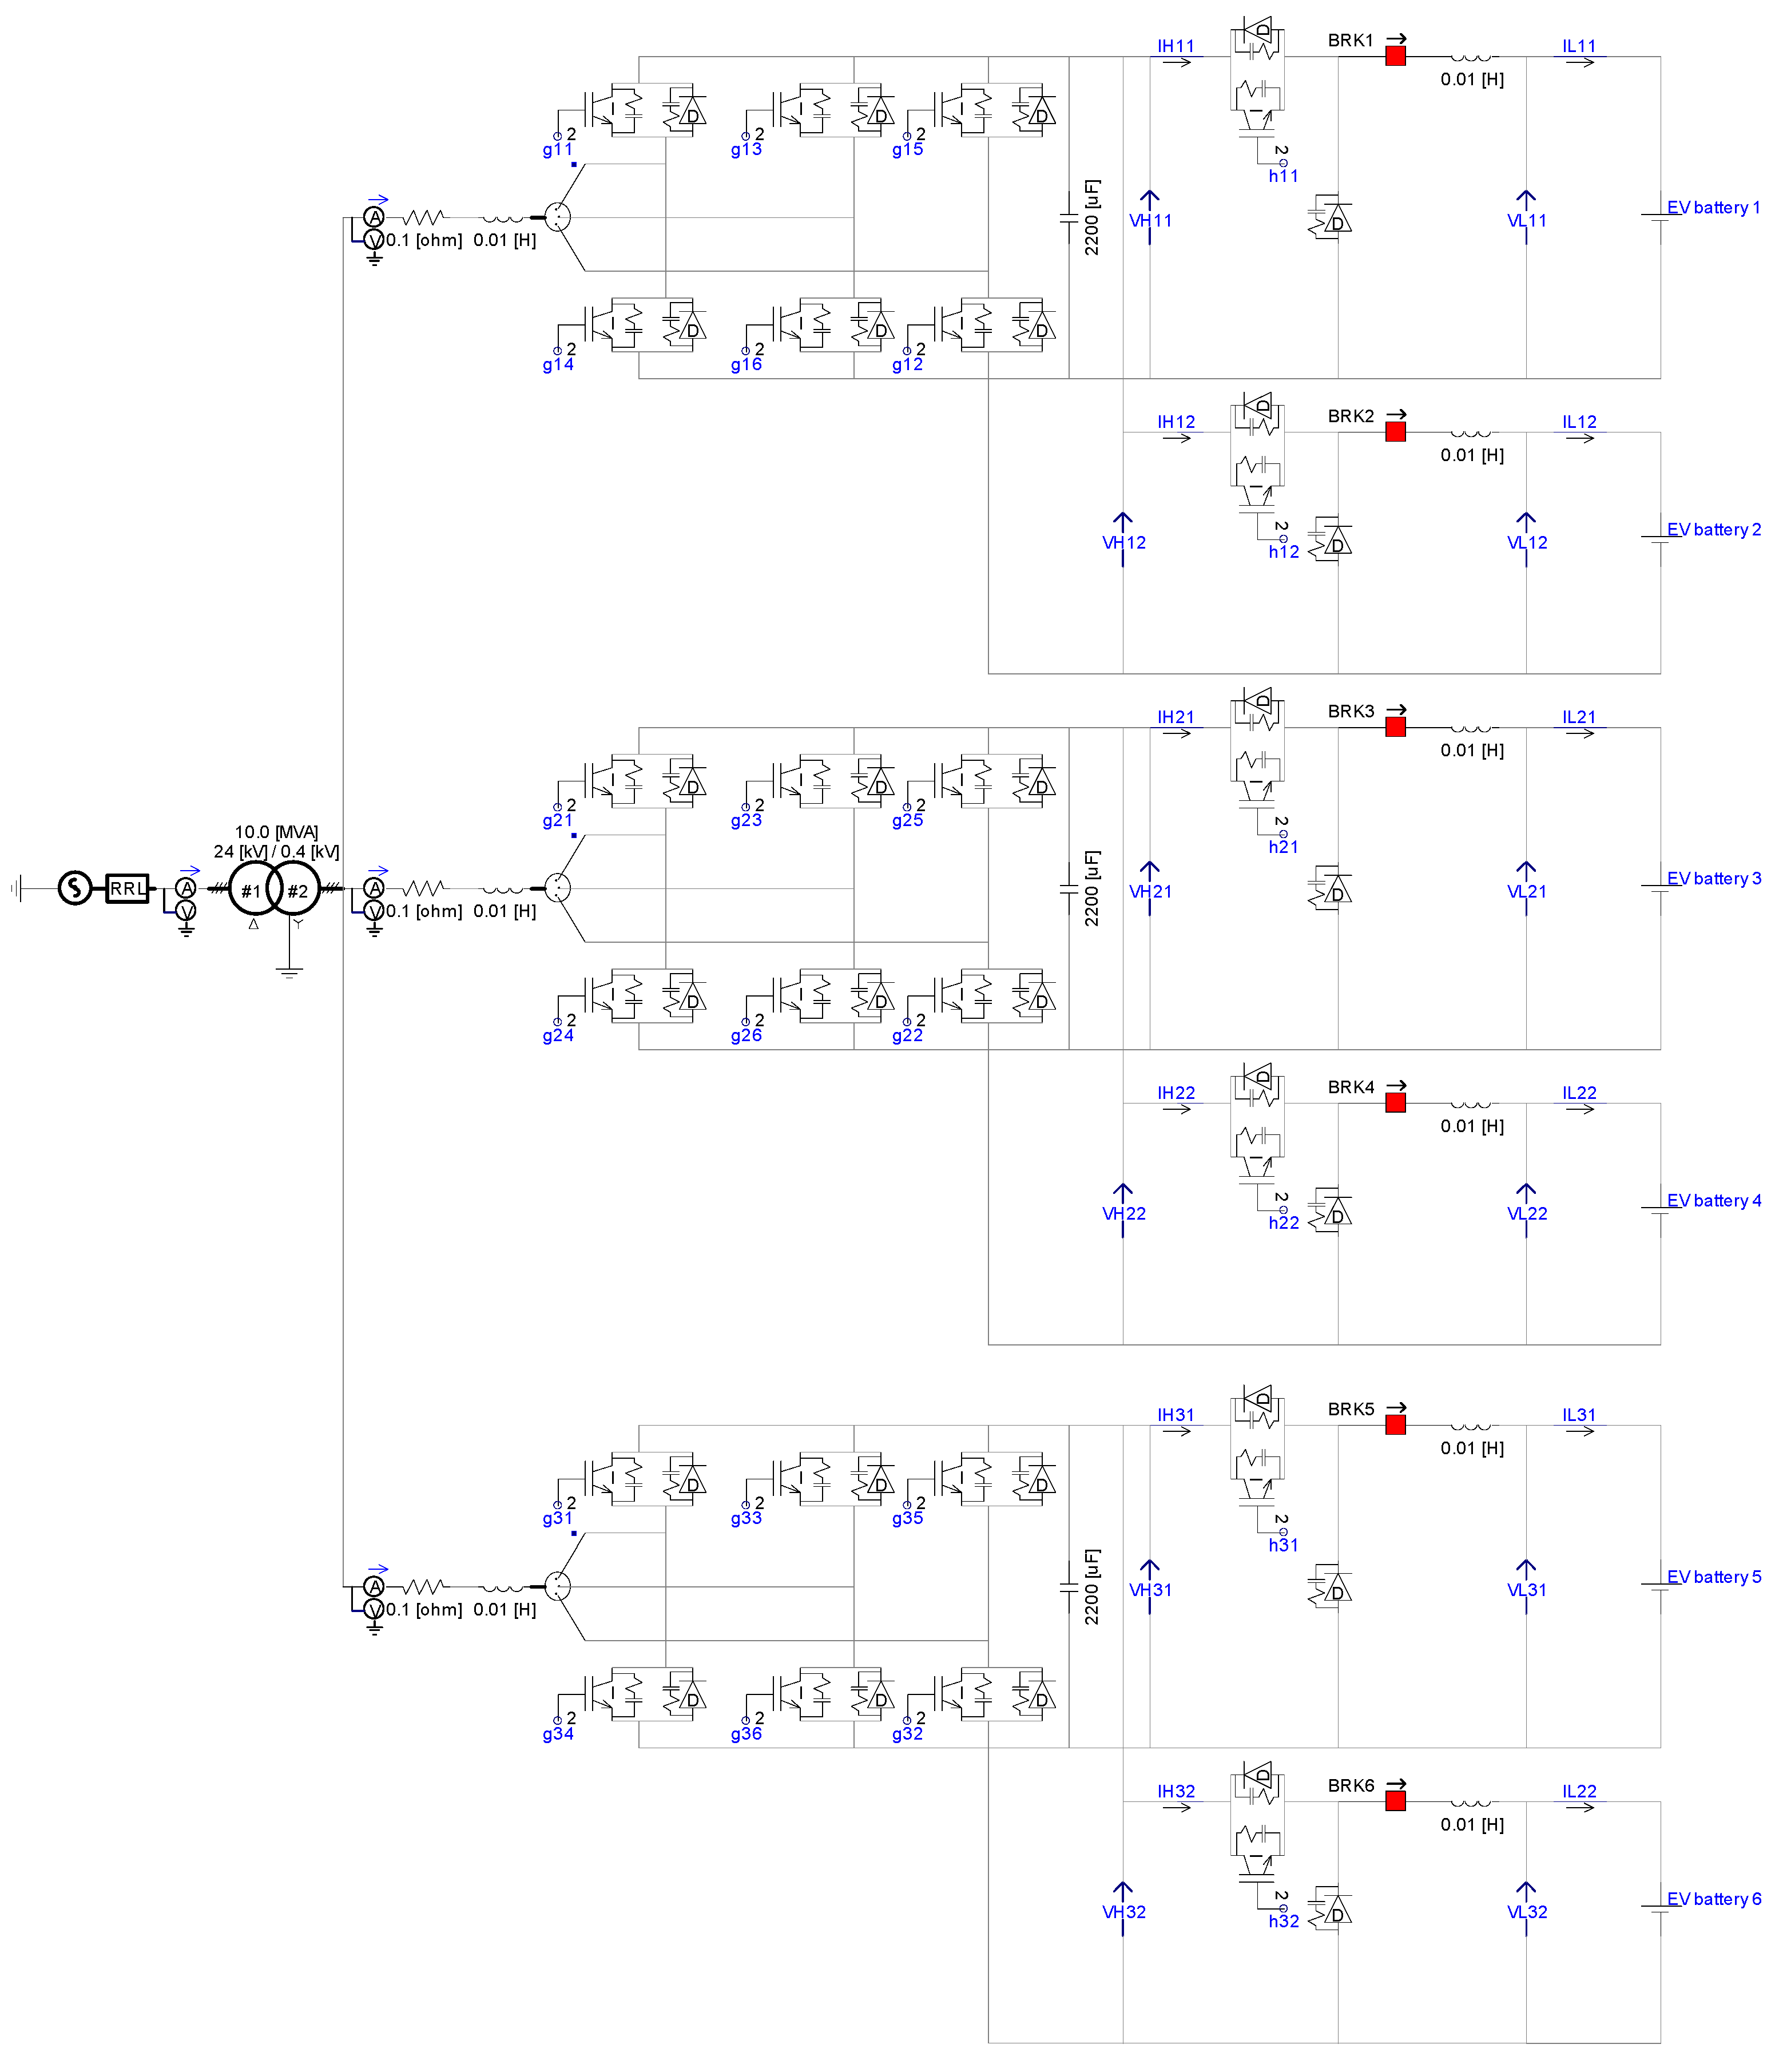
To evaluate the dynamic behavior and power-quality impacts of EV fast charging on distribution systems, we developed a comprehensive PSCAD/EMTDC model that integrates all critical subsystems of an EV-charging station and emulates realistic operating and control characteristics (as illustrated in Figure 9). The system is supplied from a 24-kV medium-voltage (MV) distribution network representative of a typical urban grid managed by the Metropolitan Electricity Authority (MEA) and stepped down to 400 V low voltage (LV) through a dedicated 500 kVA Δ–Y step-down transformer, which also provides galvanic isolation to enhance safety and attenuate the propagation of harmonics toward the upstream grid while supporting voltage stability during transient loading. The station architecture is modular, comprising three independent charging units; each unit can charge two EVs simultaneously via separate AC–DC and DC–DC conversion stages, enabling concurrent fast charging of up to six EVs. This model enables detailed analysis of grid–charger interactions under high-demand fast-charging conditions.
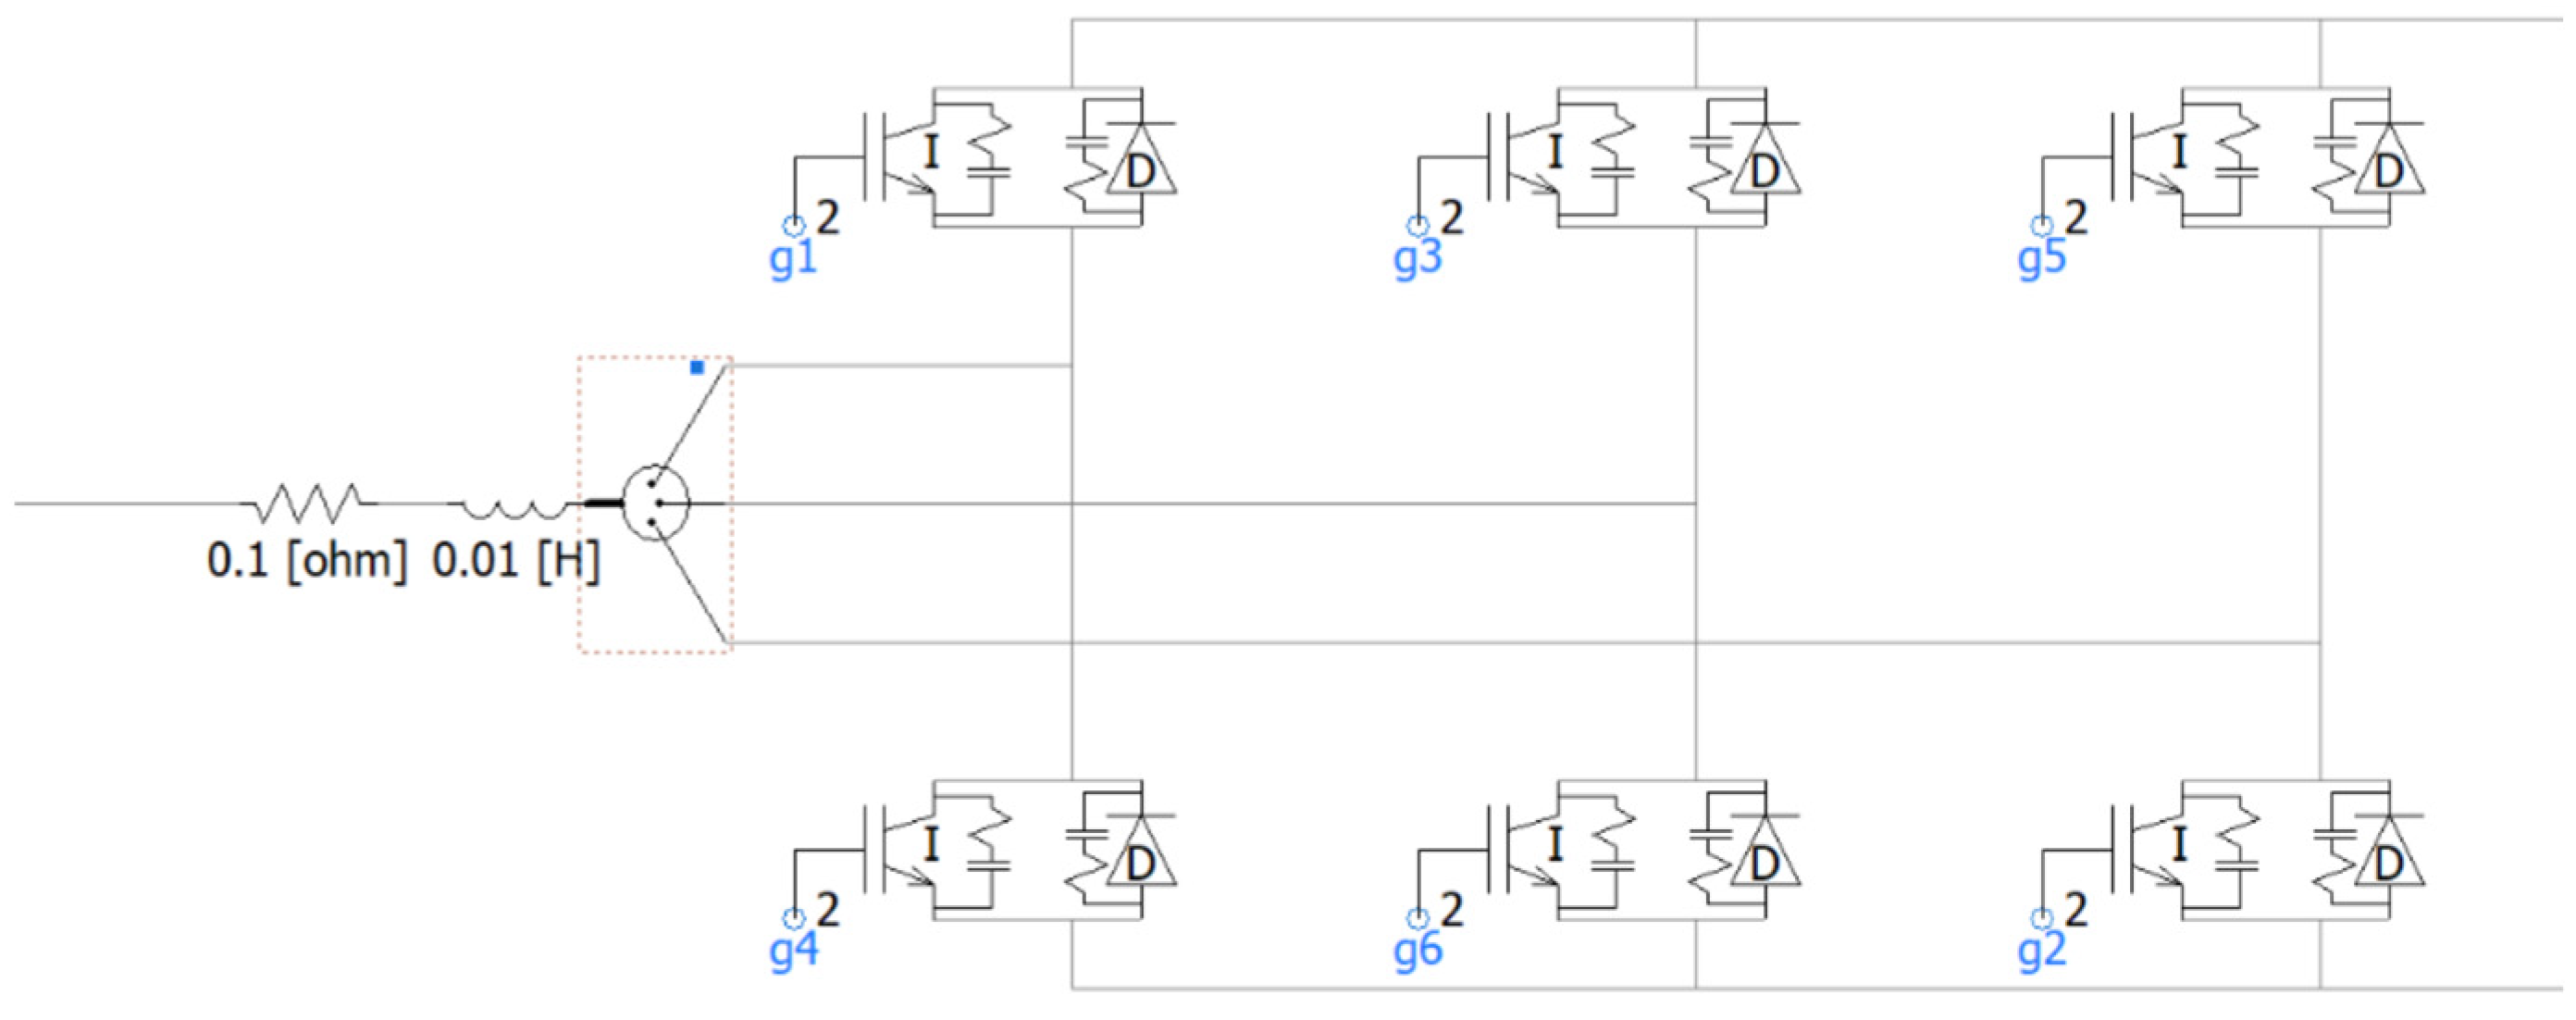
Each charging unit incorporates a three-phase voltage source inverter (VSI), implemented with six insulated gate bipolar transistors (IGBTs) configured in a full-bridge topology (Figure 10). The inverter converts three-phase AC power to DC, while series inductors (0.01 H) and resistors (0.1 Ω) are integrated to filter high-frequency switching harmonics and improve output power quality. This inverter stage serves as the front end of the charging system and interfaces with downstream control modules.
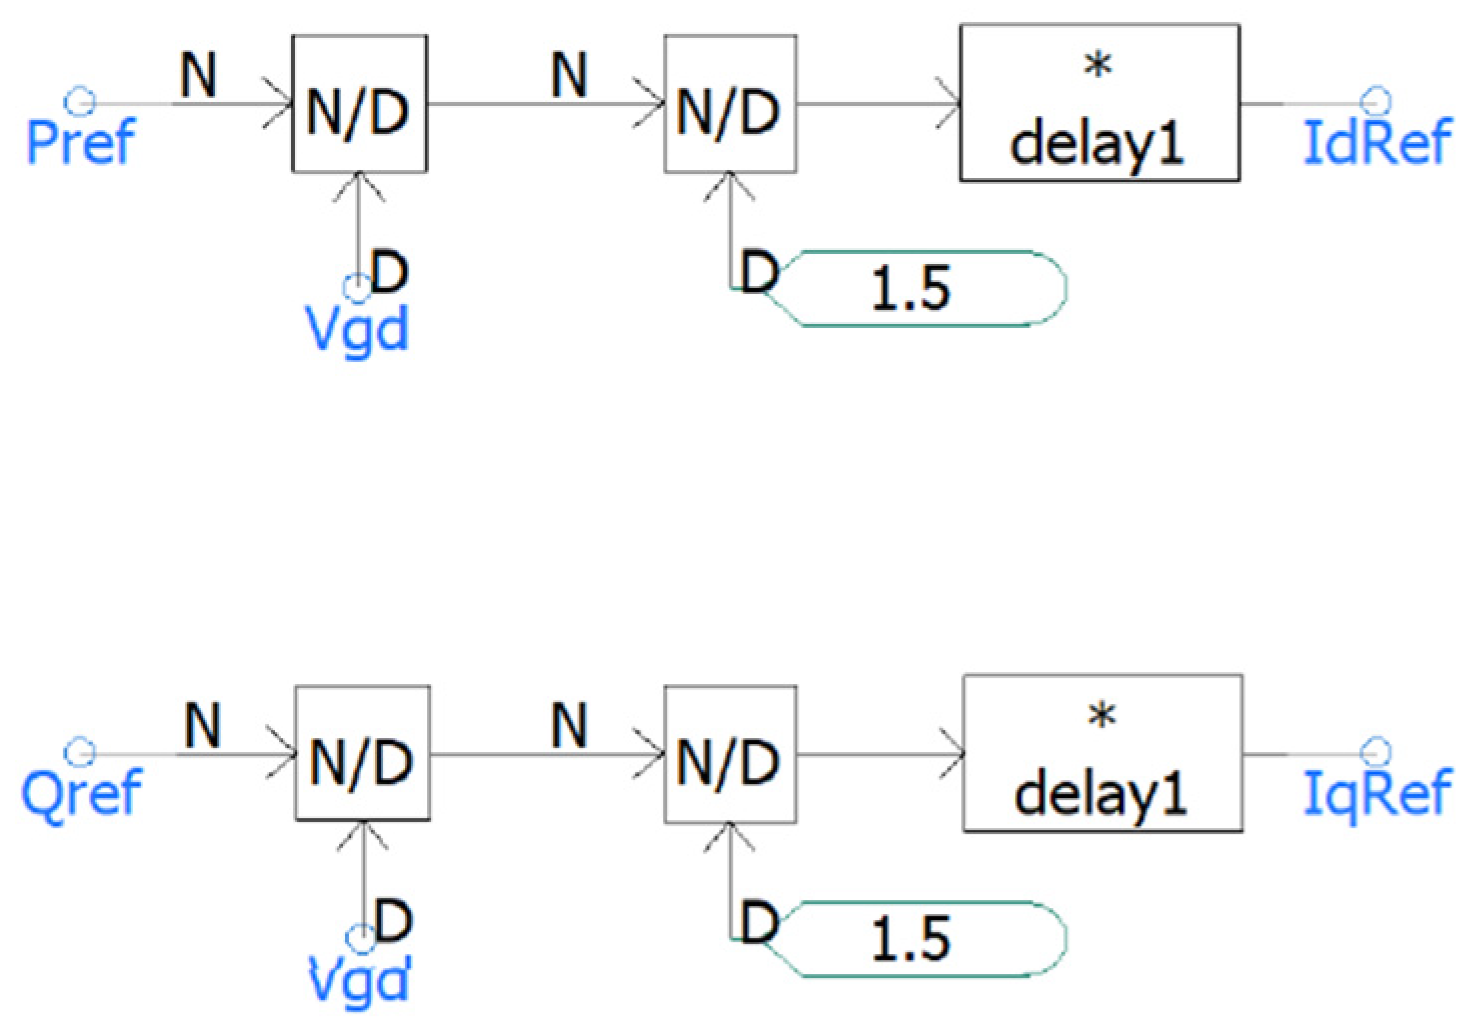
Active and reactive power setpoints (P and Q) are transformed into reference currents within the rotating dq-axis reference frame using Park’s transformation (Figure 11). This method is foundational to vector control strategies in power electronics, where the d-axis is typically assigned to regulate real power and the q-axis to control reactive power. The resulting reference currents (IdRef and IqRef) provide the basis for current regulation in subsequent control loops.
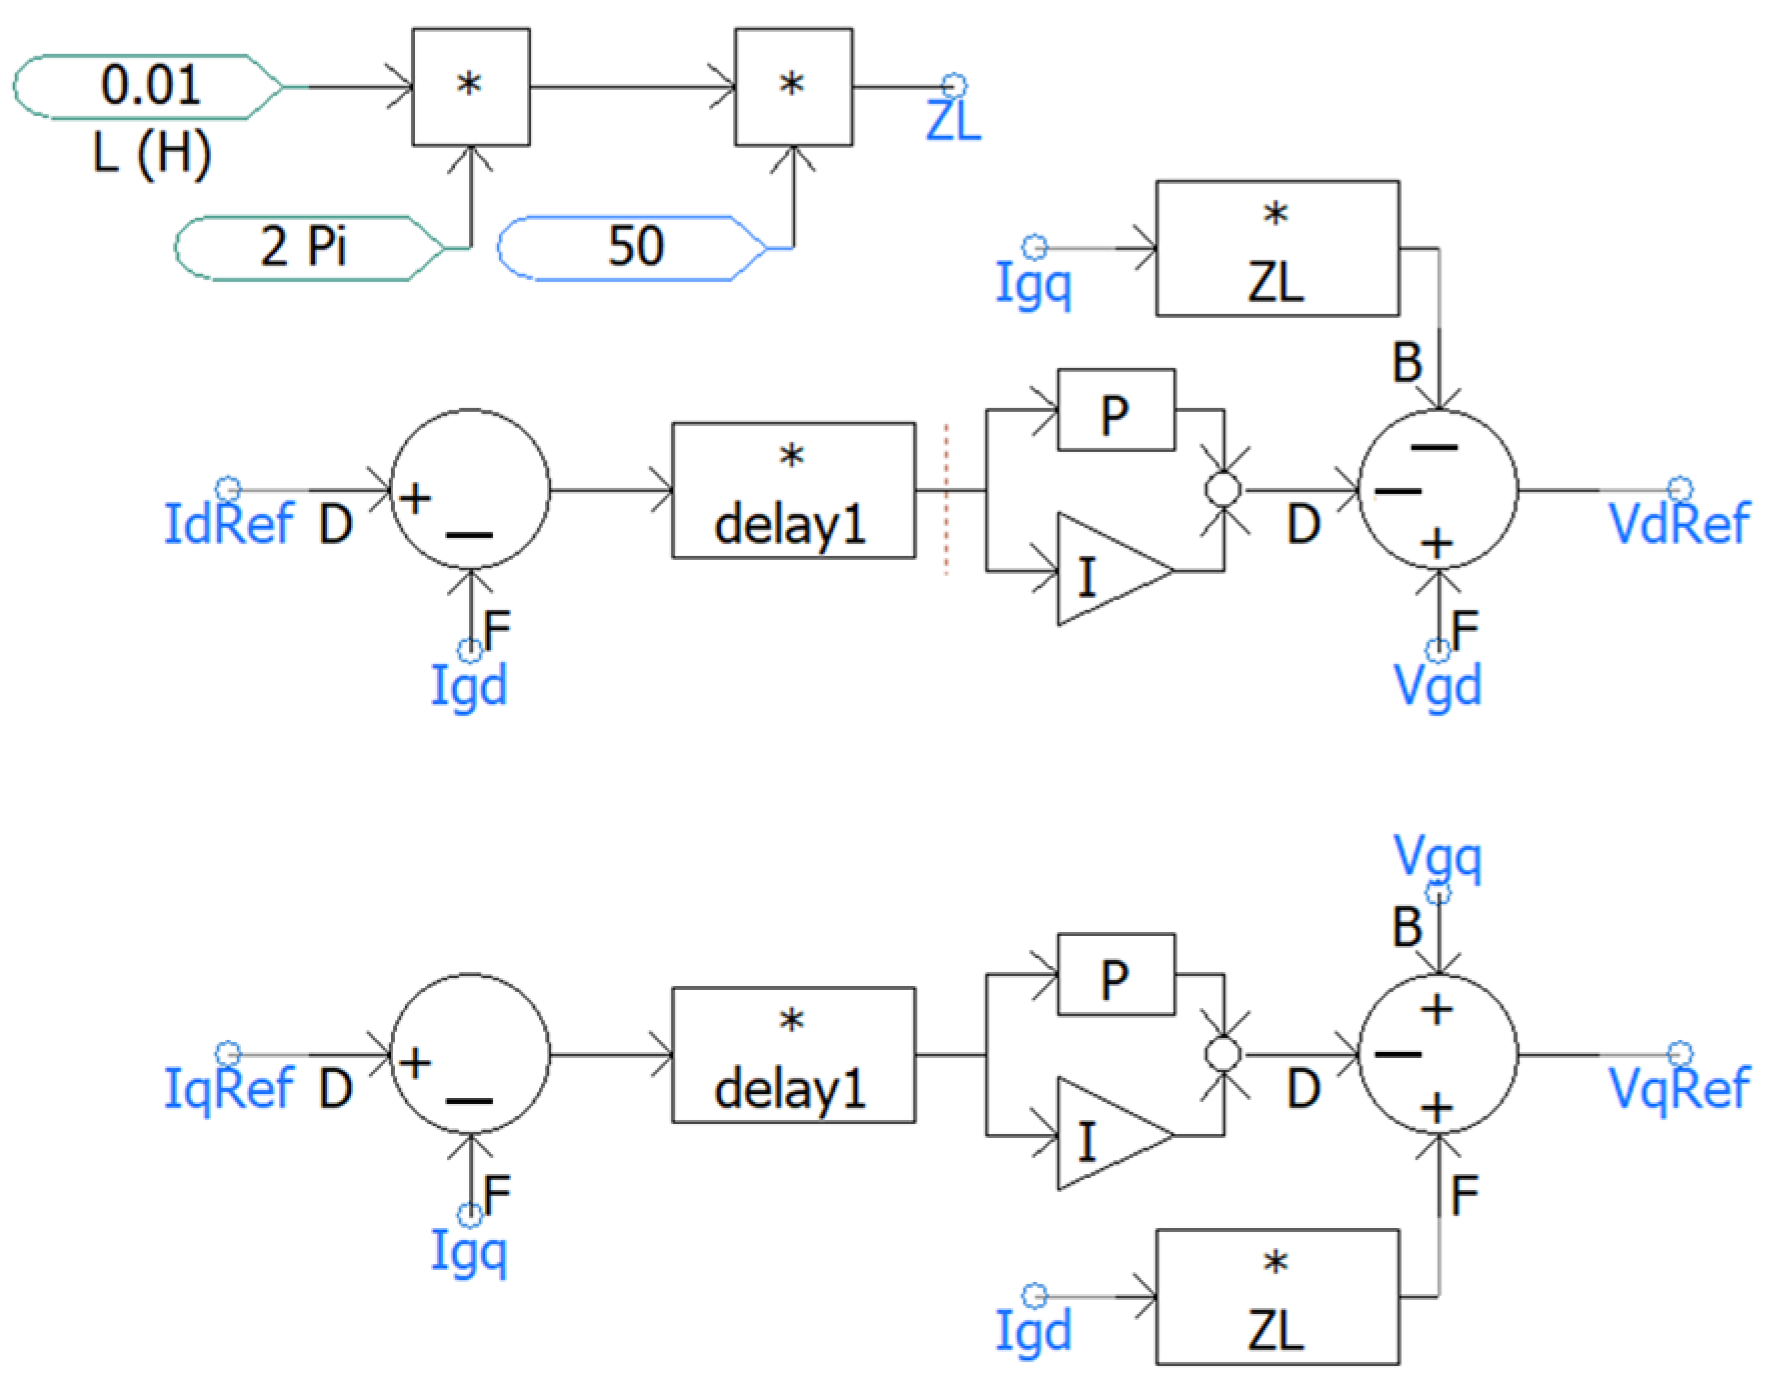
The generated dq-axis reference currents are input into a proportional–integral (PI) controller that produces corresponding voltage reference signals (VdRef and VqRef), as depicted in Figure 12. These voltage commands are then applied through sinusoidal pulse-width modulation (SPWM) to control the IGBT switching states. This closed-loop control scheme ensures accurate tracking of the desired power exchange and stabilizes current injection into the grid.
Finally, the regulated DC output from the inverter is further processed by a DC-DC buck converter, tailored to meet the specific voltage and current requirements of individual EV batteries (Figure 13). The converter utilizes an IGBT as the main switching element, a freewheeling diode to manage current continuity, and passive filtering components—namely, a 2200 µF capacitor and a 0.01 H inductor—to suppress voltage ripple and maintain output stability. A feedback-controlled PI loop ensures that the converter output closely tracks the battery charging voltage setpoint, thereby enhancing charging efficiency and battery safety.
The electric vehicle (EV) load in this study is modeled based on the BMW i3 platform, which is widely recognized for its compact urban design and its integration of a high-performance lithium-ion battery. Specifically, the battery features a rated capacity of 120 Ah and operates at a nominal voltage of 500 V, yielding a total energy storage capacity of 42.2 kWh, as summarized in Table 3. The pack consists of 96 lithium-ion cells, selected for their high energy density, stable performance, and long cycle life, key traits for modern EV applications.
The charging behavior is influenced by the state of charge (SoC), which directly affects instantaneous power demand, charging time, and harmonic response during the charging process. In the simulation, a constant current–constant voltage (CC–CV) charging profile is applied, reflecting the standard operating procedure used in most EV battery management systems (BMSs). Additionally, the battery demonstrates minimal capacity degradation, losing only 0.1% of its capacity when discharged at nominal current over the course of one hour. The initial SoC is set at 1.26%, representing a low-charge scenario often used to evaluate charging infrastructure performance under high-demand conditions.

3. Case Study and Results

The simulation was conducted on the proposed distribution system model to evaluate the electrical impacts associated with different electric vehicle (EV)-charging scenarios at a designated charging station. Two distinct scenarios were analyzed, i.e., a base case and various EV charging scenarios. The base case represents normal system operation without any EV load and is used as a reference point for comparative analysis. In contrast, the various EV charging scenarios introduce dynamic behavior, where multiple EVs connect and disconnect at various times, each with different states of charge (SoC) and energy requirements. This approach captures the stochastic and realistic nature of actual EV usage patterns.
Figure 14 presents a simplified schematic of the EV-charging station layout, highlighting key measurement points distributed throughout the system. These locations are essential for monitoring critical electrical parameters—including voltage, current, and active power, THDi, and THDv indices—under various operating conditions. The data obtained from these points are instrumental in assessing system performance, identifying potential power disturbances, and supporting the implementation of advanced control strategies to ensure stability and efficiency during fast-charging events.
The measurement positions are strategically distributed across the system as follows:
  • Front side of transformer (before step-down transformation or primary side):
  • This point is located on the medium-voltage (MV) side of the transformer and represents the electrical conditions supplied by the main distribution grid (24 kV). It is used to assess grid-side impacts and monitor incoming power quality.
  • Behind side of transformer (after step-down transformation or secondary side):
  • Positioned at the low-voltage (LV) side of the transformer (0.4 kV), this point provides insight into voltage regulation performance, voltage drop, and transformer efficiency under varying load conditions.
  • G1—input to charger unit 1:
  • This point captures electrical parameters at the input of the first AC–DC conversion unit. It is useful for analyzing the power drawn by the inverter system and its conversion efficiency.
  • G2—input to charger unit 2:
  • Similar to G1, this monitors the input of the second charger unit, enabling phase-by-phase comparison under different EV charging loads.
  • G3—input to charger unit 3:
  • Measures power input to the third charger and contributes to a complete evaluation of total station consumption and power distribution among chargers.
  • DC11—output of charging adapter 1 (charger 1):
  • Located at the first output port of charger 1, this point monitors the DC voltage and current supplied to the connected EV. It assists in validating proper current sharing and voltage regulation during fast charging.
  • DC12—output of charging adapter 2 (charger 1):
  • The second output port of charger 1 is measured here, ensuring consistent performance across both ports of the same charger.
  • DC21—output of charging adapter 1 (charger 2):
  • Positioned at the first output of charger 2, this enables performance comparison across different charger units.
  • DC22—output of charging adapter 2 (charger 2):
  • Monitors the second charging outlet of charger 2, contributing to load balancing and real-time power flow analysis.
  • DC31—output of charging adapter 1 (charger 3):
  • Captures charging behavior at the first output of charger 3.
  • DC32—output of charging adapter 2 (charger 3):
  • Measures the final outlet in the system, offering a complete view of all charging interactions.

3.1. Base Case (Without EV Charging)

The base case simulation results, shown in Table 4, represent the electrical performance of the EV-charging station under no-load conditions, i.e., when no electric vehicles are connected. During this state, the only electrical consumption arises from the station’s internal support systems rather than from active vehicle charging. Both the front and behind sides of the transformer register an active power of 0.48 kW, suggesting the presence of a low baseline load. This power is evenly distributed among the three charging units (G1, G2, and G3), each drawing approximately 0.16 kW, likely to support control circuitry and standby functions. All DC charging outputs (DC11 to DC32) show zero power draw, which is expected due to the absence of connected EVs.
In terms of power quality, the system maintains excellent harmonic performance. The voltage and current total harmonic distortion (THD) values remain below 1% at all measurement points, with readings ranging from 0.2% to 0.6%. These low levels conform well to IEEE Std 519-2014, indicating minimal harmonic interference under idle conditions. The voltage measurements further validate the system integrity, with 24 kV observed on the transformer’s primary (grid) side and 400 V maintained on the secondary side feeding the AC panels. The DC adapter voltages are stable at 500 V, aligning with standard fast-charging requirements, though unused in this scenario. Overall, the system consumes about 1.6 kW in this base state, establishing a clean reference point for comparing system performance under actual charging loads.

3.2. Various EV-Charging Scenarios

The simulation and analysis of power quality during electric vehicle charging under asynchronous conditions, where EVs connect at different times and have varying initial SoC, are presented. The simulation is divided into three distinct charging phases, each representing the introduction of a new EV into the system at different intervals and SoC levels, specifically 10%, 50%, and 80%. These conditions more accurately emulate real-world charging patterns compared with uniform scenarios. Measurements are taken at key points throughout the system, including both the primary and secondary sides of the distribution transformer, the input terminals of charging units G1, G2, and G3, and the DC charging adapters DC11, DC21, and DC31, which directly interface with the EV batteries.
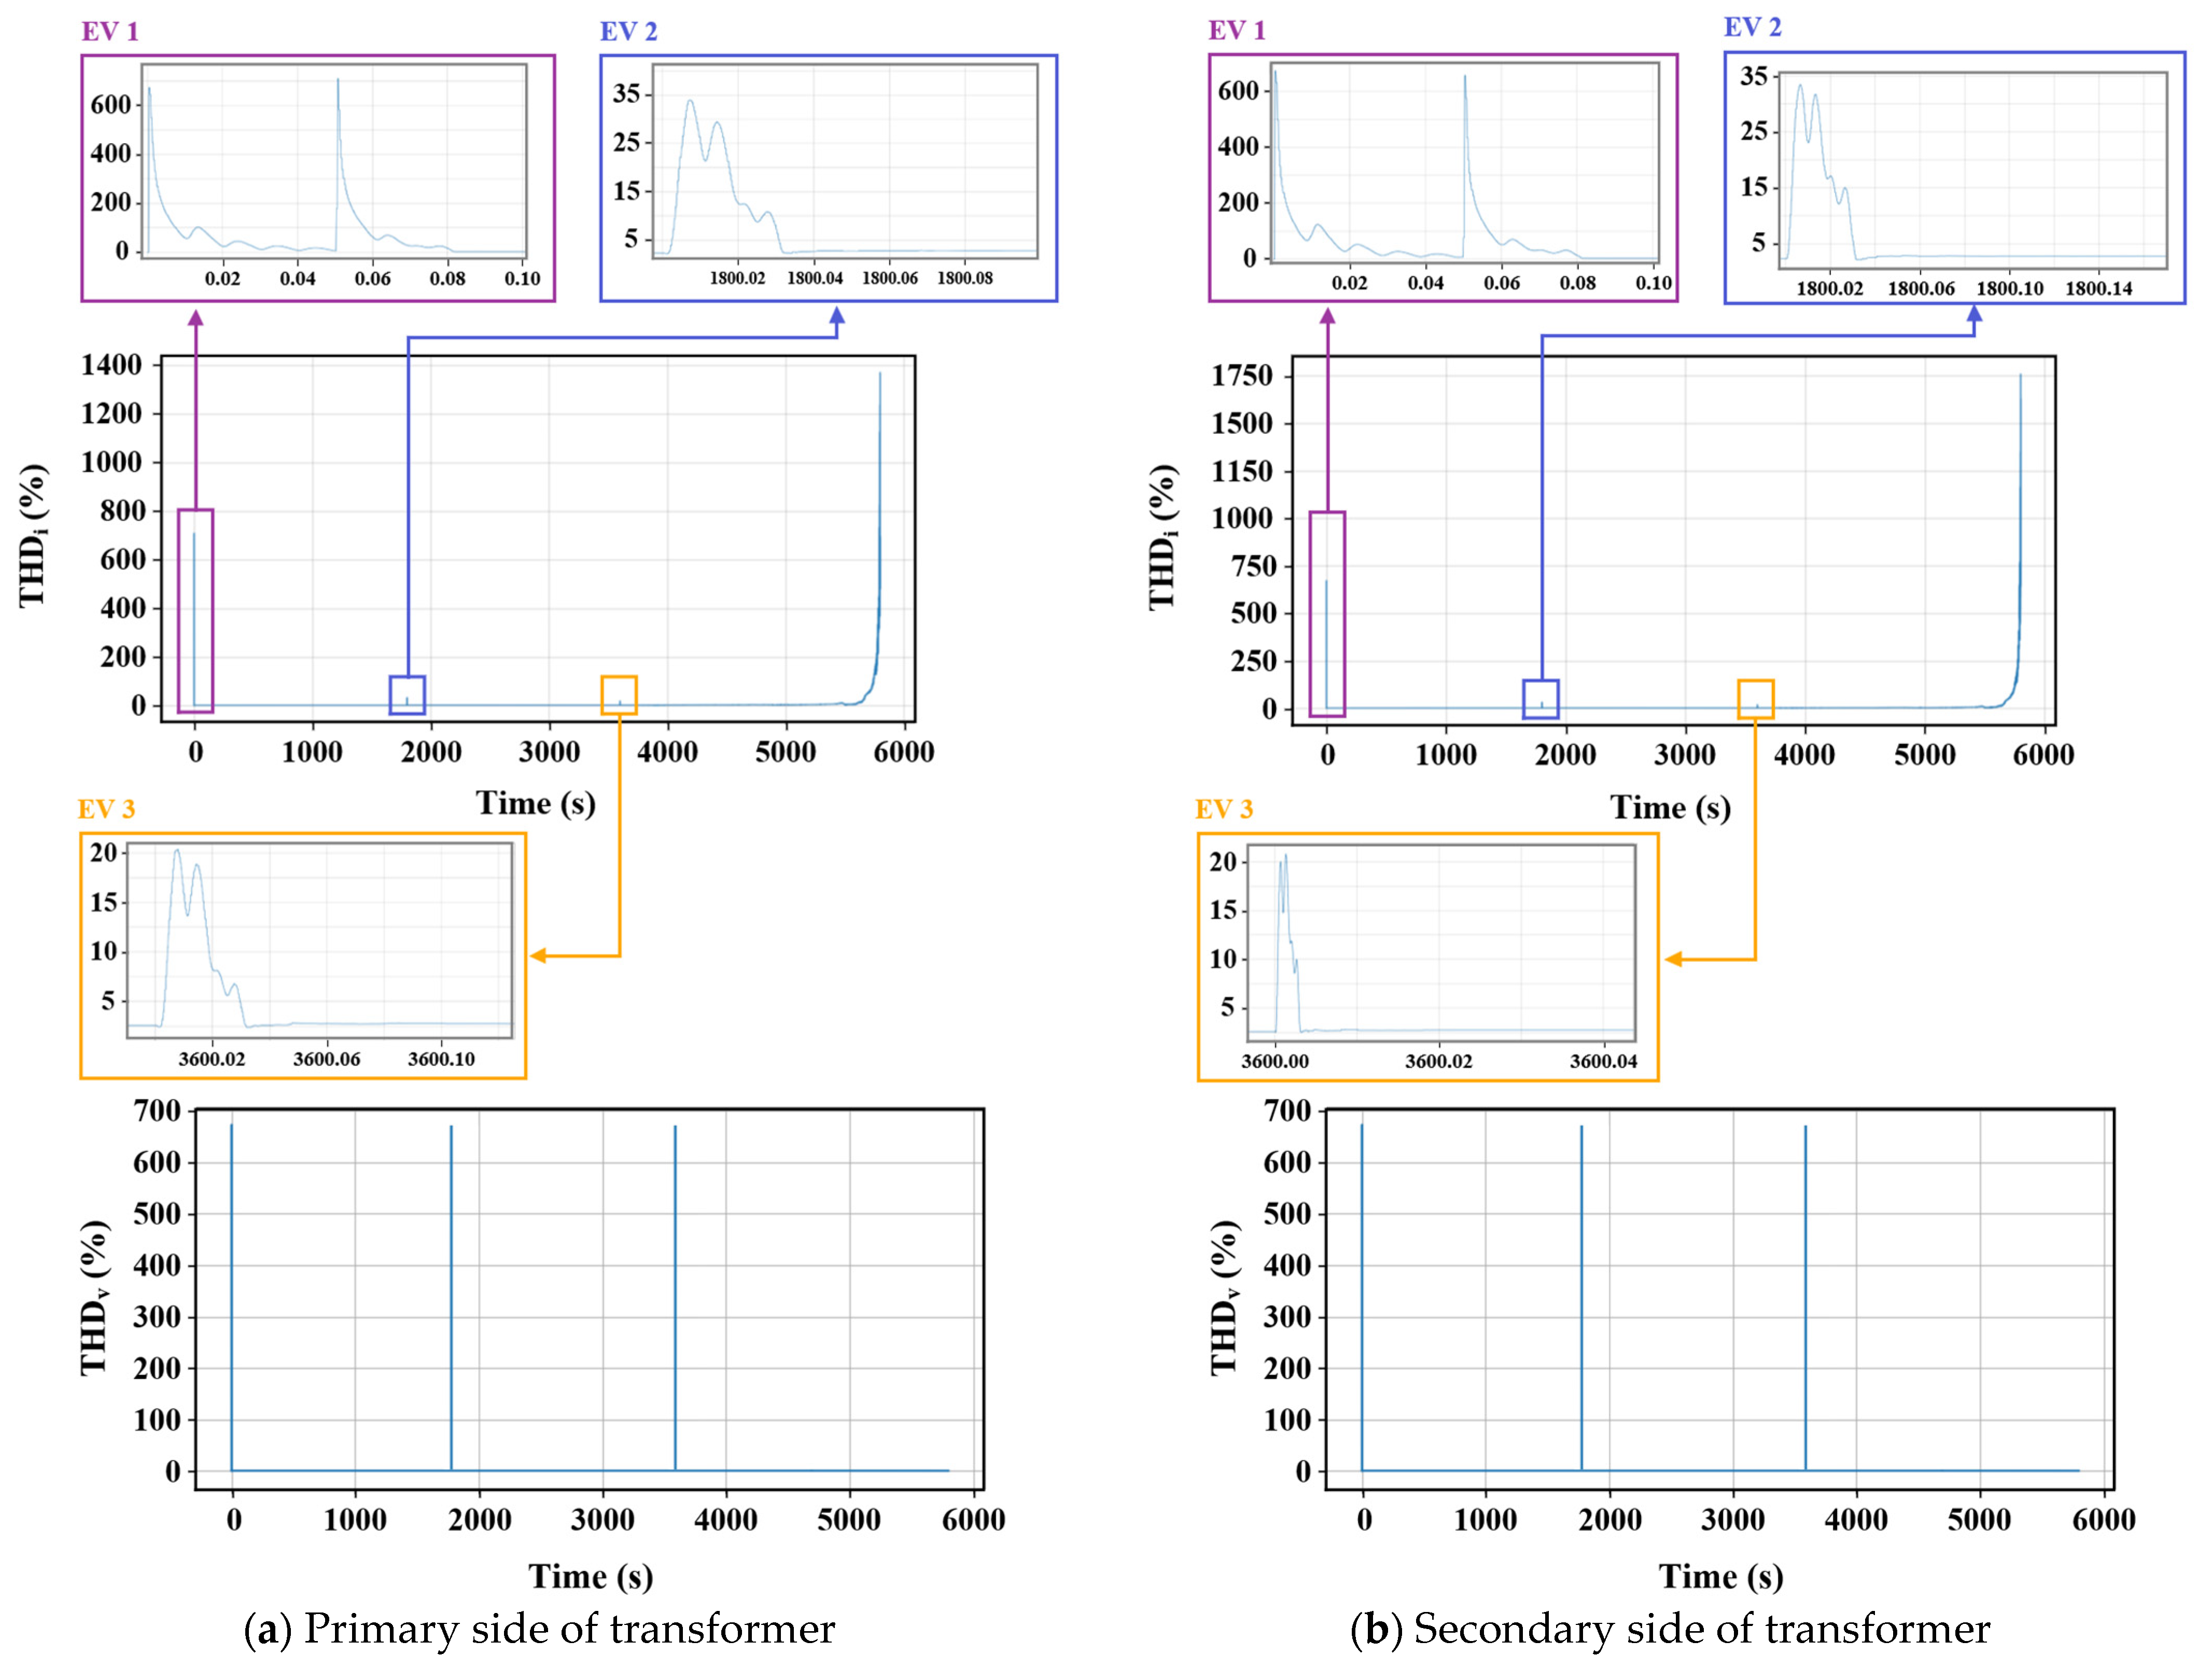
Figure 15 illustrates the electrical response at the transformer during various EV-charging scenarios, where electric vehicles are connected at different times with varying initial SoCs. Measurements are captured on both the primary side (24 kV; Figure 15a) and the secondary side (400 V; Figure 15b) to examine the effects of dynamic and staggered EV charging on transformer performance, power quality, and harmonic distortion.

3.2.1. Transformer-Side Analysis

The active power graph reveals a stepwise demand increase as each EV initiates charging. Initially, power consumption rises to approximately 50 kW, then escalates to 100 kW when the second EV connects at 1800 s, and ultimately peaks near 140 kW as the third EV joins the system at 3600 s. This stepped power pattern distinctly indicates the non-simultaneous charging characteristic of this setup. After 4000 s, power gradually decreases as each EV completes charging and shifts to the CV phase.
The current waveform mirrors this stepped trend. On the primary side, the current magnitude remains below 6 A, aligning with the high-voltage, low-current nature of the 24 kV side. Conversely, on the secondary side, the current peaks around 300 A, driven by the cumulative demand of three fully loaded EVs. These dynamic current fluctuations introduce transient loading effects, especially during EV connection and disconnection, which could challenge transformer regulation unless mitigated by control strategies such as pre-charge circuits or ramp-rate limiters in the electric vehicle supply equipment. Despite dynamic current loading, the voltage waveform remains highly sinusoidal and stable on both transformer sides. On the primary side, the waveform is sustained near the nominal 24 kV, whereas the secondary side maintains 400 V RMS, with negligible sag or deviation throughout the charging period. The results indicate robust voltage stiffness of both the transformer and the upstream system, alongside effective voltage regulation even during overlapping charging intervals.
The THDi displays pronounced spikes corresponding with each EV connection event. On both the primary and secondary sides, the THDi briefly exceeds 1000% during the initial few seconds of each charging phase. These spikes result from the activation of power electronic converters, notably the inrush currents and switching transients associated with rectifiers and DC–DC converters. Nevertheless, THDi values stabilize shortly after each transition, decreasing to below 5% during steady-state charging. This demonstrates that harmonic filtering systems and circuit design effectively attenuate distortion following transients. The THDv remains consistently low—under 1.25%—throughout the process, with minor transient fluctuations that do not compromise system stability. This indicates that while charging dynamics introduce current harmonics, they do not significantly propagate into the voltage waveform due to system impedance and filtering.
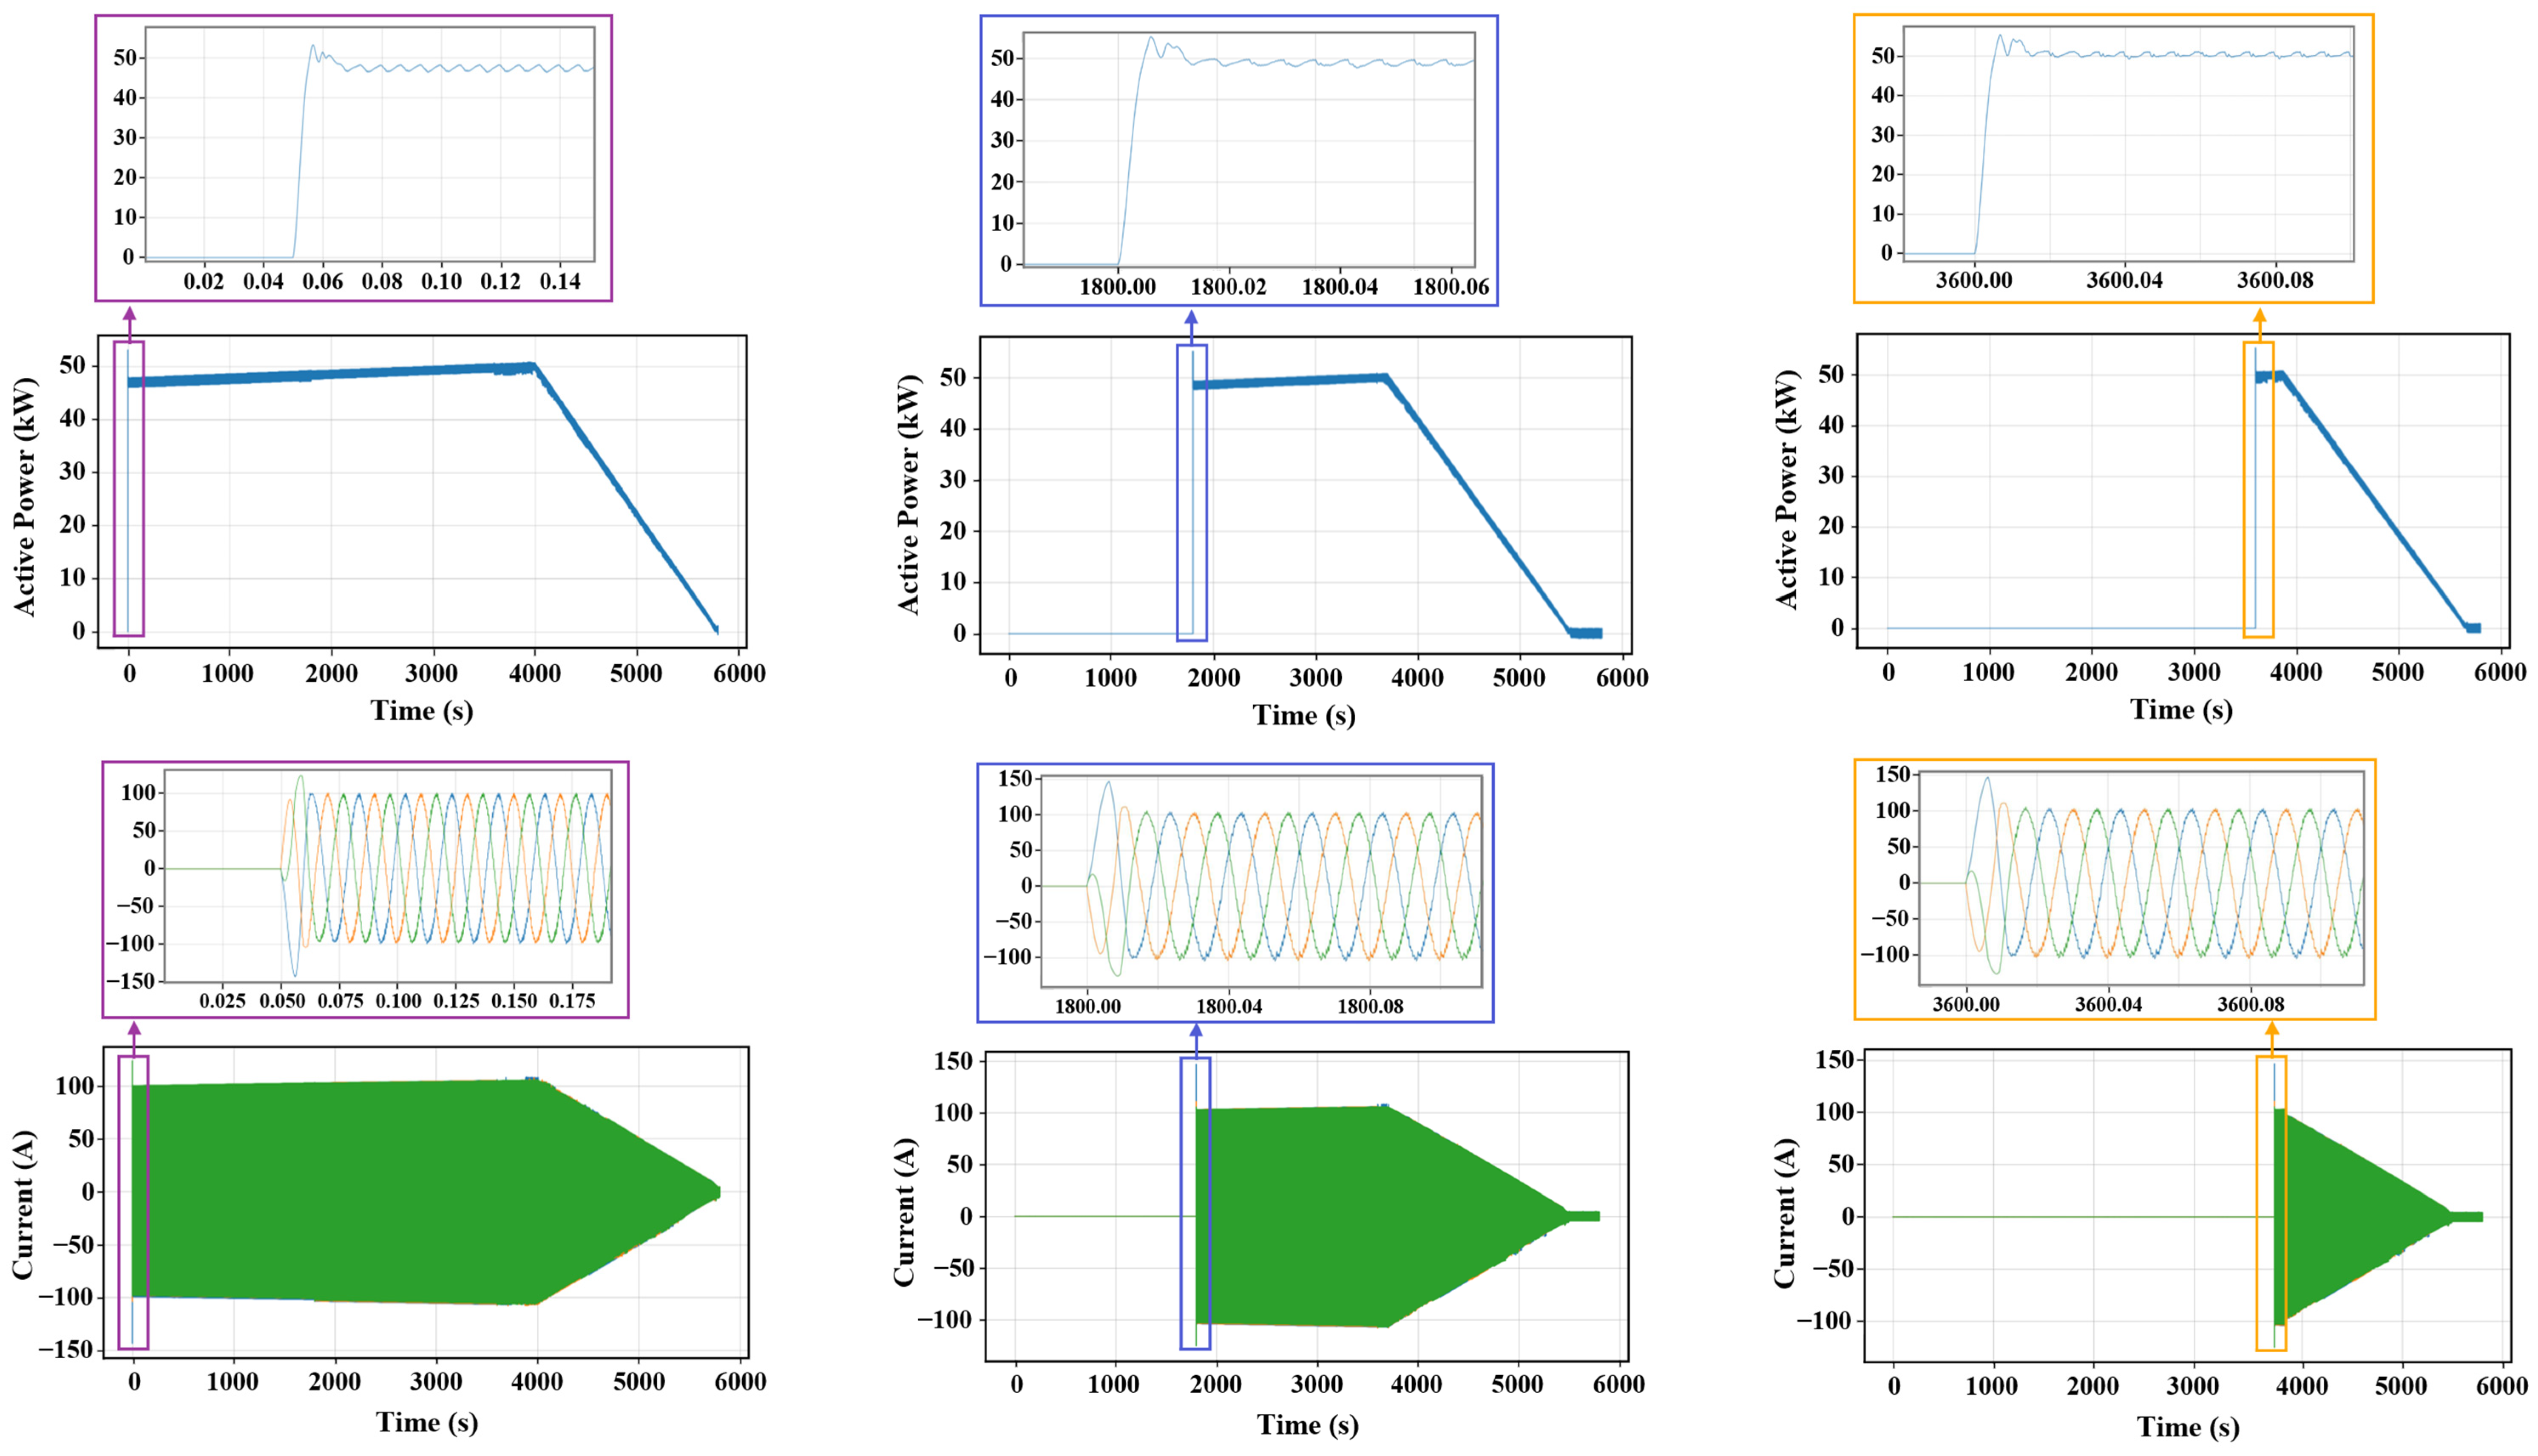
Figure 16 illustrates the power quality and electrical behavior at charging units G1, G2, and G3 during a varied EV-charging scenario, where three electric vehicles are charged at different times with distinct initial states of charge. The units are monitored for active power, current, voltage, and both current and voltage total harmonic distortion (THDi and THDv).
For unit G1 in Figure 16a, active power starts at 50 kW as EV1 connects with a 10% SoC and is maintained during the constant-current phase. As charging progresses toward 100% SoC (4000 s), the power tapers off, consistent with the CV phase. Similarly, in Figure 16b,c, charging units G2 and G3 begin their operations at staggered intervals; specifically, unit G2 starts supplying power at approximately 1800 s for EV2 with an initial SoC of 50%, while unit G3 activates at around 3600 s to charge EV3 beginning from an 80% SoC. These delayed charging events yield distinct power response curves at each unit, characterized by unique CC and CV charging trajectories that reflect the respective battery conditions and control modes. The current patterns closely mirror the power profile, surging rapidly upon connection and tapering gradually as charging concludes. This asynchronous behavior induces time-shifted current loading across each unit, enabling partial system utilization at any given moment and mitigating instantaneous stress on upstream components.
Across all three units, voltage remains highly sinusoidal and stable, consistently maintained near the nominal 400 V throughout the entire charging session. The voltage profiles reveal no significant sag or distortion, signifying robust support from the upstream distribution transformer and low internal impedance within the charging infrastructure.
As illustrated in the THDi plots, each unit exhibits a sharp harmonic spike at the moment of EV connection (notably, G1 at 0 s, G2 at 1800 s, and G3 at 3600 s). These spikes are attributed to the initial activation of the power electronics, specifically, IGBT-based inverters and DC–DC converters. However, harmonic current levels swiftly diminish and remain below 5% during steady-state charging, complying with IEEE Std 519-2014 standards for systems under 69 kV. Conversely, the THDv stays consistently low across all charging units—typically below 1.5%—highlighting the impedance of the system and the ability of the filtering components to prevent current harmonics from distorting the voltage waveform. This outcome demonstrates effective harmonic isolation and coordination between grid-side and charger-side controllers.

3.2.2. Charging Adapter Analysis

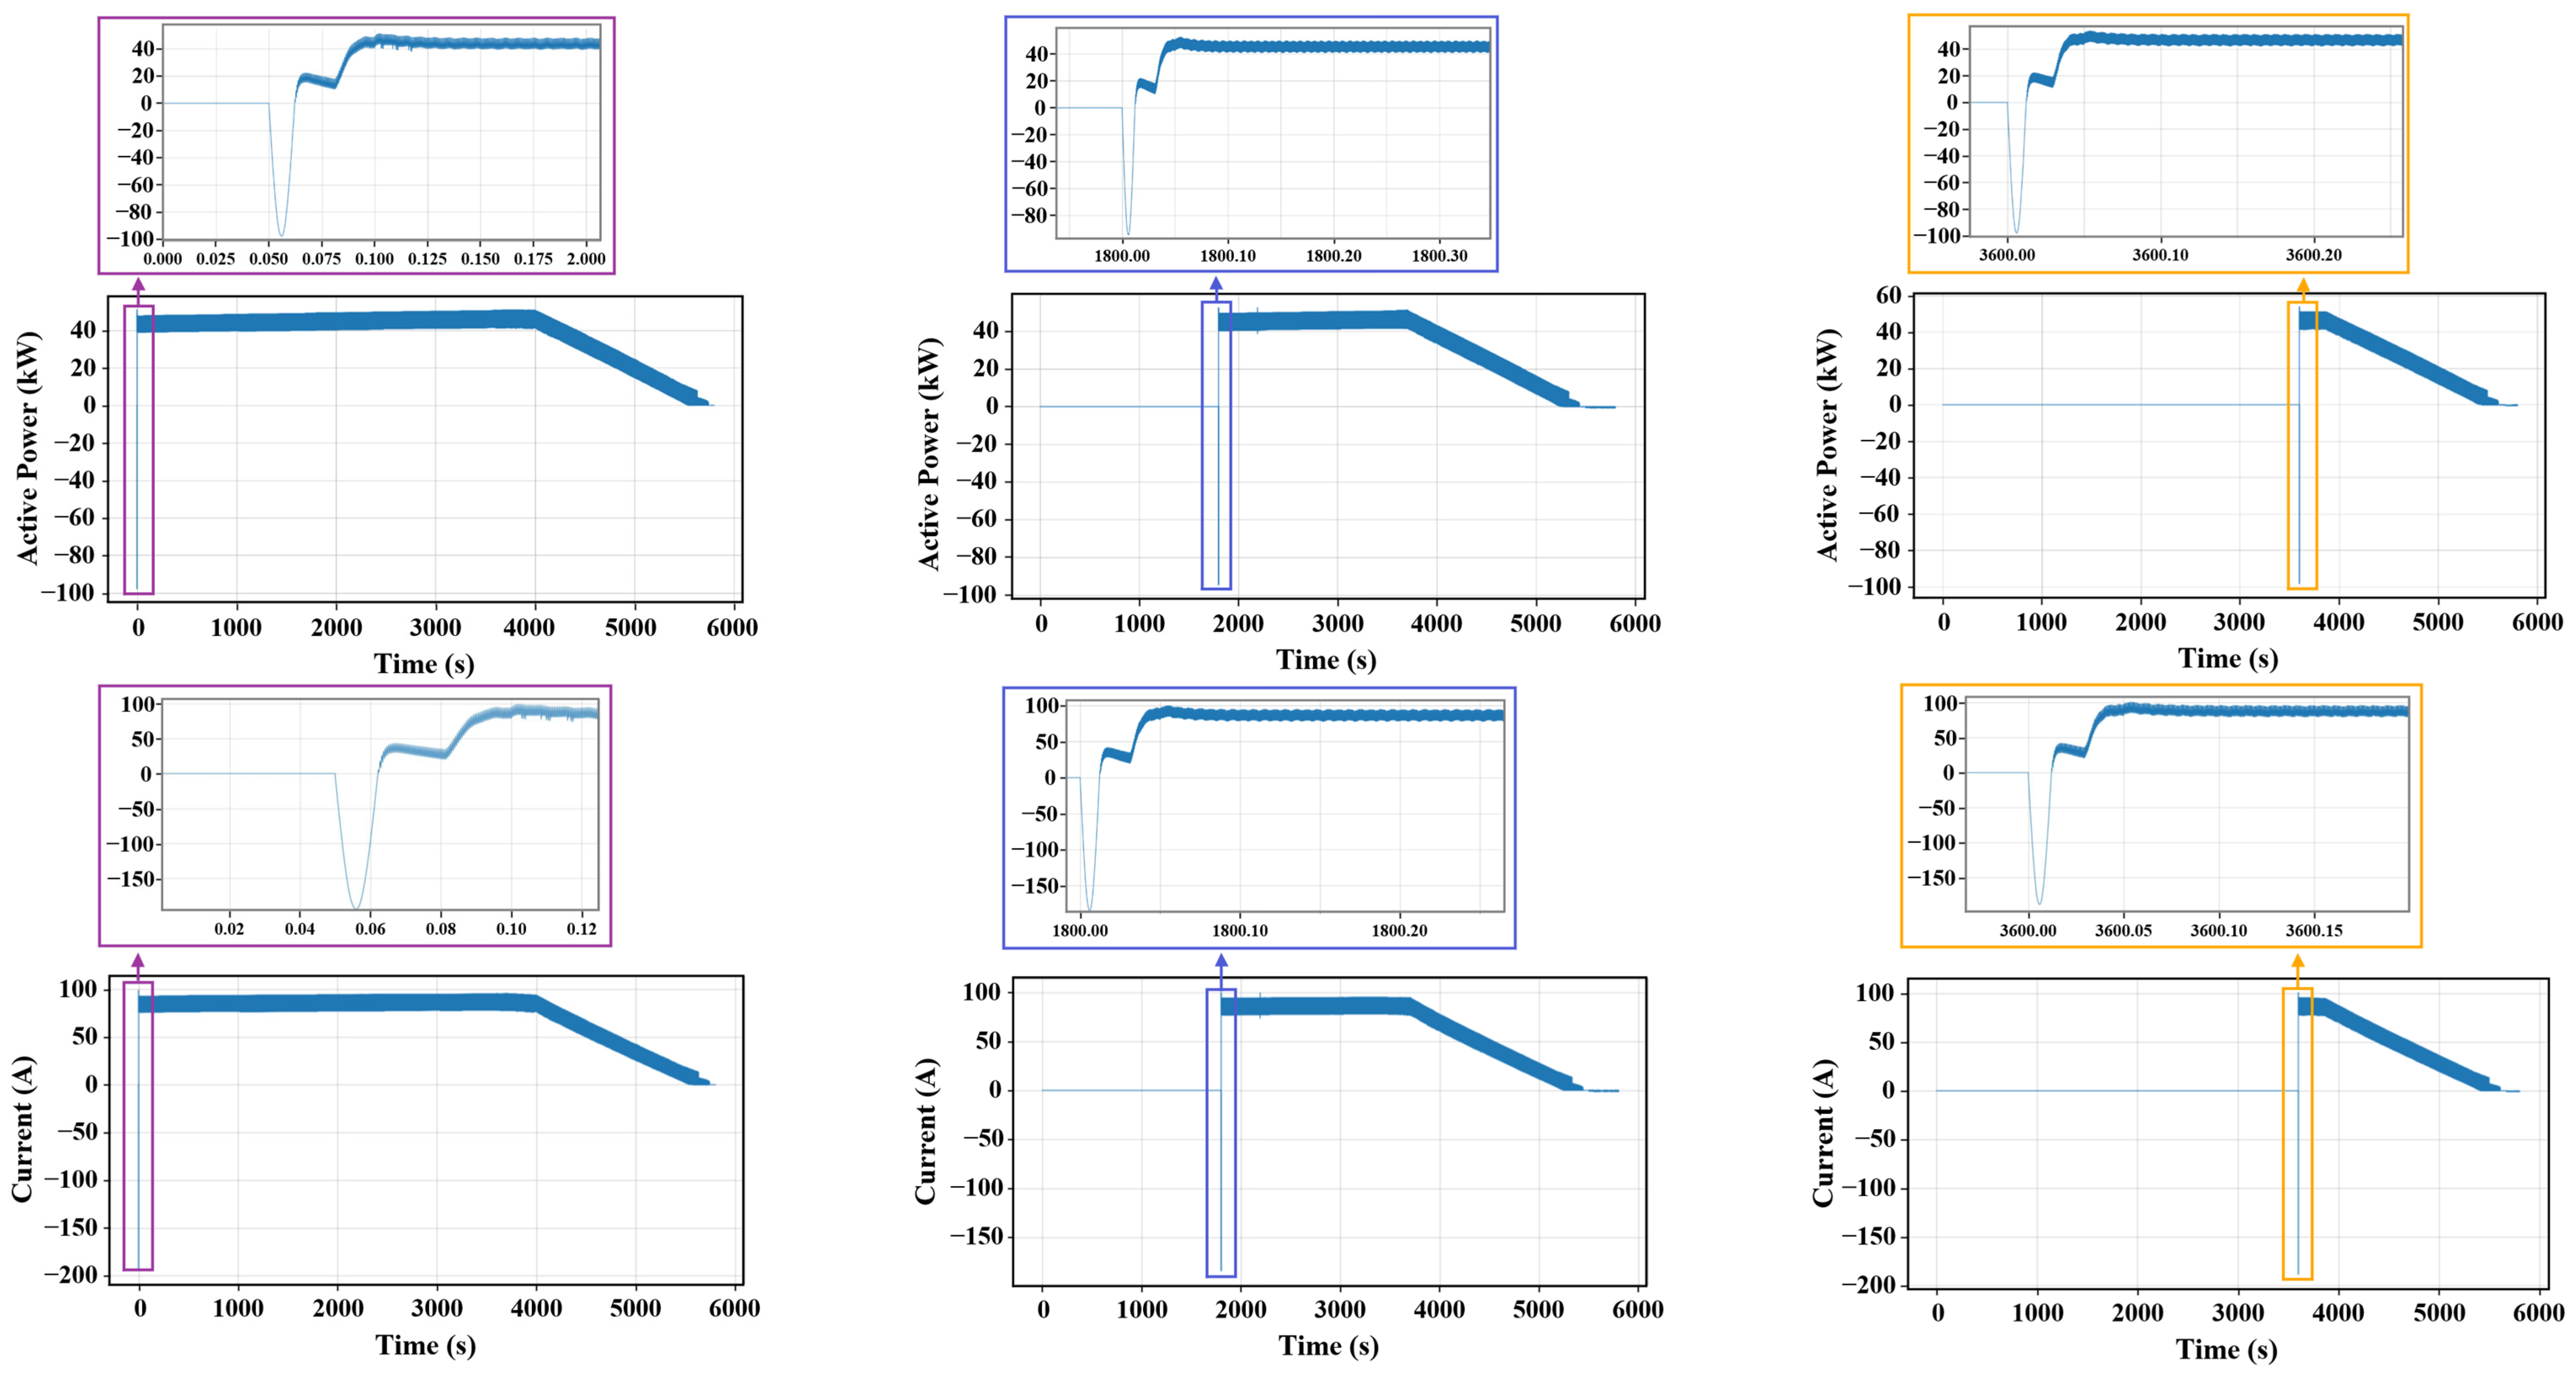
Figure 17 illustrates the electrical behavior of DC fast-charging adapters DC11, DC21, and DC31 during a scenario involving asynchronous electric vehicle charging with a varied initial battery SoC. These adapters correspond to EV1, EV2, and EV3, respectively, operating under time-staggered service conditions that reflect real-world charging patterns.
As illustrated in Figure 17a, adapter DC11 begins charging EV1 at t = 0 s, which starts with an SoC of 10%. The active power swiftly rises to approximately 45 kW during the CC phase and remains steady until around 4000 s, after which it gradually decreases as the system transitions to the CV phase. This pattern is also evident in the current waveform, which sharply increases and stabilizes before slowly declining as the SoC approaches 100%.
In Figure 17b, adapter DC21 activates at approximately 1800 s to charge EV2, which has an initial SoC of 50%. The power response follows the same CC–CV trajectory but over a shorter timeframe. Similarly, Figure 17c shows adapter DC31 commencing charging at 3600 s for EV3, which starts with an 80% SoC. Owing to the high initial SoC, the CC phase is brief, and the majority of the session operates in CV mode, resulting in a lower average current and a quicker SoC completion. Across all adapters, power control remains well-regulated, with no power oscillations or reverse power flow observed beyond the initial startup transients.
The adapter voltage waveforms are well regulated. They begin at approximately 520 V and increase gradually to 615–620 V over the charge, consistent with the expected transition from constant-current to constant-voltage operation and the associated rise in battery terminal voltage. The narrow, needle-like spikes visible at 0, 1800, and 3600 s coincide with plug-in events, when the DC link is energized and the buck converter starts ramping its duty ratio. In short electromagnetic transients analysis windows the fundamental component is not yet established, so the recorder samples high-frequency SPWM switching ripple precisely as the circuit state changes. The combination of initial-condition mismatch and decimation of a kHz waveform to a lower plotting rate produces single-sample artifacts that appear as spikes. These brief start-up transients do not affect steady-state regulation or the power-quality assessment.
The SoC curves display typical profiles associated with lithium-ion charging. Specifically, for DC11, the SoC increases linearly during the CC phase and then plateaus as it transitions to the CV mode. DC21 and DC31 exhibit similar patterns, varying in duration and slope based on their respective initial SoC values. Notably, DC31 completes charging more rapidly due to its higher initial SoC, resulting in a brief and predominantly voltage-controlled phase.

4. Discussion

This work used an implementation-ready dq–vector control (PI–SPWM) on a VSC, coupled with realistic CC–CV charging and EMT (electromagnetic transient) (PSCAD/EMTDC) modeling calibrated to Thai distribution parameters. The goal was not to invent a new converter topology, but to demonstrate standards-compliant power quality under asynchronous multi-port fast charging with deployable settings. In addition, we compared this approach with alternative solutions across core ideas/scope, power quality focus, and representative findings, strengths, and gaps versus this work, as presented in Table 5.

5. Conclusions

This research addressed the practical problem of maintaining distribution-level power quality during asynchronous, multi-port EV fast charging on a Thai distribution feeder using an implementation-ready control approach. An end-to-end EMT (PSCAD/EMTDC) model was assembled from standard library components and calibrated with Thai network parameters. Grid-side vector control (PI–SPWM in the d q frame) was coupled with a DC-side CC–CV charging stage and evaluated under varying SoC levels and staggered/simultaneous plug-ins.
  • Base case: There was minimal disturbance, with a total active power of 1.6 kW from internal standby loads. Harmonic distortion was well within IEEE Std 519-2014. Voltages were highly stable at 24 kV (primary) and at the secondary (400 V AC at transformer secondary, and 500 V DC at adapter side).
  • EV-charging scenario: System loading increased markedly, peaking at 140 kW during concurrent charging of three EVs. Secondary-side currents rose to 300 A, while voltage waveforms remained stable and nearly sinusoidal, indicating robust regulation.
  • THD behavior: The THDi showed brief spikes at charging initiation due to power-converter energization and then fell below 5% in the steady state. The THDv consistently remained < 1.5%, evidencing effective harmonic control.
  • Charging profiles and DC adapters: Chargers followed the expected CC–CV profiles with asynchronous operation that helped distribute demand over time. DC adapters delivered smooth power transitions and tracked SoC requirements, dynamically regulating output voltages between 520 V and 620 V.
  • Standards compliance (all nodes): Across all scenarios and measurement points (transformer secondary, charger AC terminals, and DC adapters), the steady-state THDi < 5% and THDv < 1.5% were maintained in accordance with IEEE Std 519-2014.
  • Transient THD note: Transient apparent THD spikes at plug-in, caused by a temporarily small fundamental in short analysis windows, were brief and were excluded from compliance metrics by using fundamental-synchronized steady-state windows.
Finally, the results provide actionable guidance for planning and scaling fast-charging infrastructure in urban Thai networks, i.e., 1. harmonic margins compatible with existing feeders and interfacing transformers, 2. verification that multi-port, staggered operation can meet IEEE 519-2014 limits with standard control, and 3. a transparent procedure for utility power quality assessments. In future work, novel adaptive control and grid-supportive functionalities in next-generation EV systems will be investigated.

Author Contributions

P.C.: conceptualization and funding acquisition; P.S.: formal analysis and performing the experiments; J.K.: visualization and data validation; S.Y.: analyzing the data and writing the original paper; A.N.: designing the experiment and reviewing and editing; S.A.: resource and project administration. All authors have read and agreed to the published version of the manuscript.

Funding

This research was funded by the Srinakharinwirot University Research Fund.

Institutional Review Board Statement

Not applicable.

Informed Consent Statement

Not applicable.

Data Availability Statement

The original contributions presented in this study are included in this article. Further inquiries can be directed to the corresponding author.

Acknowledgments

The authors wish to gratefully acknowledge the financial support for this research from the Srinakharinwirot University Research Fund.

Conflicts of Interest

The authors declare no conflicts of interest.

References

  1. International Energy Agency. Global EV Outlook 2025: Expanding Sales in Diverse Markets; IEA Publications: Paris, France, 2025. [Google Scholar]
  2. Electric Vehicle Association of Thailand (EVAT). Thailand Electric Vehicle Outlook 2022; EVAT: Bangkok, Thailand, 2022. [Google Scholar]
  3. IEEE Std 519-2014; Recommended Practice and Requirements for Harmonic Control in Electric Power Systems. IEEE Standards Association: New York, NY, USA, 2014.
  4. TIS 61851-1:2021; Electric Vehicle Conductive Charging System—Part 1: General Requirements. Thai Industrial Standards Institute (TISI), Ministry of Industry: Bangkok, Thailand, 2021.
  5. TIS 62196-1/2/3; Plugs, Socket-Outlets, Vehicle Connectors and Vehicle Inlets for EVs. Thai Industrial Standards Institute (TISI), Ministry of Industry: Bangkok, Thailand, 2022.
  6. TIS 60364-7-722; Low-Voltage Electrical Installations—Part 7-722: Supplies for Electric Vehicles. Thai Industrial Standards Institute (TISI), Ministry of Industry: Bangkok, Thailand, 2018.
  7. Metropolitan Electricity Authority. Technical Requirements for Connecting EV Chargers to the MEA Distribution Network. Available online: https://www.mea.or.th (accessed on 17 July 2025).
  8. Provincial Electricity Authority. Guideline for EV Charger Installation and Grid Interconnection for Customers. Available online: https://www.pea.co.th (accessed on 17 July 2025).
  9. UL 2202; Standard for Electric Vehicle (EV) Charging System Equipment. Underwriters Laboratories, UL Standards: Northbrook, IL, USA, 2016.
  10. UL 2231; Standard for Personnel Protection Systems for Electric Vehicle (EV) Supply Circuits. Underwriters Laboratories, UL Standards: Northbrook, IL, USA, 2016.
  11. Burra, L.T.; Al-Khasawneh, M.B.; Cirillo, C. Impact of charging infrastructure on electric vehicle adoption: A synthetic population approach. Travel Behav. Soc. 2024, 37, 100834. [Google Scholar] [CrossRef]
  12. Luo, Y.; Xu, X.; Yang, Y.; Liu, Y.; Liu, J. Impact of electric vehicle disordered charging on urban electricity consumption. Renew. Sustain. Energy Rev. 2025, 212, 115449. [Google Scholar] [CrossRef]
  13. Lin, W.; Wei, H.; Yang, L.; Zhao, X. Technical review of electric vehicle charging distribution models with considering driver behaviors impacts. J. Traffic Transp. Eng. (Engl. Ed.) 2024, 11, 643–666. [Google Scholar] [CrossRef]
  14. Ahmad, S.; Chaveesuk, S.; Chaiyasoonthorn, W. Impact of charging infrastructure on willingness to pay for EV: Mediating role of driving experience and behavior intentions. Acta Psychol. 2025, 254, 104833. [Google Scholar] [CrossRef] [PubMed]
  15. Wang, H.; Guo, F.; Sivakumar, A. Analysing the impact of electric vehicle charging on households: An interrelated load profile generation approach. Energy Build. 2025, 335, 115558. [Google Scholar] [CrossRef]
  16. Li, B.; Chang, X. EV Charging Station Load Prediction in Coupled Urban Transportation and Distribution Networks. Energy Eng. 2024, 121, 3001–3018. [Google Scholar] [CrossRef]
  17. Abiassaf, G.A.; Arkadan, A.A. Impact of EV Charging, Charging Speed, and Strategy on the Distribution Grid: A Case Study. IEEE J. Emerg. Sel. Top. Ind. Electron. 2024, 5, 531–542. [Google Scholar] [CrossRef]
  18. Su, L.; Gurumurthy, K.M.; Kockelman, K.M. Siting and sizing of public–private charging stations impacts on household and electric vehicle fleets. Transp. Res. Part A Policy Pract. 2025, 195, 104436. [Google Scholar] [CrossRef]
  19. Yao, H.; Xiang, Y.; Gu, C.; Liu, J. Optimal Planning of Distribution Systems and Charging Stations Considering PV-Grid-EV Transactions. IEEE Trans. Smart Grid 2025, 16, 691–703. [Google Scholar] [CrossRef]
  20. Khan, M.O.; Kirmani, S.; Rihan, M. Impact assessment of electric vehicle charging on distribution networks. Renew. Energy Focus 2024, 50, 100599. [Google Scholar] [CrossRef]
  21. Barnabé, G.P.; Tofoli, F.L.; Mello, L.S.; Sampaio, R.F.; Antunes, F.L.M.; Leão, R.P.S. Non-intrusive demand response management strategy to mitigate the impacts of residential electric vehicle charging on distribution systems. Electr. Power Syst. Res. 2024, 235, 110849. [Google Scholar] [CrossRef]
  22. Brodnicke, L.; Kachirayil, F.; Gabrielli, P.; Sansavini, G.; McKenna, R. Transforming decentralized energy systems: Flexible EV charging and its impact across urbanization degrees. Appl. Energy 2025, 384, 125303. [Google Scholar] [CrossRef]
  23. Heider, A.; Moors, F.; Hug, G. Impact of Smart Charging and Vehicle-to-Grid Technologies on Flexibility and Grid Expansion Requirements in German Distribution Networks. IEEE Trans. Ind. Appl. 2025, 61, 4822–4832. [Google Scholar] [CrossRef]
  24. Bernal-Sancho, M.; Rocca, R.; Fernández-Aznar, G.; Comech, M.P.; Galán-Hernández, N. Grid Impact of Frequency Regulation Provided by V2Gs Aggregated at HV, MV, and LV Level. IEEE Access 2023, 11, 76768–76780. [Google Scholar] [CrossRef]
  25. Heider, A.; Helfenbein, K.; Schachler, B.; Röpcke, T.; Hug, G. On the Integration of Electric Vehicles Into German Distribution Grids Through Smart Charging. IEEE Trans. Ind. Appl. 2025, 61, 2001–2010. [Google Scholar] [CrossRef]
  26. Chen, J.; Aurangzeb, M.; Iqbal, S.; Shafiullah, M.; Harrison, A. Advancing EV fast charging: Addressing power mismatches through P2P optimization and grid-EV impact analysis using dragonfly algorithm and reinforcement learning. Appl. Energy 2025, 394, 126157. [Google Scholar] [CrossRef]
  27. Zhu, X.; Mishra, P.; Mather, B.; Zhang, M.; Meintz, A. Grid Impact Analysis and Mitigation of En-Route Charging Stations for Heavy-Duty Electric Vehicles. IEEE Open Access J. Power Energy 2023, 10, 141–150. [Google Scholar] [CrossRef]
  28. Roy, P.; Ilka, R.; He, J.; Liao, Y.; Cramer, A.M.; Mccann, J. Impact of Electric Vehicle Charging on Power Distribution Systems: A Case Study of the Grid in Western Kentucky. IEEE Access 2023, 11, 49002–49023. [Google Scholar] [CrossRef]
  29. Zou, Q.; Qian, S.; Detwiler, D.; Chhajer, R. Impacts of vehicle electrification on large-scale transportation and charging infrastructure: A dynamic network modeling approach. Case Stud. Transp. Policy 2025, 20, 101401. [Google Scholar] [CrossRef]
  30. Wu, Y.; Aziz, S.M.; Haque, M.H.; Kauschke, T. New staggered time-of-use tariffs to mitigate the impact of electric vehicle charging demand on distribution networks. Sustain. Energy Grids Netw. 2025, 42, 101682. [Google Scholar] [CrossRef]
  31. Sarmokadam, S.; Suresh, M.; Mathew, R. Power flow control strategy for prosumer based EV charging scheme to minimize charging impact on distribution network. Energy Rep. 2025, 13, 3794–3809. [Google Scholar] [CrossRef]
  32. James, J.; Jasmin, E.A. Stochastic modeling of electric vehicle charging and impacts on the grid. Electr. Power Syst. Res. 2025, 246, 111659. [Google Scholar] [CrossRef]
  33. Gnann, T.; Yu, S.; Stute, J.; Kühnbach, M. The value of smart charging at home and its impact on EV market shares—A German case study. Appl. Energy 2025, 380, 124997. [Google Scholar] [CrossRef]
  34. Chemudupaty, R.; Bahmani, R.; Fridgen, G.; Marxen, H.; Pavić, I. Uncertain electric vehicle charging flexibility, its value on spot markets, and the impact of user behaviour. Appl. Energy 2025, 394, 126063. [Google Scholar] [CrossRef]
  35. Yu, Y.; De Herdt, L.; Shekhar, A.; Mouli, G.R.C.; Bauer, P. EV Smart Charging in Distribution Grids–Experimental Evaluation Using Hardware in the Loop Setup. IEEE Open J. Ind. Electron. Soc. 2024, 5, 13–27. [Google Scholar] [CrossRef]
  36. Li, X.; Han, Q. An EV Charging Station Load Prediction Method Considering Distribution Network Upgrade. IEEE Trans. Power Syst. 2024, 39, 4360–4371. [Google Scholar] [CrossRef]
  37. Xia, Y.; Gu, X.; Fu, D.; Chen, X. Large Scale EV Charging Allocation in Unbalanced Multi-Microgrid System. IEEE J. Emerg. Sel. Top. Circuits Syst. 2023, 13, 797–805. [Google Scholar] [CrossRef]
  38. Gönül, Ö.; Duman, A.C.; Güler, Ö. Sizing of interoperable EV charging stations on highways with a coordinated charging scheduling strategy. Eng. Sci. Technol. Int. J. 2025, 65, 102035. [Google Scholar] [CrossRef]
  39. Wang, Y.; Wang, H.; Razzaghi, R.; Jalili, M.; Liebman, A. Multi-objective coordinated EV charging strategy in distribution networks using an improved augmented epsilon-constrained method. Appl. Energy 2024, 369, 123547. [Google Scholar] [CrossRef]
  40. Yu, H.; Zhang, Y.; Qu, J.; Ji, H.; Yu, J.; Song, G.; Sun, B.; Zhao, J. A privacy-protected distributed operation method for flexible distribution networks with EV charging load clusters. Energy 2025, 327, 136409. [Google Scholar] [CrossRef]
  41. Li, X.; Yip, C.; Dong, Z.Y.; Zhang, C.; Wang, B. Hierarchical control on EV charging stations with ancillary service functions for PV hosting capacity maximization in unbalanced distribution networks. Int. J. Electr. Power Energy Syst. 2024, 160, 110097. [Google Scholar] [CrossRef]
  42. Nakhodchi, N.; Bollen, M.H.J. Impact of modelling of MV network and remote loads on estimated harmonic hosting capacity for an EV fast charging station. Int. J. Electr. Power Energy Syst. 2023, 147, 108847. [Google Scholar] [CrossRef]
  43. Visakh, A.; Selvan, M.P. Analysis and mitigation of the impact of electric vehicle charging on service disruption of distribution transformers. Sustain. Energy Grids Netw. 2023, 35, 101096. [Google Scholar] [CrossRef]
  44. Fani, H.; Hashmi, M.U.; Deconinck, G. Impact of electric vehicle charging simultaneity factor on the hosting capacity of LV feeder. Sustain. Energy Grids Netw. 2024, 40, 101581. [Google Scholar] [CrossRef]
  45. Deshmukh, S.; Tariq, H.; Amir, M.; Iqbal, A.; Marzband, M.; Al-Wahedi, A.M.A.B. Impact Assessment of Electric Vehicles Integration and Optimal Charging Schemes Under Uncertainty: A Case Study of Qatar. IEEE Access 2024, 12, 131350–131371. [Google Scholar] [CrossRef]
  46. Vasconcelos, S.D.; da Costa Castro, J.F.; Gouveia, F.; de Moura Lacerda Filho, A.V.; Buzo, R.F.; de Medeiros, L.H.A. Assessment of Electric Vehicles Charging Grid Impact via Predictive Indicator. IEEE Access 2024, 12, 163307–163323. [Google Scholar] [CrossRef]
  47. Sarda, J.; Patel, N.; Patel, H.; Vaghela, R.; Brahma, B.; Bhoi, A.K.; Barsocchi, P. A review of the electric vehicle charging technology, impact on grid integration, policy consequences, challenges and future trends. Energy Rep. 2024, 12, 5671–5692. [Google Scholar] [CrossRef]
  48. Mojlish, S.A.K.; Sutanto, D.; Muttaqi, K.M. Impacts of ultra-fast charging of electric vehicles on power grids: State-of-the-art technologies, case studies, and a proposed improvement using a solid-state transformer. J. Energy Storage 2025, 107, 114913. [Google Scholar] [CrossRef]
  49. Senol, M.; Bayram, I.S.; Hunter, L.; Sevdari, K.; McGarry, C.; Gaona, D.C. Harmonics Measurement, Analysis, and Impact Assessment of Electric Vehicle Smart Charging. IEEE Open J. Veh. Technol. 2025, 6, 109–127. [Google Scholar] [CrossRef]
  50. Kazemtarghi, A.; Chandwani, A.; Ishraq, N.; Mallik, A. Active Compensation-Based Harmonic Reduction Technique to Mitigate Power Quality Impacts of EV Charging Systems. IEEE Trans. Transp. Electrif. 2023, 9, 1629–1640. [Google Scholar] [CrossRef]
  51. Jin, Y.; Acquah, M.A.; Seo, M.; Han, S. Optimal Siting and Sizing of EV Charging Station Using Stochastic Power Flow Analysis for Voltage Stability. IEEE Trans. Transp. Electrif. 2024, 10, 777–794. [Google Scholar] [CrossRef]
  52. Subash Kumar, C.S.; Saravanan, R.; Sankarakumar, S.; Srinivas, G. Optimizing power quality and placement of EV charging stations in a DC grid with PV-BESS using hybrid DOA-CHGNN approach. Electr. Power Syst. Res. 2025, 245, 111595. [Google Scholar] [CrossRef]
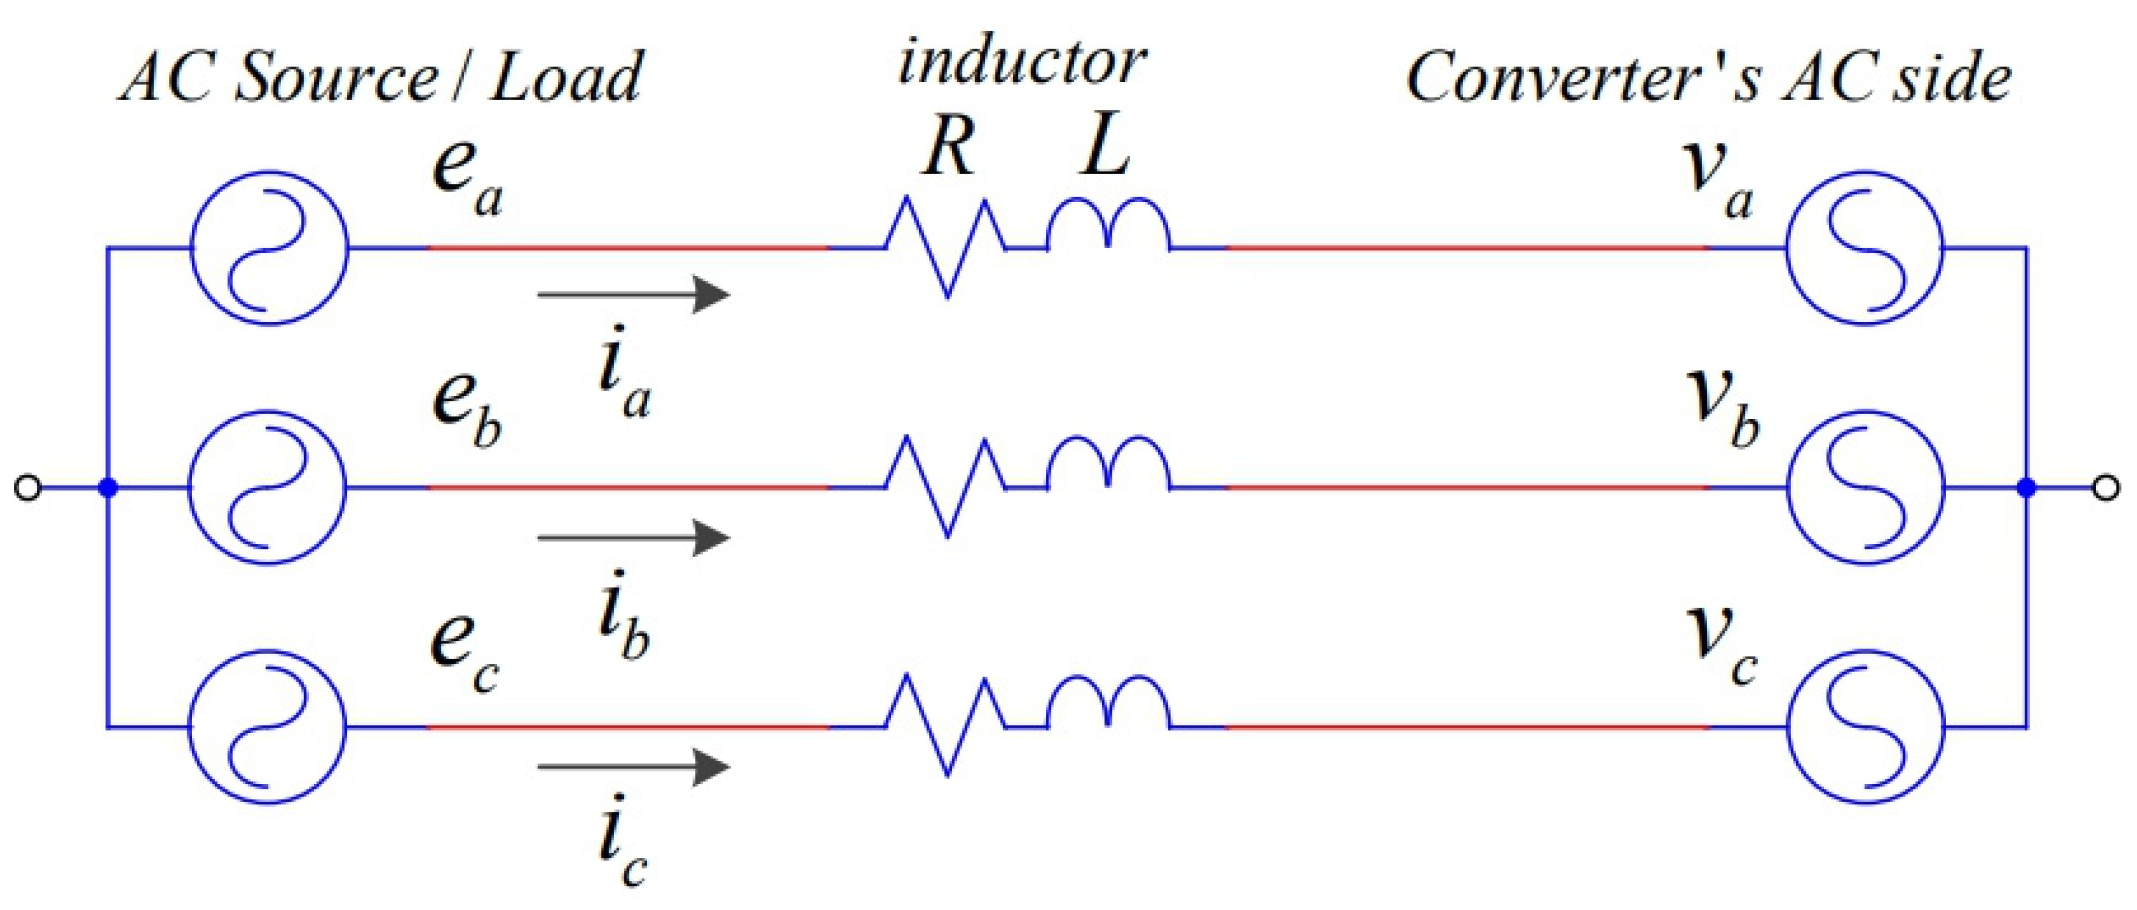
Figure 1. Equivalent AC-side model of the three-phase VSC.
Applsci 15 09645 g001
Figure 2. Stationary ( a b c ,   α β ) and rotating ( d q ) reference frames and their relative orientation.
Applsci 15 09645 g002
Figure 3. d q -frame equivalent circuit of the AC side, highlighting the cross-coupling terms ± ω L i q , d between the d and q channels.
Applsci 15 09645 g003
Figure 4. DC-side equivalent circuit.
Applsci 15 09645 g004
Figure 5. Combined schematic of the VSC showing the d q AC-side model and the DC-side link.
Applsci 15 09645 g005
Figure 6. Decoupled d q -frame PI current controller for a three-phase VSC.
Applsci 15 09645 g006
Figure 7. Buck converter governing the battery port in an EV charger.
Applsci 15 09645 g007
Figure 8. Layout of EV-charging station.
Applsci 15 09645 g008
Figure 9. EV-charging station model.
Applsci 15 09645 g009
Figure 10. Three-phase inverter circuit using IGBT modules.
Applsci 15 09645 g010
Figure 11. Active and reactive power conversion to dq reference currents. * = product/multiplier. It multiplies its inputs or multiplies a signal by the labeled constant.
Applsci 15 09645 g011
Figure 12. Conversion of reference currents to dq-axis voltage commands for current control. * = product/multiplier. It multiplies its inputs or multiplies a signal by the labeled constant.
Applsci 15 09645 g012
Figure 13. Buck converter circuit for voltage step-down.
Applsci 15 09645 g013
Figure 14. Measurement points for electrical parameters in an EV-charging station.
Applsci 15 09645 g014
Figure 15. Power quality in case of various EV-charging scenarios at the transformer.
Applsci 15 09645 g015aApplsci 15 09645 g015b
Figure 16. Power quality in case of various EV-charging scenarios at charging units.
Applsci 15 09645 g016aApplsci 15 09645 g016bApplsci 15 09645 g016c
Figure 17. Power quality in case of various EV-charging scenarios at the charging adapters.
Applsci 15 09645 g017aApplsci 15 09645 g017b
Table 1. Summary of EV charger standards and regulatory guidelines applicable in Thailand.
CategoryStandard/GuidelineGoverning BodyDescription
Product (EVSE)TIS 61851-1 (based on IEC 61851-1) [4]TISIMandatory standard for conductive EV-charging systems, including charging modes 1–4
TIS 62196-1/2/3 (based on IEC 62196) [5]TISISpecifies EV connectors, plugs, and sockets (type 1, type 2, CCS, and CHAdeMO)
InstallationTIS 60364-7-722 (based on IEC 60364-7-722) [6]TISIInstallation requirements for EV-charging systems in low-voltage environments
MEA/PEA EV Charger Installation Guidelines [7,8]MEA/PEATechnical requirements for safely connecting EV chargers to the utility grid
Power qualityIEEE Std 519-2014 (referenced by MEA/PEA) [3]Referenced in grid codesRegulates harmonic distortion: THDi ≤ 5%; THDv ≤ 5% at the point of common coupling (PCC)
Electrical safetyUL 2202/UL 2231 (for imported chargers) [9,10]TISI/ERCApplies to personal protection and safety of EV chargers
Table 2. Categorized EV article research summaries.
Research WorkGrid Impact and Mitigation StrategiesCharging and Control StrategiesBehavior, User Adoption, and Urban IntegrationPower Quality and Harmonics
[11] X
[12] X
[13] X
[14] X
[15] X
[16] X
[17]X XX
[18] X
[19]X
[20]X
[21]X X
[22]XXX
[23]XX
[24]X
[25]X
[26]XX
[27]X
[28]X
[29]X X
[30]X X
[31]X
[32]X
[33] X
[34] XX
[35]XX
[36] XX
[37] X
[38] X
[39] X X
[40] XX
[41] X
[42] X
[43] X
[44] XX
[45]X X
[46]X X
[47]XX X
[48]X X
[49] X X
[50] X
[51] X
[52]X X
This paperXXXX
Table 3. Electrical and performance characteristics of the BMW i3 battery.
DescriptionSpecification
Nominal voltage500 V
Battery capacity120 Ah
Nominal capacity42.2 kWh
Number of cells96
Storage technologyLithium-ion batteries
Loss of capacity at nominal current in an hour0.1%
Initial state of charge1.26%
Table 4. Base case simulation result (without EV charging).
Measuring PointsActive Power (kW)Reactive Power (kVar)Voltage
(V)
Current
(A)
THDi
(%)
THDv
(%)
Front TR0.48024,00000.50.6
Behind TR0.48040000.40.2
Charging unit no. G10.16040000.40.2
Charging unit no. G20.16040000.40.2
Charging unit no. G30.16040000.40.2
Adapter DC1100500000
Adapter DC1200500000
Adapter DC2100500000
Adapter DC2200500000
Adapter DC3100500000
Adaptor DC3200500000
Table 5. Comparative analysis of existing EV fast-charging grid interface solutions versus this work.
PapersCore Idea and ScopePower Quality Focus and Representative FindingsStrengthsGaps Versus This Work
[17]Methodology to project EV demand and grid impact to 2050; sensitivity to charging speed and user preferences; evaluates voltage and line limits.Planning-level power quality and hosting impacts; explores DG/RES as mitigation.Strategic view; captures behavior and adoption scenarios.Not an EMT converter-level study; lacks station-level THD compliance under asynchronous fast charging.
[39]Multi-objective scheduling on IEEE-33 bus; optimizes DNO cost, DN losses, and user cost.Cuts DN power loss (6%→2%); improves voltage stability.Rigorous trade-offs; Pareto-efficient solutions.Assumes schedules; no EMT coupling of VSC control with CC–CV charging and measured THDi/THDv at the station.
[42]Hosts a fast-charging station near a transformer; compares harmonic-voltage limits vs. transformer rating with stochastic analysis.Shows harmonic constraints can be binding; network impedance detail matters.Sound power quality framing; data-informed.Does not provide a station control recipe achieving THDi/THDv limits under asynchronous sessions.
[43]Assesses overload/thermal risk (IEEE C57.91) and shows controlled charging reduces disruption.Thermal indices (top-oil/hotspot) as primary risk metrics.Practical transformer-centric guidance.Thermal focus; not harmonic-compliance of a specific electric vehicle supply equipment control.
[45]Monte Carlo EV loads; DIgSILENT assessment; PV + reward scheme improves voltages.Voltage profile mitigation with PV and incentives.End-to-end uncertainty treatment.Does not verify station-level THD with practical control.
[46]Composite index (demand, SCC, THD, PF) from models + measurements.Aids early screening of EVSE impact.Managerial tool; predictive capability.Indicator-level; not control-design/EMT validation.
[49]Lab/field harmonics vs. current level; Monte Carlo aggregation.Worst-case aggregate 25% THD; cancellation sometimes helps.Empirical power quality evidence.Highlights risk; does not show a station control that guarantees THD limits.
[50]Active compensation to cut 3rd harmonic in PFC; THD 4.88%→4.03%.Component-level THD reduction.Concrete hardware/control refinement.Charger-front-end micro-level; not system EMT with grid coupling.
[52]Hybrid optimizer for DC-grid EVCS siting and quality; reports THD = 0.9%.PQ + cost + efficiency in DC grid.Strong optimization outcome.Different grid paradigm; not AC distribution EMT with Thai parameters.
Disclaimer/Publisher’s Note: The statements, opinions and data contained in all publications are solely those of the individual author(s) and contributor(s) and not of MDPI and/or the editor(s). MDPI and/or the editor(s) disclaim responsibility for any injury to people or property resulting from any ideas, methods, instructions or products referred to in the content.