5.1. Ablation Study
To validate the effectiveness of each proposed component, ablation experiments are conducted by removing individual modules and substituting alternatives: HSF module removal replaced with simple feature concatenation, SE module removal replaced with RNN, and CS-BiGraph removal replaced with conventional GCN. The key findings are presented below (
Table 2 and
Table 3):
Module Complementarity:
HSF + CS-BiGraph achieves the highest F1-score (56.1%) for happy emotion, demonstrating the synergy between hierarchical sequential fusion and bilevel graph optimization in positive emotion recognition.
Sentiment-Topology Synergy: SE + CS-BiGraph improves the excited emotion F1-score to 76.6%, verifying the benefits of combining sentiment enhancement with global graph modeling.
To further analyze the effectiveness of each component in the bilevel graph structure, we conducted a decomposition analysis of the CS-BiGraph module, with the results shown in
Table 4. The removal of the Global Similarity Graph (w/o Similarity Graph) and graph autoencoder (w/o GAE) led to significant performance drops of 3.2% and 1.0%, respectively, on the IEMOCAP dataset, demonstrating the foundational role of graph structure optimization in complex emotion recognition. Notably, when CS-BiGraph remains intact, the synergistic gains between HSF and SE reach their maximum (+1.7%). This enhancement effect is particularly pronounced in long-tail categories such as neutral (69.9%) and angry (68.3%). Compared to the baseline model COGMEN (w/o Similarity Graph, GAE), the triple-module integrated model (HSF + SE + CS-BiGraph) achieves a 1.9× greater improvement (+3.4%) in complex emotion categories than in ordinary ones.
The optimized graph structure enables efficient fusion of HSF’s local temporal features and SE’s global semantic information through its hierarchical information propagation channels. This triple synergistic effect ultimately yields an average F1-score of 70.0%, significantly outperforming single-module (max 68.7%) and dual-module combinations (max 69.3%).
5.2. Hyperparameter Analysis
Hyperparameter Settings For the IEMOCAP dataset: Dropout = 0.1, GNNhead = 7, SeqContext = 4, Learning Rate = 1 × 10⁻⁴. For the CMU-MOSEI dataset: Dropout = 0.3, GNNhead = 2, SeqContext = 1, Learning Rate = 1 × 10⁻³.
5.2.1. Number of Attention Layers
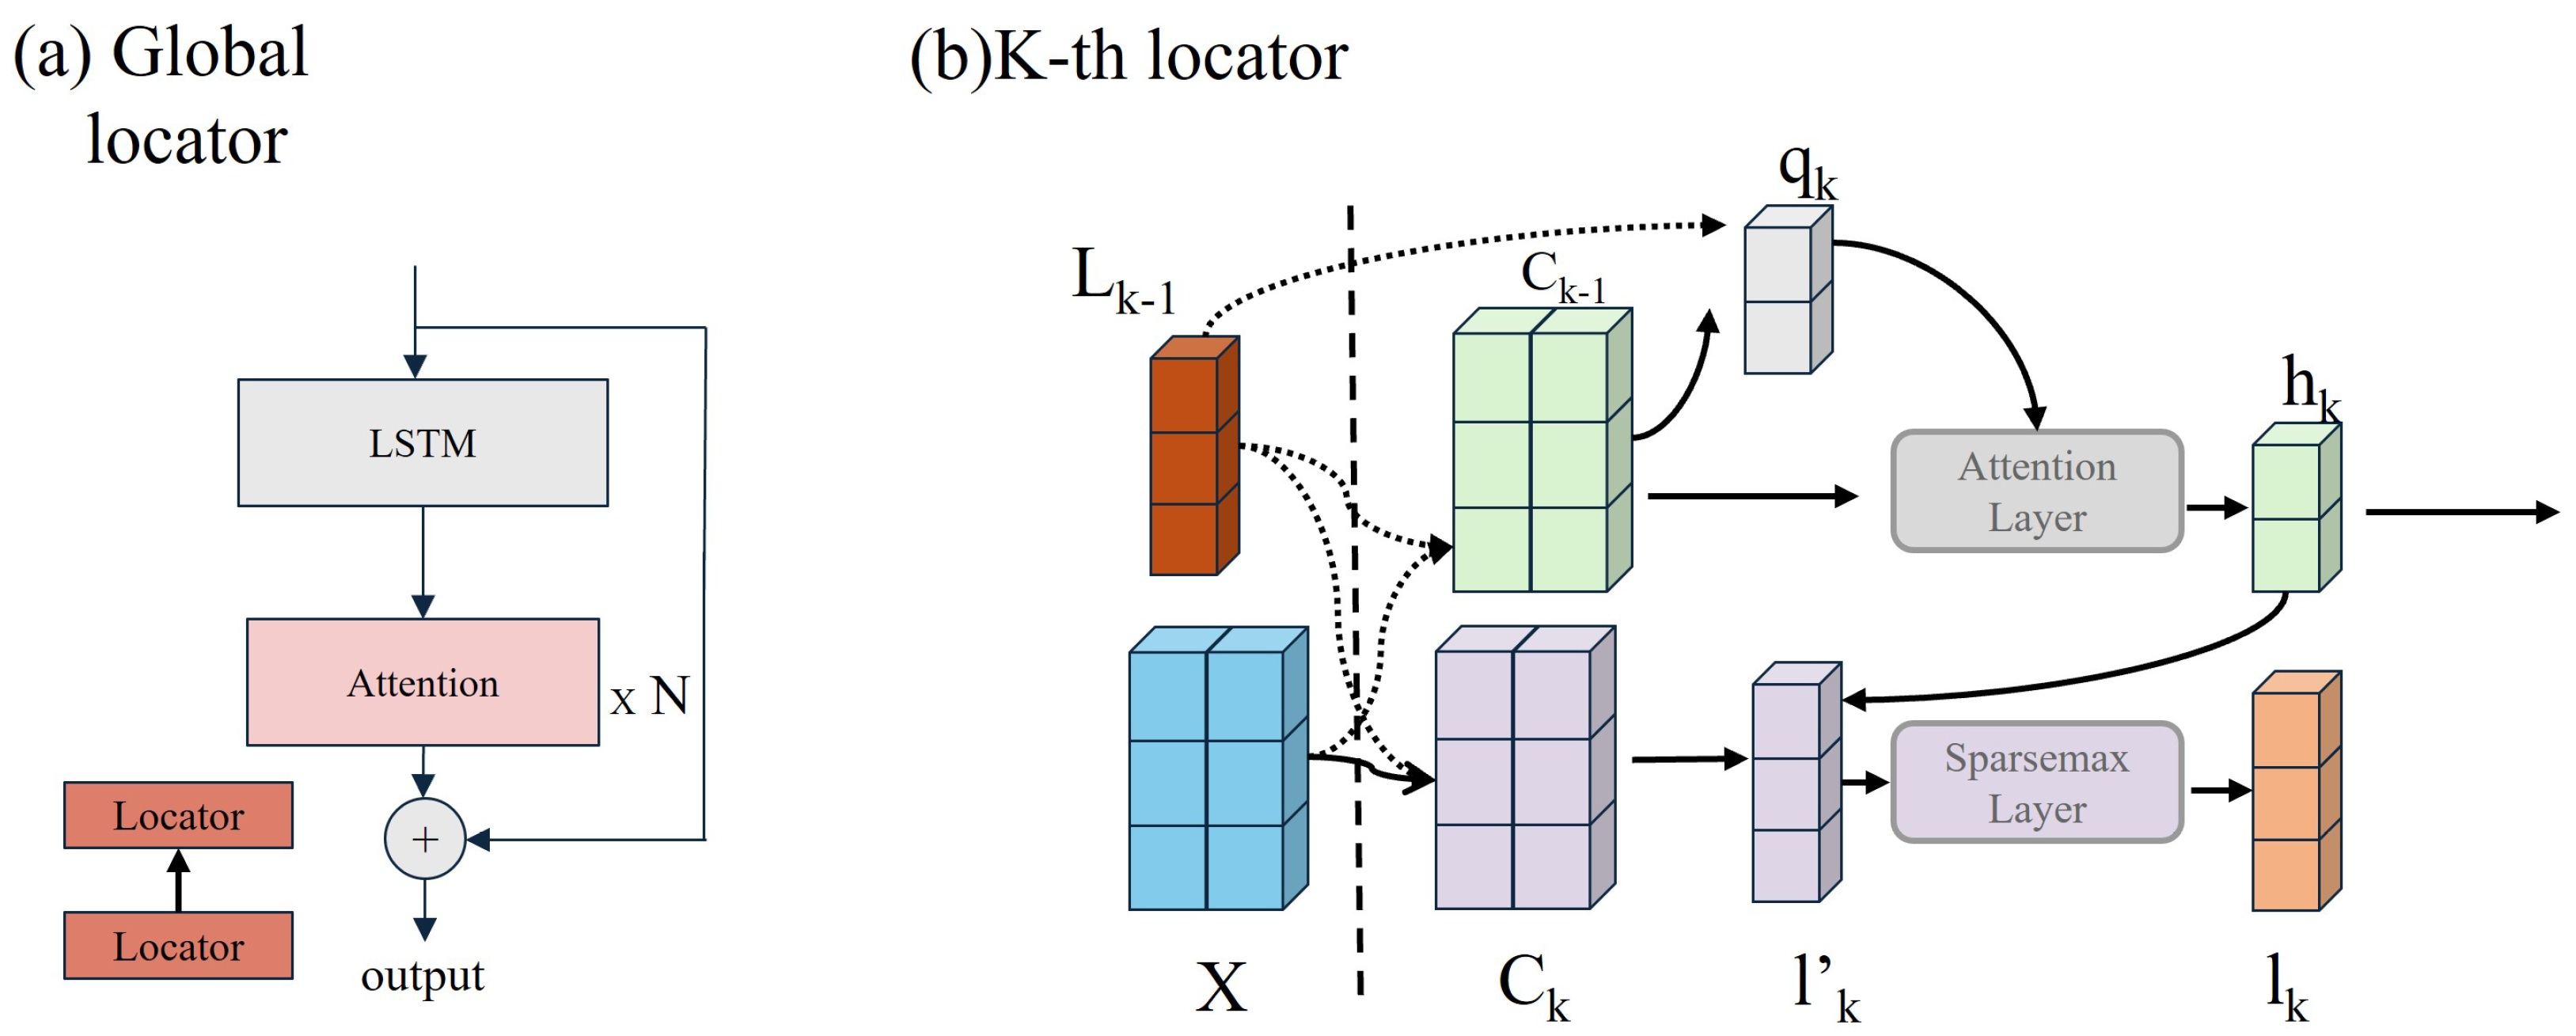
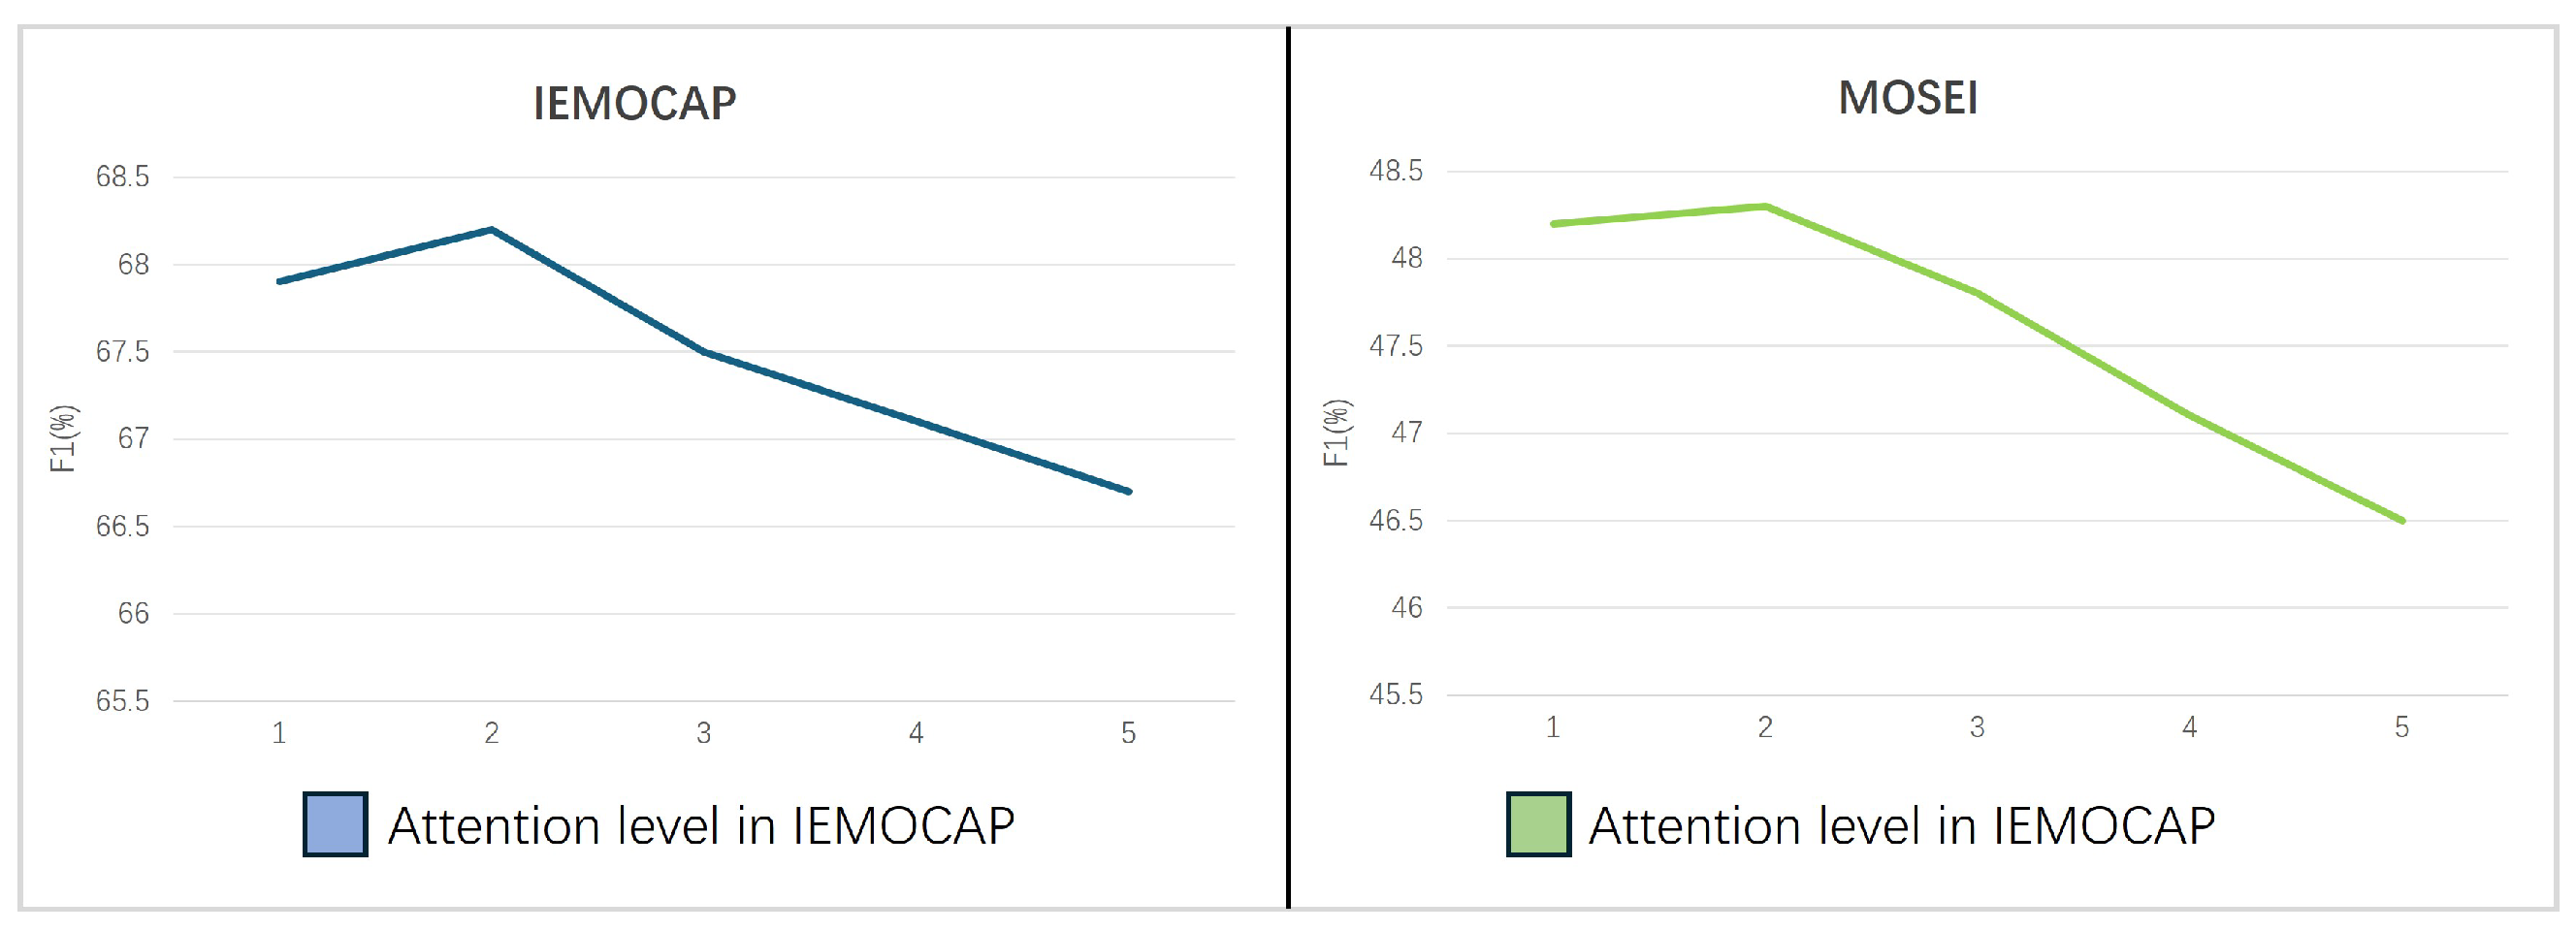
To investigate the impact of attention layers in the SE module’s global locator, we fix other hyperparameters and vary the number of attention layers h ∈ {1, 2, 3, 4, 5}. The results (
Figure 8) are presented as follows:
Initial performance gain: Increasing from 1 to 2 enhances key sentiment feature capture, improving accuracy. Diminishing returns: Beyond = 5, model complexity surges, causing overfitting and reduced generalization.
5.2.2. Number of Neighbor Nodes
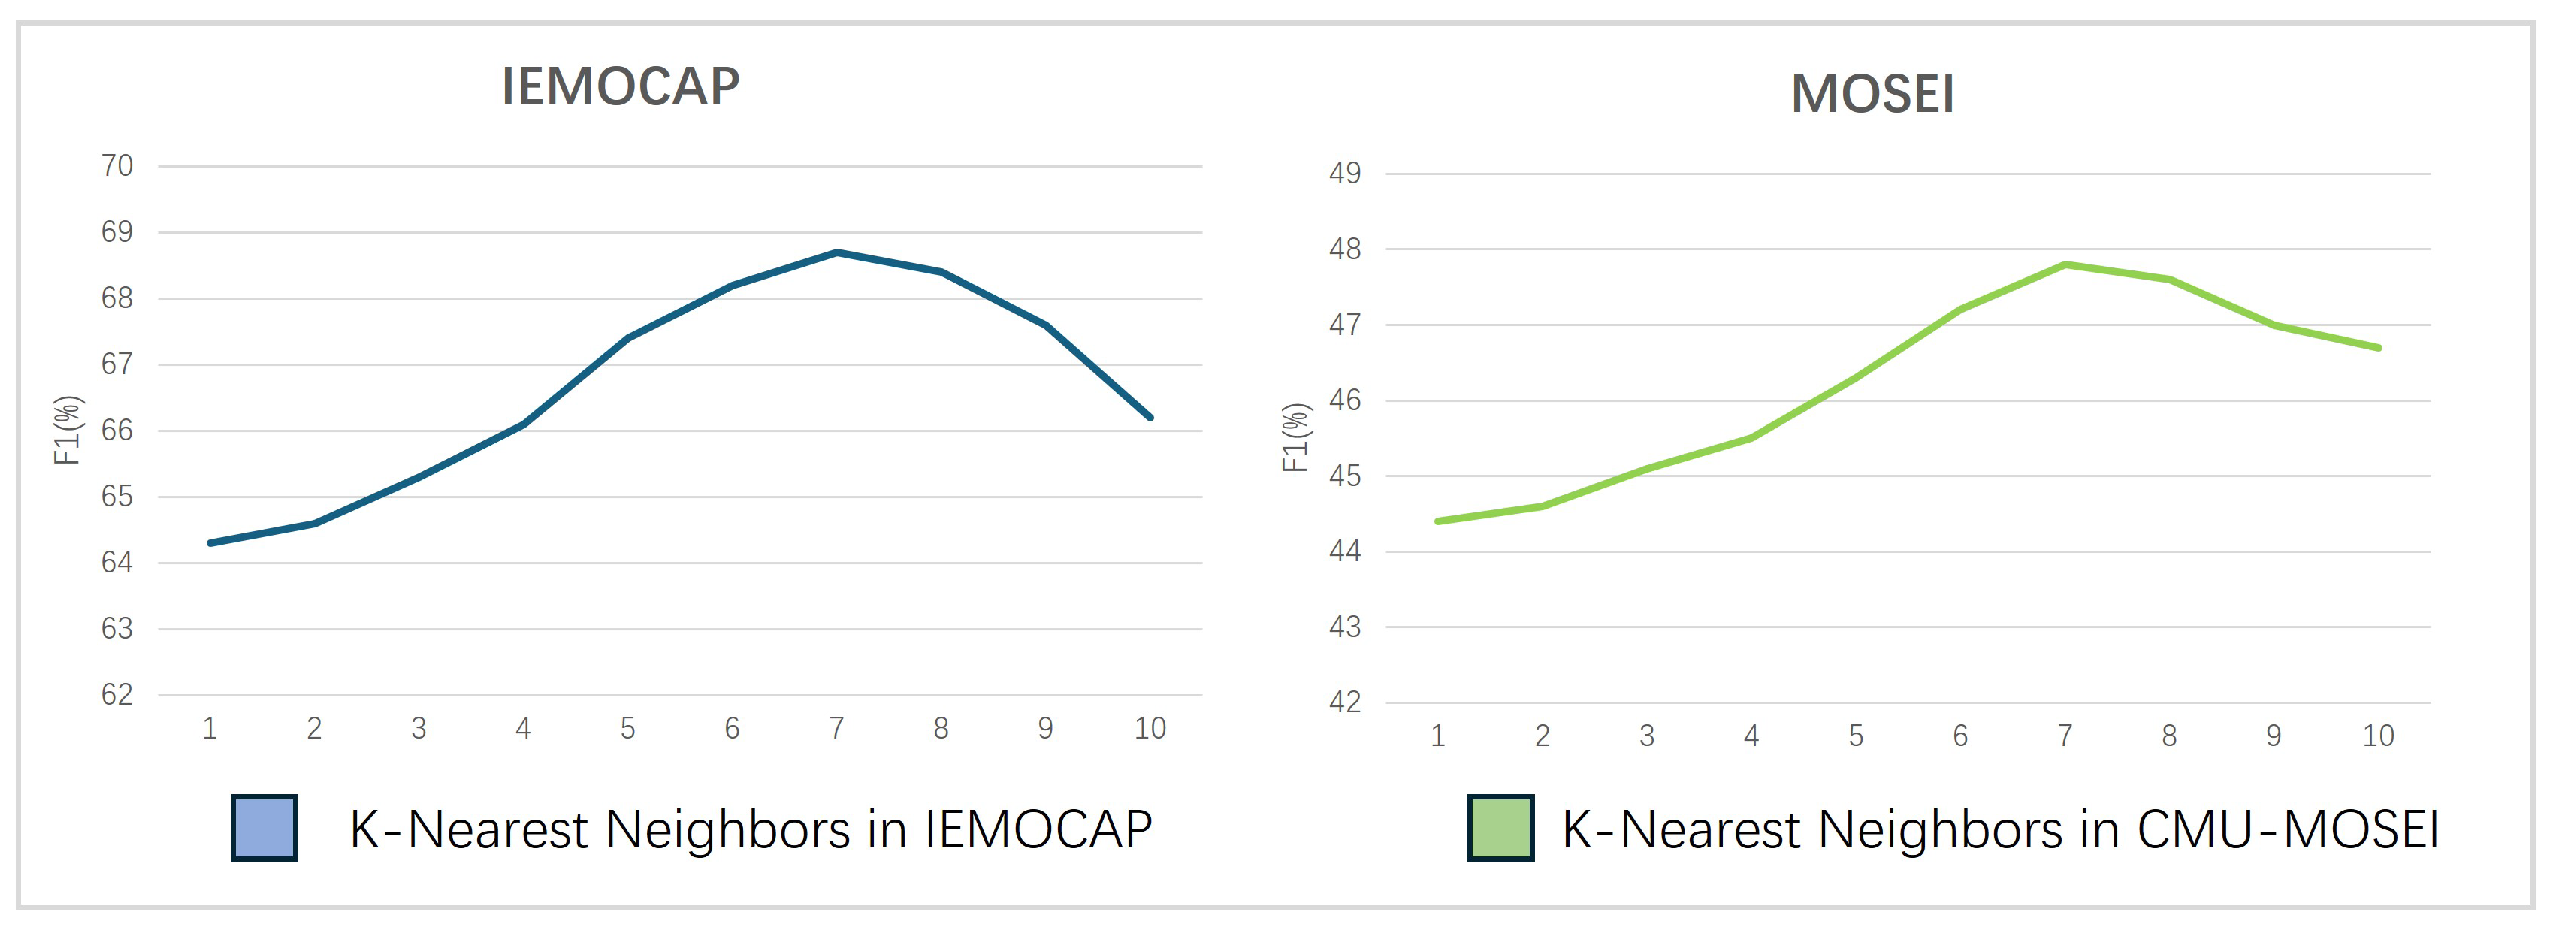
To analyze the impact of neighbor quantity in k-NN graph construction, we fix other hyperparameters and vary n ∈ {1, 2, 3, 4, 5, 6, 7, 8, 9, 10}. The results (
Figure 9) reveal the following:
Sparse regime (): Insufficient neighbors restrict feature propagation due to sparse graph connectivity. Optimal range (): Balanced local associations and mitigated sparsity yield peak performance. Overdense regime (): Excessive edges introduce low-similarity noise, degrading model robustness.
5.2.3. Similarity Threshold
Similarity Threshold
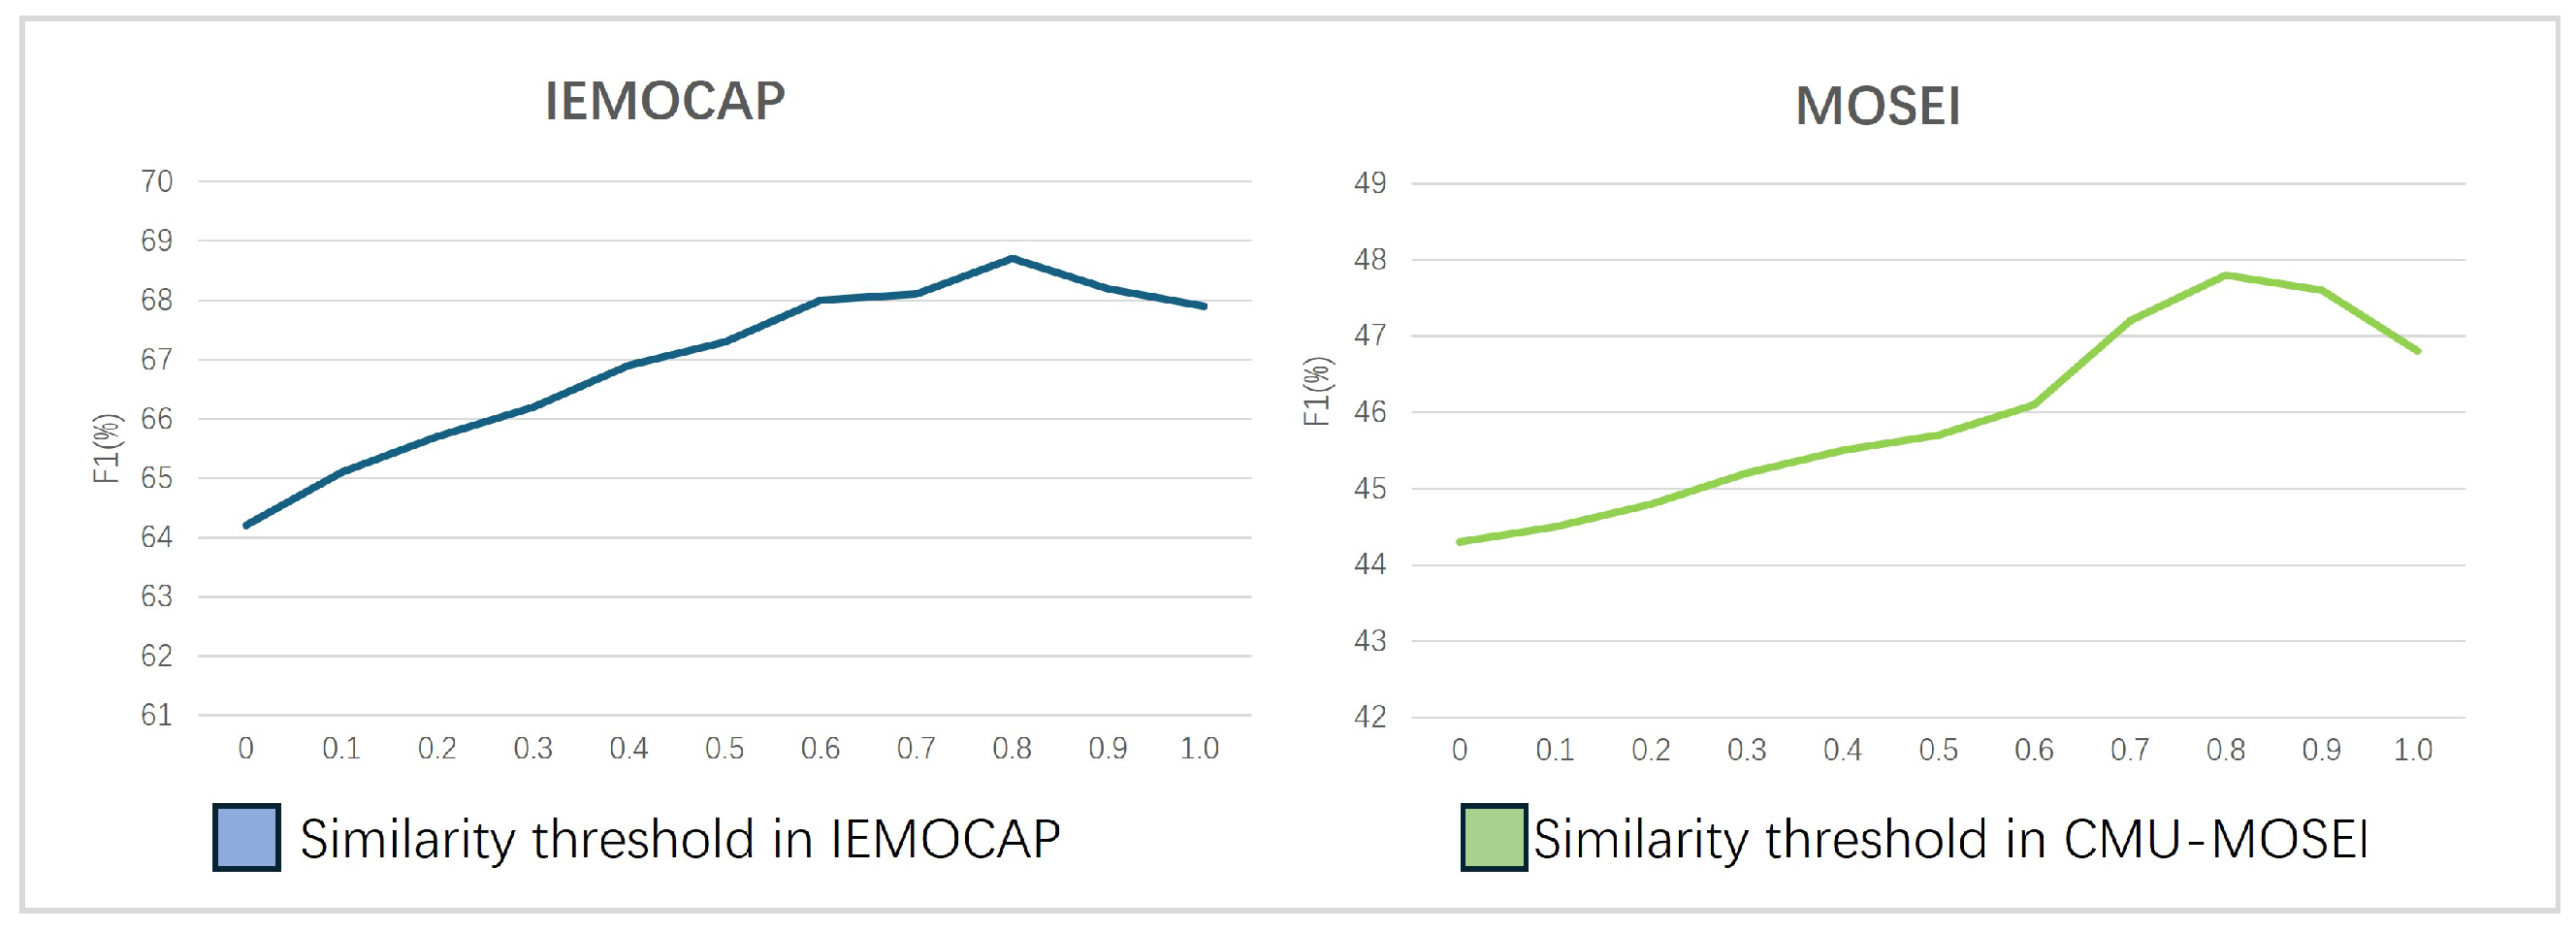
: To analyze the impact of similarity threshold
on model performance during graph construction, we fix other hyperparameters and vary
{0, 0.1, 0.2, …, 1.0}. The results (
Figure 10) demonstrate the following:
Low regime (): Excessive low-similarity edges introduce significant noise, diluting discriminative emotional associations despite expanded feature propagation.
Optimal range (): Balanced edge density and noise suppression achieve peak performance, retaining high-confidence emotional connections while avoiding isolated nodes.
High regime (): Over-sparse graphs impair context aggregation due to insufficient neighbor connections, causing severe performance degradation.
5.3. Statistical Significance Analysis
To validate that the performance improvements of our proposed framework are statistically significant and not due to random chance, we conducted a statistical analysis on the IEMOCAP dataset, which serves as our primary benchmark. We specifically compared our full model against a strong baseline, COGMEN.
Following common practice, we performed multiple independent training runs (five runs) for both our model and the baseline, each with different random seeds. We then collected the F1-score for each run and performed a two-sample t-test to assess the significance of the difference between the two sets of results.
The mean F1-score for our model was 70.2 with a standard deviation of 0.53. In comparison, the mean F1-score for the baseline was 67.6 with a standard deviation of 0.72. The t-test yielded a p-value 0.00084. Since , we can conclude that the performance gain achieved by our model is statistically significant. This analysis provides strong evidence that the architectural innovations in our framework, particularly the CS-BiGraph module, lead to a genuine and reliable improvement in performance.
5.4. Comparison with Existing Works
In this subsection, we further compare the proposed method with state-of-the-art multimodal emotion classification models on the IEMOCAP and CMU-MOSEI datasets.
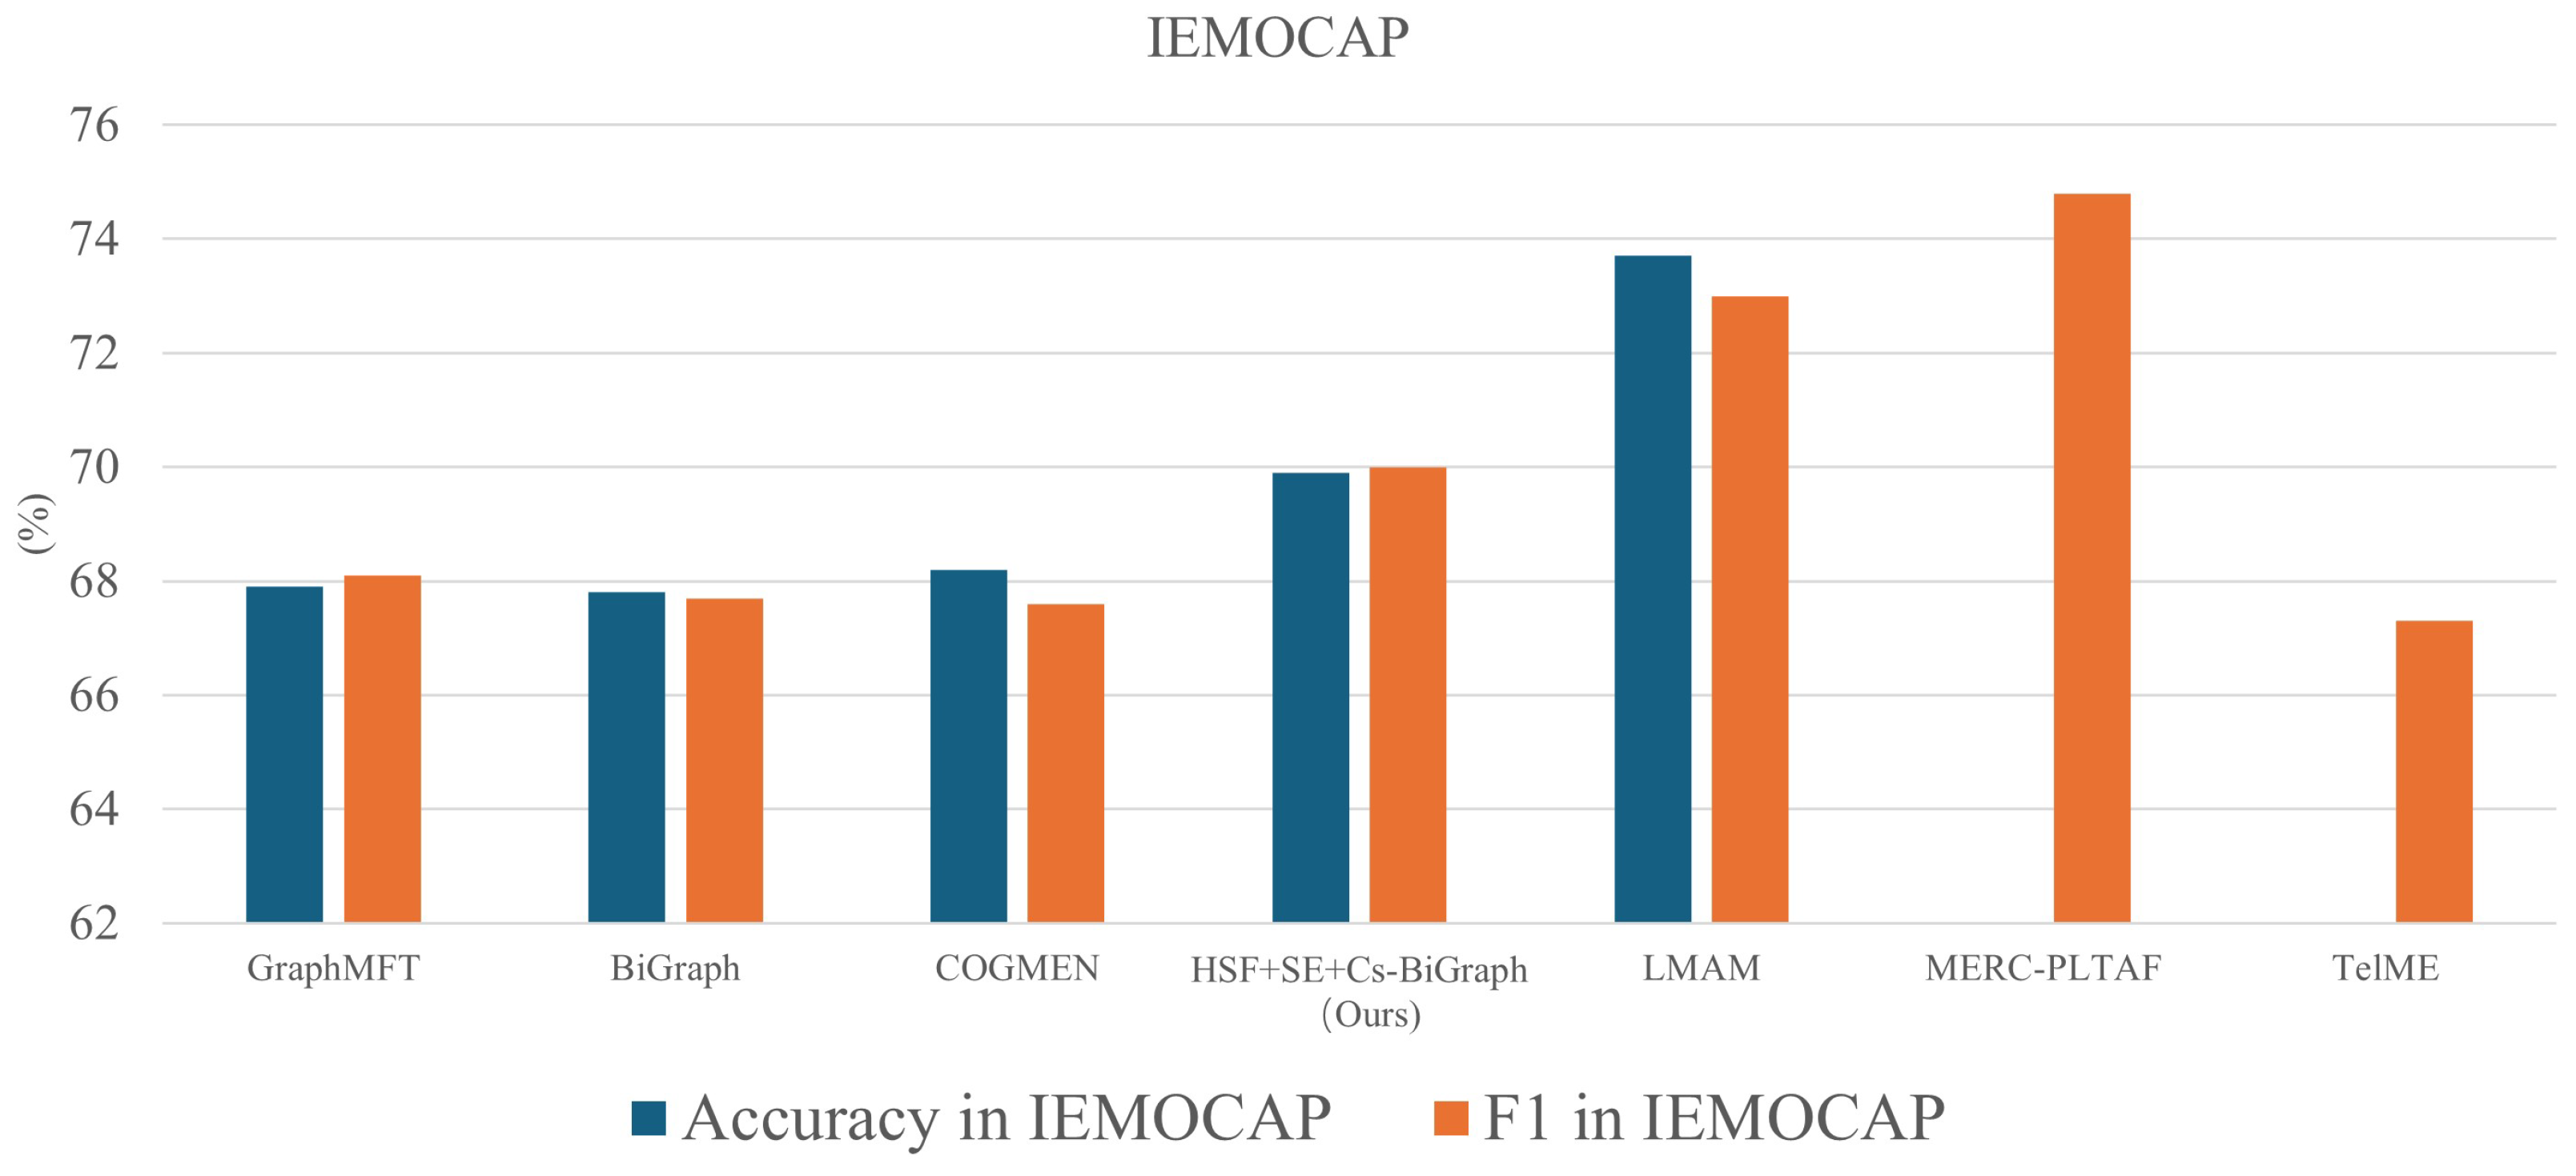
To provide a comprehensive and up-to-date comparison, we have included several strong baselines as well as two very recent state-of-the-art methods from 2025, LMAM and MERC-PLTAF [
16]. The overall performance comparison on the IEMOCAP dataset, which features rich dyadic dialogues and serves as our primary benchmark, is visualized in
Figure 11.
As illustrated in
Figure 11, our integrated framework outperforms established baselines such as GraphMFT, BiGraph [
24], TelME [
25], and COGMEN. We also observe that the recently proposed LMAM and MERC-PLTAF achieve higher overall scores. This warrants a deeper analysis into the architectural philosophies of these methods.
The strong performance of the LMAM can be attributed to its highly specialized and parameter-efficient cross-modal fusion module, which excels at its specific subtask. MERC-PLTAF’s success lies in its innovative use of a prompt-based learning paradigm, effectively converting the multimodal problem into a format that maximally leverages the power of large pre-trained language models.
In contrast, our work’s primary contribution is a
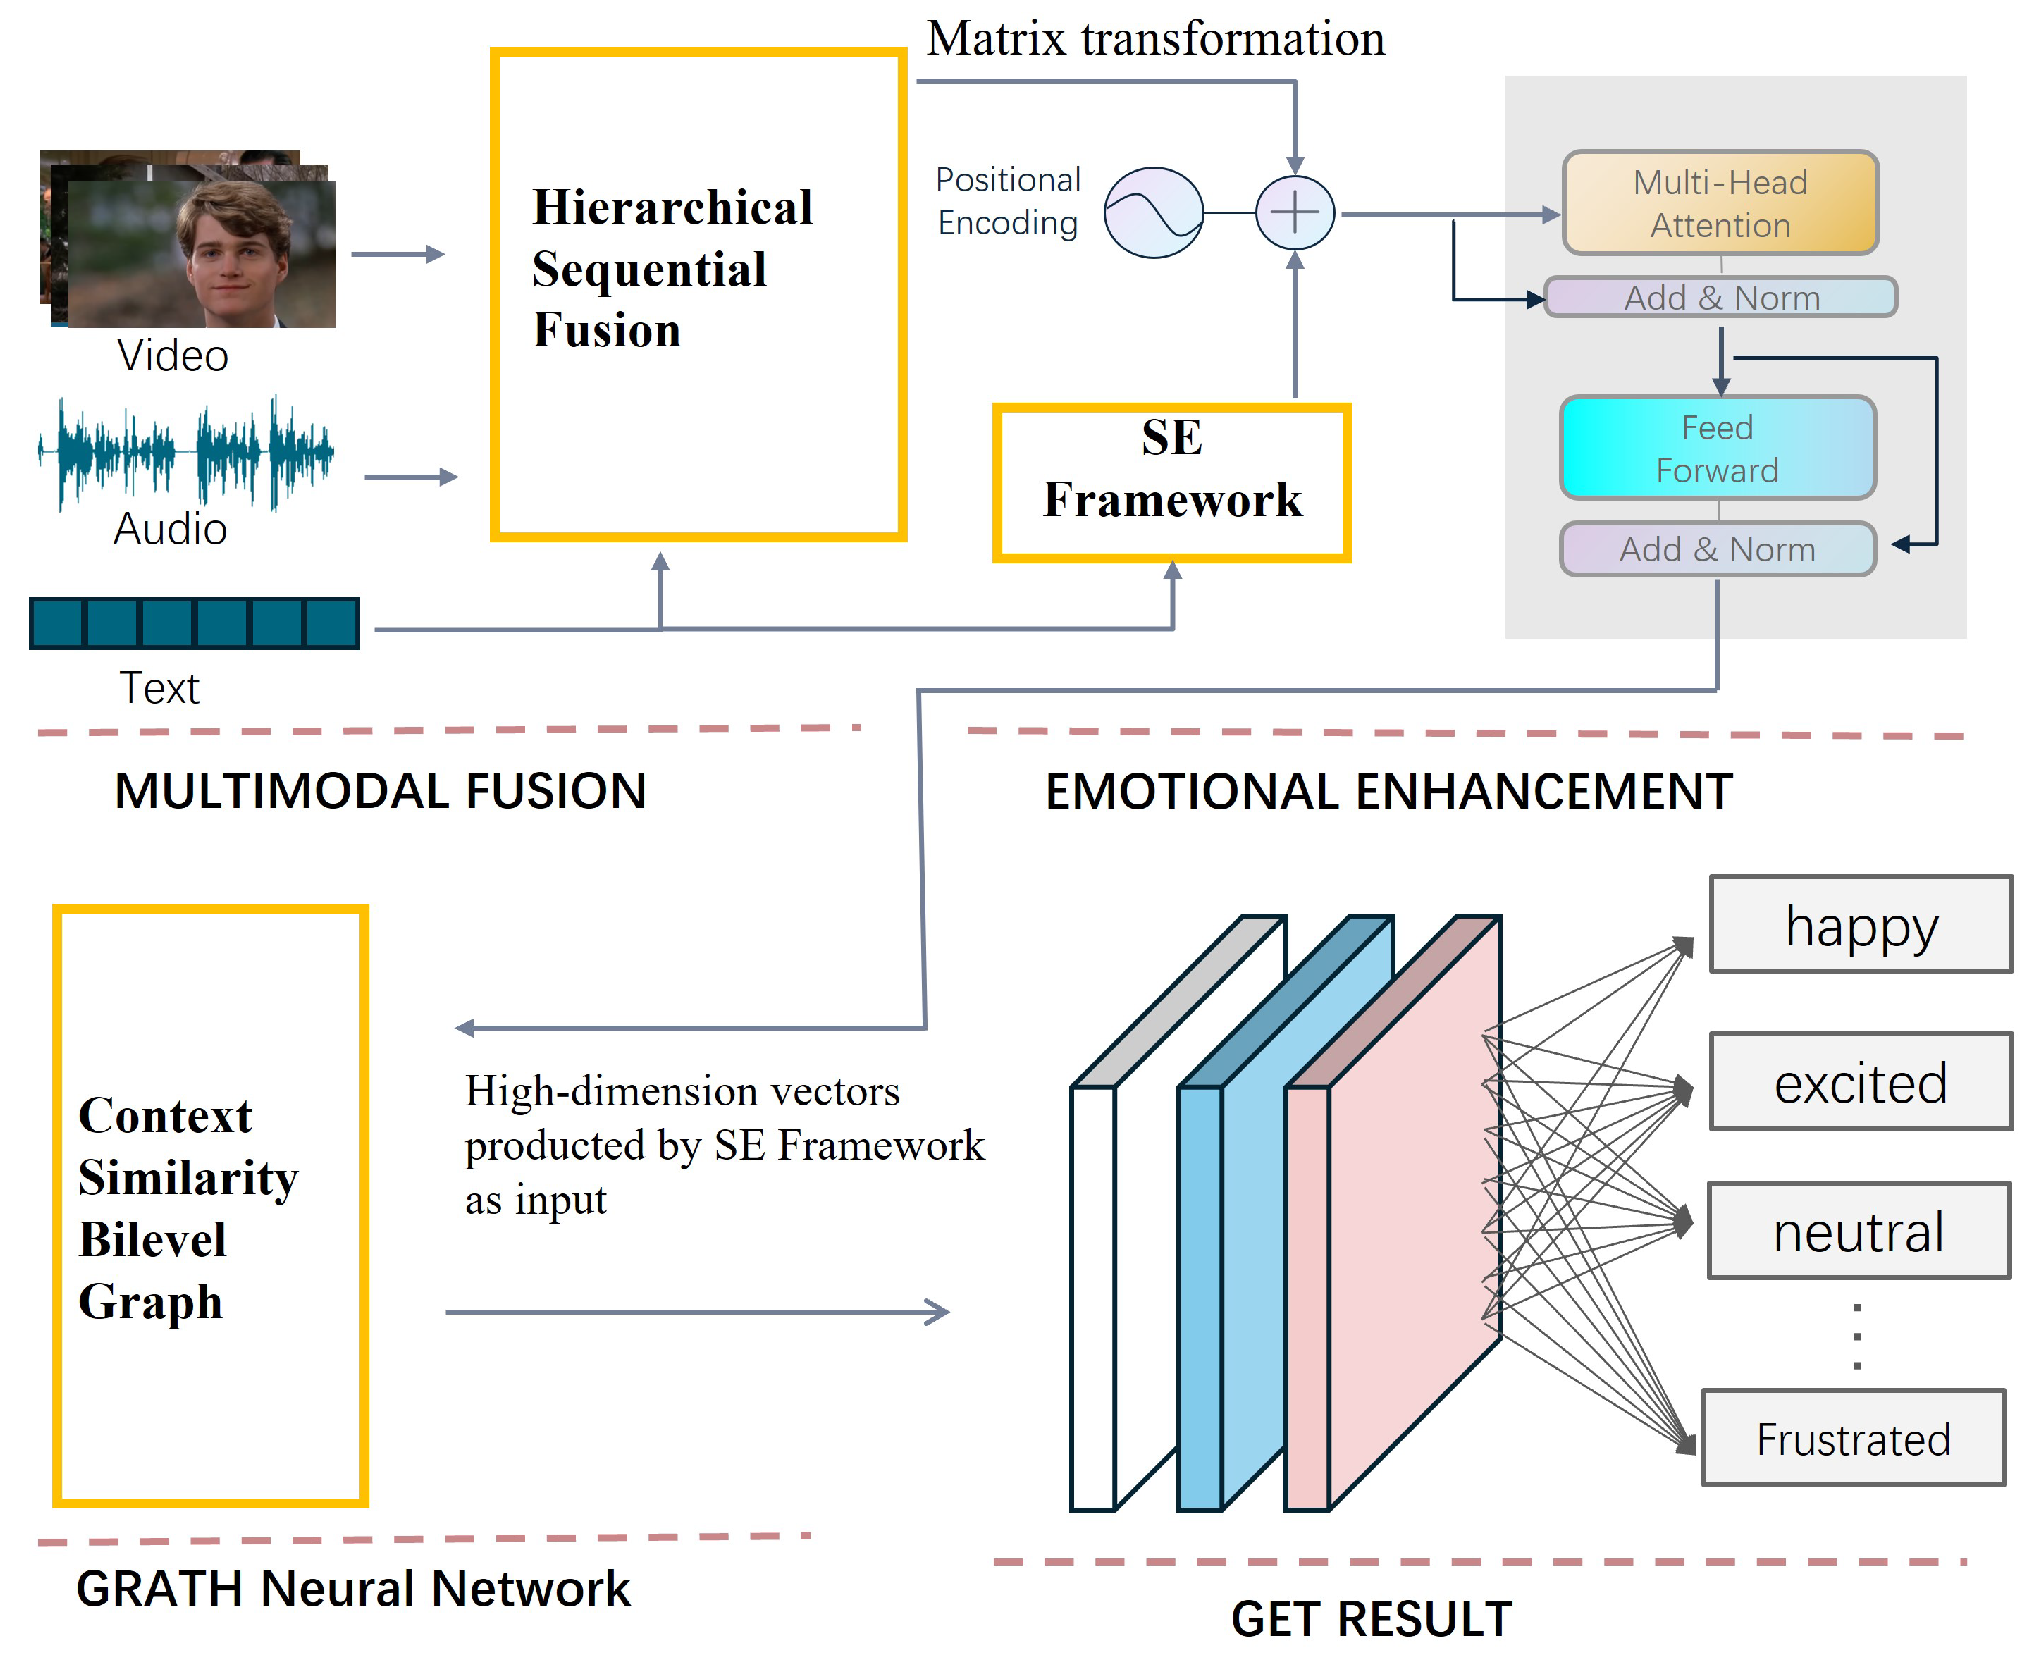
holistic three-component architecture that addresses multiple distinct challenges in the CER pipeline simultaneously. Our key innovation, the
CS-BiGraph module, provides a unique capability in adaptively learning complex non-sequential conversational structures—a mechanism not present in the aforementioned models. As demonstrated in our extensive ablation studies (
Table 1), this graph-based contextual modeling is the cornerstone of our framework’s performance. Therefore, we posit that our work offers a complementary and architecturally novel approach, focusing on robust conversational structure modeling, while methods like LMAM and MERC-PLTAF provide powerful solutions for modality fusion and alignment, respectively. Future work could explore integrating these specialized modules into our comprehensive framework.
To provide a more fine-grained analysis of our model’s capabilities,
Table 6 details the F1-scores for each of the six emotion categories on the IEMOCAP dataset, comparing our model with several classic and strong baselines for which this detailed data is available, such as BC-LSTM [
26], CMN, ICON, DialogueRNN, DialogueGCN, MMGCN [
27], TBJE [
28], and Multilogue-Net [
29]. For the CMU-MOSEI dataset, which consists primarily of monologues, the overall accuracy scores are presented in
Table 7.
As noted in our dataset description, CMU-MOSEI primarily consists of monologues. It serves as a crucial benchmark for multi-label classification on single-speaker data streams. Our framework achieves a competitive accuracy score, as shown in
Table 7, where we also include results from recent state-of-the-art models for a comprehensive comparison.
As shown in
Table 7, our model’s accuracy (48.6%) is competitive, although slightly below recent SOTA models like TAILOR (48.8%) [
30] and CARAT (49.4%) [
31]. We attribute this difference to a fundamental divergence in research paradigms. These state-of-the-art methods achieve high performance by developing sophisticated intra-task mechanisms, such as TAILOR’s label-specific feature generation or CARAT’s reconstruction-based fusion.
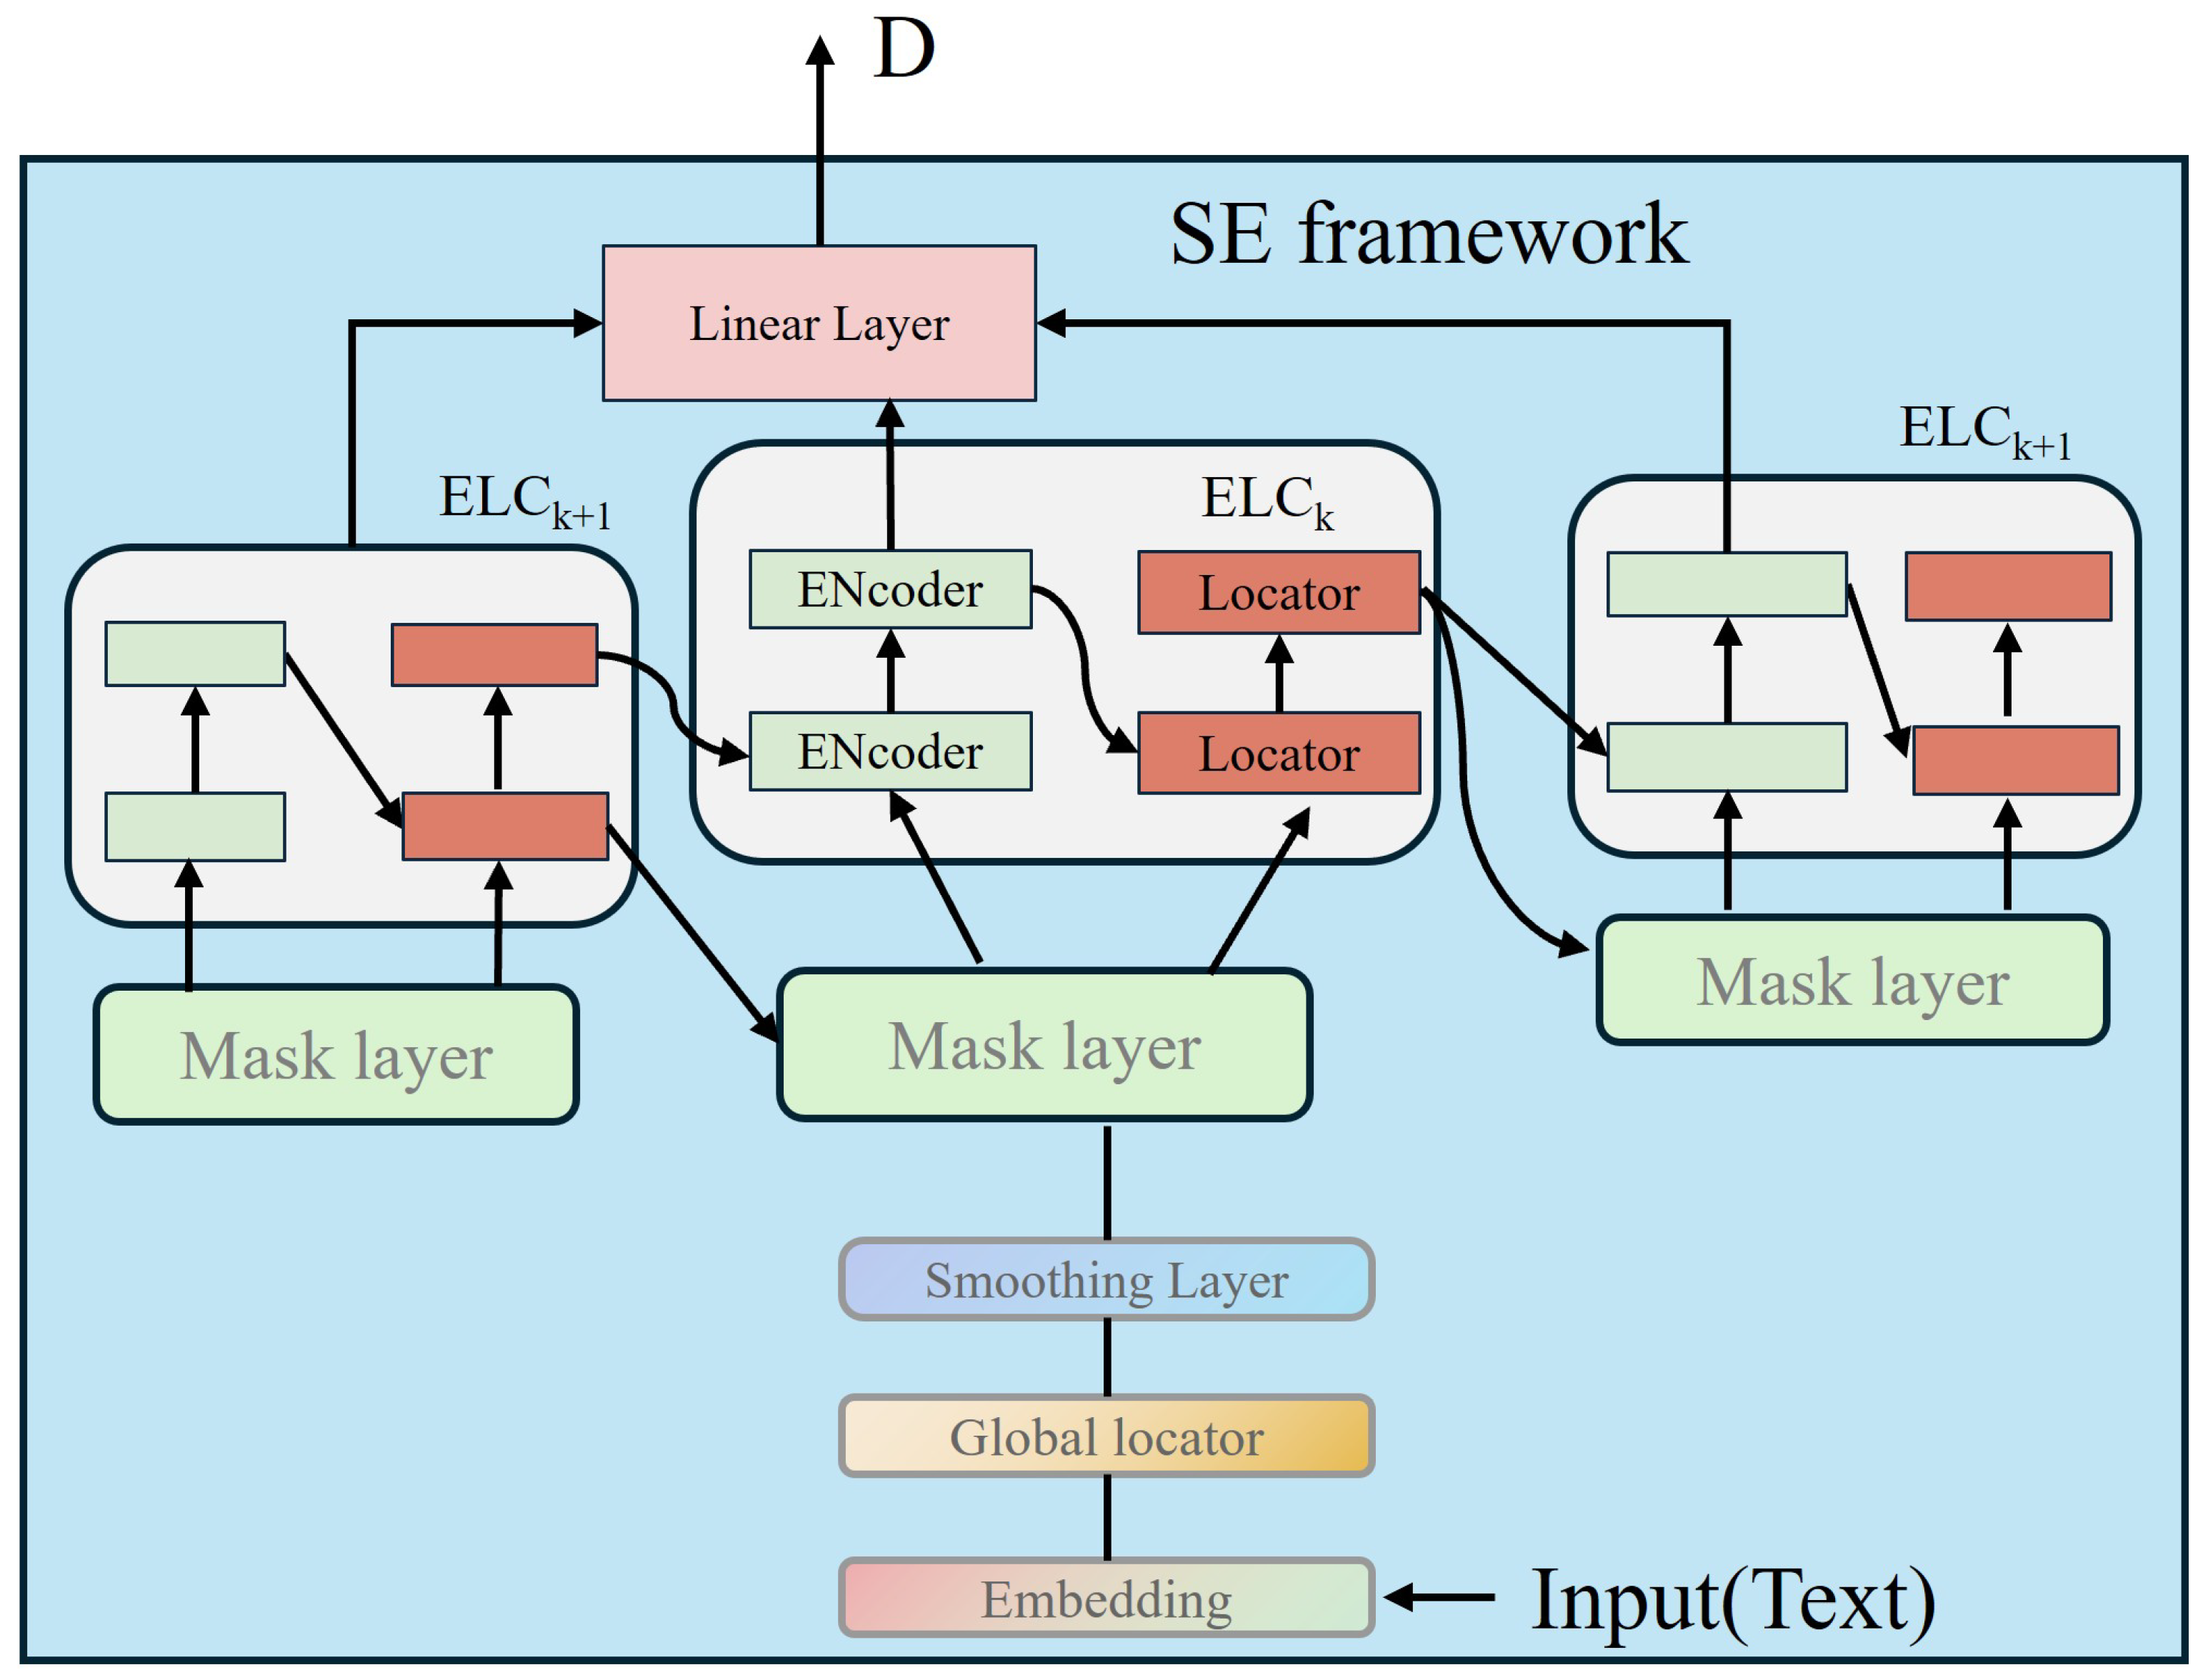
In contrast, our work explores a complementary inter-task approach. The novelty of our SE module lies in leveraging an auxiliary task—sentiment polarity analysis—to provide external knowledge that constrains and guides the primary emotion recognition task. This strategy aims to reduce emotional ambiguity by using broader sentiment cues, a method that proves particularly effective on conversational datasets like IEMOCAP (see
Table 6).
Thus, while SOTA models advance intra-task representation learning, our framework contributes an orthogonal perspective on inter-task knowledge integration. We believe these approaches are not mutually exclusive; future work could explore combining our sentiment-enhancement strategy with the advanced fusion mechanisms of models like TAILOR and CARAT.
5.5. Discussion
Our experimental results, presented in
Table 6 and
Table 7, demonstrate that our proposed framework achieves competitive or state-of-the-art performance compared to a wide range of baseline models. A key strength of our approach is evident on the IEMOCAP dataset, where our model shows a significant 7.1% F1-score improvement on the “happy” emotion over the second-best model from our baseline set—a category where many models traditionally struggle. This highlights our framework’s enhanced discriminative power in handling challenging non-canonical emotional expressions.
However, a critical analysis of our results also reveals important limitations and areas for future improvement, which we discuss in detail below.
5.5.1. Challenges in Distinguishing Semantically Similar Emotions
A primary challenge, reflected in the fine-grained results of
Table 6, is the model’s difficulty in distinguishing between semantically similar emotion categories. For instance, while achieving strong performance in most categories, the F1-scores for “angry” (68.3%) and “frustrated” (68.4%) are lower than for “sad” (79.3%) or “excited” (72.9%). This suggests a degree of confusion between emotions that share similar valence and arousal levels, such as the overlap between anger and frustration. This issue stems from two factors. First, the inherent ambiguity in human expression means that these emotions often share highly similar acoustic features (e.g., increased vocal intensity) and lexical cues. Second, capturing the subtle contextual shifts that differentiate them (e.g., frustration often implies an unfulfilled goal, while anger can be more direct) remains a non-trivial task.
Our framework is architecturally designed to mitigate this. The SE module provides a foundational layer of sentiment polarity, helping to separate positive from negative emotions. More critically, our CS-BiGraph module aims to resolve ambiguity by modeling long-range context, learning, for example, that an utterance following a series of failed attempts is more likely to be “frustrated” than “angry”. However, our results indicate that, when local immediate multimodal signals are particularly strong and ambiguous, they can occasionally override the model’s broader contextual understanding. This points to a need for future work on more robust arbitration mechanisms that can better balance local evidence with global context.
5.5.2. The Impact of Data Imbalance and Future Directions
A second factor influencing performance is the well-known class imbalance in the IEMOCAP dataset. As shown in our ablation studies (
Table 1), our model achieves its highest F1-score in the “neutral” category (69.9%), which is also the most frequent class. This high performance, while positive, may also indicate a slight bias, where the model learns to default to “neutral” in cases of high uncertainty. This is a common issue that can lead to suboptimal performance on less frequent minority emotion classes.
While the focus of this paper was on architectural innovation, we acknowledge that addressing this data imbalance is a critical next step for improving generalizability. We did not employ explicit mitigation strategies in this work, but future iterations of our framework could readily incorporate them. Promising directions include the following:
(1) class-balanced loss functions, such as focal loss or weighted cross-entropy, to assign higher penalties for misclassifying minority classes;
(2) advanced data augmentation, particularly for synthesizing realistic multimodal data for underrepresented emotions; and
(3) balanced sampling strategies, such as oversampling minority classes during batch creation. We hypothesize that integrating these data-centric strategies with our model-centric innovations will lead to more robust and equitable performance across all emotion categories.
Despite these limitations, by integrating results from both datasets, our model consistently demonstrates strong performance, proving the effectiveness and reliability of its core architectural design in practical applications.
