Article

Deterministic Spatial Interpolation of Shear Wave Velocity Profiles with a Case of Metro Manila, Philippines

Department of Civil Engineering, De La Salle University, Manila 1004, Philippines
*
Authors to whom correspondence should be addressed.
Appl. Sci. 2025, 15(17), 9596; https://doi.org/10.3390/app15179596 (registering DOI)
Submission received: 14 July 2025 / Revised: 15 August 2025 / Accepted: 16 August 2025 / Published: 31 August 2025
(This article belongs to the Special Issue Advanced Technology and Data Analysis in Seismology)

Abstract

Despite its potential danger, site amplification effects are often neglected in seismic hazard analysis. Appropriate amplification factors can be determined from shear wave velocity, but impracticality in in situ measurements leads to reliance on regional correlation with geotechnical parameters such as SPT N-value. Modified power law and logarithmic equations were derived from past correlation studies to determine Vs30 values for each borehole location in the City of Manila. Vs30 profiles were spatially interpolated using the inverse-distance weighted and thin-spline methods to approximate the variation in shear wave velocities and add more detail to the existing contour map for soil profile classification across Metro Manila. Statistical analysis of the interpolated models indicates percentage differences ranging from 0 to 10% with a normalized root mean square error of nearly 5%. Generated equations and geospatial models in the study may be used as a basis for a seismic microzonation model for Metro Manila, considering other geological and geophysical layers.

1. Introduction

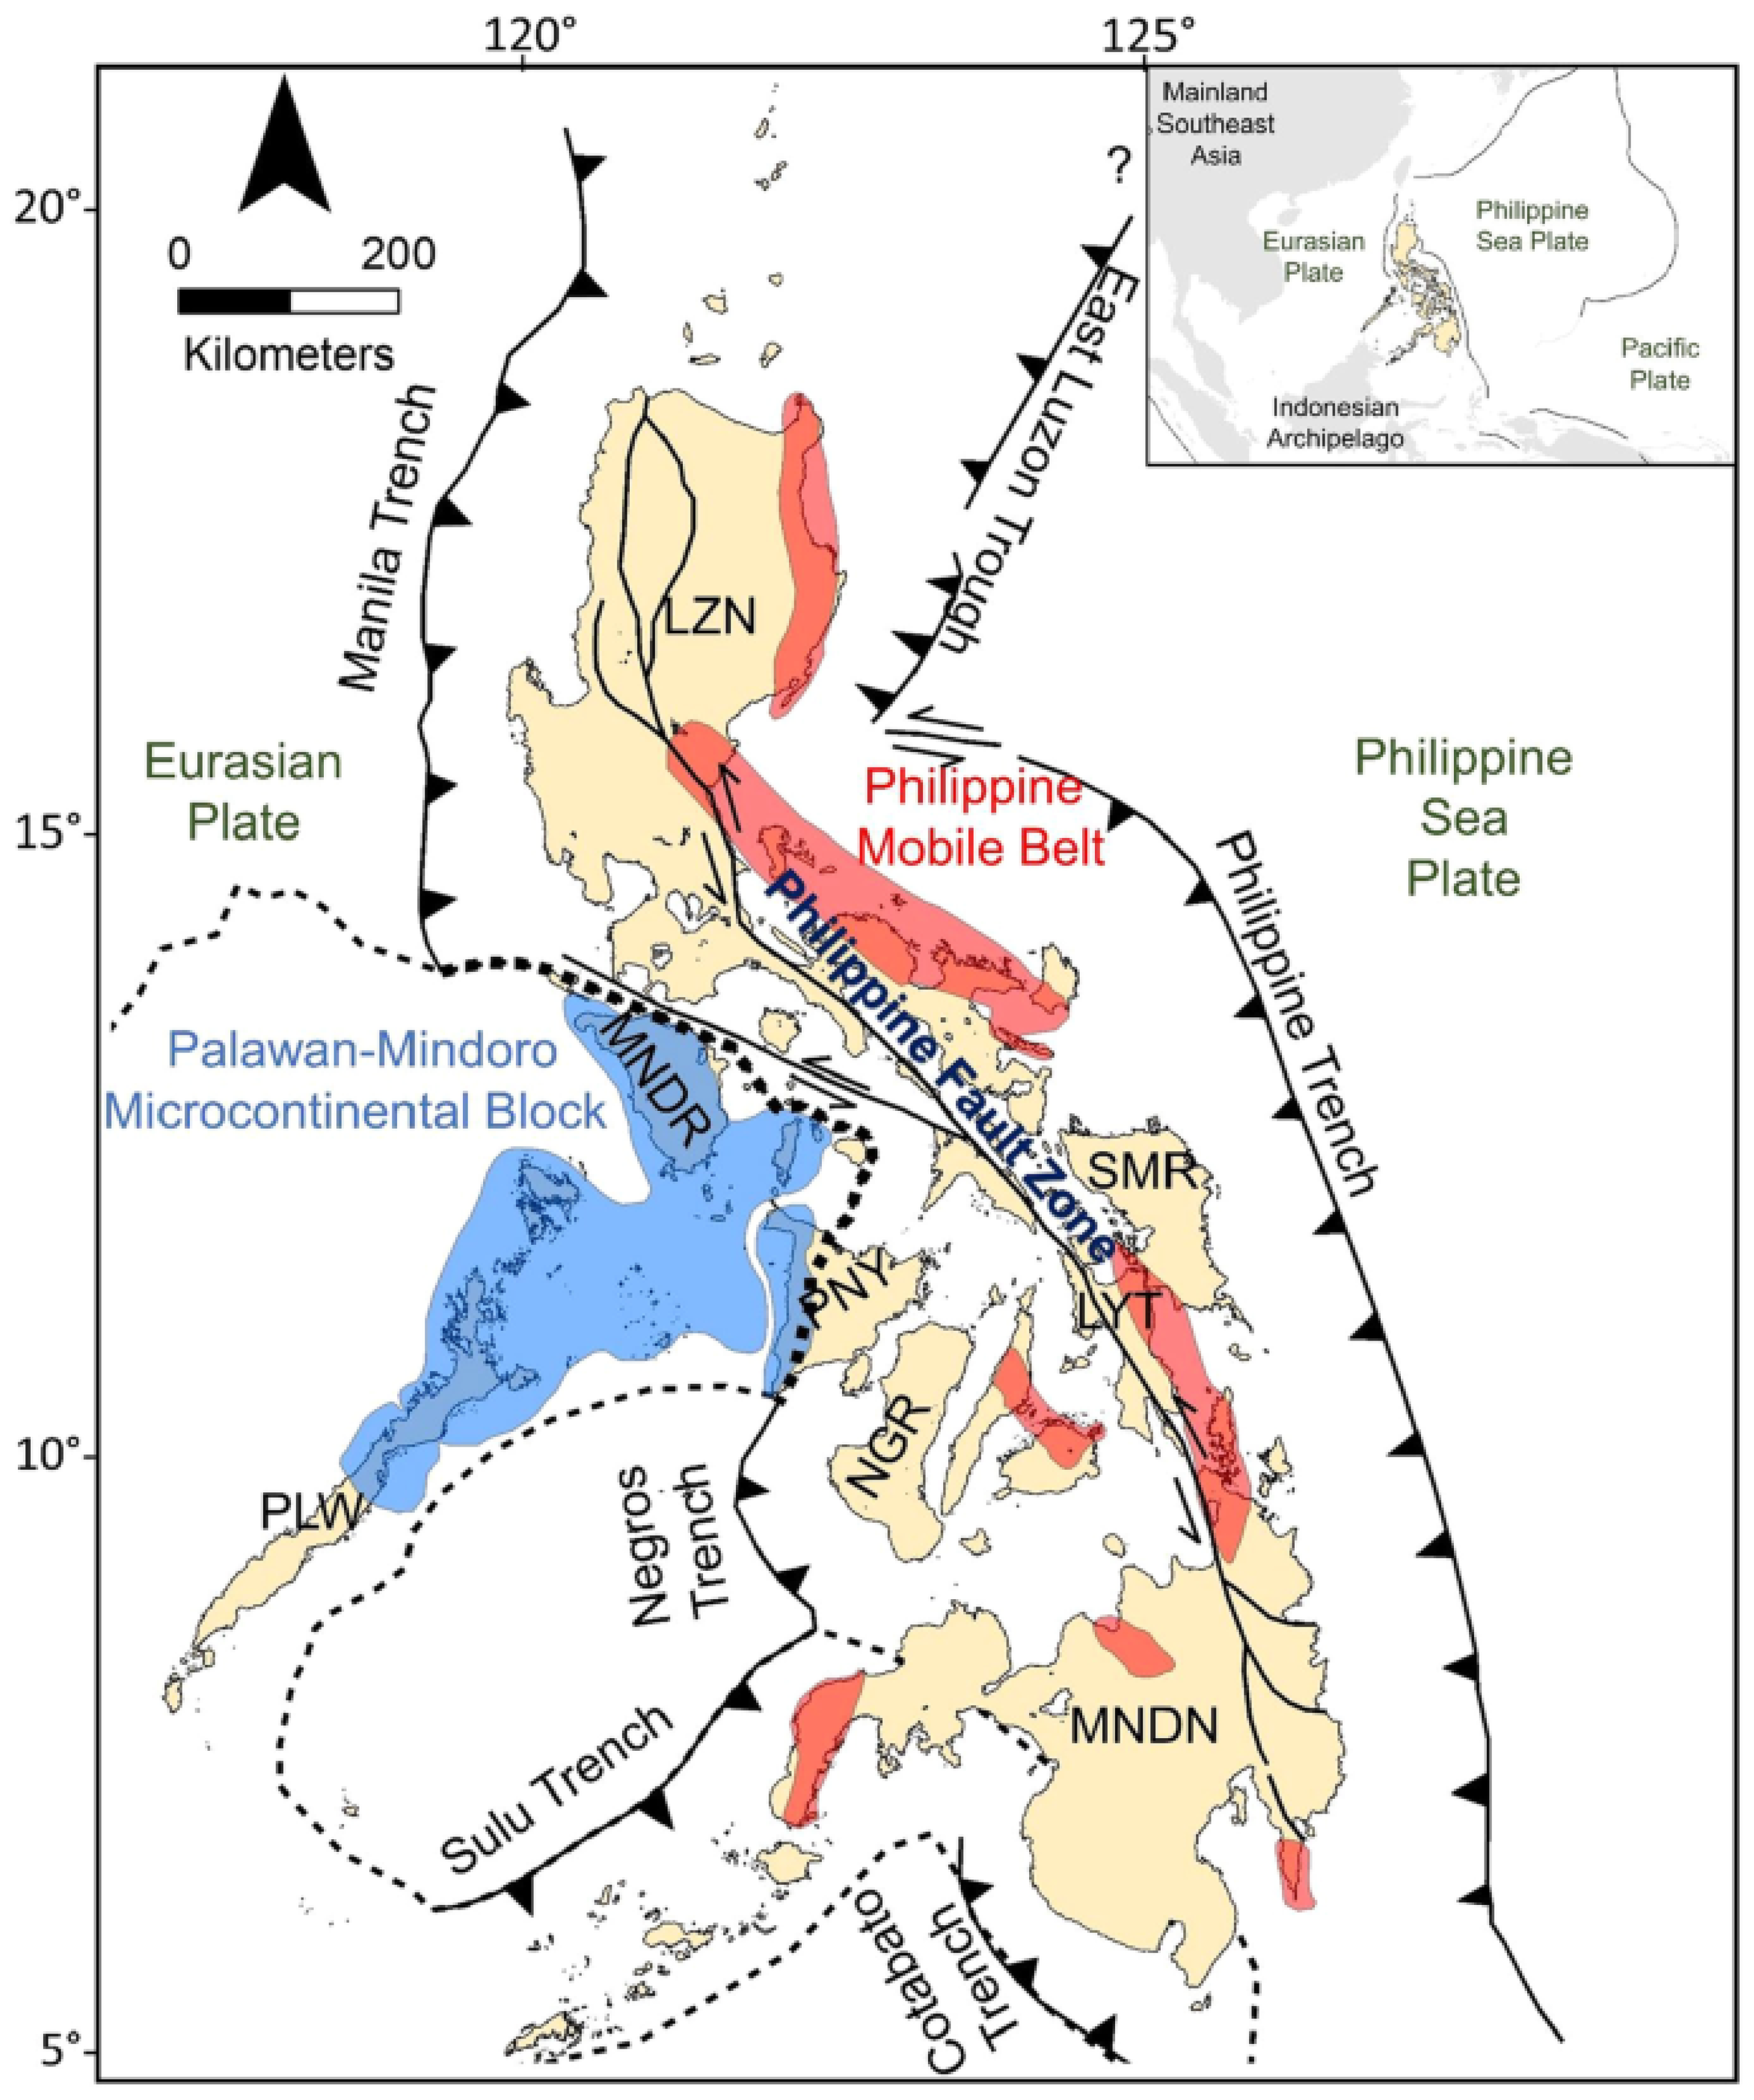
The seismo-geological setting of the Philippines exposes the country to a significant degree of vulnerability to earthquakes. The archipelago is situated on an oblique convergence between the Sunda Plate and the Philippine Sea Plate [1]. This unique tectonic feature contains two subduction zones (Manila and Philippine Trenches) on each side of a transform fault system (Philippine Fault Zone) traversing 1600 km from Mindanao to Luzon, and two major plate blocks (Philippine Mobile Belt and the Palawan-Mindoro Continental Block) as illustrated in Figure 1. The complex geology of the Philippines contributes to the proliferation of fault systems, with a few major fault lines situated near major cities and economic hubs. As one of the most seismically active regions in the world, the Philippines records a daily average of 20 earthquakes [2]. The frequency of seismic events, coupled with the level of exposure of urban zones, poses a greater risk as rapid population growth constitutes an unregulated increase in structures potentially prone to earthquake damage [3,4].
Typical seismic hazard analysis approaches often incorporate predicted intensities from selected worst-case seismic scenarios. However, intensities illustrated by isoseismal maps fail to account for geological properties that may alter the expected impact of earthquakes in an assumed homogeneous stratum. Parameters such as shear wave velocity, damping, and shear modulus dictate the response of soils subjected to dynamic loading [5]. Historical records indicate heightened levels of damage in regions underlain by soft soil due to site amplification. Notable examples include 1964 Niigata, 1977 Bucharest, 1985 Mexico City, 1988 Armenia, 1989 Loma Prieta, 1990 Iran, 1994 Northridge, 1995 Kobe, 1999 Kocaeli, and 2009 L’Aquila [6]. Site amplification is affected by amplitude, frequency content, and ground motion duration [7]. The amplitude increases as seismic waves slow down when passing through soft strata [8]. The 1985 Mexico City earthquake recorded widespread damage across structures ranging from 5 to 15 stories due to resonance as the city was built on a drained lake, leading to ground motion amplification despite the epicenter being 350 km away. Findings from this event prompted further analysis of the effect of soft soils on ground motion, leading to the development of codified site coefficients. In the Philippines, the 1968 Mw 7.3 Casiguran earthquake exhibited similar behavior, resulting in the collapse of a six-story reinforced concrete structure (Ruby Tower), with significant structural damage to other buildings also reported in the districts of Binondo and Escolta in the City of Manila, located nearly 230 km from the epicenter [4]. Reconnaissance reports by Omote et al. [9] attribute these damages to resonance, given the damaged structures were underlain by thick alluvial soil strata that amplified the ground motion. Alluvial deposits are low-density soils composed of medium to soft clay and loose sand situated along flat lands near rivers and coastlines [10].
Figure 1. Regional tectonic setting of the Philippines [11].
Applsci 15 09596 g001
Philippine research on local geological conditions mainly focused on liquefaction and slope stability [12,13,14,15], with limited studies on site amplification due to insufficient field data [16]. Regional visualizations of seismic site conditions are scarce due to the extensive financial and technical resources necessary for the acquisition and interpretative analysis of geotechnical and geological datasets [17]. Inadequate soil amplification data impedes proper seismic risk analysis for site-specific conditions [18]. Ground motion amplification can be approximated using site coefficients outlined in the National Structural Code of the Philippines (NSCP) or from international seismic standards such as ASCE/SEI 7-22 [19] and EN 1998-1 [20], which may not encompass all nuances in the variations of local geology. Considering the sociodemographic and seismic vulnerability of Metro Manila, it is essential to conduct a comprehensive assessment of the regional geologic conditions to estimate the impact of site amplification [4]. Mapping these risks informs how site amplification effects intersect with population exposure and infrastructure in large urban regions. Modeling realistic ground motions in structural design can mitigate casualties and damages inflicted by earthquakes [21]. Aside from seismic events, other forms of vibrations experienced by structures are induced by moving loads along roads and railways [22]. Proper site characterization using a comprehensive reference of geotechnical parameters is necessary to assess the effect of soils in quantifying probabilistic ground motion estimates.
Shear wave velocity (Vs) is a crucial geotechnical parameter that measures the speed of an S-wave in soil and rock strata when subjected to dynamic loading during a seismic event. S-waves are body waves that propagate perpendicular to the direction of ground motion, inducing shear deformation in soil and rock layers [23]. While shear waves only reach 60% of the velocity of primary waves [24], they possess more destructive potential, given that their predominant periods closely resemble structure periods [23]. This quantity is also directly proportional to the rigidity and stiffness of the subsurface material [7], which renders Vs an essential factor in site characterization and foundation design. The elastic theory of materials states that the shear modulus can be determined using the equation G = ρVs2. This also considers soil density (ρ) which can be correlated with the stiffness and rigidity of each soil layer [22,25]. Identifying the low-strain shear modulus (Gmax) is an essential aspect of stability analysis for slopes, embankments, and dams subject to dynamic loading [5]. Liquefaction studies and subsurface modeling also necessitate using shear wave velocity in their analysis [26]. This velocity can be determined at every depth in a soil profile. Still, the scarcity of data at greater borehole depths resulted in the standardized approach of using the average velocity (m/s) within the upper 30 m depth of the soil profile (Vs30) [24,27,28].
The average Vs30 is a critical parameter in earthquake-resilient structural and geotechnical design. The selection of the 30 m value can also be attributed to the initiative by the National Earthquake Hazard Reduction Program (NEHRP) based on research conducted in the western United States [29]. Although Vs30 does not predict all aspects of soil behavior [30], seismic design codes worldwide utilize Vs30 values in seismic hazard calculations alongside average standard penetration test (SPT) N-values and undrained shear strengths in the upper 30 m depth. Lower Vs30 values signify a higher potential for ground motion amplification in a seismic event [31].
Several laboratory and in situ methods are employed to measure shear wave velocity. While undisturbed laboratory sampling provides the most ideal condition, the difficulty in handling specimens creates an impractical approach [8]. Field tests involving invasive borehole tests and subsurface wave methods provide reliable measurements but may incur unjustifiable economic losses; hence, correlations with common geotechnical parameters such as the SPT N-value become the consensus practice in determining Vs30. However, most empirical relationships are limited by regional seismicity and geology. This necessitates new correlations to ensure a better fit with the local seismicity and lithology for site amplification and seismic microzonation mapping.
Seismic microzonation categorizes a select region into smaller zones based on aggregated geological, geophysical, and geotechnical parameters to visualize site amplification, liquefaction, and landslide hazards [8]. A localized microzonation model can better approximate site amplification without relying on simplified codified approaches to determining site response coefficients. Consolidating microzonation with isoseismal models can yield hazard risk maps from geospatial data using geographic information systems (GISs). These models can be incorporated into damage and loss assessments and population vulnerability studies to quantify the impact of earthquakes beyond seismic and geophysical parameters. Comprehensive models provide a more precise representation of the expected risks, which aids in proper information dissemination and disaster management before, during, and after earthquakes.
This study aims to compare the resulting Vs30 profiles generated using deterministic spatial interpolation methods available in geographical information system programs. The generated shear wave velocity values were determined from SPT N-values across borehole logs in Metro Manila using correlations obtained and derived from the literature review to approximate the sedimentology and lithology of the region.

2. Literature Review

2.1. Measuring Shear Wave Velocities

Shear wave velocities are obtained either using laboratory or field tests. Laboratory methods measuring Vs include ultrasonic pulse velocity, cyclic triaxial, torsional shear, piezometric bender element, and resonant column tests [21,25,31,32]. These techniques can determine the confining stress, void ratio, over-consolidation ratio (OCR), or soil cementation to calculate the maximum shear modulus and, by extension, the shear wave velocity [33]. The expected relationship of these parameters to the shear wave velocity is shown in Table 1.
Complexities and increased costs in handling undisturbed samples for laboratory methods cause greater reliance on field approaches to measure Vs [34,35]. In situ measurements can be subdivided into two categories: invasive and non-invasive methods [25]. The established invasive methods consist of down-hole, up-hole, cross-hole, and suspension PS-logging [28,31,36]. The most employed method among subsurface approaches is the seismic down-hole test, which involves gauges placed at different borehole depths to detect simulated seismic waves from the ground surface [21]. Invasive approaches are cost-prohibitive, which limits their application in massive projects [37]. Non-invasive approaches include seismic reflection, seismic refraction, refraction microtremor (ReMi), multichannel analysis of surface waves (MASW), spectral analysis of surface waves (SASW), extended spatial autocorrelation (ESAC), and horizontal to vertical spectral ratio (HVSR) [28,37,38]. All subsurface wave techniques involve the determination of shear wave velocities from dispersion curves measured from field data using acoustic sensors [25,39].
Difficulties in conducting in situ tests to determine shear wave velocities, such as equipment unavailability, lack of expertise, limited space, environmental and traffic vibratory disturbances, time, and cost, deter designers from performing site-specific soil characterization [7,22,26,33,38,40,41,42]. These impedances in efforts to profile shear wave velocities are more pronounced in economically constrained regions, resulting in scarce data [43]. While invasive methods perform more reliably than non-invasive methods, both approaches are significantly costly [44]. The impracticality of producing a regional or national shear wave velocity profile led to the inference of soil characteristics from proxy models based on topography, geology, and geophysical data [45]. Correlations with other geotechnical parameters may be used as a simpler alternative in the absence of shear wave velocity profiles [38,46,47]. ASCE 7-22 [19] provisions state that Vs can be empirically identified using in situ borehole parameters such as SPT N-value, CPT qc (tip resistance), and laboratory data on uniaxial compressive strength, soil subgrade reaction coefficient, pre-consolidation pressure, effective confining pressures, and void ratio [22,34,48]. Other proxy models derive shear wave velocities from surface geology, geological age, lithology, topography, and geomorphological data [17,30,49]. Field SPT N-values are preferred due to the widespread use of borehole investigation in geotechnical design [50,51,52]. The Department of Public Works and Highways (DPWH) conducts standard penetration tests (SPTs) and rock drilling to obtain Vs values in lieu of seismic and geophysical surveys, which are not commonly performed in the Philippines [2].

2.2. Empirical Shear Wave Velocity Equations

Numerous empirical relationships between shear wave velocity and SPT N-value use power law regression, as shown in Equation (1) [38,53,54]. N-values are typically uncorrected for overburden pressure in most regression equations but are corrected accordingly as an N60 value depending on hammer specifications. Regardless of the approach, both corrected and uncorrected correlations perform with similar degrees of accuracy in determining shear wave velocities [55].
V S = A N B
where Vs is shear wave velocity, N is SPT N-value, A is regression coefficient controlling the amplitude, and B is regression coefficient controlling the curvature.
Correlations are primarily regional due to their dependence on local geology. The literature on shear wave velocity equations mainly originates from seismically active regions such as Japan, Greece, Turkey, Iran, and India, as tabulated in Table 2. Equations are primarily made to encompass all types of soils, but empirical equations can also be classified under general soil types [40], as shown in Table 3. Hence, adopting empirical equations to different locations is constrained only to those correlations developed from regions with similar seismicity and lithology [25]. Gallipoli and Mucciarelli [29] argued that regions with peculiar geology cannot employ average shear wave velocities as a sole indicator of site amplification, given that their soil strata feature soft layers enveloped by adjacent stiff material. These soil layers do not exhibit the expected monotonic increase in shear wave velocity with depth due to wave refraction. Given that the geological history of Metro Manila is primarily attributed to sedimentation, this complexity will not affect the validity of the adopted empirical correlations from SPT N-values.
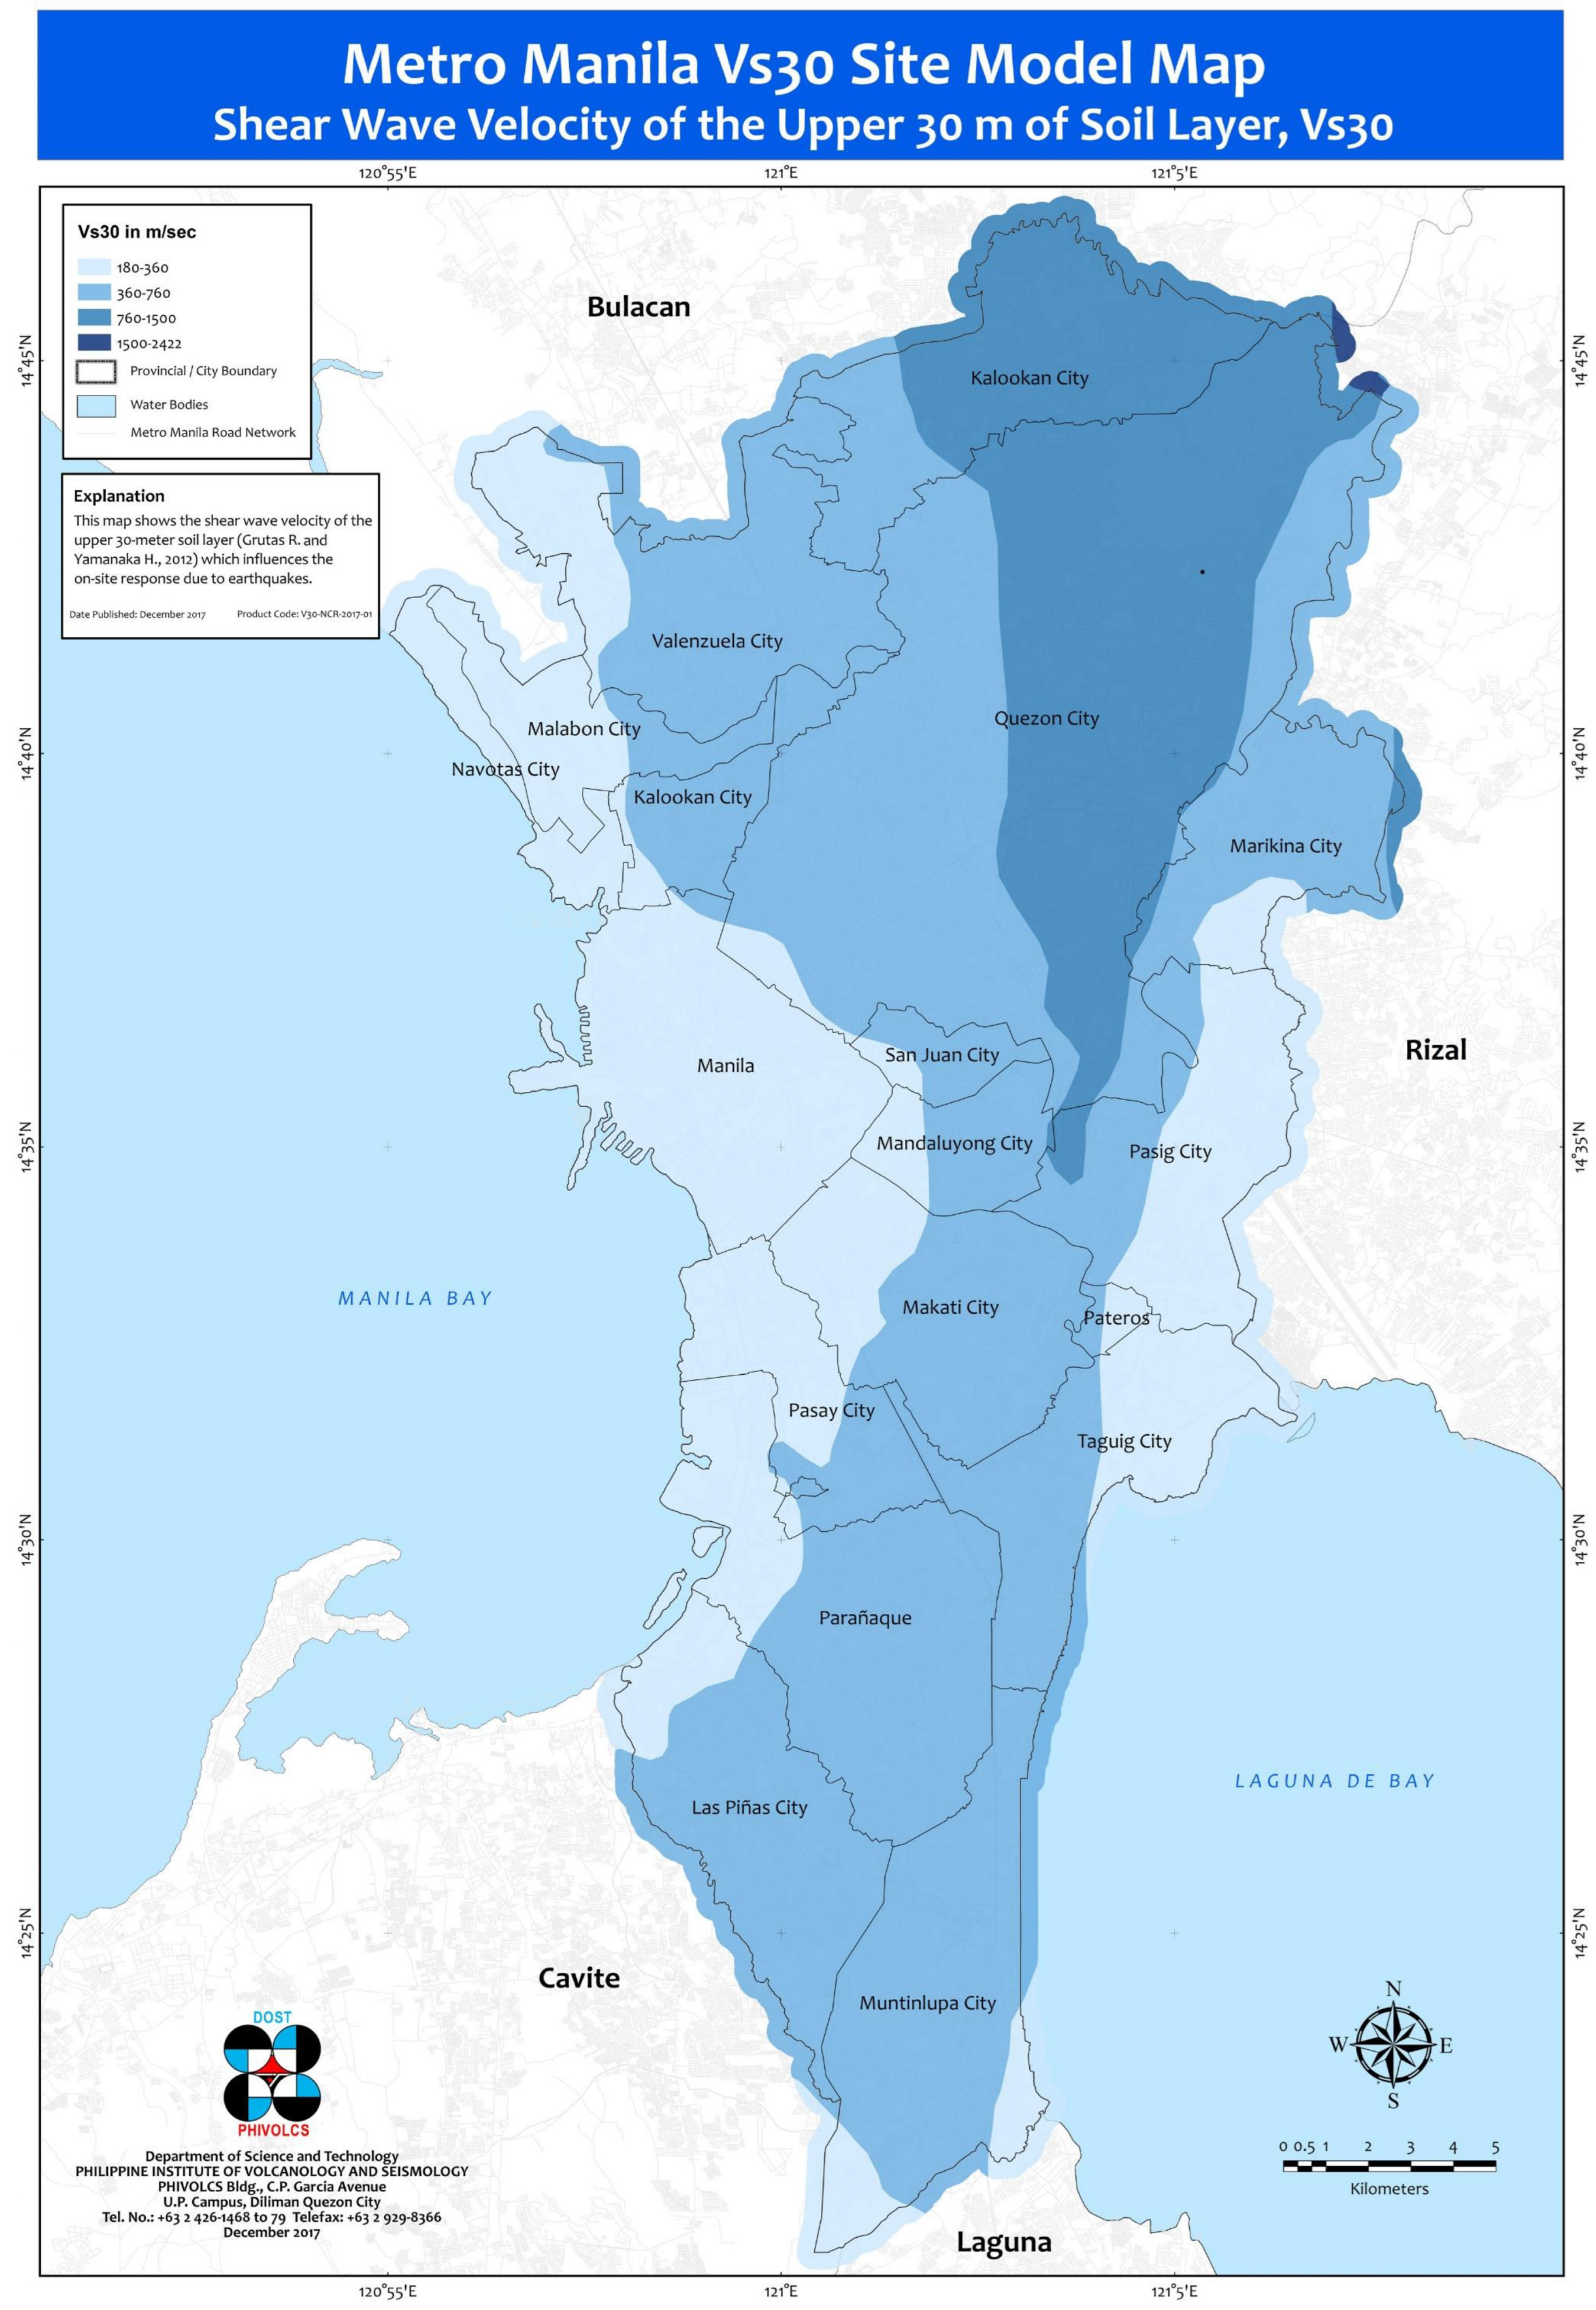
Shear wave velocity variation within Metro Manila has been studied by Grutas and Yamanaka [4], Daag et al. [25], Dungca and Montejo [16], and Monjardin and Medina [2]. Grutas and Yamanaka [4] utilized microtremor array data from 32 sites within the Greater Metro Manila area to create an inferred Vs profile from phase velocity readings. The Vs profile was a reference for the power law regression line approximating the amplification factor. However, their points are concentrated only within the central portion of Metro Manila, and no attempt was made to correlate the velocities with any geotechnical parameters. Daag et al. [25] developed equations correlating 265 pairs of Vs and SPT-N values by transforming the non-linear regression model into a linear equation using the natural logarithm function, which was later converted into a power law regression form listed in Table 2 and Table 3. This equation appears to be sourced from areas classified under soil type SD, which coincides with regions underlain by thick alluvial layers. Shear wave velocities were obtained from refraction microtremor surveys across 20 SPT borehole sites in Metro Manila. Dungca and Montejo [16] incorporated the unified empirical equation by Marto et al. [44] to predict Vs in the absence of instrument measurements to calculate site amplification factors using the adopted Midorikawa and Hori model for seismic risk analysis of Metro Manila. Marto et al. [44] compiled 27 correlations coinciding with those listed in Table 2 to determine a singular global equation for the Vs–N value relationship but failed to consider differences in geology and lithology across regions despite high correlation coefficients. Extrapolation from borehole data was also conducted using logarithmic equations by Boore et al. [99] to ensure prediction of the average shear wave velocities until a 30 m depth. Monjardin and Medina [2] only used three borehole points from MASW surveys to compare the proximity of recorded Vs values with predicted velocities using equations by Boore et al. [100]. While statistical correlations have been explored, visualization of the shear wave velocity profiles has been limited to the map provided by the Philippine Earthquake Model shown in Figure 2.
This study is motivated by the following research gaps in the context of the Philippines. The NSCP stipulates using site response coefficients for short-period and long-period motion adopted from international standards, which refer to studies that characterize their respective local geological conditions. Additionally, the Metro Manila shear wave velocity profile follows a wide interval range in displaying the contour, which reduces the detail in the variation of Vs30 values. A more detailed shear wave velocity profile can be generated using appropriate empirical correlations with easily accessible geotechnical parameters from local borehole records to aid in the development of site-specific ground motion amplification models and seismic risk assessments.

3. Methodology

3.1. Research Locale

Metro Manila contains three distinct geological terrains (Coastal Lowland, Central Plateau, and Central/Marikina Valley) that evolved from eons of tectonic and volcanic activity. Sustained sedimentation originating from the mountainous regions east of Manila (Rizal) occupied the southern section of the Luzon Central Valley, where limestone deposits intercalated with tuffaceous and volcanic material until the Late Cretaceous period. A series of complex tectonic events in the late Tertiary and Quaternary periods led to the formation of the Manila landmass [4,25]. The western Coastal Lowland segment of Manila possesses soft alluvial layers ranging from 20 m to 40 m [102,103]. The Central Plateau comprises the Guadalupe Formation, characterized by thick layers of vitric tuff, pyroclastic breccias, and tuffaceous sandstone shaped by riverine and lake sedimentation processes. The Marikina Valley is produced by the divergent basin within the Vallet Fault System, resulting in the formation of floodplains and alluvial layers near 50 m in thickness [25].
The entire National Capital Region was initially selected as the scope for the whole study. However, inadequate data for shear wave velocity limited the comparison of results within the City of Manila. This area was selected due to its presence in the Coastal Lowlands region, which contains strata prone to site amplification, as exemplified in the 1968 Casiguran earthquake. This location is illustrated in Figure 3.

3.2. Shear Wave Velocity

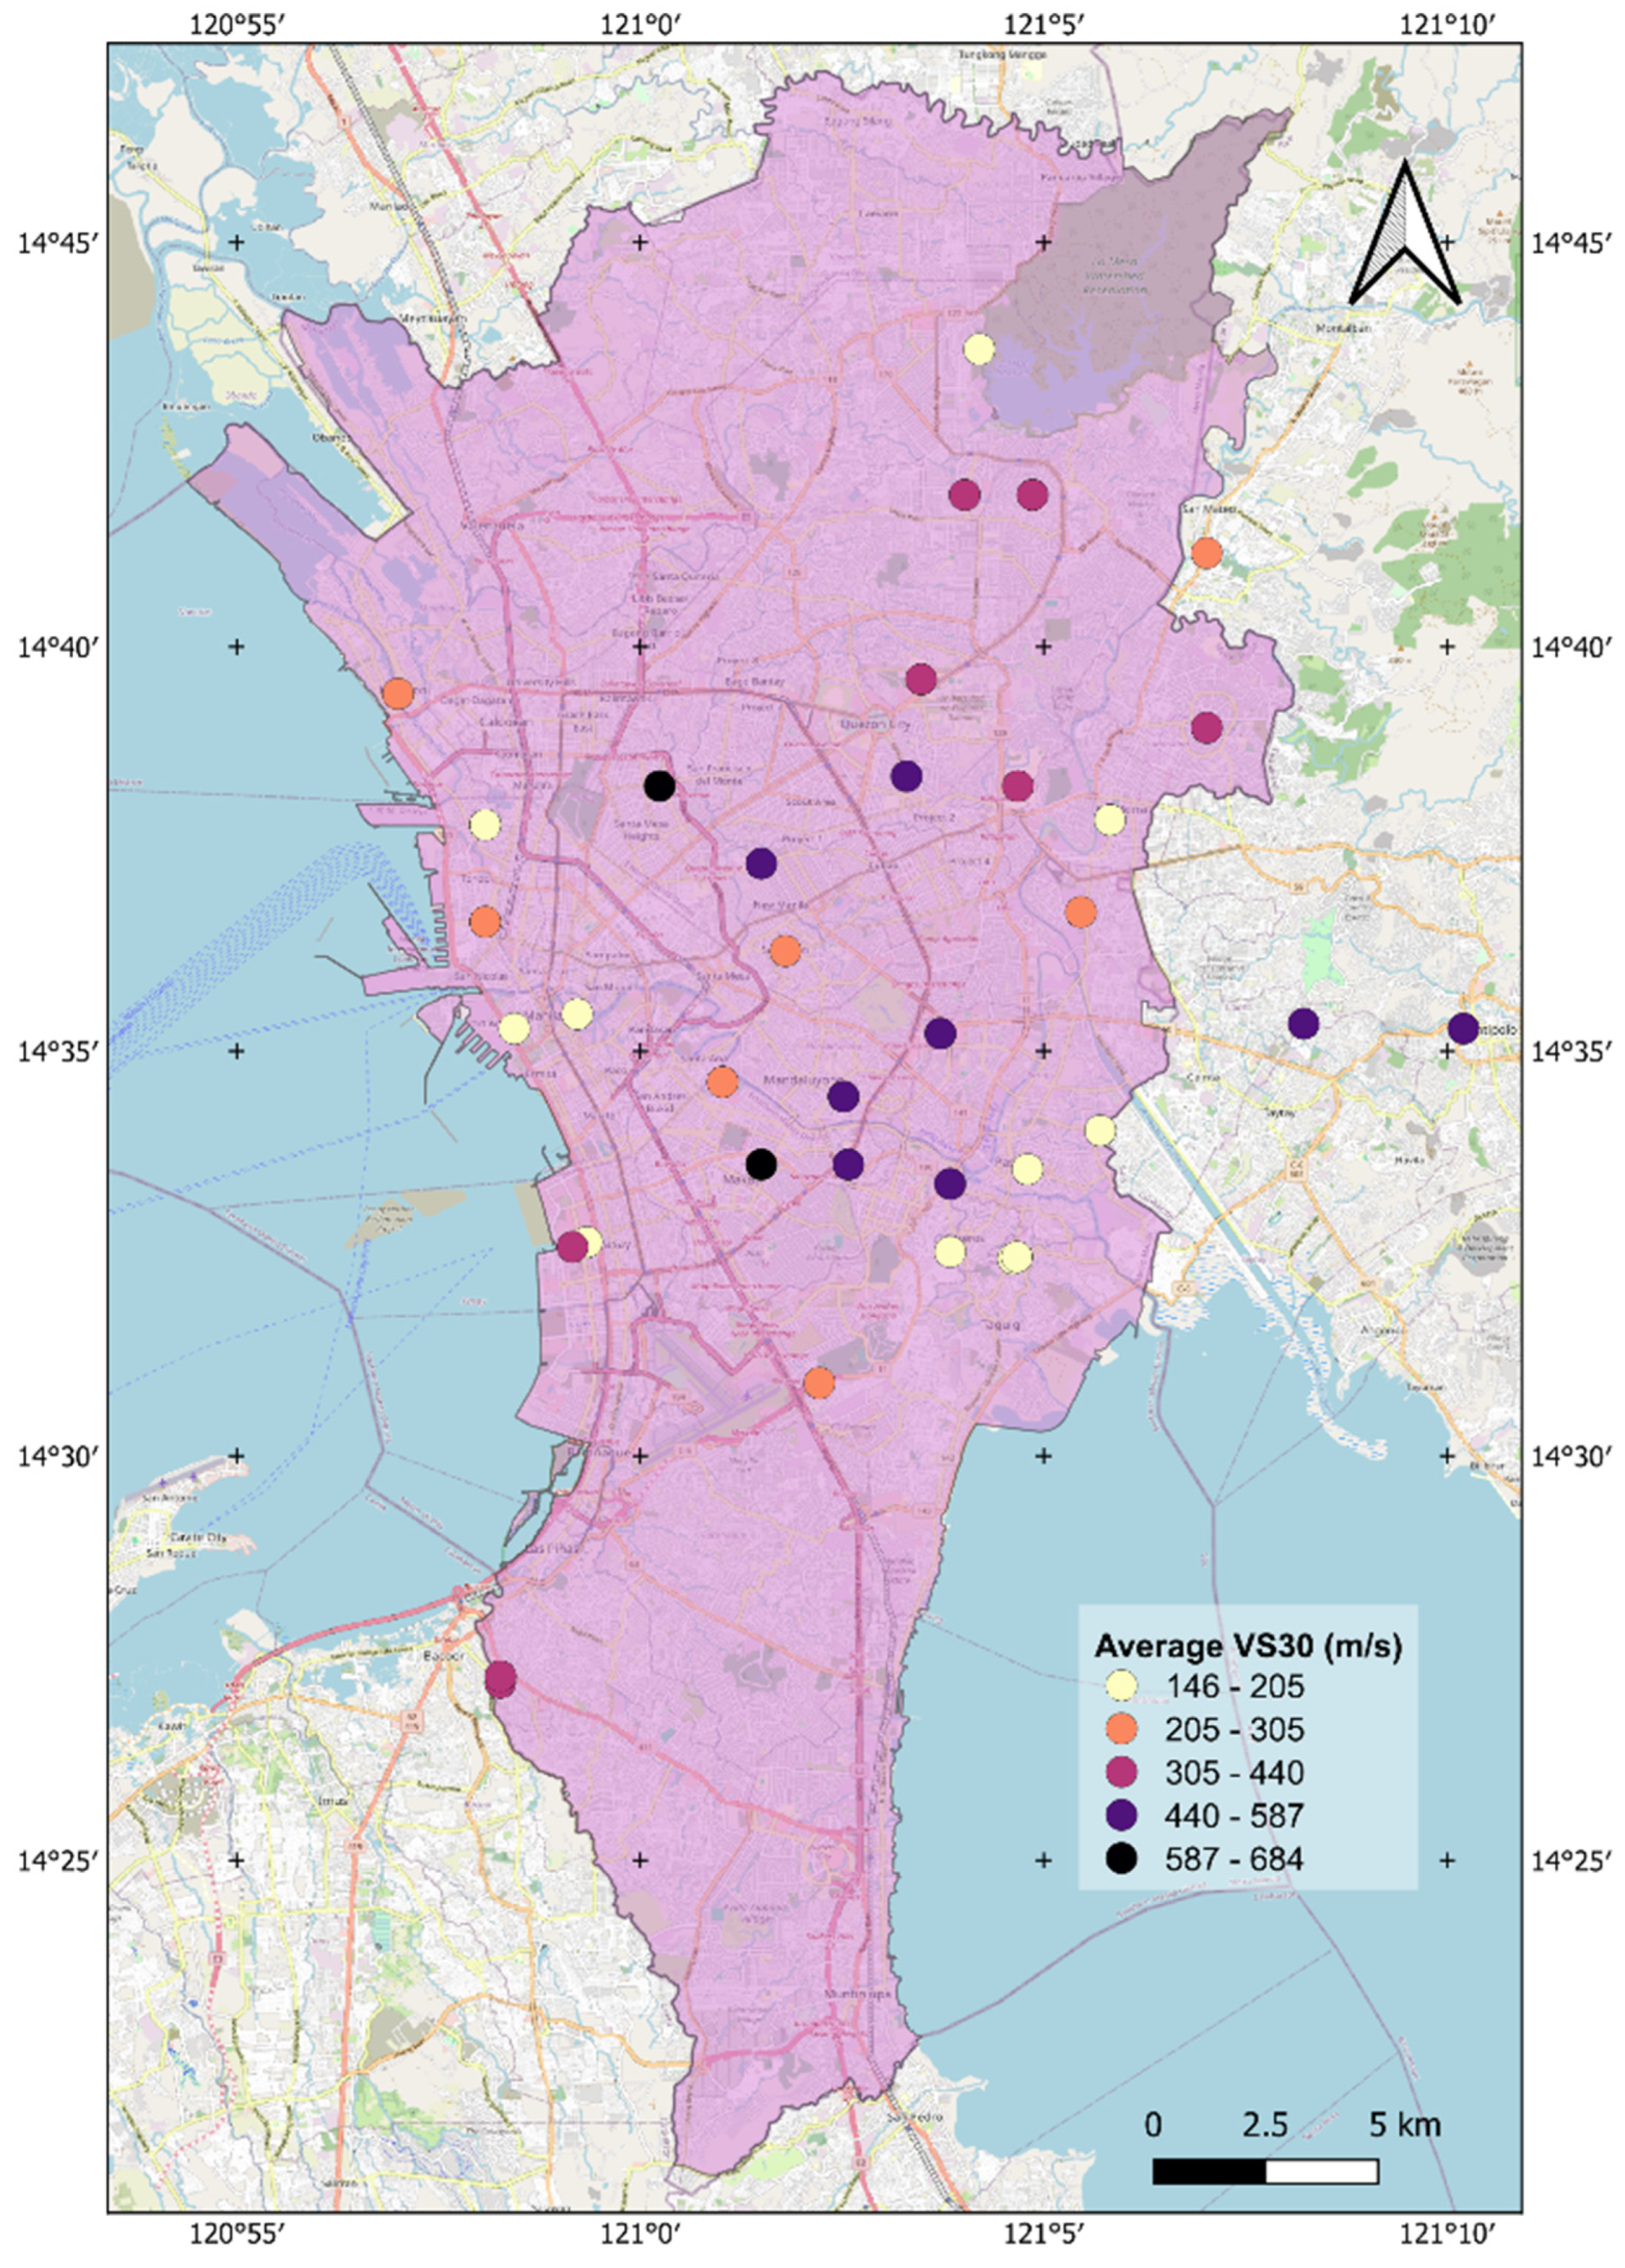
Average shear wave velocities within the first 30 m (Vs30) across data points from the Greater Metro Manila area were referenced from Grutas and Yamanaka [4]. The location of these points is displayed in Figure 4. These velocities were determined by analyzing short period microtremors detected by arrayed sensors in the selected locations. Additional data were obtained from down-hole shear test records from undisclosed private projects. Deterministic spatial interpolation using inverse distance weighted (IDW) interpolation with a power of 2 and thin-spline methods from the System for Automated Geoscientific Analyses (SAGA) plugin in QGIS were employed in visualizing a continuous profile of Vs30 values across Metro Manila.

3.3. Subsurface Data

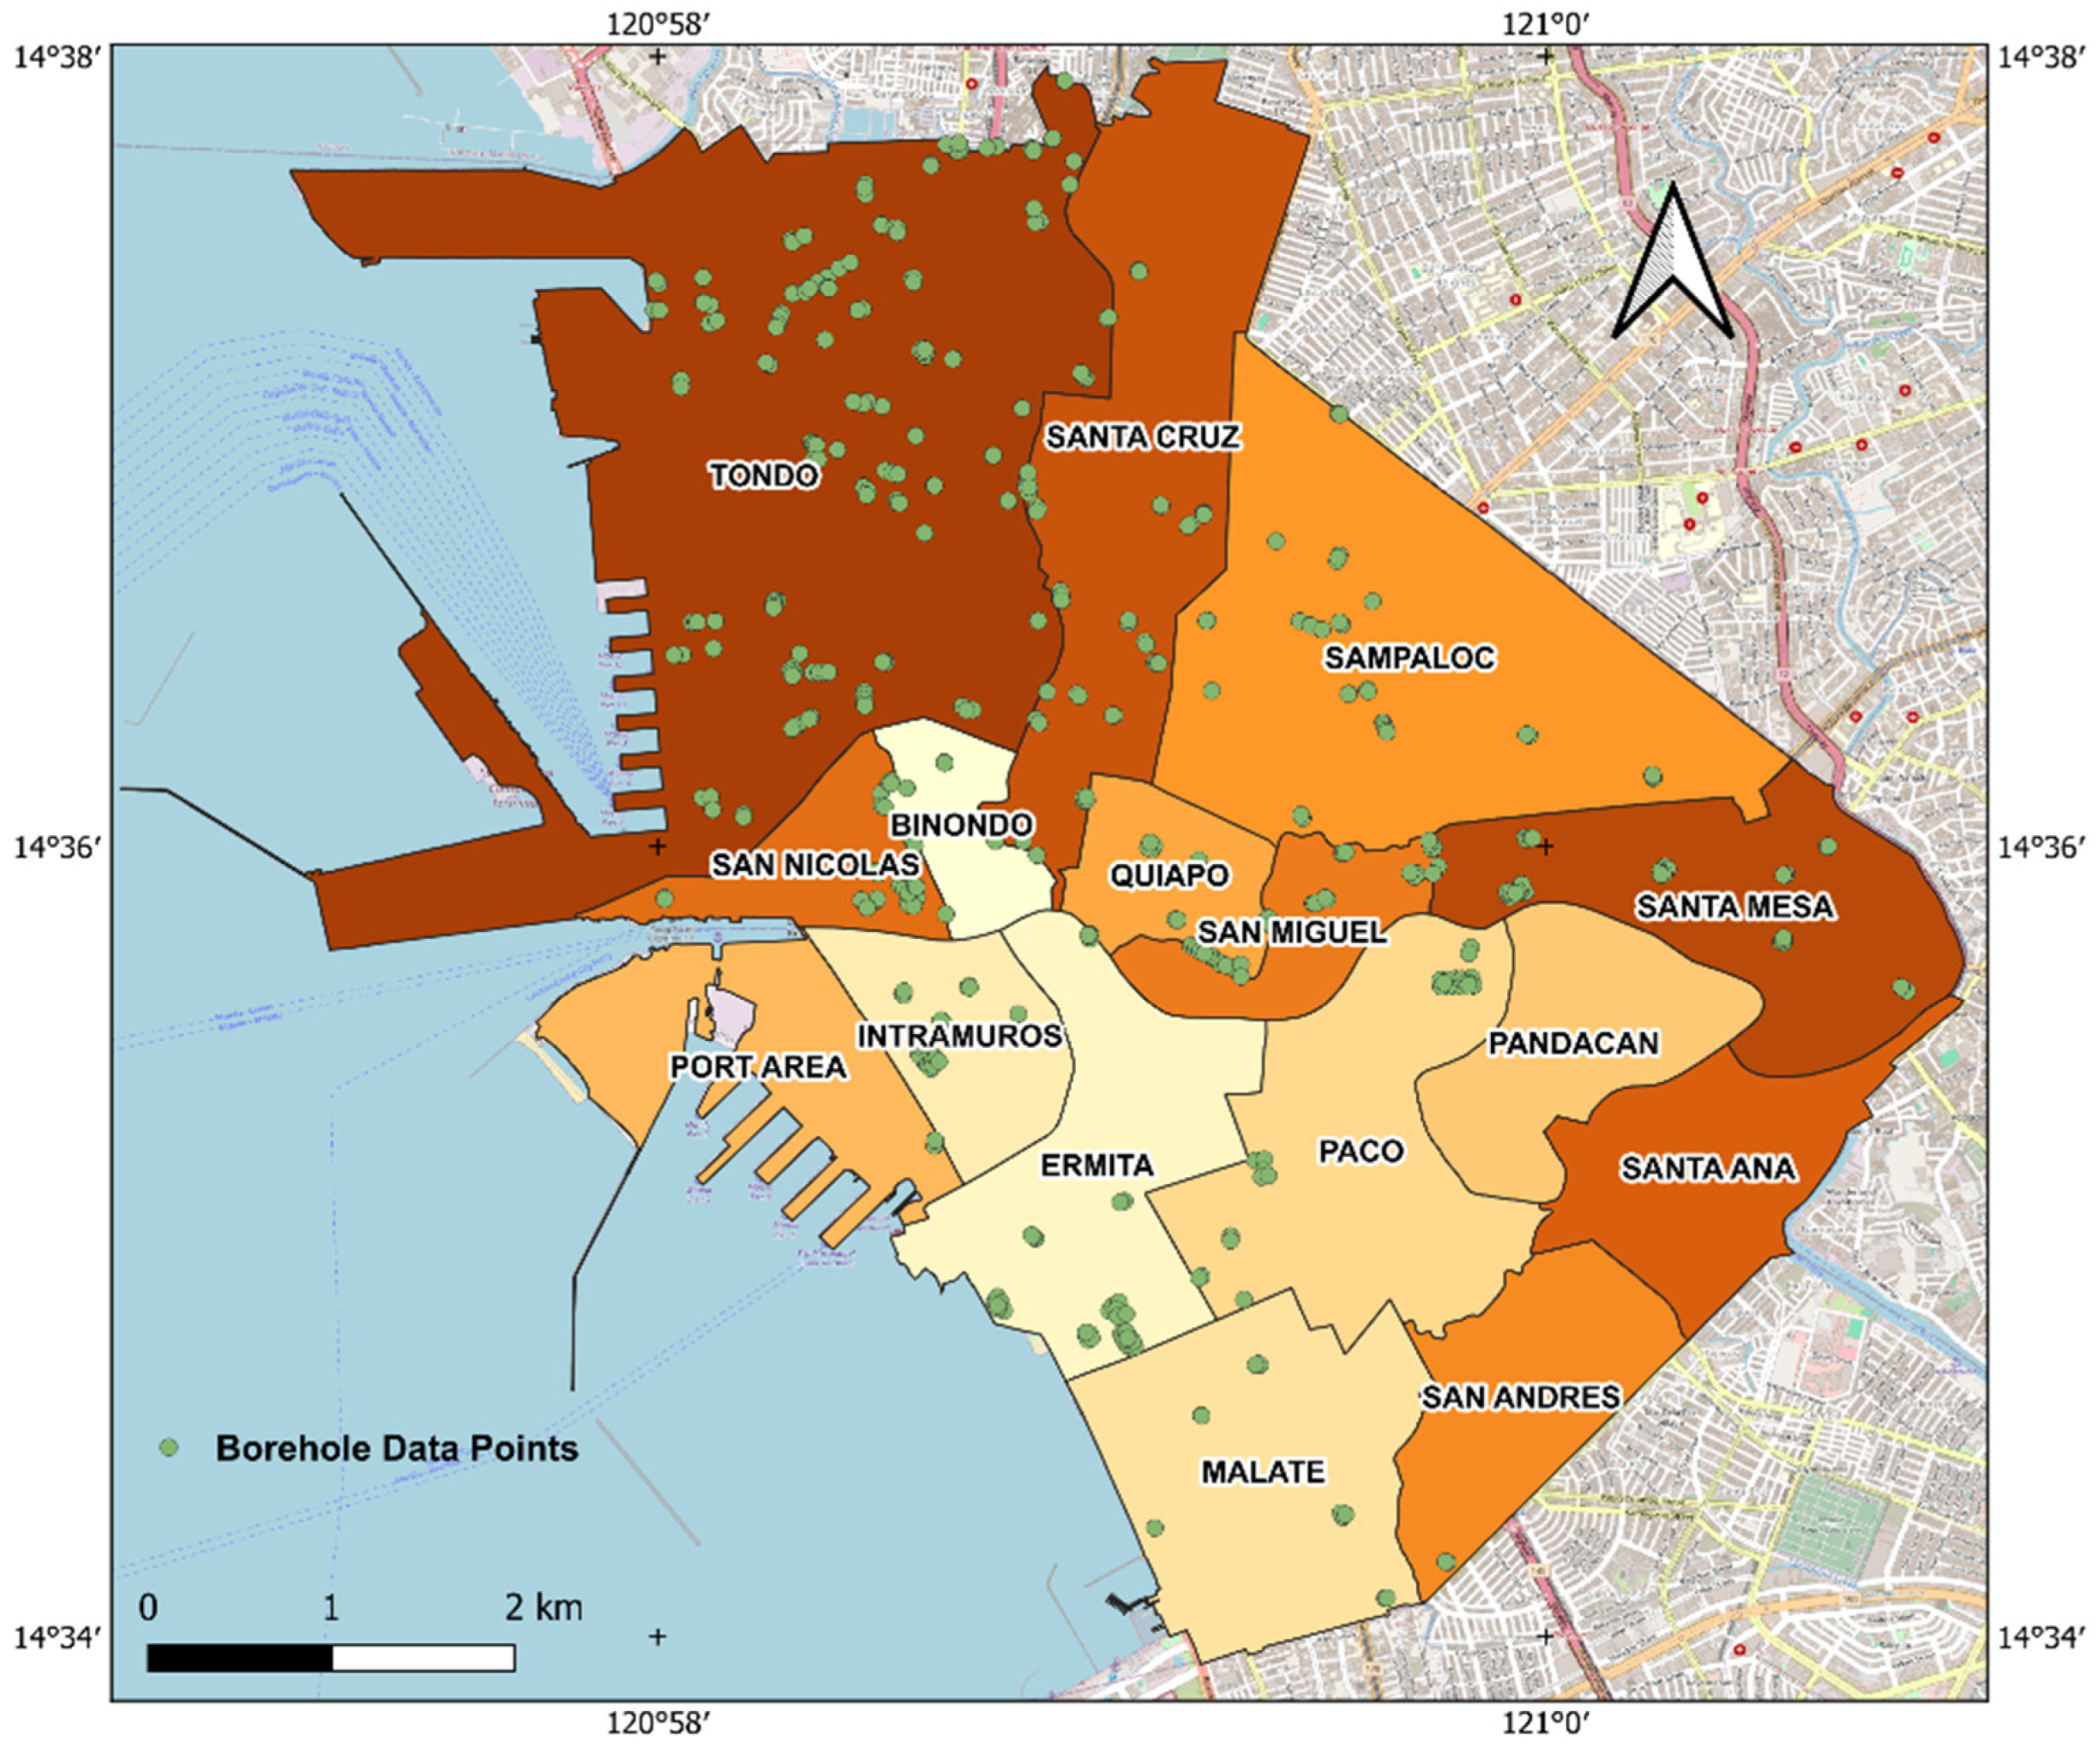
Geotechnical data obtained and calculated from in situ exploratory boreholes are sourced from standard penetration tests (SPT). The prevalence of SPTs in the Philippines can be attributed to the NSCP, which stipulated requirements for the number of boreholes per footprint area of a structure (Daag et al. [25]. Borehole data were collected from previous research [18,104] and undisclosed construction projects within the chosen study area and other locales within immediate proximity of the region to ensure the sparseness of data. The tabulated information from each borehole log includes longitude, latitude, depth, and SPT N-values. The locations of the data points are presented in Figure 5, with the calculated concentration of borehole data per administrative district determined using aggregated areas for barangay level data and the automated count of points within each polygon representing the administrative districts being shown in Table 4.
ASTM D1586 [105] details the procedure for obtaining the N-value at regular depth intervals. A split-barrel probe is driven into the ground to thrust a sampler into the soil in three 150 mm iterations. The recorded N-value is the frequency of blows required to penetrate the second and third successive 150 mm segments after seating penetration has been applied on the first 150 mm segment [7,40]. This parameter may be influenced by the energy delivered by the hammer upon impact, type of hammer, drilling method, hole diameter, rod length, normal stress, and grain size distribution [7,22,25]. These factors can also be considered when determining corrected SPT N-values.

3.4. Selected Empirical Equations

The lack of publicly available instrument data for shear wave velocity necessitates using empirical equations. Compatibility with the Philippine setting was ensured by selecting correlations in Table 2 that originate from regions sharing similar tectonic and geotechnical characteristics, such as Japan, Taiwan, and Indonesia. Despite the prevalence of Indian data, these were not selected due to the difference in abundant soil types. The selected equations are listed in Table 5.
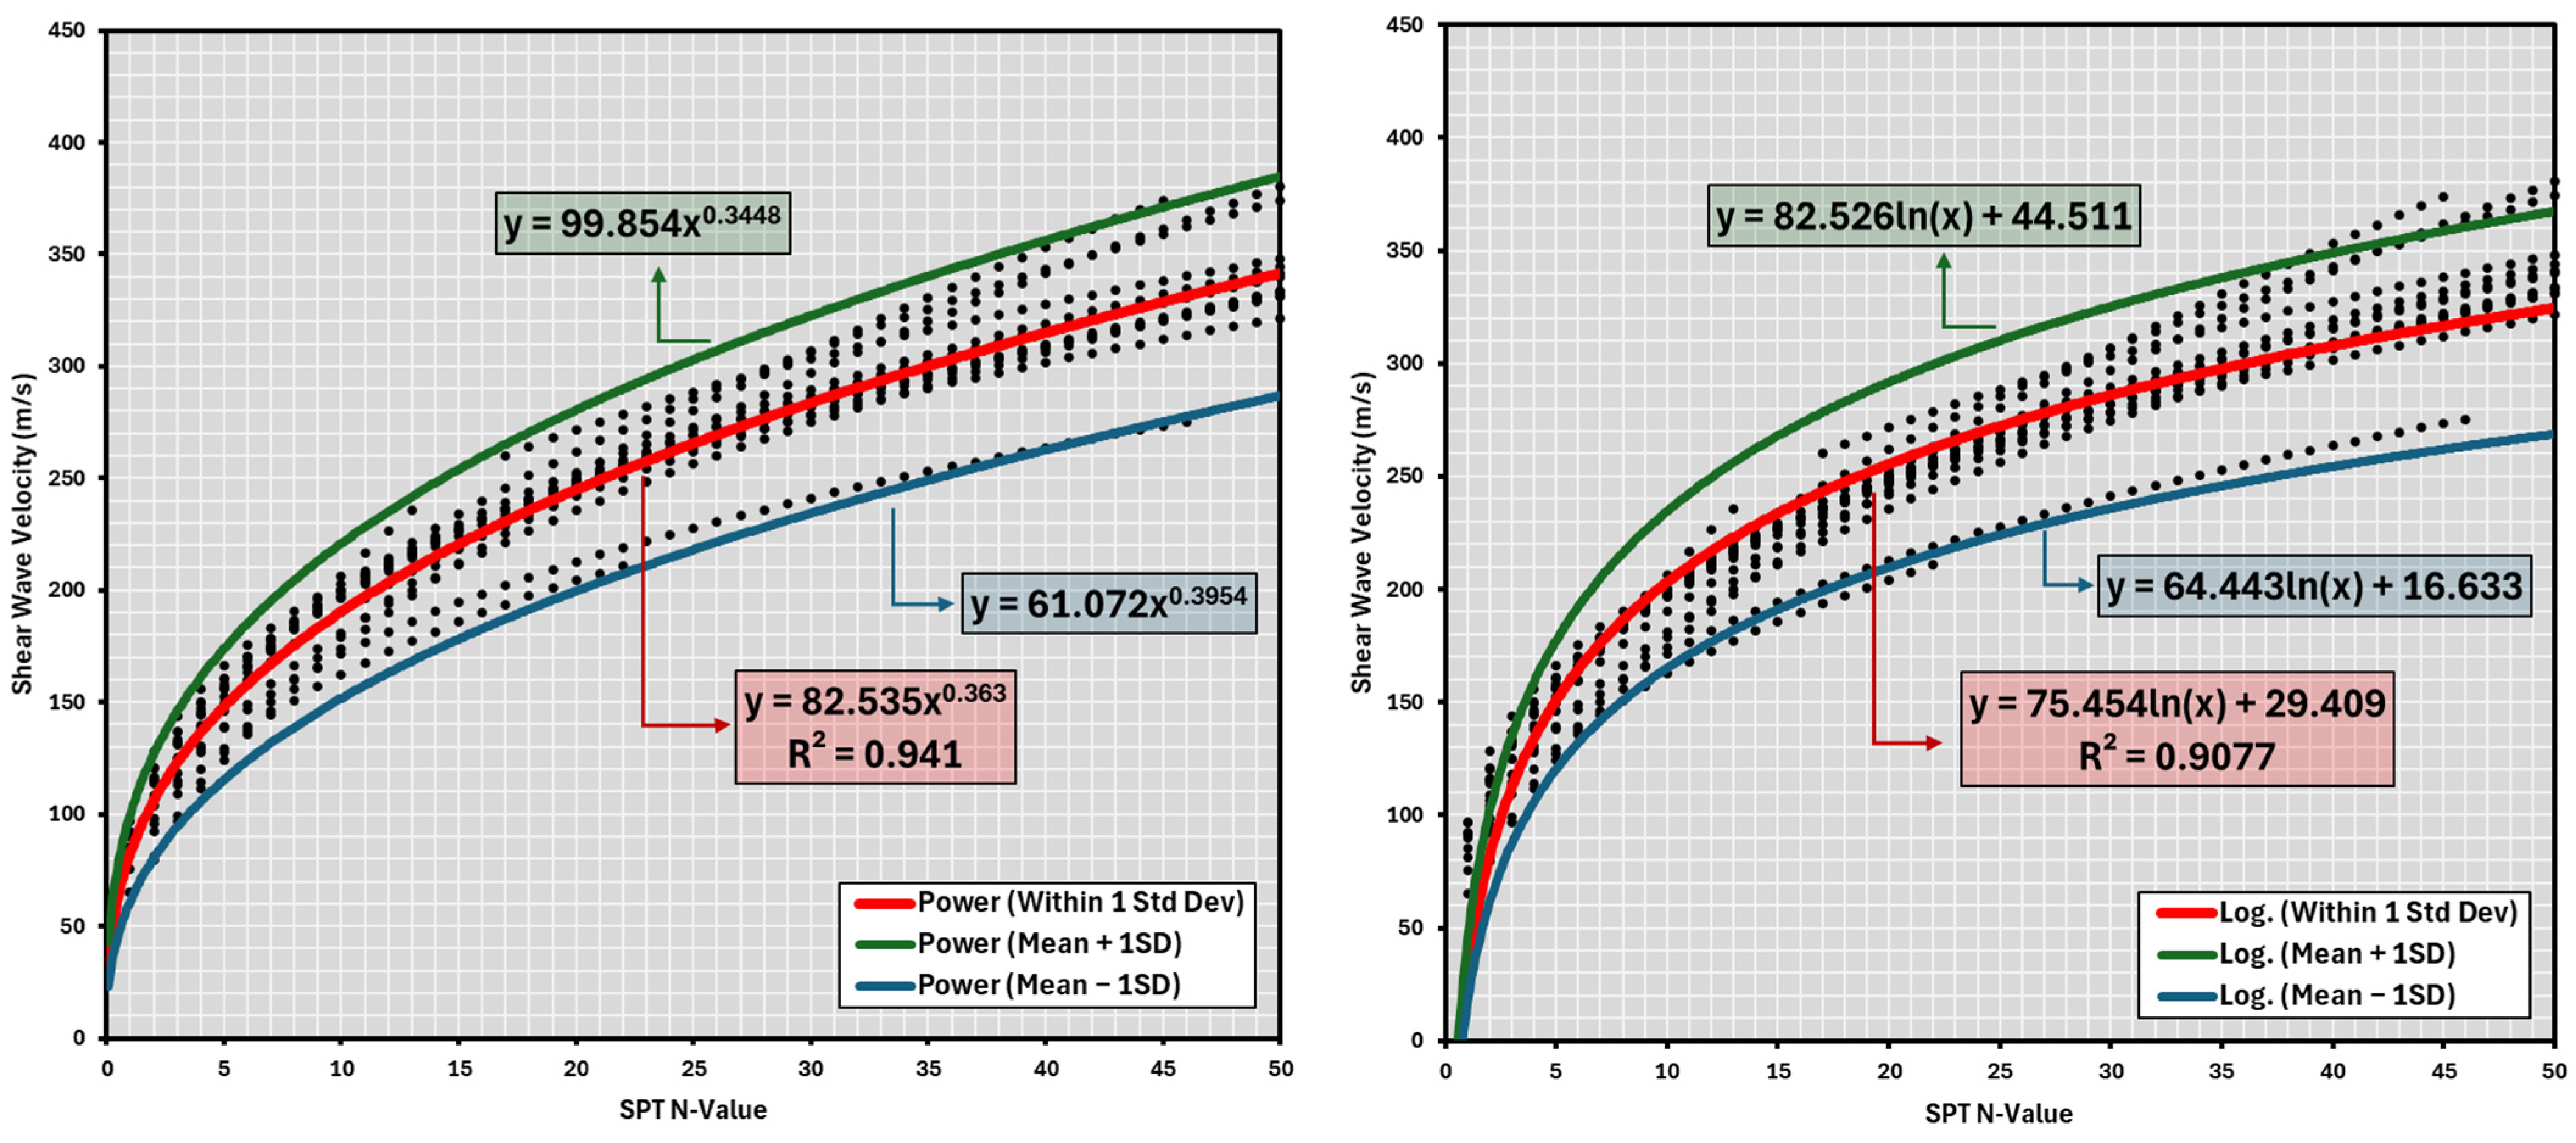
All selected equations were used to calculate shear wave velocities based on SPT N-values ranging from 0 to 50 to determine the general trend in data. The mean μ and standard deviation σ of the entire correlated dataset were determined to remove the outliers falling beyond ±1 standard deviation from the mean. New empirical equations (Equations (2) and (3)) were generated from the reduced dataset to predict the shear wave velocity from the borehole data collected for the City of Manila. While power law equations are the most common, a logarithmic equation was also considered for comparison based on studies by Ulugergerli and Uyanik [77]. These will also be compared to the correlation made by Daag et al. [25].
V s = 82.535 N 0.363
V s = 75.454 ln N + 29.409
where Vs is shear wave velocity at a given section of a soil profile and N is SPT-N-value determined from the borehole log.
Equations (2) and (3) determined from Figure 6 and Figure 7 were used to calculate the shear wave velocity at every soil layer indicated in each borehole log entry in the attribute table. Vs was not determined for layers beyond 30 m depth. For boreholes reaching rock layers above 30 m depth, an SPT N-value of 50 was assigned, given the inconsistency in the availability of core recovery (CR) or rock quality designation (RQD) values in each borehole log.

3.5. Average Shear Wave Velocity (Vs30) in the Upper 30 m Profile

The average shear wave velocity is determined using Equation (4). The results from correlations were converted into Vs30 values.
v s = i = 1 n d i i = 1 n d i v s i
where di is thickness of any layer between 0 and 30 m, vsi is shear wave velocity in m/s, and Σ i = 1 n   di is 30 m.
ASCE 7-22 Section 20.3 [19] stipulates that borehole profiles whose depths fall short of the preset 30 m depth for shear wave velocities may modify Equation (4) by extending the shear wave velocity of the last layer until 30 m, provided that the dataset ranges within 15 m to 30 m. Alternative empirical approaches will be used in the study in place of this provision to offer better extrapolation methods. Boore et al. [99] specified a logarithmic function to extrapolate Vs30 assuming Vsz reaches the point of refusal above 30 m in Equation (5), as shown below:
log V s 30 = c 0 + c 1 log V s z + c 2 log V s z 2
where Vsz is average shear wave velocity at termination depth and cn is regression coefficient from Boore et al. [99]
Three (3) Vs30 datasets were calculated into a new attribute table associated with a point shapefile using Equations (4) and (5) from the resulting Vs values from the power law correlation in Equation (2) and logarithmic correlation in Equation (3). Given that only the average for the upper 30 m depth is needed for spatial interpolation, conditional statements were set in the calculations to extract only the average Vs30 values, both actual and extrapolated depending on the borehole excavation depth. For ease of reference in this paper, Equation (2) was named “TAN-1”, and Equation (3) was called “TAN-2”. The equation of Daag et al. [25] was labeled as “DAAG”. These designated labels were also used for the fields in the associated attribute table. The location of each point in the shapefile was based on the corresponding longitude and latitude obtained from each borehole in the acquired soil reports. The coordinate reference system used in QGIS is WGS 84.

3.6. Spatial Interpolation

Deterministic spatial interpolation methods such as inverse distance weighted (IDW) and thin-spline interpolation were applied for the Vs30 points provided by Grutas and Yamanaka [4]. These options were selected instead of probabilistic models due to the limitation in the number of test points (36) and their relative distances. All borehole data points within the City of Manila were also used for spatial interpolation, with three variations made to reflect the values calculated from TAN-1, TAN-2, and DAAG. A k-fold IDW interpolation approach with 40 cross-validation subsamples, and thin-spline interpolation were applied on the Vs data. Each generated raster was clipped to fit within the bounds of the City of Manila. Cross-validation results were kept for statistical comparison across each interpolated map. The interpolated profiles were compared using the raster calculator in QGIS to measure the percentage difference between plots. Histograms were also generated to determine the frequency distribution of the average Vs30 and percentage difference values. Interpolated raster values were added into points at the location of each borehole to calculate the normalized root mean square error (NRMSE) for each equation. The attribute table for the new sample points was modified to have three additional fields corresponding to the square of the difference between calculated and interpolated Vs30 values at each sample point. Each new field was input into the basic statistics module in QGIS to determine the mean square value. The root of this value divided by the range of values per field is the NRMSE.
The resulting shear wave velocity values were also classified under their respective soil profile types using NSCP 2015 Section 208.4.3.1, as shown in Table 6 [106], based on the 1997 Uniform Building Code (UBC). Discrete symbology with corresponding contours was made by reclassifying the interpolated raster layers by table according to these given ranges to compare with the profile shown in Figure 2. All generated maps from spatial interpolation using empirical correlations or statistical calculations are shown in the next section.

4. Results and Discussions

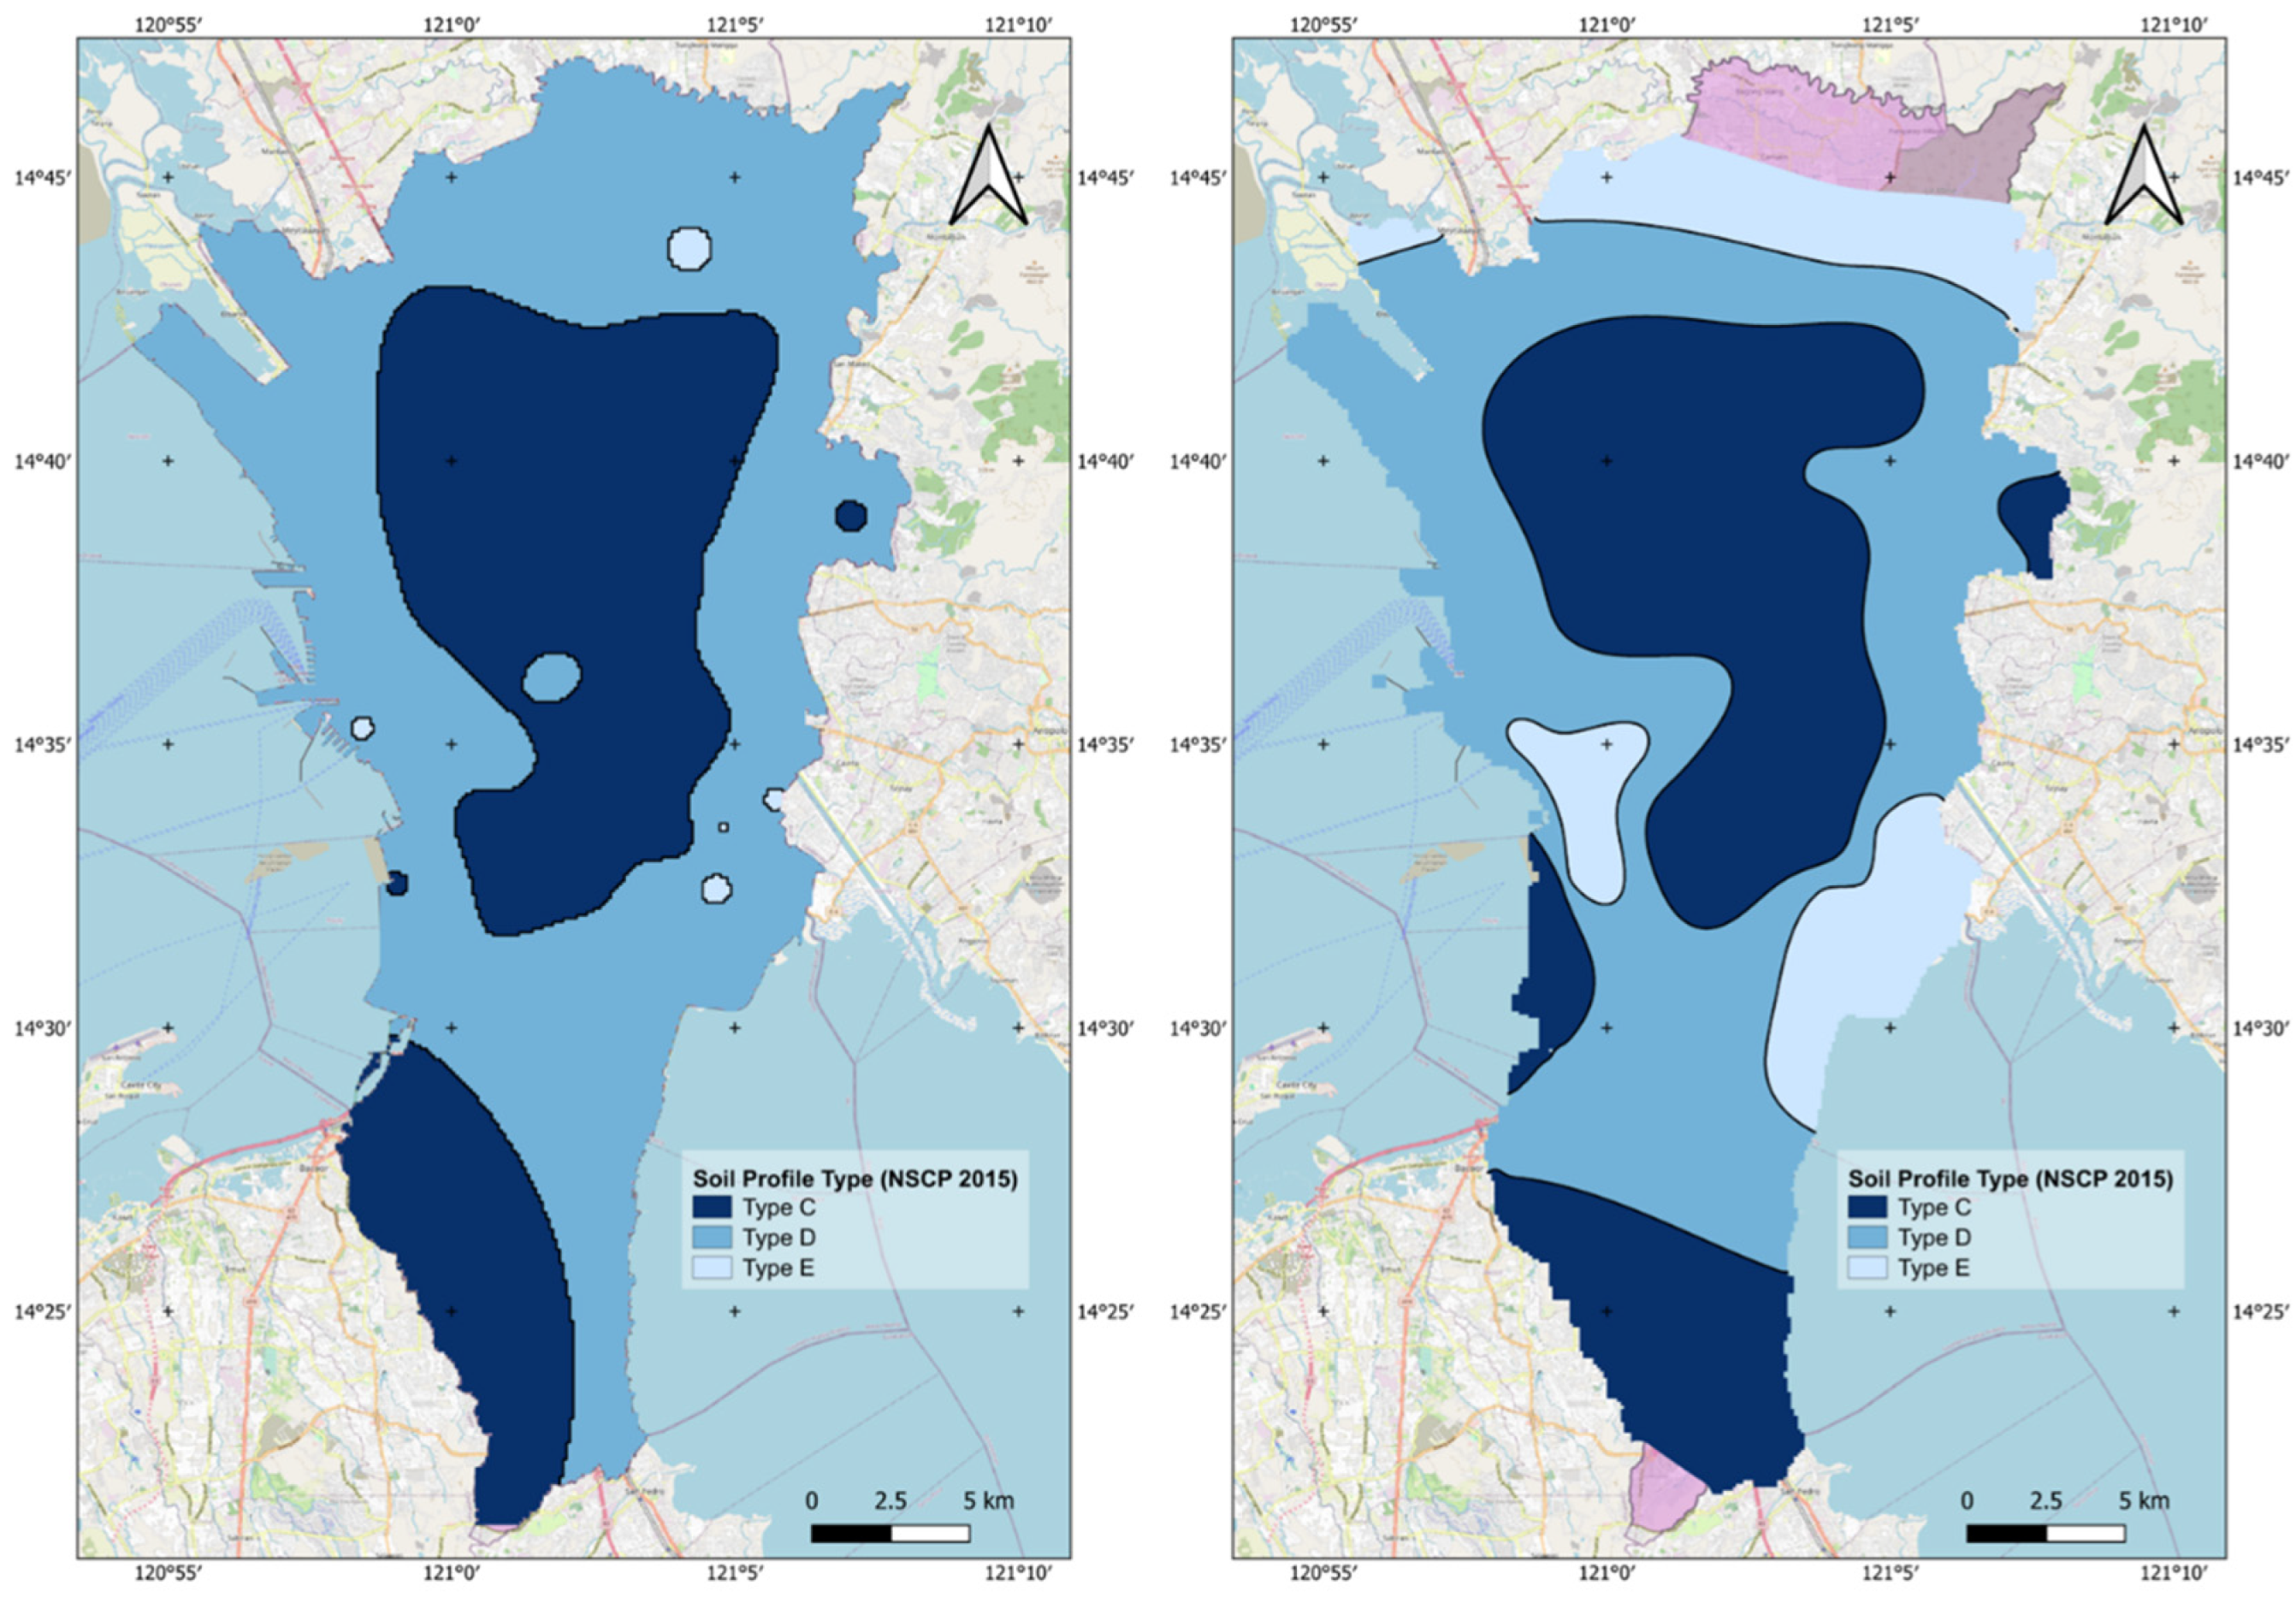
Vs30 profiles for Metro Manila were determined using thirty-six (36) points mainly concentrated within the central latitudes, as displayed in Figure 4. Generated continuous raster profiles shown in Figure 8 and reclassified discrete raster profiles illustrated in Figure 9 indicate a lack of definitive information in the northwest and southern portions of Metro Manila compared to the existing contour map from the Philippine Earthquake Model for the average shear wave velocity (Vs30) within Metro Manila provided by Figure 2. The concentration of the data points within the central section of the region limited the capacity of the program to predict velocity values adequately.
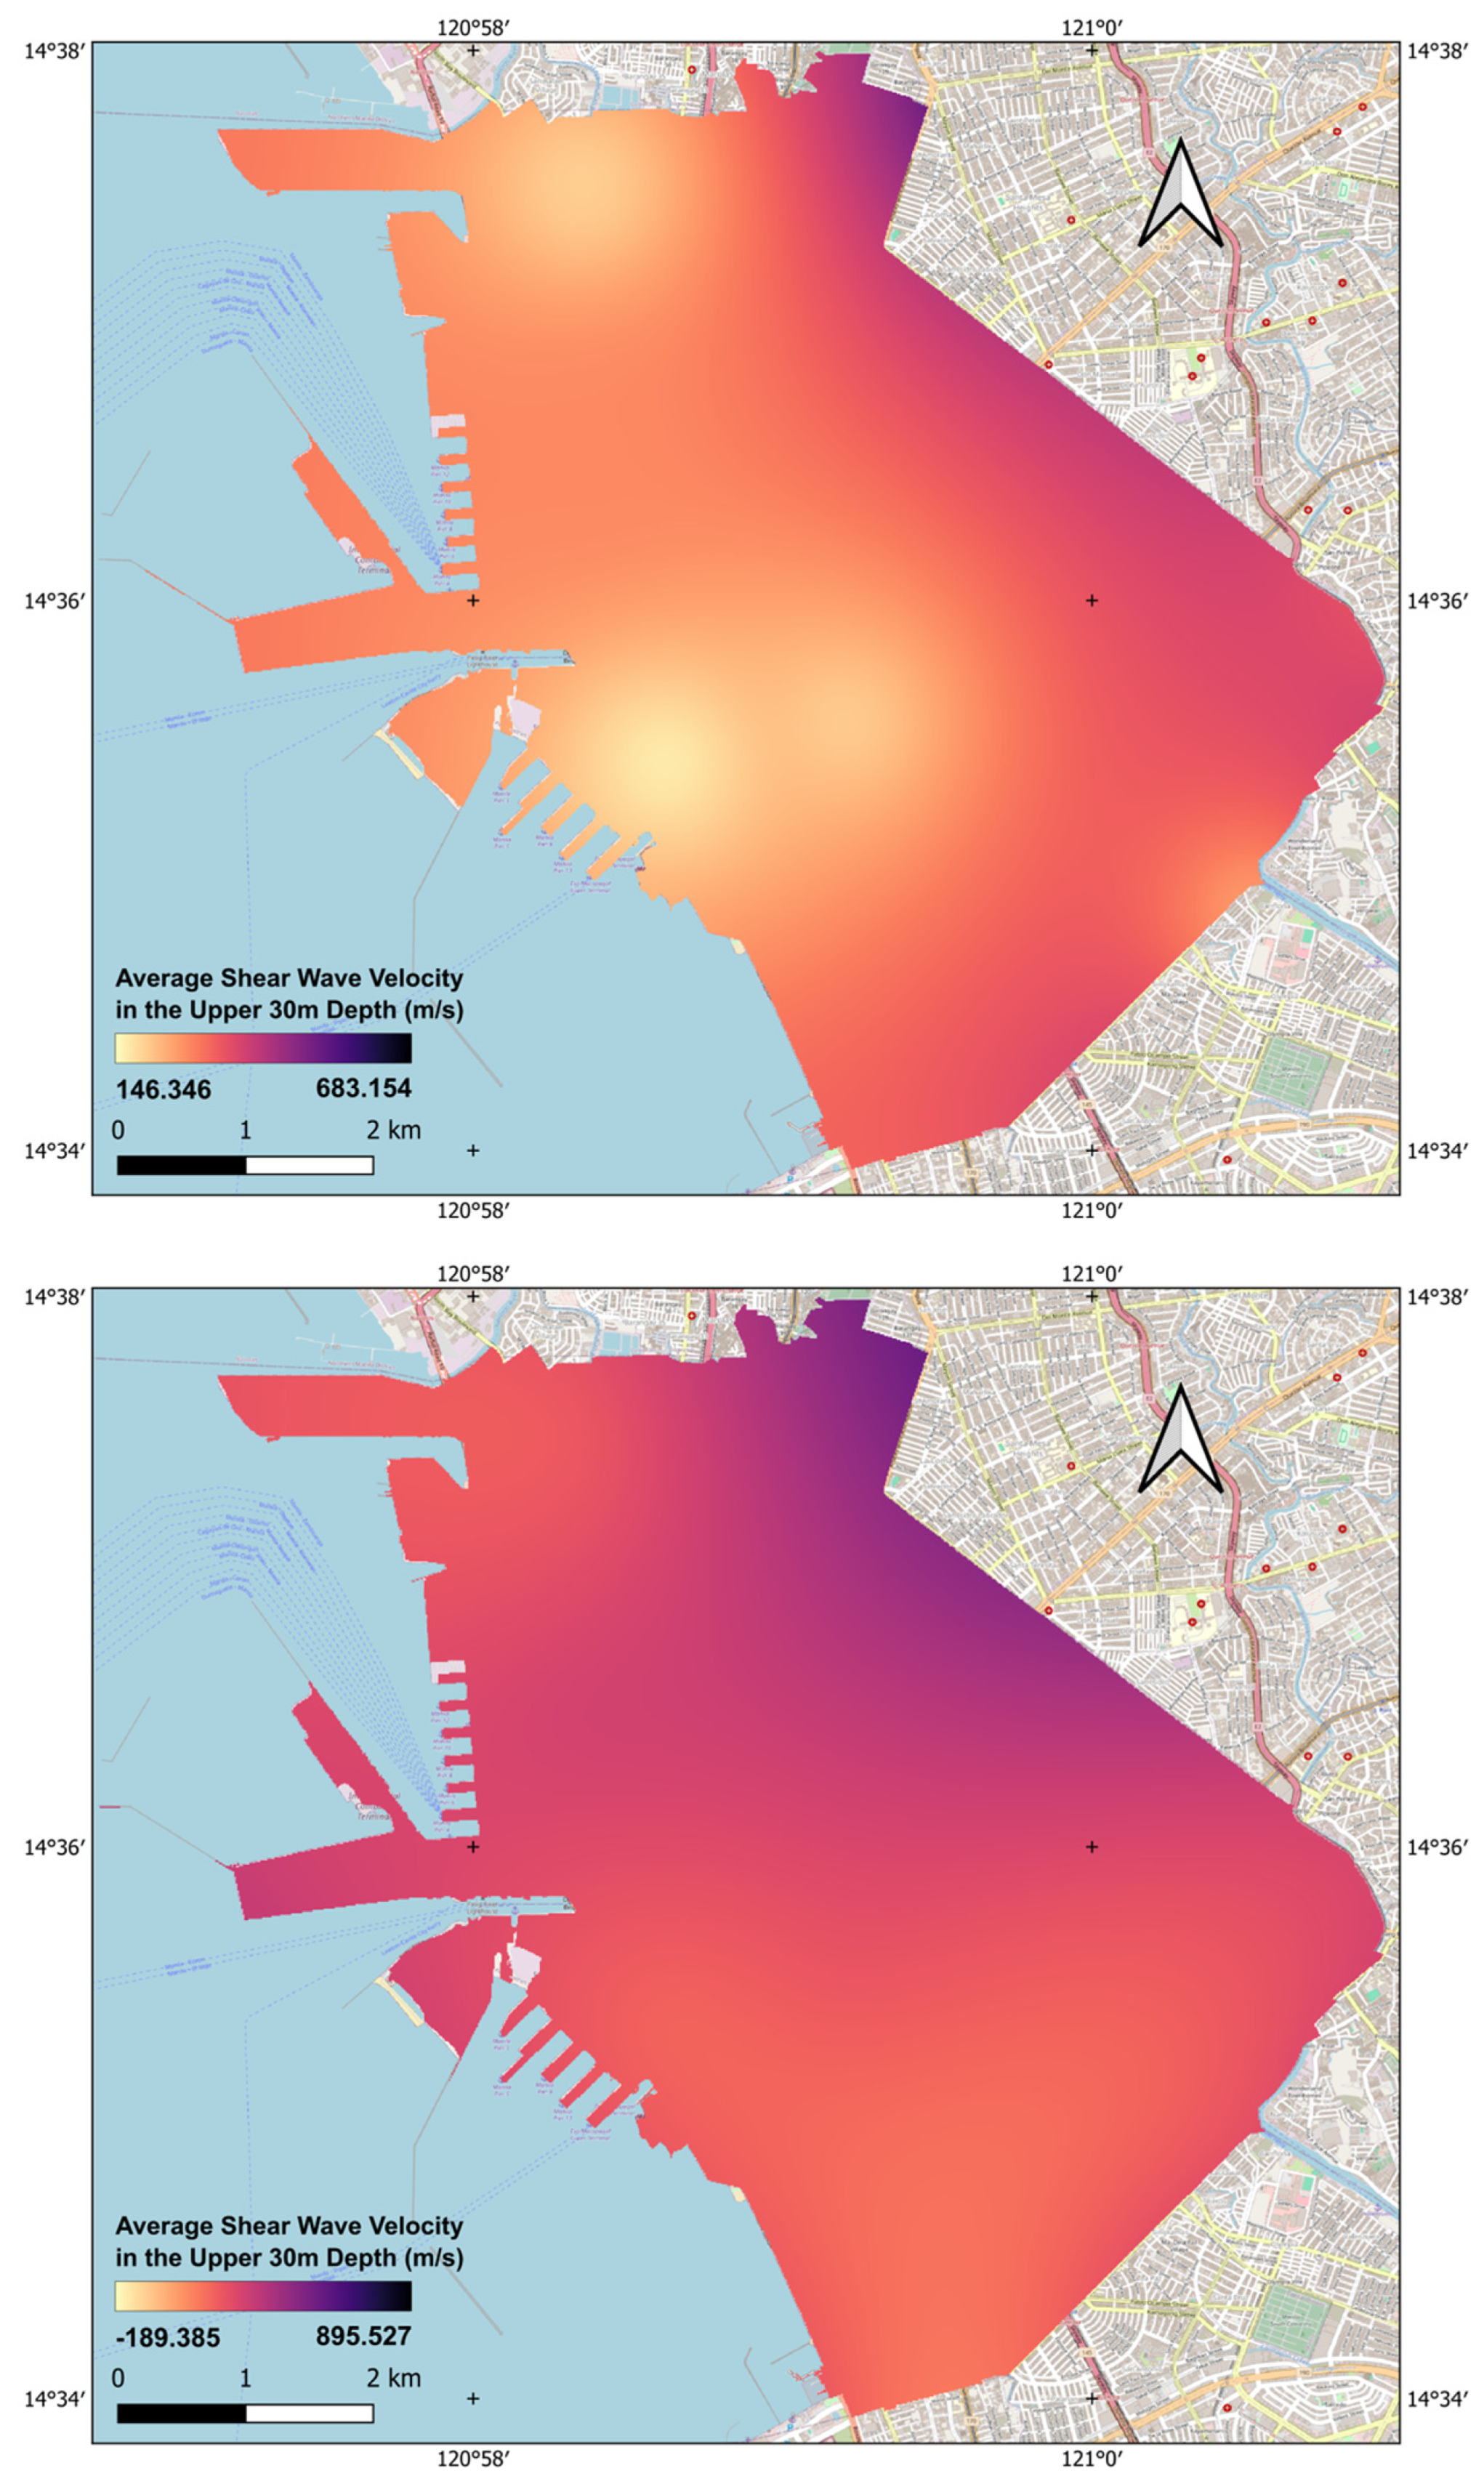
To reduce the impact of insufficient data, the scope of the study was limited to the City of Manila, which was well represented in the VS30 dataset and contains strata consistent with regions experiencing amplification. This reduction is reflected in the maps in Figure 10.
The IDW method assumes that the predicted values diminish in magnitude as it moves farther away from any given point [107]. Since Grutas and Yamanaka [4] did not include points from Valenzuela, North Caloocan, Parañaque, Las Piñas, and Muntinlupa, the values appear to be underestimated in those cities and did not match the expected velocities in their respective tuffaceous profiles. Given that IDW is distance-dependent, the resulting profile features purple peaks around data points with high Vs30 values, with the gradient. Using exponents greater than two (2) in IDW power interpolation minimizes distinct peaks, but it also increases the root mean square error of the predicted values. The profile stemming from the thin-spline interpolation also reduces the peaks in the continuous contour as the smoothing parameter can be comparable to other geostatistical approaches such as kriging. However, splines depend on subjective choices for the smoothing parameter, unlike various kriging techniques that utilize experimental variograms to determine the appropriate function for the authorized variogram model for spatial interpolation [107].
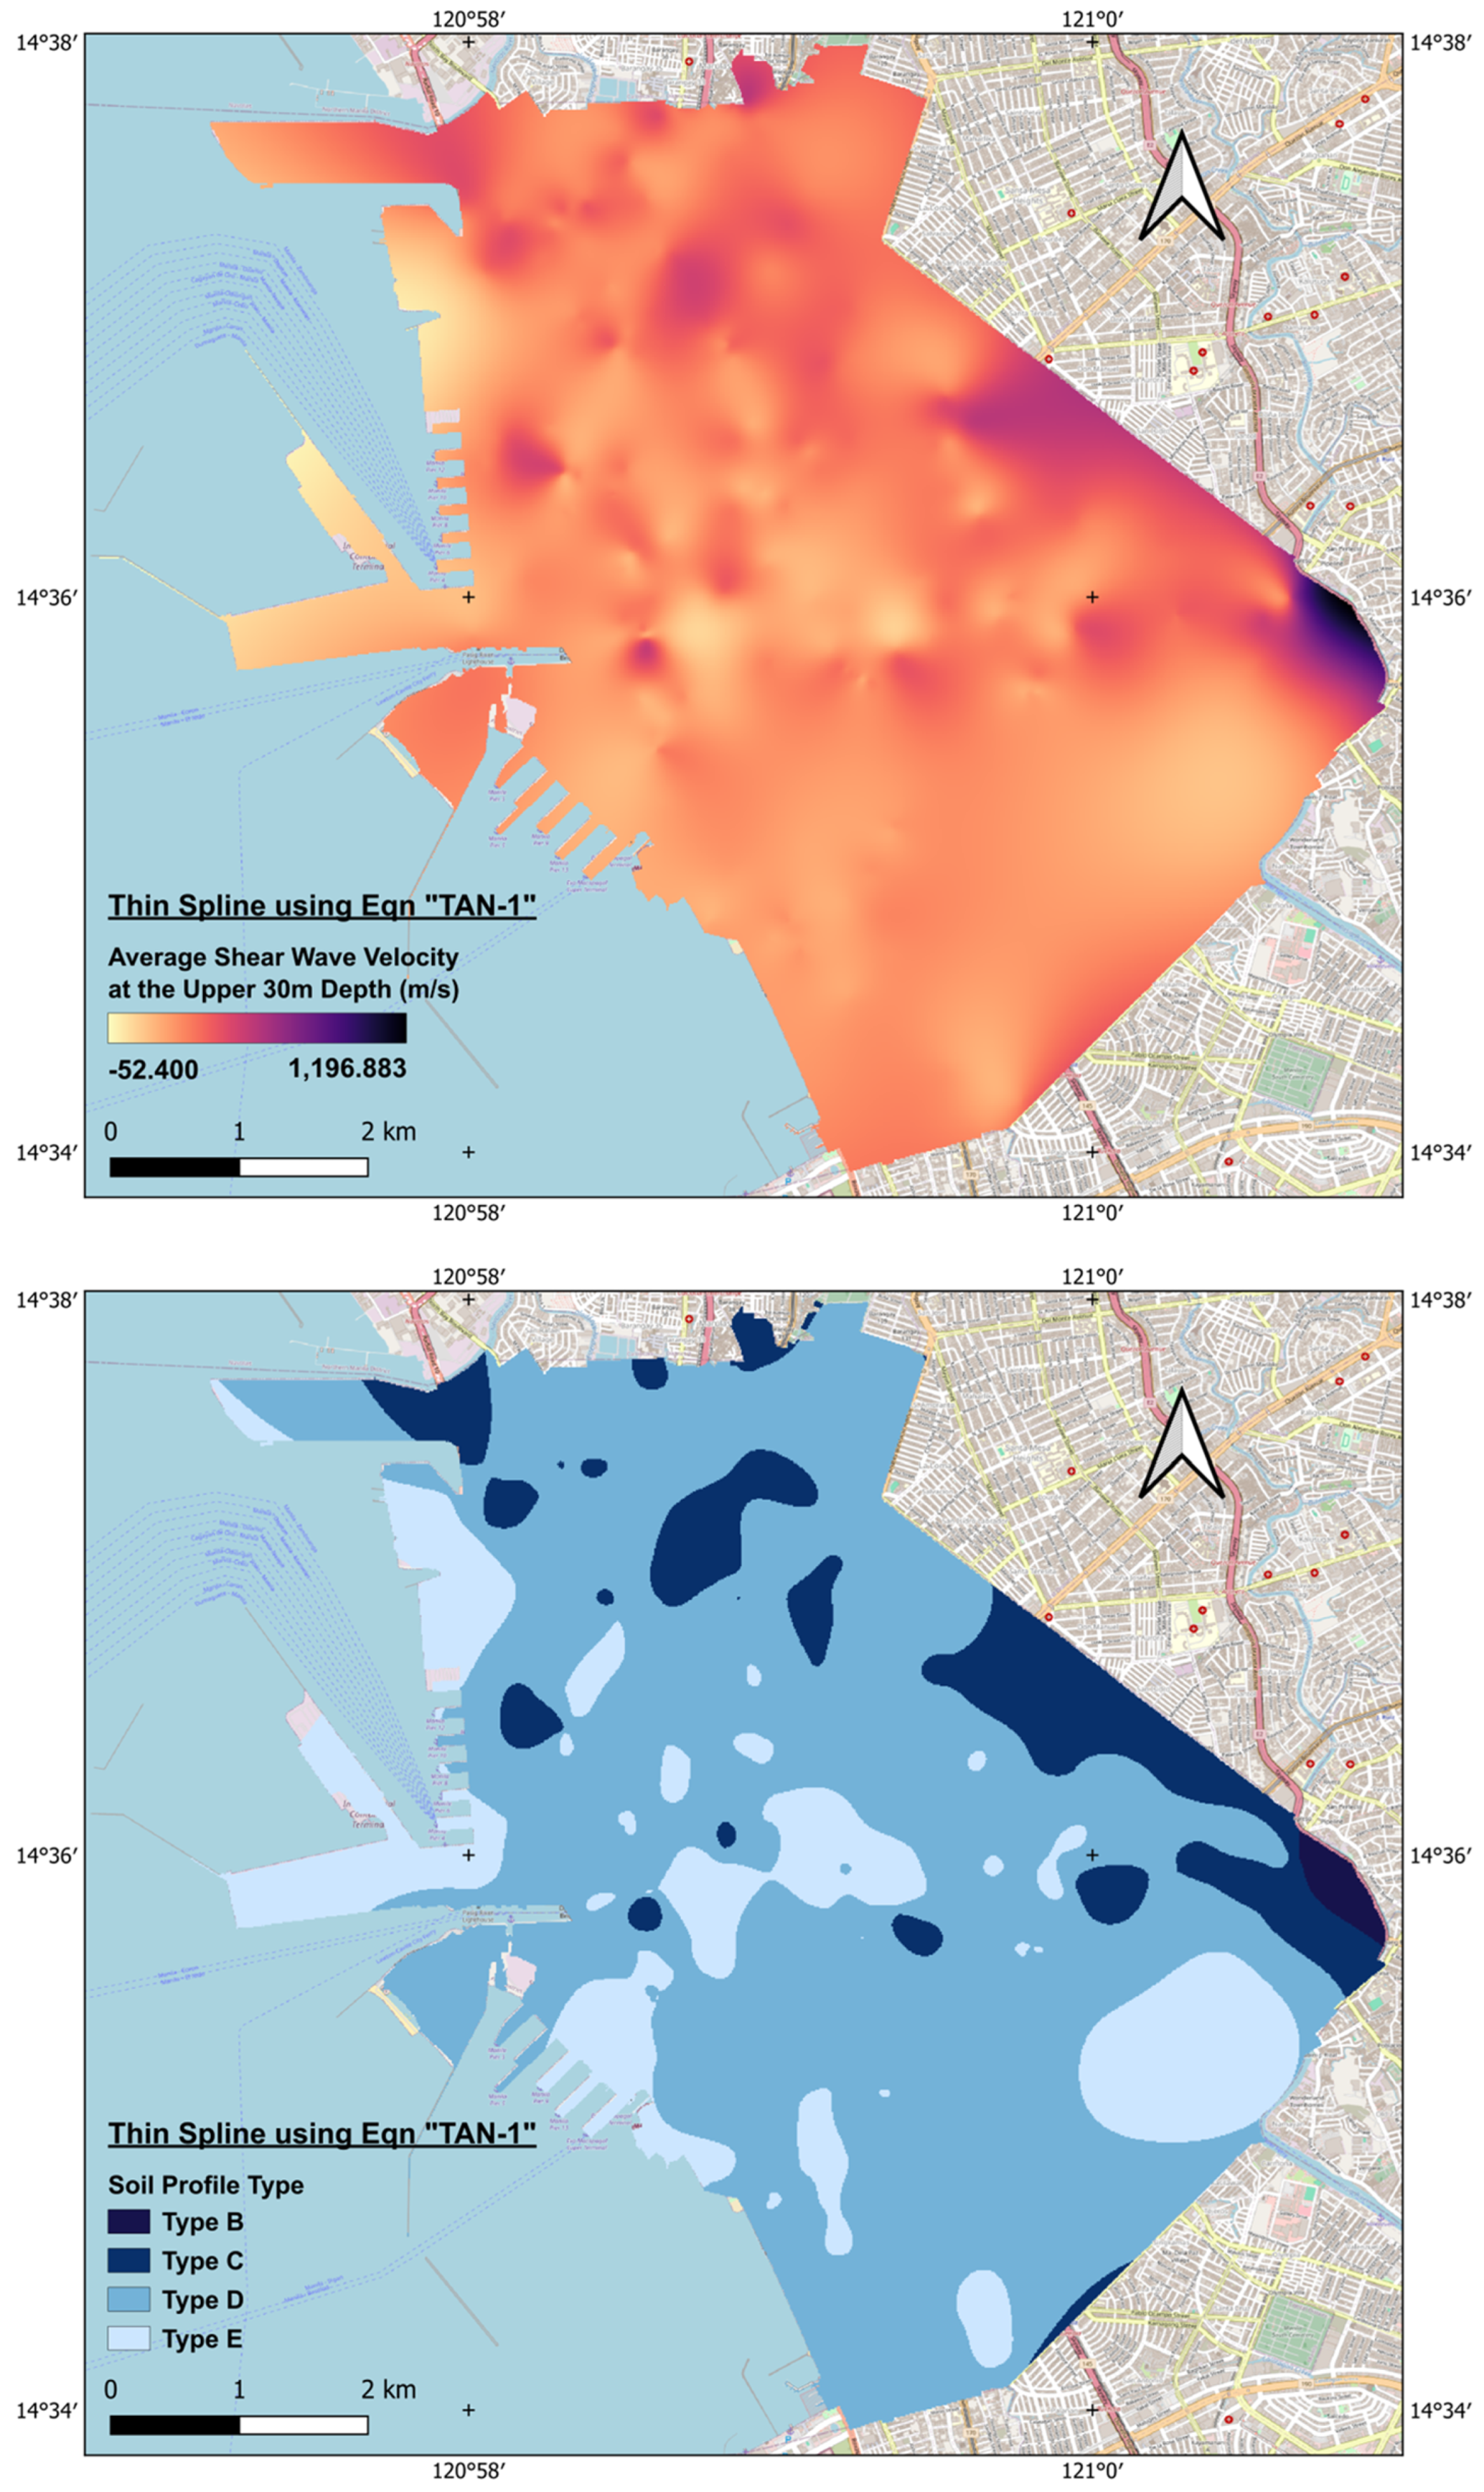
The profile interpolated using the thin spline depicted a smoother prediction that approximates the geology of the Central Plateau but suffers from predicting extreme values towards the periphery of the metropolis due to a lack of data points. This was exemplified in Figure 8 by the range of the color band that extends beyond the values found in the dataset, even reaching the negative values at the northernmost edge of Manila. Figure 9 indicated a translucent layer underneath the soil profile contour representing portions of Manila with negative Vs30 values or Vs30 beyond the maximum velocity of 760 m/s for soil type C. The reduction in scope from Metro Manila to the City of Manila seeks to avoid this issue, but it may resurface for thin-spline interpolation from correlated Vs30 values if data points were placed sparsely.
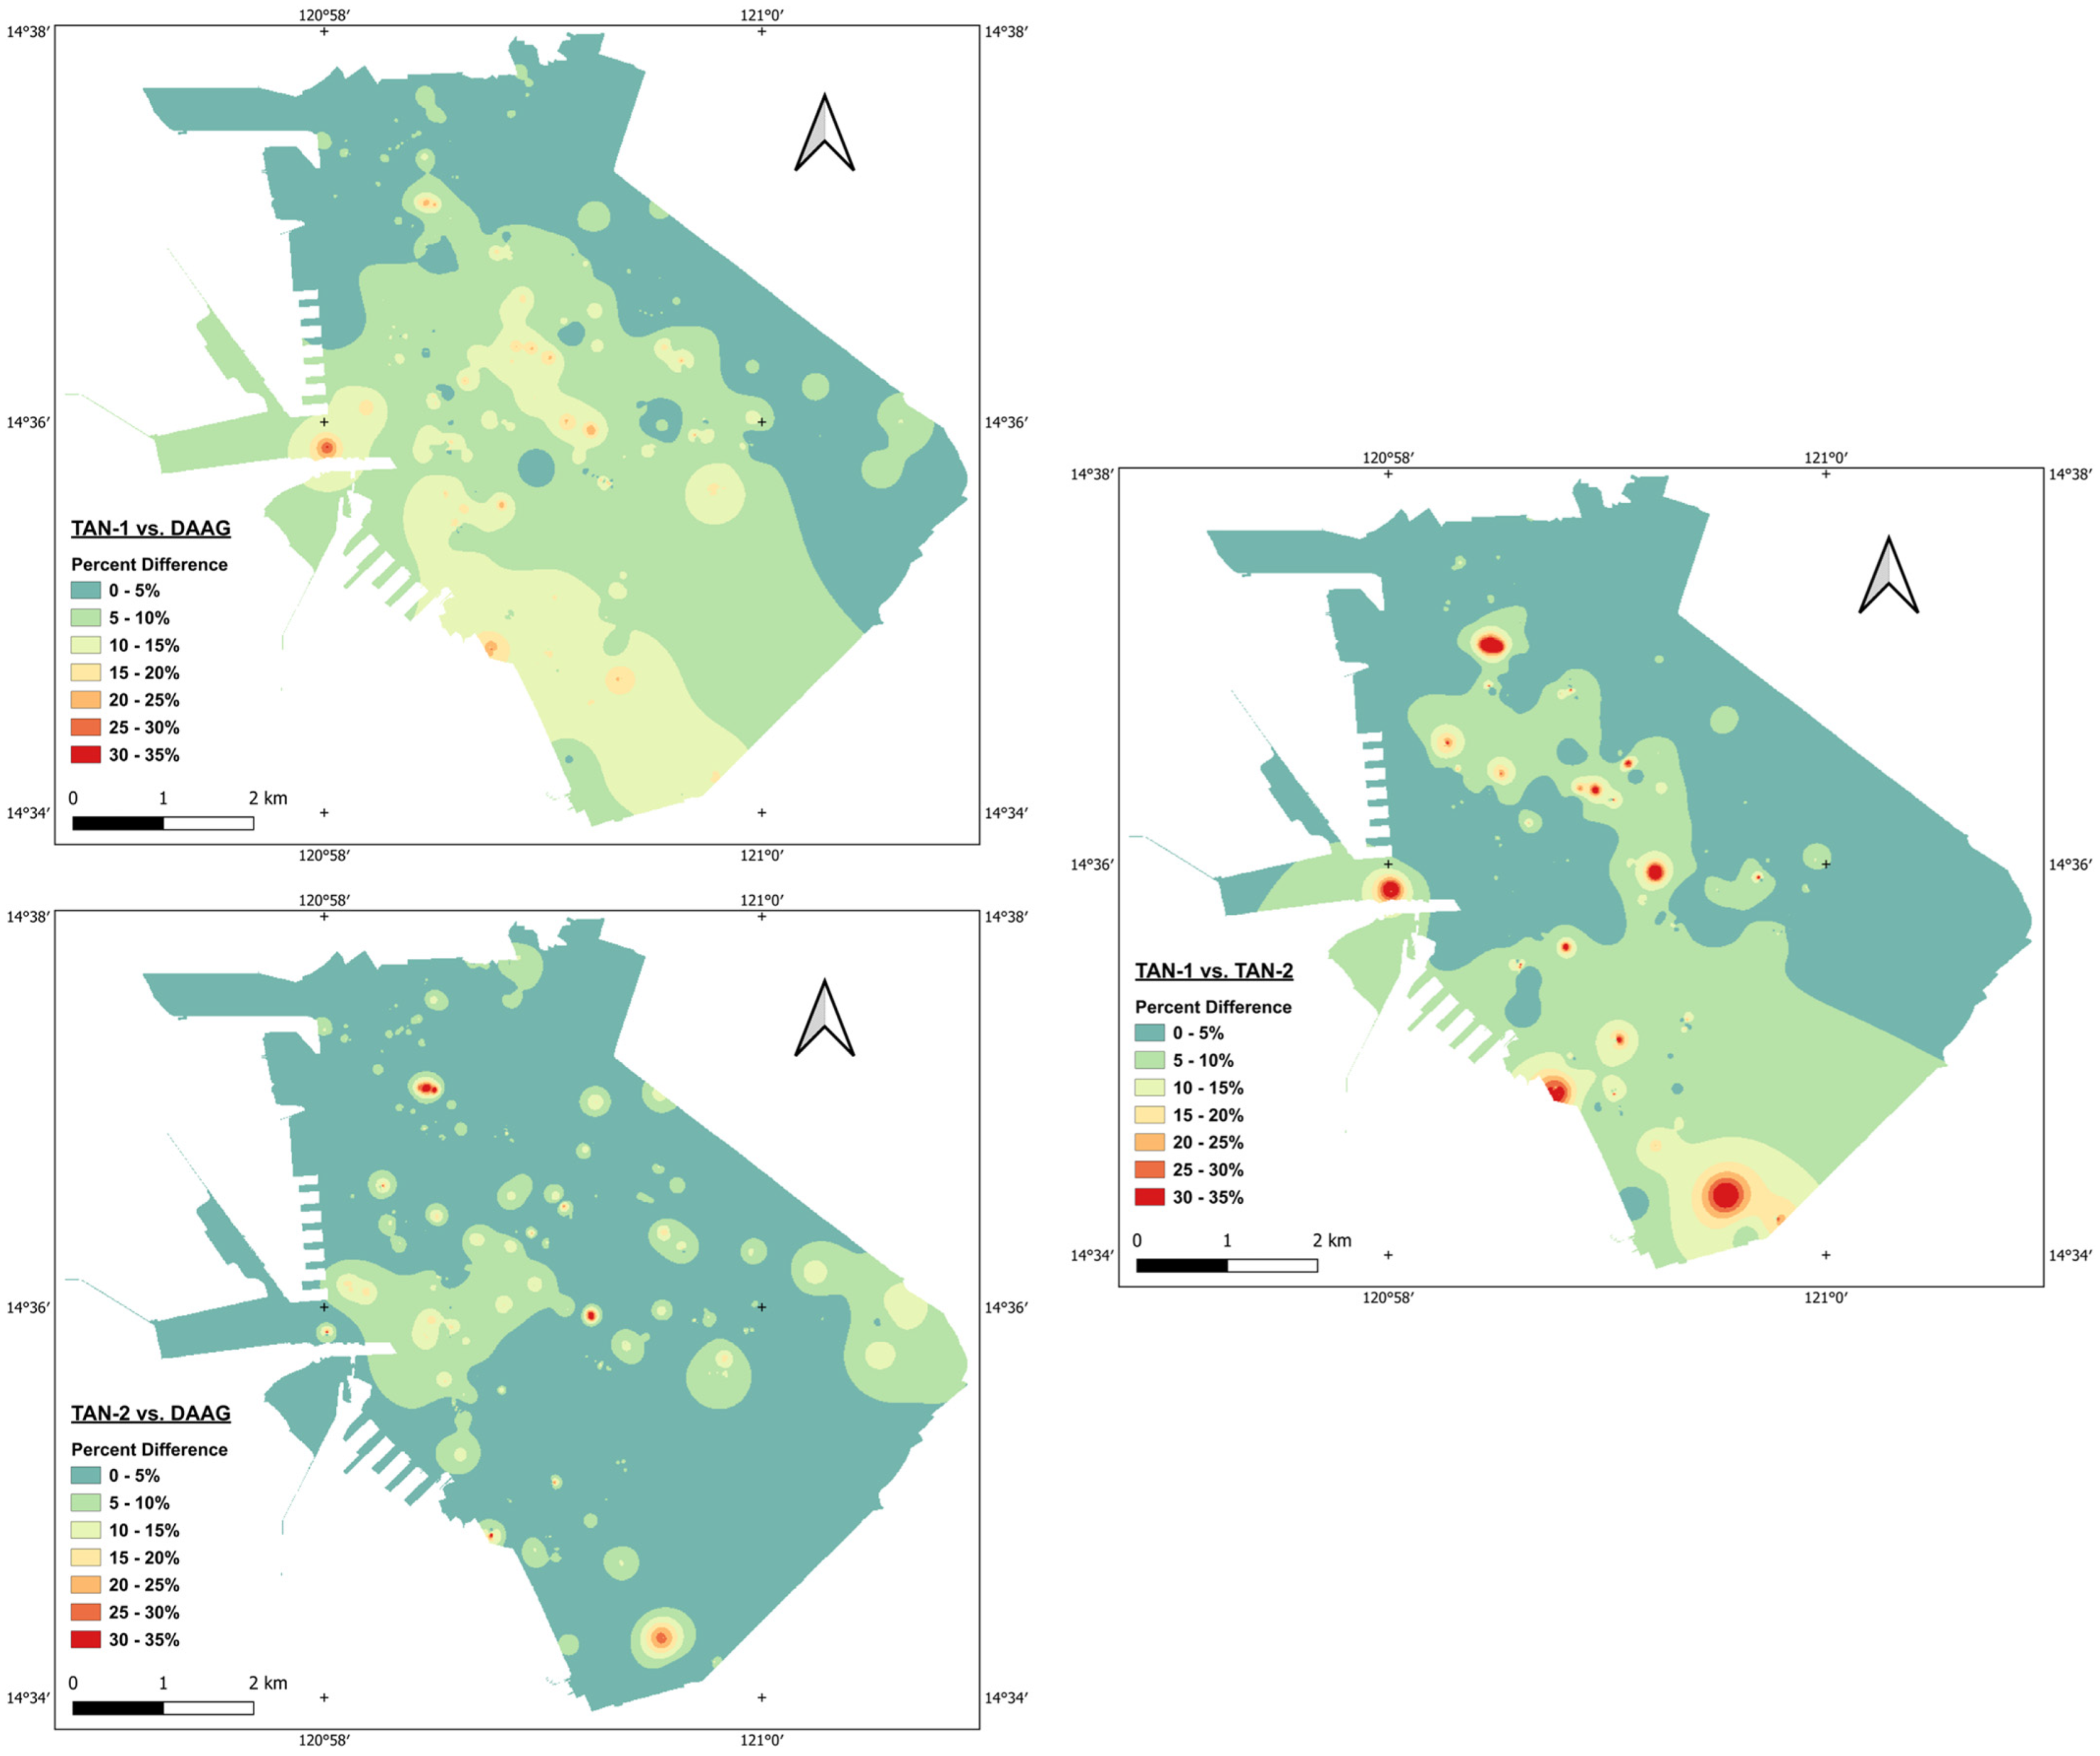
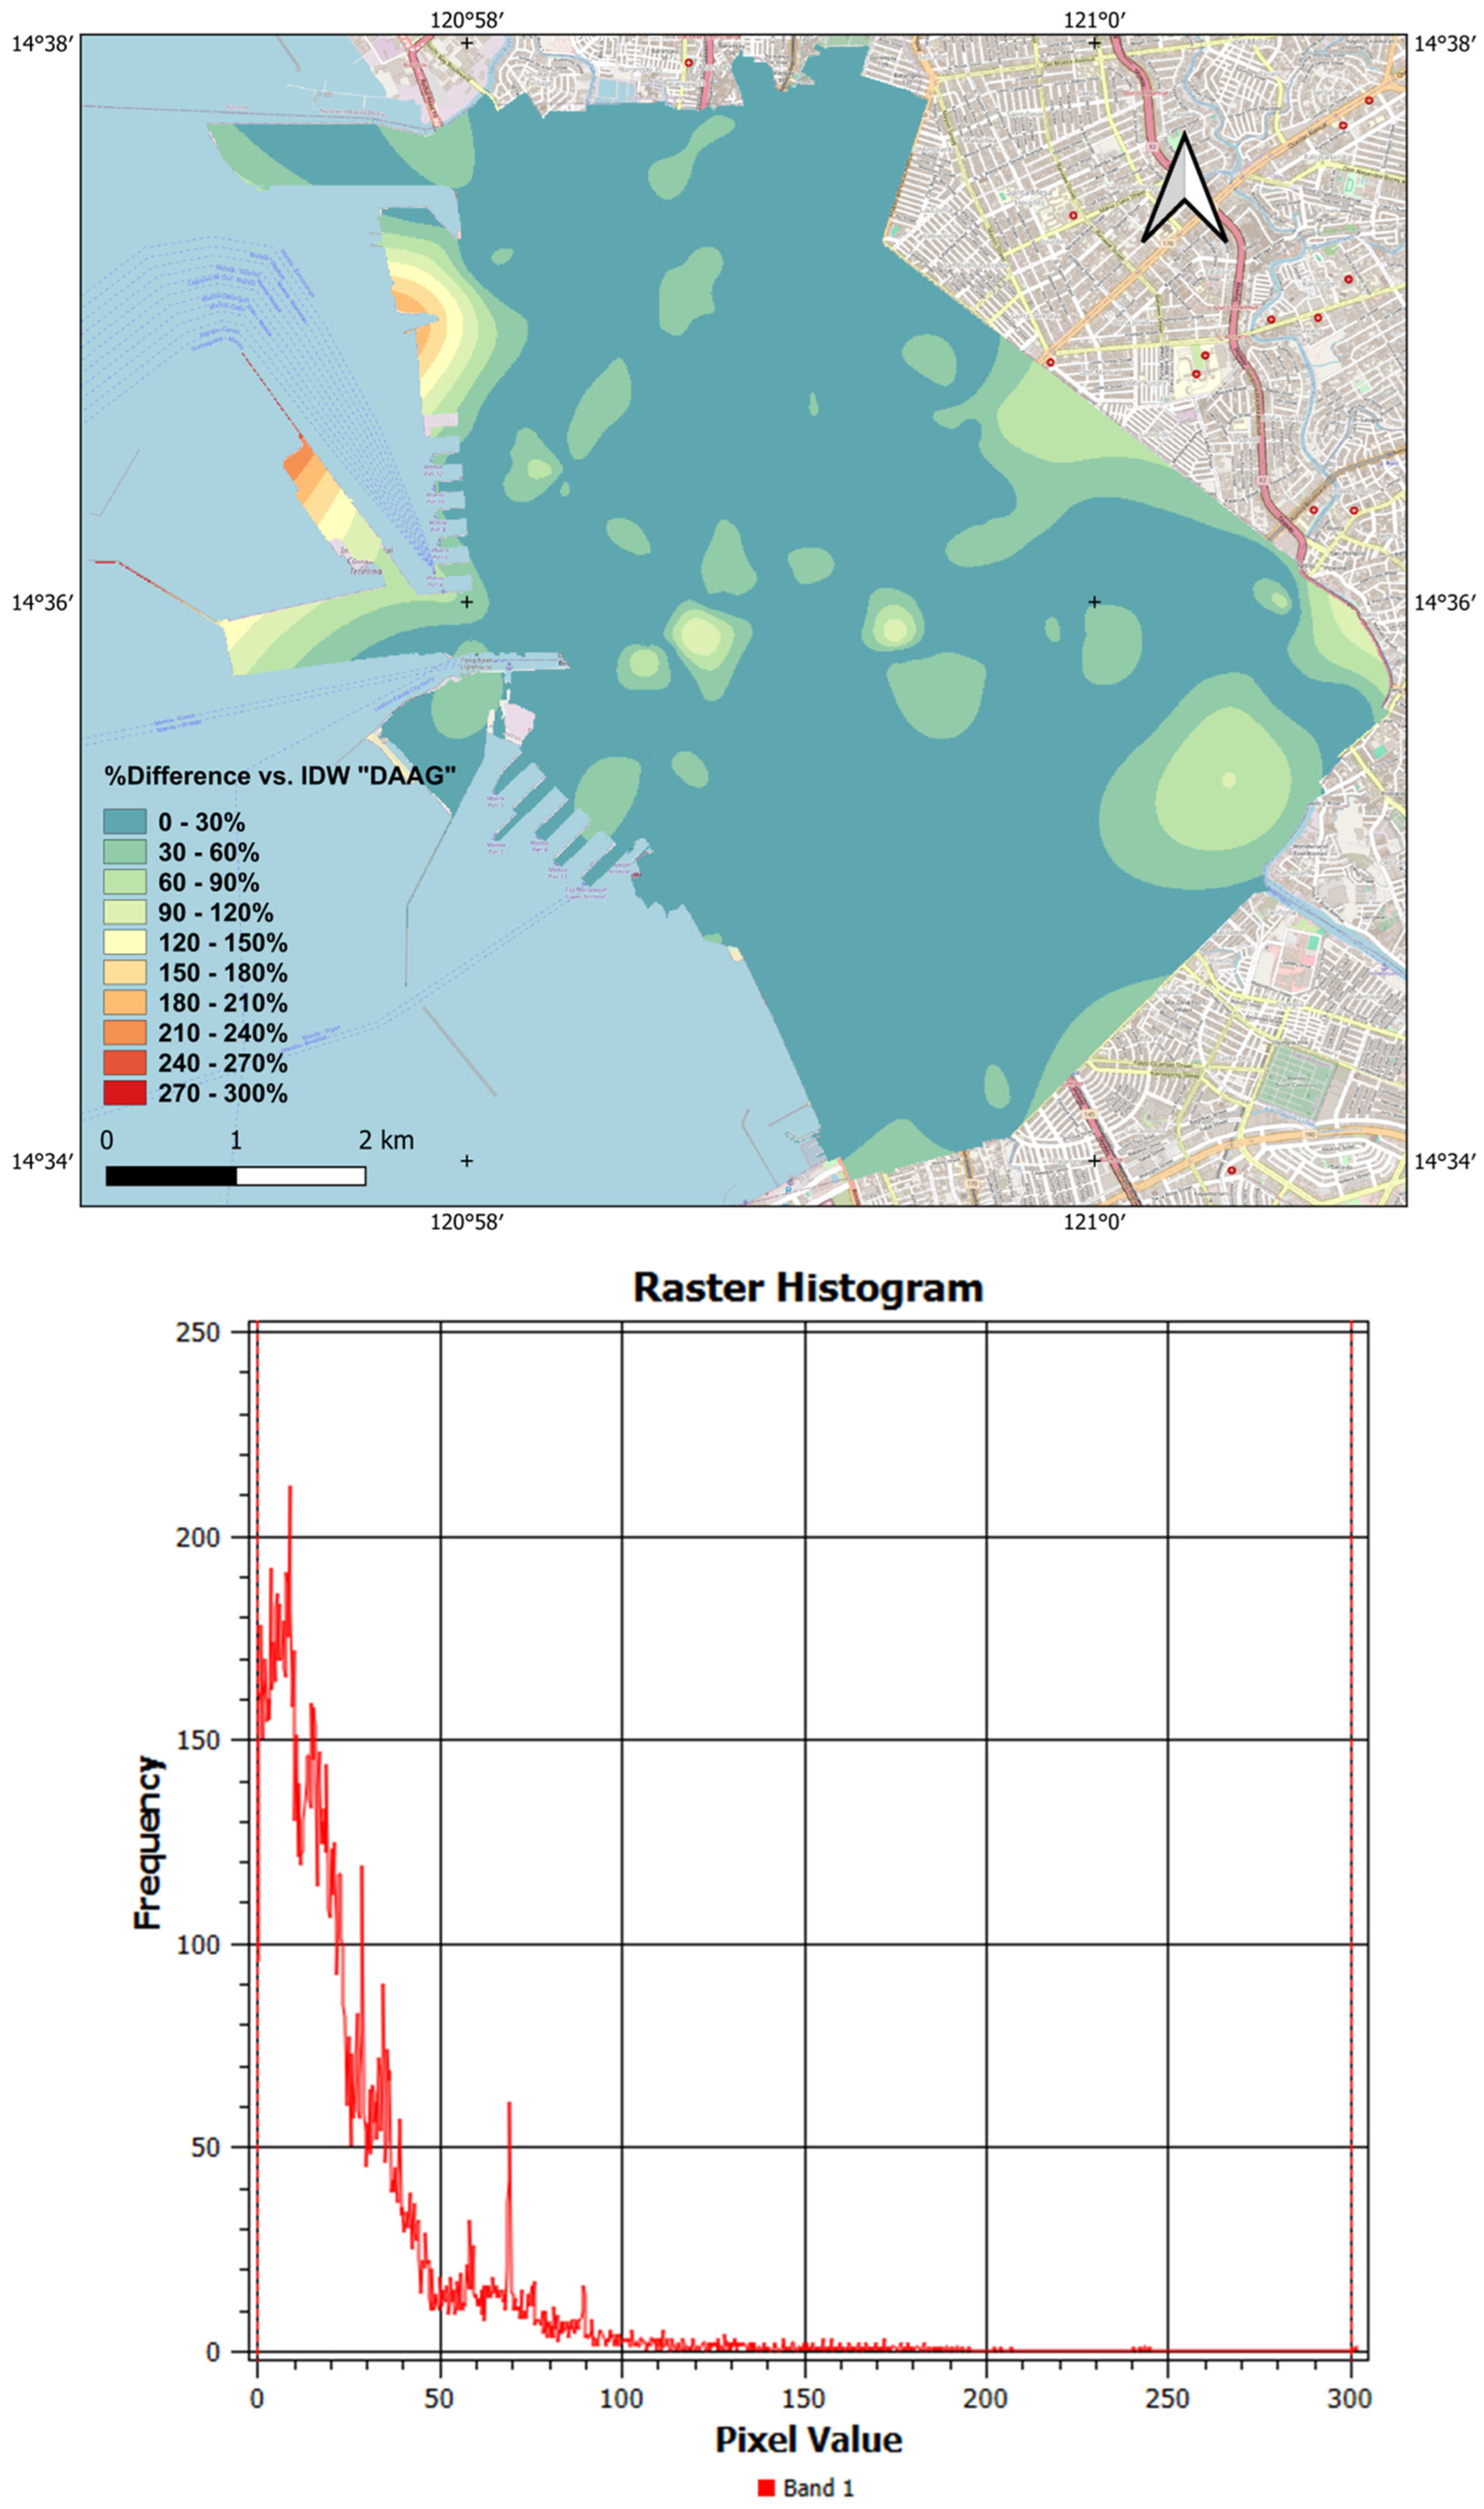
Interpolated profiles from data points with empirically obtained Vs30 values in Figure 5 are displayed in Figure 11. Compared to Figure 10, the three generated profiles feature distinct peaks scattered with the city due to the concentration of adjacent borehole points in those coordinates. The absence of peaks in the southern part of the City of Manila can be attributed to the lack of data points from the districts of Pandacan, San Andres, and Santa Ana. Apart from this expected outcome from IDW interpolations, the three maps can be observed to have a similar range of values. This was initially exhibited by the peak value indicated at the maximum end of the color band legend, with Vs30 values of 541.675 m/s, 526.475 m/s, and 584.42 m/s for equations TAN-1, TAN-2, and DAAG, respectively. Peak values were mainly situated along the city’s eastern part, which coincides with portions of the Central Plateau. The histograms shown in Figure 12 indicate that most of the city falls within a predicted Vs30 range of 200 m/s to 300 m/s, corresponding to soil type D in the NSCP classification. This is consistent with the geology of the City of Manila, which coincides with the alluvial layers of the Coastal Lowlands. The two new equations in this study (TAN-1 and TAN-2) were compared with DAAG as the reference raster layer since it is the only equation among the three interpolated options determined directly from instrumental readings across Metro Manila. The percentage difference values exhibited in Figure 13 generally suggest a reasonable degree of similarity among the results of the IDW interpolation profiles.
Most portions of the City of Manila had percentages ranging from 0 to 10% difference only, as proven by the corresponding raster layer histograms in Figure 14. This indicates that predictions made by another equation may only be within one standard deviation of the estimated value of a given empirical correlation. A few peaks in percentage difference were observed in the first two plots, which were both made relative to the DAAG equation, with TAN-2 vs. DAAG displaying a smaller difference versus TAN-1 vs. DAAG. Higher peaks were seen in TAN-1 vs. TAN-2, but the differences in the resulting histograms with TAN-2 vs. DAAG were minimal. However, sole reliance on visual observation of contour maps and histograms remains a subjective and unreliable assessment approach. The normalized root mean square error offers an objective method for comparing the accuracy of each model by considering the difference in their respective range of values. Using the toolbox modules in QGIS, the NMRSE values were determined for each empirical model, as shown in Table 7. The calculation also indicates the high similarity in the accuracy of each model and the proximity of the actual and interpolated values in the geospatial model. The 5% error also appears to mimic the percentage differences obtained for a significant portion of the City of Manila for each model.
The data points from the first equation (TAN-1) were also interpolated using the thin-spline method to determine the possibility of recurrence of the extreme values predicted near portions with sparse data points. The resulting profiles in Figure 14 display extreme values in the westernmost tip facing Manila Bay and the southeast portion of Manila. The percentage difference values in Figure 15 with the generated IDW profile using DAAG are significantly higher than those in Figure 13. The raster layer histogram in Figure 16 also indicates that the percentages mostly range from 0 to 20%. These histograms illustrate the number of pixels which fall within a specified range of percent difference. Lastly, there are sections of the city classified as soil type B despite Figure 2 only showing types C, D, and E. Portions near neighboring cities Navotas and Malabon and a few areas adjacent to the Pasig River also appeared to have been classified as type C, contradicting the alluvial characteristic in those localities. These points confirm that the thin-spline interpolation may not be the best deterministic interpolation technique for the available dataset despite the smoothness of its continuous raster layers. Additional data are suggested to reduce the distance between sparse data points.
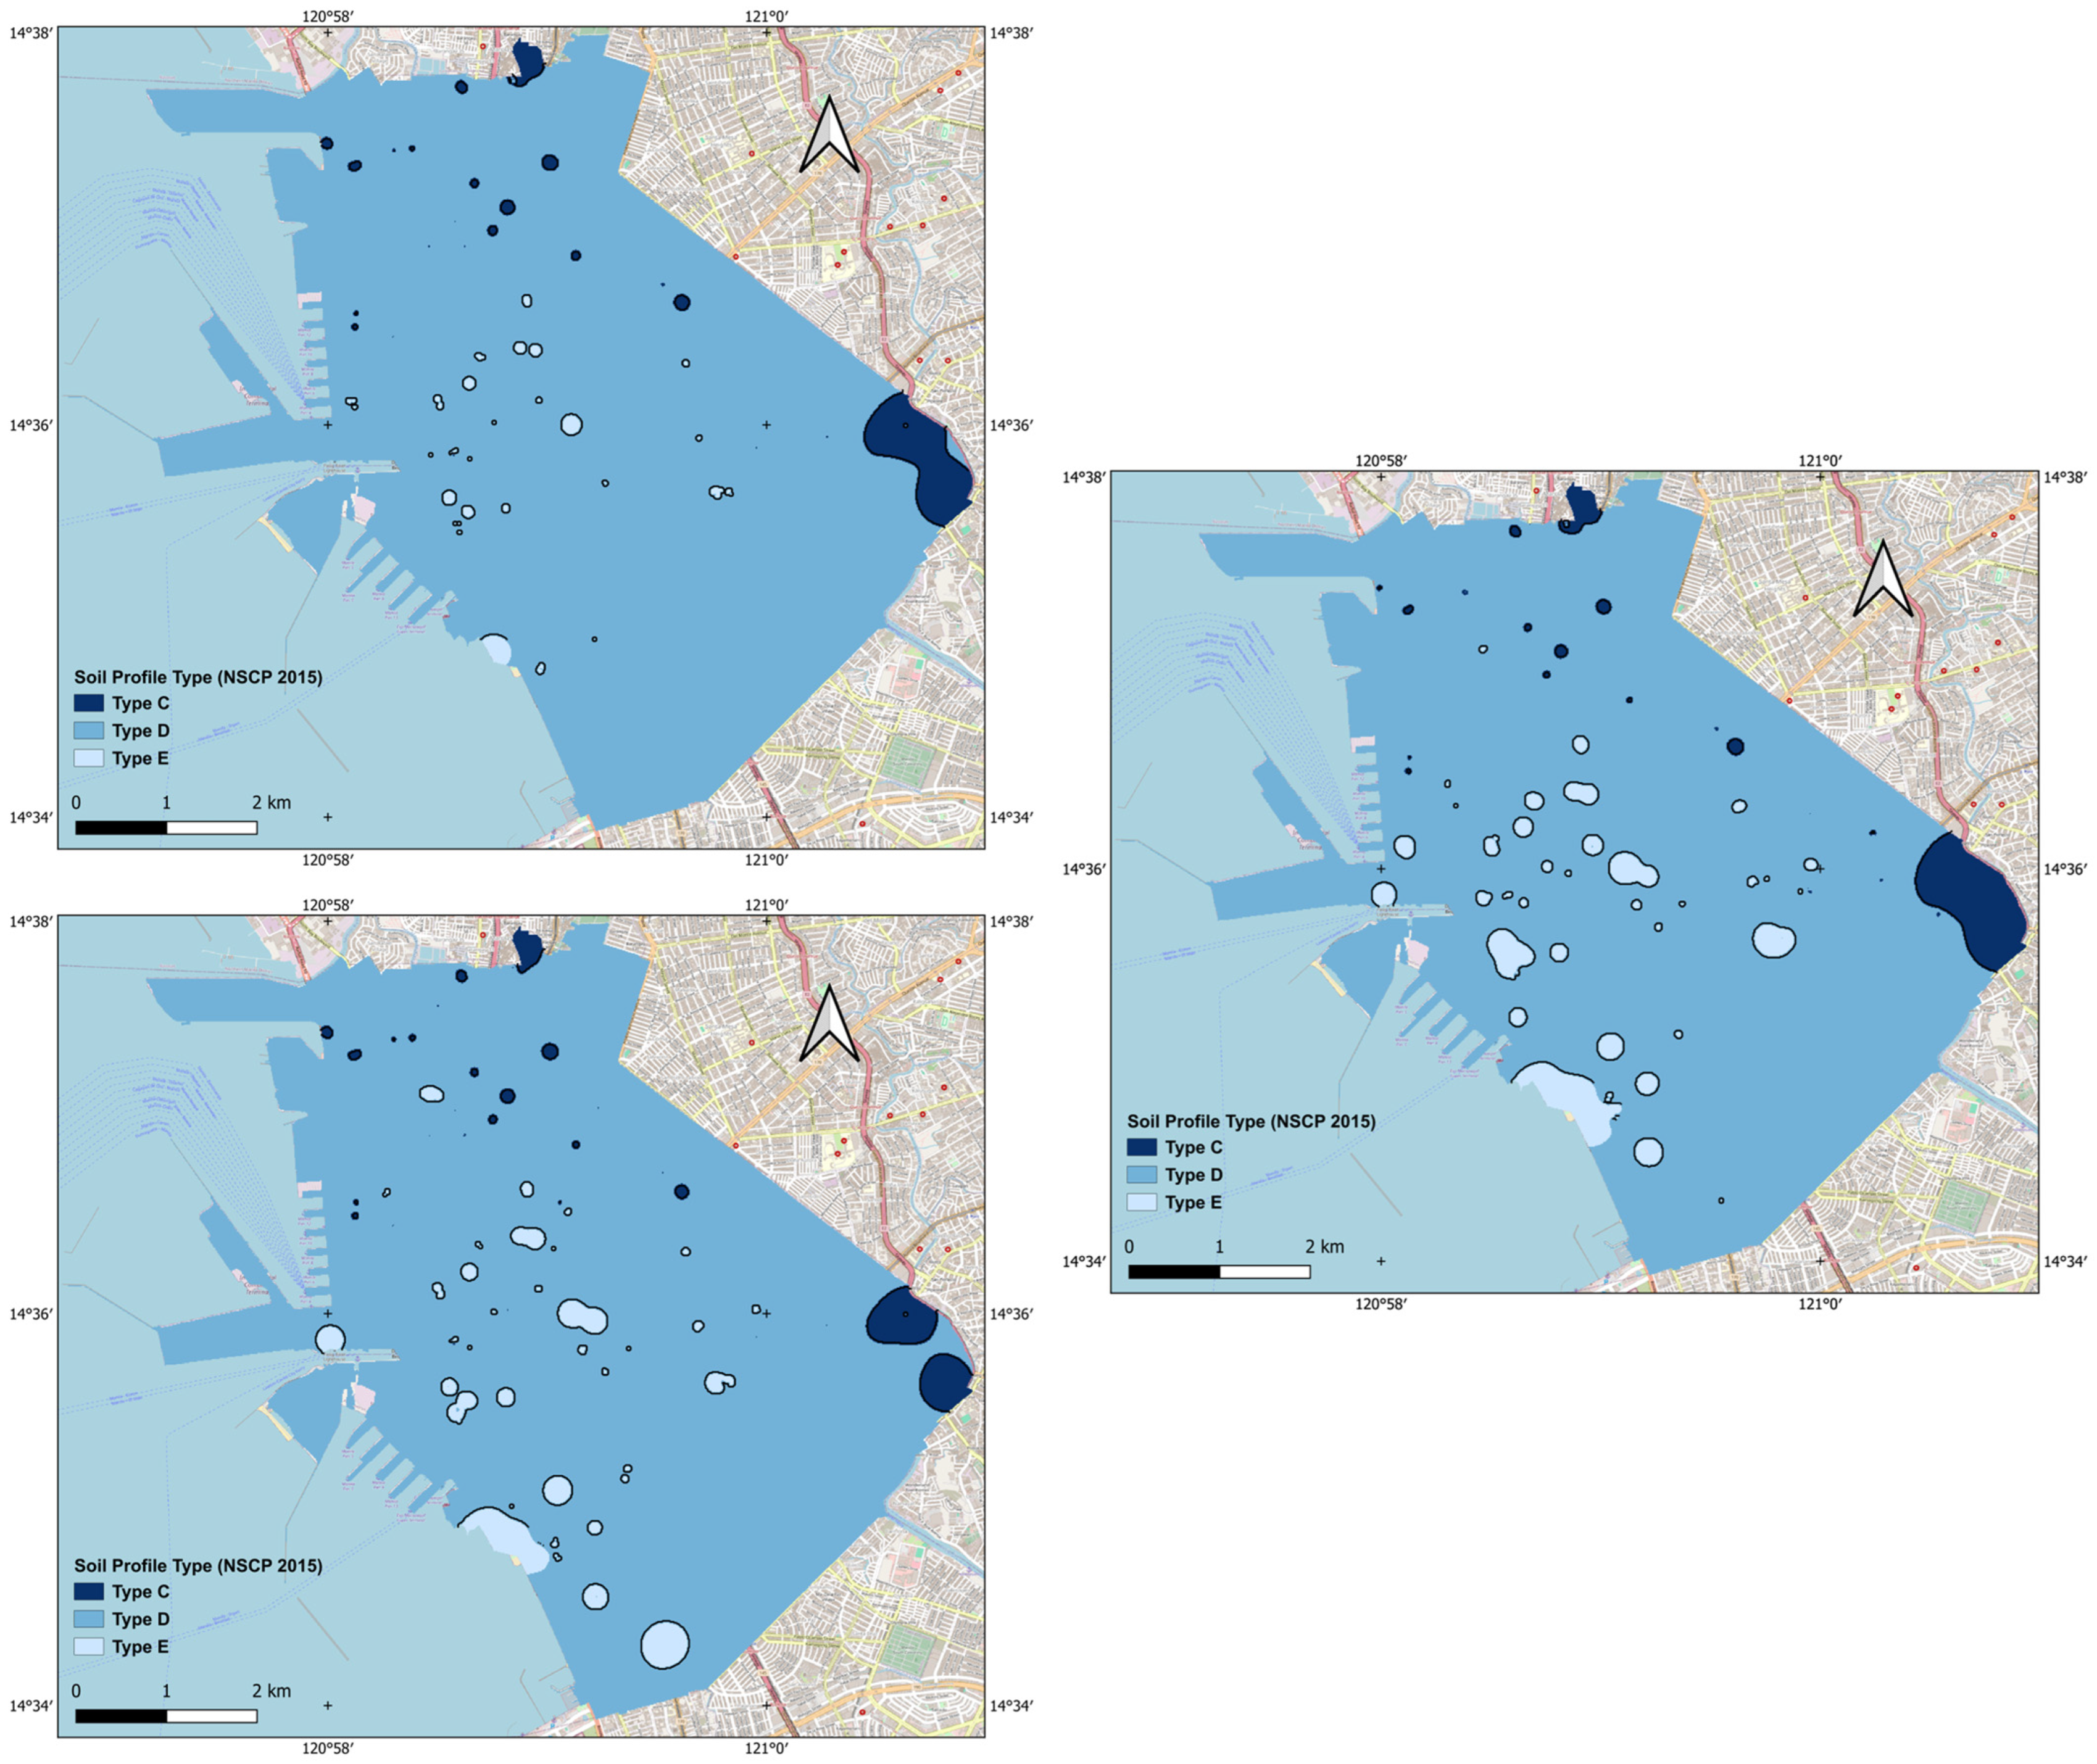
The final maps generated from the average shear wave velocity–SPT N-value correlation focus on the soil profile type per location. Figure 2 showed that most portions of the City of Manila will fall under type SD, which ranges from 180 m/s to 360 m/s based on the provisions in Table 6. Figure 17 illustrated that most of the city also fell under type SD, but it also highlighted smaller patches across the city to represent more detailed approximations of soil strata.
The smaller spots within the city are classified under type SE, which ranges in Vs from 0 to 180 m/s. These areas were not distinctly shown in the Metro Manila section of the Philippine Earthquake Model in Figure 2. Based on the location of these spots, it can be inferred that their proximity to adjacent bodies of water, such as Pasig River and Manila Bay, contribute to the creation of softer soil strata prone to amplified ground motion. Some of these areas also appear to closely coincide with the location of the Ruby Tower, which collapsed in the 1968 Casiguran earthquake. The DAAG IDW model also predicted more type SE locations, possibly due to the concentration of the 20 test sites of Daag et al. [25] in type SD/SE areas in Metro Manila. On the other hand, the small portions at the northeast and southeast of the city were classified as type C, given that their N-value reflects their location in the Central Plateau. Overall, the extensive borehole data for the city provided clearer details on the soil profile of Manila based on predicted shear wave velocity values.

5. Conclusions and Recommendations

The tectonic setting of the Philippines induces a greater risk for damage and losses against earthquakes. Mitigating these risks necessitates a proper seismic risk assessment, but the effect of site amplification is often neglected in seismic hazard analysis. Site-specific models require amplification factors, which can be determined using parameters such as shear wave velocity (Vs). The impracticality of in-situ tests to obtain Vs necessitates using empirical equations to estimate the velocity from accessible geotechnical parameters such as SPT N-value.
To address the regionality of the past developed correlations, only equations originating from countries with similar tectonic and/or geological settings as the Philippines were considered. Two new equations (power and logarithmic) were determined by discarding outliers falling beyond one standard deviation of the mean Vs calculated from all selected empirical formulas. These new correlations were used to convert SPT N-value data from the City of Manila to corresponding average shear wave velocities in the upper 30 m depth (Vs30). Extrapolations were applied to average Vs values with termination depths less than 30 m. Spatially interpolated profiles were made using deterministic approaches such as IDW and thin-spline methods due to the complexity of other geostatistical approaches. Initial findings indicate that the IDW method provided better results considering the geographic limitations of available Vs data points and the prevailing geology of the region. Thin-spline models were discarded due to their tendency to overestimate Vs along the periphery of a selected region when data points are relatively sparse.
The generated profiles were statistically analyzed using percentage differences via a raster calculator, raster layer histograms, and normalized root mean square errors, which indicated similar levels of accuracy across all models as deviations mostly fell within 0–10%, with an NRMSE of nearly 5% for all IDW models. The interpolated profiles were also reclassified to match the contour adopted by the Philippine Institute of Volcanology and Seismology (PHIVOLCS) from NSCP 2015 for the Philippine Earthquake Model. These new maps illustrated additional minute details to the soil profile of the City of Manila, previously wholly classified as type SD.
The spatially interpolated profile can be improved with more measured data points for shear wave velocity from government agencies and private entities. More realistic velocity profiles allow correlations with soil profiles generated based on SPT N-value by extracting points from their respective raster files. Statistical approaches in spatial interpolation, such as various forms of kriging (ordinary, simple, universal, regression), may be explored to objectively determine the most appropriate mathematical function to characterize the spatial variation of Vs30. Methods such as k-nearest neighbor may also be employed to assess the zonation of different soil types at every depth to allow soil classification-based correlation between Vs30 and SPT N-values, as shown in Table 3. The scope of the study can be expanded to the entire Metro Manila, given additional borehole data. Other literature suggests using different factors such as depth, overburden pressure, cone tip resistance, undrained shear strength, and geological age, which can be introduced in assessing the multicollinearity of regression equations. Improved spatial profiles for Vs30 can also be used to determine accurate amplification factors for seismic design and risk analysis. Although Vs30 is the recommended value used in site amplification models, a comparison can be performed with average shear wave velocities at other depths (5 m, 10 m, 15 m, 20 m) to assess whether these Vsz can closely approximate Vs30 to reduce excavation costs for deeper boreholes. A seismic microzonation model featuring geological, geomorphological, geotechnical, and microtremor layers can be weighted using multi-criteria decision analysis techniques to determine the amplification of ground motion predicted using next-generation attenuation models in probabilistic seismic hazard analysis [108].

Author Contributions

Conceptualization, J.T., J.D. and J.G.; methodology, J.T.; software, J.T.; validation; formal analysis, J.T.; investigation, J.T.; resources, J.D. and J.T.; data curation, J.T.; writing—original draft preparation, J.T.; writing—review and editing, J.G. and J.D.; visualization, J.T.; supervision, J.G. and J.D. All authors have read and agreed to the published version of the manuscript.

Funding

This research received no external funding.

Institutional Review Board Statement

Not applicable.

Informed Consent Statement

Not applicable.

Data Availability Statement

Not applicable.

Acknowledgments

Thank you to Raymond Abad from De La Salle University for guidance on the use of QGIS and Rhommel Grutas for providing access to shear wave velocity data in Metro Manila.

Conflicts of Interest

The authors declare no conflicts of interest.

Abbreviations

The following abbreviations are used in this manuscript:
NSCPNational Structural Code of the Philippines
ASCEAmerican Society of Civil Engineers
SEIStructural Engineering Institute
ENEuropean Norm (Eurocode)
NEHRPNational Earthquake Hazard Reduction Program
SPTstandard penetration test
GISgeographic information system
OCRover-consolidation ratio
ReMirefraction microtremor
MASWmultichannel analysis of surface waves
SASWspectral analysis of surface waves
ESACextended spatial autocorrelation
HVSRhorizontal to vertical spectral ratio
CPTcone penetration test
DPWHDepartment of Public Works and Highways
IDWinverse distance weighted
SAGASystem for Automated Geoscientific Analyses
QGISquantum geographic information system
NMRSEnormalized root mean square error
ASTMAmerican Society for Testing and Materials
WGSWorld Geodetic System
PHIVOLCSPhilippine Institute of Volcanology and Seismology

References

  1. Rimando, R.E.; Knuepfer, P.L.K. Neotectonics of the Marikina Valley Fault System (MVFS) and Tectonic Framework of Structures in Northern and Central Luzon, Philippines. Tectonophysics 2006, 415, 17–38. [Google Scholar] [CrossRef]
  2. Monjardin, C.E.; Medina, A.B. Comparative Analysis of Geotechnical and Geophysical Investigations for Average Shear Wave Velocity in Metro Manila. Energy Rep. 2023, 9, 38–47. [Google Scholar] [CrossRef]
  3. Brecht, H.; Deichmann, U.; Wang, H.G. A Global Urban Risk Index; World Bank: Washington, DC, USA, 2013. [Google Scholar]
  4. Grutas, R.; Yamanaka, H. Shallow Shear-Wave Velocity Profiles and Site Response Characteristics from Microtremor Array Measurements in Metro Manila, the Philippines. Explor. Geophys. 2012, 43, 255–266. [Google Scholar] [CrossRef]
  5. Chatterjee, K.; Choudhury, D. Variations in Shear Wave Velocity and Soil Site Class in Kolkata City Using Regression and Sensitivity Analysis. Nat. Hazards 2013, 69, 2057–2082. [Google Scholar] [CrossRef]
  6. Gioncu, V.; Mazzolani, F.M. Earthquake Engineering for Structural Design; Spon Press/Taylor & Francis: London, UK, 2011; ISBN 978-0-203-84889-0. [Google Scholar]
  7. Abbas, H.A.; Al-Jeznawi, D.; Al-Janabi, M.A.Q.; Bernardo, L.F.A.; Jacinto, M.A.S.C. Exploring Shear Wave Velocity—NSPT Correlations for Geotechnical Site Characterization: A Review. CivilEng 2024, 5, 119–135. [Google Scholar] [CrossRef]
  8. Tunusluoglu, M.C. Determination of Empirical Correlations between Shear Wave Velocity and Penetration Resistance in the Canakkale Residential Area (Turkey). Appl. Sci. 2023, 13, 9913. [Google Scholar] [CrossRef]
  9. Omote, S.; Osawa, Y.; Skinner, I.; Yoshima, Y. Luzon Earthquake of 2 August 1968; Series No. 977; UNESCO: Paris, France, 1969. [Google Scholar]
  10. Tan, C.G.; Majid, T.A.; Ariffin, K.S.; Bunnori, N.M. Seismic Microzonation for Penang Using Geospatial Contour Mapping. Nat. Hazards 2014, 73, 657–670. [Google Scholar] [CrossRef]
  11. Taguibao, K.J.L.; Takahashi, R. Whole-Rock Geochemistry of Host Rocks and K/Ar Age of Hydrothermal Mineral of the Co-O Epithermal Gold Deposit, Mindanao, Philippines. Open J. Geol. 2018, 8, 383–398. [Google Scholar] [CrossRef]
  12. Dungca, J. A Reference for the Allowable Soil Bearing Capacities in Quezon City, Philippines. Int. J. GEOMATE 2020, 19, 42–47. [Google Scholar] [CrossRef]
  13. Dungca, J.; Concepcion, I.; Limyuen, M.C.M.; See, T.O.; Vicencio, M.R. Soil Bearing Capacity Reference for Metro Manila, Philippines. Int. J. GEOMATE 2017, 12, 5–11. [Google Scholar] [CrossRef]
  14. Galupino, J.; Dungca, J. Estimating Liquefaction Susceptibility Using Machine Learning Algorithms with a Case of Metro Manila, Philippines. Appl. Sci. 2023, 13, 6549. [Google Scholar] [CrossRef]
  15. Oliquino, C.J.; Dungca, J. Probabilistic Liquefaction Potential Analysis of San Fernando Pampanga, Philippines Using Semi-Markov Chain. Int. J. GEOMATE 2021, 21, 137–144. [Google Scholar] [CrossRef]
  16. Dungca, J.; Montejo, M.F.G. Metropolitan Manila Seismic Hazard Map Using Midorikawa & Hori Site Amplification Model. GEOMATE J. 2022, 22, 67–74. [Google Scholar] [CrossRef]
  17. Wald, D.J.; Allen, T.I. Topographic Slope as a Proxy for Seismic Site Conditions and Amplification. Bull. Seismol. Soc. Am. 2007, 97, 1379–1395. [Google Scholar] [CrossRef]
  18. Macaraeg, C.J.; Dungca, J.R. Development of a Reference for Seismic Amplification: The Case of Metro Manila. In Proceedings of the 19th Congress of International Association for Bridge and Structural Engineering, Stockholm, Sweden, 21–23 September 2016; pp. 1015–1022. [Google Scholar]
  19. ASCE. Minimum Design Loads and Associated Criteria for Buildings and Other Structures (ASCE/SEI 7-22); ASCE: Reston, VA, USA, 2021. [Google Scholar] [CrossRef]
  20. EN 1998-1:2004; Eurocode 8: Design of Structures for Earthquake Resistance. CEN The European Committee for Standardization: Brussels, Belgium, 2004.
  21. Bandyopadhyay, S.; Sengupta, A.; Reddy, G.R. Development of Correlation between SPT-N Value and Shear Wave Velocity and Estimation of Non-Linear Seismic Site Effects for Soft Deposits in Kolkata City. Geomech. Geoengin. 2021, 16, 1–19. [Google Scholar] [CrossRef]
  22. Esfehanizadeh, M.; Nabizadeh, F.; Yazarloo, R. Correlation between Standard Penetration (N SPT) and Shear Wave Velocity (V S) for Young Coastal Sands of the Caspian Sea. Arab. J. Geosci. 2015, 8, 7333–7341. [Google Scholar] [CrossRef]
  23. Bhattacharya, S.; Orense, R.; Lombardi, D. Seismic Design of Foundations: Concepts and Applications; ICE Publishing: London, UK, 2019; ISBN 978-0-7277-6166-8. [Google Scholar]
  24. Sen, T.K. Fundamentals of Seismic Loading on Structures; Wiley: Chichester, UK, 2009; ISBN 978-0-470-01755-5. [Google Scholar]
  25. Daag, A.S.; Halasan, O.P.C.; Magnaye, A.A.T.; Grutas, R.N.; Solidum, R.U. Empirical Correlation between Standard Penetration Resistance (SPT-N) and Shear Wave Velocity (Vs) for Soils in Metro Manila, Philippines. Appl. Sci. 2022, 12, 8067. [Google Scholar] [CrossRef]
  26. Ansary, M.; Ansary, M. Use of SPT and Depth for Estimating Shear-Wave Velocity Using Optimised Machine Learning Models. J. Civ. Eng. 2023, 51, 99–119. [Google Scholar]
  27. Anderson, J.; Lee, Y.; Zeng, Y.; Day, S. Control of Strong Motion by the Upper 30 Meters. Bull. Seismol. Soc. Am. 1996, 86, 1749–1759. [Google Scholar] [CrossRef]
  28. Kuo, C.-H.; Wen, K.-L.; Hsieh, H.-H.; Chang, T.-M.; Lin, C.-M.; Chen, C.-T. Evaluating Empirical Regression Equations for Vs and Estimating Vs30 in Northeastern Taiwan. Soil Dyn. Earthq. Eng. 2011, 31, 431–439. [Google Scholar] [CrossRef]
  29. Gallipoli, M.R.; Mucciarelli, M. Comparison of Site Classification from VS30, VS10, and HVSR in Italy. Bull. Seismol. Soc. Am. 2009, 99, 340–351. [Google Scholar] [CrossRef]
  30. Crespo, M.; Benjumea, B.; Moratalla, J.M.; Lacoma, L.; Macau, A.; González, Á.; Gutiérrez, F.; Stafford, P. A Proxy-Based Model for Estimating VS30 in the Iberian Peninsula. Soil Dyn. Earthq. Eng. 2022, 155, 107165. [Google Scholar] [CrossRef]
  31. Kumar, A.; Satyannarayana, R.; Rajesh, B.G. Correlation between SPT-N and Shear Wave Velocity (V) and Seismic Site Classification for Amaravati City, India. J. Appl. Geophys. 2022, 205, 104757. [Google Scholar] [CrossRef]
  32. Motalleb Nejad, M.; Momeni, M.S.; Manahiloh, K.N. Shear Wave Velocity and Soil Type Microzonation Using Neural Networks and Geographic Information System. Soil Dyn. Earthq. Eng. 2018, 104, 54–63. [Google Scholar] [CrossRef]
  33. Dehghanian, K.; Çaltili, E.; Koçak Dinç, B.; Soysal, H.M. Implementation of Shear Wave Velocity and Standard Penetration Test Correlation for Edirne District, Turkey. J. Sustain. Constr. Mater. Technol. 2022, 7, 24–29. [Google Scholar] [CrossRef]
  34. Eslami, A.; Moshfeghi, S.; MolaAbasi, H.; Eslami, M.M. 4—Geotechnical Parameters from CPT Records. In Piezocone and Cone Penetration Test (CPTu and CPT) Applications in Foundation Engineering; Eslami, A., Moshfeghi, S., MolaAbasi, H., Eslami, M.M., Eds.; Butterworth-Heinemann: Oxford, UK, 2020; pp. 81–110. ISBN 978-0-08-102766-0. [Google Scholar]
  35. Shooshpasha, I.; Molaabasi, H.; Jamalian, A.; Dikmen, Ü.; Salahi, M. Validation and Application of Empirical Shear Wave Velocity Models Based on Standard Penetration Test. Comput. Methods Civ. Eng. 2013, 4, 25–41. [Google Scholar]
  36. Heo, G.; Kim, J.; Jeong, S.; Kwak, D. Evaluation of Shear Wave Velocity Prediction Models from Standard Penetration Test N Values Depending on Geologic Attributes: A Case Study in Busan, South Korea. Geotechnics 2023, 3, 1004–1016. [Google Scholar] [CrossRef]
  37. Darvasi, Y. Shear-Wave Velocity Measurements and Their Uncertainties at Six Industrial Sites. Earthq. Spectra 2021, 37, 2223–2246. [Google Scholar] [CrossRef]
  38. Shiuly, A.; Roy, N. A Generalized VS–N Correlation Using Various Regression Analysis and Genetic Algorithm. Acta Geod. Geophys. 2018, 53, 479–502. [Google Scholar] [CrossRef]
  39. Guzel, Y. Correlating Measured SPT-N, Shear Wave Velocity and Liquid Limit Values in Melekli Region, Igdır (Türkiye). Çanakkale Onsekiz Mart Univ. J. Adv. Res. Nat. Appl. Sci. 2024, 2024, 161–174. [Google Scholar] [CrossRef]
  40. Ataee, O.; Moghaddas, N.H.; Lashkaripour, G.R. Estimating Shear Wave Velocity of Soil Using Standard Penetration Test (SPT) Blow Counts in Mashhad City. J. Earth Syst. Sci. 2019, 128, 66. [Google Scholar] [CrossRef]
  41. Ghazi, A.; Moghadas, N.H.; Sadeghi, H.; Ghafoori, M.; Lashkaripur, G.R. Empirical Relationships of Shear Wave Velocity, SPT_N Value and Vertical Effective Stress for Different Soils in Mashhad, Iran. Ann. Geophys. 2015, 58, S0325. [Google Scholar] [CrossRef]
  42. Hasancebi, N.; Ulusay, R. Empirical Correlations between Shear Wave Velocity and Penetration Resistance for Ground Shaking Assessments. Bull. Eng. Geol. Environ. 2007, 66, 203–213. [Google Scholar] [CrossRef]
  43. Adeel, M.B.; Nizamani, Z.A.; Aaqib, M.; Khan, S.; Rehman, J.U.; Bhusal, B.; Park, D. Estimation of VS30 Using Shallow Depth Time-Averaged Shear Wave Velocity of Rawalpindi–Islamabad, Pakistan. Geomat. Nat. Hazards Risk 2023, 14, 1–21. [Google Scholar] [CrossRef]
  44. Marto, A.; Soon, T.C.; Kasim, F.; Suhatril, M. A Correlation of Shear Wave Velocity and Standard Penetration Resistance. Electron. J. Geotech. Eng. 2013, 18, 463–471. [Google Scholar]
  45. Darzi, A.; Halldorsson, B.; Cotton, F.; Rahpeyma, S. Nationwide Frequency-Dependent Seismic Site Amplification Models for Iceland. Soil Dyn. Earthq. Eng. 2024, 183, 108798. [Google Scholar] [CrossRef]
  46. Kirar, B.; Maheshwari, B.K.; Muley, P. Correlation Between Shear Wave Velocity (Vs) and SPT Resistance (N) for Roorkee Region. Int. J. Geosynth. Ground Eng. 2016, 2, 9. [Google Scholar] [CrossRef]
  47. Tsai, C.-C.; Kishida, T.; Kuo, C.-H. Unified Correlation between SPT–N and Shear Wave Velocity for a Wide Range of Soil Types Considering Strain-Dependent Behavior. Soil Dyn. Earthq. Eng. 2019, 126, 105783. [Google Scholar] [CrossRef]
  48. Hussien, M.N.; Karray, M. Shear Wave Velocity as a Geotechnical Parameter: An Overview. Can. Geotech. J. 2016, 53, 252–272. [Google Scholar] [CrossRef]
  49. Wu, W.; Liu, J.; Guo, L.; Deng, Z. Methodology and Assessment of Proxy-Based Vs30 Estimation in Sichuan Province, China. Int. J. Disaster Risk Sci. 2020, 11, 133–144. [Google Scholar] [CrossRef]
  50. Chatrayi, H.; Hajizadeh, F.; Taghavi, B. Shear Wave Velocity (Vs) and SPT Resistance (N) Correlation for the Isfahan Metro, Iran. Acta Geophys. 2023, 72, 1749–1764. [Google Scholar] [CrossRef]
  51. Alhuay-León, C.G.; Trejo-Noreña, P.C. The Empirical Correlation between Shear Wave Velocity and Penetration Resistance for the Eolian Sand Deposits in the City of Olmos-Peru. DYNA 2021, 88, 247–255. [Google Scholar] [CrossRef]
  52. Anbazhagan, P.; Parihar, A.; Rashmi, H.N. Review of Correlations between SPT N and Shear Modulus: A New Correlation Applicable to Any Region. Soil Dyn. Earthq. Eng. 2012, 36, 52–69. [Google Scholar] [CrossRef]
  53. Ashikuzzaman, M.; Hossain, A.; Shakil Ar Salan, M.; Ashikur Rahman, M.; Mahmudul Hasan, M. Development of Empirical Correlations Between Shear Wave Velocity and Standard Penetration Value: A Case Study of Rajshahi District, Bangladesh. Am. J. Mech. Ind. Eng. 2021, 6, 1–6. [Google Scholar] [CrossRef]
  54. Fauzi, A.; Irsyam, M.; Fauzi, U.J. Empirical Correlation of Shear Wave Velocity and N-Spt Value For Jakarta. GEOMATE J. 2014, 7, 980–984. [Google Scholar] [CrossRef]
  55. Uma Maheswari, R.; Boominathan, A.; Dodagoudar, G.R. Use of Surface Waves in Statistical Correlations of Shear Wave Velocity and Penetration Resistance of Chennai Soils. Geotech. Geol. Eng. 2010, 28, 119–137. [Google Scholar] [CrossRef]
  56. Kanai, K. Conference on Cone Penetrometer; The Ministry of Public Works and Settlement: Ankara, Turkey, 1966. [Google Scholar]
  57. Imai, T.; Yoshimura, Y. Elastic Wave Velocity and Soil Properties in Soft Soil (in Japanese). Tsuchito-kiso 1970, 18, 17–22. [Google Scholar]
  58. Ohba, S.; Toriumi, I. Dynamic Response Characteristics of Osaka Plain. In Proceedings of the Annual Meeting AIJ; AIJ: Tokyo, Japan, 1970; Volume 12. (In Japanese) [Google Scholar]
  59. Fujiwara, T. Estimation of Ground Movements in Actual Destructive Earthquakes. In Proceedings of the Fourth European Symposium on Earthquake Engineering, London, UK, 5–7 September 1972; pp. 125–132. [Google Scholar]
  60. Ohsaki, Y.; Iwasaki, R. On Dynamic Shear Moduli and Poisson’s Ratios of Soil Deposits. Soils Found. 1973, 13, 61–73. [Google Scholar] [CrossRef]
  61. Imai, T.; Yoshimura, Y. The Relation of Mechanical Properties of Soils to P and S-Wave Velocities for Ground in Japan; Technical note OYO Corporation: Tokyo, Japan, 1975. [Google Scholar]
  62. Imai, T.; Fumoto, H.; Yokota, K. The Relation of Mechanical Properties of Soil to P-and S-Wave Velocities in Japan. In Proceedings of the 4th Japan Earthquake Engineering Symposium, Tokyo, Japan, 26–28 November 1975; pp. 89–96. [Google Scholar]
  63. Imai, T. P and S Wave Velocities of the Ground in Japan. In Proceedings of the 9th International Conference on Soil Mechanics and Foundation Engineering, Tokyo, Japan, 10–15 July 1977; Volume 2, pp. 257–260. [Google Scholar]
  64. Ohta, Y.; Goto, N. Empirical Shear Wave Velocity Equations in Terms of Characteristic Soil Indexes. Earthq. Eng. Struct. Dyn. 1978, 6, 167–187. [Google Scholar] [CrossRef]
  65. Seed, H.B.; Idriss, I. Evaluation of Liquefaction Potential Sand Deposits Based on Observation of Performance in Previous Earthquakes. In Proceedings of the ASCE National Convention (MO), St. Louis, MO, USA, 26–30 October 1981; pp. 481–544. [Google Scholar]
  66. Yokota, K.; Imai, T.; Konno, M. Dynamic Deformation Characteristics of Soils Determined by Laboratory Tests. OYO Tec. Rep. 1981, 3, 13–37. [Google Scholar]
  67. Imai, T.; Tonouchi, K. Correlation of N Value with S-Wave Velocity and Shear Modulus. In Proceedings of the 2nd European Symposium on Penetration Testing, Amsterdam, The Netherlands, 24–27 May 1982; pp. 67–72. [Google Scholar]
  68. Tonouchi, K.; Sakayama, T.; Imai, T. S Wave Velocity in the Ground and the Damping Factor. In Proceedings of the Bulletin of the International Association of Engineering Geology; 1983; pp. 327–333. [Google Scholar]
  69. Lee, S. Analysis of the Multicollinearity of Regression Equations of Shear Wave Velocities. Soils Found. 1992, 32, 205–214. [Google Scholar] [CrossRef]
  70. Zheng, J. Correlation between Seismic Wave Velocity and the Number of Blow of SPT and Depth. Sel. Pap. Chin. J. Geotech. Eng. 1987, 12, 92–100. [Google Scholar]
  71. Kalteziotis, N.; Sabatakakis, N.; Vassiliou, J. Evaluation of Dynamic Characteristics of Greek Soil Formations. In Proceedings of the Second Hellenic Conference on Geotechnical Engineering, Thessaloniki, Greece, 21–23 October 1992; Volume 2, pp. 239–246. [Google Scholar]
  72. Athanasopoulos, G. Empirical Correlations Vso-NSPT for Soils of Greece: A Comparative Study of Reliability. In Proceedings of the 7th International Conference on Soil Dynamics and Earthquake Engineering, Seville, Spain, 23–25 September 2024; WIT Press: Crete, Greece, 1995; Volume 15. [Google Scholar]
  73. Sisman, H. An Investigation on Relationships Between Shear Wave Velocity, and SPT and Pressuremeter Test Results. Master’s Thesis, Ankara University, Ankara, Turkey, 1995. [Google Scholar]
  74. Iyisan, R. Correlations between Shear Wave Velocity and In-Situ Penetration Test Results. Tek. Dergi-Tmmob Insa. Muhendisleri Odasi 1996, 7, 371–374. [Google Scholar]
  75. Jafari, M.; Asghari, A.; Rahmani, I. Empirical Correlation between Shear Wave Velocity (Vs) and SPT-N Value for South of Tehran Soils. In Proceedings of the 4th International Conference on Civil Engineering, Tehran, Iran, 4–6 May 1997. [Google Scholar]
  76. Kiku, H. In-Situ Penetration Tests and Soil Profiling in Adapazari, Turkey. In Proceedings of the 15th ICSMGE TC4 Satellite Conference on Lessons Learned from Recent Strong Earthquakes, Istanbul, Turkey, 25 August 2001; pp. 259–265. [Google Scholar]
  77. Ulugergerli, E.; Uyanik, O. Statistical Correlations Between Seismic Wave Velocities and SPT Blow Counts and the Relative Density of Soils. J. Test. Eval. 2007, 35, 187–191. [Google Scholar] [CrossRef]
  78. Hanumantharao, C.; Ramana, G.V. Dynamic Soil Properties for Microzonation of Delhi, India. J. Earth Syst. Sci. 2008, 117, 719–730. [Google Scholar] [CrossRef]
  79. Sun, C.-G.; Kim, H.-J.; Chung, C.-K. Deduction of Correlations between Shear Wave Velocity and Geotechnical In-Situ Penetration Test Data. J. Earthq. Eng. Soc. Korea 2008, 12, 1–10. [Google Scholar] [CrossRef]
  80. Dikmen, Ü. Statistical Correlations of Shear Wave Velocity and Penetration Resistance for Soils. J. Geophys. Eng. 2009, 6, 61–72. [Google Scholar] [CrossRef]
  81. Hafezi Moghaddas, N.; Azadi, A.; Amanian, M. Assessment of Shear Wave Velocity Based on Standard Penetration and Accuracy of the Results in the Range of Mashhad City. In Proceedings of the Fourteenth Geophysics Conference of Iran, Tehran, Iran, 13 May 2010. [Google Scholar]
  82. Mhaske, S.Y.; Choudhury, D. Geospatial Contour Mapping of Shear Wave Velocity for Mumbai City. Nat. Hazards 2011, 59, 317–327. [Google Scholar] [CrossRef]
  83. Sil, A.; Haloi, J. Empirical Correlations with Standard Penetration Test (SPT)-N for Estimating Shear Wave Velocity Applicable to Any Region. Int. J. Geosynth. Ground Eng. 2017, 3, 22. [Google Scholar] [CrossRef]
  84. Shibata, T. The Relationship Between the N-Value and S-Wave Velocity in the Soil Layer; Disaster Prevention Research Laboratory, Kyoto University: Kyoto, Japan, 1970. [Google Scholar]
  85. Ohta, T.; Hara, A.; Niwa, M.; Sakano, T. Elastic Shear Moduli as Estimated from N-Value. In Proceedings of the 7th Annual Convention of Japan Society of Soil Mechanics and Foundation Engineering, Tokyo, Japan, 10–15 July 1972; pp. 265–268. [Google Scholar]
  86. Seed, H.B.; Idriss, I.M.; Arango, I. Evaluation of Liquefaction Potential Using Field Performance Data. J. Geotech. Eng. 1983, 109, 458–482. [Google Scholar] [CrossRef]
  87. Sykora, D.W. Correlations of in Situ Measurements in Sands of Shear Wave Velocity, Soil Characteristics, and Site Conditions. Ph.D. Thesis, University of Texas at Austin, Austin, TX, USA, 1983. [Google Scholar]
  88. Fumal, T.; Tinsley, J.; Ziony, J. Mapping Shear-Wave Velocities of near-Surface Geologic Materials. US Geol. Surv. Prof. Pap. 1985, 1360, 127–150. [Google Scholar]
  89. Okamoto, T.; Kokusho, T.; Yoshida, Y.; Kusuonoki, K. Comparison of Surface versus Subsurface Wave Source for P–S Logging in Sand Layer. In Proceedings of the 44th Annual Conference of the Japan Society of Civil Engineers (JSCE), Tokyo, Japan, 4–6 October 1989; Volume 3, pp. 996–997. [Google Scholar]
  90. Lee, S.H.-H. Regression Models of Shear Wave Velocities in Taipei Basin. J. Chin. Inst. Eng. 1990, 13, 519–532. [Google Scholar] [CrossRef]
  91. Pitilakis, K.; Anastasiadis, A.; Raptakis, D. Field and Laboratory Determination of Dynamic Properties of Natural Soil Deposits. In Proceedings of the 10th World Conference on Earthquake Engineering, Madrid, Spain, 19–24 July 1992; Volume 5, pp. 1275–1280. [Google Scholar]
  92. Raptakis, D.; Anastasiadis, S.; Pitilakis, K.; Lontzetidis, K. Shear Wave Velocities and Damping of Greek Natural Soils. In Proceedings of the 10th European Conference on Earthquake Engineering, Vienna, Austria, 28 August–2 September 1994; Volume 477482. [Google Scholar]
  93. Kayabali, K. Soil Liquefaction Evaluation Using Shear Wave Velocity. Eng. Geol. 1996, 44, 121–127. [Google Scholar] [CrossRef]
  94. Pitilakis, K.; Raptakis, D.; Lontzetidis, K.; Tika-Vassilikou, T.; Jongmans, D. Geotechnical and Geophysical Description of EURO-SEISTEST, Using Field, Laboratory Tests and Moderate Strong Motion Recordings. J. Earthq. Eng. 1999, 3, 381–409. [Google Scholar] [CrossRef]
  95. Chien, L.; Oh, E. Laboratory and Field Shear Wave Measurement at a Reclaimed Site in West Taiwan. Geotech. Test. J. 2000, 23, 21–35. [Google Scholar] [CrossRef]
  96. Jafari, M.K.; Shafiei, A.; Razmkhah, A. Dynamic Properties of Fine Grained Soils in South of Tehran. J. Seismol. Earthq. Eng. 2002, 4, 25–35. [Google Scholar]
  97. Tsiambaos, G.; Sabatakakis, N. Empirical Estimation of Shear Wave Velocity from in Situ Tests on Soil Formations in Greece. Bull. Eng. Geol. Environ. 2011, 70, 291–297. [Google Scholar] [CrossRef]
  98. Fatehnia, M.; Hayden, M.; Landschoot, M. Correlation between Shear Wave Velocity and SPT-N Values for North Florida Soils. Electron. J. Geotech. Eng. 2015, 20, 12421–12430. [Google Scholar]
  99. Boore, D.; Thompson, E.; Cadet, H. Regional Correlations of VS30 and Velocities Averaged Over Depths Less Than and Greater Than 30 Meters. Bull. Seismol. Soc. Am. 2011, 101, 3046–3059. [Google Scholar] [CrossRef]
  100. Boore, D. Estimating V ¢ s (30) (or NEHRP Site Classes) from Shallow Velocity Models (Depths 30 m). Bull. Seismol. Soc. Am. 2004, 94, 591–597. [Google Scholar] [CrossRef]
  101. PHIVOLCS. The Philippine Earthquake Model: A Probabilistic Seismic Hazard Assessment of the Philippines and of Metro Manila 2017; Philippine Institute of Volcanology and Seismology: Quezon City, Philippines, 2017.
  102. Midorikawa, S.; Fujimoto, K.; Yamanaka, H.; Miura, H.; Pacheco, B.M.; Bautista, B.C. GIS-Based Earthquake Damage Assessment Considering Seismic Capacity of Existing Buildings in Metro Manila, Philippines; Association of Structural Engineers of the Philippines: Manila, Philippines, 2004. [Google Scholar]
  103. Adajar, M.A.; Tan, J.; Adriano, A.; Vera, S.B.D.; Manabat, J.V.; Navarro, H. Agar Biopolymer as a Sustainable Alternative Binder to Enhance the Strength of Low-Plasticity Soil. Polymers 2025, 17, 1253. [Google Scholar] [CrossRef] [PubMed]
  104. Galupino, J.; Dungca, J. Estimating Ground Elevation Using Borehole Information: A Case of Metro Manila, Philippines. In Proceedings of the International Exchange and Innovation Conference on Engineering & Sciences (IEICES); Interdisciplinary Graduate School of Engineering Sciences, Kyushu University: Fukuoka, Japan, 2022. [Google Scholar]
  105. ASTM D1586; Test Method for Standard Penetration Test (SPT) and Split-Barrel Sampling of Soils. ASTM International: West Conshohocken, PA, USA, 2018. [CrossRef]
  106. ASEP. National Structural Code of the Philippines, 2015. Volume 1, Buildings, Towers, and Other Vertical Structures; Association of Structural Engineers of the Philippines: Quezon City, Philippines, 2016. [Google Scholar]
  107. Hengl, T. A Practical Guide to Geostatistical Mapping of Environmental Variables. Available online: https://publications.jrc.ec.europa.eu/repository/handle/JRC38153 (accessed on 5 August 2024).
  108. Tan, J.; Aniñon, M.J. Review of GIS-Based Approaches in Earthquake Disaster Management. In Proceedings of the International Exchange and Innovation Conference on Engineering & Sciences (IEICES); Interdisciplinary Graduate School of Engineering Sciences, Kyushu University: Fukuoka, Japan, 2024. [Google Scholar]
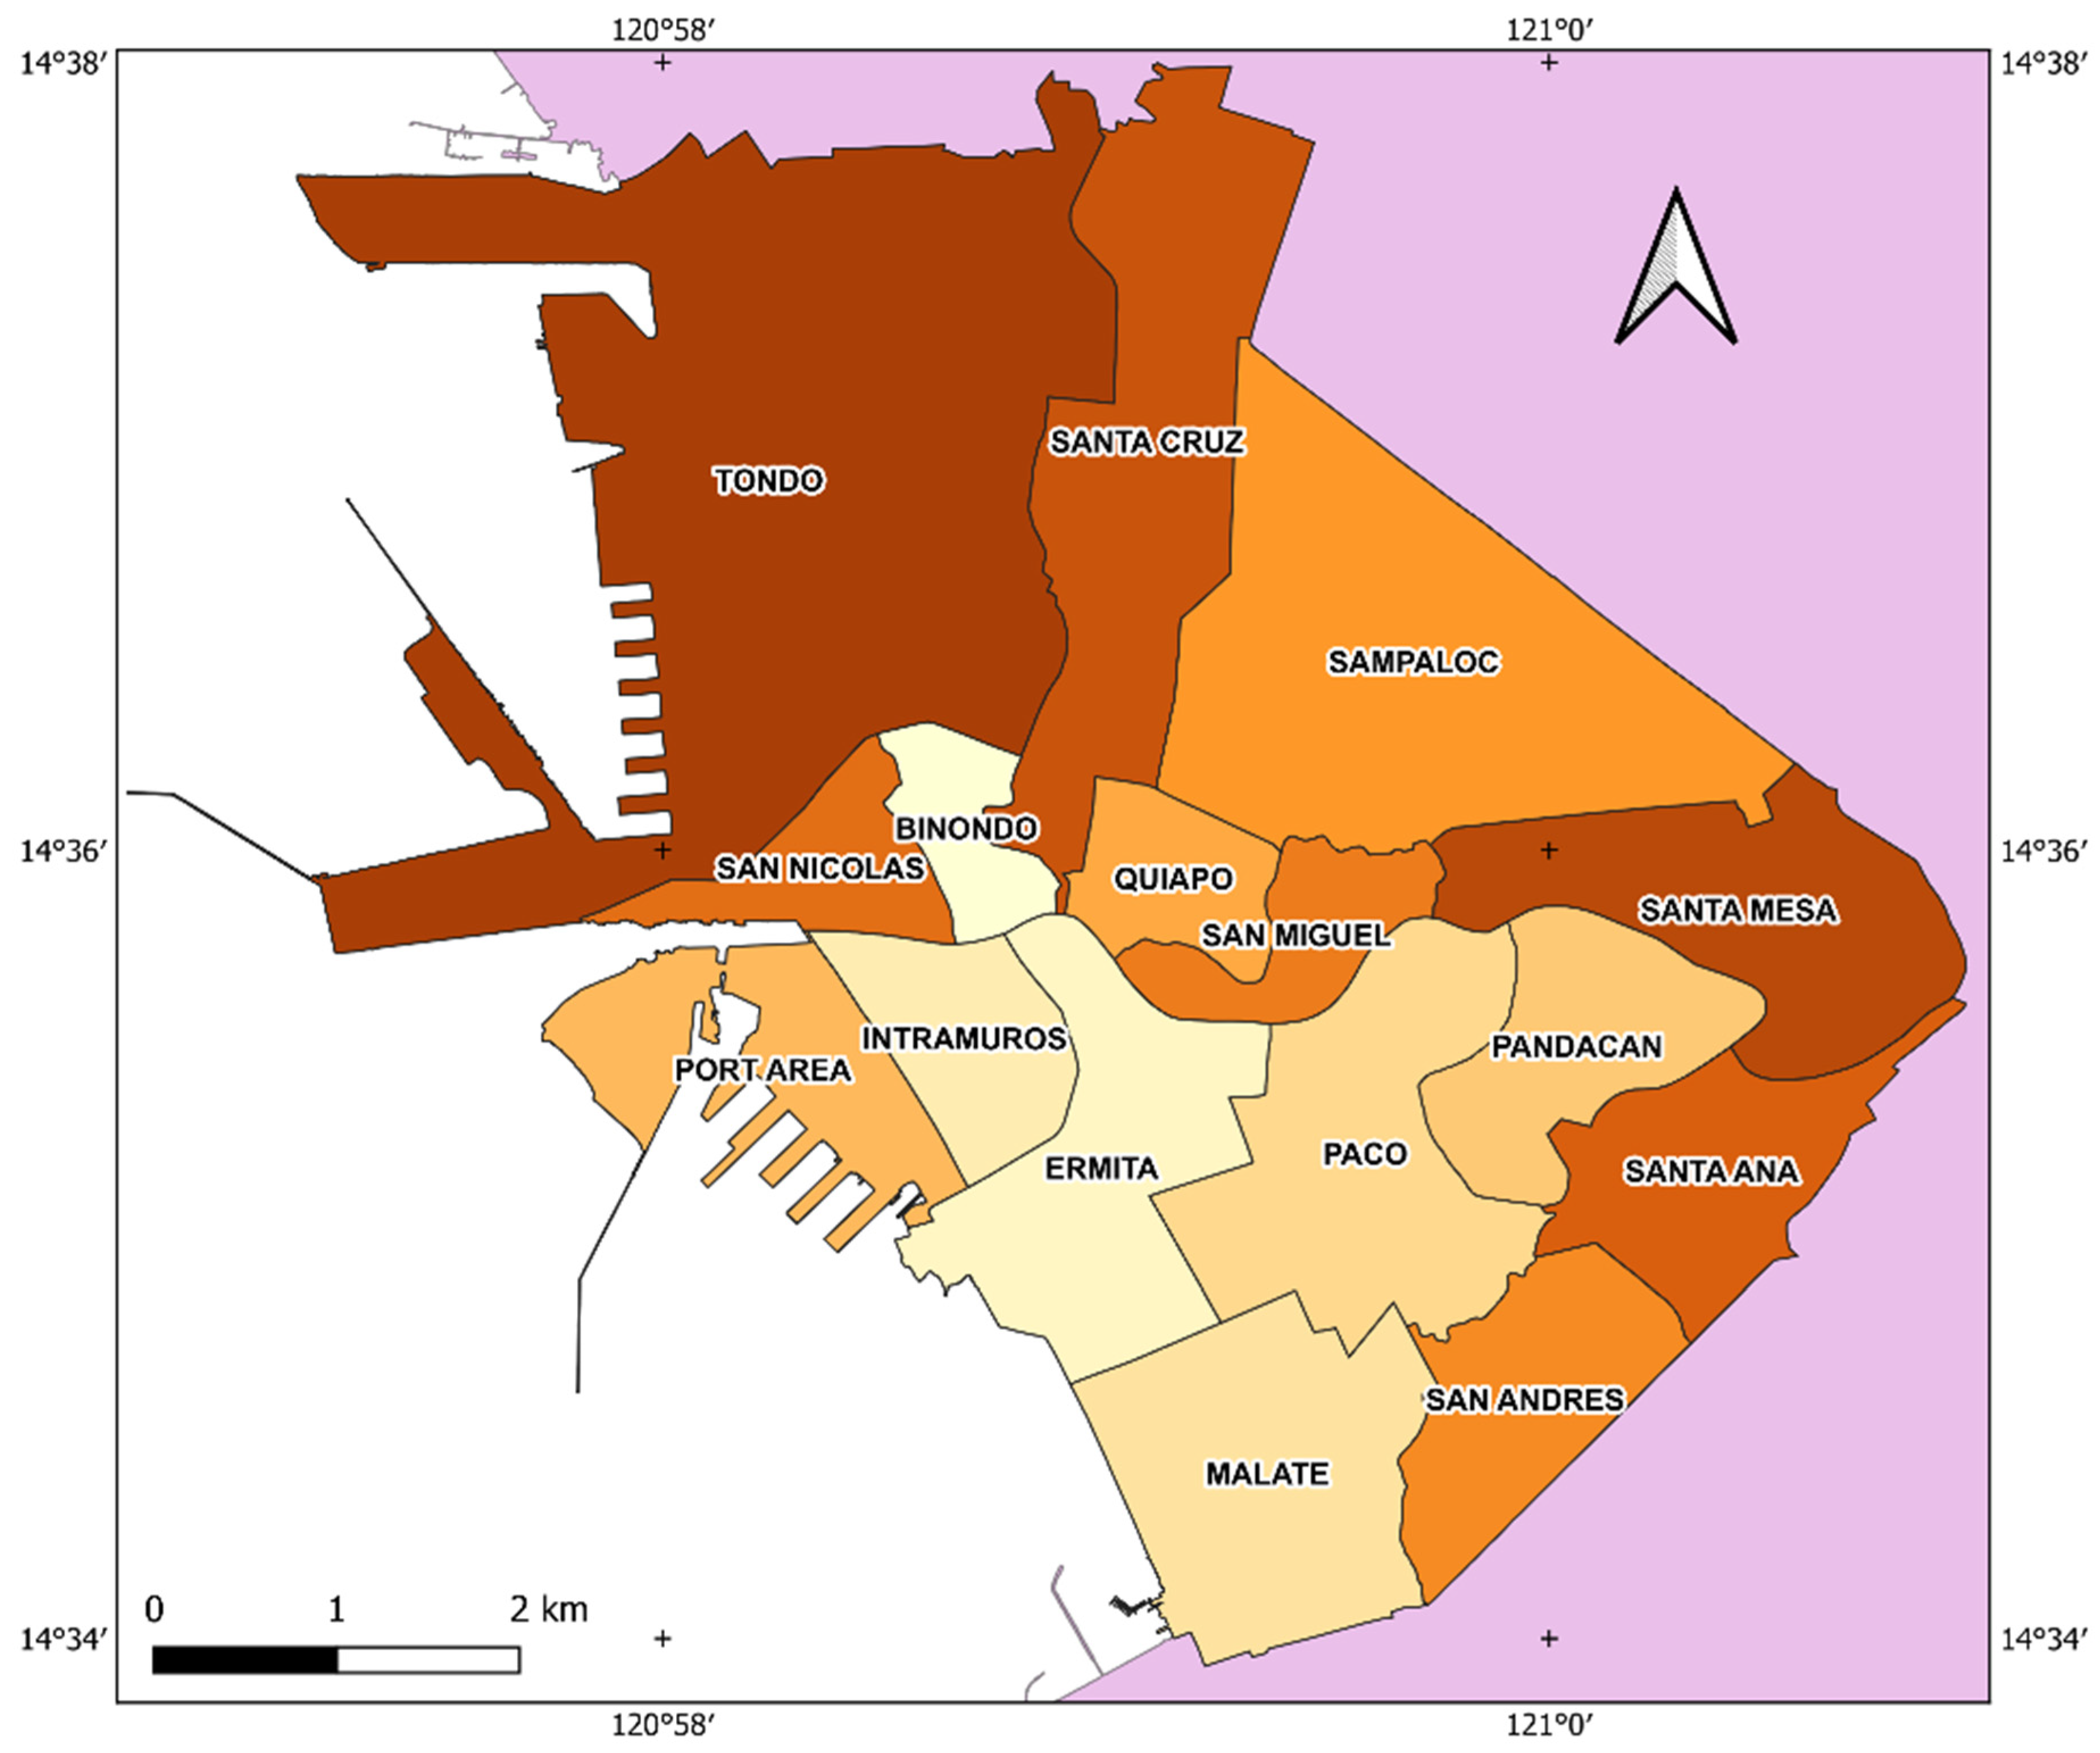
Figure 2. Shear wave velocity profile of Metro Manila from Grutas and Yamanaka [4,101].
Applsci 15 09596 g002
Figure 3. The study areas for the correlation of shear wave velocity and SPT N-value.
Applsci 15 09596 g003
Figure 4. Shear wave velocity data points derived from Grutas and Yamanaka [4].
Applsci 15 09596 g004
Figure 5. Location of boreholes collected in the City of Manila.
Applsci 15 09596 g005
Figure 6. Generated empirical equations considering all data points, including outliers [25,54,56,57,58,59,60,61,62,63,64,66,67,68,69,83].
Applsci 15 09596 g006
Figure 7. Generated empirical equations considering all values within one standard deviation of the mean shear wave velocity per SPT N-value.
Applsci 15 09596 g007
Figure 8. Spatially interpolated Vs30 profiles using IDW (left) and thin spline (right).
Applsci 15 09596 g008
Figure 9. Reclassified Vs30 profiles using IDW (left) and thin spline (right).
Applsci 15 09596 g009
Figure 10. Clipped Vs30 profiles for the City of Manila using inverse distance weighted interpolation (top) and thin-spline interpolation (bottom).
Applsci 15 09596 g010
Figure 11. Shear wave velocity profiles generated using the IDW method for the City of Manila. Equations used include TAN-1 (top), TAN-2 (bottom), and DAAG (right).
Applsci 15 09596 g011
Figure 12. Histograms for IDW VS30 profile for TAN-1 (top), TAN-2 (bottom), and DAAG (right).
Applsci 15 09596 g012
Figure 13. Percent difference between generated IDW Vs30 profiles.
Applsci 15 09596 g013
Figure 14. Generated raster profiles using thin-spline interpolation.
Applsci 15 09596 g014
Figure 15. Corresponding raster histogram for percentage difference of TAN-1 thin-spline profile with DAAG IDW profile.
Applsci 15 09596 g015
Figure 16. Raster layer histograms of generated IDW Vs30 profiles for TAN-1 vs. DAAG (top), TAN-2 vs. DAAG (bottom left), and TAN-1 vs. TAN-2 (bottom right).
Applsci 15 09596 g016
Figure 17. Reclassified soil type profiles from interpolated Vs30 models using Table 6 for the City of Manila. Equations include TAN-1 (top), TAN-2 (bottom), and DAAG (right).
Applsci 15 09596 g017
Table 1. The effect of increasing various factors on Gmax and Vs.
Parameter Effect of Gmax on Vs
Confining stressIncreases with confining stress
Void ratioDecreases with increase in void ratio
Over-consolidation ratio (OCR)Increases
CementationIncreases
Table 2. Empirical correlations between shear wave velocity and SPT-N value for all soil types.
AuthorCountryAll Soils
Kanai [56]JapanVs = 19N0.6
Imai and Yoshimura [57]JapanVs = 76N0.33
Ohba and Toriumi [58]JapanVs = 84N0.31
Fujiwara [59]JapanVs = 92.1N0.337
Ohsaki and Iwasaki [60]JapanVs = 81.38N0.39
Imai and Yoshimura [61]JapanVs = 92.05N0.329
Imai, Fumoto, and Yokota [62]JapanVs = 89.92N0.341
Imai [63]JapanVs = 91N0.337
Ohta and Goto [64]JapanVs = 85.35N0.348
Seed and Idriss [65]USAVs = 61.4N0.5
Yokota et al. [66]JapanVs = 121N0.27
Imai and Tonouchi [67]JapanVs = 96.9N0.314
Tonouchi et al. [68]JapanVs = 97N0.314
Lin et al. [69]TaiwanVs = 65N0.502
Zheng [70]ChinaVs = 116.1(N + 0.3185)0.6
Lee [69]TaiwanVs = 57.4N0.49
Kalteziotis et al. [71]GreeceVs = 76.2N0.24
Athanasopoulos [72]GreeceVs = 107.6N0.36
Sisman [73]TurkeyVs = 32.8N0.51
Iyisan [74]TurkeyVs = 51.5N0.516
Jafari et al. [75]IranVs = 22N0.85
Kiku et al. [76]TurkeyVs = 68.3N0.292
Hasancebi and Ulusay [42]TurkeyVs = 90N0.309 and Vs = 104.79(N60)0.26
Ulugergerli and Uyanik [77]TurkeyVs = 23.29ln(N) + 405.61 (upper bound)
Vs = 52.9e−0.01N (lower bound)
Hanumantharao and Ramana [78]IndiaVs = 86.2N0.43
Sun et al. [79]South KoreaVs = 65.64N0.407
Dikmen [80]TurkeyVs = 58N0.39
Hafezi Moghaddas et al. [81]IranVs = 99N0.53
Uma Maheswari et al. [55]IndiaVs = 95.64N0.301
Mhaske and Choudhury [82]IndiaVs = 72N0.40
Chatterjee and Choudhury [5]IndiaVs = 78.21N0.38
Marto et al. [44]GlobalVs = 77.13N0.377
Fauzi [54]IndonesiaVs = 105.03N0.286
Kirar [46]IndiaVs = 99.5N0.345 and Vs = 90.6(N60)0.341
Sil and Haloi [83]GlobalVs = 75.478N0.3799
Daag et al. [25]PhilippinesVs = 56.82N0.4861
Chatrayi et al. [50]IndiaVs = 141.84N0.5853
Table 3. Empirical equations predicting shear wave velocities using SPT N-values per soil type.
AuthorCountrySandSiltClay
Shibata [84]JapanVs = 31.7N0.54--
Ohta et al. [85]JapanVs = 87.2N0.36--
Ohsaki and Iwasaki [60]JapanVs = 59.4N0.47--
Imai [62]JapanVs = 80.6N0.331-Vs = 102N0.292
Yokota et al. [66]Japan--Vs = 114N0.31
Seed et al. [86]JapanVs = 56.4N0.5--
Sykora and Stokoe [87]USAVs = 100.5N0.29--
Fumal and Tinsley [88]USAVs = 152 + 51N0.27--
Okamoto et al. [89]JapanVs = 125N0.3--
Lee [90]TaiwanVs = 57.4N0.49Vs = 105.64N0.319Vs = 114.43N0.31
Lee [69]Taiwan--Vs = 138.4(N + 1)0.242
Pitilakis et al. [91]GreeceVs = 162N0.17Vs = 165.7N0.19-
Athanasopoulos [72]Greece--Vs = 76.55N0.445
Raptakis et al. [92]GreeceVs = 100.7N0.24-Vs = 184.2N0.17
Kayabali [93]TurkeyVs = 175 + 3.75N--
Pitilakis et al. [94]TurkeyVs = 145(N60)0.178-Vs = 132(N60)0.271
Chien and Oh [95]TaiwanVs = 22N0.76--
Jafari et al. [96]IranVs = 19N0.85Vs = 22N0.77Vs = 27N0.73
Hasancebi and Ulusay [42]TurkeyVs = 90.82N0.319
Vs = 131(N60)0.205
-Vs = 97.89N0.269
Vs = 107.6(N60)0.237
Hanumantharao and Ramana [78]IndiaVs = 79.0N0.434Vs = 86N0.42-
Sun et al. [79]South KoreaVs = 82.01N0.319Vs = 82.01N0.319-
Dikmen [80]TurkeyVs = 73N0.33Vs = 60N0.36Vs = 44N0.48
Hafezi Moghaddas et al. [81]IranVs = 80N0.58-Vs = 45N0.72
Tsiambaos and Sabatakakis [97]Greece-Vs = 99.45N0.364-
Uma Maheswari et al. [55]IndiaVs = 100.53N0.265-Vs = 89.3N0.358
Chatterjee and Choudhury [5]India-Vs = 54.82N0.53Vs = 77.11N0.39
Esfehanizadeh et al. [22]IranVs = 107.3N0.34--
Fatehnia et al. [98]USAVs = 77.1N0.355-Vs = 77.1N0.355
Kirar [46]IndiaVs = 100.3N0.338-Vs = 94.4N0.379
Daag et al. [25]PhilippinesVs = 45.07N0.5534-Vs = 70.26N0.4420
Chatrayi et al. [50]IndiaVs = 140.85N05872-Vs = 143.2N0.5815
Tunusluoglu [8]TurkeyVs = 59N0.42
Vs = 83(N60)0.343
--
Table 4. Borehole count and density for the City of Manila.
DistrictBorehole PointsBorehole Density
(per km2)
DistrictBorehole PointsBorehole Density
(per km2)
Binondo46Sampaloc3216
Ermita4016San Andres21
Intramuros2622San Miguel2224
Malate114San Nicolas3234
Paco269Santa Ana00
Pandacan00Santa Cruz4813
Port Area21Santa Mesa3413
Quiapo1719Tondo17515
Table 5. Selected equations for the Vs–SPT N-value correlation.
AuthorEquationAuthorEquation
Kanai [56]Vs = 19N0.6Yokota et al. [66]Vs = 121N0.27
Imai and Yoshimura [57]Vs = 76N0.33Imai and Tonouchi [67]Vs = 96.9N0.314
Ohba and Toriumi [58]Vs = 84N0.31Tonouchi et al. [68]Vs = 97N0.314
Fujiwara [59]Vs = 92.1N0.337Lin et al. [69]Vs = 65N0.502
Ohsaki and Iwasaki [60]Vs = 81.38N0.39Lee [69]Vs = 57.4N0.49
Imai and Yoshimura [61]Vs = 92.05N0.329Fauzi [54]Vs = 105.03N0.286
Imai, Fumoto, and Yokota [62]Vs = 89.92N0.341Sil and Haloi [83]Vs = 75.478N0.3799
Imai [63]Vs = 91N0.337Daag et al. [25]Vs = 56.82N0.4861
Ohta and Goto [64]Vs = 85.35N0.348
Table 6. Soil profile types in NSCP 2015 [106].
Soil Profile TypeDescriptionAverage Values for Top 30 m of Soil Profile
Shear Wave Velocity
Vs (m/s)
SPT, N (Blows/300 mm)Undrained Shear Strength, Su (kPa)
SAHard Rock>1500
SBRock760 to 1500
SCVery Dense Soil and Soft Rock360 to 760>50>100
SDStiff Soil Profile180 to 36015 to 5050 to 100
SESoft Soil Profile 1<180<15<50
SFSoil requiring site-specific evaluation 2
1 Includes profiles with a least 3.0 m of soft clay with Su < 24 kPa, w ≥ 40%, and PI > 20. 2 Soil types include: 1. Soils vulnerable to potential failure or collapse under seismic loading (liquefiable soils, quick and highly sensitive clays, collapsible weakly cemented soils). 2. Peats and/or highly organic clays (H > 3 m of peat and/or highly organic clay where H = thickness of soil). 3. Very high plasticity clays (H > 7.5 m with PI > 75). 4. Very thick, soft/medium stiff clays, where the depth of clay exceeds 35 m.
Table 7. Normalized root mean square error for each spatial interpolation model.
ModelRMSERangeNMRSE
IDW—TAN-121.208397.1480.0534
IDW—TAN-222.814439.3170.0519
IDW—DAAG23.916467.1300.0512
Disclaimer/Publisher’s Note: The statements, opinions and data contained in all publications are solely those of the individual author(s) and contributor(s) and not of MDPI and/or the editor(s). MDPI and/or the editor(s) disclaim responsibility for any injury to people or property resulting from any ideas, methods, instructions or products referred to in the content.