Article

Structural Failure and Mechanical Response of Buried Pipelines Under Offshore Fault Dislocation

School of Civil Engineering, University of Science and Technology Liaoning, Anshan 114051, China
*
Author to whom correspondence should be addressed.
Appl. Sci. 2025, 15(17), 9450; https://doi.org/10.3390/app15179450
Submission received: 4 July 2025 / Revised: 16 August 2025 / Accepted: 19 August 2025 / Published: 28 August 2025
(This article belongs to the Topic Exploitation and Underground Storage of Oil and Gas)

Abstract

Fault activity represents a significant geological hazard to buried pipeline infrastructure. The associated stratigraphic dislocation may lead to severe deformation, instability, or even rupture of the pipeline, thereby posing a serious threat to the safe operation of oil and gas transportation systems. This study employs the 3D nonlinear finite element method to systematically investigate the mechanical behavior of buried steel pipes subjected to fault-induced dislocation, with particular emphasis on critical parameters including fault offset, internal pressure, and the diameter-to-thickness ratio. The study reveals that buried pipelines subjected to fault dislocation typically undergo a progressive failure process, transitioning from the elastic stage to yielding, followed by plastic deformation and eventual fracture. The diameter-to-thickness ratio is found to significantly affect the structural stiffness and deformation resistance of the pipeline. A lower diameter-to-thickness ratio improves deformation compatibility and enhances the overall structural stability of the pipeline. Internal pressure exhibits a dual effect: within a moderate range, it enhances pipeline stability and delays the onset of structural buckling; however, excessive internal pressure induces circumferential tensile stress concentration, thereby increasing the risk of local buckling and structural instability. The findings of this study provide a theoretical basis and practical guidance for the design of buried pipelines in fault-prone areas to withstand and accommodate ground misalignment.

1. Introduction

As the “lifelines” of national energy transportation, the safety and reliability of long-distance oil and gas pipelines are vital to economic development and social stability. However, in complex geological settings—such as seismic zones and active fault areas—these pipelines are frequently subjected to catastrophic hazards induced by fault dislocation [1,2,3,4]. For example, earthquake-induced fault displacement can cause local buckling, cracking of circumferential welds, and even leakage of transported media. Notable cases include the 1906 San Francisco earthquake [5], the 1999 Izmit earthquake in Turkey, and the 1999 Jiji earthquake in Taiwan [6]—all involving fault crossings where pipelines sustained severe damage. Therefore, studying the mechanical response of buried pipelines crossing faults and developing high-precision numerical simulation methods for seismic pipeline design are of great significance.
Currently, three primary methods are used to study the damage mechanisms of buried pipelines crossing faults [7,8,9]—theoretical analysis, large-scale physical modeling, and numerical simulation—each with its own advantages and limitations. The theoretical analysis method, based on shell or beam theory in elastic mechanics, establishes a pipeline axial tension-bending coupling equation to quickly assess the relationship between fault displacement and pipeline strain. However, it assumes the soil to be uniform and continuous while neglecting material nonlinearities, making it difficult to capture complex effects such as soil delamination and cumulative pipeline damage under actual operating conditions. Karamitros et al. [10] proposed an improved method for calculating axial and flexural strains in buried steel pipes crossing faults, effectively assessing their structural strength. Valsamis et al. [11] introduced a novel design method for flexible pipeline joints, demonstrating that such joints can reduce pipeline flexural strain by 87.5%. Hu et al. [12] improved the theoretical calculation method for earth pressure and pipe bending strain at fault intersections and validated its accuracy using finite element analysis. The proposed analytical method effectively captures the strain response of tensioned steel pipes subjected to fault activity. Zhang et al. [13] proposed an analytical solution for pipeline deformation caused by normal and reverse faults, considering the effects of faults and joints. The study systematically examines how fault and joint characteristics influence pipeline deformation and internal forces. The aforementioned analytical solution can be applied to specific project cases; however, its generalizability remains unproven. Large-scale physical modeling tests, including downsizing and foot-sizing approaches, can visually capture damage patterns such as pipe buckling and soil slippage. To analyze the extent of damage to the submarine pipeline, Meniconi et al. [14] adopted a new type of transient testing technology. The on-site test results proved the effectiveness of the TTBT technology in detecting faults in submarine pipelines. However, the high cost, lengthy duration, and limited sensor deployment hinder systematic parameter sensitivity analyses. Additionally, discrepancies in dynamic responses between soil simulants and prototype materials may introduce scale effect errors. Demirci et al. [15] developed a novel test setup to study pipelines subjected to faults, deriving analogous relationships and scaling laws for pipeline systems. The study identified the critical zone for bending strain as the fault crossing point. Abdoun et al. [16] employed centrifuge testing to investigate the effects of fault offset, burial depth, and pipe diameter on pipeline mechanical behavior. The study found that pipeline flexural strain was unaffected by soil moisture content and fault offset. Oskouei et al. [17] conducted full-scale tests on buried pipelines crossing strike-slip faults to evaluate the extent of pipeline damage caused by fault slippage. In contrast, numerical simulation has emerged as an effective tool for elucidating fault-pipeline interaction mechanisms due to its repeatability, parameter control, and multi-field coupling capabilities. However, current studies still face accuracy challenges in coupled modeling of pipe-soil contact nonlinearities, material failure criteria, and seismic wave propagation paths. Joshi et al. [18] employed finite element simulation to investigate the buckling failure behavior of pipes crossing faults, considering both material nonlinearities and those arising from large deformations. Liu et al. [19] analyzed the effects of pipe size, material properties, and operating conditions on the mechanical performance of pipes subjected to fault displacement loading. Rahman and Taniyama [20] employed a coupled FEM-DEM approach to realistically simulate the strain-softening behavior of pipelines at fault intersections. Vazouras et al. [21] employed finite element simulations to investigate the effects of pipe diameter-to-thickness ratio and fault width on pipeline failure modes. Banushi et al. [22] employed a continuum modeling approach to study the effects of strike-slip faults on buried pipelines and systematically analyzed the mechanical behavior of the fault-pipeline system.
Although previous studies have examined the effects of fault misalignment width, diameter-to-thickness ratio, and other factors on pipe failure, the coupling effect of internal pressure and fault misalignment has not been considered. Secondly, previous numerical models have often employed simplified approaches that neglect the impact of boundary effects. In contrast, the present model incorporates an equivalent spring model to integrate the mechanical response of the pipeline boundary into the modeling framework. This omission hampers a comprehensive analysis of the mechanical behavior of faulted pipelines. This paper establishes a three-dimensional nonlinear refined finite element model of the pipeline-fault system to investigate the influence of internal pressure and fault misalignment on pipeline failure deformation and damage modes. Specifically, Section 2 presents the theory of pipe buckling under fault misalignment. Section 3 develops an analytical model for pipeline failure based on equivalent boundary springs. Section 4 analyzes the effects of parameters—including fault misalignment, diameter-to-thickness ratio, and internal pressure—on pipeline performance, providing a reference for predicting damage extent and seismic resilience of buried pipelines crossing faults.

2. Mechanical Analysis of Pipe Buckling

The local buckling behavior of pipelines subjected to strike-slip faults is influenced by several factors, including pipe yield strength, soil–pipe interaction characteristics, fault traversal angle, and end-constraint effects. As shown in Figure 1, this study establishes a systematic theoretical model to accurately characterize the mechanical response of pipelines under fault displacement, with a focus on the deformation mechanisms considering the coupled effects of axial tension and bending. The model is grounded in elastic–plastic mechanics and describes the pipe’s displacement field, strain distribution, and buckling critical conditions by deriving a set of governing equations. These equations emphasize the coupled effects of material nonlinearity, geometric nonlinearity, and soil confinement nonlinearity [23]. The theoretical formulations are simplified by assuming the pipe as a homogeneous continuum and neglecting local discontinuities such as seams and welds. Fault misalignment is idealized as a quasi-static uniform displacement field, neglecting the effects of internal cracks, pore water pressure, and dynamic slip rate within the fault zone. The theoretical model limits pipeline failure to ductile deformation, excluding fracture damage.
As shown in Figure 1b, the total fault displacement vector is defined as d, and its spatial intersection angle with the pipe axis is β (0° < β < 90°). According to the principle of vector decomposition, the fault displacement can be decomposed orthogonally into the transverse displacement component dcosβ that leads to the bending deformation of the pipe and the longitudinal displacement component dsinβ that is axial stretching or compression. Considering the nonlinear characteristics of soil–pipe interactions, the transverse displacement field u(z) of the pipeline is described by the following refinement function:
u z = L 1 L 1 + L 2 d c o s β 1 π s i n π z L 1 z L 1 , 0 z L 1 + L 2
Since the deformation of the tunnel under the action of the fault presents asymmetric characteristics (as shown in Figure 1), it can be set that the length of the deformation-affected zone satisfies L1 = L2 = L/2. Based on this geometrical constraint, Equation (1) can be simplified to the following explicit expression:
u z = 1 2 d c o s β 1 π s i n 2 π z L 2 z L , 0 z L
The refined shape function u(z) accurately characterizes the S-shaped deformation of the underground integrated pipe corridor subjected to fault misalignment. The function strictly satisfies the following boundary conditions at the pipe section ends (z = 0 and z = L):
u L u 0 = d c o s β
u 0 = u L = 0
u 0 = u L = 0
Based on the beam theory, the curvature distribution of the deformed duct gallery can be directly obtained by second-order differentiation of Equation (2). This curvature field accurately characterizes the bending effect induced by the fault transverse displacement component dcosβ:
k z = d 2 u z d z 2 = 2 π L 2 d c o s β s i n 2 π z L , 0 z L
The peak curvature in Equation (6) appears at z = L/4 and z = 3L/4, and its amplitude κmax (κmax = (2π/L)2dcosβ) directly reflects the intensity of fault misalignment. Accordingly, the bending strain distribution of the outer wall of the pipe gallery is given by the classical beam theory:
ϵ b z = D 2 d 2 u z d z 2 = π D L 2 d c o s β s i n 2 π z L , 0 z L
Based on the theoretical solution of the curvature distribution, when the sinusoidal function takes the extreme value (sin(2πz/L) = 1), the key extreme parameters κmax and εb,max can be obtained for the deformation of the pipe corridor. When the material of the pipe corridor reaches the yielding state, the corresponding critical fault displacement is defined to be dy, and then the yield strain can be expressed as follows:
ϵ b y = D 2 k m a x = π D L 2 d y
In addition to the bending effect, the fault motion induces the axial stretching of the corridor through the longitudinal component dsinβ. Based on the principle of differential geometry, the total elongation of the corridor, δ1, can be accurately expressed as follows:
δ 1 = 0 L 1 + u 2 z d z L
Based on the elastic foundation beam theory and considering the effect of the axial resistance Kt of the soil [21,23], the displacement distribution can be expressed as follows [21]:
ν z = d s i n β L z e λ L z , 0 z L
The attenuation coefficient λ characterizes the strength of soil–structure interaction [23]:
λ = π D K t E A
where Kt is the tangent stiffness of soil; D is the pipe diameter; EA is the axial stiffness of the pipe, where E is the elastic modulus and A is the cross-sectional area.
Considering the end constraint effect of the pipe gallery, the total elongation δ can be expressed by coupling the bending-induced elongation (δ1), axial tensile deformation (δ2), and end-compensating term (δ3) as follows:
δ = δ 1 + δ 2 δ 3
Considering axial-bending coupling deformation and boundary constraints, the three-dimensional deformation governing equations of the pipe corridor under fault action are established:
E A L δ = K ¯ T δ 3 2
The total axial strain is assumed to be uniformly distributed along the pipe and is expressed as the sum of bending-induced strain, direct axial strain, and end-constraint compensation effects [21]:
ϵ m = δ L = 1 L 0 L 1 + u 2 d z 1 + d s i n β L δ 3 L
The theoretical axial strain model is simplified using a Taylor series expansion, resulting in a simplified analytical solution:
1 + u 2 = 1 + 1 2 u 2 +
ϵ m = 3 4 L 2 d c o s β 2 + d s i n β L ω ω + 1
In order to characterize the critical strain conditions in the yield state of the pipe, an analytical expression for the yield axial strain is obtained [24]:
ϵ m y = 3 d y 2 4 L 2 + d y t a n β L ω 1 + ω
Based on the principle of static equilibrium, to establish the seismic analysis model of the corridor, as shown in Figure 2, using a uniformly distributed load qu characterizes the peak resistance of the soil body per unit length, symmetrically acting on the left and right sections of the corridor (L1 = L2 = L/2). A static equilibrium model based on beam theory is developed to determine the deformation length L of the pipe gallery under fault action, as illustrated in Figure 2. In Figure 2a, the model represents the permanent soil misalignment on both sides of the fault by the difference in transverse displacements at the pipe gallery supports. The critical bending moments, MA and MB, are calculated using classical beam theory. Figure 2b simulates the constraint force exerted by the surrounding soil through a distributed load qu, representing the soil’s confinement resistance.
A static equilibrium model (Figure 2) is developed based on the beam theory to solve the deformation length of the pipe gallery under the action of the fault [24]. As shown in Figure 2a, the model characterizes the permanent misalignment of the soil on both sides of the fault through the difference in the transverse displacements of the pipe gallery bearings, where the critical cross-section moments MA and MB are calculated using the classical beam theory; and in Figure 2b, the constraint resisting force provided by the surrounding soil is simulated through the distribution of the loads qu to simulate the confinement resistance provided by the surrounding soil.
This simplified analytical method, based on static equilibrium equations, establishes force-moment coordination conditions and employs the moment–curvature relationship to describe the pipe’s elastic–plastic behavior. By introducing an equivalent soil spring stiffness, the model simultaneously accounts for the coupling effects of bending deformation and soil–structure interaction. However, the simplified treatment of soil nonlinearities may lead to inaccuracies at large fault displacements [25,26]. The bending moment at the typical pipe end is given by the following:
M A = 6 E I d c o s β L 2
M B = 6 E I d c o s β L 2
I = π D 3 t 8
The bending moments at both ends in Figure 2b are calculated according to the following equation:
M A = 1 3 τ 1 + v 2 2 v 1 2 τ 2
M B = 1 3 τ 2 + v 1 2 v 2 2 τ 1
The complex deformation mechanism of the pipe gallery under fault action is elucidated using the superposition principle (Figure 2c). The deformation pattern results from the nonlinear coupling between foundation displacement (Figure 2a) and soil confinement response (Figure 2b). Theoretical analysis indicates that the pipe gallery ends (z = 0, L) satisfy zero bending moment boundary conditions (Equations (21) and (22)), reflecting the joints’ limited bending capacity in practice. Specifically, the mutual cancelation of MA and MA (Equation (21)) shows that the left free end does not transfer bending moments. The equilibrium between MB and MB (Equation (22)) confirms the stress release mechanism at the right boundary:
M A + M A = 0
M B + M B = 0
A combination of Equations (21)–(24) can be obtained:
125 4 q u L 4 = 6000 E I d c o s β
Combined with the static equilibrium equations, the maximum bending moment in Figure 2c is
M m a x = V A 12 E I d c o s β L 3 z m a x q u z m a x 2 2
The maximum negative bending moment is represented by zmax in Figure 2c, which is expressed as follows [24]:
z m a x = V A 12 E I d c o s β L 3 q u = L 4
An analytical framework for the yield displacement of the pipe gallery is established based on the material yield criterion, in which the key parameter yield bending moment is jointly determined by the yield strength σy of the pipe and the geometric dimensions (diameter D, wall thickness t), which is expressed as. By making the maximum bending moment Mmax ( M m a x   =   0.433 E I q u d y ) equal to the yielding moment My ( M y   =   σ y π D 2 t 4 ). Under strike-slip fault actions, the critical yield displacement of pipeline can be derived through the combination of Mmax and My [24]:
d y = D 8 π 3 σ y E t D D σ y q u

3. Three-Dimensional Numerical Pipeline–Soil Interaction Model

3.1. FE Model

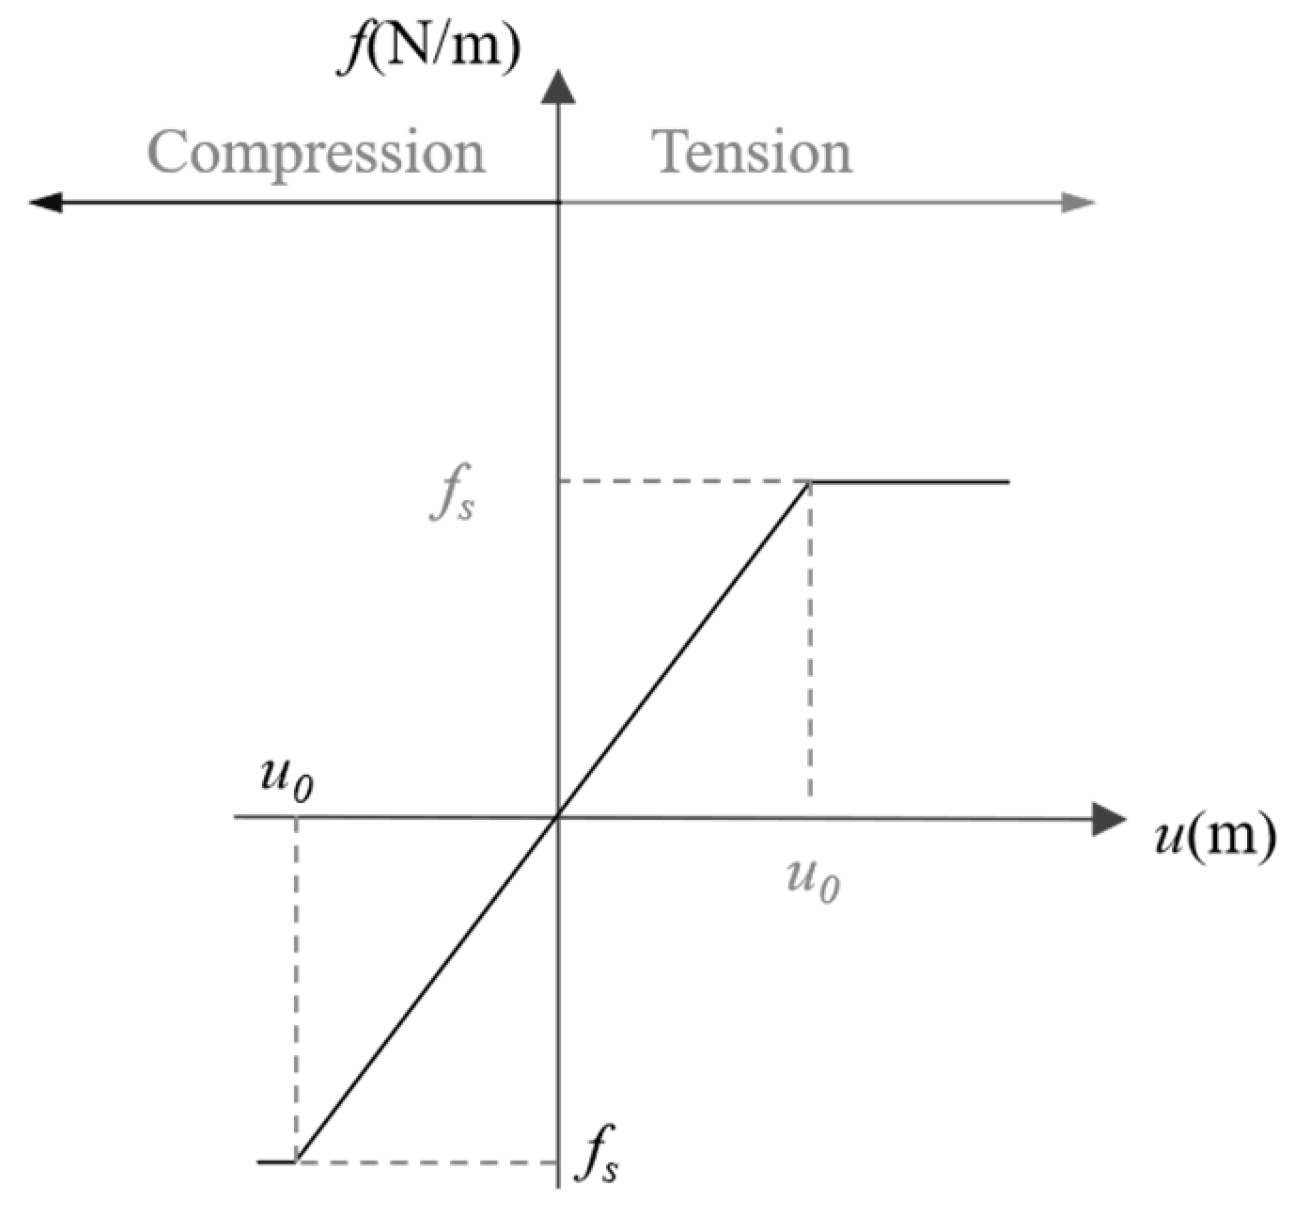
This study employs finite element analysis software to develop a three-dimensional free-field inverse fault-pipe numerical model (Figure 3). To minimize boundary size effects and ensure that pipeline response during fault sliding is unaffected by model geometry, the boundary dimensions are set to exceed three times the pipe diameter [27,28,29]. The fault dimensions are defined as 6.8 m × 8 m × 30 m. The pipeline has an inner diameter of 0.48 m, a wall thickness of 0.02 m, and is buried at a depth of 2.5 m. The soil is modeled using reduced integration continuum solid elements (C3D8R), while the pipeline is modeled with four-node shell elements (S4). The pipe endpoints are connected to CONN3D2 axial connection cells via linear axial constraints. These cells simulate equivalent boundary springs [30] commonly used in tunnel load-structure methods to model the axial interaction between the pipe and the surrounding system beyond its ends. They also represent the deformation response of an infinitely long pipe at the fault’s far end. The constitutive behavior of these nonlinear directional springs is described by Equations (29)–(31) [30]:
F = 2 f s A E Δ L 1 4 u 0
f s = π D α c c + π D H γ ¯ K 0 + 1 2 t a n φ
φ = f φ
where F is the external force on the boundary spring; f s   is the axial friction force between the pipe and the soil; α c is the cohesion coefficient; γ ¯ is the bulk density of fault zone; H is the distance from the center of the pipe to the ground surface; Δ L is the extension of the equivalent spring; A is the pipe cross-sectional area. The method of applying equivalent boundary springs is described in Section 3.4.
The model adopts structured meshing to refine the large deformation region of the pipeline, and in order to achieve the accuracy and convergence of the contact algorithm and to take into account the requirements of computational speed, the mesh length along the axial direction of the pipeline should not be greater than 0.3 times the diameter of the pipeline. In order to accurately capture the pipe’s buckling deformation, the model mesh size should be smaller than the pipe’s buckling critical wavelength ( λ < λ i = 3.44 D t 2 ) [31]. Therefore, a mesh size of 0.1 m was applied to the pipe in the refined region, while a coarser mesh of 0.25 m was used at the far ends. Additionally, finer meshes were employed in specific areas to capture potential local buckling of the pipe, with the numerical results interpolated to the model boundaries. This grid accuracy is sufficient to capture the local buckling deformation and mechanical response mechanisms of the pipes (see Section 3.6.).
It is important to note that, in actual geotectonic movements, large-scale fault ruptures rarely occur along a single smooth surface. Instead, they typically manifest as ruptures within complex fault zones composed of multiple fault surfaces or fracture networks. However, to focus on the fundamental response mechanisms of pipeline structures to fault activity and to simplify the model under limited computational resources, this study treats the fault as a single sliding surface, ignoring the fault zone width and its heterogeneity.

3.2. Material Properties

The soil is modeled using the Mohr–Coulomb constitutive model, incorporating Hooke’s law and Coulomb’s failure criterion. Strain softening is accounted for by specifying the cohesion (c = 40 kPa), friction angle (ϕ = 22°), and dilation angle (ψ = 0.01°). The soil’s elastic modulus is set to E = 40 MPa, with a Poisson’s ratio μ = 0.35. The soil density is consistent throughout, and the coefficient of static earth pressure, K0, is assigned a value of 0.54 (K0 = μ/(1 − μ)). The selection of K0 is based on the results of elastic analysis under undrained conditions. K0 can also be estimated using the μ of consolidated soil. The main parameters are summarized in Table 1.
The soil is assumed to be normally consolidated and under undrained conditions. The pipe is modeled using an elastic–plastic stress–strain constitutive model with nonlinear hardening to capture its plastic deformation under fault action. The stress–strain behavior of this model is illustrated in Equation (32) and Figure 4. Initially, the material exhibits a linear elastic response up to a strain of 0.02%, after which it transitions into plastic deformation and strain hardening stages [32]. The yield stress of the pipe is approximately 488 MPa, and the initial elastic modulus is 200 GPa.
ε = σ y E p σ σ y + λ σ σ y N
where ε is the total strain; σ is the stress; σ y is the yield stress; E p is the initial elastic model; λ and N are dimensionless parameters, equal to 0.53 and 14, respectively.

3.3. Soil–Pipe Interaction and Boundary Conditions

The fault is symmetrically divided into two equal parts, with β representing the angle between the fault plane and the pipeline’s normal direction. Two methods exist to simulate the fault fracture zone: one treats it as a low-strength medium; the other employs a nonlinear friction–contact interface model, which more realistically captures pipeline damage caused by fault sliding. In this model, the outer surfaces of materials with higher and lower stiffness serve as the target and contact surfaces, respectively. The normal and tangential interactions between the pipe and the fault are modeled using “hard” contact and “penalty” functions, respectively. The “hard contact” allows separation between the pipe and the surrounding soil after contact, while the “penalty” function simulates frictional resistance during fault-induced misalignment. The friction coefficient between the pipe and the fault is set to 0.3. The contact surfaces between the upper and lower fault blocks are modeled as face-to-face discrete interfaces, using “penalty” friction and “hard” contact to simulate fault-slip behavior. It is assumed that the shear strength at the fault interface is equal to the cohesion at the cross-section. The friction coefficient for the contact surfaces of the upper and lower blocks is set to 0.7.
In addition, due to the large slip deformation behavior of the fault, “allow large deformation” was enabled in the simulation, and the penalty stiffness and automatic stability parameters were set to 1 × 10⁶ N/m3 and 0.001, respectively, to ensure the convergence of the calculation. Under the initial conditions, the top surface of the model is treated as a free boundary. The bottom surface constrains displacements in the X, Y, and Z directions, except at the corners, which remain unconstrained. The side boundaries restrict displacements normal to their surfaces. Additionally, a spring load is applied to the ends of the pipe during the numerical simulation. To ensure the continuity of normal and tangential interactions during fault slip, appropriate constraints are applied in the direction perpendicular to the fault plane. This prevents local instability of the model caused by excessive gravitational loading and slip rates. The pipe ends are axially constrained using equivalent boundary springs. According to Liu’s [33] study on seismically active faults, a relationship between fault displacement and earthquake magnitude is established, as shown in Equation (33).
log 10 d m a x = M 2.247 log 10 ( k / L R ) + 0.6489 M + 0.0518 s 0.3407 v 2.9850 0.1363 M 2 + ( 0.0306 S L 1 + 0.2302 S L 2 + 0.5792 S L 3 ) + 0.3898 r 0.2749 ( 1 r ) R / 100
where M is the magnitude; R is the epicenter moment; H is the depth of the earthquake source; L is the rupture length. The fault misalignment is 1.2 m when the 50-year exceeding probability is 30%, and 0.99 m when the exceeding probability is 63% as obtained by the formula, so the fault misalignment is 0.3~1.5 m in this study.
To determine a reasonable internal operating pressure for the numerical simulation, the pipeline safety factor is set to 0.72 [34]. The calculation of Pmax is based on the ASME method [34] of calculation for pressure piping [22]:
p m a x = 0.72 ( 2 σ y t D )
where σy is the yield stress at failure of the pipe; t and D are the thickness and diameter, respectively; and the maximum operating pressure of the pipe is proportional to the diameter–thickness ratio.

3.4. Imposition of Boundary Equivalent Springs

Fault misalignment primarily affects buried pipelines through pipe deformation and soil–pipe interaction. During fault movement, the pipeline undergoes localized S-shaped bending and axial stretching. Friction and lateral pressure develop between the pipe and surrounding soil, generating lateral reaction forces that induce S-shaped yield deformation in the pipe to accommodate the imposed displacements. This large deformation is primarily concentrated in the curved section of the pipeline (Figure 5) [10,30]. In contrast, regions farther from the fault are predominantly influenced by axial friction. Axial slip occurs only when this friction force reaches its limiting value, a mechanism similar to that observed in axial pull-out tests of anchors.
In the extended region near the pulling end (0 < X < L), relative sliding occurs between the pipe and the surrounding soil, and the frictional resistance reaches its limiting value. In contrast, within the segment 0 < X < L1, no relative displacement is observed between the pipe and the soil. Here, the soil provides a static frictional response, and the frictional resistance gradually decreases to zero toward the far end of the “curved section”. This segment behaves as an elastic foundation beam. To calculate the axial force distribution along the pipeline, different regions are analyzed under distinct loading conditions. For “straight sections”, the problem can be simplified as a one-dimensional axial deformation model, where the pipe–soil interaction is described using a continuous medium approach.
For pipeline segments within the static friction zone, the axial stress is derived based on elastic foundation beam theory [22,35]. In contrast, for segments within the slip zone, the axial force is determined using static equilibrium equations (Figure 6). The total axial elongation is then obtained by integrating the strain distribution derived from the material constitutive relationship. The corresponding calculation equations are as follows:
Δ L = t a n h α L α Δ L , Δ L u 0
Δ L = Δ L u 0 2 1 t a n h 2 α L e 1 , Δ L > u 0
α = k E 1 A
k = f s u 0
Δ L = ± F F 0 k A E 1 ,   Δ L < u 0
Δ L = ± u 0 2 ± F F 0 2 2 A E 1 f S ,   N 0 F F 1
Δ L = Δ L i 1 ± 1 2 f S A E i [ F 2 + 2 A E i ε i 1 F i 1 F + F i 1 2 2 A E i ε i 1 F i 1 ]
where L α is the length of the non-anchored section of the pipe; L e is the length of the static friction action generated at the free end of the pipe by applying the axial force F; A is the cross-sectional area of the pipe; E 1 is the modulus of elasticity of the pipe; k is the frictional stiffness of the contact interface; f s is the friction on the contact surface; u 0 is the amount of the relative slip of the pipe; Δ L is the amount of elongation assuming an infinite length of the pipe; ε i is the nominal strain; and F i is the axial force.
In the case that the pipe has not yet yielded, its end deformation can be regarded as an elastic response, and the soil–pipe interaction can be calculated by the “boundary spring model” (Figure 7); the pre-stress F0 generated by thermal expansion and contraction or internal pressure during the operation of the pipeline, and it is assumed that both ends of the pipeline are in a fully restrained state at this stage. N0 is the axial force at the critical relative pipe–soil displacement, assuming that axial stretching occurs at infinite length of the pipe. F1 represents the yield limit of the pipe material in the axial direction, i.e., the minimum axial force required for it to deform plastically, as detailed in Equations (42)–(44).
F 0 = A ν σ y E α T Δ T
N 0 = F 0 ± A E 1 α u 0 = F 0 ± A E 1 f s u 0
F 1 = A σ y / 2 ± σ 1 2 3 σ y 2 / 4
where α T is the coefficient of thermal expansion; ν is Poisson’s ratio; when the pipe has just begun to slip with the soil, the relative displacement is u0—at this time, the corresponding axial force of the pipe is N0, which is an important parameter to measure the starting point of the slip; and σ y is the circumferential stress under the action of the internal pressure of the pipe.

3.5. Computational Simulation Steps

To evaluate the pipe’s performance under varying internal pressures, diameter-to-thickness ratios, and slips, the numerical simulation was divided into three steps:
Step 1: Set the mesh size of the pipe and the surrounding soil to be identical. Then, apply the sub-model technique to interpolate the global model’s results onto the sub-model boundary.
Step 2: Determine the initial stress–strain state of the pipeline–fault via static analysis, incorporating gravity load and pipeline operating pressure. This step realistically simulates the hydraulic pressure during oil and gas transport.
Step 3: Apply forced linear displacement loads in the axial, lateral, and vertical directions to the sliding fault using dynamic implicit loading, while keeping the fixed disk stationary. Throughout loading, the pipe’s stress–strain state is obtained by solving the equilibrium equations via the Newton–Raphson method.

3.6. Validation of the FE Model

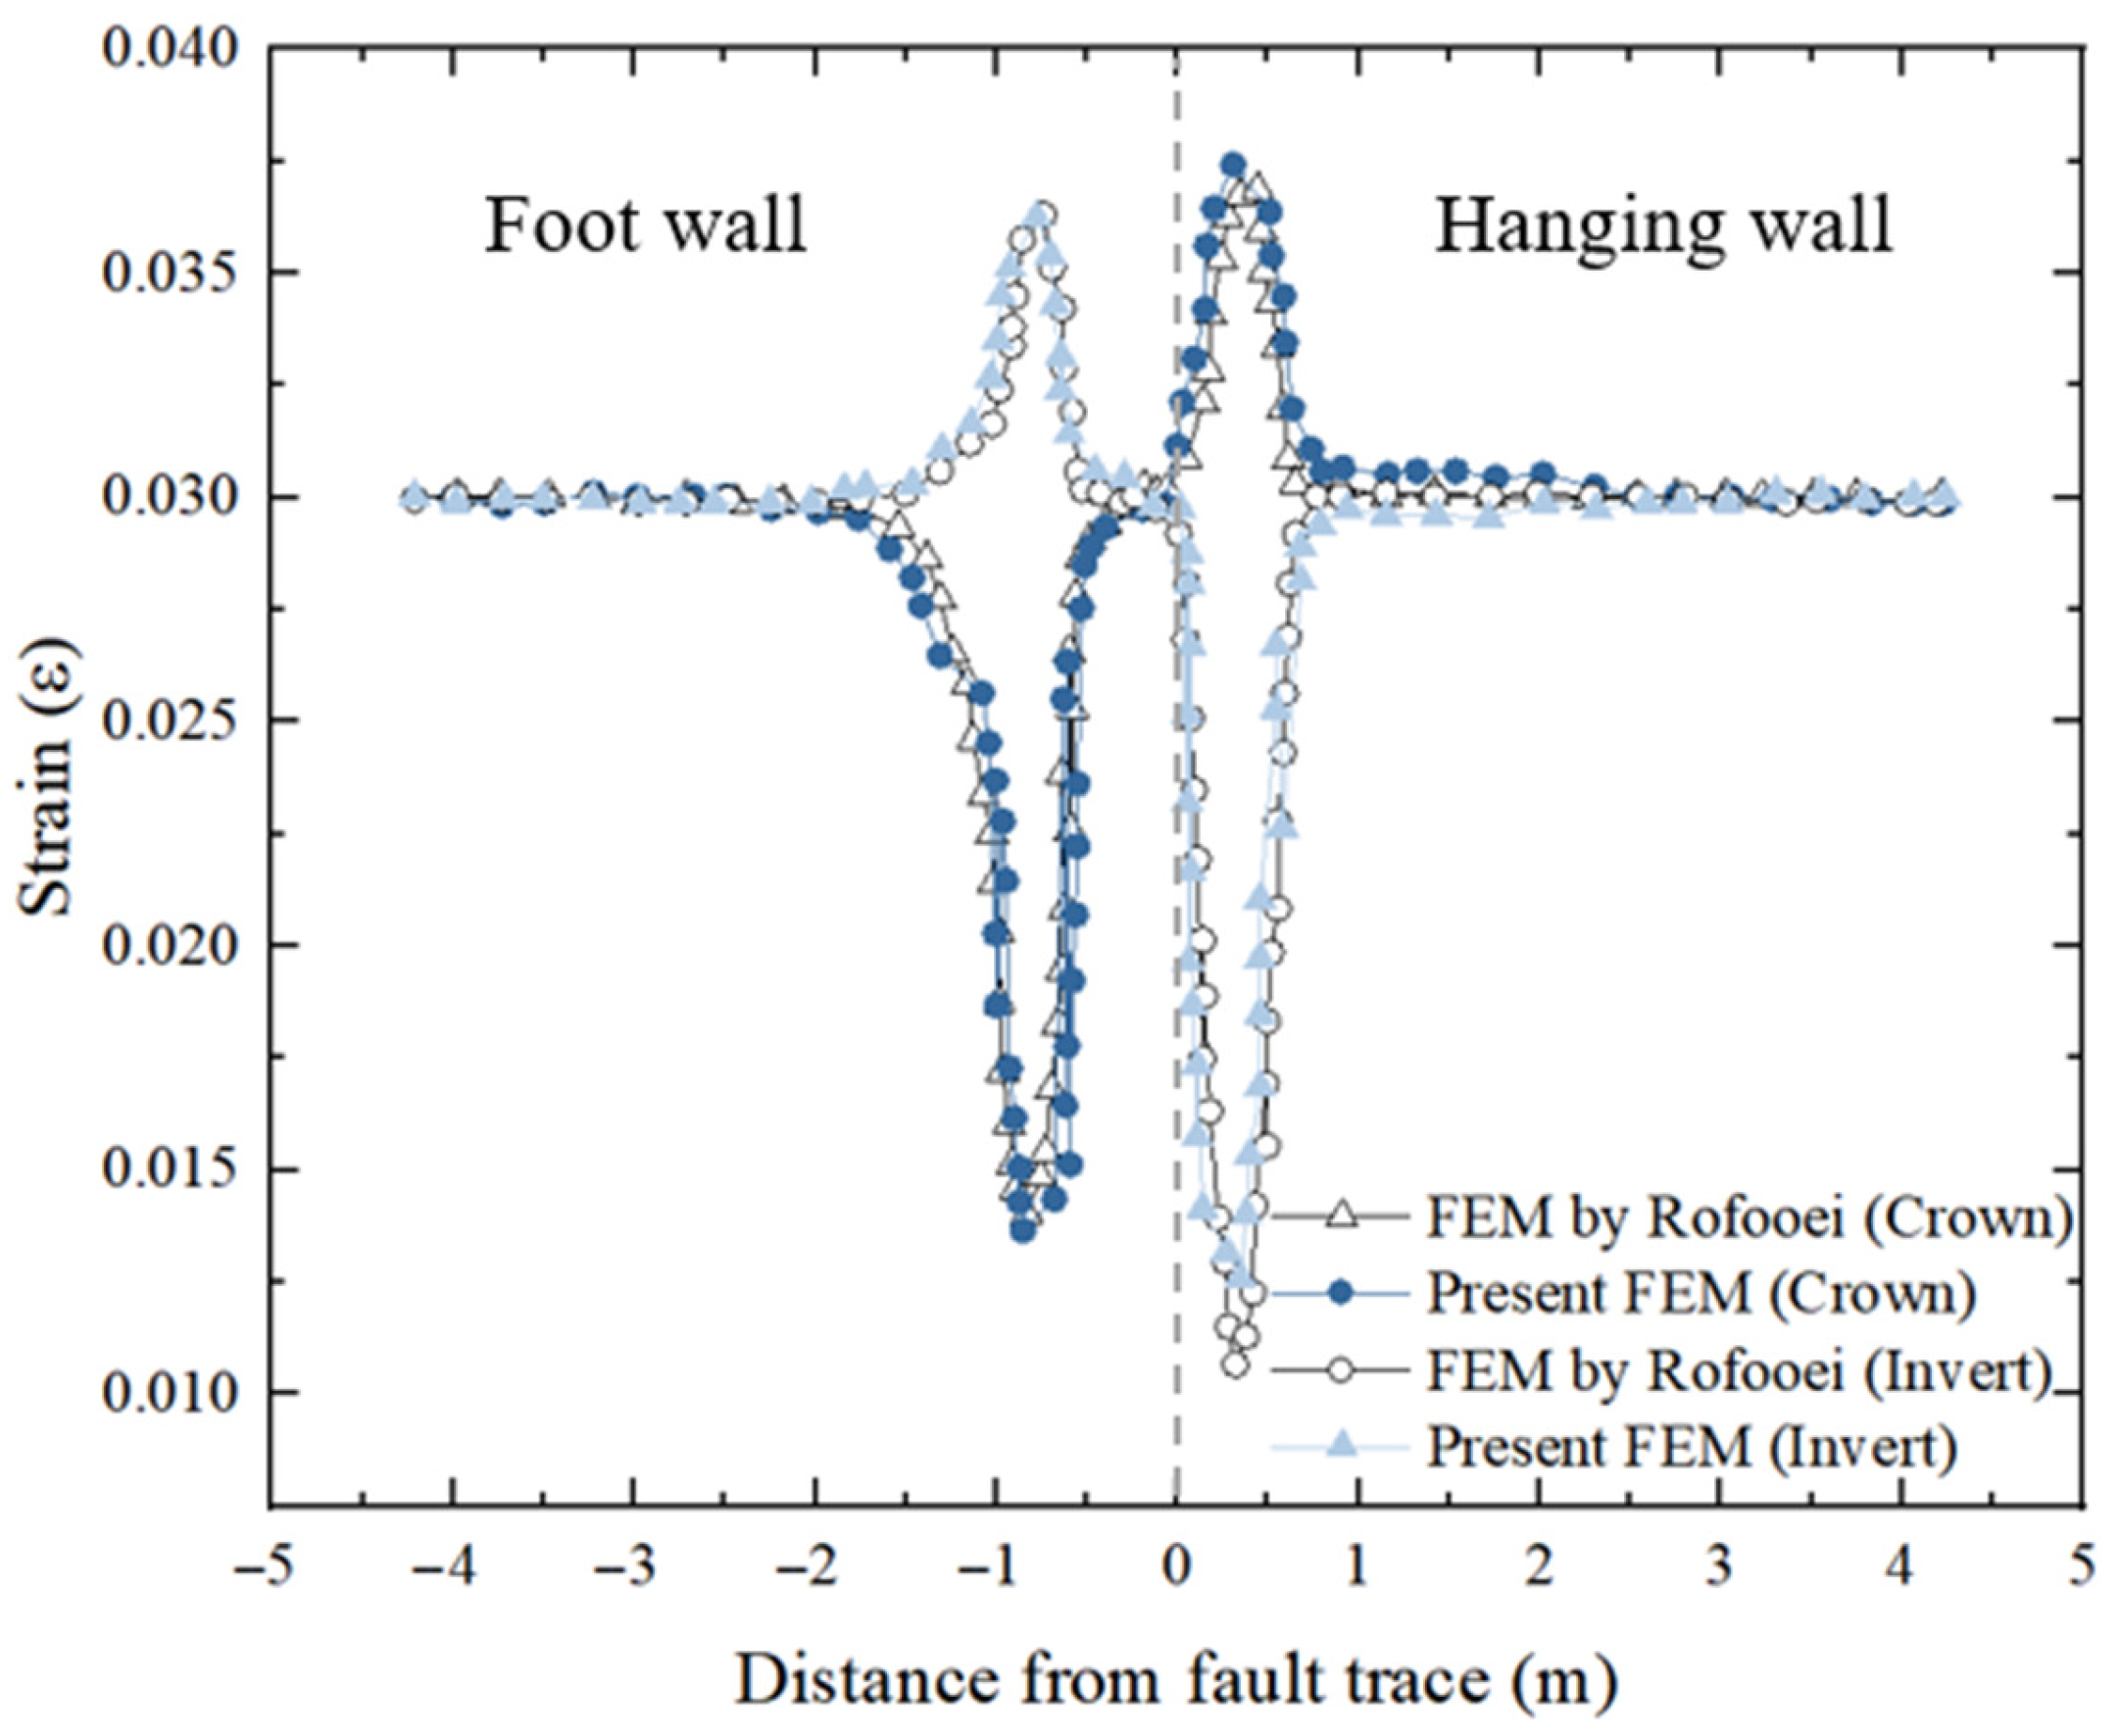
To verify the reliability of the model developed in this study, the typical model by Rofooei et al. [36] was selected for comparison. The key physical parameters they provided (see Table 2) were fully incorporated into the simulation. Keeping boundary conditions, load types, and material parameters consistent, the responses of the pipeline structure under fault misalignment were comparatively analyzed for both models. The model utilized by Rofooei et al. [36] adopted a fine mesh with a cell size of 0.5D within a range of 100D on either side of the fault, whereas our model employed a fine mesh of 0.1 m in the pipe buckling zone. The boundary conditions of the two models were consistent. The simulation results demonstrate strong agreement between the present model and those of Rofooei et al. [36] (Figure 8). The model not only maintains good consistency in the overall deformation trend but also captures the maximum tensile and compressive strains at key locations (e.g., 0.5 m and 1 m from the fault center). These are the primary sites where the pipeline first yields and subsequently enters the destabilized damage stage. At a distance of −0.5 m from the fault center, the two models yielded strains of 0.037% at the invert and 0.0127% at the crown, respectively, with relative errors ranging from 1% to 2%.
Additionally, the model accurately reproduces the pipeline’s stress–strain evolution—from initial elastic response and yielding progression to final failure—under non-uniform loading caused by fault misalignment. This demonstrates strong physical consistency and numerical stability. These results indicate that the model is well-calibrated in parameter selection and constitutive relationships, with high predictive capability and engineering relevance in reflecting fault activity’s impact on pipeline structures, thereby verifying its reliability and accuracy.
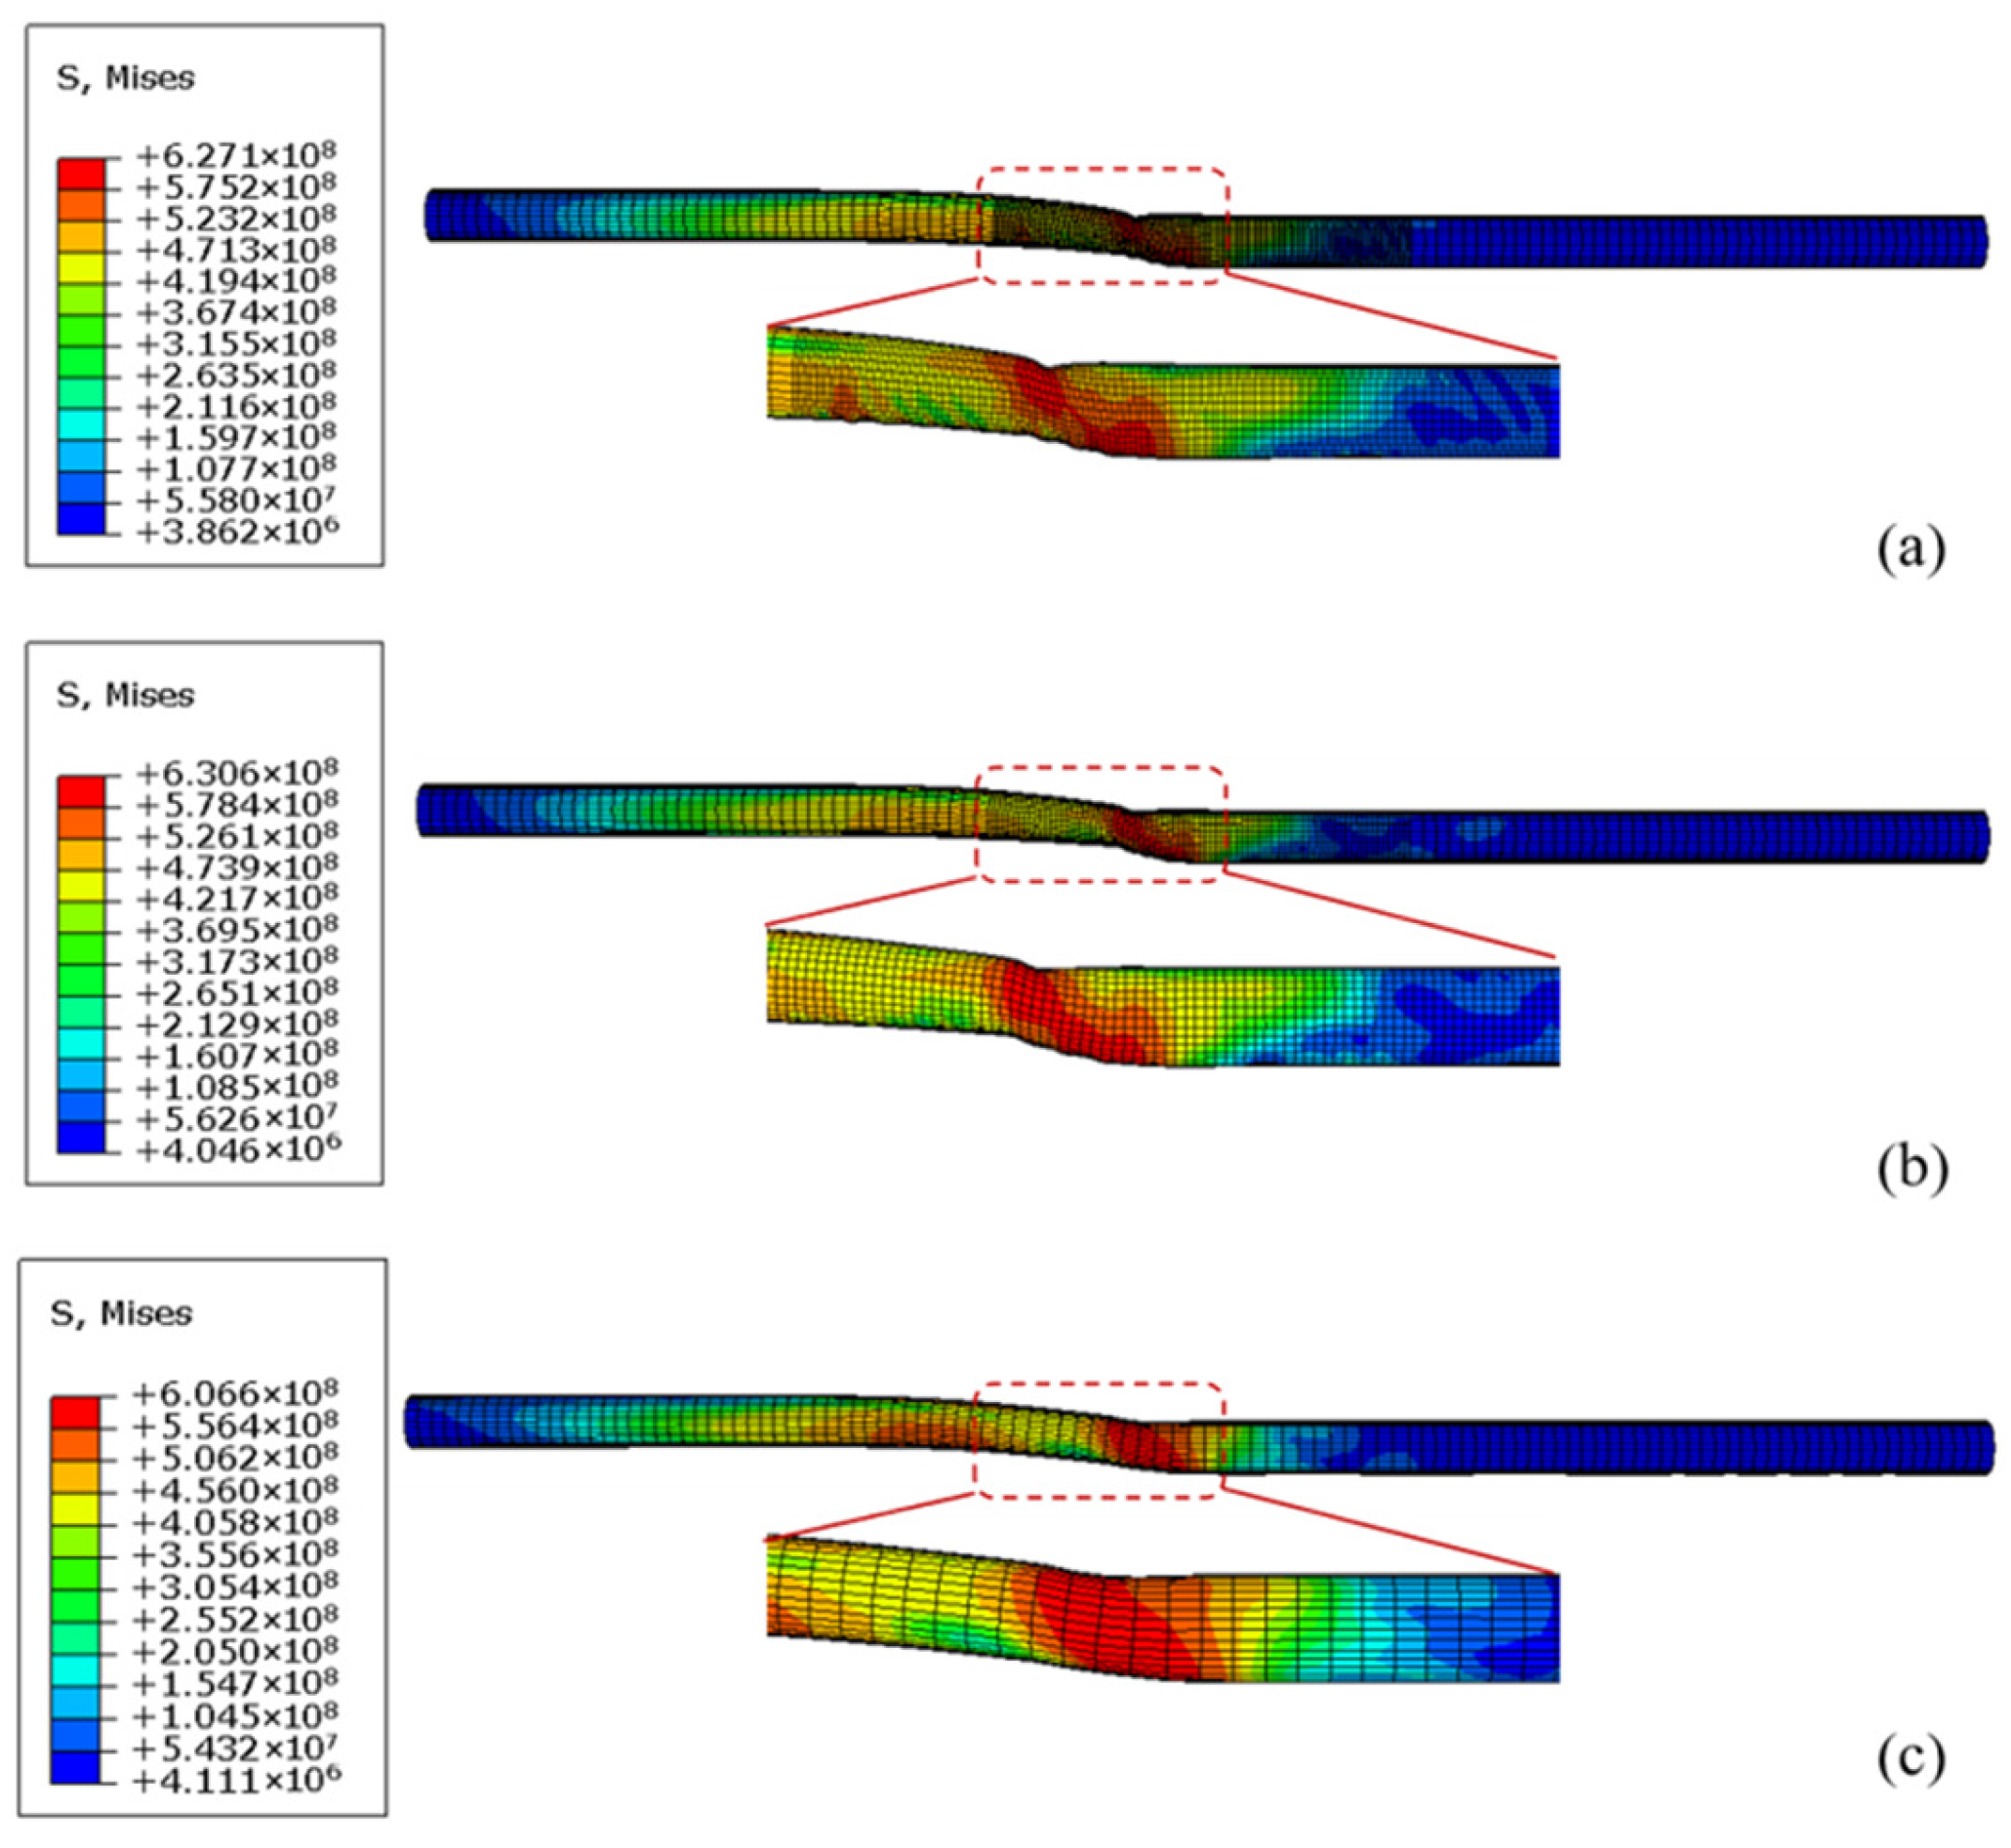
To assess the model’s mesh sensitivity, three distinct mesh densities were implemented. Analysis of the stress distribution reveals that the overall trends are consistent across the three element sizes (0.05 m, 0.1 m, and 0.3 m), all qualitatively capturing the fundamental stress characteristics (Figure 9). The 0.05 m fine mesh, while offering exceptional detail, incurs excessive computational burden and time investment, making it unnecessary for applications not requiring ultra-high precision. Conversely, the 0.3 m coarse mesh introduces noticeable distortion in the stress contours, with abrupt local stress transitions that compromise result reliability. The 0.1 m mesh strikes an optimal balance: it retains sufficient detail to accurately represent stress variations while significantly reducing computational demands. This configuration effectively captures both general stress patterns and critical values without unnecessary computational overhead. Consequently, considering the dual priorities of accuracy and efficiency, the 0.1 m element length mesh was selected for the model.

4. Analysis of Numerical Simulation Results

4.1. The Effect of Fault Displacement on the Mechanical Response of Pipelines

In order to study the influence of different fault displacements on the structural safety of buried pipelines, this paper selects a composite fault formed by the combination of a right-turn strike-slip fault and a reverse fault as a typical research object. Considering that faults exist in nature in the form of inclination, the inclination angle of the fault is set to 45°. To analyze the spatial distribution of fault activity on the pipeline, the angle between the fault plane and the pipeline axis is set to 90°, making the fault orthogonal to the pipeline. To simplify parameter settings and facilitate analysis of the combined effect of displacements in all directions, the fault misalignment components in X, Y, and Z directions are assumed equal, i.e., Dx = Dy = Dz. The pipeline burial depth is set to 2.5 m to simulate typical shallow laying conditions. The soil model and parameter settings follow those in the previous section to ensure model consistency and result comparability. Additionally, to simulate high-pressure conveying conditions, a constant internal pressure is applied throughout the analysis. This better reflects the pipeline’s structural response to fault misalignment under high internal pressure. Fault displacements are set between 0.3 and 1.5 m.
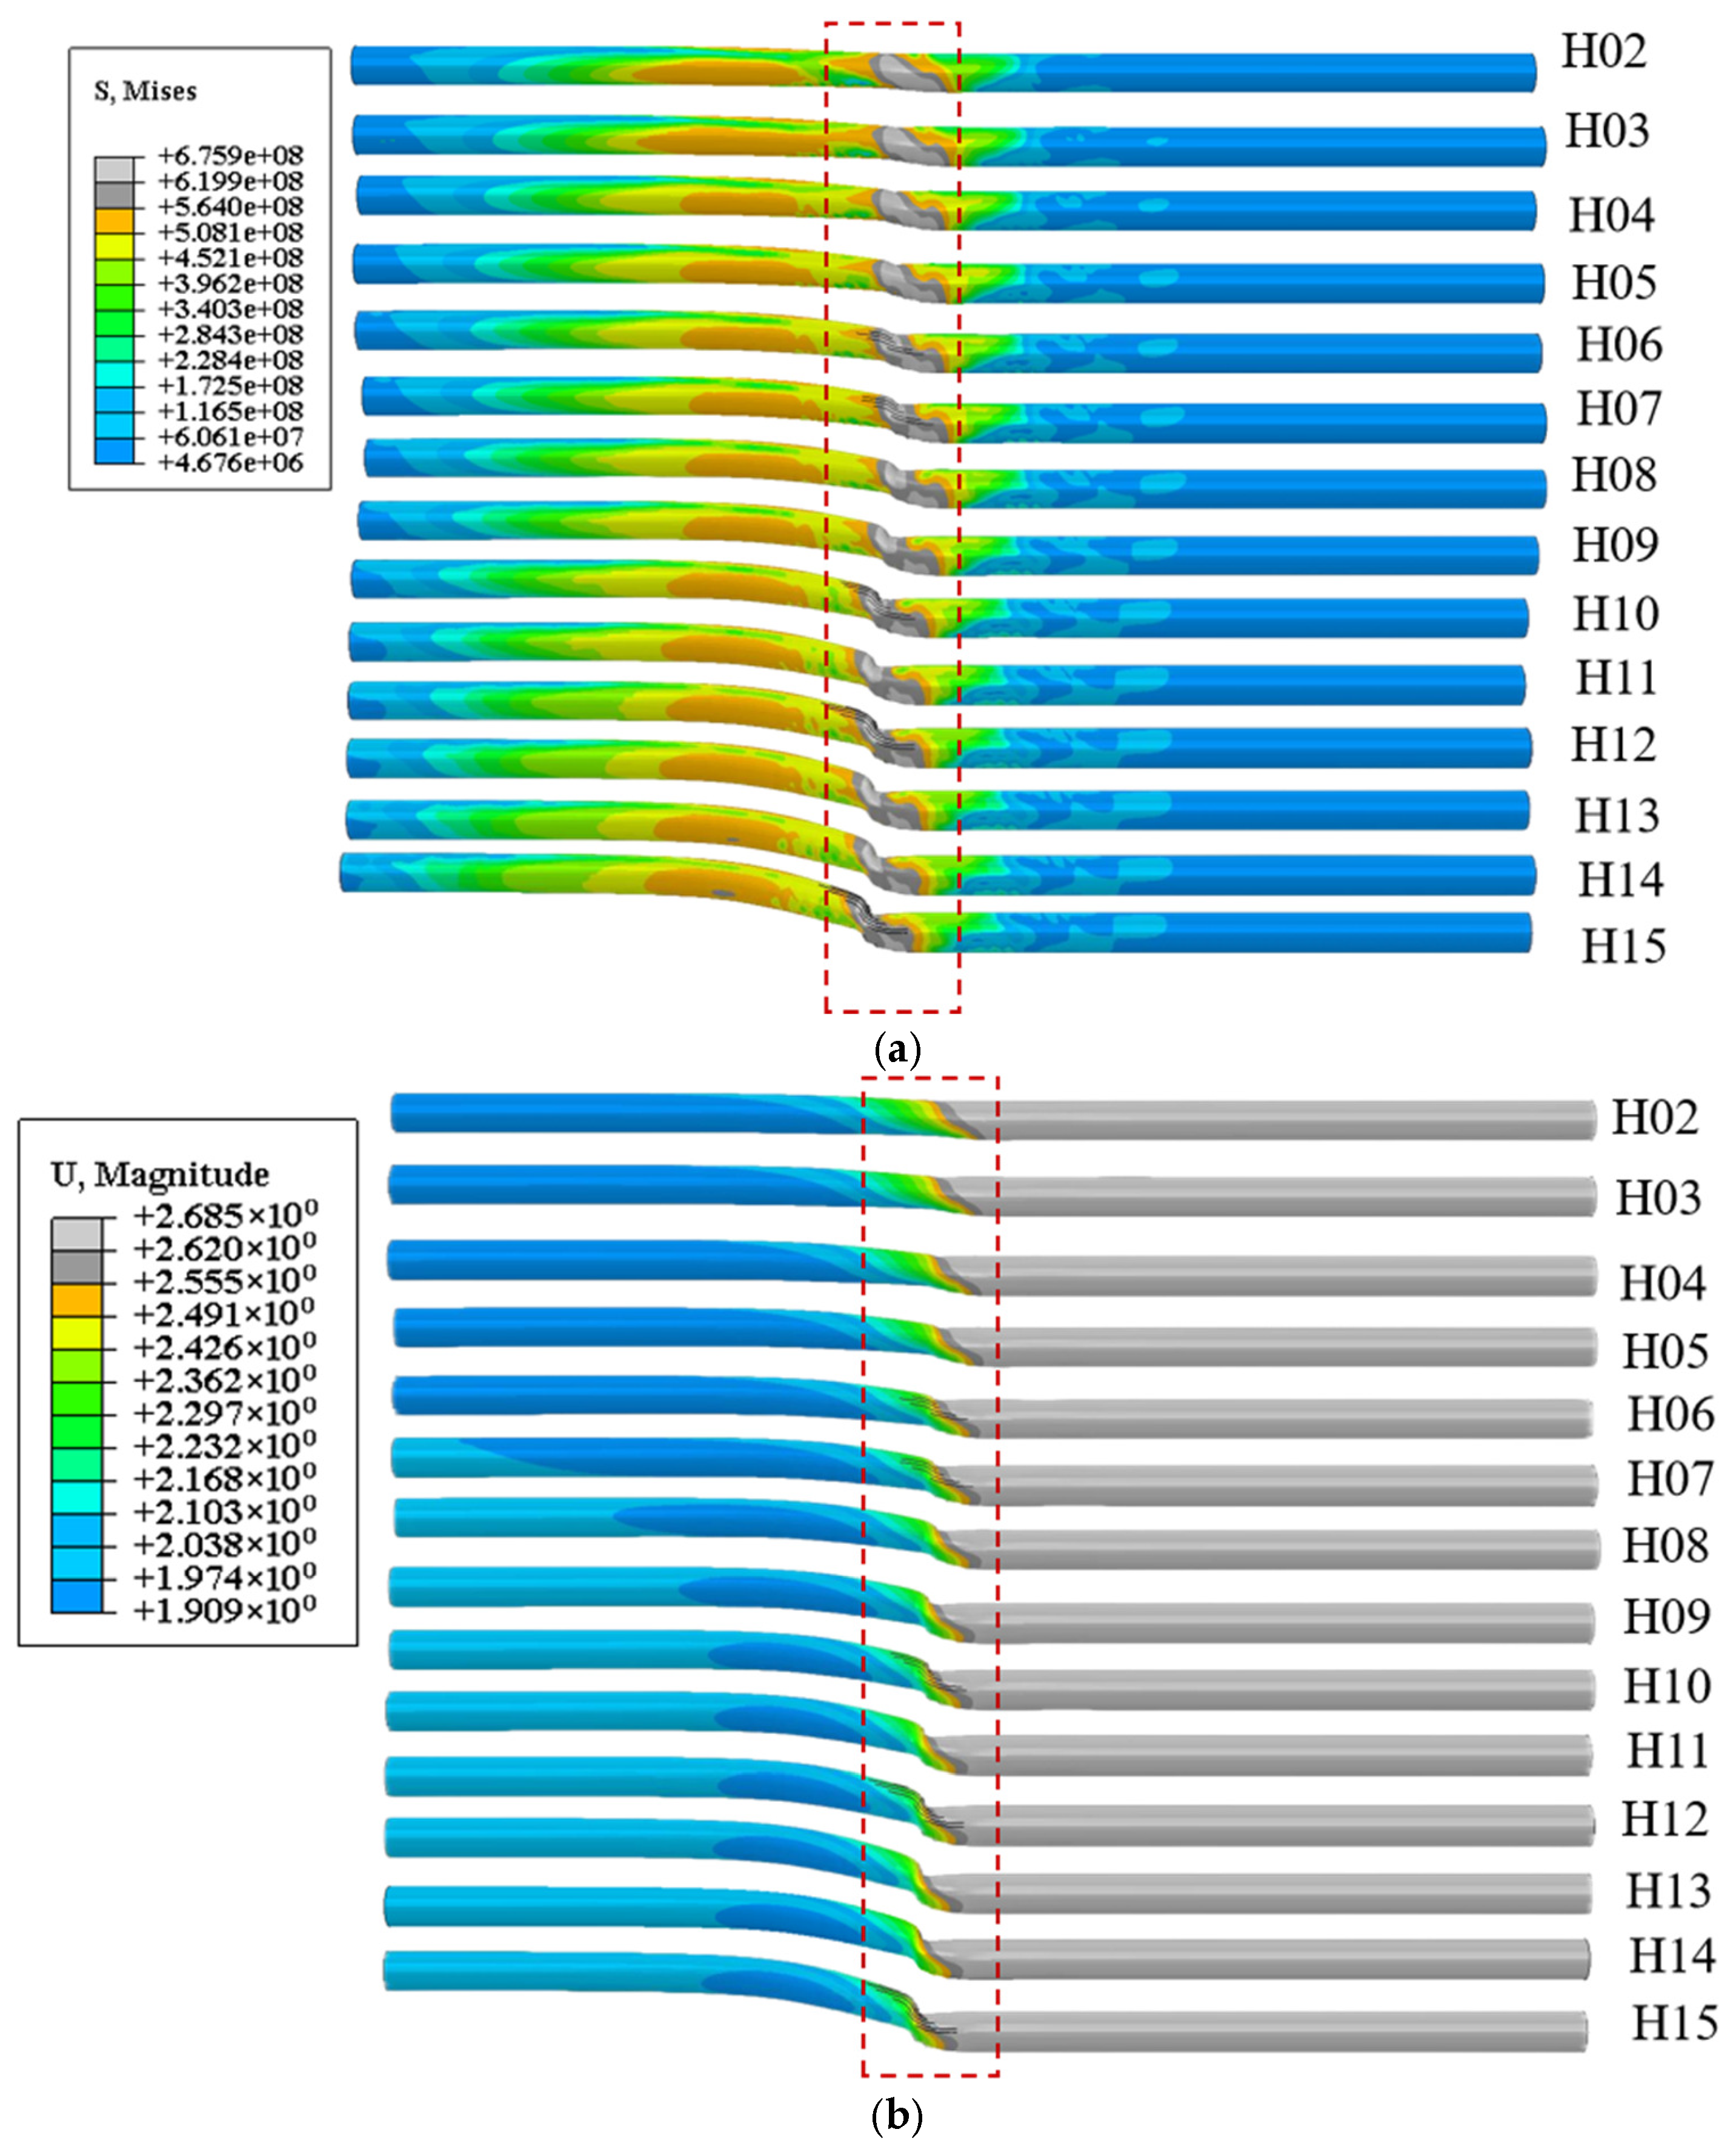
Figure 10 shows the displacement and equivalent stress of the pipeline under various fault misalignments, illustrating the typical damage evolution caused by fault activity. As fault displacement increases, the pipeline near the fault junction first exhibits a slight lateral offset, then gradually develops an “S”-shaped bending pattern. This indicates that bending and buckling become the dominant deformation modes. During moderate misalignment, displacement across the fault section further increases, and the peak displacement shifts outward. The pipe gradually forms a plastic hinge on the compression side, accompanied by intensified pressure shear on the inner wall and local folding deformation. Under large misalignment, the stress concentration area significantly enlarges, and the von Mises stress on the compression side exceeds the pipeline material’s yield strength. This leads to severe local buckling. Simultaneously, the pipe’s outer tensile region is at risk of circumferential cracking due to the combined effects of bending, tension, and internal high pressure.
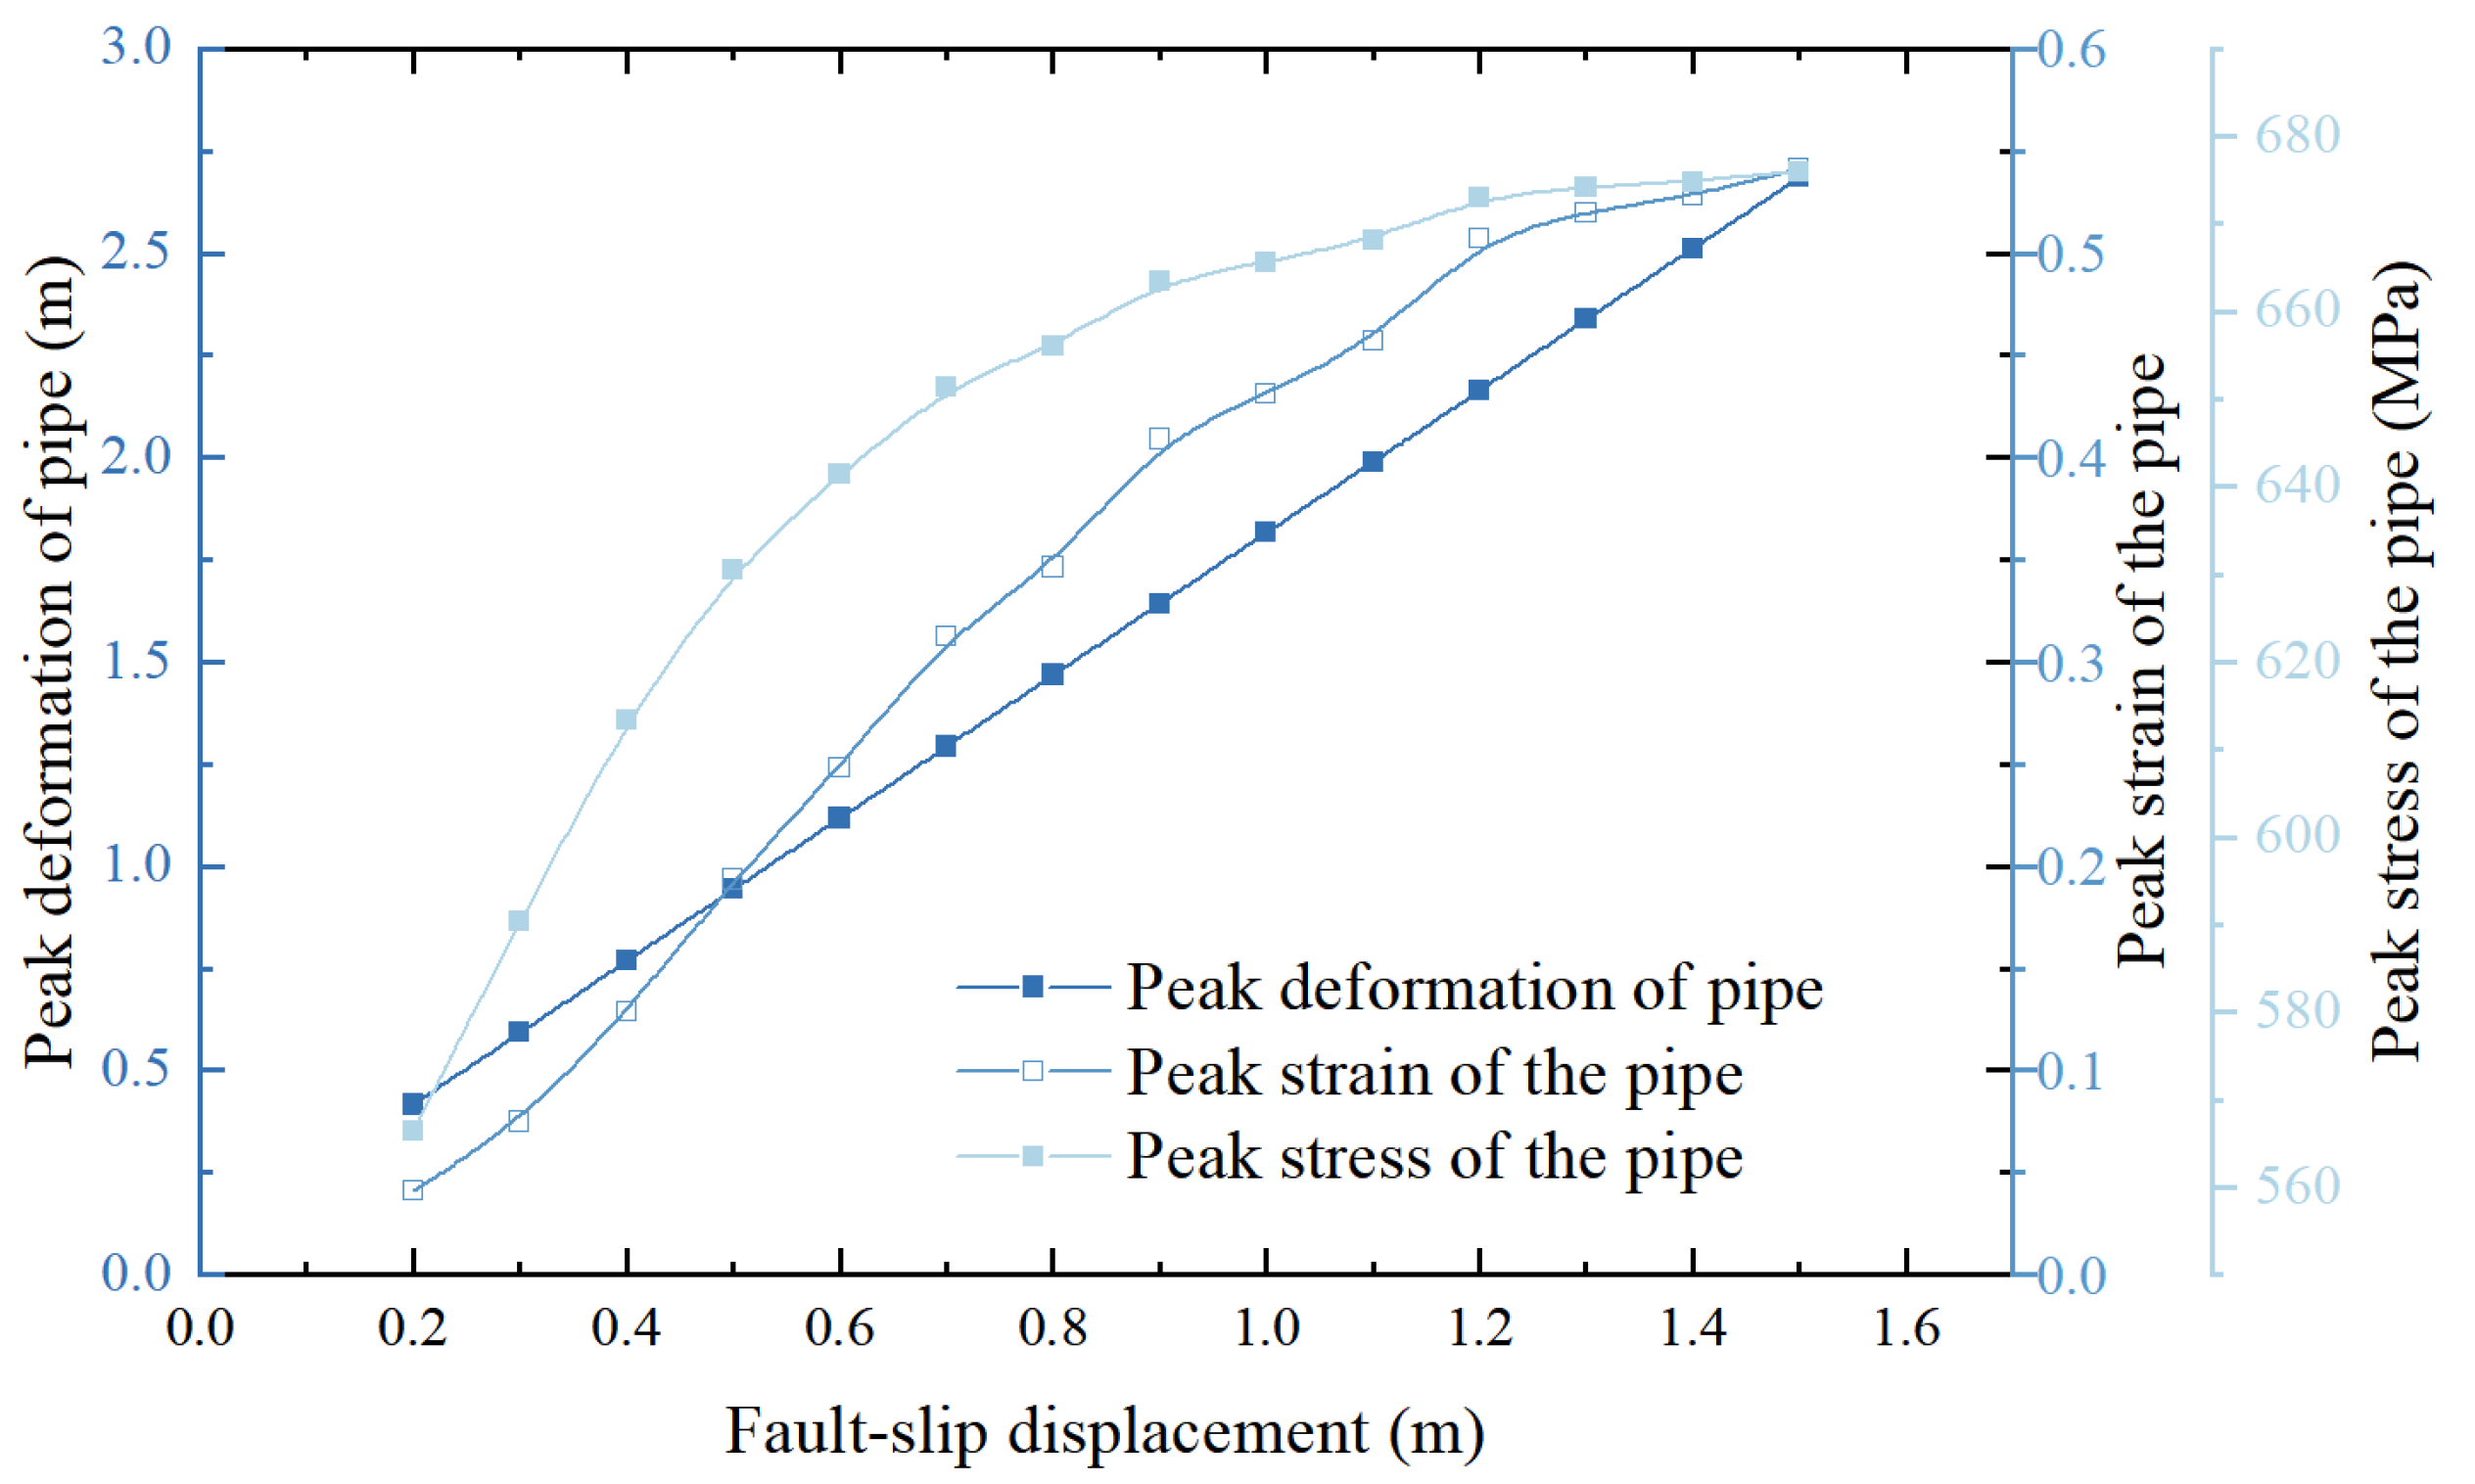
Figure 11 shows the maximum deformation, strain, and stress responses of the pipeline structure along the misalignment direction under varying fault misalignment conditions. Overall, all three responses increase with fault misalignment, but their growth rates and patterns differ, reflecting the structure’s nonlinear response evolution. During the initial misalignment stage (0–0.4 m), the pipeline’s structural response remains in the linear elastic range. Stress, strain, and deformation increase approximately linearly with misalignment, and no significant buckling or local damage occurs. Among these responses, stress increases more rapidly and reaches the material’s yield strength, indicating that the pipe experiences significant tensile and compressive stress concentrations at this stage. In the medium misalignment stage (0.4–1.0 m), the pipe’s response exhibits nonlinear intensification. The growth rate of the maximum stress curve slows and plateaus, indicating that parts of the pipe have yielded and the bearing capacity approaches its limit. Meanwhile, maximum strain and deformation continue to rise rapidly, with the strain curve’s slope increasing significantly. This reflects the expansion of local plastic deformation and the development of buckling. This stage marks the critical transition of the pipeline structure from elastic stability to nonlinear instability. In the large misalignment stage (1.0–1.5 m), the maximum stress stabilizes around 680 MPa. Meanwhile, maximum strain and deformation continue to increase but at a decreasing rate, entering a plastic deformation-dominated phase. At this stage, the pipeline exhibits significant bending and localized folding, with a risk of tearing or rupture in high-strain regions (Figure 10).
The response of buried pipelines to fault misalignment typically progresses through three stages: elastic, elastic–plastic transition, and plastic damage. In the initial stage, with small fault displacement, the pipe exhibits a linear elastic response, where stress and strain follow Hooke’s law ( σ = E · ϵ ), and deformation increases linearly with fault misalignment. As misalignment increases, localized stress surpasses the material’s yield strength, initiating the elastic–plastic transition stage. At this stage, the pipe’s equivalent stress is determined by the von Mises yield criterion:
σ e q = 1 2 σ 1 σ 2 2 + σ 2 σ 3 2 + σ 3 σ 1 2 σ y
where σ 1 , σ 2 , σ 3 are the principal stresses; σ e q is the equivalent stress; σ y is the yield strength.
Upon yielding, stress growth slows and reaches a plateau, while strain increases significantly and the plastic zone expands gradually. As misalignment worsens, the pipe enters the plastic damage stage. At this stage, the structure, either wholly or locally yielded, shows stable stress, while deformation and strain continue to increase, potentially causing destabilizing damage. During the large deformation stage, displacement response is dominated by geometric factors and fault misalignment, approximated as follows:
Δ m a x D f L 2 E I
where Df is the fault misalignment, L is the length of the pipe affected, and I is the cross-section moment of inertia.
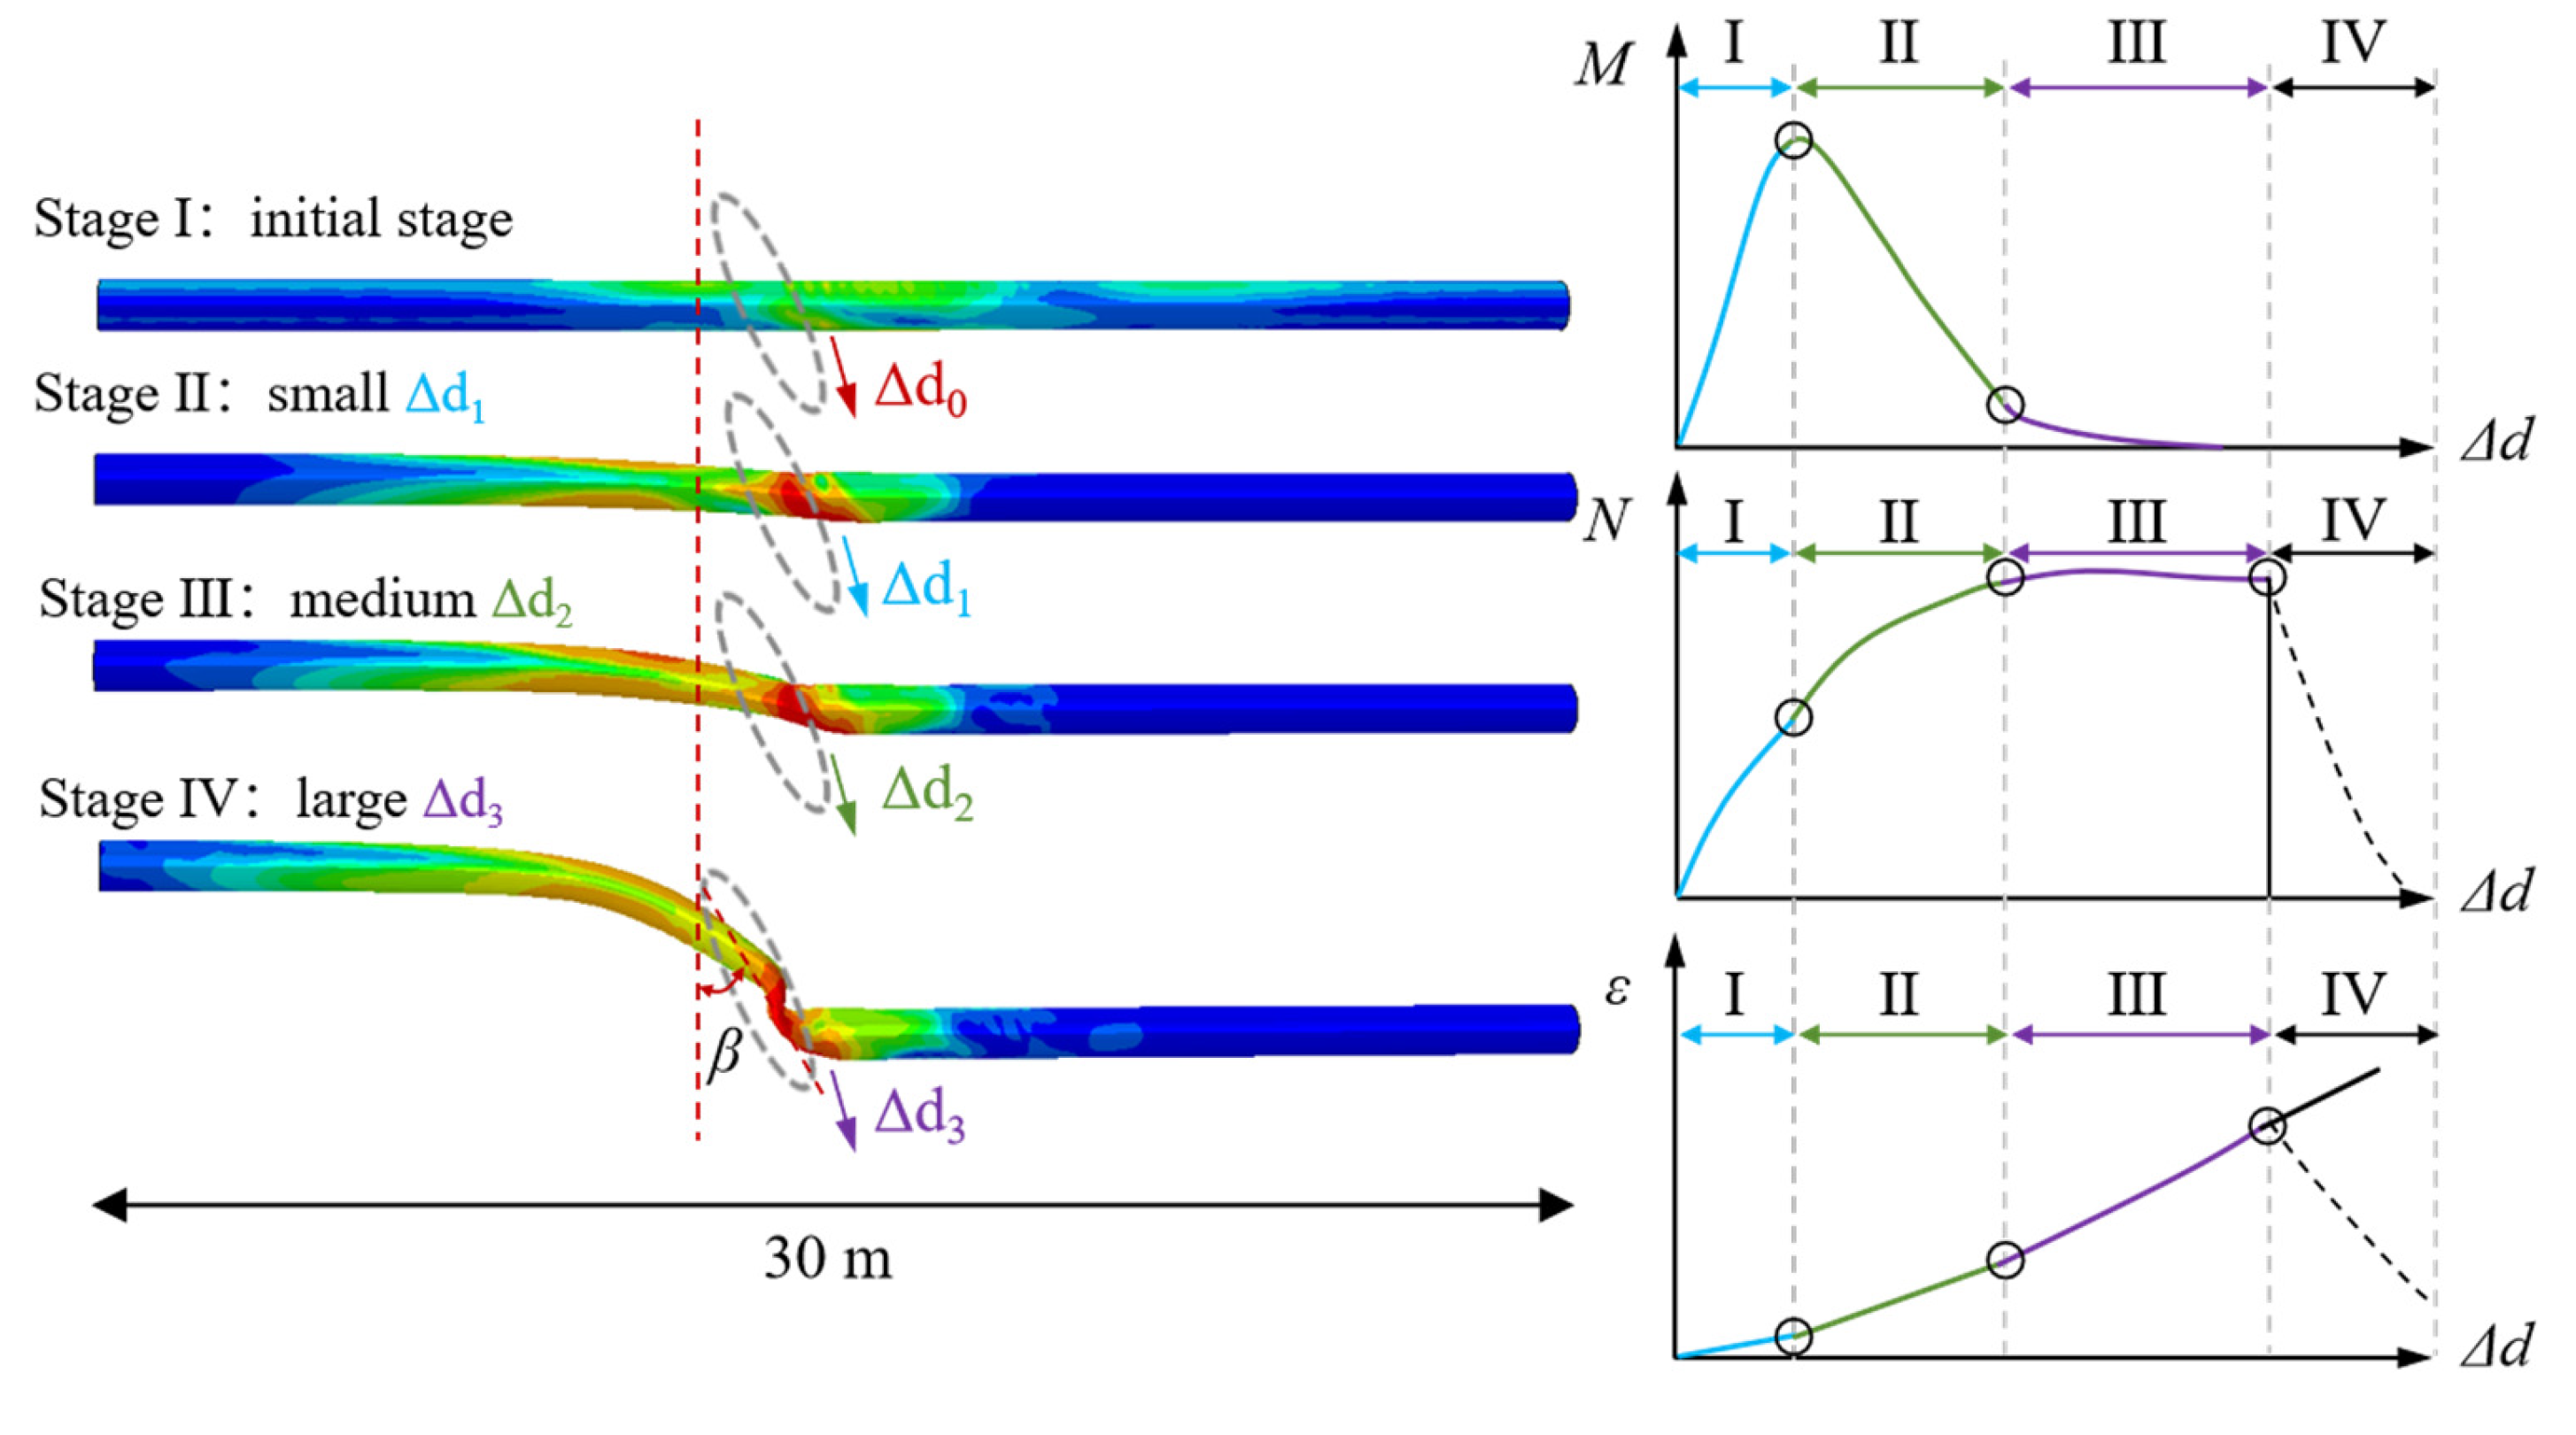
Figure 12 illustrates the four-stage mechanical response process, clearly demonstrating the pipe’s failure evolution under misalignment-induced non-uniform deformation. This process encompasses elastic response, yield propagation, plastic development, and fracture failure [32,37]:
I.
In the early stage of fault misalignment (small Δd), the pipeline remains in the elastic response range with no significant structural deformation. As fault displacement has not reached the pipe’s core, bending moment rapidly accumulates and peaks near the fault, reflecting structural constraints reinforcing local bending. Axial force increases slightly with misalignment, indicating the pipe’s overall axial stress state. At this stage, strain distribution is uniform, structural stiffness remains intact, and the pipeline maintains overall continuity and stability.
II.
With increasing fault misalignment, the bending moment gradually decreases, indicating yielding near the fault and the formation of a plastic hinge. Local structural stiffness decreases, and bending capacity weakens progressively. Simultaneously, axial force increases slowly, indicating gradual intensification of axial tensile and compressive effects. Strain response becomes asymmetric, with increasing deformation difference between tensile and compressive sides. Plastic strain concentrates locally, indicating the onset of nonlinear structural evolution.
III.
During the pipeline’s plastic development stage, fault misalignment is pronounced, causing widespread plastic deformation. The bending moment stabilizes at a low level, indicating that the structure’s deformation capacity has reached saturation. Axial force plateaus or increases slightly, reflecting the tensile and compressive loads nearing their limits. Strain grows rapidly, especially in the tensile region of the large-strain zone, as structural ductility gradually exhausts, creating a latent risk of fracture. At this stage, the pipeline approaches a strongly nonlinear response.
IV.
When fault misalignment reaches a critical value, the pipe’s local structure fails completely, resulting in rupture or fracture. At this stage, the bending moment rapidly decays to near zero, as the fractured section can no longer transfer bending stiffness. Axial force also drops sharply due to structural fracture, interrupting the mechanical load path and preventing axial load transfer. Strain exhibits a sudden drop or release after reaching its peak, marking structural instability and failure. This phase represents the final transition from “deformation” to “damage” of the pipeline caused by the fault.
Overall, fault misalignment causes the pipeline to evolve through stages of overall bending and buckling, local folding and buckling, and outer tear damage. The damage concentrates near the fault junction and extends approximately 1–1.5 times the pipe diameter on both sides. The results indicate that fault activity significantly threatens shallow-buried high-pressure pipelines. Design considerations must include fault displacement tolerance, compression-side buckling instability, and risk of tensile fracture. Measures such as structural reinforcement and burial depth optimization should be implemented to enhance pipeline safety across active fault zones.

4.2. Effect of Pipe Diameter-to-Thickness Ratio

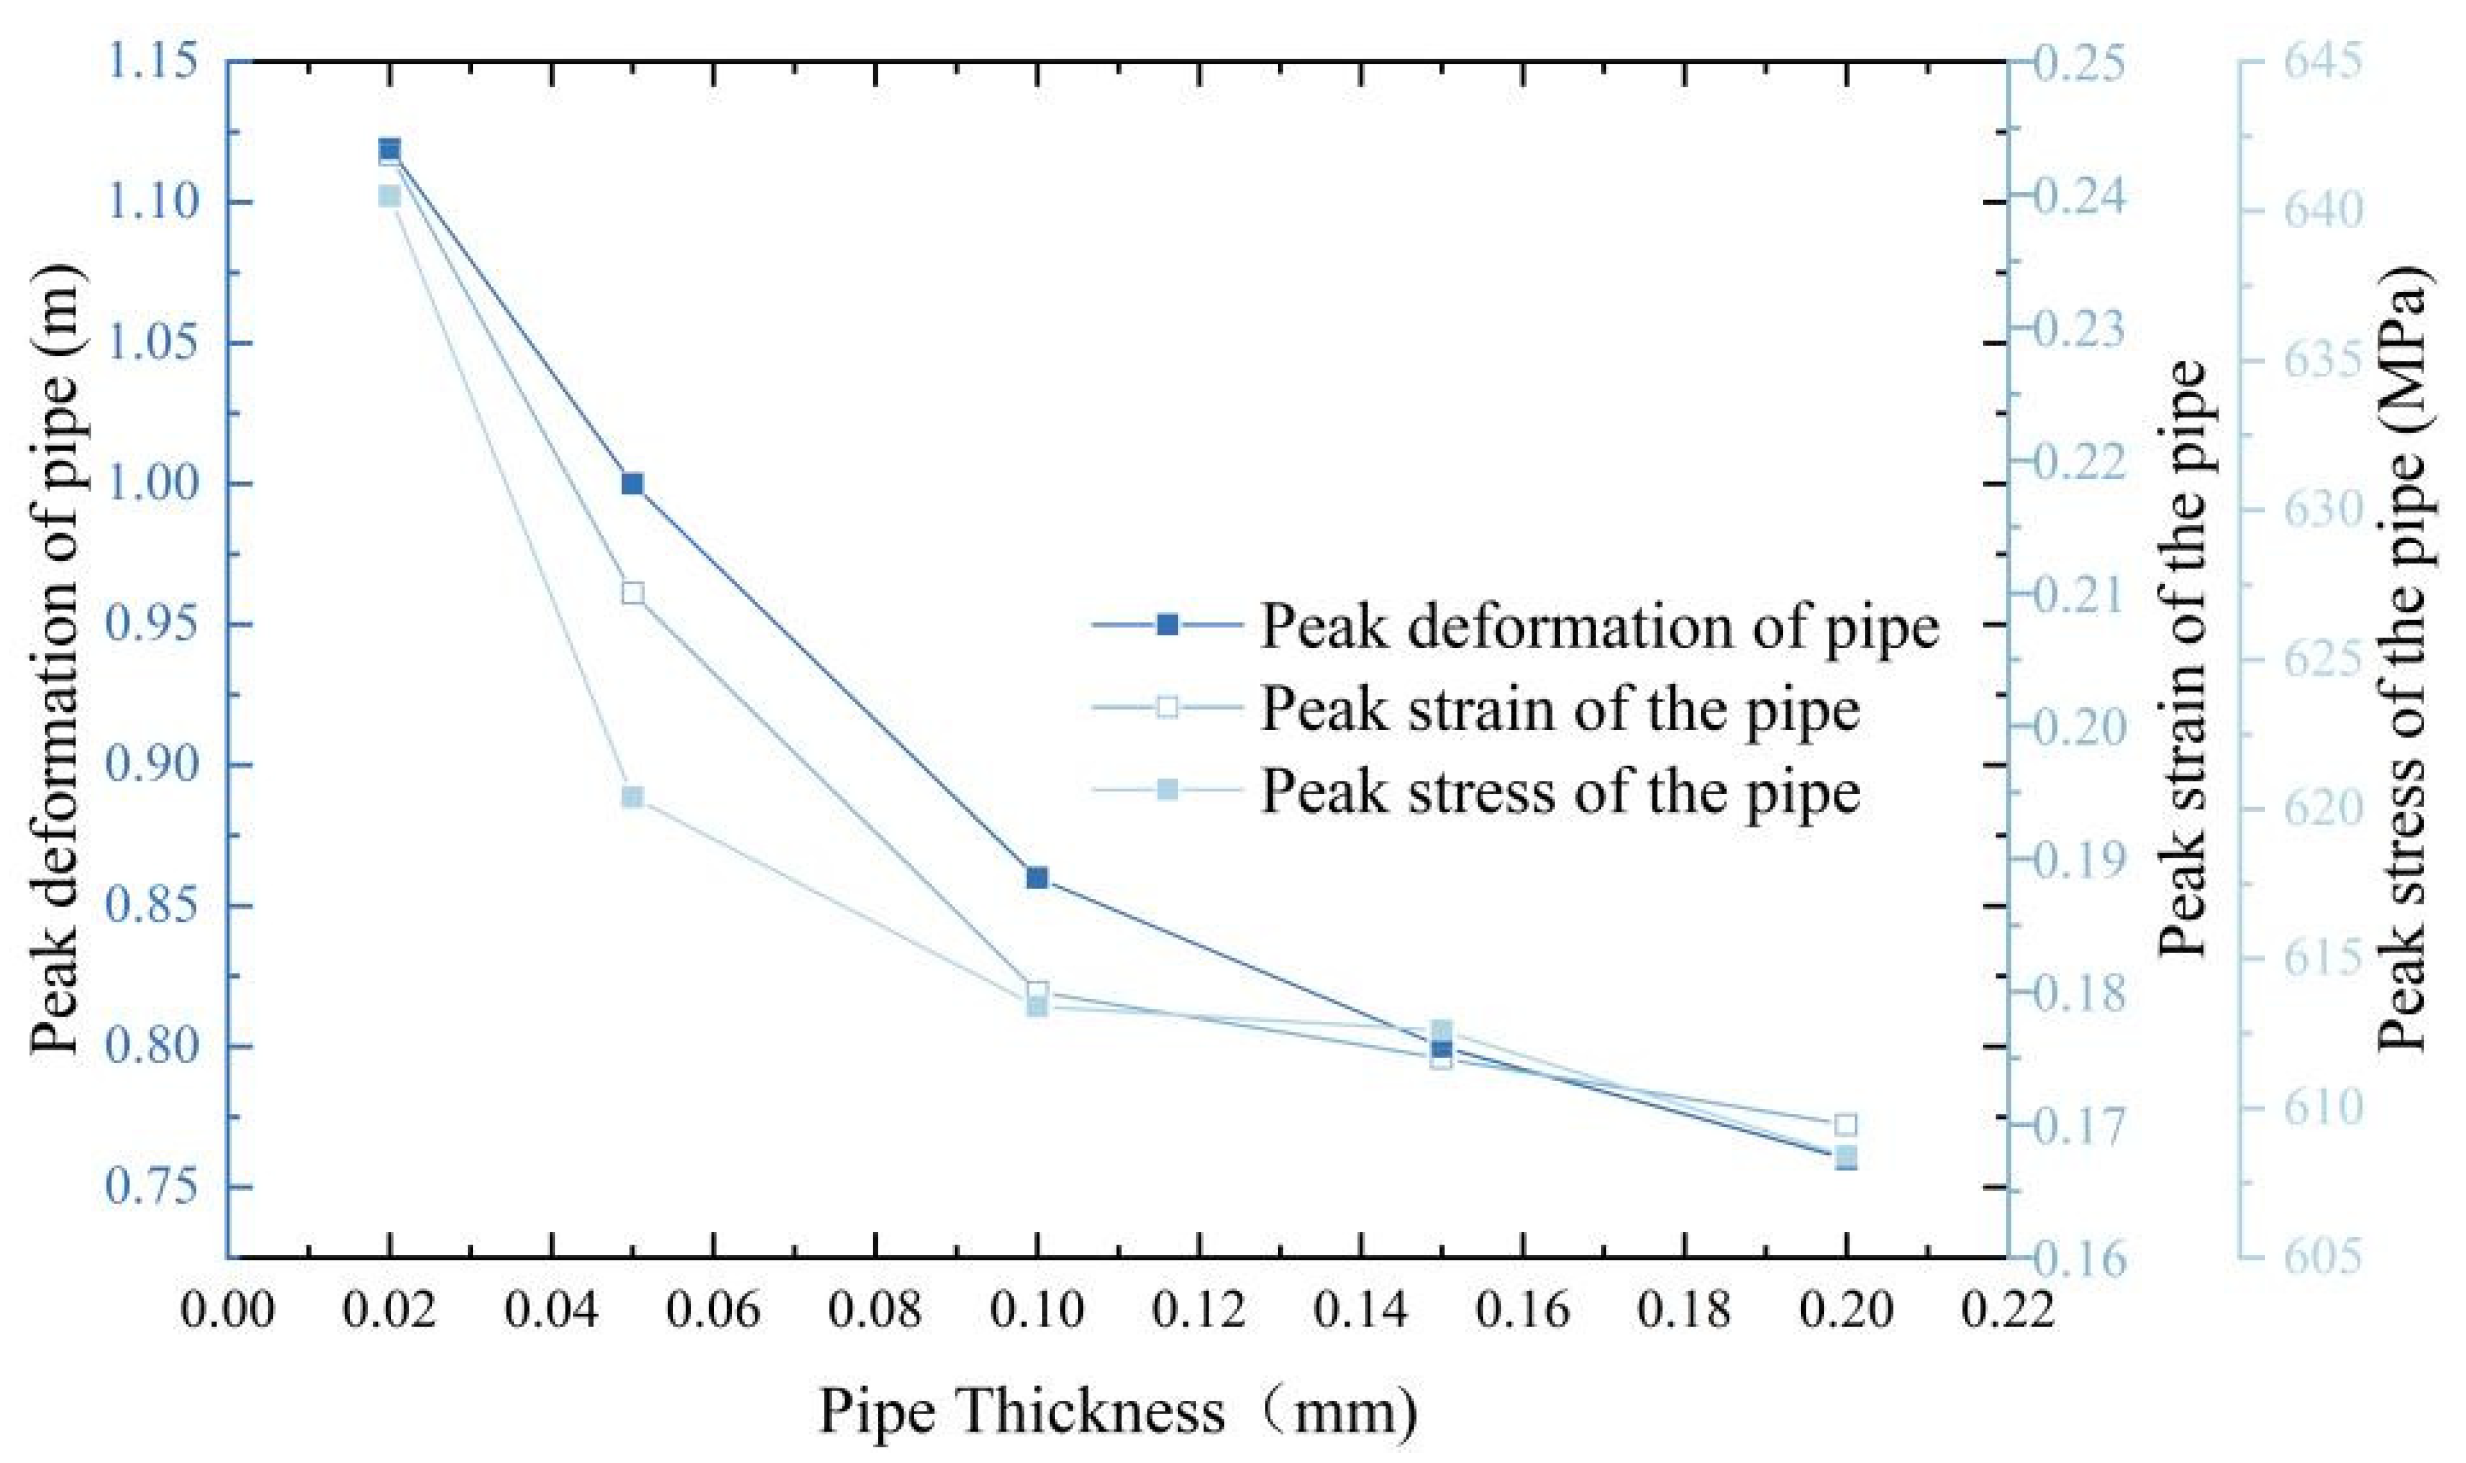
Figure 13 shows that under fault misalignment, the pipe’s peak displacement, peak strain, and peak stress significantly decrease as the diameter-to-thickness ratio decreases (i.e., as relative wall thickness increases). Specifically, peak displacement reduced from approximately 1.12 m to 0.75 m, peak strain from 0.24 to 0.17, and peak stress from 645 MPa to 607 MPa. This indicates that increasing the pipe’s relative wall thickness enhances its overall stiffness, enabling it to better resist structural responses caused by fault shear deformation. Consequently, deformation and stress levels in the misalignment zone are reduced [38]. Therefore, increasing the relative wall thickness (i.e., decreasing the diameter-to-thickness ratio) effectively improves the pipe’s resistance to fault misalignment, significantly enhancing its structural safety and stability [39]. Under fault misalignment, the pipe’s response to shear deformation is governed by its stiffness, which primarily depends on the diameter-to-thickness ratio. The circumferential bending stiffness of a pipe can be expressed as D = E t 3 12 ( 1     ν 2 ) . It shows that the stiffness is proportional to the third power of the wall thickness, and the increase in the wall thickness will significantly improve the deformation resistance of the pipe. In addition, according to the stress–strain relationship, the maximum bending stress induced under fault misalignment can be approximated as σ = M r I , r is the distance from the neutral axis to the outer edge, and I is the sectional moment of inertia ( I = π 4 ( r o 4 r i 4 ) ). The cross-sectional moment of inertia increases significantly with increasing wall thickness, resulting in lower stresses under the same external force. The fault misalignment-pipe structure can be simplified as an elastic foundation beam model, and its corresponding governing equation is E I d 4 y d x 4 + k y = q ( x ) , where k is the foundation reaction force coefficient and q(x) is the ground disturbance load, which further shows that increasing EI can effectively reduce the bending deformation response.
However, using thick-walled pipelines effectively enhances structural rigidity and deformation resistance, improving resistance to misalignment [40]. Nevertheless, it significantly increases construction costs, so the design process must balance structural safety and economic considerations. Under the combined effects of normal and reverse faults, increasing the pipe’s diameter-to-thickness ratio reduces structural rigidity. This leads to localized deformation and a more concentrated damage zone.

4.3. Effect of Internal Pipe Pressure

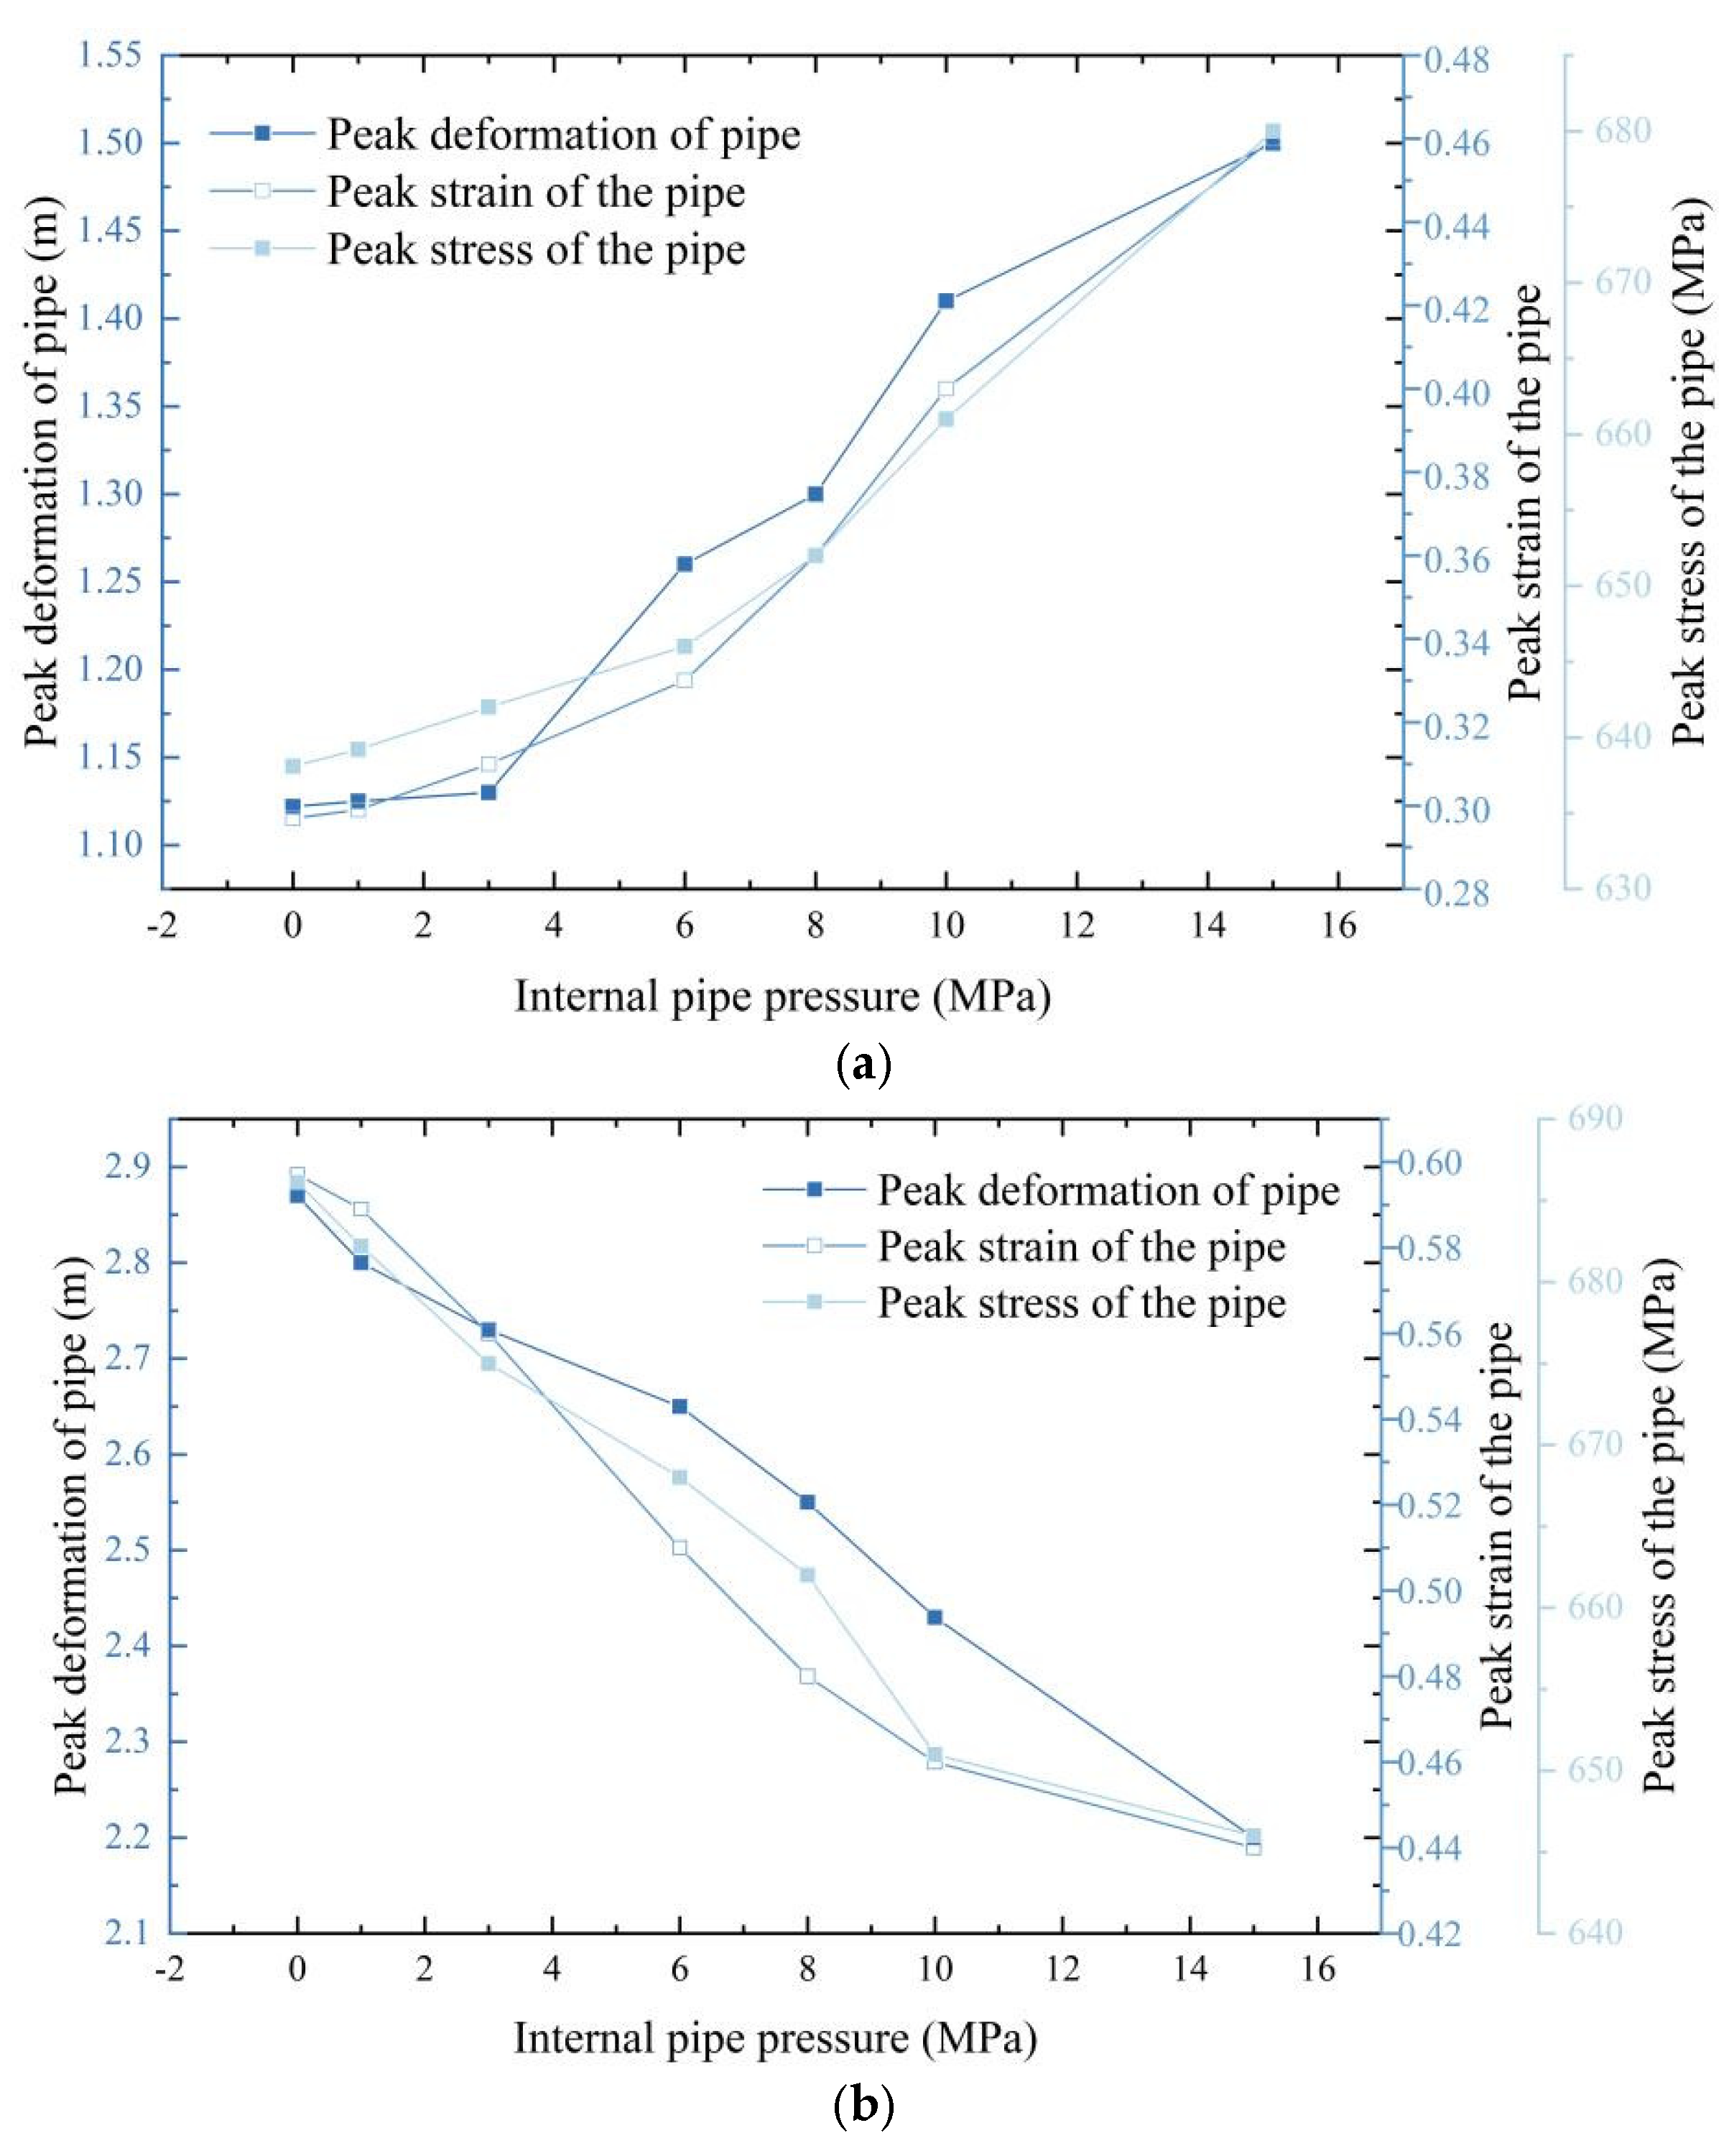
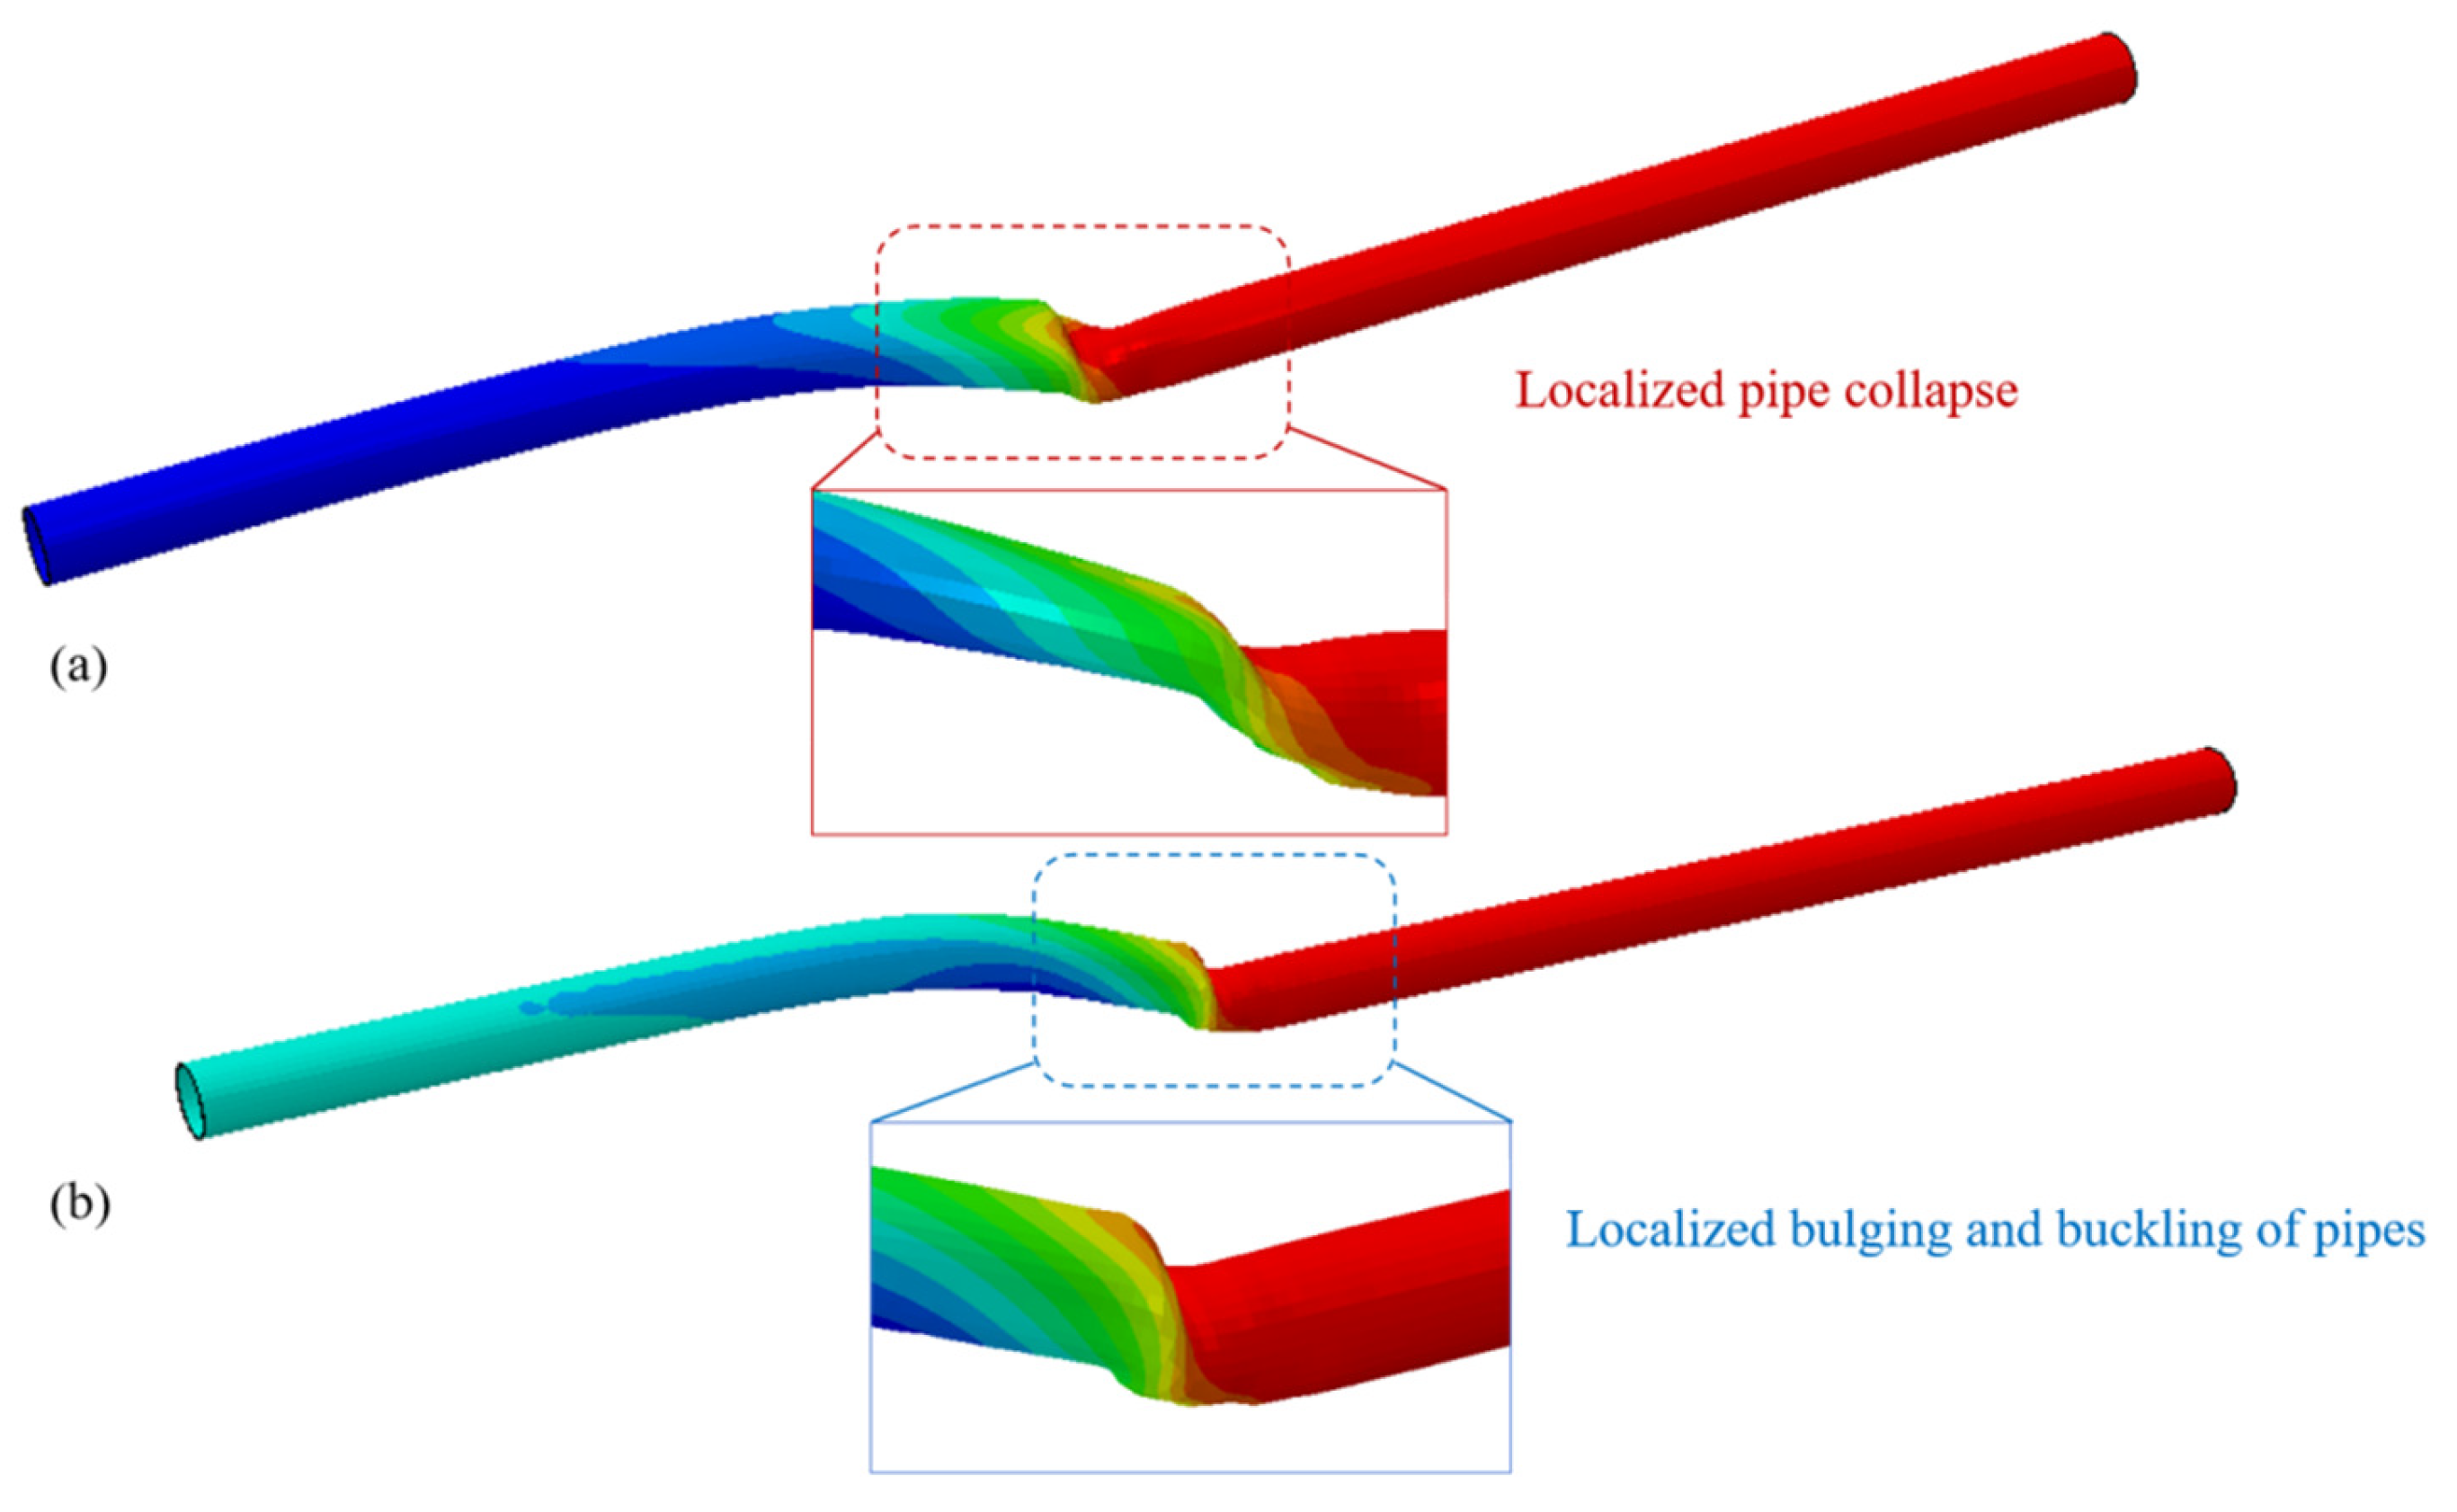
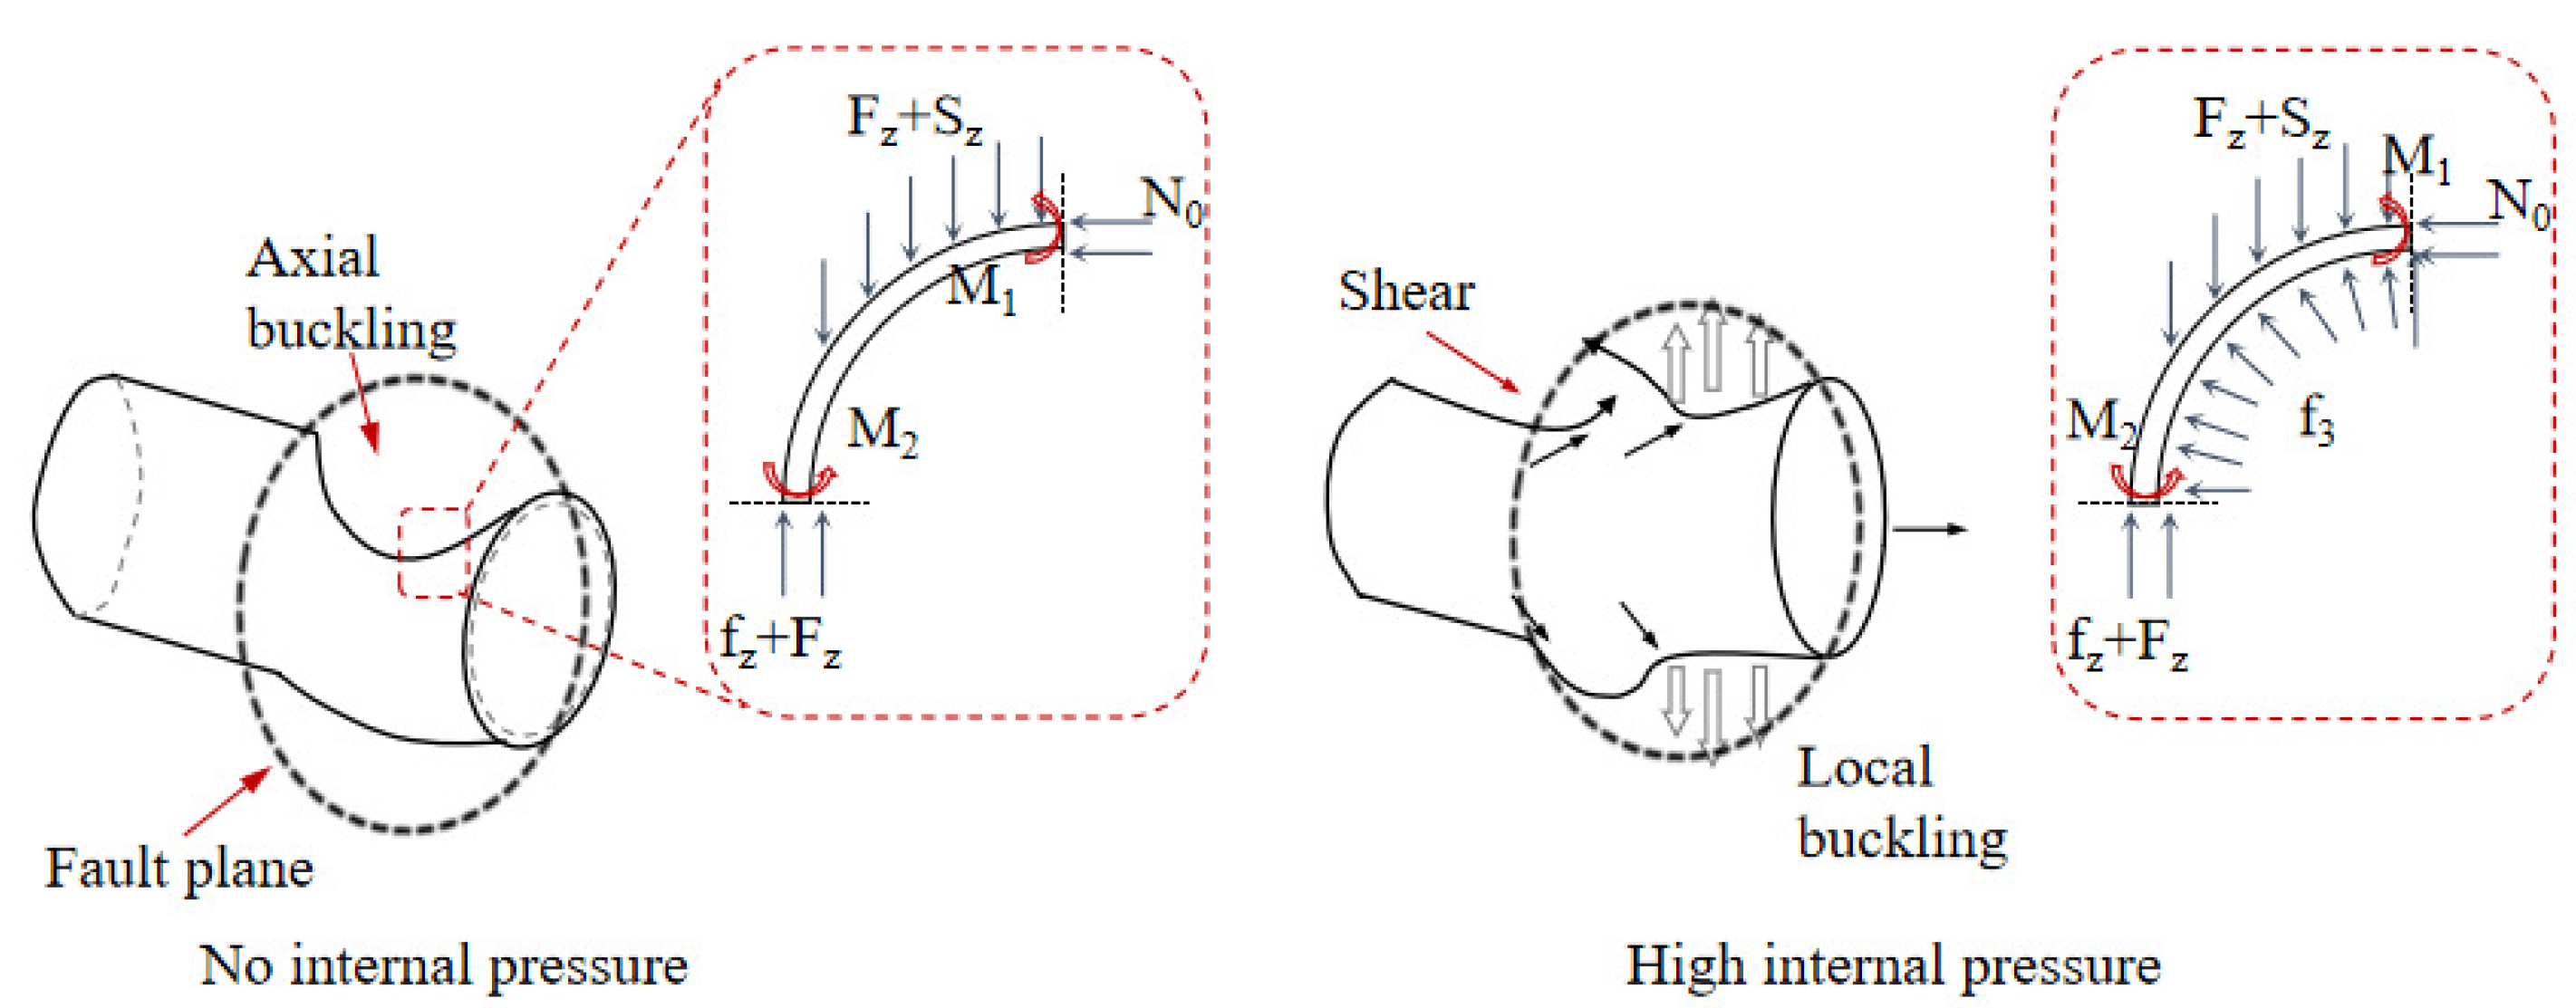
Internal pressure significantly influences the pipe’s deformation behavior under fault misalignment [41,42,43]. Higher internal pressure increases the likelihood of local bulging and buckling, whereas the absence of internal pressure tends to cause overall crushing damage. Analysis of Figure 14 shows that internal pressure exacerbates the pipeline’s stress and deformation responses at small fault displacements. Under these conditions, pipelines without internal pressure demonstrate higher structural safety. When fault displacement is large, moderate internal pressure enhances the pipe’s structural stiffness and buckling resistance. This reduces severe deformation caused by misalignment and improves mechanical stability. However, excessive internal pressure exacerbates local instability and accelerates pipeline damage (Figure 15). According to thin-walled circular pipe buckling theory, internal pressure alters the pipe’s boundary stress state and enhances axial stability to some extent but may also induce local bulge buckling (Figure 16). The critical buckling stress can be estimated by the following equation:
σ c r = E t r 3 1 v 2 1 + r t
where E is the modulus of elasticity, t is the wall thickness, r is the neutral axis radius, and ν is Poisson’s ratio. Increased internal pressure initially enhances structural rigidity and delays overall collapse but raises the risk of local buckling on the outer wall. Moderate internal pressure offers radial support against compression and shear deformation from fault misalignment. However, excessive pressure induces stress concentration, bulging, and buckling, accelerating damage. Therefore, the effect of internal pressure on pipeline safety is dual and depends on misalignment amplitude. Engineering design should comprehensively consider fault activity intensity and internal pressure levels, controlling pressure to balance structural strength and deformation performance.
Therefore, in the design of energy infrastructure, pipeline parameters (such as diameter-to-thickness ratio and stiffness) should be designed based on regional seismic indices, thereby guiding the layout of pipelines in fault zones and the selection of joints. By reasonably controlling the diameter-to-thickness ratio, differentiated wall thickness designs can be achieved to prioritize deformation resistance in high-risk areas while balancing costs. In response to the dual effects of internal pressure, internal pressure control strategies should be optimized or local buckling-resistant structures enhanced in conjunction with fault scenarios.

5. Conclusions

This study investigates the mechanical response mechanism of buried steel pipes under fault action using the finite element method, focusing on the effects of fault displacement, internal pipe pressure, and diameter-to-thickness ratio. The main conclusions are summarized as follows:
(1)
Under fault misalignment, the mechanical response of buried pipelines can be divided into four distinct stages: In the initial stage, elastic deformation dominates, the pipeline structure remains stable, and the bending moment rises rapidly. As misalignment increases, the yielding stage begins, characterized by the formation of local plastic hinges, a decrease in bending moment, and continued growth of axial force and strain. Next, in the plastic development stage, structural stiffness significantly degrades, the bending moment stabilizes, and strain rapidly approaches the limit state. Finally, when misalignment reaches a critical value, structural rupture occurs, causing a rapid decline in bending moment and axial force, strain fluctuations, and a complete loss of the pipe’s load-bearing capacity.
(2)
The diameter-to-thickness ratio is a key parameter influencing the structural stiffness and misalignment resistance of the pipeline. As the diameter-to-thickness ratio increases, the relative wall thickness decreases, leading to reduced overall stiffness and diminished ability to resist shear deformation caused by fault misalignment. This often results in deformation concentration, local failure, and an expanded damage range. Conversely, reducing the diameter-to-thickness ratio (i.e., increasing wall thickness) significantly enhances the pipe’s axial and bending stiffness, improves deformation coordination within the fault zone, effectively inhibits plastic deformation and destabilization, and thus improves structural deformation resistance and stability. Therefore, reasonable control of the diameter-to-thickness ratio is an important design strategy for enhancing pipeline resilience against fault misalignment. However, excessively thick walls substantially increase construction and material costs, requiring a balance between structural performance and economic considerations to optimize safety and cost efficiency.
(3)
The internal pressure of the pipeline exerts a significant dual effect on its structural response under fault misalignment. On one hand, internal pressure enhances the radial stiffness and axial stability of the pipeline, particularly under large fault displacements, helping to inhibit overall collapse, delay structural buckling, and improve deformation resistance and mechanical stability. On the other hand, increased internal pressure alters the pipeline’s stress boundary conditions, inducing circumferential tensile stress concentration, which raises the risk of localized bulging and buckling—especially in deformation concentration zones that are more sensitive. When fault misalignment is small, internal pressure may exacerbate stress redistribution and local deformation, making the pipe more susceptible to local instability. According to the buckling theory of thin-walled round pipes, although internal pressure can enhance initial structural stiffness, the circumferential tensile stress it induces may trigger local buckling.
The current model adopts a “single slip plane” assumption for the fault. However, natural fault zones are marked by substantial heterogeneity—encompassing variations in lithology, fracturing intensity, and material properties—while actual fault systems generally manifest as intricate 3D networks. Such simplification of a single slip plane, therefore, cannot fully capture the true mechanical response mechanisms of the pipeline under faulting conditions. Moving forward, subsequent studies could focus on examining how fault zone heterogeneity parameters (e.g., spatial variations in friction coefficients or fracture density) and the geometric distribution of fault networks influence the pipeline’s mechanical behavior, thereby refining our understanding of these complex interactions.

Author Contributions

Conceptualization, C.Q.; methodology, C.Q.; software, C.Q.; validation, C.Q.; investigation, C.Q.; resources, C.Q., S.T. and Y.W.; data curation, C.Q.; writing—original draft preparation, C.Q.; writing—review and editing, C.Q., S.T. and Y.W.; visualization, C.Q., S.T. and Y.W.; supervision, C.Q., S.T. and Y.W. All authors have read and agreed to the published version of the manuscript.

Funding

This research received no external funding.

Data Availability Statement

The original contributions presented in this study are included in the article. Further inquiries can be directed to the corresponding author.

Conflicts of Interest

The authors declare no conflicts of interest.

References

  1. Datta, S.; Sarkar, S. A review on different pipeline fault detection methods. J. Loss Prev. Process Ind. 2016, 41, 97–106. [Google Scholar] [CrossRef]
  2. Takada, S.; Hassani, N.; Fukuda, K. A new proposal for simplified design of buried steel pipes crossing active faults. Earthq. Eng. Struct. Dyn. 2001, 30, 1243–1257. [Google Scholar] [CrossRef]
  3. Ni, P.; Moore, I.D.; Take, W.A. Numerical modeling of normal fault-pipeline interaction and comparison with centrifuge tests. Soil Dyn. Earthq. Eng. 2018, 105, 127–138. [Google Scholar] [CrossRef]
  4. Li, H.; Feng, X.; Zhao, L. Failure analysis of a buried large-diameter prestressed concrete cylinder pipeline subjected to strike-slip fault displacement. Tunn. Undergr. Space Technol. 2022, 121, 104334. [Google Scholar] [CrossRef]
  5. Eidinger, J.; De Castro, L.; Ma, D. The 1906 earthquake impacts on the San Francisco and Santa Clara water systems—What we learned, and what we are doing about it. Earthq. Spectra 2006, 22 (Suppl. S2), 113–134. [Google Scholar] [CrossRef]
  6. Tsai, J.S.; Jou, L.D.; Lin, S.H. Damage to buried water supply pipelines in the chichi (Taiwan) earthquake and apreliminary evaluation of seismic resistance of pipe joints. J. Chin. Inst. Eng. 2000, 23, 395–408. [Google Scholar] [CrossRef]
  7. Asgarihajifirouz, M.; Dong, X.; Shiri, H. A Decoupled Buckling Failure Analysis of Buried Steel Pipeline Subjected to the Strike-Slip Fault. J. Mar. Sci. Eng. 2024, 12, 1243. [Google Scholar] [CrossRef]
  8. Melissianos, V.E. Onshore buried steel fuel pipelines at fault crossings: A review of critical analysis and design aspects. J. Pipel. Syst. Eng. Pract. 2022, 13, 03122002. [Google Scholar] [CrossRef]
  9. Li, Z.; Yu, Y.; Liu, X.; Liu, X.; Wang, X.; Xu, L.; Yu, J. Propagation and arrest of collapse failures in a buried offshore pipeline crossing reverse fault areas. Mar. Struct. 2024, 93, 103522. [Google Scholar] [CrossRef]
  10. Karamitros, D.K.; Bouckovalas, G.D.; Kouretzis, G.P.; Gkesouli, V. An analytical method for strength verification of buried steel pipelines at normal fault crossings. Soil Dyn. Earthq. Eng. 2011, 31, 1452–1464. [Google Scholar] [CrossRef]
  11. Valsamis, A.I.; Bouckovalas, G.D.; Gantes, C.J. Alternative design of buried pipelines at active fault crossings using flexible joints. Int. J. Press. Vessel. Pip. 2020, 180, 104038. [Google Scholar] [CrossRef]
  12. Hu, Z.; Ren, X.; Wang, Q.; Wang, R.; Pan, R. Analytical method for the mechanical response of buried pipeline under the action of strike-slip faulting. Undergr. Space. 2022, 7, 268–277. [Google Scholar] [CrossRef]
  13. Zhang, Z.; Feng, J.; Zhu, Z.; Zhao, Q.; Pan, Y. Analytical solution for buried pipeline deformation induced by normal and reverse fault considering structural joint influence. Int. J. Numer. Anal. Methods Geomech. 2024, 48, 2085–2127. [Google Scholar] [CrossRef]
  14. Meniconi, S.; Brunone, B.; Tirello, L.; Rubin, A.; Cifrodelli, M.; Capponi, C. Transient tests for checking the Trieste subsea pipeline: Towards the field tests. J. Mar. Sci. Eng. 2024, 12, 374. [Google Scholar] [CrossRef]
  15. Demirci, H.E.; Bhattacharya, S.; Karamitros, D.; Alexander, N. Experimental and numerical modelling of buried pipelines crossing reverse faults. Soil Dyn. Earthq. Eng. 2018, 114, 198–214. [Google Scholar] [CrossRef]
  16. Abdoun, T.H.; Ha, D.; O’Rourke, M.J.; Symans, M.D.; O’Rourke, T.D.; Palmer, M.C.; Stewart, H.E. Factors influencing the behavior of buried pipelines subjected to earthquake faulting. Soil Dyn. Earthq. Eng. 2009, 29, 415–427. [Google Scholar] [CrossRef]
  17. Oskouei, A.V.; Tamjidi, A.; Pourshabani, P. Effects of burial depth in the behavior of buried steel pipelines subjected to strike-slip fault. Soil Dyn. Earthq. Eng. 2019, 123, 252–264. [Google Scholar] [CrossRef]
  18. Joshi, S.; Prashant, A.; Deb, A.; Jain, S.K. Analysis of buried pipelines subjected to reverse fault motion. Soil Dyn. Earthq. Eng. 2011, 31, 930–940. [Google Scholar] [CrossRef]
  19. Liu, W.; Guo, Q.; Qiao, C.; Hou, W. Strain design method of buried pipeline crossing fault. Eng. Fail. Anal. 2019, 105, 659–671. [Google Scholar] [CrossRef]
  20. Rahman, M.A.; Taniyama, H. Analysis of a buried pipeline subjected to fault displacement: A DEM and FEM study. Soil Dyn. Earthq. Eng. 2015, 71, 49–62. [Google Scholar] [CrossRef]
  21. Vazouras, P.; Karamanos, S.A.; Dakoulas, P. Finite element analysis of buried steel pipelines under strike-slip fault displacements. Soil Dyn. Earthq. Eng. 2010, 30, 1361–1376. [Google Scholar] [CrossRef]
  22. Banushi, G.; Squeglia, N.; Thiele, K. Innovative analysis of a buried operating pipeline subjected to strike-slip fault movement. Soil Dyn. Earthq. Eng. 2018, 107, 234–249. [Google Scholar] [CrossRef]
  23. Talebi, F.; Kiyono, J. Introduction of the axial force terms to governing equation for buried pipeline subjected to strike-slip fault movements. Soil Dyn. Earthq. Eng. 2020, 133, 106125. [Google Scholar] [CrossRef]
  24. Li, Z.; Zhang, S.; Shen, M.; Shen, Q. In Study on shallow steel utility tunnels under strike-slip fault conditions: Analytical and numerical approaches. Structures 2025, 79, 109536. [Google Scholar] [CrossRef]
  25. Zhang, S.; Bu, R.; Zhang, Z.; Gao, L.; Li, Z. A systematic model for the mechanical behavior of thin-walled composite FGM pipelines subjected to strike-slip faults in geohazard area. Thin-Walled Struct. 2024, 202, 112135. [Google Scholar] [CrossRef]
  26. Sarvanis, G.C.; Karamanos, S.A. Analytical model for the strain analysis of continuous buried pipelines in geohazard areas. Eng. Struct. 2017, 152, 57–69. [Google Scholar] [CrossRef]
  27. Zheng, Y.; Wu, K.; Jiang, Y.; Chen, R.; Duan, J. Optimization and design of pre-reinforcement for a subsea tunnel crossing a fault fracture zone. Mar. Geores. Geotechnol. 2023, 41, 36–53. [Google Scholar] [CrossRef]
  28. Zhang, W.; Ayello, F.; Honegger, D.; Taciroglu, E.; Bozorgnia, Y. Comprehensive numerical analyses of the seismic performance of natural gas pipelines crossing earthquake faults. Earthq. Spectra 2022, 38, 1661–1682. [Google Scholar] [CrossRef]
  29. Demirci, H.E.; Karaman, M.; Bhattacharya, S. Behaviour of buried continuous pipelines crossing strike-slip faults: Experimental and numerical study. J. Nat. Gas Sci. Eng. 2021, 92, 103980. [Google Scholar] [CrossRef]
  30. Liu, A.; Hu, Y.; Zhao, F.; Li, X.; Takada, S.; Zhao, L. An equivalent-boundary method for the shell analysis of buried pipelines under fault movement. Acta Seismol. Sinica. 2004, 17, 150–156. (In Chinese) [Google Scholar] [CrossRef]
  31. Kaya, E.S.; Uckan, E.; O’Rourke, M.J.; Karamanos, S.A.; Akbas, B.; Cakir, F.; Cheng, Y. Failure analysis of a welded steel pipe at Kullar fault crossing. Eng. Fail. Anal. 2017, 71, 43–62. [Google Scholar] [CrossRef]
  32. Ma, C.; Cheng, X.; Xu, T.; Xu, L.; Wang, Y.; An, K.; Hu, W. Research on local buckling failure range of X80 buried steel pipeline under oblique-reverse fault. Soil Dyn. Earthq. Eng. 2023, 164, 107592. [Google Scholar] [CrossRef]
  33. Liu, Q. Study on Seismic Surface Permanent Displacement of Active Faults. Recent Dev. World Seismol. 2014, 42–43. (In Chinese) [Google Scholar] [CrossRef]
  34. ASME B31.8; Gas Transmission and Distribution Piping Systems. American Society of Mechanical Engineers: New York, NY, USA, 2007.
  35. Banushi, G.; Squeglia, N. Seismic analysis of a buried operating steel pipeline with emphasis on the equivalent-boundary conditions. J. Pipel. Syst. Eng. Pract. 2018, 9, 04018005. [Google Scholar] [CrossRef]
  36. Rofooei, F.R.; Jalali, H.H.; Attari, N.K.A.; Kenarangi, H.; Samadian, M. Parametric study of buried steel and high density polyethylene gas pipelines due to oblique-reverse faulting. Can. J. Civ. Eng. 2015, 42, 178–189. [Google Scholar] [CrossRef]
  37. Zheng, Y.; Wu, K.; Wang, L.; Jiang, Y.; Liu, Y. Structural damage assessment and failure mode analysis for cross-fault submarine tunnels. Eng. Fail. Anal. 2024, 157, 107853. [Google Scholar] [CrossRef]
  38. Liao, P.; Guo, C.; Wang, F.; Sun, W.; Ni, P. Investigating brittle damage of buried pipelines under dip-slip faulting with peridynamics. Acta Geotech. 2023, 18, 1945–1965. [Google Scholar] [CrossRef]
  39. Zhang, R.; Wang, C.; Li, S.; Zhang, J.; Liu, W. Numerical simulation study on the performance of buried pipelines under the action of faults. Appl. Sci. 2023, 13, 11266. [Google Scholar] [CrossRef]
  40. Zhang, J.; Chen, Y.; Zhang, H. Local buckling evolution mechanism of a buried steel pipe under fault movements. Energy Sci. Eng. 2020, 8, 412–425. [Google Scholar] [CrossRef]
  41. Arumugam, T.; Vijaya Kumar, S.D.; Karuppanan, S.; Ovinis, M. The influence of axial compressive stress and internal pressure on a pipeline network: A review. Appl. Sci. 2023, 13, 3799. [Google Scholar] [CrossRef]
  42. Fang, P.; Xu, Y.; Gao, Y.; Ali, L.; Bai, Y. Mechanical responses of a fiberglass flexible pipe subject to tension & internal pressure. Thin-Walled Struct. 2022, 181, 110107. [Google Scholar] [CrossRef]
  43. Zeng, D.; Wang, X.; Ming, K.; Yu, C.; Zhang, Y.; Yu, Z.; Yan, J.; Li, F. Analysis and optimization design of internal pressure resistance of flexible composite pipe. Int. J. Press. Vessel. Pip. 2024, 210, 105271. [Google Scholar] [CrossRef]
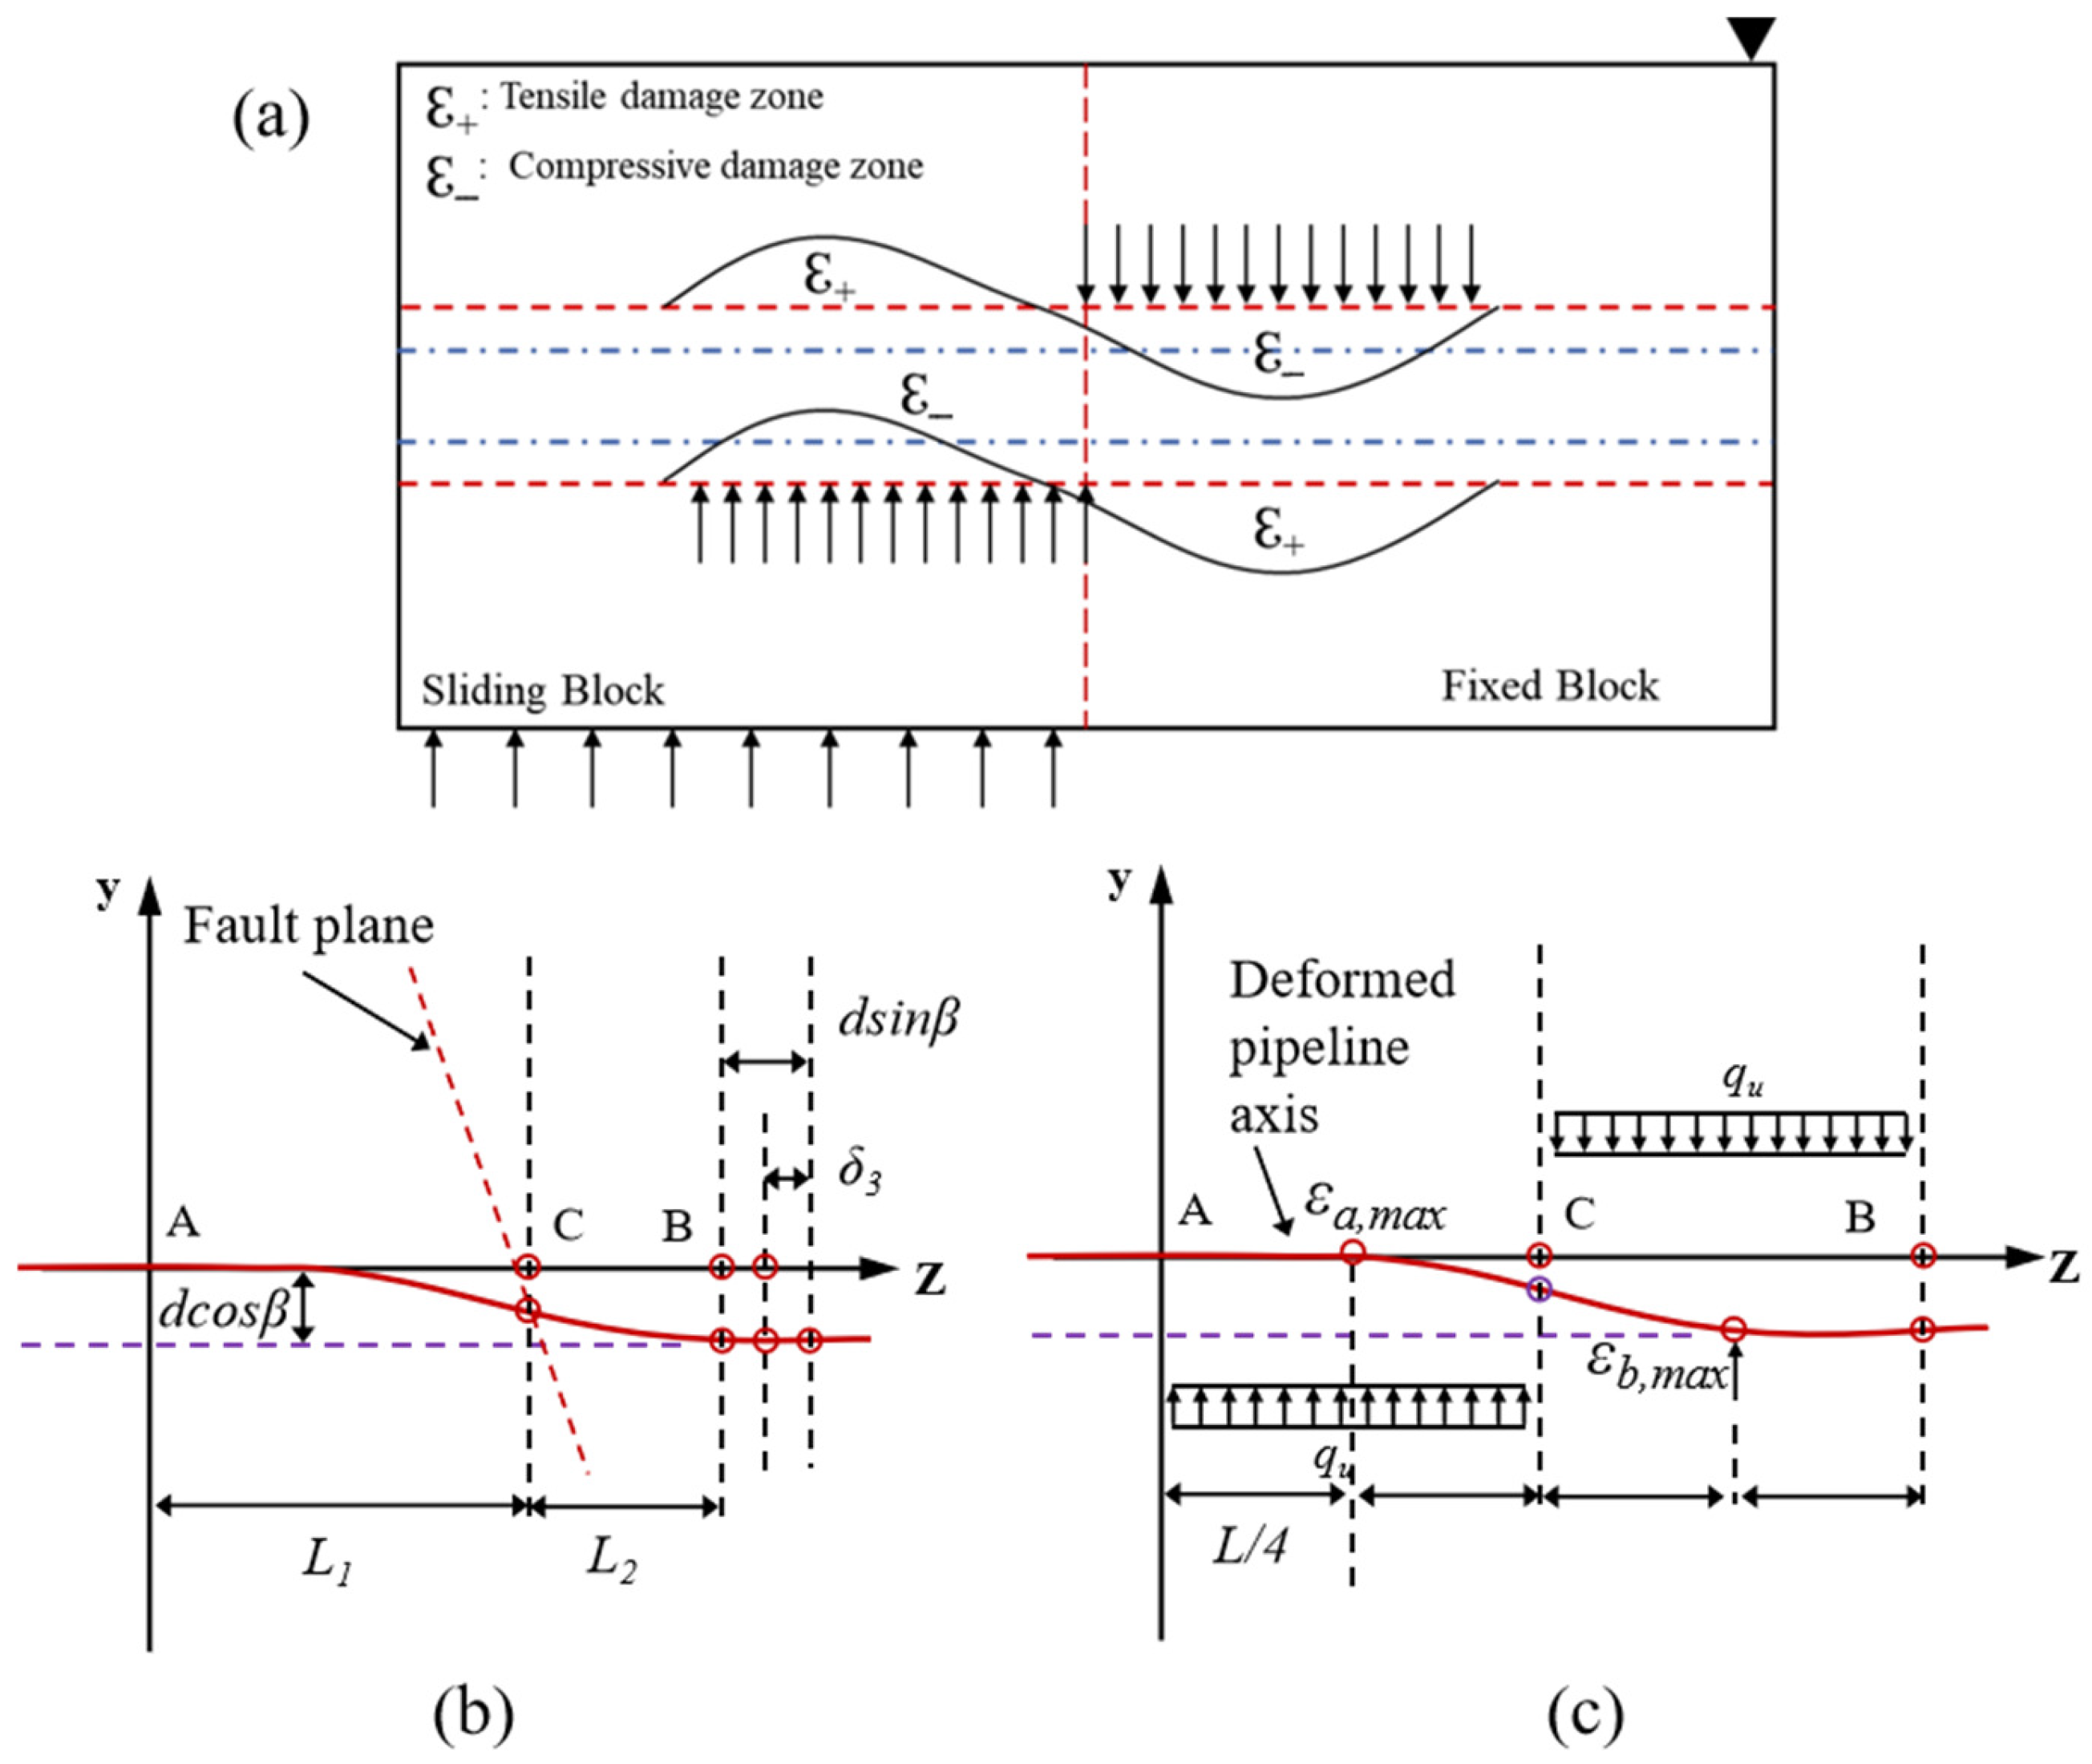
Figure 1. (a) Schematic diagram of pipeline response under fault dislocation effects; (b) pipe deformation under fault displacement; (c) transverse deformation response of pipeline under fault displacement.
Applsci 15 09450 g001
Figure 2. Schematic of pipeline displacement and moment distribution during fault displacement: (a) Permanent displacement of the soil on both sides of the fault; (b) the mechanical response of pipelines under uniformly distributed loads; (c) the mechanical response of pipelines under the superposition of uniformly distributed loads and fault displacement.
Applsci 15 09450 g002
Figure 3. Finite element modeling of pipe-fault systems based on equivalent boundary springs.
Applsci 15 09450 g003
Figure 4. Stress–strain constitutive equation for pipe.
Applsci 15 09450 g004
Figure 5. “Hazardous Sections” and “Less Disturbed Sections” of pipe under fault dislocation.
Applsci 15 09450 g005
Figure 6. (left) Schematic diagram of axial loading of the pipe under fault misalignment; (right) force equilibrium diagram of micro-element length pipe.
Applsci 15 09450 g006
Figure 7. Schematic diagram of fault–pipeline system interaction.
Applsci 15 09450 g007
Figure 8. Comparison between existing studies and the simulation results of the present model.
Applsci 15 09450 g008
Figure 9. Mesh sensitivity analysis of the model: (a) 0.05 m unit grid length; (b) 0.1 m unit grid length; (c) 0.3 m unit grid length.
Applsci 15 09450 g009
Figure 10. Stress–displacement response of pipelines under different fault misalignment displacements: (a) The stress variations of pipelines under forced displacements of different faults; (b) The maximum displacement of pipelines under forced displacements of different faults.
Applsci 15 09450 g010
Figure 11. Pipeline stresses, displacements, and strains under different fault misalignment displacements.
Applsci 15 09450 g011
Figure 12. Typical four key stages of a pipeline under different fault misalignments: initial stage, small fault displacement, medium displacement, and large fault displacement.
Applsci 15 09450 g012
Figure 13. Stress, strain, and displacement response of pipes with different diameter-to-thickness ratios.
Applsci 15 09450 g013
Figure 14. (a) Stress, strain, and displacement response of different pipeline internal pressures under fault misalignment of 0.6 m; (b) stress, strain, and displacement response of different pipeline internal pressures under fault misalignment of 2.0 m.
Applsci 15 09450 g014
Figure 15. Damage patterns of pipelines under different fault misalignment conditions: (a) pipe collapse under low internal pressure; (b) pipe bulging under high internal pressure conditions.
Applsci 15 09450 g015
Figure 16. Mechanisms of pipeline internal pressure under different fault misalignment conditions: pipeline collapse under low internal pressure, pipeline bulging under high internal pressure conditions.
Applsci 15 09450 g016
Table 1. Soil-related parameters.
Parameter TypeDensity ρ (kg/m3)Elastic Modulus E (MPa)Poisson’s Ratio μCohesion c (kPa)Friction Angle
φ (°)
Dilation Angle Ψ
Soil1900400.3540220.01
Table 2. Parameters of the FE model by Rofooei et al. [36].
ClassificationParameter TypeParameter Value
FaultPipe-fault crossing angle50°
Dip angle75°
Displacement0.4 m
PipelineMaterialAPI-5L Grade B
Yield stress241 MPa
Elastic modulus2 × 105 MPa
Poisson’s ratio0.3
Diameter114.3 mm
Thickness8.6 mm
Burial depth1.2 m
Internal pressure413 kPa
SoilTypeSandy soil
Model size1.7 m × 2.0 m × 8.5 m
Density20.6 kg/m
Elastic modulus33 MPa
Poisson’s ratio0.3
Cohesion5 kPa
Friction angle38°
Dilation angle
Disclaimer/Publisher’s Note: The statements, opinions and data contained in all publications are solely those of the individual author(s) and contributor(s) and not of MDPI and/or the editor(s). MDPI and/or the editor(s) disclaim responsibility for any injury to people or property resulting from any ideas, methods, instructions or products referred to in the content.