Article

Molecular Dynamics Simulation of Methane Adsorption and Diffusion in Limestone Pores in the Taiyuan Formation of the Ordos Basin, China: Effects of Pore Shapes, Apertures, and Formation Water

1
College of Safety and Emergency Management Engineering, Taiyuan University of Technology, Taiyuan 030024, China
2
Shanxi Laboratory of Intelligent Mine, Taiyuan 030024, China
3
Postdoctoral Research Station, Huayang New Material Technology Group Co., Ltd., Yangquan 045000, China
*
Author to whom correspondence should be addressed.
Appl. Sci. 2025, 15(17), 9446; https://doi.org/10.3390/app15179446
Submission received: 17 July 2025 / Revised: 14 August 2025 / Accepted: 22 August 2025 / Published: 28 August 2025

Abstract

The Taiyuan Formation limestone in the Ordos Basin of China holds significant gas-bearing potential, making it a key target for unconventional natural gas exploration. Clarifying the microscopic occurrence mechanism of gas in limestone is necessary. The effects of pore morphology, aperture, and formation water were systematically studied in this paper through MD and GCMC. The results indicate that specific surface area, pore volume, tortuosity, and interaction synergistically influence methane adsorption and diffusion. Pore shape is intricately linked to these factors, and variations in pore width impact pore volume and interaction, with a slit pore being most conducive to gas diffusion. Formation water mainly forms water films and clusters in organic–inorganic pores. Water molecules preferentially form a water film, while increasing moisture content, expanding aperture, and introducing ions promote cluster formation. Formation water can enhance surface diffusion, reduce the adsorbed phase proportion, and decrease interaction, but it also occupies flow space and forms clusters that hinder gas diffusion. At low moisture content, gas diffusion is promoted in 2 nm and 4 nm pores, while high moisture content inhibits it. In contrast, 6 nm pores consistently curb diffusion.

1. Introduction

With the continuous growth of global energy demand, developing and utilizing unconventional oil and gas resources has emerged as an effective solution to the energy crisis [1]. The Ordos Basin is China’s second-largest sedimentary basin, containing plentiful natural gas reserves [2]. In 2021, the limestone in the Taiyuan Formation of the Ordos Basin produced over 500,000 m3 of high-yield air flow, establishing this formation as a focal point for natural gas exploration [3]. Additionally, the Taiyuan Formation limestone is extensively distributed and forms a “sandwich” structure alongside coal, sandstone, shale, and other reservoirs, often serving as both the roof and floor of coal seams [4,5,6]. During coal extraction operations, limestone formations release substantial quantities of methane gas at working faces, which significantly disrupts normal mining activities and leads to considerable wastage of valuable coal resources [7]. Current studies indicate that Taiyuan Formation limestone possesses certain hydrocarbon-generating potential. Although the abundance of organic matter is generally lower than that found in shale and coal seams, the evaluation criteria for carbonate source rocks suggest that Taiyuan Formation limestone still holds promise as an effective source rock [8,9]. Presently, research on Taiyuan Formation limestone primarily focuses on sedimentary facies, diagenesis, reservoir formation characteristics, and gas content evaluation [10,11]. However, current understanding of gas occurrence mechanisms in limestone pore systems remains notably insufficient. Therefore, it is essential to investigate the adsorption–diffusion mechanism and microscopic occurrence characteristics of CH4 in limestone. These scientific questions are crucial for accurately estimating limestone natural gas reserves, solving gas outburst problems during mining processes, and improving natural gas extraction efficiency.
The molecular simulation method is now an essential way for investigating gas adsorption and diffusion behavior, frequently employed in shale gas research. Shale serves as an important source rock, comprising both organic and inorganic components [12]. The primary ingredient of the organic matter is kerogen [13], whereas the major components of the inorganic substances include quartz, illite, kaolinite, and montmorillonite (MMT) [14]. By constructing organic slit pores in shale through the replacement of kerogen with graphene, it was confirmed that gas adsorption capacity is inversely associated with temperature [15]. The methane adsorption capacity exhibits significant pore shape dependence, with triangular carbon pores demonstrating the highest CH4 excess adsorption density at equivalent pore sizes, followed sequentially by slit-shaped, circular, and square pore geometries [16]. Moreover, an increase in moisture content is detrimental to methane adsorption by kerogen [17]. Among the clay minerals in shale, MMT exhibits the highest adsorption capability, following illite–MMT mixed layers and illite [18]. In the slit pores of graphene–MMT, the CH4 density on the graphene side is markedly larger, indicating that graphene exhibits a superior adsorption capacity for methane [19]. Additionally, the CH4 diffusion coefficient in the graphene slit pores reduces with increasing pressure [20]. For a given pressure and temperature, the slope of gas mean square displacement (MSD) shows a positive correlation with pore size [21,22]. Furthermore, pressure significantly impacts the CH4 diffusion rate in macropores compared to micropores [23]. While research on the CH4 microscopic properties in shale nanopores has advanced significantly in recent years, the Taiyuan Formation limestone has received comparatively less attention. In addition, this limestone formation contains extensive aquifer systems, with the characteristic Taiyuan Formation Water (commonly termed “Taihui Water”) frequently causing water influx in mining operations, thereby posing substantial challenges to coal extraction safety. Taihui Water is essentially a type of saline, composed mainly of Na+, HCO3, and Cl ions [24,25]. Current research on the limestone aquifer primarily focuses on identifying sudden water sources, hydraulic connections within the aquifer, paleo-sedimentary habitats, and hydrogeological features [26,27,28,29]. However, the influence of Taihui Water on the occurrence and migration of natural gas within limestone reservoirs remains poorly understood.
This article focuses on the Taiyuan Formation L5 limestone. The study examines CH4 adsorption capacity, density distribution, interaction energy, and diffusion coefficient. The research aims to reveal the mechanisms by which pore shape, aperture, and formation water influence gas adsorption and diffusion in Taiyuan Formation limestone. These findings will provide a theoretical foundation for the extraction of natural gas in the region and serve as a reference for predicting gas content in limestone in other areas.

2. Methodology

2.1. Pore Morphology

Figure 1a presents an SEM image of L5 limestone. It illustrates that the sample contains both organic and inorganic matter, clearly distinguishing between the two. It reveals significant heterogeneity in L5 limestone samples, with the yellow dashed line demarcating distinct organic (left) and inorganic (right) material domains. Limestone contains three different types of pores: inorganic, organic, and organic–inorganic. Figure 1b displays the organic pore shapes in limestone, with the most common types being slit, circular, L-shaped, and triangular. Based on these pore types, this paper conducts MD calculations for methane adsorption and diffusion.

2.2. Molecular Model Construction

2.2.1. Calcite Model

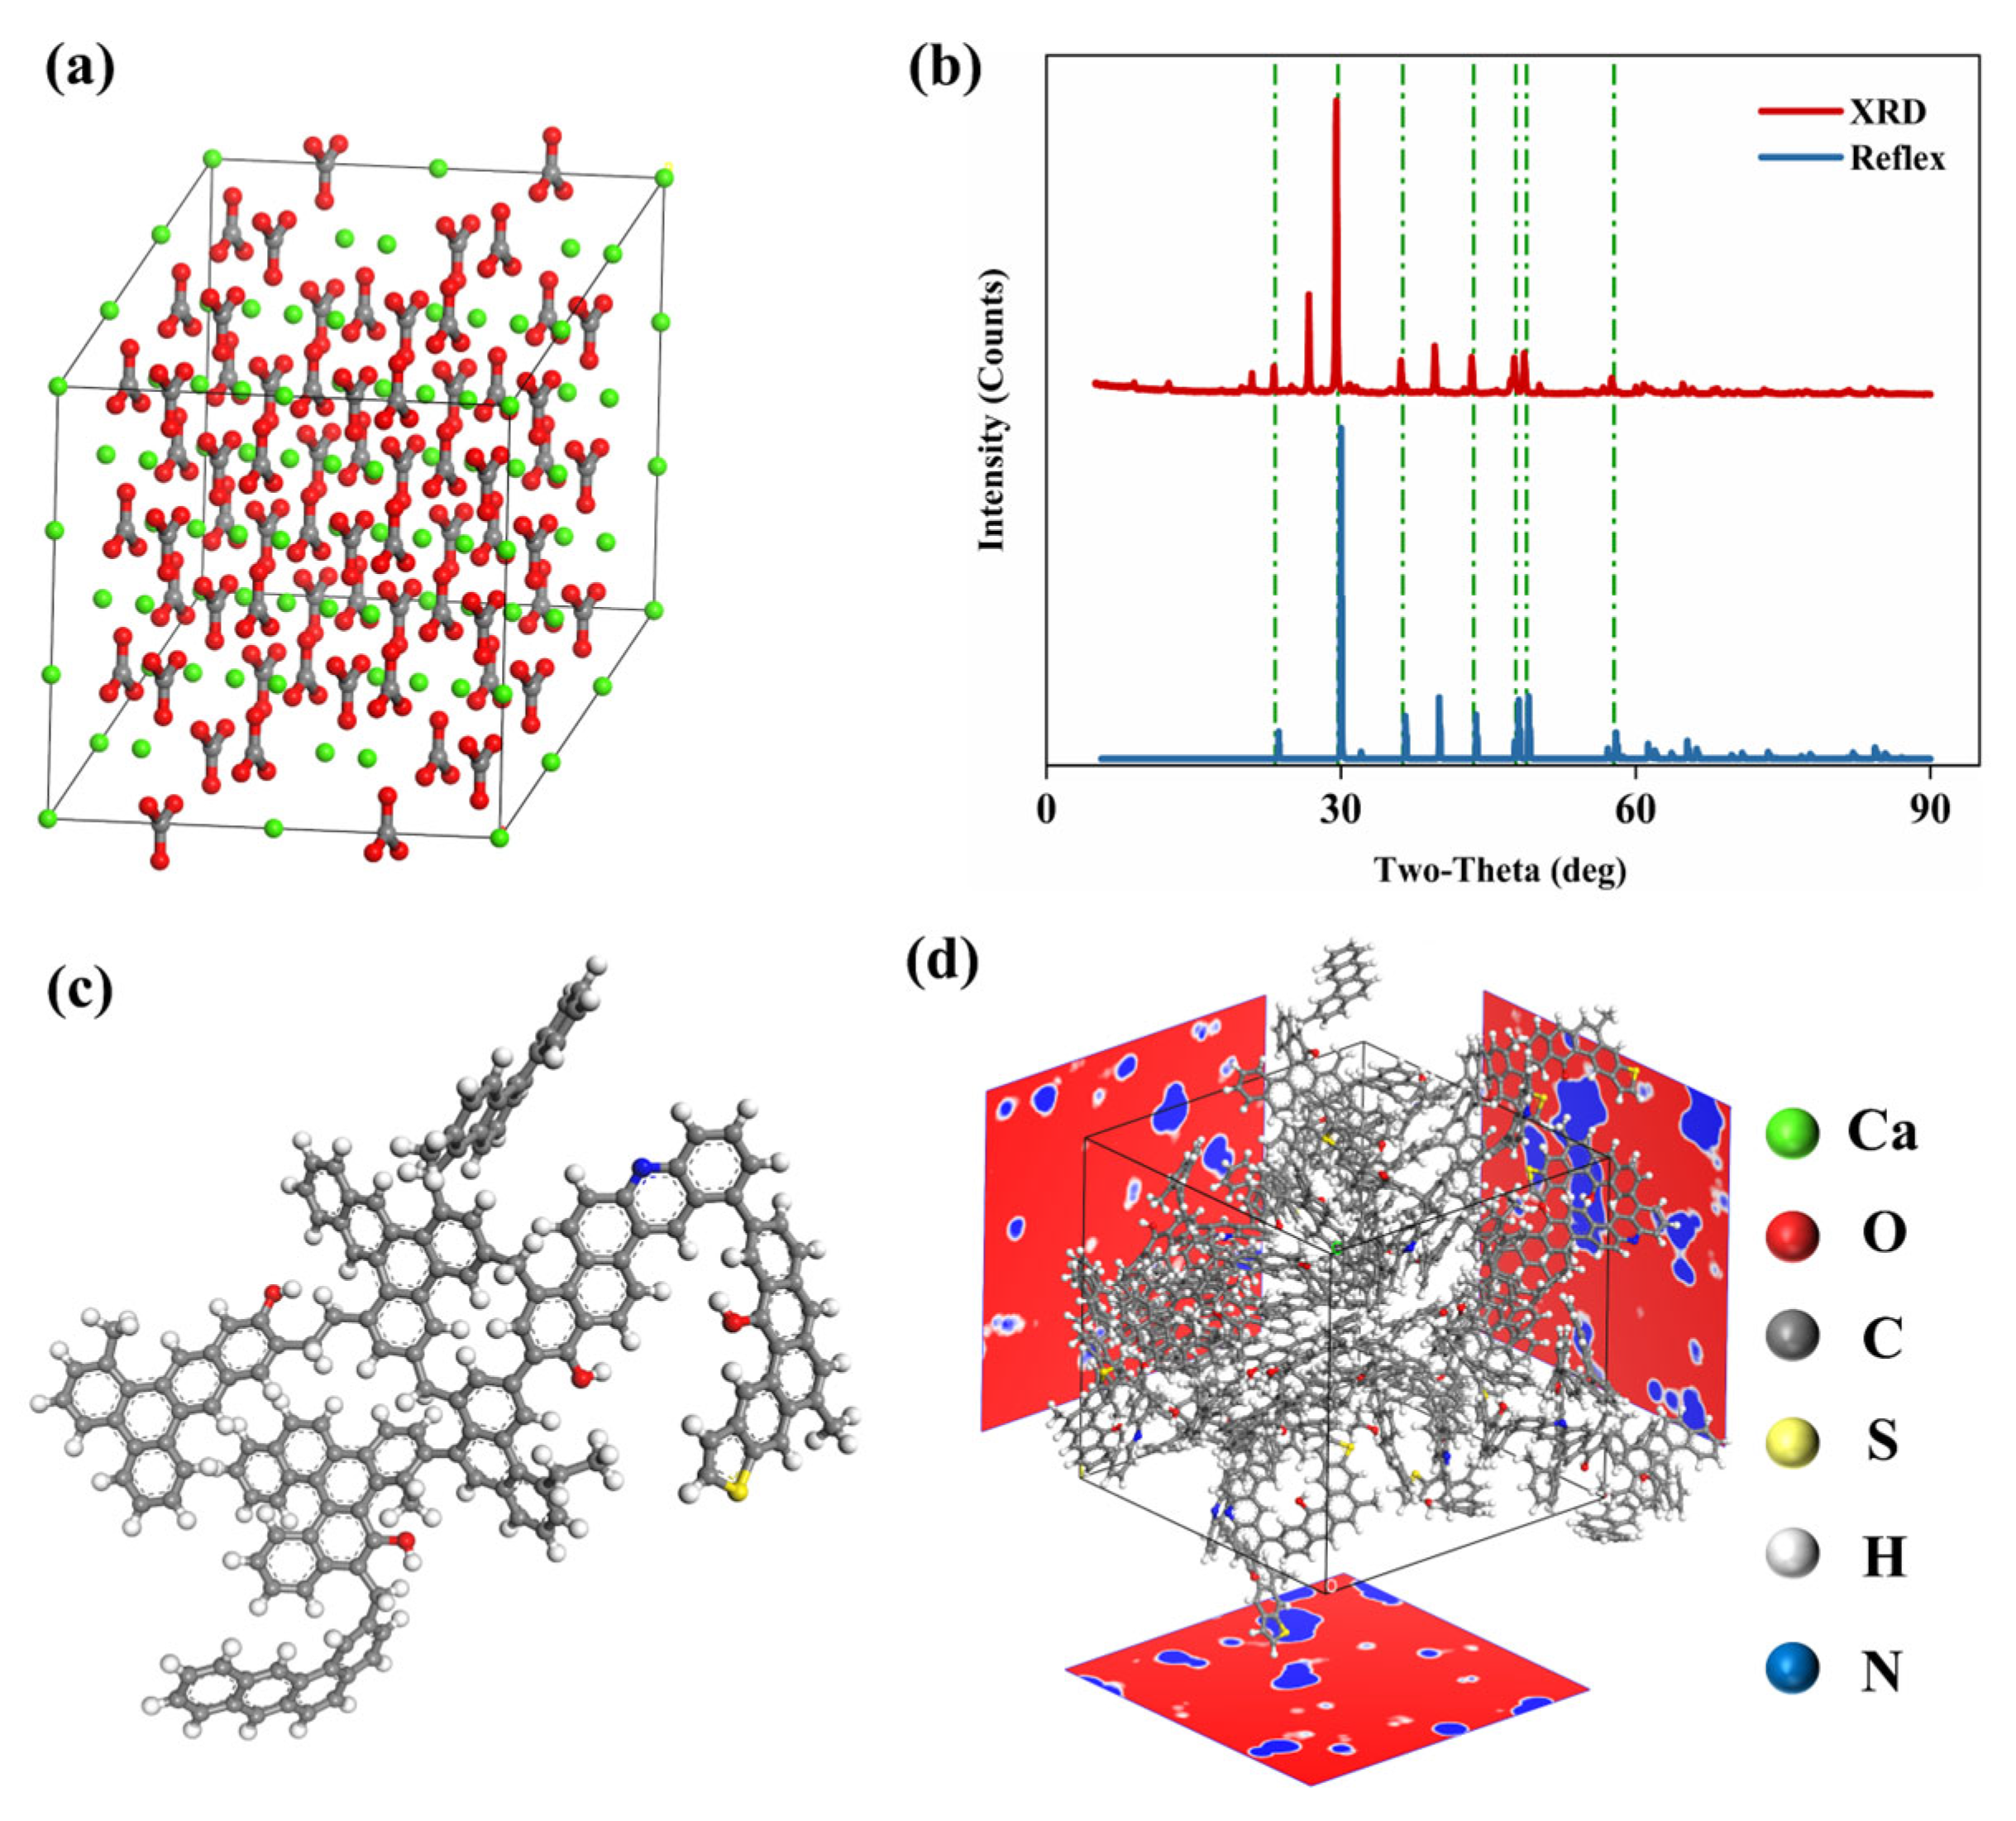
Experimental X-ray diffraction (XRD) data show that calcite is the most important mineral in L5 limestone (Figure 2b). The calcite cell constructed by Materials Studio (MS) is depicted in Figure 2a, and its cell parameters were as follows: a = 4.99 Å, b = 4.99 Å, and c = 17.0615 Å. In addition, the XRD simulation results obtained from the Reflex module demonstrate excellent agreement with experimental data, as shown in Figure 2b, thereby validating the accuracy of the calcite model.

2.2.2. Kerogen Model

According to previous studies, the majority of the organic matter in Taiyuan Formation limestone is Type I. The vitrinite reflectance (Ro) is generally higher than 1.2%, indicating a high level of maturity [30]. Consequently, this paper adopts the Type I kerogen molecular model with the Ro of 1.27%, created by Liang et al. [31]. The corresponding molecular formula is C173H111NO4S (Figure 2c). Ten kerogen units were utilized to produce a kerogen matrix with an initial density of 0.1 g/cm3. MD simulation was carried out after structural optimization and annealing. First, 600 ps (T = 800 K) was simulated in the canonical ensemble (NVT), and then the system was relaxed by gradually cooling in the isothermal–isobaric ensemble (NPT) (T = 800 K, 500 K, and 300 K; P = 20 MPa). Next, 800 ps simulation (T = 368.15 K; P = 20 MPa) was carried out in NPT to achieve a reliable kerogen structure. The final model size is 3.16 × 3.16 × 3.16 nm, and its density is 1.212 g/cm3, which falls within the high-maturity kerogen density range (1.18~1.25 g/cm3) [32]. This is depicted in Figure 2d.

2.2.3. Model Validation

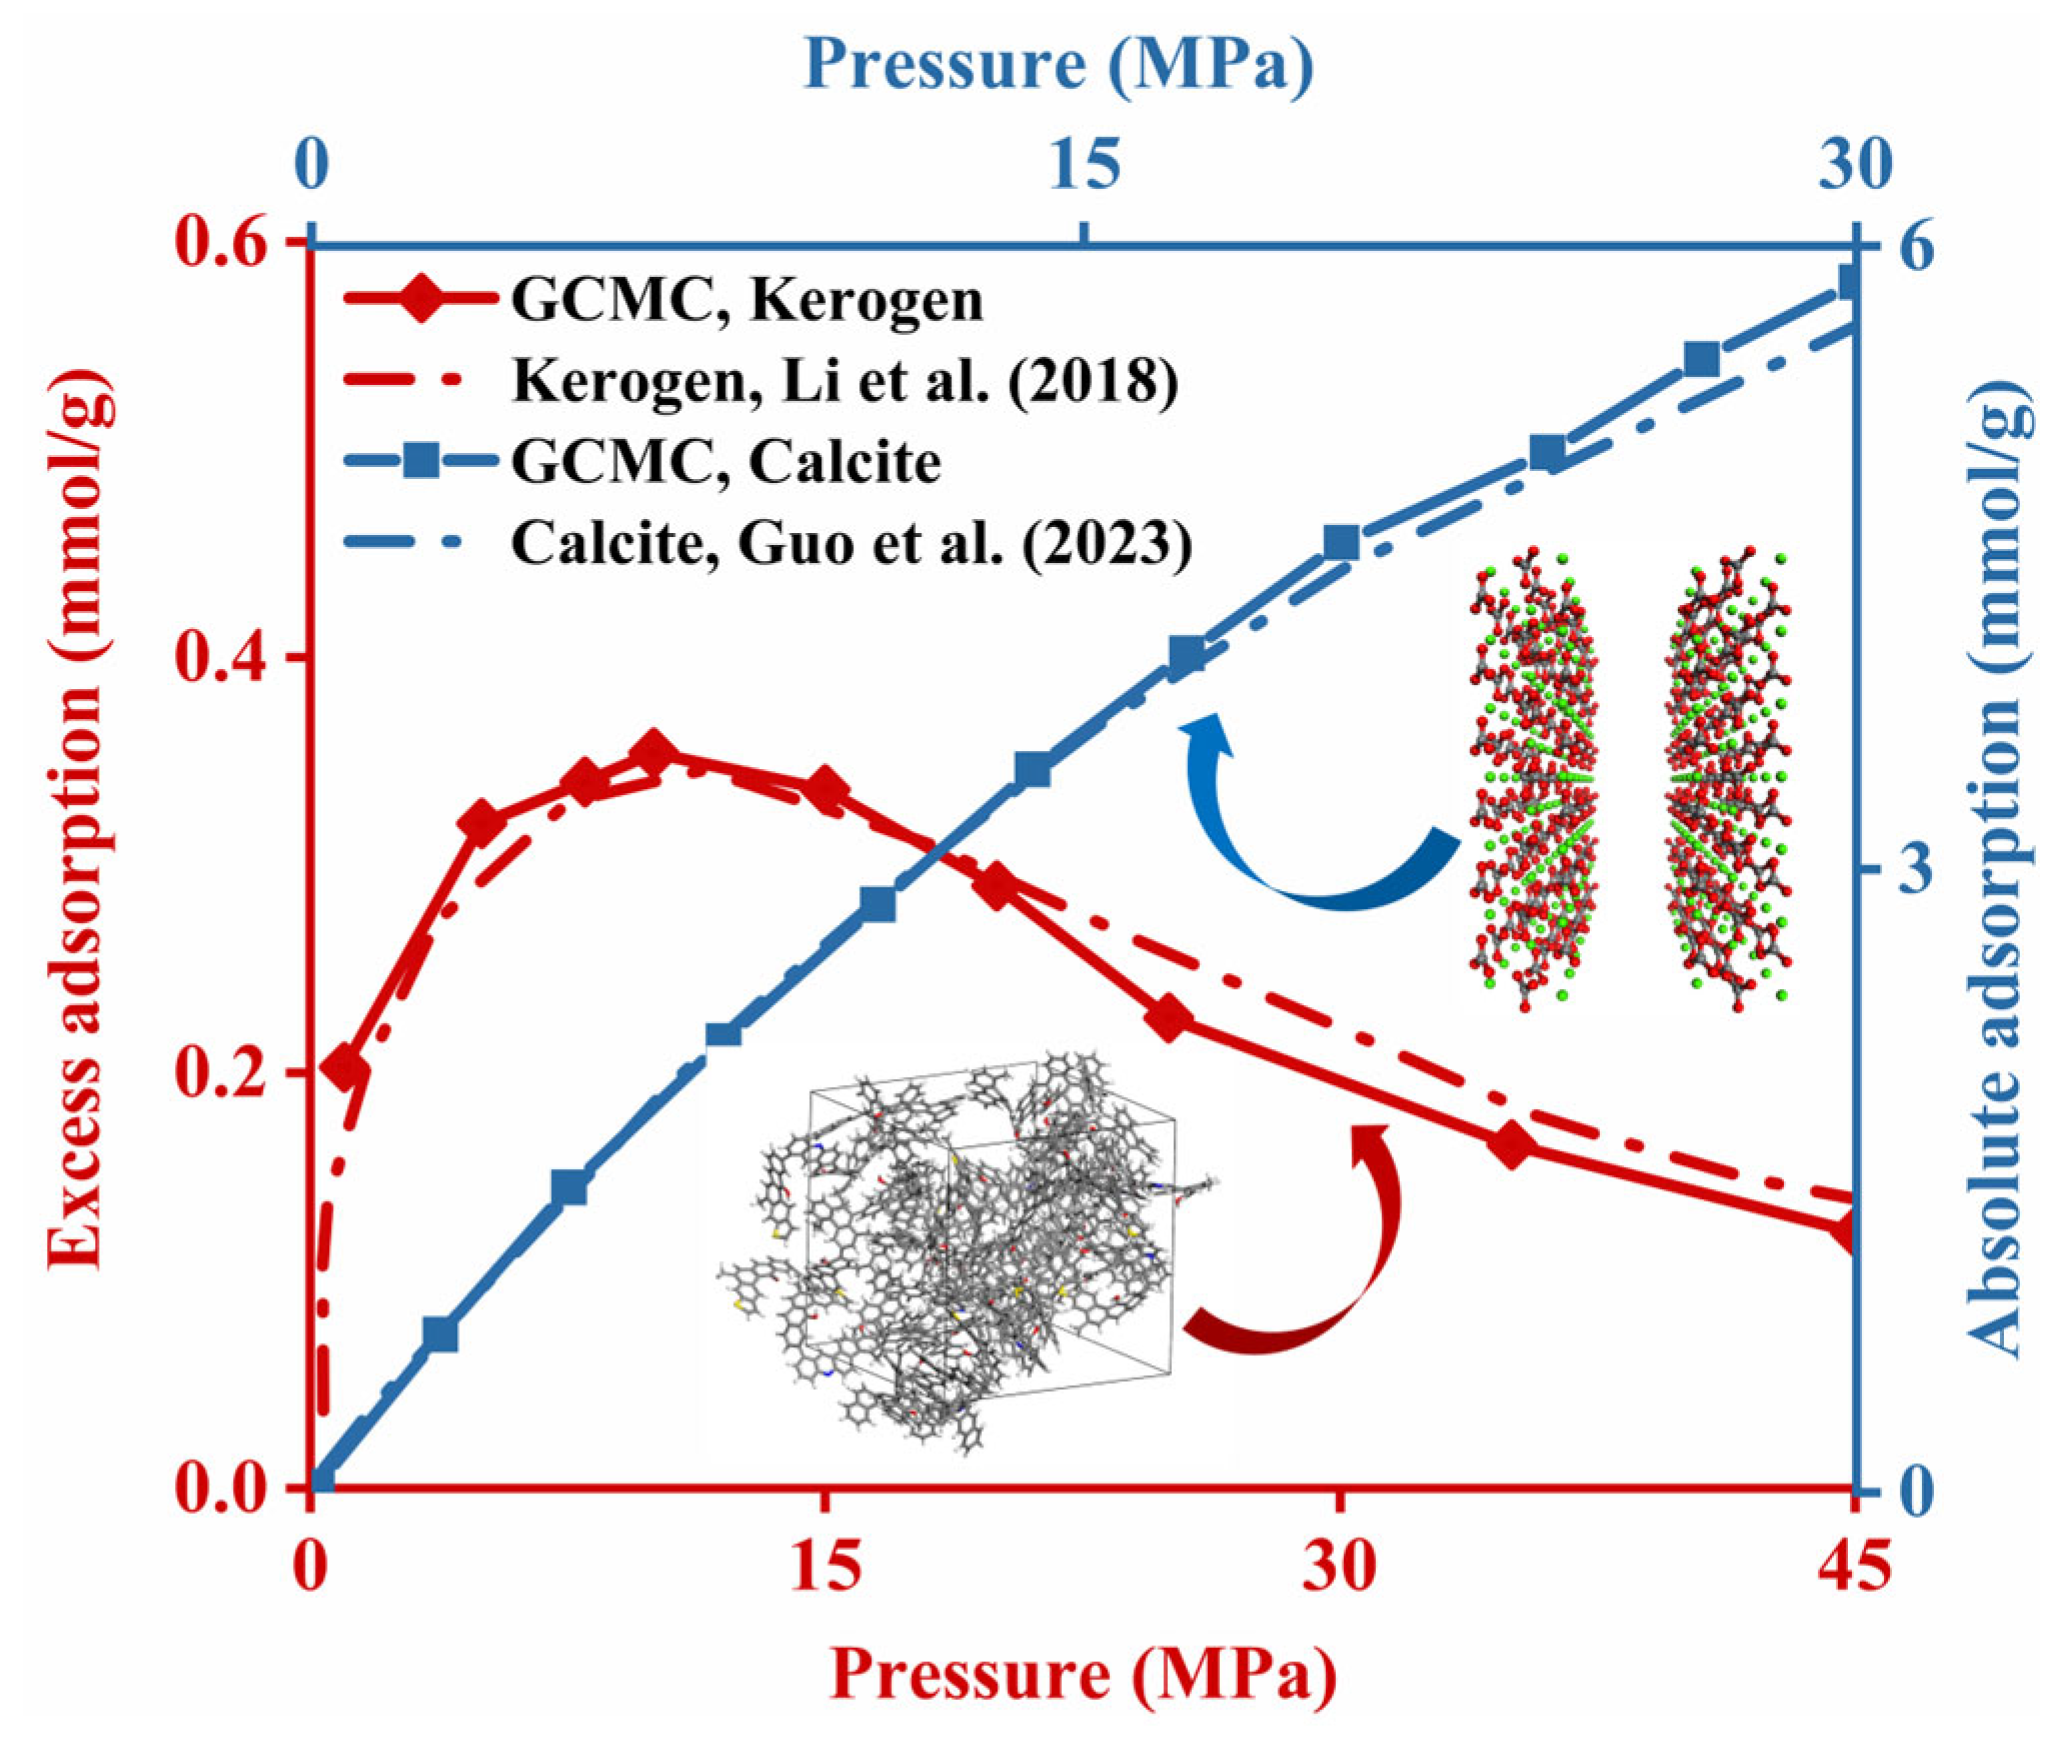
A calcite (1 0 4) slit pore was created [33,34,35]. The CH4 excess adsorption isotherms in the kerogen matrix (T = 333.15 K; P = 0~45 MPa) and the absolute adsorption isotherms in the calcite slit pore with a 2 nm pore size (T = 343.15 K; P = 0~30 MPa) were determined using the COMPASS force field [36,37,38,39,40]. The results indicate a high degree of agreement with research data from Li et al. [41] and Guo et al. [36], as described in Figure 3.

2.3. Simulation Methods and Details

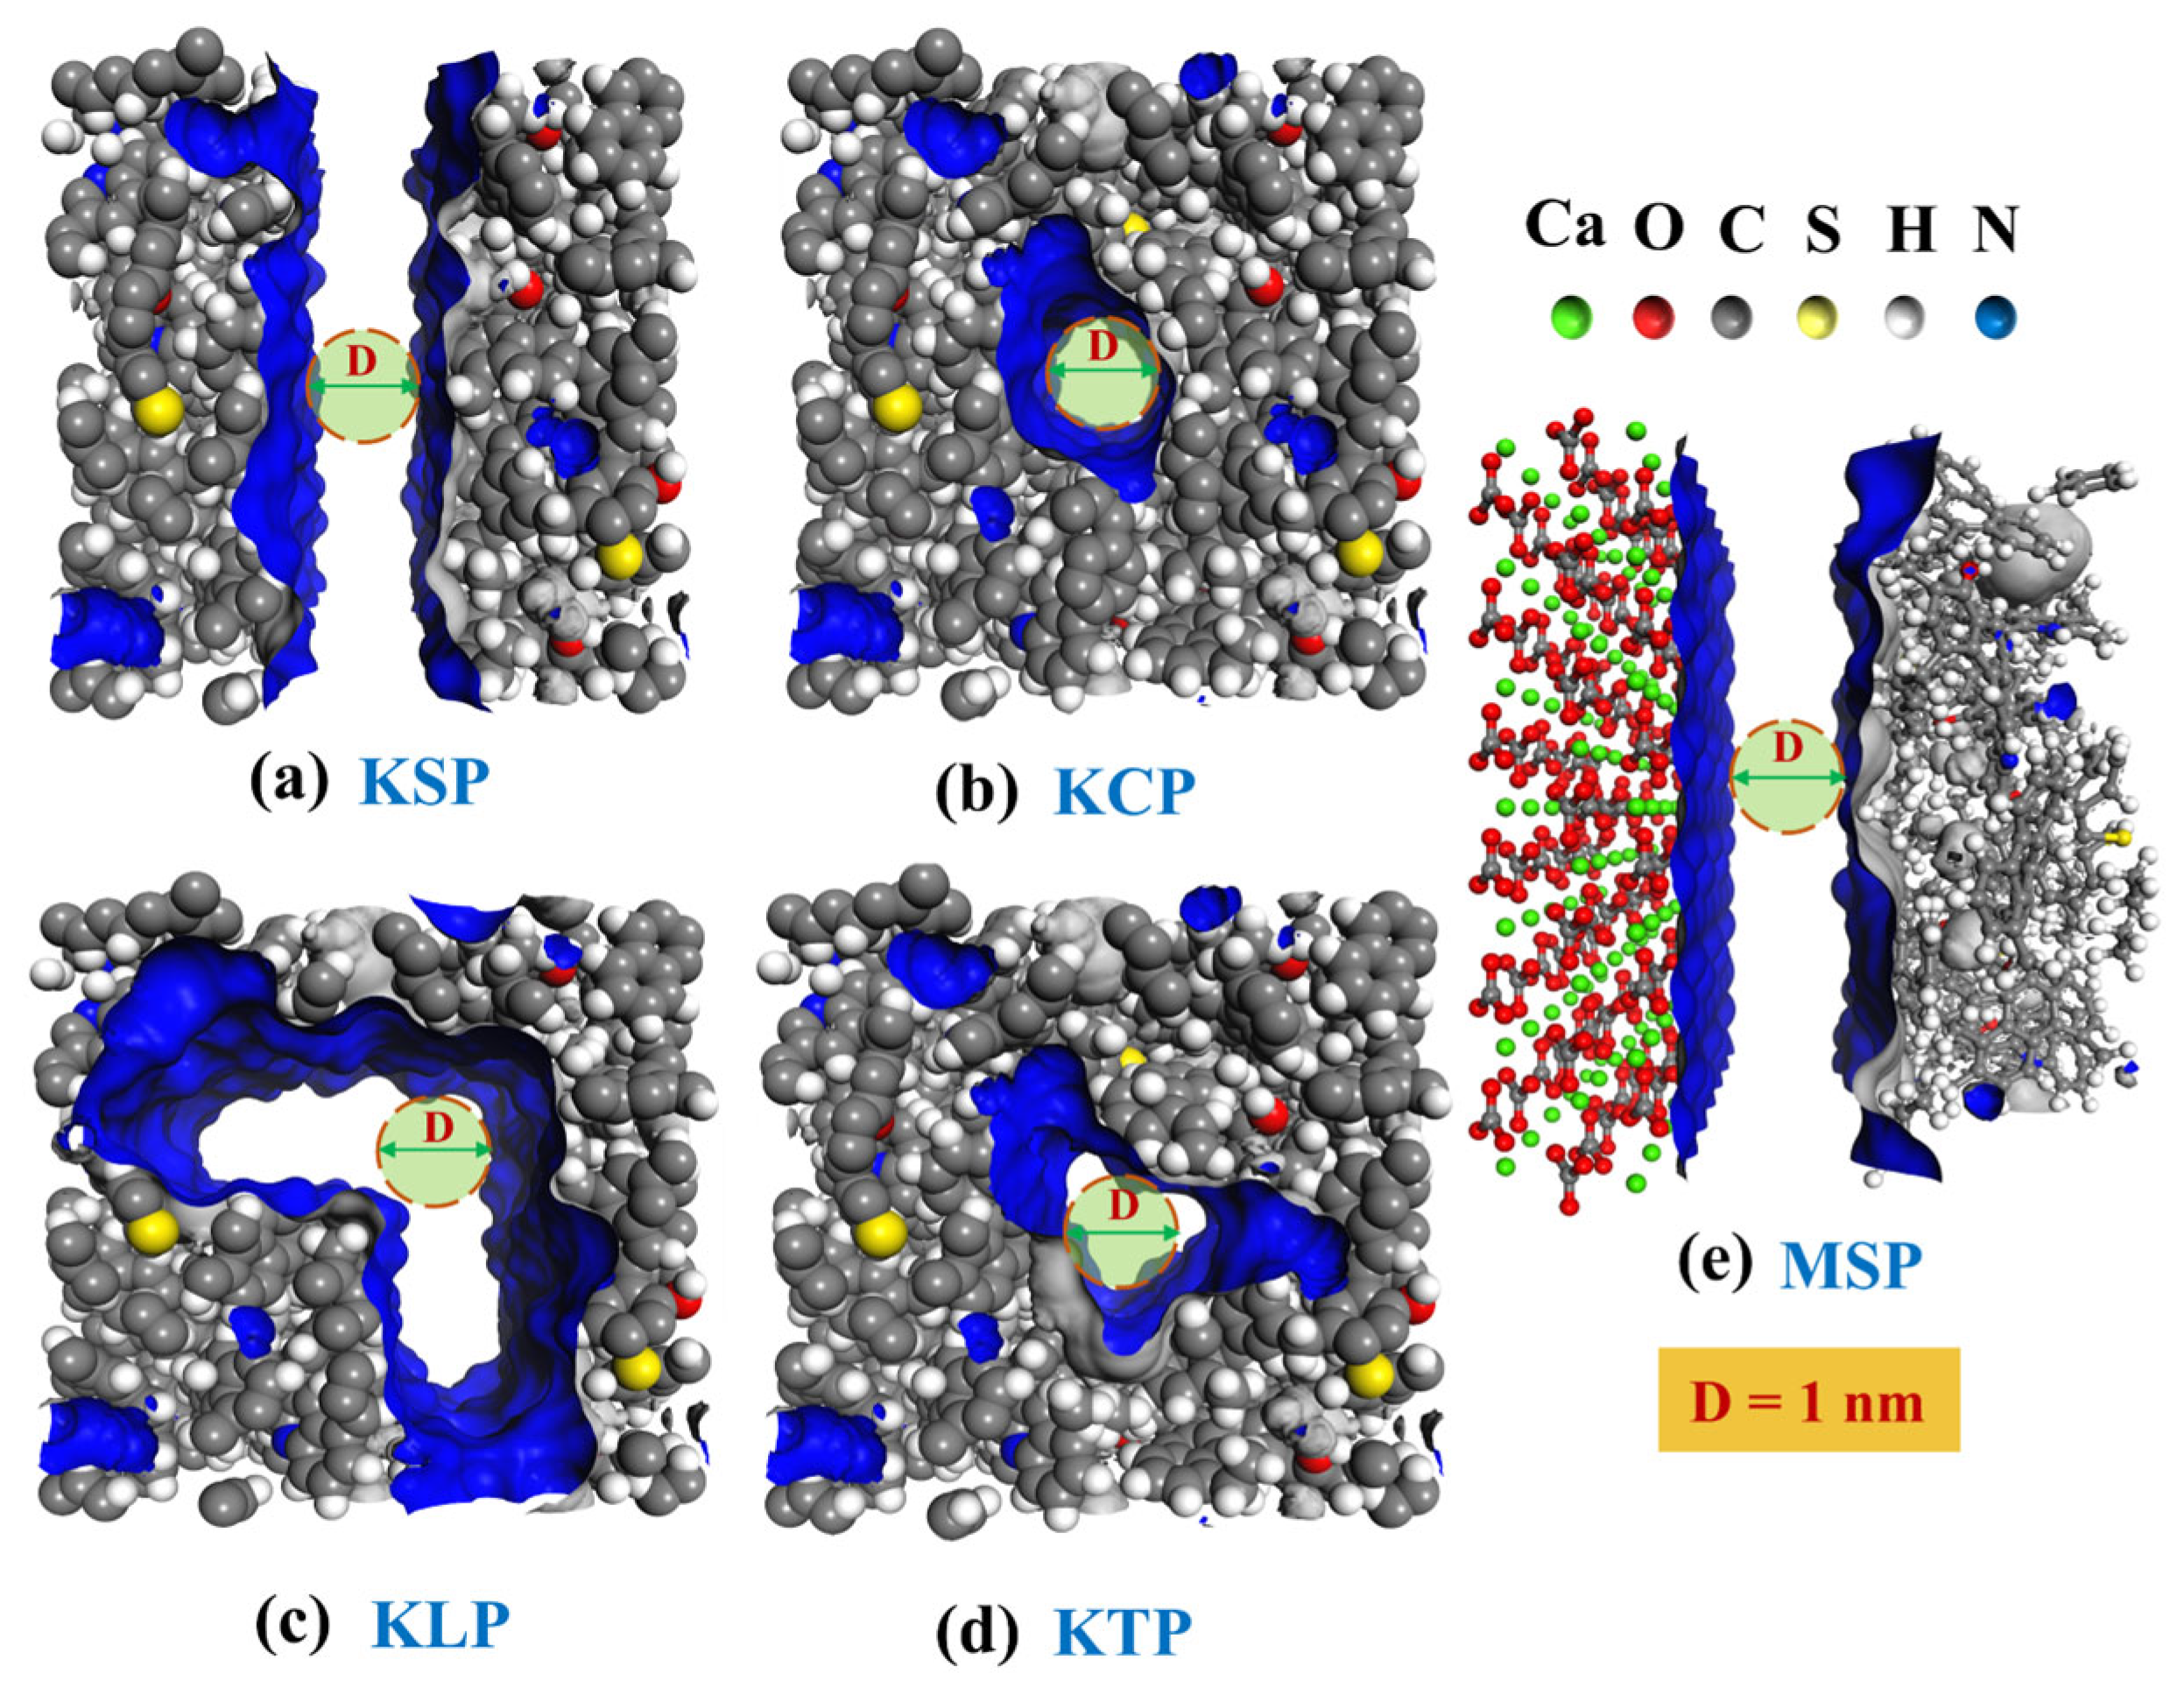
This study employs molecular simulations using Materials Studio 2020 (MS2020) to investigate CH4 behavior in various adsorption systems. GCMC simulations (Sorption module) were used to determine CH4 adsorption capacities, while MD simulations (Forcite module) analyzed density distributions, interaction energies, and diffusion coefficients. The entire computational process relied on the COMPASS force field. The limestone kerogen slit pore (KSP), kerogen circular pore (KCP), kerogen L-shaped pore (KLP), kerogen triangular pore (KTP), and calcite–kerogen composite slit pore (MSP) were formed by directly deleting atoms [42,43]. As shown in Figure 4.
The electrostatic summation and van der Waals summation methods are Ewald and atom-based, respectively. The cutoff distance is 12.5 Å. And the Peng–Robinson equation is employed to convert the pressure and fugacity. Each equilibration and production process was set to 2 × 10⁶ steps. The NVT ensemble was utilized for MD calculations, with a duration of 2000 ps. To investigate aperture effects, MSP models with 1, 2, 4, and 6 nm apertures were constructed. Moreover, to examine the formation water impact, the MSP model with an average water density ( ρ H 2 O a v g ) of 0.1 g/cm3 (M1) and 0.2 g/cm3 (M2) and containing a certain number of ions (M2-1) was prepared. The systems were equilibrated through 2000 ps NVT molecular dynamics simulations after introducing predetermined amounts of H2O and ions. At ρ H 2 O a v g = 0.1 g/cm3, the 2 nm, 4 nm, and 6 nm pores contained 64, 130, and 194 H2O molecules, respectively, while at ρ H 2 O a v g = 0.2 g/cm3, these values doubled to 127, 260, and 388. The ionic composition of Taiyuan Formation limestone water was primarily Na+-HCO3-Cl, with HCO3 constituting approximately 70% of anions [24,25]. Accordingly, at ρ H 2 O a v g = 0.2 g/cm3, the ion composition under M2-1 conditions was 10 Na+, 7 HCO3, and 3 Cl.
Investigating the methane diffusion properties in limestone is crucial for natural gas recovery. The diffusion coefficient (D) can be derived from the MSD using the following formula [44]:
D = 1 6 K M S D
where D is the CH4 diffusion coefficient, m2/s, and KMSD represents the slope of MSD, dimensionless.
The interaction energy is the fundamental reason driving the gas adsorption and dissociation in limestone reservoirs. Binding energy quantitatively represents the interaction energy between different components in the entire adsorption system.
When the system has only two components, A and B, the formula for computing the binding energy of A and B is as follows [45,46]:
E t = E a l l E A E B
When the system contains three components, A, B, and C, the formula for computing the binding energy between A and B is as follows [47]:
E t = E a l l E B + C E A + C E A E B + E C + E A + B 2
where Et represents the total binding energy, kcal/mol; Eall represents the total energy of the system, kcal/mol; and EX represents the energy of substance X, kcal/mol.
The total binding energy (Et) is the sum of the interaction between all CH4 and pore walls, which is influenced by the number of CH4. The specific binding energy (Es) is the average interaction energy between the pore wall and a single methane molecule, reflecting the average interaction strength. It is obtained by dividing the Et by the number of CH4 molecules.
Throughout the simulation process, all pore walls remained rigid, and only methane molecules, water molecules, and ions were allowed to move.

2.4. Pore Structure Characterization

Table 1 shows the organic pore structural parameters measured by a spherical probe with CH4 molecular diameter (d = 0.38 nm). KLP had the largest pore volume and specific surface area, followed by KSP, KTP, and lastly KCP.

3. Results and Analysis

3.1. Effect of Pore Shape

3.1.1. Effect of Pore Shape on CH4 Adsorption Capacity

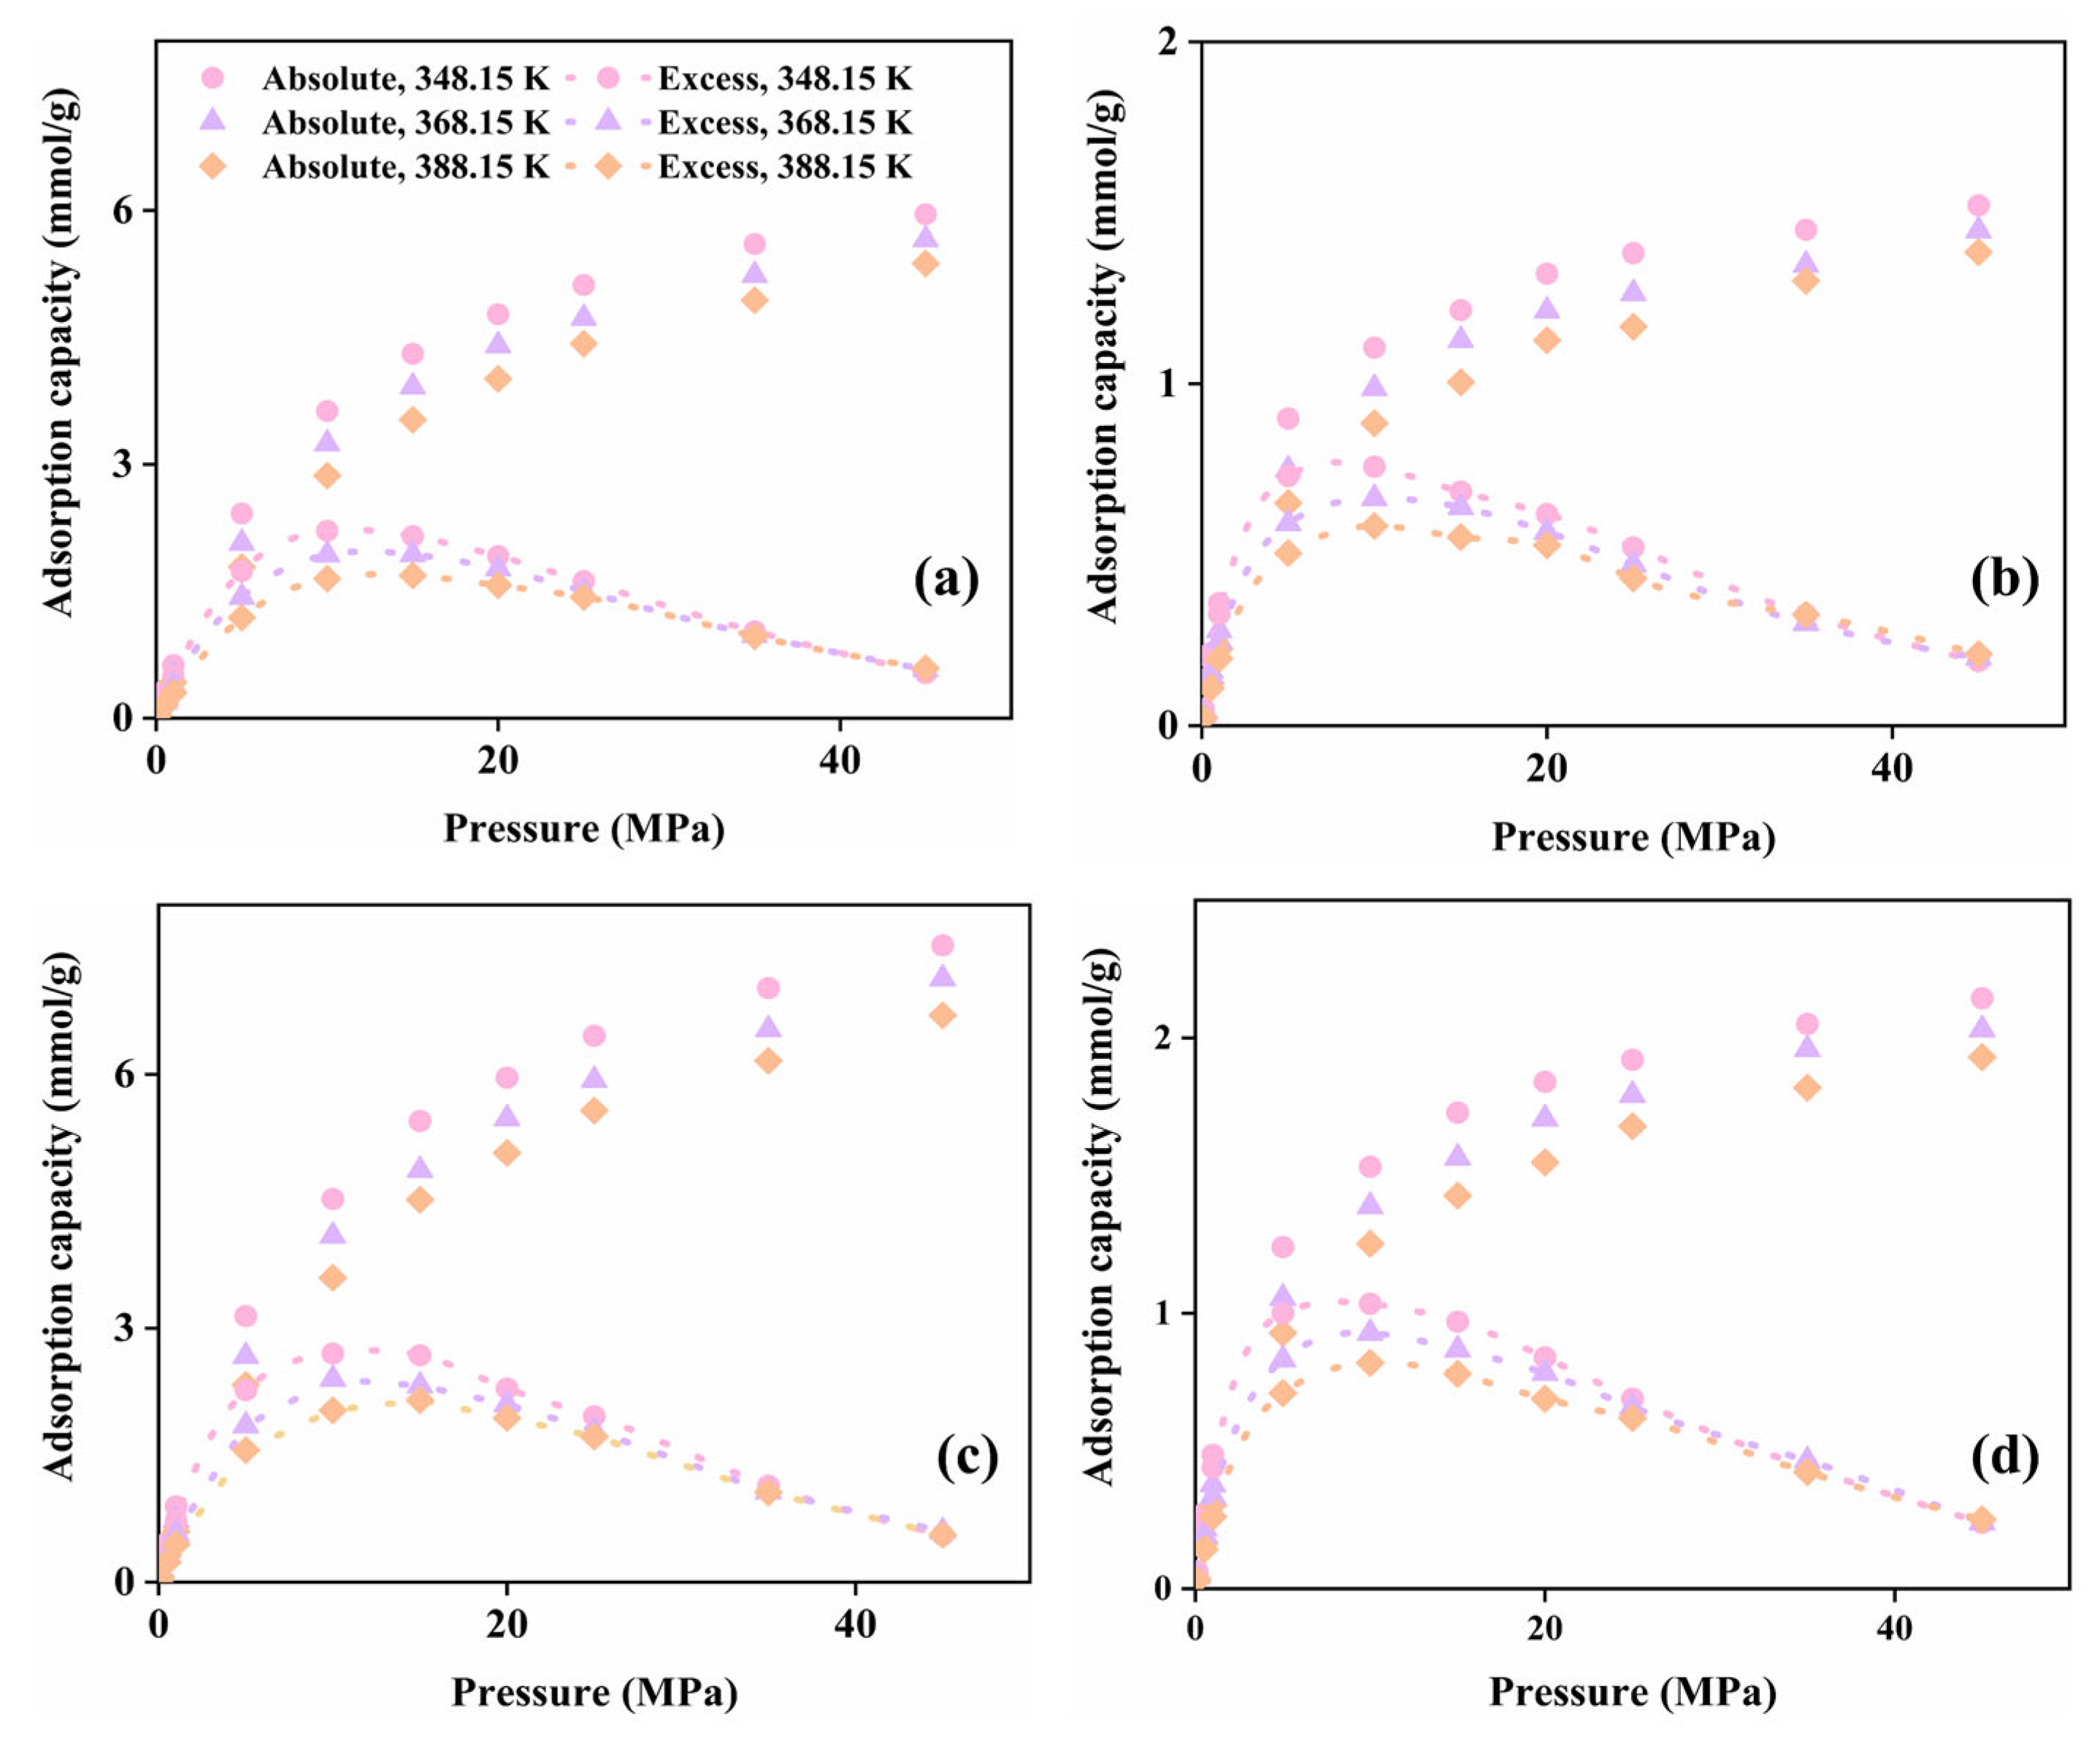
Absolute adsorption capacity refers to the total amount of adsorbed gas, while excess adsorption capacity is the difference between the gas load with pore walls and that without pore walls (only free gas) with identical pore volume, pressure, and temperature [48]. Figure 5 reveals the isothermal adsorption curves for different organic pore shapes. Specifically, absolute adsorption capacity is proportional to pressure and inversely proportional to temperature, indicating that CH4 adsorption on limestone is an exothermic process. Additionally, excess adsorption first rises and subsequently falls with rising pressure, with the slope of the decline becoming larger as temperature decreases. The optimal adsorption pressure, corresponding to the excess adsorption peak, varies with different pore shapes and temperature conditions. At 348.15 K, the optimal pressure for KSP and KLP is around 10 MPa, while for KCP and KTP, it is approximately 5 MPa. However, at 388.15 K, the optimal pressure for KSP and KLP rises to about 15 MPa, while it is approximately 10 MPa for KCP and KTP. The variation observed can be attributed to the fact that gas molecules are more readily adsorbed at lower temperatures, which in turn decreases the necessary equilibrium pressure. Furthermore, a higher optimal adsorption pressure is also a consequence of an increased number of available adsorption sites.
Figure 6 depicts the adsorption isotherms of organic pores under various adsorption units (T = 368.15 K; P = 1~45 MPa). When the adsorption unit is mmol/g, KLP shows the maximum adsorption capacity, while KCP has the lowest. This is attributed to KLP’s larger specific surface area of 1141.99 m2/g, which is approximately 6.4 times that of KCP. When the adsorption capacity unit is mmol/m2, the adsorption capacity is ranked as KCP, KTP, KLP, and KSP. This reflects the average interaction strength between gas and pores. In the case of the adsorption unit being mmol/cm3, KCP and KTP show significantly higher adsorption capacities than KSP and KLP at lower pressures, though this advantage diminishes with growing pressure. The larger adsorption capacity of KCP and KTP at low pressure is due to their stronger interaction with CH4 molecules. However, the limited surface area per unit volume results in fewer adsorption sites, leading to quicker saturation of adsorption as pressure rises. Consequently, this slows the growth of adsorption capacity in the later stages. The surface areas per unit volume for KSP, KCP, KLP, and KTP are 2483.9 m2/cm3, 1965.2 m2/cm3, 2394.1 m2/cm3, and 2263.7 m2/cm3, respectively. In short, the difference in the microstructure characteristics of adsorbents can be reflected by different adsorption measurement dimensions.

3.1.2. Effect of Pore Shape on CH4 Adsorption Density

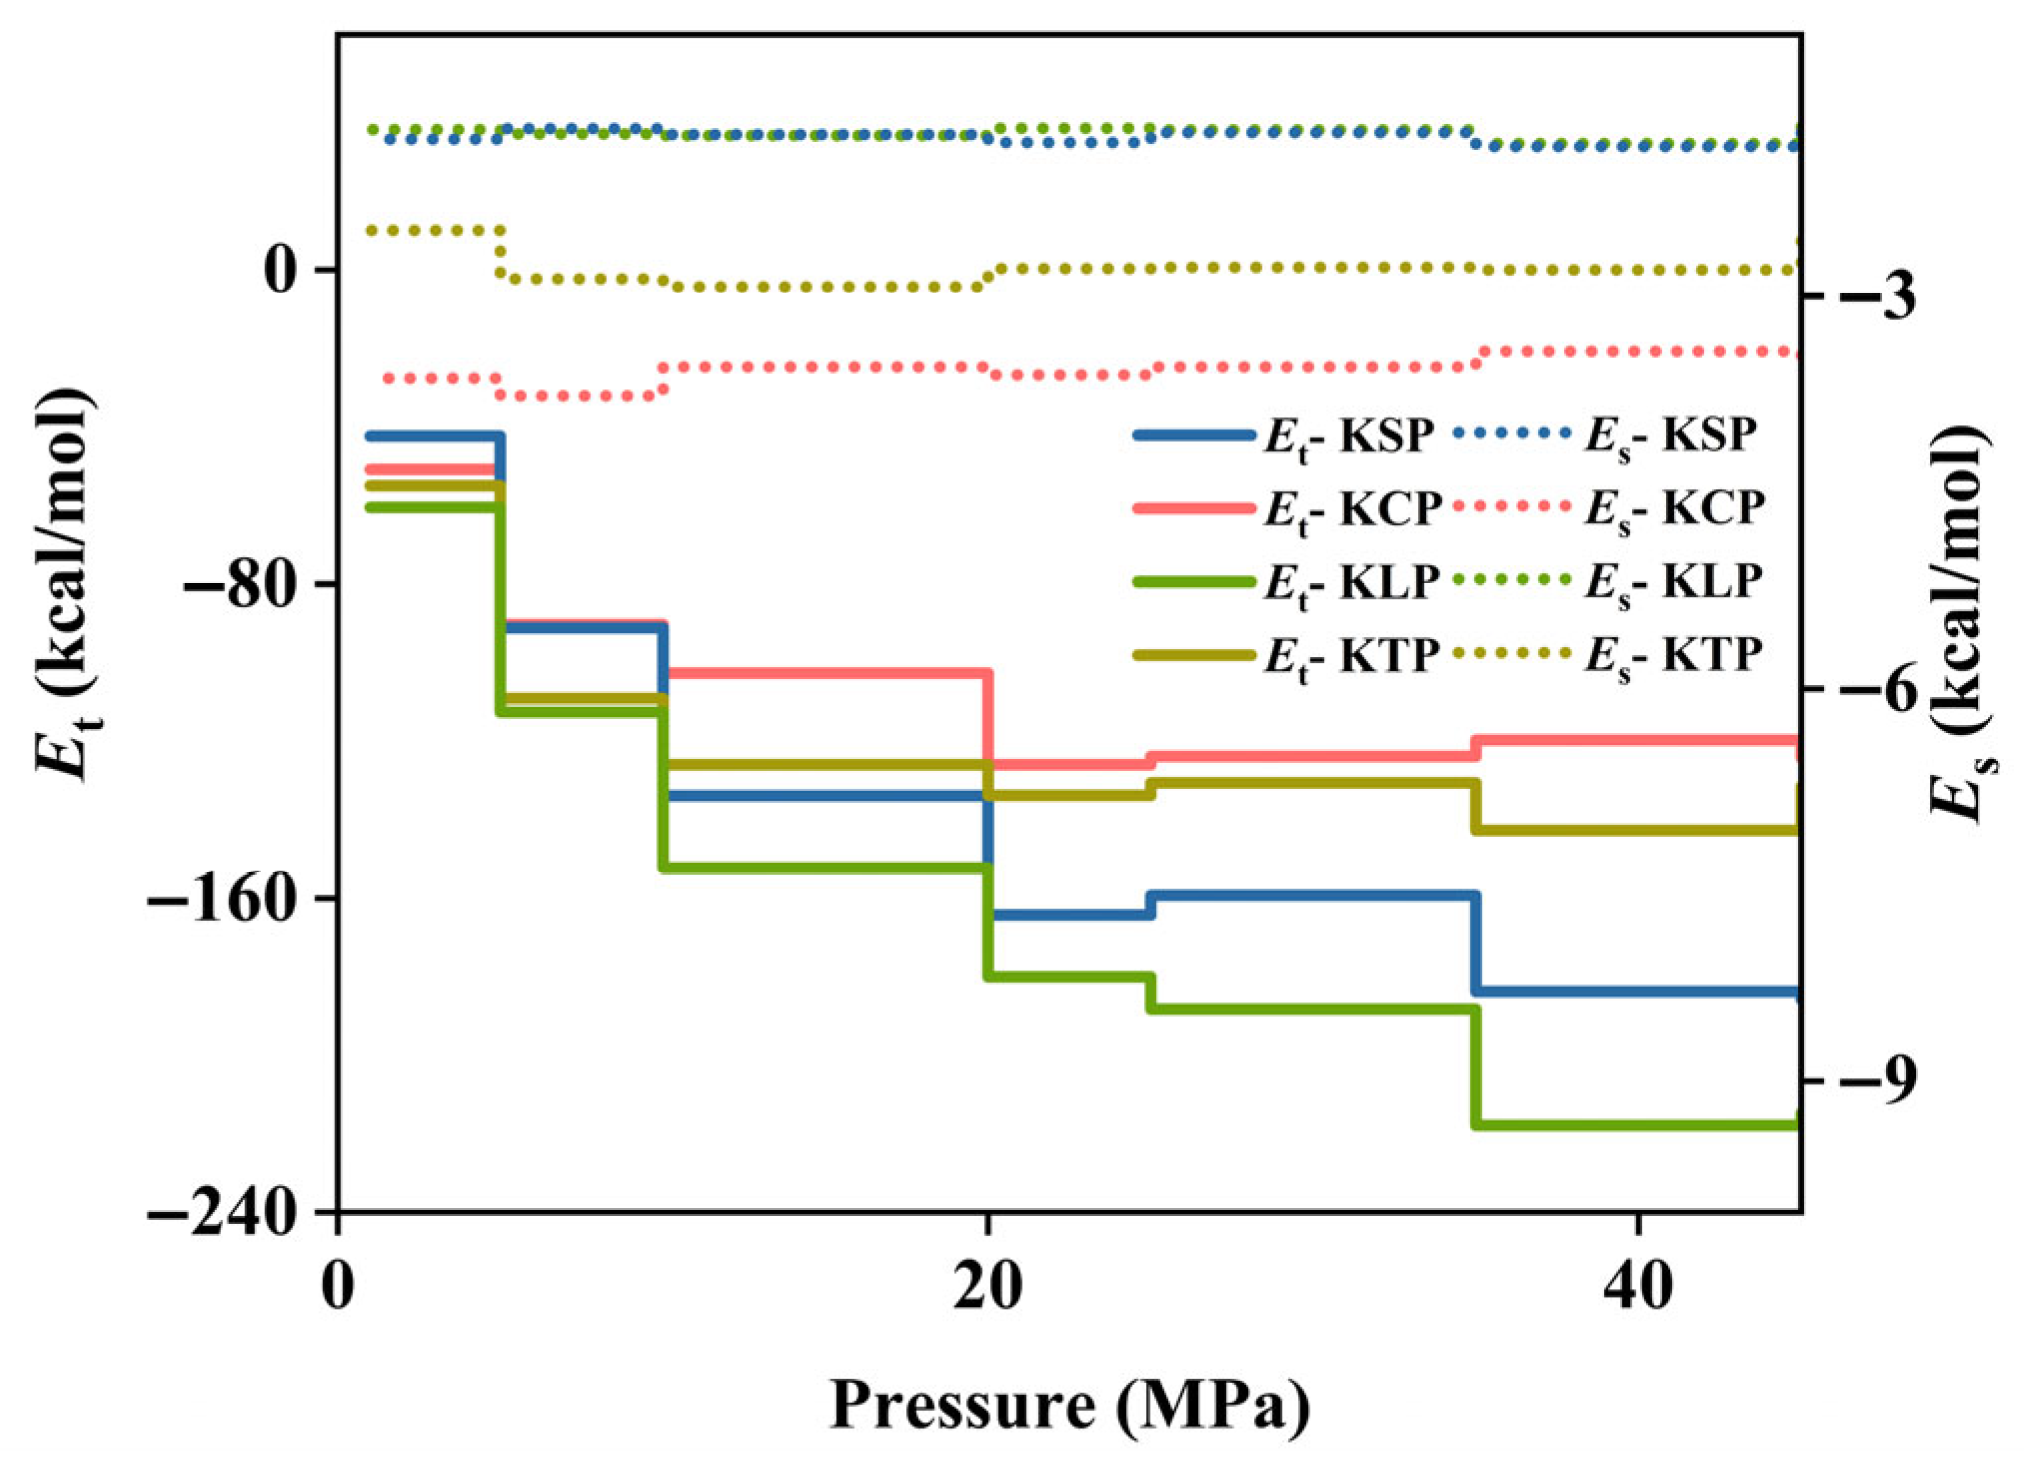
To intuitively understand the CH4 distribution characteristics in different organic pore shapes, the CH4 density distribution (1 0 0) and the density field in four organic pores were plotted. The gas density peak is created close to the pore wall. Taking KSP as an example (Figure 7), two distinct gas adsorption layers are evident near the pore surface, corresponding to the CH4 high-density state. This is because a deeper potential well is formed around the pore wall, which promotes the adsorption and accumulation of gas. Figure 7 clearly shows that CH4 density in the pores increases with rising pressure and decreasing temperature. The proportion of the high-density region of methane (blue) in the density field diagram increases as pressure rises. Conversely, as the temperature drops from 388.15 K to 348.15 K, the gas adsorption layer peak density climbs from 0.35 g/cm3 to 0.4 g/cm3 at 20 MPa. The bending of the hole wall shape leads to the overlapping of the potential energy field, the enhancement of the coupling effect, and the improvement of the interaction strength. This leads to the ranking of interaction forces as KCP, KTP, KLP, and KSP, as shown in Figure 8. Consequently, methane preferentially adsorbed near the corner formed by the pore wall bending, such as KCP and at the sharp corner of KTP.

3.1.3. Effect of Pore Shape on CH4 Diffusion

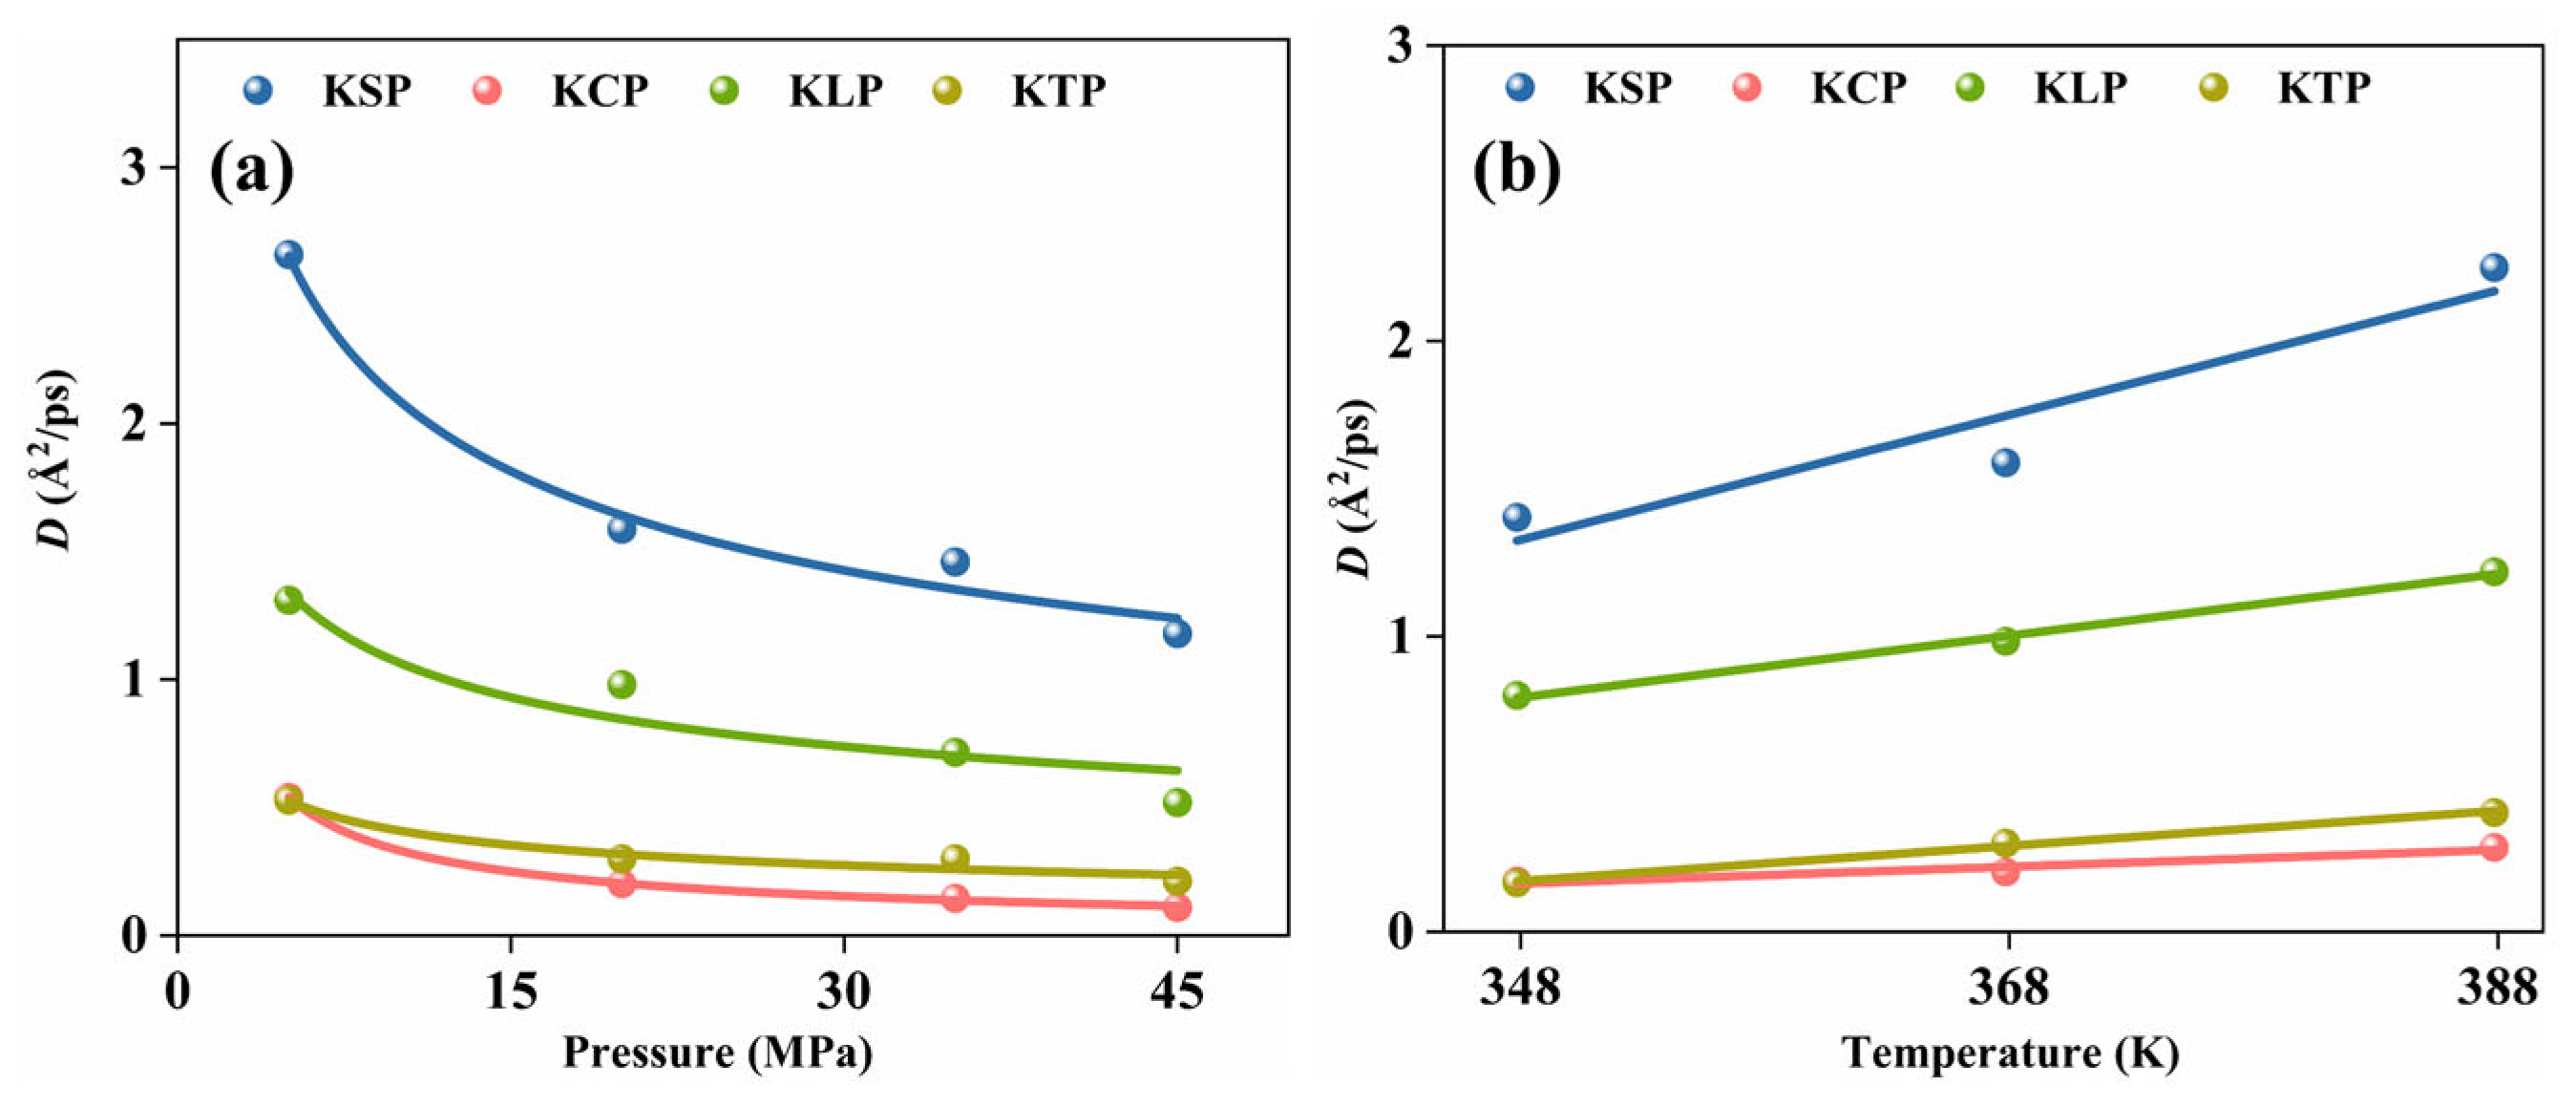
The D of CH4 in organic pores is shown in Figure 9. The results indicate that, from 5 MPa to 45 MPa, the D for KSP, KCP, KLP, and KTP decreases by 1.48 Å2/ps, 0.43 Å2/ps, 0.79 Å2/ps, and 0.32 Å2/ps, respectively. This indicates that D is inversely proportional to the pressure change. As pressure rises, the CH4 density in the pores rises, enhancing molecular collisions and ultimately inhibiting diffusion. From 348.15 K to 388.15 K, the diffusion coefficients for KSP, KCP, KLP, and KTP increase by 0.84 Å2/ps, 0.11 Å2/ps, 0.42 Å2/ps, and 0.24 Å2/ps, respectively. This shows that D is positively correlated with temperature change. Elevated temperatures enhance molecular thermal motion, thereby facilitating methane diffusion.
Figure 9 shows that the ranking of D is KSP > KLP > KTP > KCP. The reason is that, on one hand, KTP and KCP have narrow pore volumes and limited gas transport space. This reduces the mean free path of molecules, increases collision frequency, and raises diffusion resistance. On the other hand, there is a higher Es between KTP, KCP, and CH4 (Figure 8), making it difficult for gas molecules to escape their confinement. Furthermore, although KLP has a larger pore volume compared to KSP, and both have nearly equal Es with gas molecules, the D value of KLP is still lower than that of KSP. This is due to the greater curvature of KLP, which adversely affects gas diffusion. This indicates that the shape of the pores significantly influences methane diffusion. Slit pores, with their larger specific surface area and pore volume, relatively weaker interaction strength with gas molecules, and lower curvature, are the most favorable pore shape for gas adsorption and diffusion.

3.2. Effect of Pore Aperture

3.2.1. Effect of Pore Aperture on CH4 Adsorption Capacity

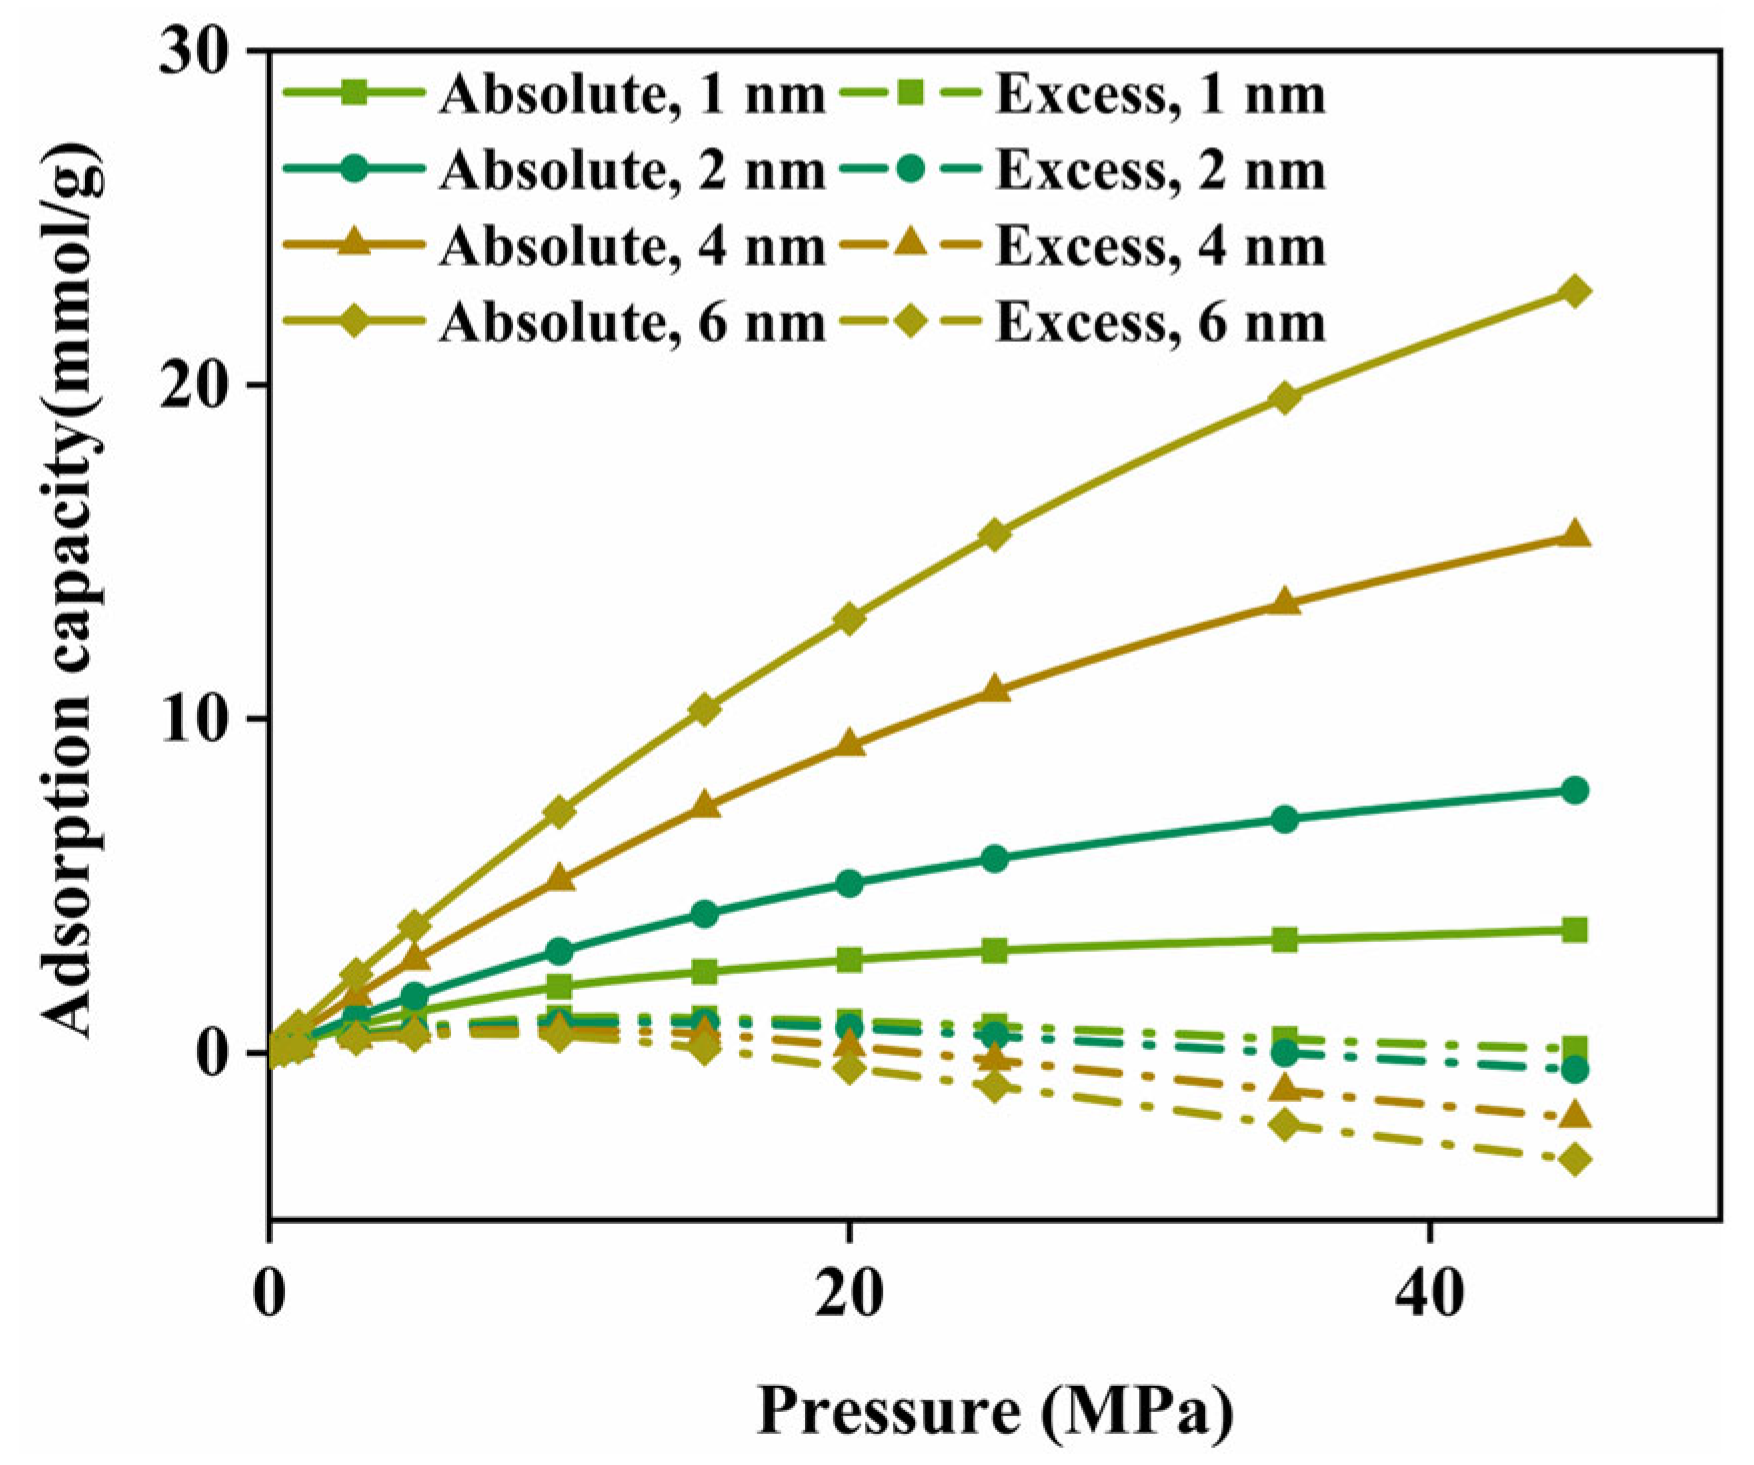
Figure 10 exhibits the adsorption isotherms of MSP with varying pore widths at 368.15 K. As pore diameters grow, the excess adsorption capacity falls while the absolute adsorption capacity rises. Larger pore sizes enhance the adsorption capability of the system. This is because the expansion of the pore aperture provides more space for gas adsorption. In addition, it reduces intermolecular repulsion and promotes the formation of the second adsorption layer. As illustrated in Figure 11, a second adsorption layer can be observed in all pores except for the 1 nm pore at high pressure. When the aperture is small, the interaction between the gas and the pore wall is significant, and the gas diffusion effect dominates. As the aperture increases, the number of free gas molecules at the center of the pore increases, the interaction between gas molecules is enhanced, and the collision frequency between molecules increases, gradually transforming into a transmission mode dominated by viscous flow. Excess adsorption strongly correlates with the density difference between the adsorbed and free phases. In the 1 nm pore, the potential energy overlap of the pore walls leads to a micropore-filling effect, resulting in the maximum density of the adsorbed phase with no free phase present. When the pore aperture expands, the overlapping effect weakens, the gas adsorbed phase’s density drops, and the excess adsorption amount declines. This aligns with the results of Wang et al. [49].

3.2.2. Effect of Pore Aperture on CH4 Adsorption Density

The CH4 density distribution (T = 368.15 K; P = 0.5~45 MPa) and the density field (T = 368.15 K; P = 5 MPa, 20 MPa, 45 MPa) in MSP with various apertures are demonstrated in Figure 11. The CH4 adsorption layer density peak value on the calcite side is considerably higher compared to the kerogen side. However, according to the density field map, CH4 is more easily adsorbed on the kerogen surface. This is because CH4 exhibits stronger interactions with kerogen than with calcite. The rougher surface on the kerogen side can explain the lower peak gas density. The rougher the surface, the thicker the adsorption layer and the lower the peak adsorption density. The findings of Mohammed and Gadikota [50] and Babaei et al. [51] are consistent with this.

3.2.3. Effect of Pore Aperture on CH4 Diffusion

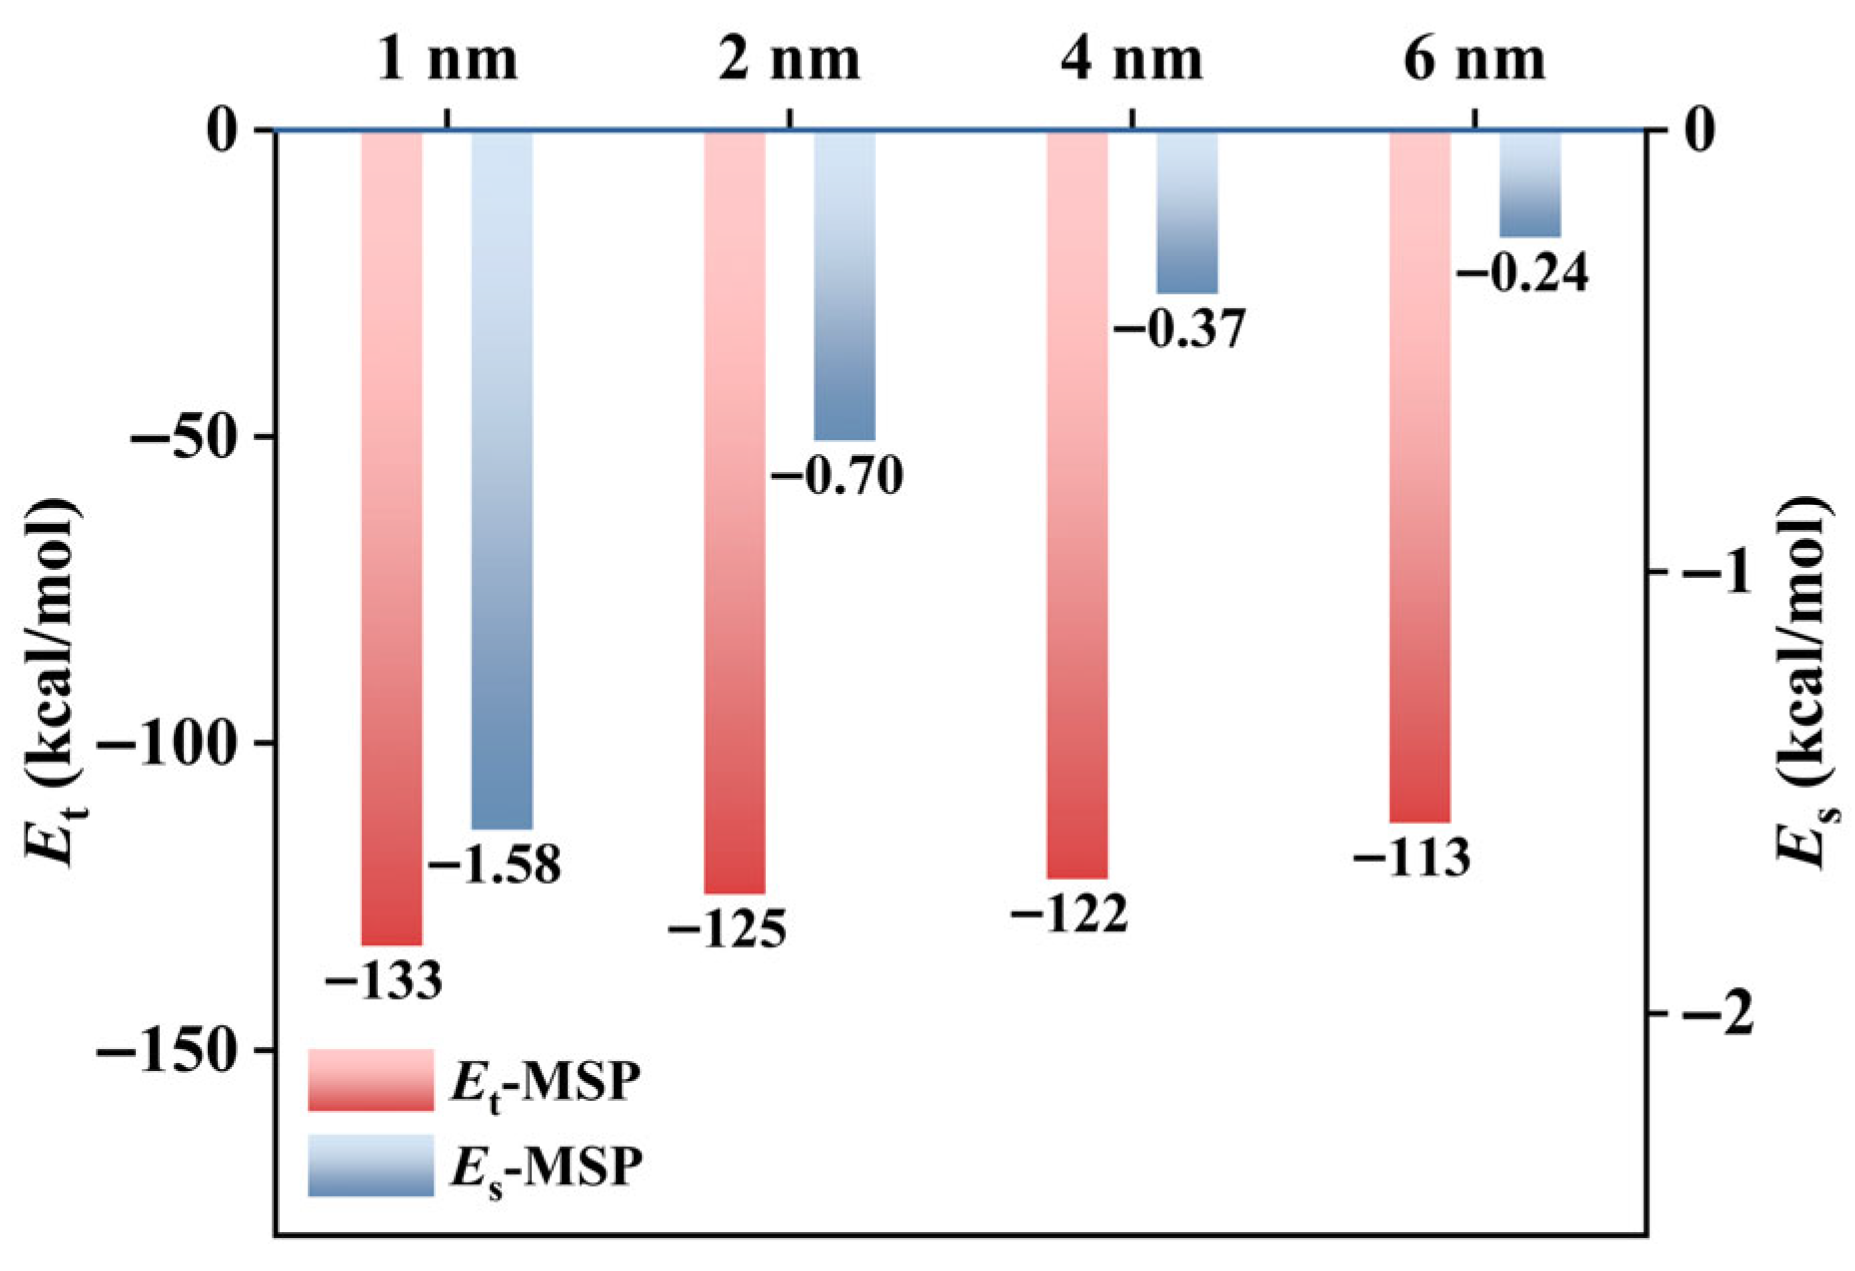
Figure 12 illustrates the binding energy (T = 368.15 K; P = 45 MPa) of CH4 within MSPs of different pore sizes. Figure 13a,b present the D and MSD of CH4 in varying pore diameters, respectively. For apertures of 1, 2, 4, and 6 nm, the Et values are −133, −125, −122, and −112 kcal/mol, respectively, while the Es values are −1.58, −0.7, −0.37, and −0.24 kcal/mol. The D values are 3.3, 10.9, 21.8, and 29.7 Å2/ps, respectively. Both the absolute values of binding energy and Ds are inversely proportional to the pore width. This phenomenon arises from the more pronounced potential energy superposition effect of the pore walls in smaller pores, leading to a higher adsorbed phase proportion. As the aperture grows, the free-phase gas gradually becomes dominant. Compared to the adsorbed state, the free gas demonstrates negligible interfacial interactions with pore walls, and free gas diffuses more readily than adsorbed gas. Thus, larger pore sizes contribute to an enhanced overall diffusion rate. Notably, the difference in diffusion coefficients between different pore sizes reduces as pressure rises, indicating that the effect of pore aperture wanes gradually. The potential mechanism may be that under low pressure, lower gas density leads to reduced interactions between gases, resulting in non-continuous flow (gas diffusion) as the main mode of gas transport [52]. And the Knudsen diffusion coefficient is proportional to the pore size [53]. As the pore diameter increases, the migration velocity of confined molecules rises significantly. In contrast, under high-pressure environments, frequent intermolecular collisions make viscous flow the dominant transport mechanism. This weakens the aperture effect.

3.3. Effect of Formation Water

3.3.1. Effect of Formation Water on CH4 Adsorption Capacity

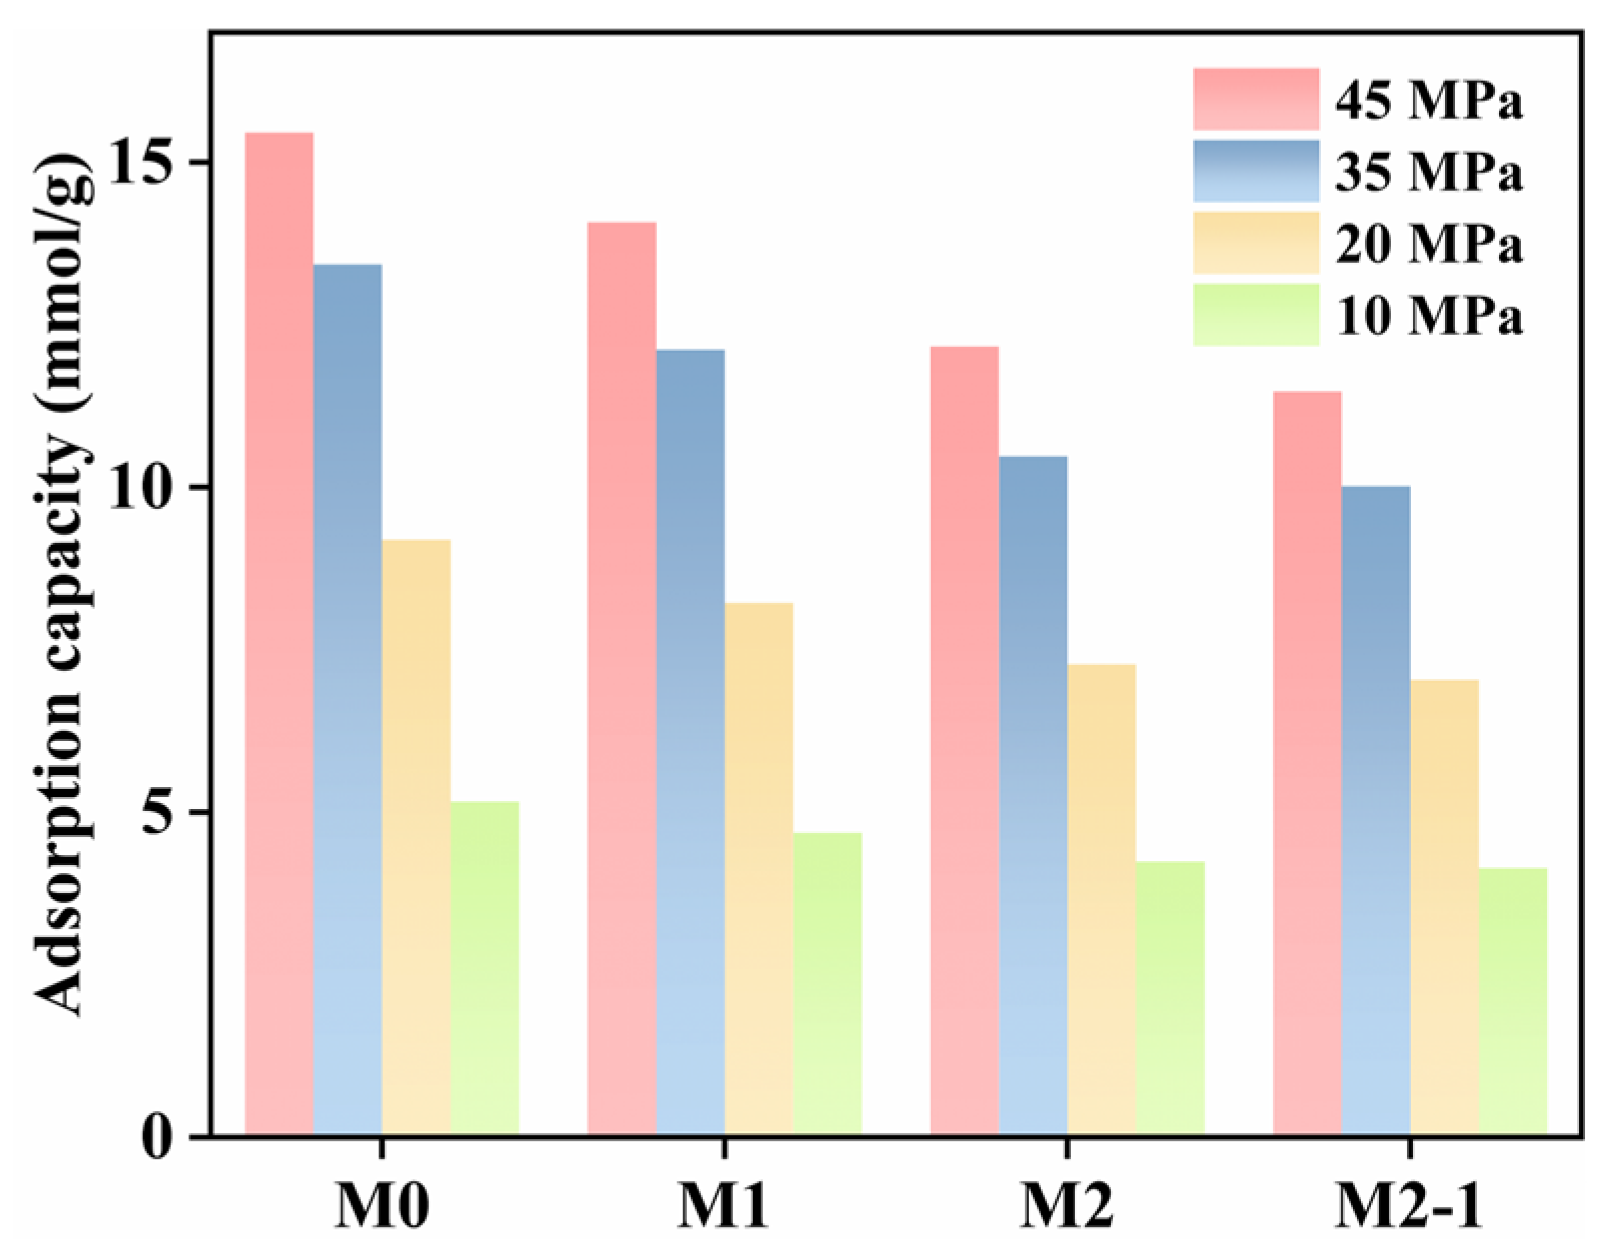
Figure 14 illustrates the adsorption capacity of 4 nm MSP at different pressures under different conditions of formation water (T = 368.15 K). As moisture content rises and ions are added, the adsorption capability progressively declines. This is because the CH4 adsorption sites are occupied. Under pressures of 10 MPa, 20 MPa, 35 MPa, and 45 MPa, the adsorption capacity decreased by 1.02 mmol/g, 2.15 mmol/g, 3.41 mmol/g, and 3.98 mmol/g, respectively, from M0 to M2-1. The negative effects of the formation water are even more pronounced under high pressure. The natural gas in MSP is particularly sensitive to moisture content under high reservoir pressure, highlighting the importance of considering the impact of formation water on gas storage capacity in limestone reservoirs.

3.3.2. Effect of Formation Water on CH4 Adsorption Density

To further evaluate formation water’s impact on CH4 adsorption and diffusion in MSP, gas density distribution and molecular simulation snapshots at various apertures (4 nm and 6 nm), pressures (5 MPa, 20 MPa, and 45 MPa), and formation water conditions (M0, M1, M2, and M2-1) were plotted at 368.15 K (Figure 15). Under M1 conditions, the 4 nm pores exhibit the disappearance of the second adsorption layer on the calcite side, a rightward shift of the first adsorption layer, and a drop in density (Figure 15). In contrast, the methane density on the kerogen side remains almost unchanged. This is due to the strong electrostatic force between H2O and calcite, where calcite and water interact more strongly than it does with CH4 [54]. H2O molecules adsorb onto the surface of calcite, resulting in O atoms with high electronegativity being positioned near Ca2+ ions, while H atoms are oriented towards CO32− ions. Molecular simulation snapshots reveal that in 4 nm pores under M1 conditions, H2O form continuous films on calcite surfaces, occupying methane adsorption sites and space. Consequently, this leads to a notable reduction in the interaction forces Et and Es (as shown in Figure 16), resulting in the first adsorption layer shifting to the right and a decrease in density. Under M2 conditions, the methane adsorption layer is entirely displaced from the calcite surface. This phenomenon occurs because almost all water molecules gather near the calcite pore walls, forming a thicker water film. Notably, Et decreases significantly, while Es remains almost unchanged, suggesting that the primary influence is on the methane free phase. Under M2-1 conditions, there exists a strong electrostatic interaction between cations and anions, as well as between ions and H2O molecules. Consequently, water molecules tend to arrange themselves into an ordered structure surrounding the ions, forming a “shell–core structure”, where ions serve as the “core” and water molecules as the “shell”. Coupled with the hydrogen bonding between H2O molecules, a tighter and more stable cluster state is ultimately formed on the kerogen side. This significantly reduces the gas density on the kerogen side.
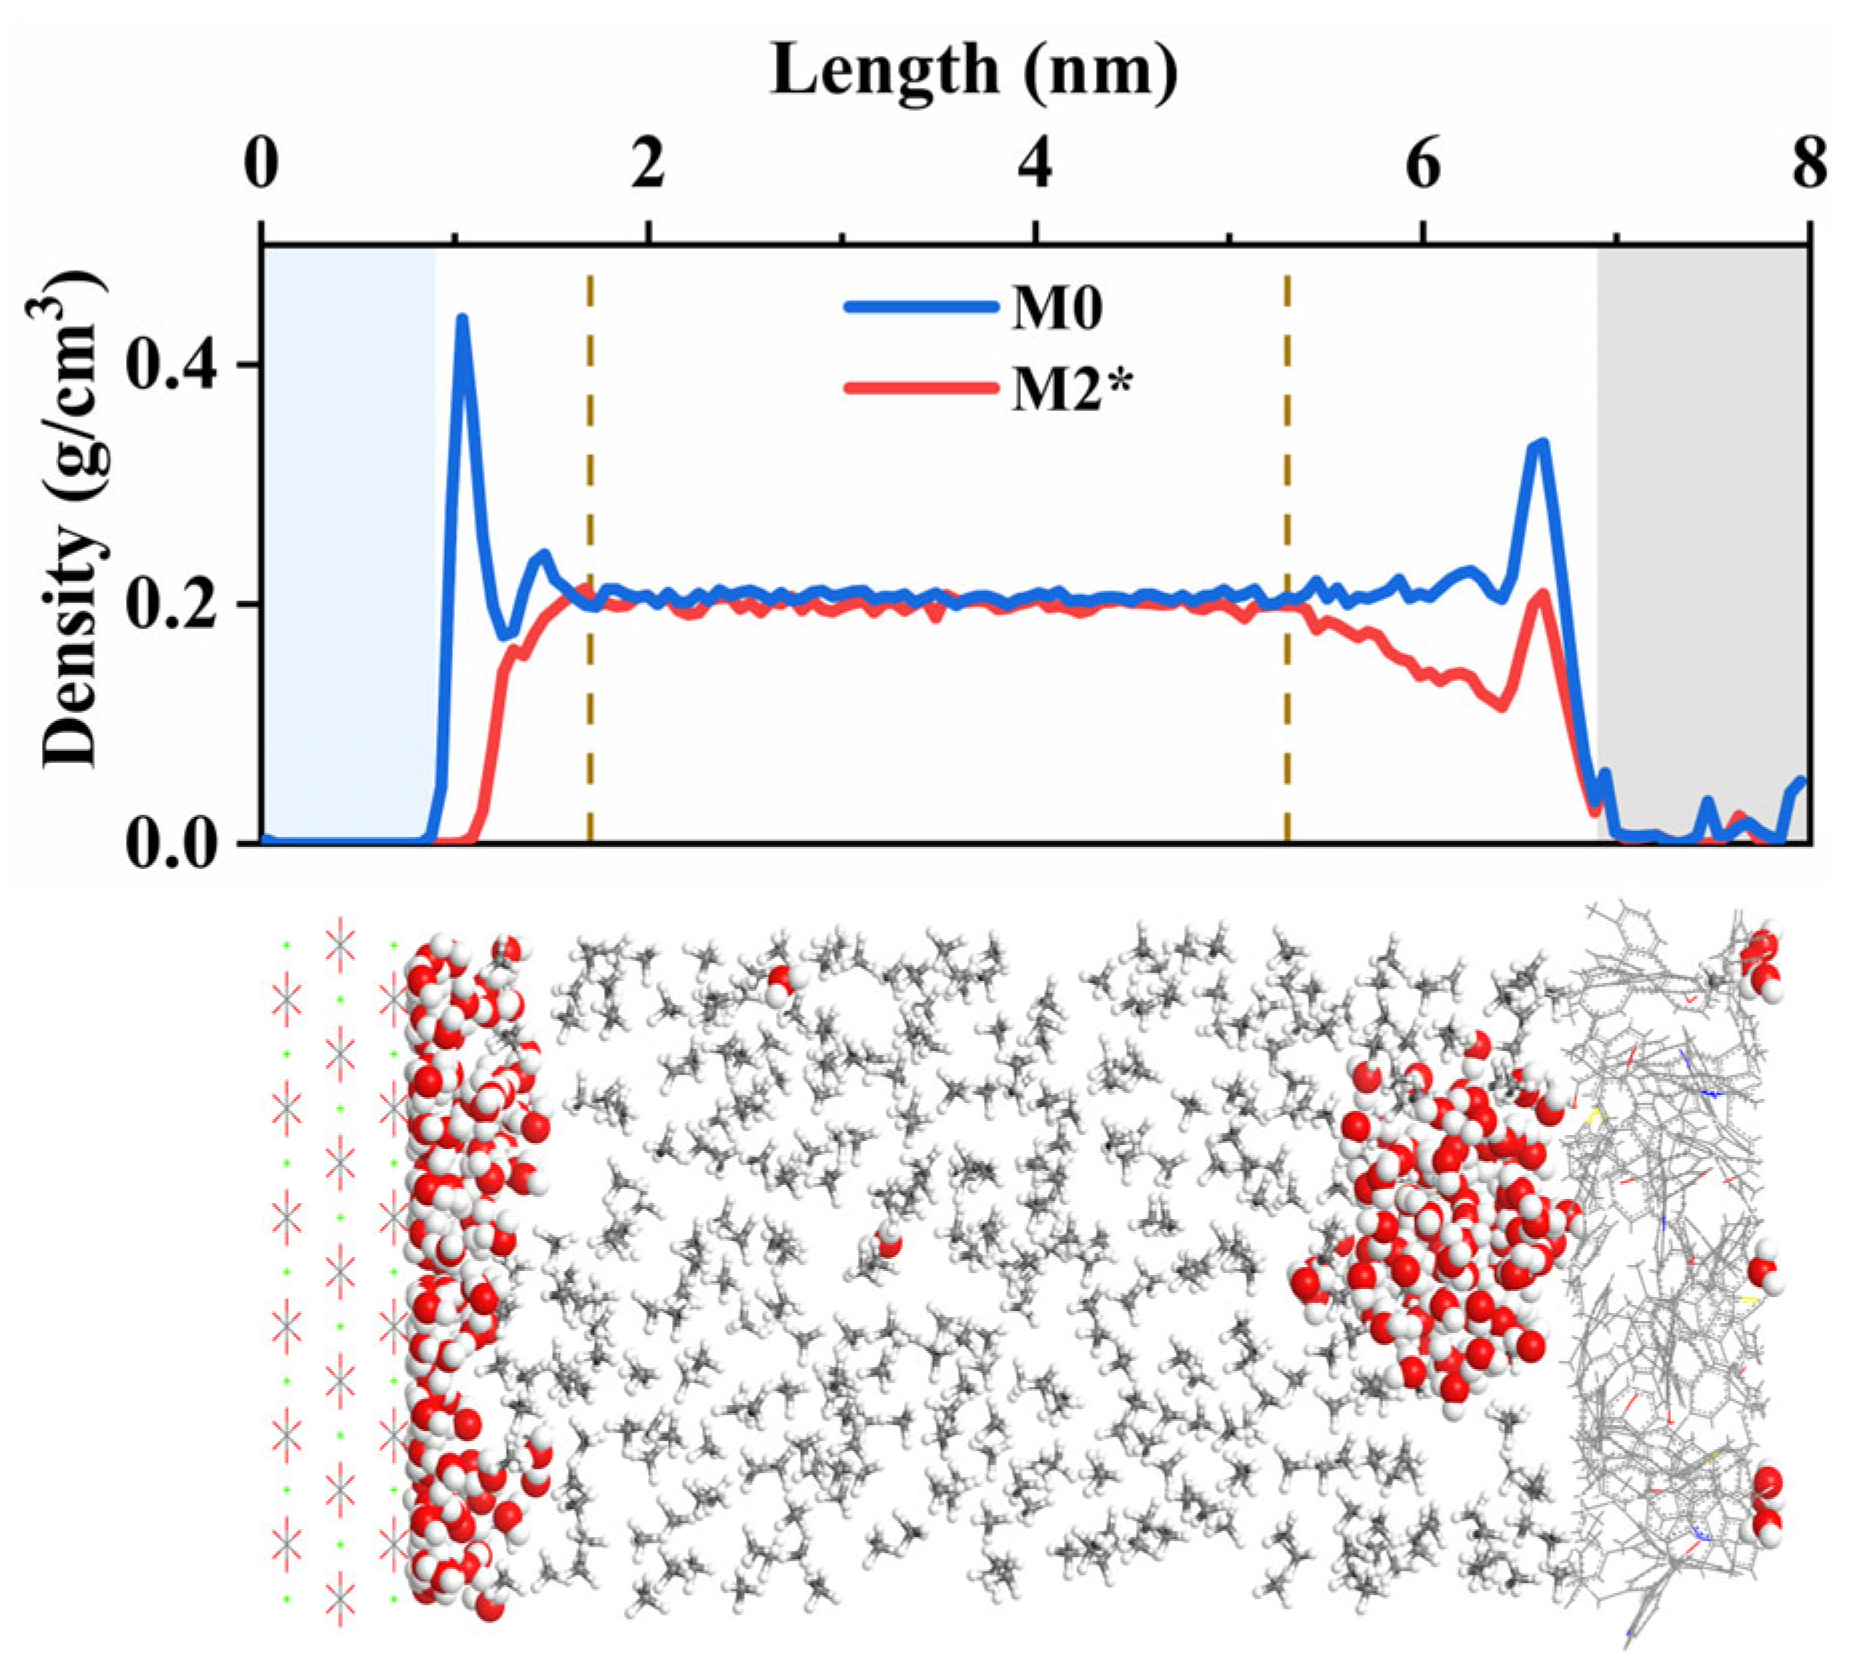
Notably, the aforementioned phenomenon also occurs in 6 nm pore systems. However, under M2 conditions, while the majority of H2O molecules form continuous films on calcite surfaces, a minor fraction aggregates into discrete clusters at the kerogen interface. To eliminate the influence of H2O molecular weight, 260 H2O molecules (M2*) were preloaded into an MSP with a 6 nm pore size, corresponding to the H2O molecular weight at 4 nm under M2 conditions (Figure 17). The findings reveal that water clusters still form on the surface of kerogen. This suggests that the pore size influences the aggregation pattern of water molecules within the MSP, which subsequently impacts CH4 adsorption and diffusion. The main reason is that, on the one hand, the surface of calcite is saturated with H2O, while on the other hand, the interactions between calcite and H2O in the pore are weakened by pore aperture widening. Meanwhile, due to the stronger hydrogen bonding between H2O molecules, H2O adsorbs in clusters on the surface of kerogen. Similar phenomena have also been reported in MMT kerogen [55] and graphene slit pores [56]. However, the mechanisms by which the aggregation forms of water molecules (water films and clusters) affect methane adsorption vary in MSP. For instance, as depicted in Figure 17, the influence area of water clusters is larger than that of water films, albeit with a lower degree of influence. The water film occupies all the methane adsorption sites in this space. Conversely, water clusters only occupy a portion of the adsorption sites, albeit with a wider impact scope. In addition, the presence of ions facilitates the formation of clusters (Figure 15), thereby enhancing the distinction between clusters and water films within the same pore.

3.3.3. Effect of Formation Water on CH4 Diffusion

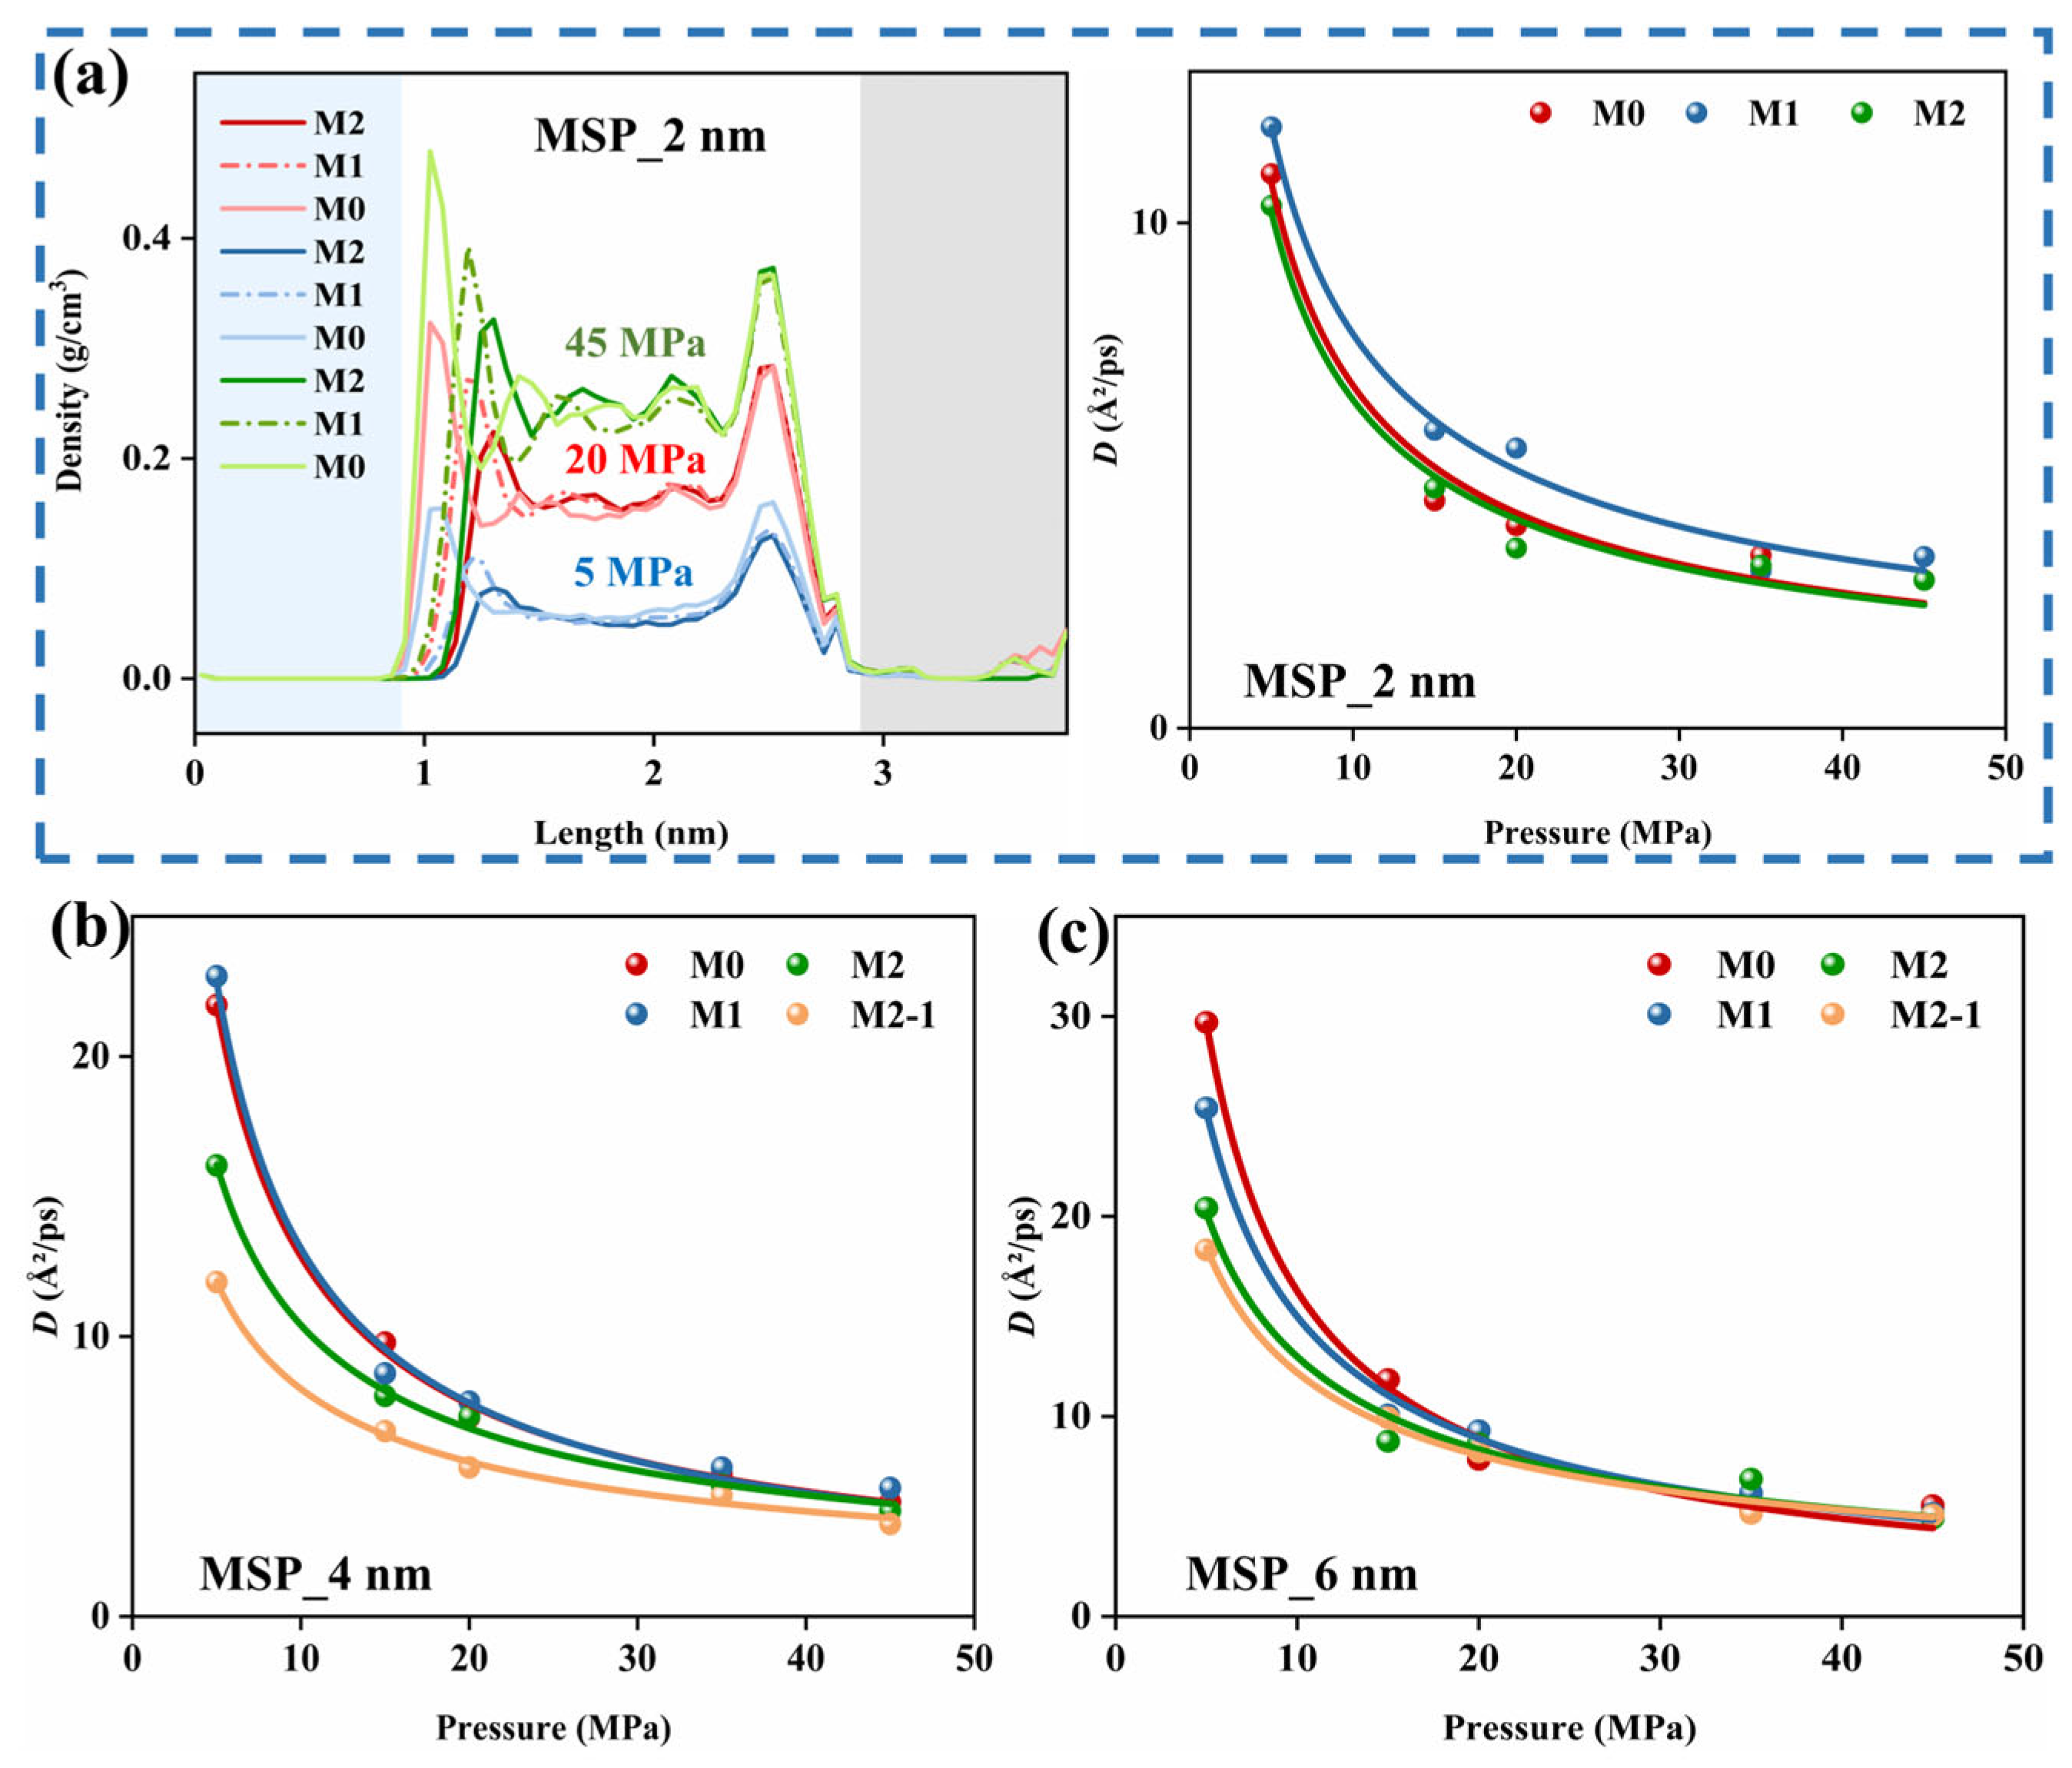
The D of CH4 in 2 nm, 4 nm, and 6 nm MSP under various formation water conditions is displayed in Figure 4e. The D continuously decreases as pressure increases. Under M1 and M2 circumstances, the CH4 adsorption layer on the calcite side shifts right by varying degrees and experiences a density drop, while the kerogen side remains largely unchanged, according to the CH4 density distribution in the 2 nm pore (Figure 18a). This suggests the formation of a water film on the calcite side under both conditions. In the 2 nm pore, the D of CH4 exhibits the trend M1 > M0 > M2. In the 4 nm pore, the trend is M1 ≥ M0 > M2 > M2-1 (Figure 18b). However, in the 6 nm pore, the pattern is roughly M0 > M1 > M2 > M2-1 (Figure 18c). This can be explained by the following reasons. Slip flow and Knudsen diffusion increase with larger pore sizes [57]. When the pore width is small, gas diffusion is primarily dominated by surface diffusion [58]. The formation of a water film reduces the effective aperture, decreasing the rates of slip flow and Knudsen diffusion while increasing the rate of surface diffusion. Compared to 6 nm pores, the effect of the water film on enhanced surface diffusion is more pronounced in the narrower 2 nm and 4 nm pores. Therefore, at low moisture content (M1), the effect of thin water film on CH4 diffusion may mainly manifest as enhanced gas surface diffusion and reduced interaction force. This ultimately manifests as enhanced diffusion of methane. When the moisture content is high (M2), the effect of a thick water film on reducing the gas flow space becomes more pronounced. The presence of ions facilitates the formation of larger and more stable clusters (M2-1). These clusters exert a more significant impact than water films. They fill and intercept part of the cross-section, acting as a piston during the diffusion process, thereby further reducing the diffusion coefficient.

4. Discussion

The morphology of limestone organic pores significantly influences the microscopic adsorption–diffusion properties of methane molecules. CH4 exhibits preferential adsorption at the corners formed by curved pore walls, where the superposition of potential energy fields creates deeper potential wells, thereby enhancing the interaction forces. This phenomenon impedes gas escape and promotes adsorption and aggregation. The variation in methane adsorption capacity among different pore shapes primarily arises from differences in specific surface area and interaction forces. Notably, the dominant factors influencing methane adsorption capacity vary across different measurement dimensions. The primary mechanism through which pore shape affects methane diffusion involves the synergistic effects of pore volume, curvature, and interaction energy. Specifically, limited pore volume reduces the molecular mean free path, high curvature enhances methane–wall collision frequency during diffusion, and strong interaction energy restricts methane mobility, collectively increasing diffusion resistance.
In the organic–inorganic composite pores of limestone, pore size enlargement results in decreased excess adsorption but increased absolute adsorption, while enhancing methane diffusion. As pore width increases, the gas adsorption space expands, reducing repulsive forces between methane molecules and facilitating the formation of a secondary adsorption layer, thereby improving the system’s overall adsorption capacity. In narrower pores, the potential energy overlap effect is intensified, strengthening the interaction between pore walls and CH4, increasing adsorbed phase density, and consequently enhancing excess adsorption capacity. In addition, larger pores provide more space for molecular motion, reduce collision frequency, and diminish the impact of surface effects, thereby promoting gas diffusion. Within composite slit pores, water molecule aggregation patterns are significantly influenced by pore size, which in turn affects methane adsorption. Specifically, the calcite–water interaction strength is weakened with increasing aperture. Simultaneously, some H2O molecules tend to aggregate on kerogen surfaces, occupying the CH4 adsorption space, leading to a notable reduction in adsorption layer density on the kerogen side.
Water film (calcite side) and clusters (kerogen side) are the main aggregation forms of formation water in limestone MSP, and their mechanisms of influence on methane adsorption and diffusion are different. In terms of adsorption, clusters have a larger active area and a lower degree of influence compared to water films. The water film occupies all the methane adsorption sites in the space, causing the disappearance of the original adsorption layer. In contrast, clusters occupy only a portion of the adsorption sites, which causes the methane density in that area to fall, but the affected spatial cross-sectional area is relatively large. In terms of diffusion, the influence mechanism of water on methane diffusion has a dual nature. On the one hand, water film and clusters promote diffusion by reducing the adsorption layer density, decreasing the adsorption phase ratio, and weakening the CH4 pore wall interaction, among which water film can also enhance gas surface diffusion. On the other hand, pore water occupies the gas flow space, and the influence of clusters is particularly significant. It increases diffusion resistance by compressing pore volume, intercepting cross-sections, and even blocking pores. The ultimate performance of methane diffusion relies on the balance between the promoting and inhibiting mechanisms discussed above. This balance may be influenced by various factors, including pressure, aperture, and moisture content, indicating that further exploration and quantitative analysis are necessary. In addition, the introduction of ions significantly promotes cluster formation. The strong electrostatic interaction between ions and water molecules forms hydrated ions, which macroscopically manifest as a more compact and stable cluster. In summary, ions exacerbate the differences between water films and clusters within the same pore.

5. Conclusions

Based on the real situation of Taiyuan Formation limestone in the Ordos Basin, MD and GCMC methods were used to study the effects of pore shape, pore size, and formation water on methane adsorption–diffusion in limestone. The main conclusions are as follows:
(1)
Organic pore shape significantly influences CH4 adsorption–diffusion. Adsorption capacity mainly depends on specific surface area and potential energy strength. Pore space, tortuosity, and interaction energy synergistically influence diffusion. Diffusion is influenced by the combined effects of pore space, tortuosity, and interaction energy. KSP (slit) exhibits the highest diffusion coefficient—2.3, 3.4, and 10.7 times that of KLP (L-shaped), KTP (triangular), and KCP (circular), respectively—due to its larger pore space, low interaction strength, and minimal tortuosity.
(2)
The expansion of pore diameter increases CH4 absolute adsorption capacity, reduces excess adsorption, and enhances diffusion. Compared to 1 nm pores, 6 nm pores exhibit a 6.2 times increase in absolute adsorption, a 3.4 mmol/g decrease in excess adsorption, and a 67% improvement in diffusion coefficient (T = 368.15 K; P = 45 MPa). Pore size also affects the H2O aggregation behavior. At equivalent moisture content, a 4 nm pore forms a continuous water film, while a 6 nm pore exhibits both water films and clusters, reducing kerogen side adsorption density.
(3)
In organic–inorganic composite slit pores (MSPs), formation water readily forms films on calcite and clusters on kerogen, weakening CH4 adsorption and its interaction with the pore walls. For methane diffusion, 2 nm and 4 nm MSPs may exhibit a promoting trend under low moisture water conditions but show inhibition with increasing moisture content or the introduction of ions. In contrast, 6 nm pores exhibit inhibition under water-containing conditions. Ions further enhance cluster formation, significantly hindering gas diffusion.

Author Contributions

T.S.: Investigation, software, visualization, and writing—original draft. C.D.: Conceptualization, methodology, and funding acquisition. X.G.: Resources, supervision, and funding acquisition. L.Z.: Software, formal analysis, and writing—review and editing. Y.Z.: Software and visualization. Y.B.: Investigation and visualization. D.L.: Investigation. Y.L.: Formal analysis. All authors have read and agreed to the published version of the manuscript.

Funding

This work was supported by the National Natural Science Foundation of China (grant numbers 52434007 and 52204231).

Data Availability Statement

Data will be made available on request.

Conflicts of Interest

The authors declare that they have no known competing financial interests or personal relationships that could have appeared to influence the work reported in this paper.

References

  1. He, L.; Ye, W.; Wan, Y.X.; Feng, H.S.; Chen, B.X.; Liang, D.Z. Using knowledge graph and RippleNet algorithms to fulfill smart recommendation of water use policies during shale resources development. J. Hydrol. 2023, 617, 128970. [Google Scholar] [CrossRef]
  2. Dong, G.; Liu, X.; Yin, L.; Fu, X.; Song, J.; Zhao, X.; Pei, W. Development characteristics and genetic analysis of dense limestone reservoirs in the Taiyuan Formation of the Ordos Basin, China. Nat. Gas Geosci. 2023, 8, 307–317. [Google Scholar] [CrossRef]
  3. Fu, J.; Zhao, H.; Dong, G.; Han, T.; Ren, J.; Huang, Z.; Lu, Z.; Zhu, B.; Zhu, J.; Yin, L.; et al. Discovery and prospect of oil and gas exploration in new areas of Ordos Basin. Nat. Gas Geosci. 2023, 34, 1289–1304. [Google Scholar]
  4. Zhang, Q.; Xiong, W.; Li, X.; Feng, C.; Qiu, Z.; Liu, W.; Li, X.; Xiao, Y.; Liu, D.; Yang, H. Discussion on Transitional Shale Gas Accumulation Conditions from the Perspective of Source-Reservoir-Caprock Controlling Hydrocarbon: Examples from Permian Shanxi Formation and Taiyuan Formation in the Eastern Margin of Ordos Basin, NW China. Energies 2023, 16, 3710. [Google Scholar] [CrossRef]
  5. Huo, Z.; Gao, J.; Zhang, J.; Zhang, D.; Liang, Y. Role of overlying and underlying limestones in the natural hydraulic fracturing of shale sections: The case of marine–continental transitional facies in the Southern North China Basin. Energy Rep. 2021, 7, 8711–8729. [Google Scholar] [CrossRef]
  6. Xie, W.; Gan, H.; Chen, C.; Vandeginsteet, V.; Chen, S.; Wang, M.; Wang, J.; Yu, Z. A model for superimposed coalbed methane, shale gas and tight sandstone reservoirs, Taiyuan Formation, Yushe-Wuxiang Block, eastern Qinshui Basin. Sci. Rep. 2022, 12, 11455. [Google Scholar] [CrossRef] [PubMed]
  7. Shi, L.; Liu, T.; Zhang, X.; Huang, J.; Zhang, W.; Zhao, S. Origin type and generating mechanism of coal measure limestone gas: A case study of L1 limestone gas in the Taiyuan formation of the Shenzhou coal mine, Eastern edge of the Ordos Basin, China. Energy Fuels 2020, 34, 10904–10914. [Google Scholar] [CrossRef]
  8. Zhang, L.; Zhao, Q.; Wu, C.; Qiu, Z.; Zhang, Q.; Wang, Y.; Liu, D.; Dong, D.; Zhou, S. Pore structures of the lower Permian Taiyuan shale and limestone in the Ordos Basin and the significance to unconventional natural gas generation and storage. Geofluids 2022, 2022, 3156547. [Google Scholar] [CrossRef]
  9. Yin, J.; Hu, P.; Guo, Y.; Li, Y.; Luo, S. Petrological Characteristics and Hydrocarbon Generation of Carbonate Source Rocks of the Permian Taiyuan Formation in Central and Eastern Ordos Basin, China. Minerals 2023, 13, 1058. [Google Scholar] [CrossRef]
  10. Lv, D.; Fan, W.; Ejembi, J.I.; Wu, D.; Wang, D.; Li, Z.; Li, J.; Li, P. Depositional environments of limestones from the Taiyuan Formation in the North China Block interpreted from REE proxies. Carbonates Evaporites 2020, 35, 61. [Google Scholar] [CrossRef]
  11. Wang, R.; Fu, X.; Zhang, B.; Feng, J.; Li, W. Preliminary study on exploration prospect of carbonate gas in coal measures: A case study of Taiyuan Formation in North China. Int. J. Coal. Sci. Technol. 2021, 49, 138–149. [Google Scholar]
  12. Xiong, J.; Liu, X.; Liang, L. Experimental study on the pore structure characteristics of the Upper Ordovician Wufeng Formation shale in the southwest portion of the Sichuan Basin, China. J. Nat. Gas Sci. Eng. 2015, 22, 530–539. [Google Scholar] [CrossRef]
  13. Zhang, S.; Liu, Q.; Cheng, H.; Li, X.; Zeng, F.; Frost, R.L. Intercalation of dodecylamine into kaolinite and its layering structure investigated by molecular dynamics simulation. J. Colloid Interface Sci. 2014, 430, 345–350. [Google Scholar] [CrossRef]
  14. Wang, T.; Tian, S.; Li, G.; Zhang, L.; Sheng, M.; Ren, W. Molecular simulation of gas adsorption in shale nanopores: A critical review. Renew. Sustain. Energy Rev. 2021, 149, 111391. [Google Scholar] [CrossRef]
  15. Lin, K.; Yuan, Q.; Zhao, Y.P. Using graphene to simplify the adsorption of methane on shale in MD simulations. Comput. Mater. Sci. 2017, 133, 99–107. [Google Scholar] [CrossRef]
  16. Song, W.; Yao, J.; Ma, J.; Li, A.; Li, Y.; Sun, H.; Zhang, L. Grand canonical Monte Carlo simulations of pore structure influence on methane adsorption in micro-porous carbons with applications to coal and shale systems. Fuel 2018, 215, 196–203. [Google Scholar] [CrossRef]
  17. Wang, T.; Tian, S.; Li, G.; Sheng, M.; Ren, W.; Liu, Q.; Zhang, S. Molecular simulation of CO2/CH4 competitive adsorption on shale kerogen for CO2 sequestration and enhanced gas recovery. J. Phys. Chem. C 2018, 122, 17009–17018. [Google Scholar] [CrossRef]
  18. Lv, Z.; Ning, Z.; Wang, Q.; Huang, L.; Meng, H.; Yu, X.; Qin, H. Molecular simulation of methane adsorption behavior on clay minerals. CCS 2019, 44, 3117–3124. [Google Scholar]
  19. Chen, C.; Sun, J.; Zhang, Y.; Mu, J.; Li, W.; Song, Y. Adsorption characteristics of CH4 and CO2 in organic-inorganic slit pores. Fuel 2020, 265, 116969. [Google Scholar] [CrossRef]
  20. Kazemi, M.; Takbiri-Borujeni, A. Modeling and simulation of gas transport in carbon-based organic nano-capillaries. Fuel 2017, 206, 724–737. [Google Scholar] [CrossRef]
  21. Kim, C.; Jang, H.; Lee, J. Experimental investigation on the characteristics of gas diffusion in shale gas reservoir using porosity and permeability of nanopore scale. J. Pet. Sci. Eng. 2015, 133, 226–237. [Google Scholar] [CrossRef]
  22. Bhatia, S.K.; Nicholson, D. Adsorption and diffusion of methane in silica nanopores: A comparison of single-site and five-site models. J. Phys. Chem. C 2012, 116, 2344–2355. [Google Scholar] [CrossRef]
  23. Dang, W.; Jiang, S.; Zhang, J.; Wang, F.; Tao, J.; Wei, X.; Tang, X.; Wang, C.; Chen, Q. Experimental and modeling study on the effect of shale composition and pressure on methane diffusivity. Energy Fuels 2019, 33, 714–726. [Google Scholar] [CrossRef]
  24. Wang, F.; Chang, S.; Yan, X.; Meng, Y.; Zhao, D. Study on Hydrogeological Conditions and Water Source Identification of 8+9# Coalbed Methane Reservoir in Sanjiao Block. J. Taiyuan Univ. Technol. 2023, 54, 673–683. [Google Scholar]
  25. Zhao, X. Study on Chemical Composition of Mine Water in Shaqu No.1 Coal Mine. Shanxi Coking Coal Sci. Technol. 2023, 47, 33–36+47. [Google Scholar]
  26. Yan, Z.; Liu, G.; Sun, R.; Tang, Q.; Wu, D.; Wu, B.; Zhou, C. Geochemistry of rare earth elements in groundwater from the Taiyuan Formation limestone aquifer in the Wolonghu Coal Mine, Anhui province, China. J. Geochem. Explor. 2013, 135, 54–62. [Google Scholar] [CrossRef]
  27. Guo, Y.; Gui, H.; Wei, J.; Pang, Y.; Hu, M.; Zhang, Z.; Nie, F.; Hong, H.; Cui, Y.; Zhao, J. Hydrogeochemical evolution of Taiyuan formation limestone water under the disturbance of water inrush from karst collapse column in Taoyuan coal mine, China. Water Supply 2022, 22, 8196–8210. [Google Scholar] [CrossRef]
  28. Wang, M.; Gui, H.; Hu, R.; Zhao, H.; Li, J.; Yu, H.; Fang, H. Hydrogeochemical characteristics and water quality evaluation of carboniferous Taiyuan formation limestone water in Sulin mining area in Northern Anhui, China. Int. J. Env. Res. Public Health 2019, 16, 2512. [Google Scholar] [CrossRef] [PubMed]
  29. Liu, J.; Wang, H.; Jin, D.; Xu, F.; Zhao, C. Hydrochemical characteristics and evolution processes of karst groundwater in Carboniferous Taiyuan formation in the Pingdingshan coalfield. Environ. Earth Sci. 2020, 79, 151. [Google Scholar] [CrossRef]
  30. Luo, S.; Fi, Y.; Yin, J.; Dai, R. Lithofacies types and geochemical characteristics of carbonate source rocks in Taiyuan Formation of middle and eastern Ordos Basin. J. Yangtze Univ. Nat. Sci. Ed. 2024, 21, 19–31. [Google Scholar]
  31. Liang, T.; Zhan, Z.W.; Zou, Y.R.; Lin, X.H.; Shan, Y.; Peng, P. Research on type I kerogen molecular simulation and docking between kerogen and saturated hydrocarbon molecule during oil generation. Chem. Geol. 2023, 617, 121263. [Google Scholar] [CrossRef]
  32. Huang, S.; Ma, X.; Yang, H.; Wu, J.; Zhang, J.; Zhao, S.; Zhang, D.; Ren, C.; Huang, L. Experimental characterization and molecular modeling of kerogen in Silurian deep gas shale from southern Sichuan Basin, China. Energy Rep. 2022, 8, 1497–1507. [Google Scholar] [CrossRef]
  33. Kerisit, S.; Parker, S.C. Free energy of adsorption of water and metal ions on the {1014} calcite surface. J. Am. Chem. Soc. 2004, 126, 10152–10161. [Google Scholar] [CrossRef]
  34. Durán-Álvarez, A.; Maldonado-Domínguez, M.; González-Antonio, O.; Durán-Valencia, C.; Romero-Ávila, M.; Barragán-Aroche, F.; López-Ramírez, S. Experimental–theoretical approach to the adsorption mechanisms for anionic, cationic, and zwitterionic surfactants at the calcite–water interface. Langmuir 2016, 32, 2608–2616. [Google Scholar] [CrossRef]
  35. de Leeuw, N.H.; Parker, S.C. Surface–water interactions in the dolomite problem. Phys. Chem. Chem. Phys. 2001, 3, 3217–3221. [Google Scholar] [CrossRef]
  36. Guo, D.; Zhang, L.H.; Li, X.G.; Yang, X.; Zhao, Y.L.; Chen, X. Effect of the Water Content on the Adsorption of CO2 and CH4 in Calcite Slit Nanopores: Insights from GCMC, MD, and DFT. Langmuir 2023, 40, 818–826. [Google Scholar] [CrossRef] [PubMed]
  37. Sun, H. COMPASS: An ab initio force-field optimized for condensed-phase applications overview with details on alkane and benzene compounds. J. Phys. Chem. B 1998, 102, 7338–7364. [Google Scholar] [CrossRef]
  38. Sui, H.; Zhang, F.; Wang, Z.; Wang, D.; Wang, Y. Effect of kerogen maturity, water content for carbon dioxide, methane, and their mixture adsorption and diffusion in kerogen: A computational investigation. Langmuir 2020, 36, 9756–9769. [Google Scholar] [CrossRef] [PubMed]
  39. Hu, H.; Li, X.; Fang, Z.; Wei, N.; Li, Q. Small-molecule gas sorption and diffusion in coal: Molecular simulation. Energy 2010, 35, 2939–2944. [Google Scholar] [CrossRef]
  40. McQuaid, M.J.; Sun, H.; Rigby, D. Development and validation of COMPASS force field parameters for molecules with aliphatic azide chains. J. Comput. Chem. 2004, 25, 61–71. [Google Scholar] [CrossRef]
  41. Li, J.; Zhou, S.; Gaus, G.; Li, Y.; Ma, Y.; Chen, K.; Zhang, Y. Characterization of methane adsorption on shale and isolated kerogen from the Sichuan Basin under pressure up to 60 MPa: Experimental results and geological implications. Int. J. Coal. Geol. 2018, 189, 83–93. [Google Scholar] [CrossRef]
  42. Huang, L.; Feng, X.; Yang, Q.; Wu, J.; Yang, X.; Huang, S. Microscopic Occurrence Characteristics of Methane in Kerogen Nanopores of Deep Shale Reservoirs. Pet. Drill. Tech. 2023, 51, 112–120. [Google Scholar]
  43. Zhou, B.; Xu, R.; Jiang, P. Novel molecular simulation process design of adsorption in realistic shale kerogen spherical pores. Fuel 2016, 180, 718–726. [Google Scholar] [CrossRef]
  44. Chen, J.; Jiang, F.; Cong, Q.; Pang, X.; Ma, K.; Shi, K.; Pang, B.; Chen, D.; Pang, H.; Yang, X.; et al. Adsorption characteristics of shale gas in organic-inorganic slit pores. Energy 2023, 278, 127788. [Google Scholar] [CrossRef]
  45. Zhang, Y.; Jiang, Y.; Wei, Q.; Huang, H.; Wang, T.; Xiong, H.; Wang, J.; Ren, Y.; Cui, X. Insight into adsorption behaviors of shale oil in kerogen slit by molecular dynamics. Fuel 2024, 374, 132432. [Google Scholar] [CrossRef]
  46. Zhu, Y.; Su, H.; Jing, Y.; Guo, J.; Tang, J. Methane adsorption on the surface of a model of shale: A density functional theory study. Appl. Surf. Sci. 2016, 387, 379–384. [Google Scholar] [CrossRef]
  47. Deible, M.J.; Tuguldur, O.; Jordan, K.D. Theoretical study of the binding energy of a methane molecule in a (H2O)20 dodecahedral cage. J. Phys. Chem. B 2014, 118, 8257–8263. [Google Scholar] [CrossRef]
  48. Wang, T.; Tian, S.; Li, G.; Sheng, M. Selective adsorption of supercritical carbon dioxide and methane binary mixture in shale kerogen nanopores. J. Nat. Gas Sci. Eng. 2018, 50, 181–188. [Google Scholar] [CrossRef]
  49. Wang, S.; Feng, Q.; Javadpour, F.; Hu, Q.; Wu, K. Competitive adsorption of methane and ethane in montmorillonite nanopores of shale at supercritical conditions: A grand canonical Monte Carlo simulation study. Chem. Eng. J. 2019, 355, 76–90. [Google Scholar] [CrossRef]
  50. Mohammed, S.; Gadikota, G. Exploring the role of inorganic and organic interfaces on CO2 and CH4 partitioning: Case study of silica, illite, calcite, and kerogen nanopores on gas adsorption and nanoscale transport behaviors. Energy Fuels 2020, 34, 3578–3590. [Google Scholar] [CrossRef]
  51. Babaei, S.; Ghasemzadeh, H.; Tesson, S. Methane adsorption of nanocomposite shale in the presence of water: Insights from molecular simulations. Chem. Eng. J. 2023, 475, 146196. [Google Scholar] [CrossRef]
  52. Yu, H.; Xu, H.Y.; Fan, J.C.; Zhu, Y.B.; Wang, F.C.; Wu, H.A. Transport of shale gas in microporous/nanoporous media: Molecular to pore-scale simulations. Energy Fuels 2020, 35, 911–943. [Google Scholar] [CrossRef]
  53. Sharma, A.; Namsani, S.; Singh, J.K. Molecular simulation of shale gas adsorption and diffusion in inorganic nanopores. Mol. Simulat. 2015, 41, 414–422. [Google Scholar] [CrossRef]
  54. Mohammed, S.; Gadikota, G. The effect of hydration on the structure and transport properties of confined carbon dioxide and methane in calcite nanopores. Front. Energy Res. 2018, 6, 86. [Google Scholar] [CrossRef]
  55. Huang, L.; Zhou, W.; Xu, H.; Wang, L.; Zou, J.; Zhou, Q. Dynamic fluid states in organic-inorganic nanocomposite: Implications for shale gas recovery and CO2 sequestration. Chem. Eng. J. 2021, 411, 128423. [Google Scholar] [CrossRef]
  56. Wang, S.; Feng, Q.; Zha, M.; Javadpour, F.; Hu, Q. Supercritical methane diffusion in shale nanopores: Effects of pressure, mineral types, and moisture content. Energy Fuels 2018, 32, 169–180. [Google Scholar] [CrossRef]
  57. Bai, J.; Kang, Y.; Chen, M.; Liang, L.; You, L.; Li, X. Investigation of multi-gas transport behavior in shales via a pressure pulse method. Chem. Eng. J. 2019, 360, 1667–1677. [Google Scholar] [CrossRef]
  58. Bai, J.; Kang, Y.; Chen, M.; Li, X.; You, L.; Chen, Z.; Fang, D. Impact of water film on methane surface diffusion in gas shale organic nanopores. J. Pet. Sci. Eng. 2021, 196, 108045. [Google Scholar] [CrossRef]
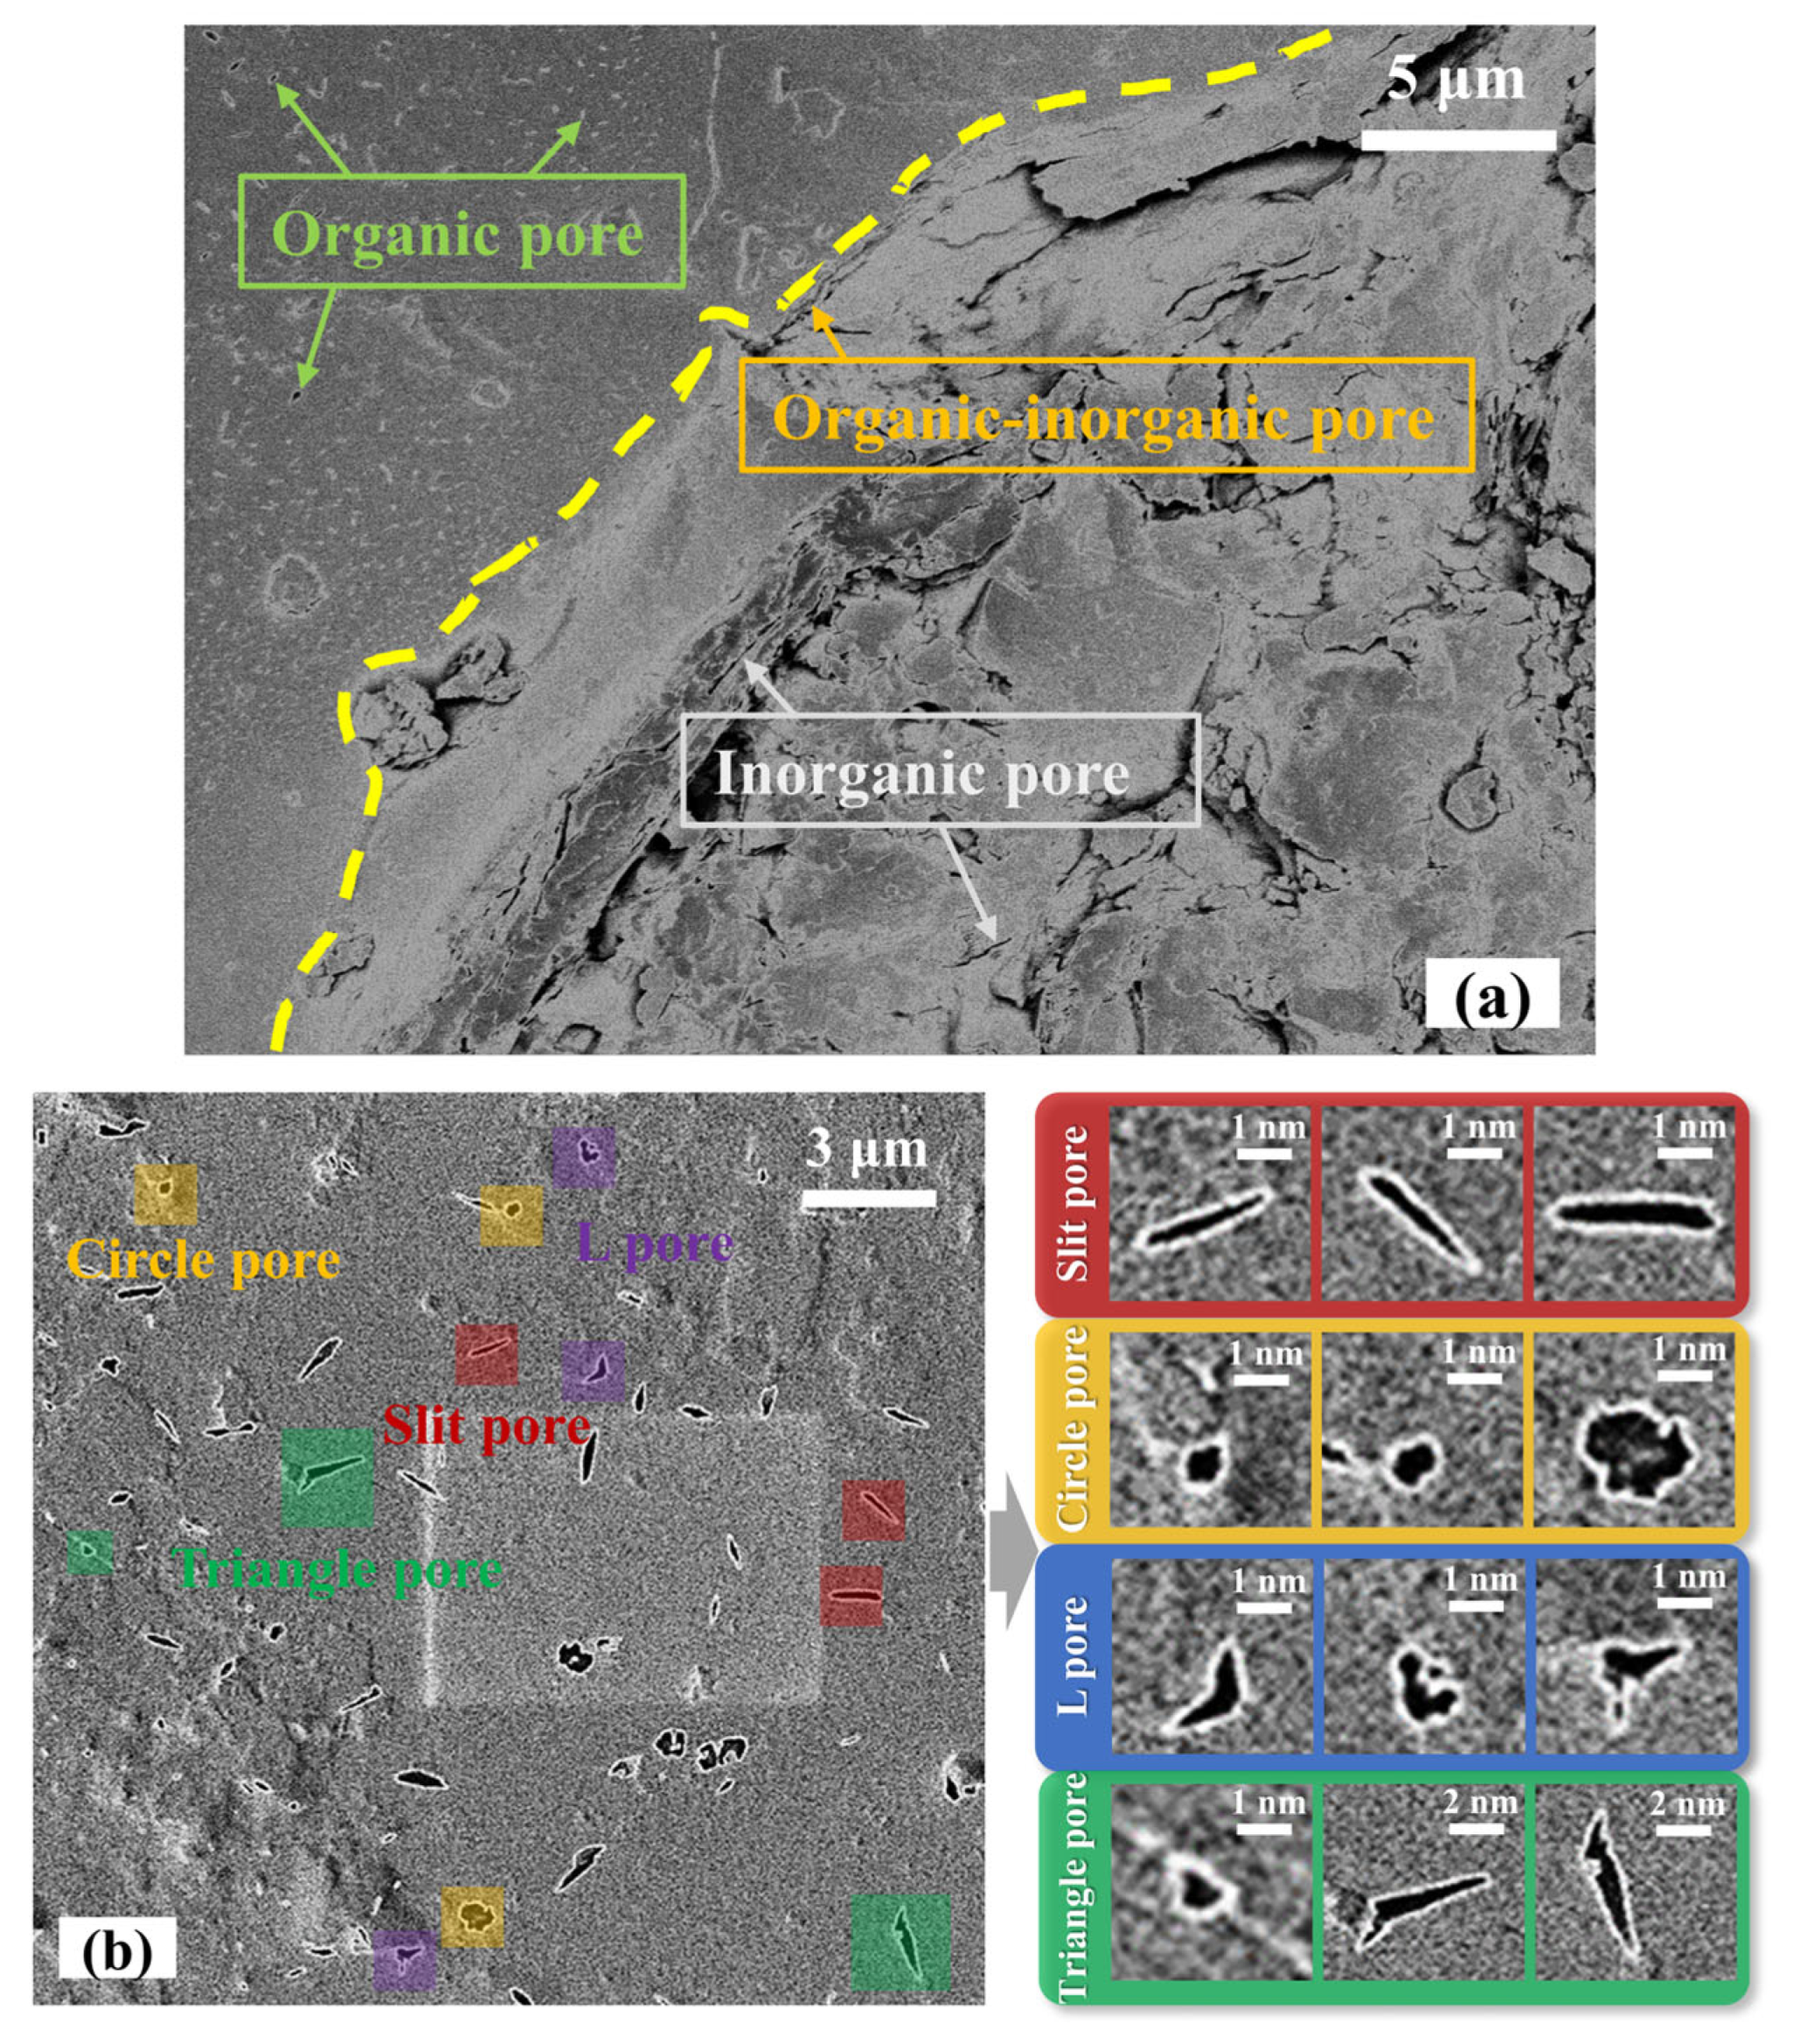
Figure 1. L5 limestone SEM images. (a) Pore types of L5 limestone. (b) Organic pore morphology of L5 limestone.
Applsci 15 09446 g001
Figure 2. Construction of calcite and kerogen models. (a) Unit cell of calcite crystal. (b) Validation of the calcite unit cell model. (c) Molecular model of kerogen. (d) Kerogen matrix.
Applsci 15 09446 g002
Figure 3. Validation of calcite slit pore and kerogen matrix models. The red curve illustrates the comparison between the excess adsorption of methane within the kerogen matrix and experimental data (Li et al. [41]), while the blue curve depicts the comparison of the absolute adsorption capacity of methane in 2 nm calcite slit pores with simulated data from literature (Guo et al. [36]).
Applsci 15 09446 g003
Figure 4. Pore models. (a) Kerogen slit pore (KSP). (b) Kerogen circular pore (KCP). (c) Kerogen L-shaped pore (KLP). (d) Kerogen triangular pore (KTP). (e) Calcite–kerogen composite slit pore (MSP).
Applsci 15 09446 g004
Figure 5. CH4 adsorption isotherms of organic pores with different shapes. (ad) correspond to KSP, KCP, KLP, and KTP, respectively.
Applsci 15 09446 g005
Figure 6. Comparison of the adsorption capacity of organic pores under different units. (ac) correspond to mmol/g, mmol/m2, and mmol/cm3, respectively.
Applsci 15 09446 g006
Figure 7. CH4 density distribution (curve chart) and density field (cloud map) in organic pores of distinct geometries.
Applsci 15 09446 g007
Figure 8. The interaction energy between CH4 and organic pores of varying shapes.
Applsci 15 09446 g008
Figure 9. Diffusion coefficient (D)of CH4 in organic pores at different (a) pressures and (b) temperatures.
Applsci 15 09446 g009
Figure 10. CH4 adsorption isotherms at varying pore widths.
Applsci 15 09446 g010
Figure 11. CH4 density distribution (top) and density field (bottom) under different apertures. From left to right: 1 nm, 2 nm, 4 nm, and 6 nm.
Applsci 15 09446 g011
Figure 12. The interaction energy between CH4 and pores of various diameters.
Applsci 15 09446 g012
Figure 13. CH4 diffusion in various pore sizes. (a) D of CH4 in various apertures. (b) MSD of CH4 in various apertures.
Applsci 15 09446 g013
Figure 14. CH4 adsorption capacity at varying pressures under different formation water conditions.
Applsci 15 09446 g014
Figure 15. Distribution of H2O and CH4 within 4 nm and 6 nm pores under distinct formation water conditions. From left to right are CH4 density distribution, molecular simulation snapshots, electrostatic potential of H2O adsorbed on the calcite surface, and electrostatic potential of hydrated ions.
Applsci 15 09446 g015
Figure 16. Interaction energies between CH4 and pores under varying formation water conditions.
Applsci 15 09446 g016
Figure 17. Spatial distribution of H2O and CH4 in 6 nm MSP under M2* conditions (T = 368.15 K; P = 45 MPa).
Applsci 15 09446 g017
Figure 18. CH4 diffusion coefficients under different formation water conditions. (a) CH4 density distribution and D in 2 nm pores under varying moisture content conditions. (b) D in 4 nm pores under varying moisture content conditions. (c) D in 6 nm pores under varying moisture content conditions.
Applsci 15 09446 g018
Table 1. Organic pore structural parameters.
Organic Pore ShapeKSPKCPKLPKTP
Pore volume (cm3/g)0.3720.0910.4770.140
Specific surface area (m2/g)924.026178.8321141.990316.921
Disclaimer/Publisher’s Note: The statements, opinions and data contained in all publications are solely those of the individual author(s) and contributor(s) and not of MDPI and/or the editor(s). MDPI and/or the editor(s) disclaim responsibility for any injury to people or property resulting from any ideas, methods, instructions or products referred to in the content.