Article

DeepSIGNAL-ITS—Deep Learning Signal Intelligence for Adaptive Traffic Signal Control in Intelligent Transportation Systems

by
Mirabela Melinda Medvei
1,2,*,
Alin-Viorel Bordei
2,
Ștefania Loredana Niță
2 and
Nicolae Țăpuș
1
1
Computer Science Department, Faculty of Automatic Control and Computer Science, Politehnica University of Bucharest, 060042 Bucharest, Romania
2
Computer and Cyber Security Department, Faculty of Informations Systems and Cyber Security, Military Technical Academy ‘Ferdinand I’, 050141 Bucharest, Romania
*
Author to whom correspondence should be addressed.
Appl. Sci. 2025, 15(17), 9396; https://doi.org/10.3390/app15179396 (registering DOI)
Submission received: 5 July 2025 / Revised: 30 July 2025 / Accepted: 20 August 2025 / Published: 27 August 2025
(This article belongs to the Section Transportation and Future Mobility)

Abstract

Featured Application

The article introduces DeepSIGNAL-ITS, an intelligent traffic management framework that uses deep learning and reinforcement learning to monitor vehicle density in real time and dynamically control traffic signals.

Abstract

Urban traffic congestion remains a major contributor to vehicle emissions and travel inefficiency, prompting the need for adaptive and intelligent traffic management systems. In response, we introduce DeepSIGNAL-ITS (Deep Learning Signal Intelligence for Adaptive Lights in Intelligent Transportation Systems), a unified framework that leverages real-time traffic perception and learning-based control to optimize signal timing and reduce congestion. The system integrates vehicle detection via the YOLOv8 architecture at roadside units (RSUs) and manages signal control using Proximal Policy Optimization (PPO), guided by global traffic indicators such as accumulated vehicle waiting time. Secure communication between RSUs and cloud infrastructure is ensured through Transport Layer Security (TLS)-encrypted data exchange. We validate the framework through extensive simulations in SUMO across diverse urban settings. Simulation results show an average 30.20% reduction in vehicle waiting time at signalized intersections compared to baseline fixed-time configurations derived from OpenStreetMap (OSM). Furthermore, emissions assessed via the HBEFA-based model in SUMO reveal measurable reductions across pollutant categories, underscoring the framework’s dual potential to improve both traffic efficiency and environmental sustainability in simulated urban environments.

1. Introduction

In the last decade, technological innovation, urbanization and the need for sustainable mobility solutions led to the growing adoption of traffic management systems. The future of traffic management focuses on intelligent, adaptive, and interconnected components that can handle increasing traffic volumes while improving road safety, efficiency, and environmental accountability. These systems are based on advanced technologies, including Internet of Things (IoT) sensors, smart cameras, Global Positioning System (GPS) devices, and artificial intelligence (AI) algorithms in order to offer real-time and accurate information about traffic flow and road conditions. Implementing such systems in large urban areas can lead to improved traffic control and more efficient transportation management. Moreover, scenarios like traffic jams, air pollution, and road safety challenges have increased due to rising urban populations and the growing number of vehicles. Therefore, these are additional arguments for the need for real-time traffic monitoring systems that should optimize traffic flow, minimize delays, and increase public safety.
Traffic congestion leads to a large amount of carbon emissions and air pollutants, among which, the most widespread are carbon dioxide (CO2), hydrocarbons (HC), carbon monoxide (CO), nitrogen oxides (NOx), and particulate matter (PM), which impact urban air quality and public health [1]. Studies reveal that emissions during congested traffic conditions can be multiples of those during smooth traffic flow, with CO emissions being especially significant [2]. The application of carbon emission metrics within traffic signal control frameworks allows for emission-aware adaptive signal timing. Reinforcement learning-based adaptive control algorithms, such as Multi-Objective Multi-Agent Deep Deterministic Policy Gradient (MOMA-DDPG), have proved the minimization of both traffic delays and carbon emissions through coordinated local and global traffic optimization [3,4]. Simulation and field studies confirm that such systems can reduce CO2 emissions by 12–41%, depending on the network and control strategy [5]. Environmental impact models incorporate traffic pollutant emission factors linked to vehicle operating modes (acceleration, deceleration, idling, uniform speed) to guide optimal traffic management decisions [2]. Considering environmental impact is crucial in smart city development, connecting traffic management to broader sustainability and emission reduction objectives [6,7].
The intelligent traffic management market is predicted to expand robustly, with compound annual growth rates (CAGR) estimated between 9.7% and 15% over the coming years. This growth is driven by rising urbanization, increased vehicle usage, expansion of smart city initiatives, and demand for environmentally sustainable traffic solutions [8]. Additionally, the market growth is one of the consequences of government investments and the proliferation of connected vehicles, facilitating real-time traffic data sharing and adaptive control system deployments [7,9]. Technological enhancements will lead to traffic monitoring devices capable of handling terabit-scale data volumes with sub-second latency, supporting monitoring of hundreds of thousands of concurrent traffic flows.
Intelligent Transportation Systems (ITS) are based on technologies whose purpose is to enhance the management of transportation systems, improve public transit, and assist individuals in making travel-related decisions. These systems integrate advanced wireless, electronic, and automated technologies to increase safety, efficiency, and convenience in surface transportation [10]. They also aim to reduce energy consumption in certain situations, although this is not their primary objective. ITSs are based on the application of information, communication, and sensing technology to transportation and transit systems. ITSs will become an important part of urban planning and future smart cities, contributing to improved road and traffic safety, transportation efficiency, and reduced environmental pollution. The concept of ITS emerged in the 1990s and has since been continuously evolving. The U.S. Department of Transportation (USDOT) defines ITS as a means to achieve safety and mobility in surface transportation through the application of information and communication technologies, specifically excluding air transportation [11]. Similarly, the European Union defines ITS with a focus on road transportation [12]. ITSs will become an important part of urban planning and future smart cities, contributing to improved road and traffic safety, transportation efficiency, and reduced environmental pollution. These services often depend on the interaction between vehicles and road infrastructure, which supports the idea of Cooperative ITS (C-ITS). C-ITS leverages Vehicle-to-Everything (V2X) interaction and aligns with efforts towards “smart and connected vehicles” [13]. ITSs have different applications, including traffic flow optimization, real-time traveler information on routes and delays, and improved public transit management through updates on bus locations and seat availability [13,14]. They support the development of autonomous vehicles and enhance safety through systems like forward collision warnings, smart traffic lights, and pedestrian alerts. Core Cooperative ITS (C-ITS) applications using vehicle-to-vehicle (V2V) and vehicle-to-infrastructure (V2I) communication include Road Hazard Signaling, Intersection and Longitudinal Collision Risk Warnings, and Vulnerable Road User protection [13,14]. These functionalities are implemented using fundamental tasks, often supported by machine learning (ML) technologies [13,15,16]:
  • Perception Tasks: These tasks involve detecting, identifying, and recognizing data patterns to extract and interpret relevant information from the ITS environment. This is crucial for applications like cooperative collision avoidance, which gathers data from a vehicle’s sensing infrastructure to provide awareness of its surroundings. The massive amounts and variety of data produced by sensors pose challenges related to data fusion and big data for perception tasks.
  • Prediction Tasks: These tasks aim to forecast future states based on historical and real-time data, enabling proactive applications. For instance, cooperative collision avoidance applications predict vehicle movements to identify potential accidents and mitigate impacts. Long Short-Term Memory (LSTM), Recurrent Neural Networks (RNN), and Convolutional Neural Networks (CNN) have been widely used for prediction tasks in recent years.
  • Management Tasks: ITS leverages ML in infrastructure management to provide services that enhance road safety and efficiency. This includes efficient resource allocation for resource-intensive use cases such as on-demand multimedia video and live traffic reports. ML techniques have been applied to dynamic computing and caching resource management, with objectives like maximizing Quality of Service (QoS) and minimizing overhead and cost.
  • Energy Management: This involves optimizing energy consumption, particularly for electric vehicles (EVs), by determining charge/discharge policies based on routes. ML algorithms such as regression and reinforcement learning (RL) are used for this purpose.

1.1. Motivation

Adaptive traffic management systems, including traffic signal control, are fundamental to ITS [13,17]. These systems depend on continuous traffic monitoring, data processing, and coordinated signal operation. Modern traffic prediction techniques often adopt a hybrid approach that combines convolutional neural networks (CNNs) with long short-term memory (LSTM) networks [18,19,20]. Although these models can forecast congestion and traffic patterns, their accuracy is highly dependent on the quality and volume of historical data. Moreover, their predictions tend to be less reliable during unforeseen incidents such as accidents, traffic signal malfunctions, roadworks, or road closures.
In parallel, real-time traffic density data can be derived from live inputs obtained by cameras, sensors, and specialized devices. This continuous monitoring of actual traffic conditions provides up-to-date traffic status, enabling quick responses to sudden changes or incidents. Video-based vehicle counting techniques leverage computer vision algorithms to detect and count vehicles from camera footage [21]. Among these methods, deep learning-based neural networks have proven to be highly accurate, capable of real-time performance, and easily scalable for vehicle detection and counting applications [22,23]. YOLO (You Only Look Once) is a real-time, single-stage object detection algorithm known for its high speed and accuracy, framing detection as a regression problem to predict bounding boxes and class probabilities from the entire image in a single pass [24,25]. Widely used in ITS, YOLO supports applications such as vehicle detection, accident identification, and traffic sign recognition, significantly enhancing safety and operational efficiency. Its real-time capabilities (up to 45 FPS), unified detection grid, and end-to-end training make it ideal for dynamic environments like autonomous driving and video surveillance. Variants like YOLOv5 and YOLOv8 offer improvements in performance and efficiency, while lightweight versions such as Edge YOLO are adapted for edge devices in resource-constrained contexts [26]. YOLO enables intelligent traffic monitoring, dynamic traffic light control, and drone-based surveillance, making it a key technology in modern ITS infrastructure.
Meanwhile, recent advances in reinforcement learning (RL) algorithms, particularly Proximal Policy Optimization (PPO) [27] have significantly enhanced real-time traffic signal control. PPO is used in ITS to improve autonomous driving, traffic signal control, and resource allocation in connected vehicle networks, due to its ability to handle complex decision-making and continuous action spaces [28]. In autonomous driving, PPO supports intelligent decision-making in dynamic environments, with enhanced variants like LFPPO and SA-PPO improving exploration and interaction with human-driven vehicles at unsignalized intersections [29]. PPO is also used for end-to-end driving systems and integrates human interventions to refine training. For traffic signal control, PPO optimizes signal timing to reduce congestion and improve throughput, outperforming classical algorithms and adapting to dynamic factors like weather and holidays [30]. In multi-intersection scenarios, Multi-Agent Reinforcement Learning (MARL) expands PPO’s scope for coordinated control. Additionally, PPO is applied in Internet of Vehicles (IoV) for efficient resource allocation, using multi-agent frameworks to dynamically manage bandwidth and transmission power [19]. JointPPO, a centralized PPO extension, further enhances coordination in large-scale multi-agent systems, proving effective in high-dimensional environments.

1.2. Contributions

To overcome the aforementioned limitations and leverage recent technological advancements, we introduce DeepSIGNAL-ITS, an intelligent traffic management framework that combines deep learning and reinforcement learning to monitor vehicle density in real time and dynamically adjust traffic signals. Specifically, the key contributions of our work are as follows:
  • Real-Time Vehicle Detection and Counting at the Edge: We developed a low-latency vehicle detection and tracking system based on YOLO, deployed on edge devices (NVIDIA Jetson Nano) configured as RSUs near traffic lights. This system processes video streams locally, minimizing bandwidth usage by sending only structured JSON traffic data instead of raw video feeds.
  • Reinforcement Learning (PPO) Optimization Engine: Collects traffic data from RSUs and uses SUMO to simulate traffic scenarios for training. Employs Proximal Policy Optimization (PPO) within a scalable containerized framework to optimize traffic signal phase durations. Moreover, within PPO orchitecture, we defined a multi-level observation space incorporating both local metrics (e.g., per-intersection vehicle waiting time, phase vehicle counts, intersection pressure) and global metrics (total and average vehicle waiting time) and introduced a pressure-based feature to model congestion asymmetries between major and minor roads.
  • Secure, Encrypted Cloud Communication Protocol: Implements certificate-based authentication and end-to-end encryption to safeguard data transfers between RSUs and the cloud. Utilizes lightweight JSON messages for efficient transmission of traffic data and status updates. Associates each RSU with a unique OpenStreetMap node for precise geographic identification.
  • Comprehensive Evaluation Across Real Urban Layouts: Validated the system in both large (Bucharest) and small (Tecuci, Galați, Focșani) Romanian cities using SUMO-based simulations with up to 24 randomized route files per scenario. Demonstrated consistent reductions in total and average vehicle waiting times (up to 50% in some sectors), confirming the effectiveness of the algorithm across different city sizes and traffic complexities. In addition to traffic flow improvements, an exploratory analysis of emissions across six key pollutant categories, including CO, CO 2 , HC, NOx, PMx, and fuel consumption, was conducted using SUMO’s built-in HBEFA-based emission estimation module. The results revealed a consistent and measurable decrease in pollutant output, driven by optimized signal timings that reduced idle time and stop-and-go driving. These findings underscore the algorithm’s potential to simultaneously enhance urban mobility and promote environmental sustainability.

2. Related Work

2.1. Vision-Based Vehicle Counting Using CNNs

Vehicle counting from video footage provides an automated and effective approach for assessing vehicle density at key locations, such as intersections. In this context, computer vision techniques leveraging CNNs [31], such as YOLO [32,33,34], provide a robust and real-time solution for monitoring traffic flow within ITS to enable optimal traffic management [35]. For example, ref. [36] introduces a real-time vehicle detection and counting system that combines YOLOv2 with feature point motion analysis. The method functions in two stages: it first detects vehicles using YOLOv2, then accurately counts them by tracking their movement across successive frames, enhanced by K-means clustering and the KLT tracker for refined trajectory assignment. Similarly, ref. [37] combines YOLOv4 with SORT and DeepSORT trackers to develop two trajectory models, YS and YDS, for improved vehicle detection and tracking.
In addition, recent research has focused on overcoming the shortcomings of traditional traffic monitoring by introducing advanced computer vision-based systems capable of accurate real-time traffic volume analysis in challenging conditions. For example, ref. [38] presents the MDCFVit-YOLO model, an enhanced version of YOLOv8, designed specifically for nighttime infrared object detection. It addresses issues such as low visibility and small object detection through key innovations, including a lightweight RepVIT backbone, an MPA module for multi-scale contextual integration, a CSM module to boost small target sensitivity, and a dynamic detection head (DAIH). In a related effort, ref. [39] evaluates YOLO versions 8 to 11, DETR, and Faster-RCNN using video footage from New Zealand highways under varying weather and traffic conditions. Their optimized method, which combines YOLOv10l with ByteTrack, achieves a high vehicle counting accuracy of 98.01%.
Another limitation lies in the need to enhance efficiency while minimizing computational overhead. To enhance efficiency and reduce computational load, ref. [40] introduces PMSA-YOLO, a lightweight vehicle detection model. It features a Parallel Multi-Scale Aggregation (PMSA) module for efficient multi-scale feature extraction, a Convolutional Block Attention Module (CBAM) for improved key feature recognition, and a bidirectional feature pyramid network for optimized feature fusion.

2.2. Policy-Based Reinforcement Learning for Traffic Lights Control

Adaptive traffic signal control methods aim to adjust signal plans to mirror real-time traffic demand. Reinforcement learning (RL) has emerged as a viable and powerful approach to optimizing traffic signal control due to its ability to learn directly from data and adapt to complex and dynamic traffic environments [41,42]. RL methods are highly responsive in real-time, continuously updating their policies to reflect evolving traffic patterns. They also offer strong scalability, particularly through multi-agent architectures, enabling coordination across city-wide systems of intersections [43,44]. Moreover, RL methods are model-free optimization systems [45], meaning they do not use mathematical models of traffic flow but instead learn optimal control strategies directly from the interaction with the environment. The key components of an RL-based traffic control system include the formulation of states, actions, and rewards [46]. For a given urban region with specific traffic conditions, the state might include variables such as vehicle waiting time, delays, and congestion levels. The action space can be defined in both continuous form, such as adjusting the current phase duration or phase ratio, and discrete form, such as switching phase or selecting the next phase. The reward function is designed to guide the learning process and consider factors such as total vehicle delay, queue length, green wave efficiency, and environmental impact.
Model-free RL methods employed in adaptive traffic signal control include value-based algorithms such as Q-learning [47], Deep Q Network (DQN) [48], Double Deep Q Network (DDQN) [49], Dueling Double Deep Q Network (D3QN) [50], as well as policy-based methods such as the Monte Carlo Policy Gradient (REINFORCE) [51], the Deterministic Policy Gradient (DPG) [52,53] and Proximal Policy Optimization (PPO) [17,18,19,54,55,56,57,58,59,60,61,62]. Among these, PPO has received considerable attention for this application [63], due to its effective trade-off between learning stability and computational efficiency [64].

2.2.1. General Design of PPO Systems in Adaptive Traffic Control

PPO-based traffic signal control strategies are typically formulated as a Markov Decision Process (MDP), which consists of a defined state space, action space, and reward function. The state space encodes the current traffic flow conditions, commonly incorporating features such as vehicle waiting times, speeds, traffic signal phases, congestion levels, lane occupancy, or a combination of these factors [18,19]. These features capture both spatial and temporal dynamics of traffic flow and are often represented as a matrix or vector format [55], which serves as input to the PPO agent. Based on the current state and the learned policy, the agent selects an action from the predefined action space, typically corresponding to a particular traffic signal phase or transition.
In [55], Huang et al. assert that the action modes in adaptive traffic control can generally be divided into three categories. The first category involves selecting a green-light phase for a single direction, while all other directions remain red. As traffic control needs evolved, more complex phase combinations emerged, such as separate actions for the north-south straight, north-south left turn, east-west straight, and east-west left turn phases. The third approach utilizes a continuous action space, in which the agent predicts the duration of the upcoming phase within preset limits, while keeping the phase sequence fixed.
After the selected signal control action is executed, the environment transitions to a new traffic state and calculates a corresponding reward. This reward reflects the immediate effectiveness of the applied control strategy. The agent uses this feedback to evaluate its decision and update its policy accordingly. The ultimate objective is to maximize the cumulative reward over time, thereby improving overall traffic flow efficiency in accordance with the control goals of the system. Michailidis et al. [63] categorize reward functions in adaptive traffic control systems into six main types: queue or waiting time-based, delay-based, pressure or cost-based, safety-oriented, emissions-focused, and hybrid or multi-objective approaches.
The PPO algorithm leverages this process to update its policy parameters with the objective of maximizing the expected cumulative reward, while simultaneously limiting the extent of policy changes to ensure stable and reliable training. This iterative process continues until the agent learns to optimize signal timings under varying traffic conditions, ultimately leading to the convergence of the policy toward an optimal solution.
Table 1 provides an overview of various studies employing the PPO algorithm for traffic signal control, illustrating the diversity in methodologies, state representations, action spaces, and reward functions. In addition, the table examines whether traffic density is explicitly considered in these approaches. Notably, only a few studies incorporate traffic flow predictions and most rely on estimated or indirect measures rather than real-time traffic density monitoring.

2.2.2. Performance Analysis and Baseline Control Methods

To evaluate the effectiveness of PPO-based adaptive traffic signal control strategies, a set of performance indicators is established. Although these metrics are typically aligned with the reward functions employed during training, they often extend beyond them to provide a more comprehensive evaluation of overall improvements in the controlled traffic system [63]. For instance, in [55], five performance indicators are analyzed: average speed, average lane occupancy rate, average maximum queue length, average parking time, and overall traffic flow. In contrast, the reward function in that study is defined solely based on the average speed of vehicles across the road network. In [19], the evaluation metrics include the average travel time, the average speed, the average waiting time, and the vehicle throughput. Meanwhile, the reward function is designed to minimize the total vehicle waiting time at the intersection.
Baseline control methods typically represent traditional traffic control strategies or earlier learning-based models, such as MaxPressure [66], CoLight [67], PressLight [68], MPLight [69] and MetaLight [70]. For example, Zhou et al. [61] propose Hyper-Action Multi-Head Proximal Policy Optimization (HAMH-PPO), a multi-agent reinforcement learning (MARL) approach based on the Centralized Training with Decentralized Execution (CTDE) framework. This method employs a shared PPO policy network to generate personalized signal control strategies for individual intersections. Its performance is evaluated against several benchmark methods, including CoLight, MaxPressure, and MPLight.
More recent baselines incorporate alternative RL algorithms, allowing comparative analyses with methods such as Q-learning [18,19], Deep Q-Networks (DQN) and its derivatives, including Double DQN and Dueling DQN [17,55], as well as Advantage Actor-Critic (A2C) [62] and Cooperative Control for Traffic Light Signals and Connected Autonomous Vehicles (CoTV) [54]. These approaches serve as benchmarks for evaluating the performance of PPO-based traffic signal control, particularly with respect to traffic efficiency, system robustness, and adaptability under dynamic traffic conditions.
In addition, particular attention is given to analyzing policy optimization fluctuations, which offer insights into the learning dynamics, system stability, and overall performance. PPO is noted for exhibiting reduced reward variability and achieving faster convergence toward optimal control policies [18].

2.2.3. Scale and Simulation Environment

Scalability is a critical aspect in the design and evaluation of traffic signal control systems. In this context, a key attribute of an adaptive signal control approach is the number of intersections modeled and managed by the RL algorithm. This factor directly reflects the practical applicability of the proposed solution in real-world settings, since it indicates both scalability and computational efficiency [63]. As the number of controlled intersections increases, so does the computational complexity of the system, posing challenges for real-time deployment [56]. In particular, a significant number of existing studies focus on single-intersection control [17,55,56,57,59] or minimal-scale networks (including 2–6 intersections [63]) [18,19], which limits their scalability to more complex multi-intersection urban traffic networks. Simulation platforms like SUMO, VISSIM, and CityFlow facilitate detailed and customizable urban traffic modeling with seamless RL integration, making them well-suited for testing traffic control systems prior to real-world deployment.
In [56], a federated collaboration mechanism is proposed to address the challenges posed by the gradual expansion of road networks and the exponential growth of state and action spaces associated with an increasing number of intersections. However, simulation experiments are conducted within a single-intersection setting.
However, more complex simulation scenarios and enhanced scalability are demonstrated in [54,58,61]. The study in [58] introduces a centralized-critic multi-agent PPO (MA-PPO) framework for adaptive and coordinated control along a seven-intersection arterial corridor, modeled using the PTV-Vissim-MaxTime, version 2025.00-08, software. Similarly, within a Centralized Training with Decentralized Execution (CTDE) architecture, Ref. [61] proposes the Hyper-Action Multi-Head PPO (HAMH-PPO) method, which leverages a shared PPO policy network and is validated across six scenarios using the CityFlow simulation platform. These scenarios span two synthetic networks, Grid10×10 and Grid4×4, comprising 100 and 16 intersections, respectively, as well as two real-world networks derived from Jinan and New York, containing 12 and 48 intersections [54], where experiments are carried out on a 1 km2 network in the city center of Dublin, comprising 31 signalized intersections.
In [43], Wang et al. suggest that the efficiency of the traffic network can be assessed at three distinct levels: intersection, network, and arterial. Intersection-level metrics, such as delay, queue length, and intersection pressure, offer localized performance insights. Network-level indicators, such as total vehicle waiting time across the network, provide a broader perspective but are more challenging to implement in real-world applications. Arterial-level metrics evaluate signal coordination across multiple intersections (e.g., green waves), focusing on smooth vehicle progression along corridors. Table 2 summarizes the key contributions of each study, along with the simulation setups used to evaluate PPO-based adaptive traffic signal control models, including performance metrics, simulation platforms and the number of intersections tested.
Training within a simulated environment requires the inclusion of external factors, such as weather conditions, holidays, and accidents, that can influence traffic flow. Evaluating their impact on the traffic light control system is essential for developing a more robust and adaptable solution suitable for real-world deployment. The study by Lin et al. [19] provides a quantitative analysis of how irregular traffic patterns, including those caused by holidays and weather changes, affect signal control strategies. Their findings show that the PPO-controlled system maintains traffic efficiency even in the face of previously unseen fluctuations. Ref. [17] presents an evaluation of the impact of traffic collisions on the performance of learning-based traffic light control systems, specifically those based on DQN, DDQN, and PPO, under two control policies: one employing variable time intervals for traffic signal phases, and the other using fixed time intervals. Their simulation results indicate that PPO outperforms value-based RL methods, demonstrating greater robustness and superior overall performance.

3. Methodology and Implementation

This section presents the overall system architecture of the proposed traffic optimization framework, outlining the end-to-end development process, from data collection and preprocessing for model training to deployment. The design follows a modular and scalable approach, integrating edge computing, secure cloud communication, centralized decision-making via reinforcement learning, and real-time monitoring tools.

3.1. Framework’s Architecture

The Figure 1 illustrates the overall architecture of the system, highlighting the core modules, their interconnections, and the general flow of the traffic optimization framework. The proposed architecture consists of multiple interconnected modules, each dedicated to a critical function within the intelligent traffic optimization pipeline.
  • Data Acquisition and Vehicle Detection—Captures real-time traffic data using roadside cameras and processes video streams to detect and count vehicles at intersections.
  • Secure Cloud Communication Protocol and Data Exchange—Ensures reliable and encrypted transfer of traffic data from the edge devices to the cloud-based processing units.
  • Cloud-Based Web Interface and RL Model Generation—Provides an intuitive web interface for system monitoring, configuration, and the dynamic creation of reinforcement learning (RL) models tailored to the traffic topology.
  • Reinforcement Learning Decision Logic—Hosts the PPO-based control engine responsible for adjusting traffic light phases and durations based on learned traffic patterns.
  • Secure Communication and System Integrity—Implements protection mechanisms to ensure the confidentiality, integrity, and availability of data throughout all system communications.
The system is built with practical deployment considerations, enabling real-time traffic signal optimization using live video data and reinforcement learning. At the edge, the Nvidia Jetson development kit captures traffic footage via connected cameras and performs local vehicle detection. For physical control, the Jetson directly interfaces with the traffic signal controller using standard industrial protocols like GPIO (General Purpose Input/Output), CAN (Controller Area Network). These protocols are commonly used in traffic control cabinets and embedded systems, ensuring compatibility with existing roadside infrastructure. This direct connection allows the system to update signal timings on-site with minimal delay, maintaining responsiveness and operational continuity.
The system design features a reliable fallback mechanism to maintain operation during network issues or cloud server downtime. The Nvidia Jetson device includes an embedded local control logic module that holds a pre-set baseline traffic signal plan, based on historical data or default timings. This allows the device to run a functional signal schedule independently. If the Jetson detects communication loss with the cloud environment, due to connectivity problems, server downtime, or latency, it automatically switches to local control. During this time, the traffic signals operate on the fallback plan, ensuring continuous intersection management and system stability. When communication is re-established, the Jetson smoothly transitions back to dynamic control, using the latest policy updates from the central optimization module. This approach improves safety, maintains minimum service levels, and enables graceful degradation for real-world deployment.

3.2. Data Acquisition and Vehicle Detection

The Vehicle Detection and Counting module serves as a fundamental component of the system architecture, tasked with the initial acquisition of traffic data by detecting and counting vehicles entering or exiting intersections.
This edge-side functionality is implemented using real-time AI-based object detection [71], allowing low-latency processing and eliminating the need to transmit raw video data to the cloud, thus avoiding network congestion and preserving bandwidth. The hardware platform used consists of a NVIDIA Jetson Nano development kit paired with a video camera [72,73]. Installed adjacent to the traffic lights, this configuration forms a Roadside Unit (RSU), which operates independently to collect and preprocess traffic data. The module receives a continuous video stream and outputs structured traffic information in JSON format, specifically listing the vehicles that have entered and exited the monitored intersection during a given time window.
The core detection engine is based on the YOLOv8 architecture, known for its speed and efficiency in real-time object detection tasks. For vehicle tracking and trajectory analysis, a custom tracker inspired by the Centroid Tracking algorithm has been developed [74]. Additional technologies include:
  • OpenCV, for frame acquisition and preprocessing.
  • Docker, for containerized deployment and edge scalability.
  • ImageHash, a perceptual hashing library used to reduce redundant computation.

3.2.1. Algorithm Workflow

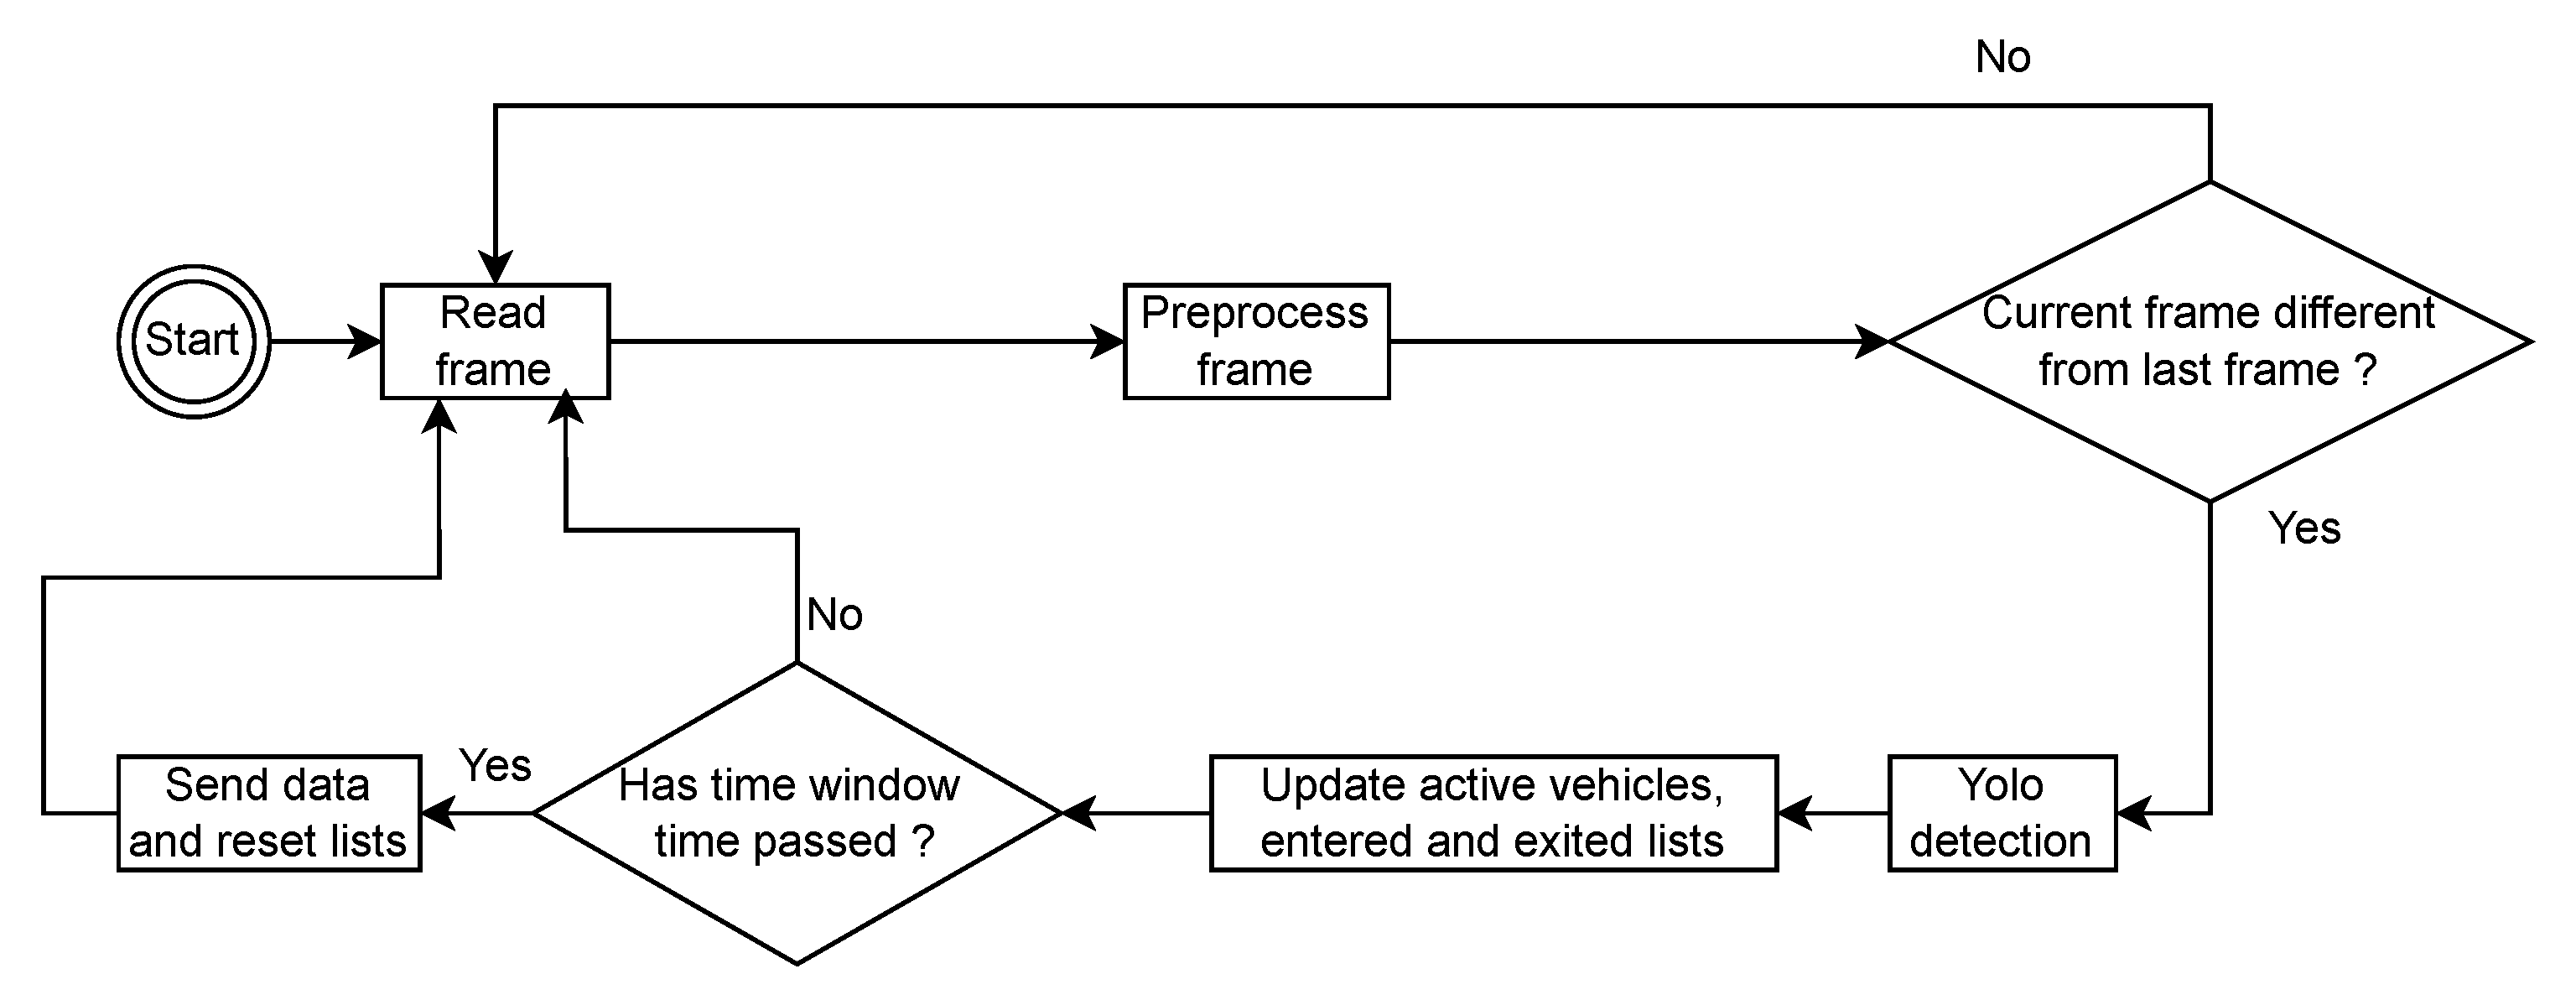
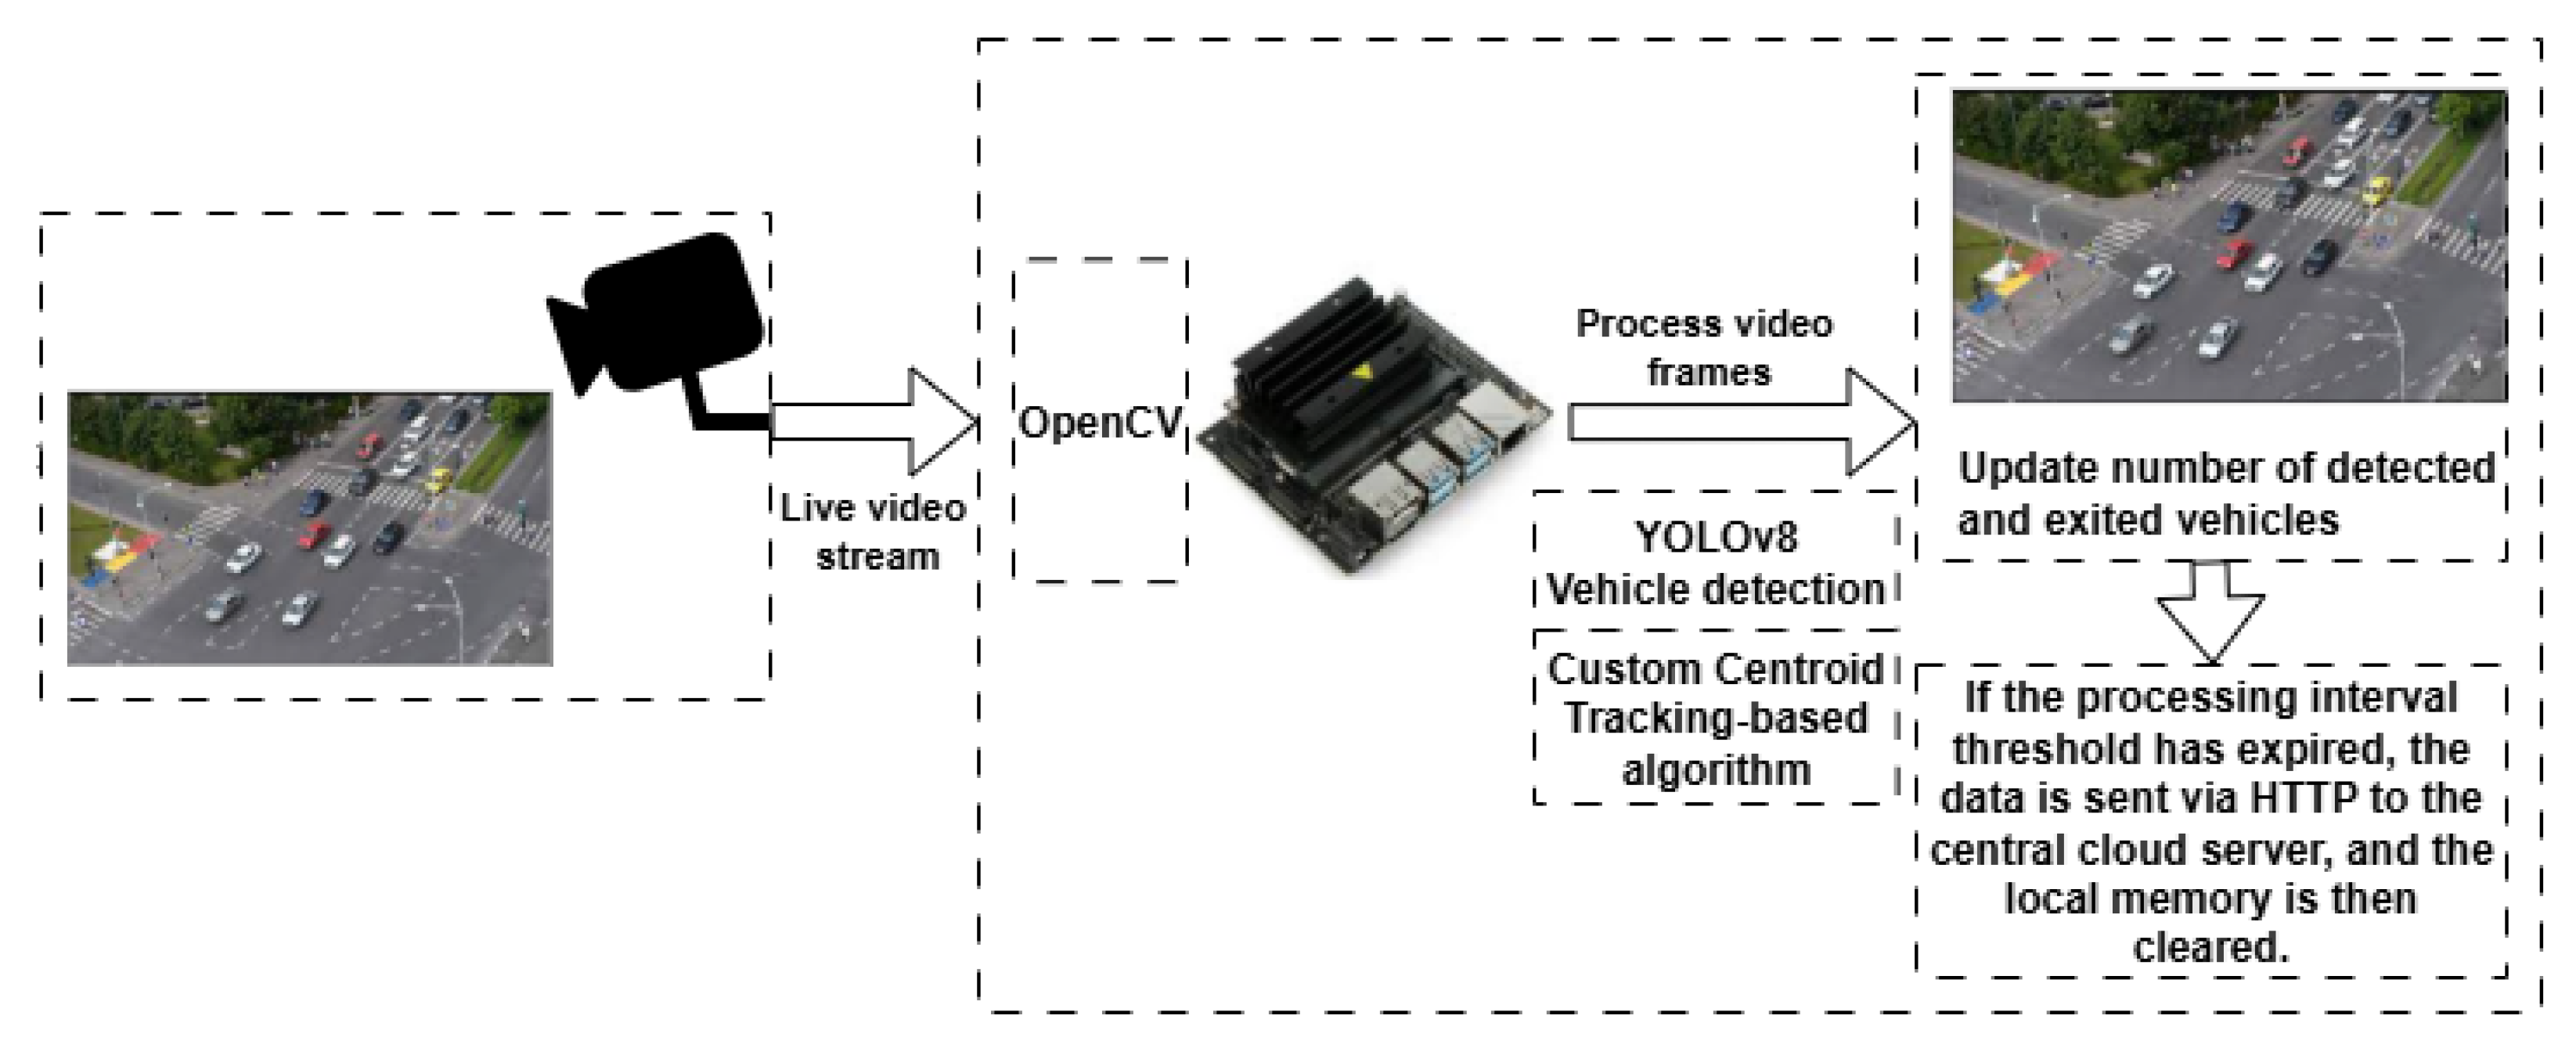
A schematic representation of the vehicle detection and counting module processing pipeline is illustrated in Figure 2. The detection process starts with capturing frames from the live video stream. Each frame is first resized to minimize computational overhead, after which a perceptual hash is generated. If the hash is found to be sufficiently similar to the previous frame (based on a configurable similarity threshold), the frame is skipped under the assumption that no meaningful change has occurred in the scene. When a new frame is identified as significantly different, the YOLOv8 model is invoked to perform object detection. The detected vehicles are registered by their bounding box center and stored in a working list.
The tracking procedure follows a looped comparison between the current and previous detection results. For each new vehicle detected, its center is compared with those of the previous frame. If a match is found within a distance less than or equal to half the diagonal of a bounding box, the vehicle is considered to be already tracked, and its center is updated accordingly. Otherwise, it is recorded as a newly entered vehicle.
Vehicles present in the previous frame but missing from the current detections are assessed for potential exits from the monitored zone, using their movement direction as a reference. At the end of each processing interval (e.g., hourly), the system compiles entry and exit data, transmits them to the central cloud server, and resets local memory for the next data collection cycle. A representative example of these vehicle logs is provided in Appendix A.

3.2.2. Algorithm Validation and System Deployment

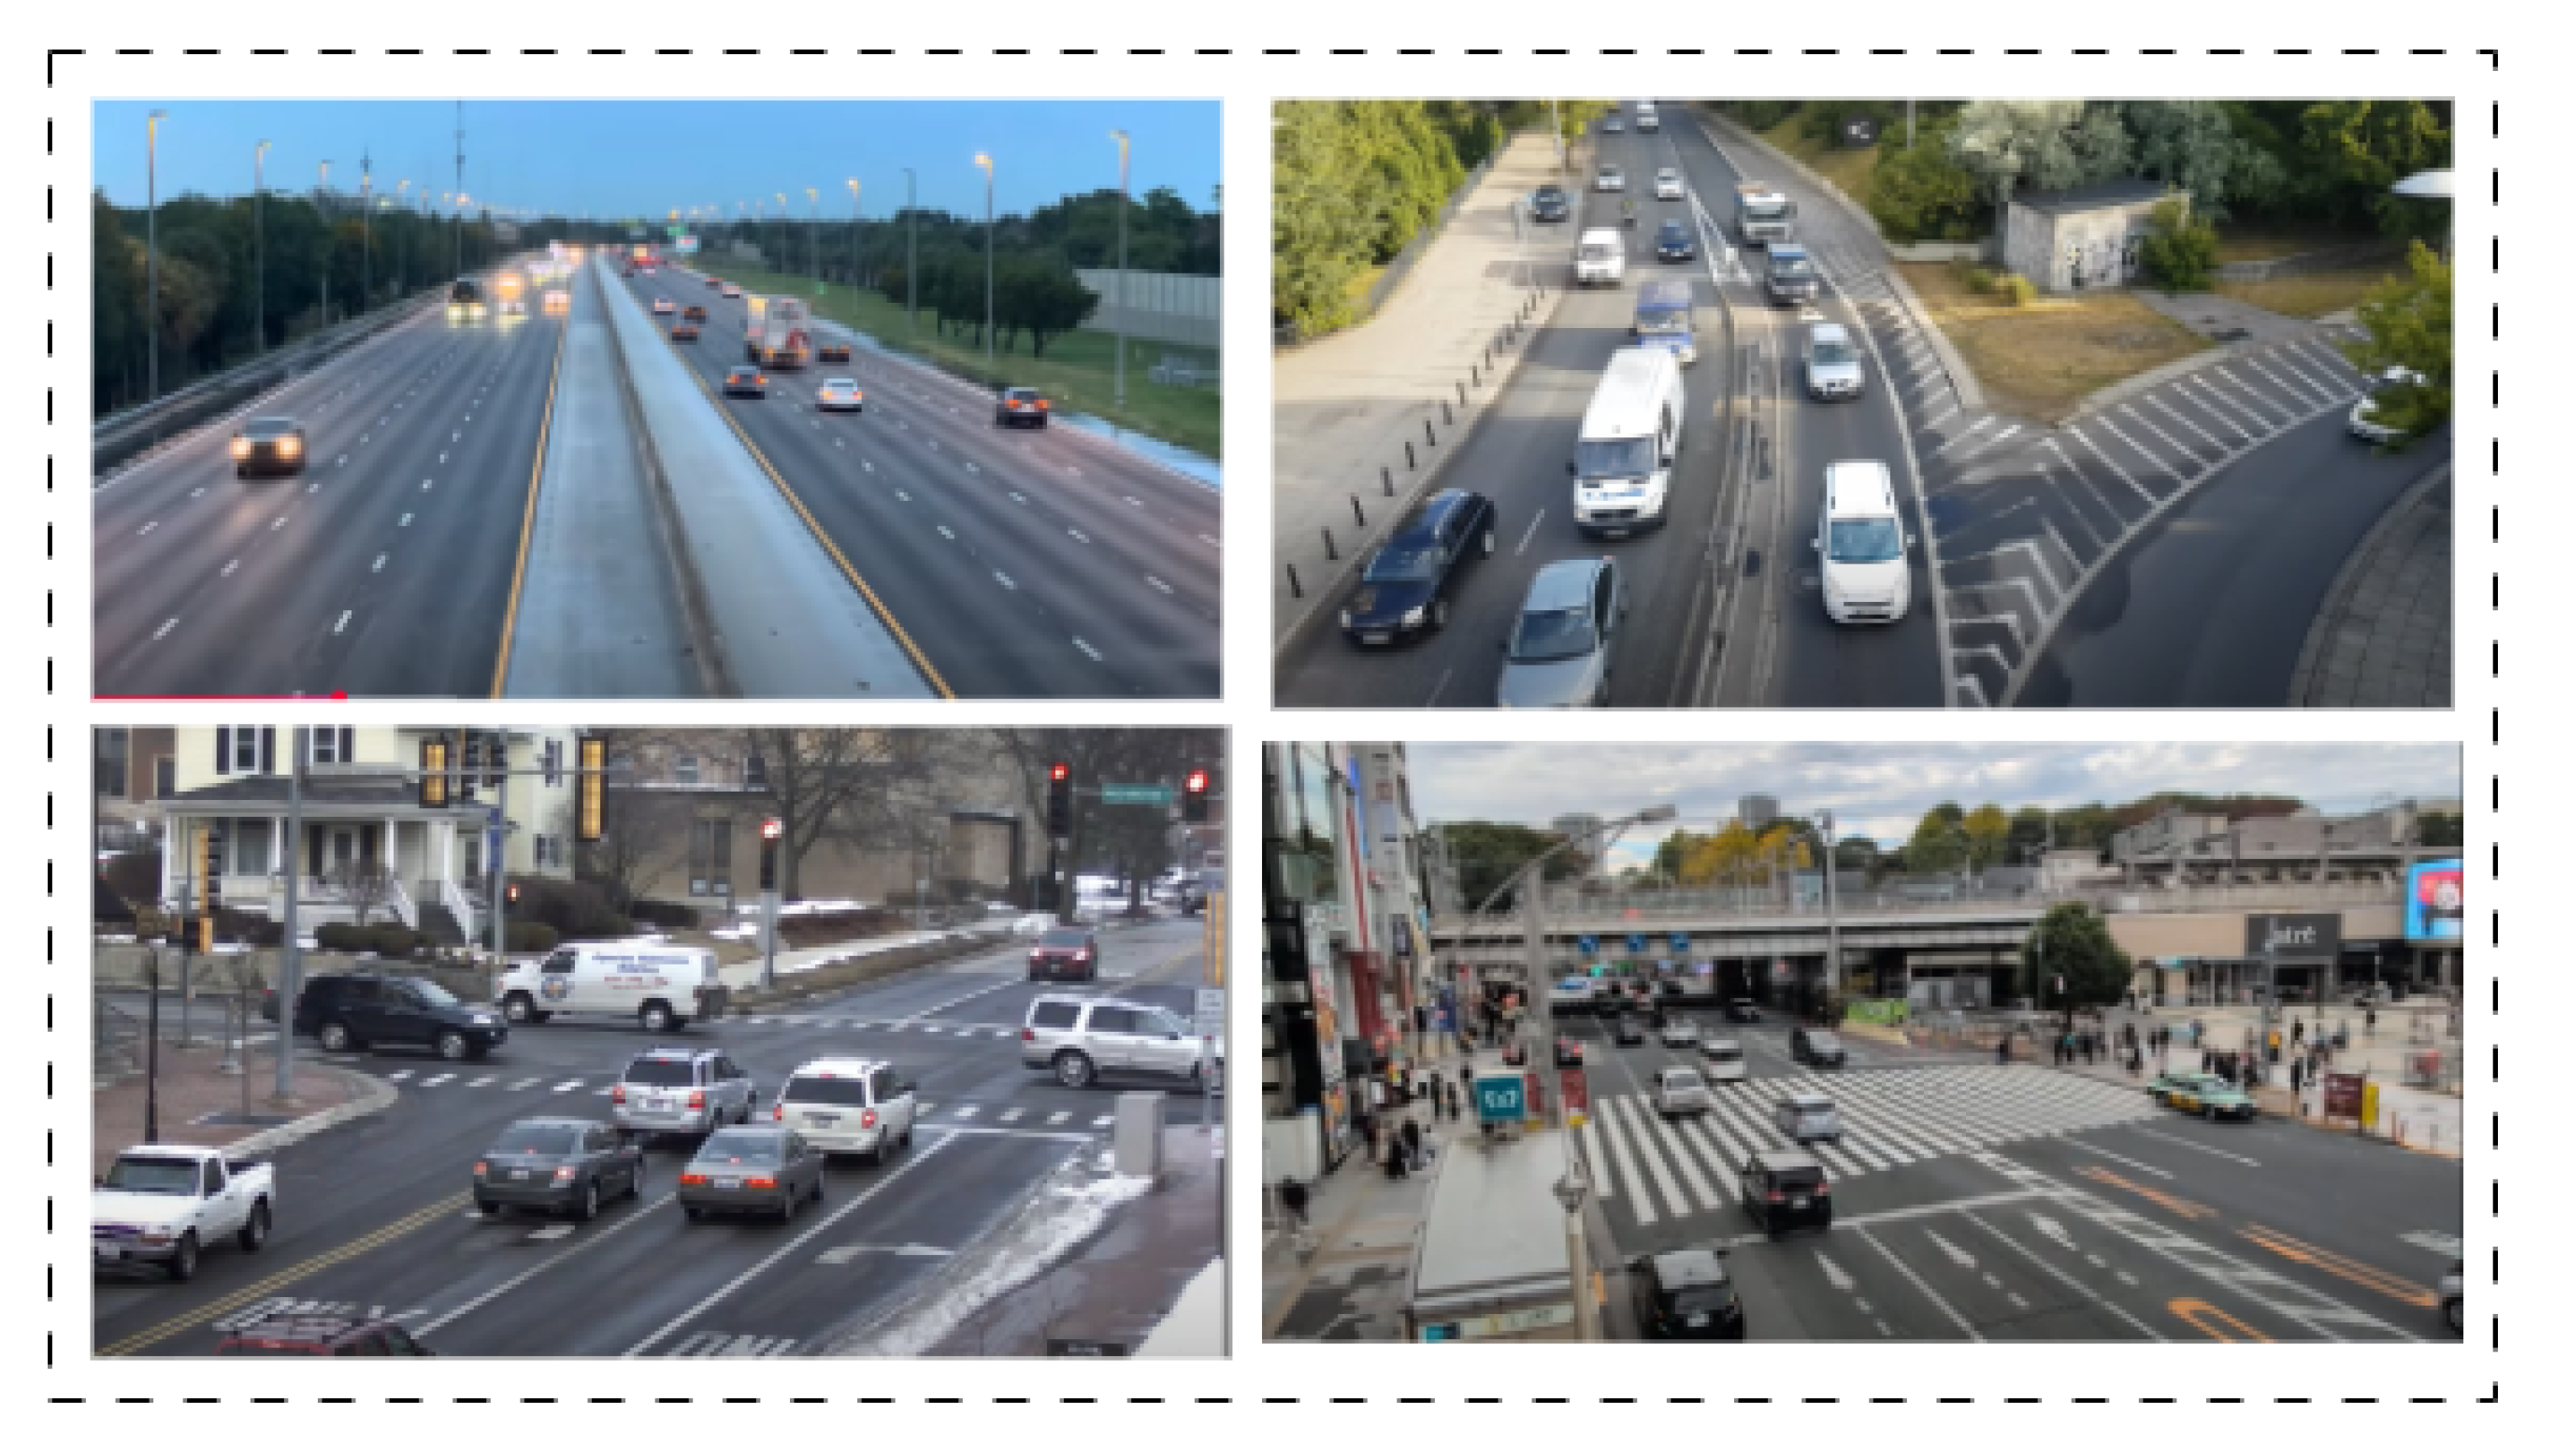
We evaluated our vehicle detection and counting module using a set of four recorded CCTV videos sourced from YouTube (Videos are available at https://github.com/B0r0B0r0/Optiroad, accessed on 1 August 2025). The video footage included two urban intersections and two highway segments, selected to assess the system’s performance under both congested and high-speed traffic conditions, as illustrated in Figure 3. Additionally, three of the videos were captured during daytime, while one featured nighttime conditions, allowing us to observe performance across varying lighting environments.
We used the YOLOv8 model for vehicle detection and OpenCV for video rendering. To avoid counting the same vehicle multiple times, we implemented a custom tracking algorithm based on centroid tracking. Counting accuracy was evaluated by comparing the predicted results with manually annotated ground truth data.
We assessed the performance of our vehicle counting system using two key metrics, accuracy and precision, for both entering and exiting directions. As presented in Table 3, the experimental results indicate that the system delivers reliable and consistent performance across diverse traffic scenarios, including highways and complex multi-lane intersections. Notably, the system achieves high accuracy for cars and trucks, with most values exceeding 97% for both entering and exiting directions across all videos, for instance, car detection in Video 1 and Video 4 surpassed 97% accuracy in both directions. Motorbikes, while generally detected with reasonable accuracy (typically above 80%), show comparatively lower performance due to their smaller size and greater maneuverability, which introduce additional detection challenges. Precision for motorbikes also drops in some cases (e.g., 77.78% for exits in Video 4), indicating occasional false positives in congested or visually complex scenes.
Although the tests were performed offline using recorded CCTV footage, the module is specifically designed for edge-based vehicle detection and is intended for deployment within a Roadside Unit (RSU), as shown in Figure 4. To optimize performance on the Jetson Nano, the YOLOv8 model was converted from the ONNX format to TensorRT (.engine), which is a serialized and hardware, optimized representation tailored for NVIDIA GPUs.
TensorRT engine files offer significantly faster loading and inference times compared to ONNX models. This setup enables real-time vehicle detection and counting directly at the network edge, minimizing reliance on cloud communication and ensuring low-latency processing. However, due to constraints related to field access and infrastructure permissions, real-world intersection deployment and physical installation were not included in this study.

3.2.3. Challenges and Limitations

The main challenges associated with this module are tightly coupled with the inherent limitations of real-time object detection models. Notable factors impacting performance include:
  • Degradation in image quality influenced by lighting, weather conditions, or camera resolution.
  • Traffic density, which increases the risk of occlusions and false detections.
Although external factors such as weather or camera positioning are not always controllable, the impact of dense traffic can be mitigated by customizing and fine-tuning the tracking component, allowing a more robust association between detections across frames.

3.2.4. Role Within the Framework

As a fundamental pillar of the entire architecture, the Vehicle Detection and Counting module ensures a reliable, real-time flow of data for subsequent cloud-based analysis and traffic optimization algorithms. The RSU, beyond data collection, also acts as an actuator that can dynamically modify the semaphore state based on feedback received from the centralized optimization system, thus closing the loop between perception and action.

3.3. Secure Cloud Communication Protocol and Data Exchange

To ensure confidentiality and integrity in the communication between the RSUs and the cloud infrastructure, the system employs certificate-based authentication and full encryption of all transmitted data. Upon initial deployment, each RSU sends a secure handshake request to the cloud server, which includes its physical location. The cloud system uses this location to assign the corresponding OpenStreetMap (OSM) [75] node identifier, which becomes the unique ID for subsequent interactions.
The communication protocol employs lightweight and secure JSON messages. RSUs periodically send data packets containing information that is used to evaluate local traffic conditions and update the global traffic optimization model, including:
  • The camera identifier.
  • A list of timestamps, representing the relative time a vehicle has entered the traffic light controlled intersection, since the beginning of the counting interval.
  • The number of vehicles detected leaving the intersection.
At fixed intervals (e.g., hourly), the cloud server returns an updated JSON configuration to each RSU. This response contains optimized traffic light phase durations for the monitored intersection, based on the latest output from the reinforcement learning model.

3.4. Cloud-Based Web Interface and RL Model Generation

The cloud infrastructure fulfills a dual role within the proposed framework: it serves as both the central controller for PPO-based traffic optimization [76] and as the interface through which system maintainers interact with deployed RSUs and system configurations.

3.4.1. Reinforcement Learning Optimization Engine

At the core of the cloud system lies the data aggregation and RL optimization engine. Each RSU periodically transmits structured traffic data containing vehicle counts, entry timestamps, and intersection identifiers which the cloud server aggregates into a unified representation of traffic conditions over a fixed time interval (typically one hour).
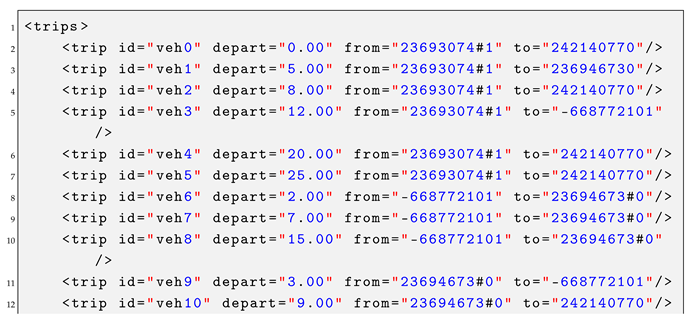
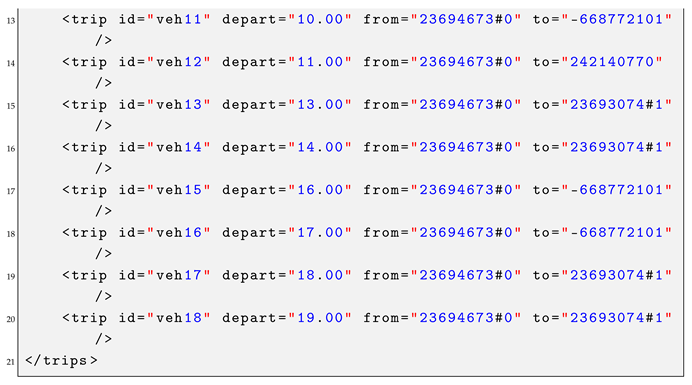
Using the data collected, the system dynamically generates traffic routes, detailed in Appendix B, and creates simulation scenarios with the SUMO traffic simulator [77]. These scenarios are then forwarded to a containerized PPO agent, responsible for computing the phase durations and configurations of all traffic light systems (TLS) involved [17]. Upon completing the training process for a given time window, the agent stores the resulting phase plan, along with simulation data and metadata, in a MongoDB instance for traceability and future analysis.
To ensure scalability and adaptability, a new PPO container is instantiated for each traffic optimization cycle, corresponding to a specific time frame. Once the optimization process is completed, the container is either destroyed or reassigned to a different city, being reloaded with new training data accordingly. The learnt policy, along with all relevant metadata, including traffic simulations and route mappings, is persistently stored in a MongoDB database.
Crucially, the concept of a “time frame” is defined in relation to the week. For instance, a one-hour time frame corresponds to a specific hourly window within the weekly cycle (e.g., Monday 14:00–15:00), rather than a daily recurring interval. This design allows the system to more accurately capture and adapt to recurring weekly traffic patterns.
When the same time frame recurs in a subsequent week, the PPO agent resumes training from the previously saved state, effectively implementing continual learning over time. This approach enables the system to refine its control policy incrementally as more data becomes available, improving its responsiveness to long-term traffic dynamics.
The PPO agent is trained to learn optimal traffic signal timing policies by maximizing a reward function designed to reduce traffic congestion. Specifically, the reward at each decision step is computed as the negative sum of vehicle waiting times across all lanes and intersections in the simulation environment, thereby encouraging the agent to minimize cumulative delay. The optimization process unfolds over simulated hourly and weekly traffic episodes that reflect typical demand cycles under uninterrupted conditions. While the objective does not explicitly minimize stop–start behavior or emissions, smoother flows naturally emerge as a byproduct of delay reduction. Mathematically, the reward r t at time step t is expressed as:
r t = i = 1 N w i ( t )
where w i ( t ) is the waiting time of vehicle i at time t, and N is the number of vehicles in the system. The agent interacts with the traffic simulation environment (SUMO), receiving observations and computing actions that aim to optimize long-term returns. For a detailed formulation of the reward structure and state representation, we refer the reader to Section 3.5.4. Although the current model does not explicitly simulate abnormal scenarios such as roadworks or accidents, future extensions may incorporate external event signals into the observation space, enabling adaptive response to traffic disruptions through multi-objective reward shaping.

3.4.2. Cloud-Based Web Interface

Complementing the backend optimization pipeline, the system features a web-based interface developed with a ReactJS frontend and Flask backend, integrated with a PostgreSQL database. This administrative platform is designed for system maintainers and authorized personnel, offering real-time visibility into system operations, configuration management tools, and user administration functionalities.
To become a maintainer, candidates must submit an on-site registration form and obtain a unique access key. It is strongly recommended that potential users coordinate with the system’s lead administrator before initiating the registration process. Once approved, the user can associate their account with a specific target city. The web interface also provides:
  • A live interactive map showing the RSU network.
  • Real-time traffic flow indicators and video feeds.
  • Device status, alerts, and logs.
  • Administrative functions for credential management and system configuration.
This integration ensures that all stakeholders, from local maintainers to central administrators, can effectively monitor and adjust the behavior of the traffic control framework.

3.5. Reinforcement Learning Decision Logic

In this work, we employ the PPO algorithm within a single-agent architecture to optimize urban traffic flow. The agent is containerized and connected to a MongoDB database, which serves as the source for the route files used in training and evaluation. These route files correspond to predefined traffic intervals, typically designed for one-hour windows, and contain the simulated vehicle flows that the agent must manage.
The primary objective of the agent is to determine optimized signal durations across all intersections in a given city or district, aiming to minimize the average waiting time at traffic lights. Rather than computing entire signal plans from scratch, our approach is based on an offset strategy. That is, it assumes that the initial configuration of the traffic signals (either from default city-wide setups or from previously computed schedules) is reasonably effective. The role of the agent, therefore, is to fine-tune these schedules by proposing offset values, expressed in seconds, that adjust the timing of each traffic signal phase.
This approach provides two significant advantages. First, it reduces learning complexity by narrowing the action space to delta adjustments, which are easier to learn and validate. Second, it facilitates smoother integration into existing traffic control infrastructures, where wholesale replacement of traffic plans is often impractical or politically sensitive.
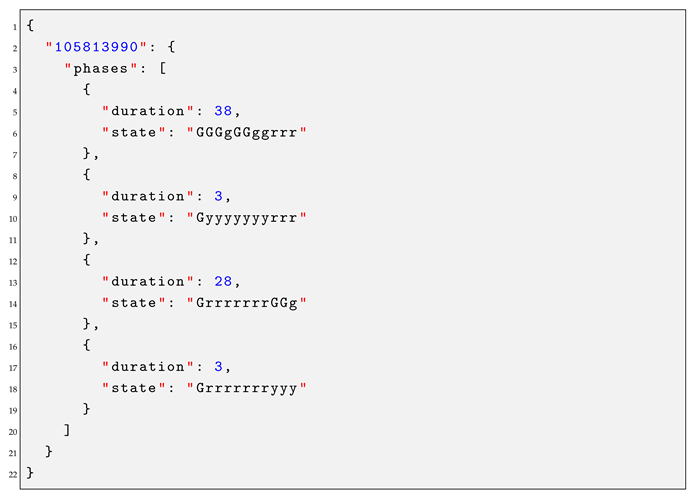
The offsets are computed and saved in a JSON file, which describes the adjusted duration and phase configurations for each traffic light in the scenario. A partial example of this output format is provided in Appendix C.

3.5.1. Environment Initialization

To initialize the environment, the agent requires a precise definition of the target city. Preferably, the input includes detailed administrative information such as country, county, city name, and, in large metropolitan areas, district, or sector. The geographical layout of the city is automatically retrieved from OpenStreetMap (OSM) via the Overpass API, ensuring consistent and up-to-date infrastructure data.
In addition to the city topology, the agent must receive a route file containing realistic vehicle trajectories. Once both inputs are available, the SUMO simulator is configured and the training phase can begin.

3.5.2. Training Strategy and Overfitting Concerns

For the training of the Proximal Policy Optimization (PPO) agent, a set of standard yet effective hyperparameters was adopted to ensure both stability and convergence efficiency:
  • The clipping parameter was set to 0.2, which restricts the policy update to prevent large deviations during training.
  • The discount factor γ was fixed at 0.99, placing a strong emphasis on long-term rewards, which is critical in traffic control environments with delayed feedback.
  • The learning rate was set to 3 × 10⁻⁴, and the optimizer used was Adam, chosen for its adaptive gradient descent capabilities and robustness in non-stationary environments.
  • The number of training epochs per update ( K epochs ) was set to 10, allowing enough iterations to improve the policy without overfitting each batch.
  • An entropy regularization coefficient of 0.01 was applied to encourage exploration during training, helping the agent avoid suboptimal local minima.
The training process is initially configured to run for 50 episodes per time-frame. Although this relatively low number of episodes may not lead to fully converged policies, it provides a solid initial improvement in traffic flow efficiency without risking severe overfitting.
A critical challenge in this early phase lies in the use of a single route file for training, which limits the generalization capability of the agent. Since route diversity increases only as more data is collected over time, we propose a dynamic training strategy. The agent begins with a single route file and gradually incorporates additional files collected during later iterations of the same time-frame (e.g., Monday 14:00–15:00). This incremental approach ensures continuous learning while mitigating the risk of overfitting to a single traffic scenario.
Notably, the policy learned for each specific time-frame is stored in a MongoDB database upon completion. When the same time-frame recurs the following week, the agent resumes training from its previously saved state, allowing it to improve iteratively based on week-over-week traffic patterns.

3.5.3. Single-Agent Architecture Justification

When approaching the challenge of optimizing a series of traffic lights using PPO, one of the most intuitive ideas that comes to mind is to adopt a multi-agent architecture. In such an approach, each traffic light controller is assigned to an individual agent, with custom observation spaces and tailored reward functions. Although this design is theoretically sound and aligns with many decentralized traffic management strategies, it becomes increasingly problematic when scaled to city-level scenarios.
In practice, medium-sized cities, such as county capitals, typically feature hundreds of traffic lights, while large urban areas like Bucharest may include thousands. Designing a correct multi-agent PPO architecture in this context requires carefully crafted observation and reward functions for each agent. The observation space, a critical component in reinforcement learning performance, often includes variables such as average waiting time, pressure, current signal phase, or vehicle count. However, the computational overhead of training thousands of agents with these individual inputs becomes a major bottleneck.
Beyond computational cost, another critical issue lies in coordination. In multi-agent systems without explicit communication, agents may act suboptimally due to a lack of synchronization with their neighboring TLS units. One proposed workaround is to construct a shared observation vector, containing traffic pressures, current phases, and other aggregated metrics, that is broadcast to all agents. Yet, this approach introduces significant noise and complexity: agents struggle to interpret such high-dimensional input, and the link between an agent’s actions and their effects on the environment becomes increasingly opaque.
A more balanced alternative involves limiting each agent’s observation space to include only its immediate neighbors. Although more relevant, this still leads to substantial computational costs and data duplication, ultimately feeding agents with information that may have limited influence on their own decision-making process. From this perspective, a single-agent architecture offers a substantial advantage. It possesses full visibility over the entire environment, akin to the aggregated vector in the multi-agent case, while maintaining direct control over the action space and its global consequences. This design eliminates the need for complex coordination mechanisms and ensures that the agent can learn more effectively.
Reward shaping is another major challenge in multi-agent PPO. In such settings, four ambiguous cases often arise:
  • The agent’s action is good, and the global performance is good.
  • The agent’s action is bad, but the global performance is still good.
  • The agent’s action is good, but the global performance is poor.
  • The agent’s action is bad, and the global performance is poor.
While the first and fourth cases are relatively easy to handle, the second and third pose significant difficulties. A naive solution might involve computing the difference between local and global average waiting times, but this fails in scenarios where an agent must increase its own delay (e.g., by holding a red light longer) to benefit neighboring intersections. In such cases, the agent would be penalized despite contributing to an overall system improvement.
This problem is inherently avoided in a single-agent setup. Since the agent controls the entire environment, the reward signal can be directly tied to global performance metrics, such as total delay or average system throughput, making it much more interpretable and effective.
Finally, the simulation methodology itself plays a role. In multi-agent training, step-by-step simulations (e.g., at 1-second intervals) can provide better responsiveness and flexibility. However, they introduce other drawbacks: step-wise execution either requires centralized coordination, leading to disorganized simulation workflows, or distributed computation, which incurs significant infrastructure and financial costs. Training convergence is also often slower in such settings.
In contrast, a single-agent approach is not only computationally cheaper but also simpler to implement and more scalable for real-world deployments. Provides a clean, centralized policy that is easier to interpret, train, and deploy, especially in cost-sensitive applications. Therefore, for the city-wide traffic optimization scenario considered in this work, the single-agent PPO architecture emerges as a more practical and robust choice from both theoretical and implementation perspectives.

3.5.4. Observation Space and Reward Function

The observation space captures the state of the environment through several key metrics, computed per intersection:
  • The average waiting time at each traffic light.
  • The average vehicle count during each signal phase.
  • Intersection pressure is defined as the difference in the number of vehicles between major and minor incoming roads.
Pressure i = j M ( i ) v j k S ( i ) v k
The pressure is calculated as shown in Equation (1), where:
  • M ( i ) is the set of major incoming roads at intersection i,
  • S ( i ) is the set of secondary (minor) incoming roads at intersection i,
  • v j and v k represent the number of vehicles on roads j and k, respectively.
In addition to these local metrics, in the observations, two global indicators are also included:
  • The total accumulated vehicle waiting time across the simulation.
  • The average waiting time per vehicle for the entire simulation.
The reward function is designed to encourage a reduction in overall traffic congestion and is computed as shown in Equation (2), where:
  • W ¯ initial is the average vehicle wait time at the beginning of training,
  • W ¯ current is the average wait time during the current simulation episode.
Reward = W ¯ initial W ¯ current
This formulation encourages the agent to continuously minimize the average vehicle delay throughout the training.

3.6. Secure Communication and System Integrity

Security and data protection are foundational principles in the design of the proposed framework. All communication between RSUs and the cloud infrastructure is encrypted and authenticated using TLS certificates, ensuring the confidentiality and integrity of transmitted data.
The cloud architecture adopts a microservice-based design, where each service operates in isolation and communicates internally through a secure virtual network. Only the NGINX reverse proxy is exposed to the public internet, serving as the single entry point for all external requests. All other services are exclusively bound to the NGINX IP, minimizing the external attack surface. The web server is fully HTTPS-compliant, providing encrypted access to the system interface.
Importantly, the video data captured by the cameras is used solely for traffic analysis purposes. Personal identifiers such as license plates or facial features are not extracted, stored, or processed in any form. The only data derived from the video streams is the aggregate vehicle movement information required for route reconstruction and traffic flow modeling. This ensures full compliance with data minimization principles and privacy-by-design practices.
User registration data collected through the web interface (e.g., names, contact information) is managed entirely by the administrative entity responsible for the deployment in a specific region. The system itself does not process or retain any personal user data beyond what is necessary for authentication and authorization purposes.
Through this architecture, the system maintains a high level of security, data privacy, and operational integrity, aligning with current best practices in secure cloud computing and privacy-aware system design.

4. Results

This section presents the results obtained within the proposed framework. It is important to note that the results presented in this section are derived from simulation-based evaluations conducted using the SUMO traffic simulation environment. While the simulation scenarios are constructed using realistic city layouts obtained from OpenStreetMap and incorporate time-based traffic flow variations, the optimization framework has not yet been validated in a live deployment setting. However, to support partial validation of system components, the vehicle detection and counting module was prototyped and tested on the NVIDIA Jetson Nano platform using real-world CCTV footage under controlled laboratory conditions. This prototyping phase ensured the feasibility of real-time inference at the edge, as discussed in Section 3.2.1.

4.1. Testing Methodology

To evaluate the proposed algorithm, extensive simulations were carried out in the SUMO environment under two distinct scenarios. The hardware configuration on which test were run is based on Amd ryzen 5 4600h, with 16GB RAM memory, and GPU 1 Nvidia Geforce GRX 1650, GPU 2 AMD Radeon graphics integrated on CPU.
In the first scenario, for each city examined, a fixed set of 720 vehicles was randomly generated using SUMO’s built-in randomTrips.py module and simulated across 50 independent episodes. Each episode featured a unique vehicle distribution, resulting in a total of 36,000 vehicle trajectories (720 vehicles × 50 episodes). This configuration ensured consistent benchmarking conditions while providing statistically robust insights into the algorithm’s performance. Detailed results of this scenario are provided in Section 4.2.1.
In the second scenario, the vehicle count was dynamically adjusted to mirror real-world traffic congestion patterns observed across various urban settings. This method enabled the algorithm to be evaluated under more realistic and variable load conditions, capturing both peak and off-peak traffic volumes. By integrating both fixed-load and congestion-based scenarios, the evaluation provides a comprehensive assessment of the system’s performance, adaptability, and scalability across diverse traffic conditions. In this setup, vehicle counts during peak periods (around 08:00 A.M. and 05:00 P.M.) increased to nearly 7.000, while during other times they remained in the low hundreds. The results of this scenario are illustrated using histogram graphs that span a full 24-h period in Section 4.2.2.
The primary metric selected to quantify algorithm efficiency was the difference in total waiting time at traffic lights before and after applying our optimized control method. This metric directly reflects improvements in traffic flow and reduced congestion. The experimental evaluation was carried out across four cities with varying urban layouts and scales:
  • First, we tested the algorithm extensively in Bucharest, considering all city sectors due to the complexity and large number of traffic signals present, as well as the city’s well-known congestion challenges. The city was divided into its six administrative sectors, each treated as a separate simulation zone.
  • Additionally, three smaller cities, Tecuci, Focsani, and Galati, were included to demonstrate the algorithm’s general applicability across urban scenarios. For instance, Tecuci has only three traffic lights according to OSM, illustrating the algorithm’s adaptability irrespective of urban size or complexity.
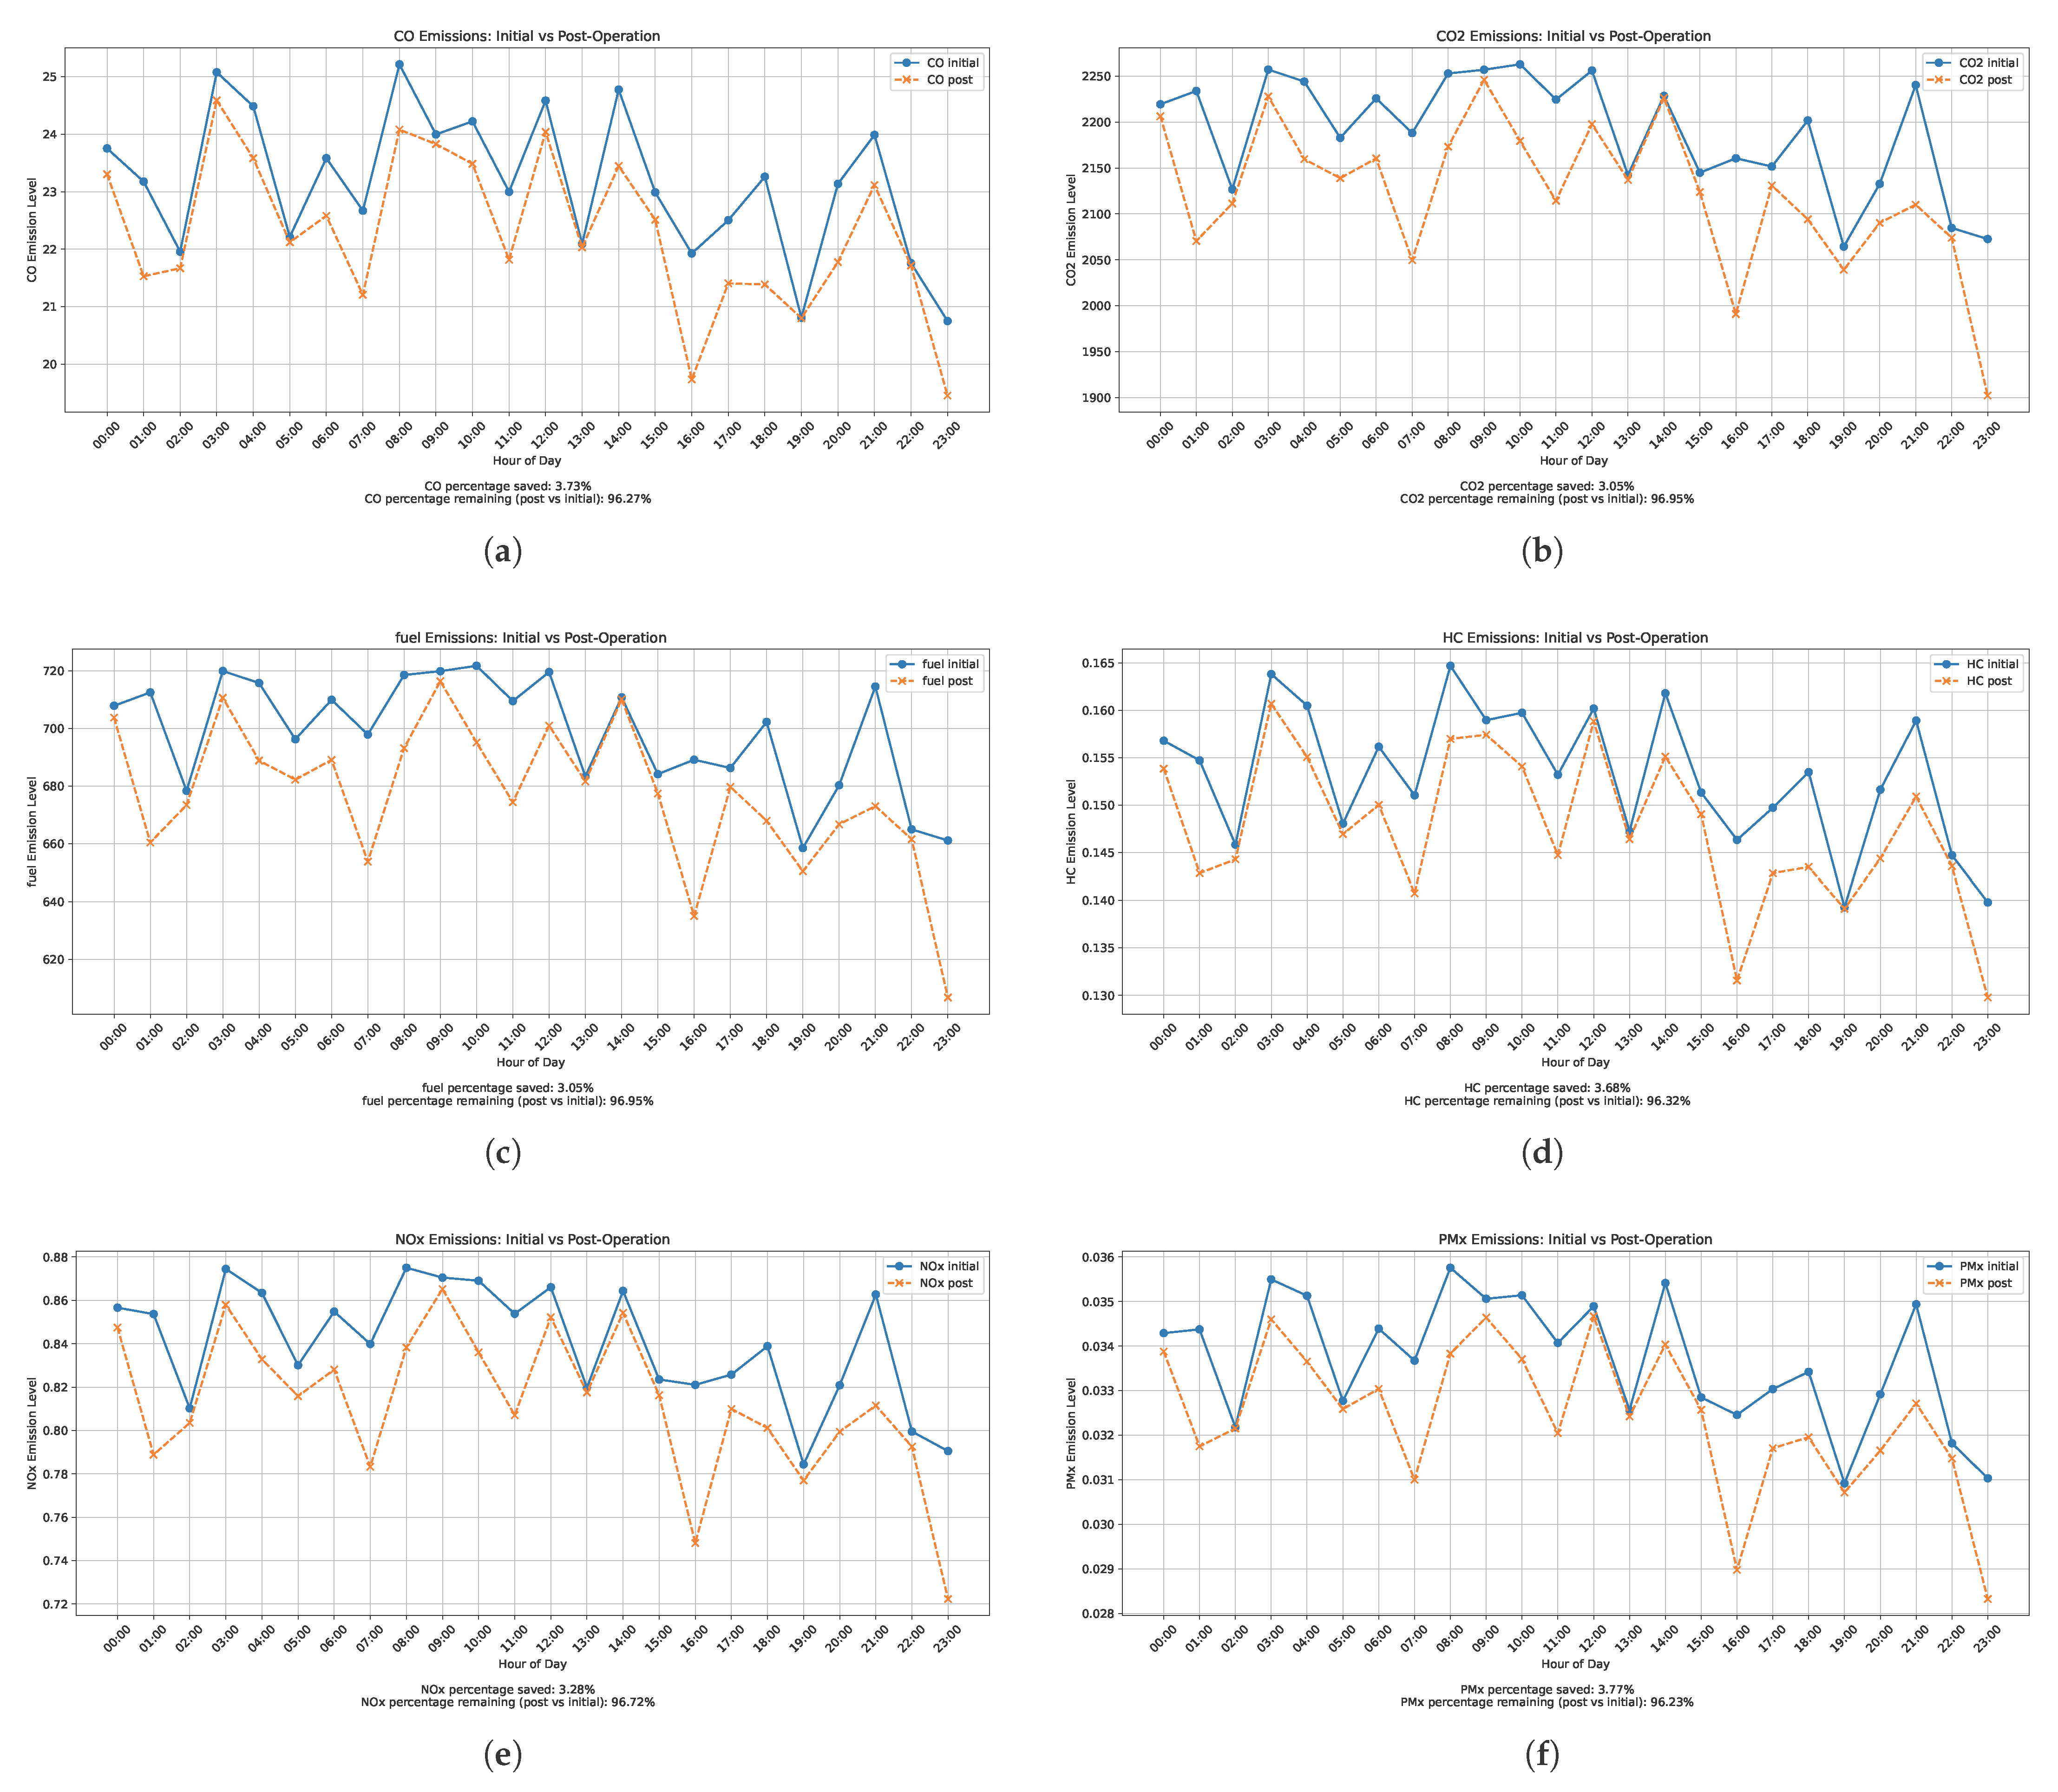
In addition to the traffic optimization experiments, we conducted an exploratory analysis of vehicular emissions to assess the environmental impact of the proposed traffic control algorithm. This analysis focused on six key pollutant categories, namely carbon monoxide (CO), carbon dioxide ( CO 2 ), hydrocarbons (HC), nitrogen oxides (NOx), particulate matter (PMx), and overall fuel consumption. For this purpose, we utilized the emission estimation capabilities provided by the SUMO simulation environment, which integrates the HBEFA emission model. The results of this emission analysis, detailed in Section 4.3, provide valuable insights into how traffic management strategies can contribute not only to reduced congestion and waiting times but also to lowering the environmental footprint of urban transport.

4.2. Impact on Waiting Time

4.2.1. Fixed Vehicle Load Scenario: Controlled Benchmarking with 720 Vehicles/Episode

In the baseline (“initial”) scenario, we simulate traffic using the original, unaltered signal timings provided by OpenStreetMap. These represent static fixed-time control without adaptation or real-time actuation. This serves as a consistent reference point for evaluating the improvements achieved by the PPO-based optimization.
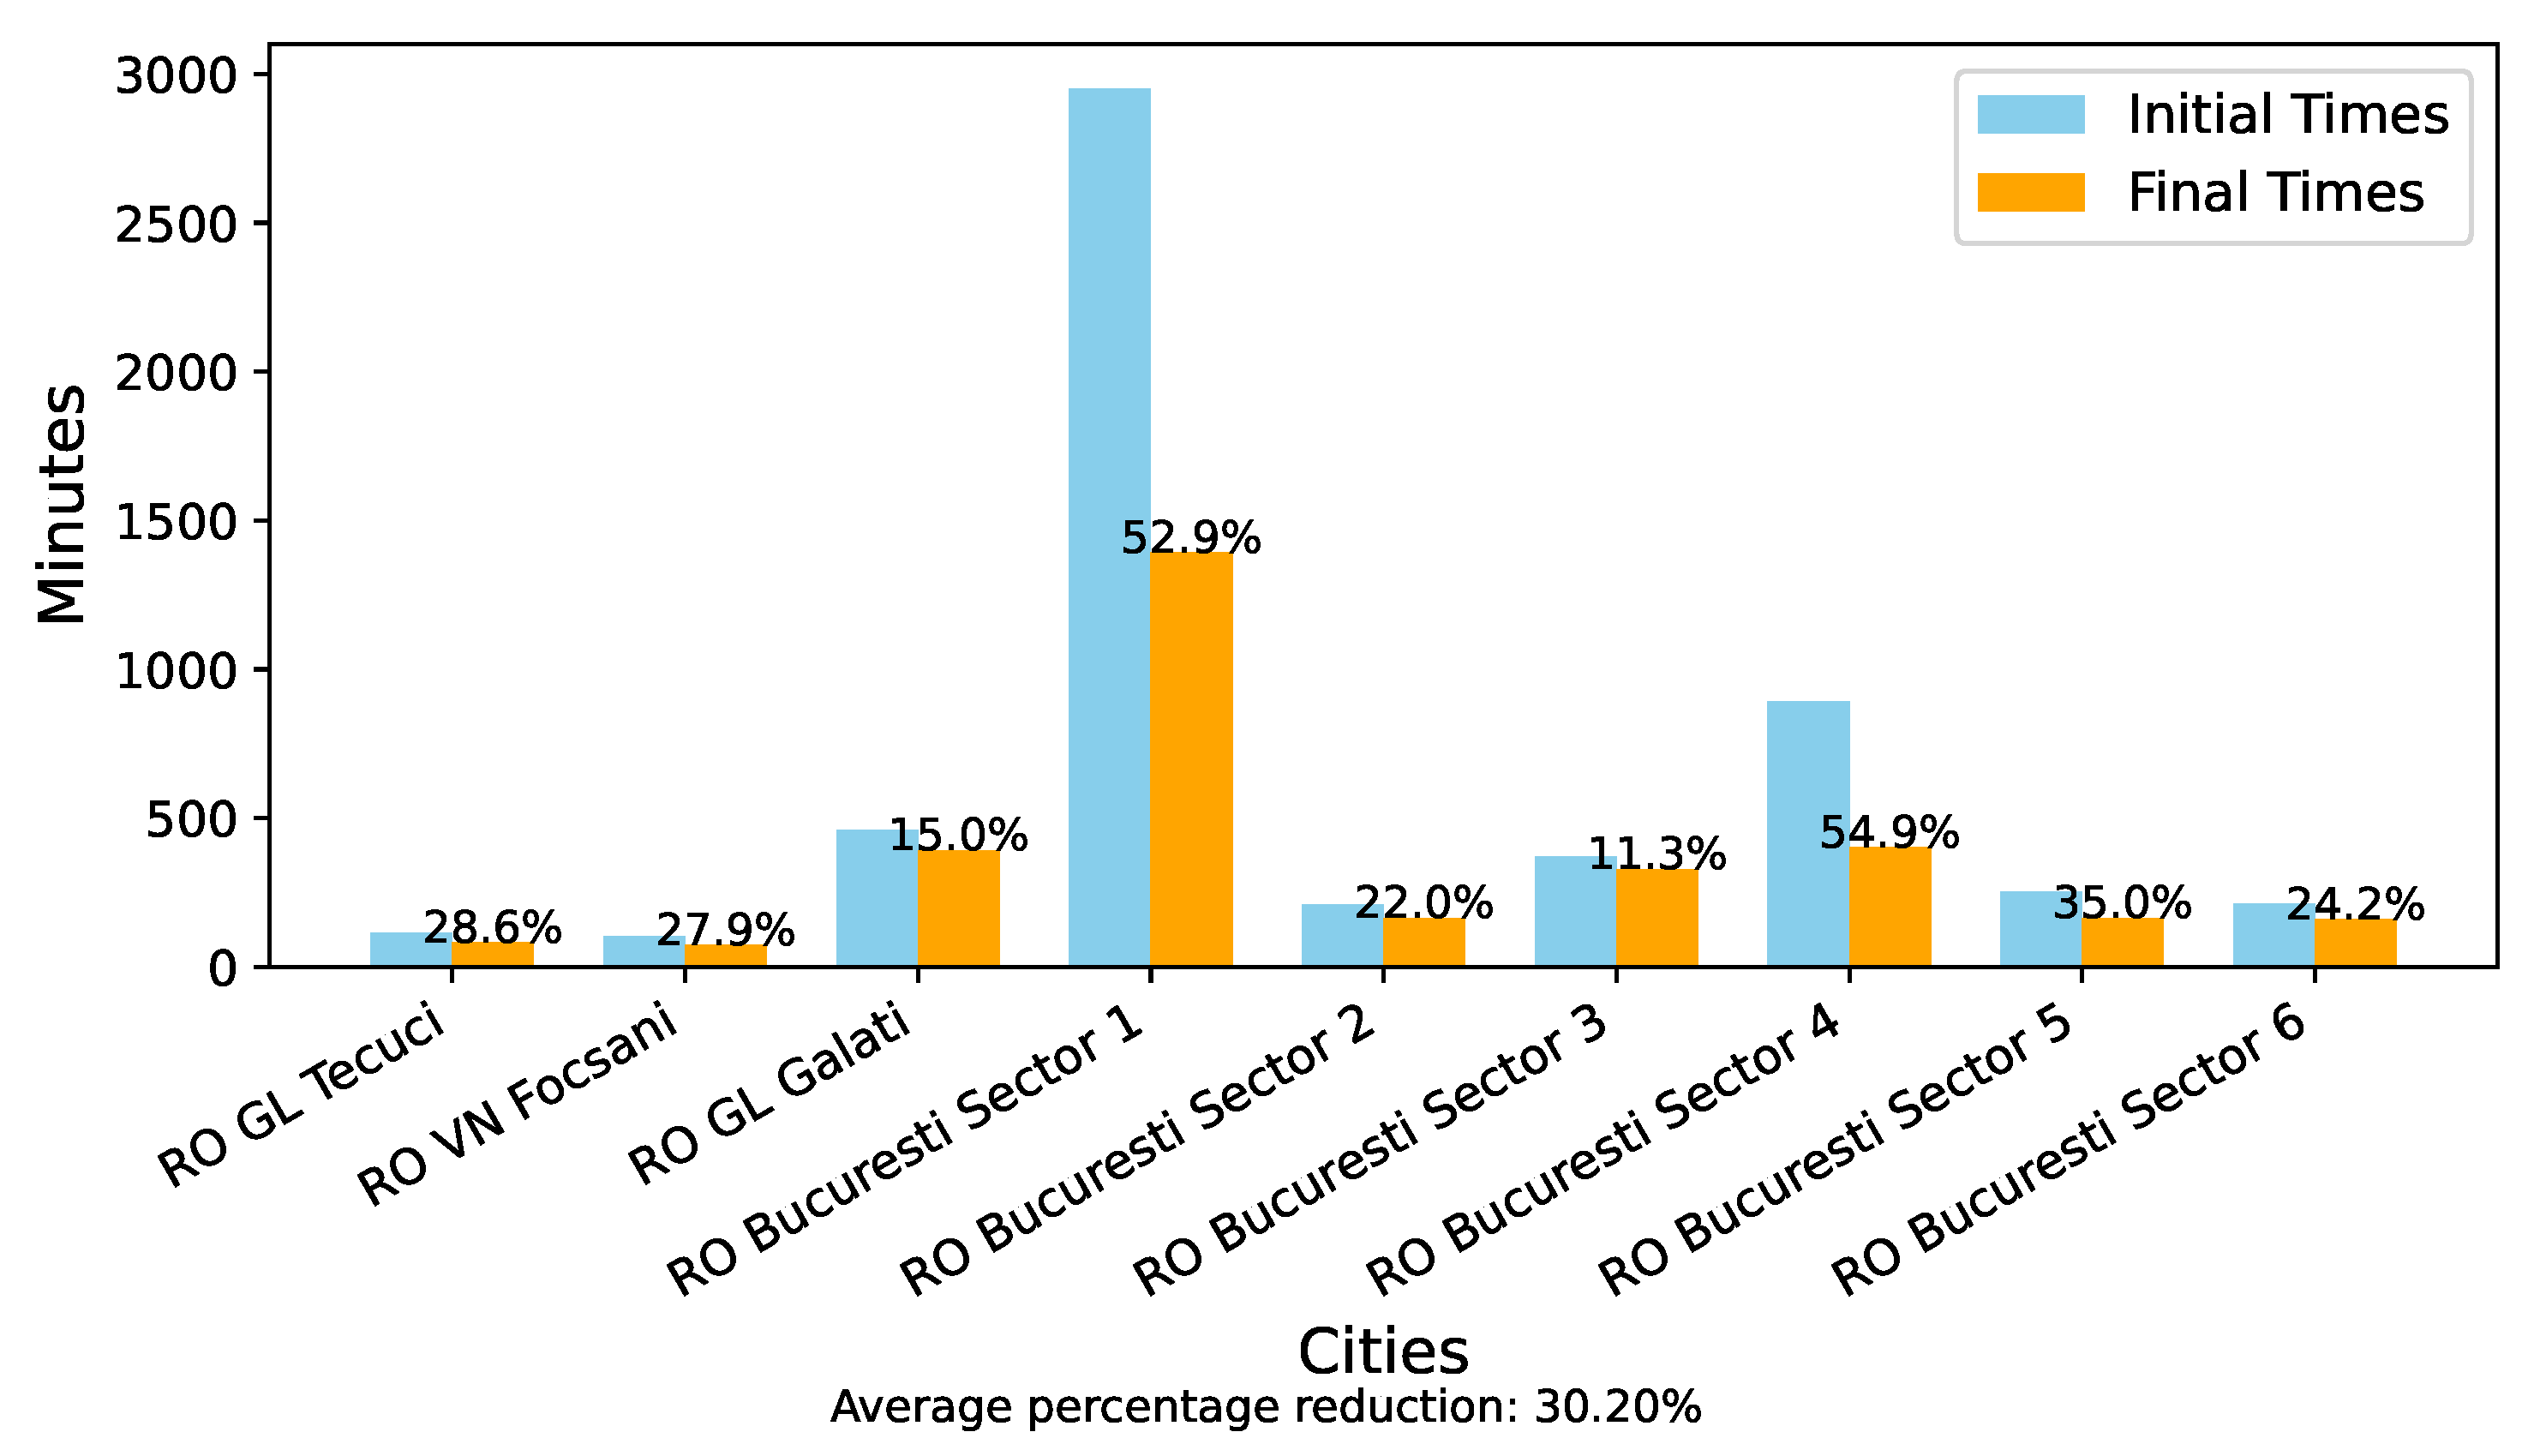
The results reported in the Figure 5 were obtained using a single route file composed of 720 randomly generated vehicles, repeated across 50 PPO training episodes. For the subsequent two figures, the same configuration of 50 episodes per run was used; however, in this case, 24 distinct route files were generated, each containing 720 vehicles, to better simulate variability and assess the algorithm’s performance under diverse traffic conditions.
Figure 5 graphically illustrates the improvements achieved by our proposed optimization algorithm. On the vertical axis, the total waiting time at traffic lights is represented, measured in minutes. Each city tested is indicated on the horizontal axis. For each city or sector, two distinct bars are displayed: a blue bar, representing the initial waiting times (before applying our algorithm), and an orange bar, representing the improved waiting times (after optimization). Each orange bar is accompanied by a percentage value on top, indicating the exact percentage of improvement relative to the initial scenario.
The comparative results shown in Figure 5 highlight several key trends regarding the effectiveness of the DeepSIGNAL-ITS optimization across different urban configurations. The largest reductions in overall vehicle waiting time were seen in Bucharest Sector 1 and Bucharest Sector 4, with improvements of 52.9% and 54.9%, respectively. These two sectors are among the most densely connected and congested parts of the capital Bucharest, characterized by numerous signalized intersections, complex traffic patterns, and high vehicle volumes. The significant improvements in these areas indicate that the PPO-based control strategy is particularly effective in high-complexity urban networks, where interdependencies between intersections provide greater scope for optimization through coordinated signal timing. In contrast, mid-sized cities such as Tecuci, Focșani, and Bucharest Sector 5 experienced moderate improvements, ranging from 27.9% to 35.0%. These areas typically have simpler road infrastructures and moderate traffic volumes, which limit the scope for significant dynamic adjustments, although they still benefit from adaptive control. The lowest improvements were recorded in Galați and Bucharest Sector 3, with reductions of 15.0% and 11.3%, respectively. Galati city’s network includes several roundabouts and non-signalized intersections, reducing the effectiveness of signal timing strategies. Similarly, Sector 3 has a higher proportion of residential and park areas, with lower peak-hour traffic volumes and less intense congestion, thereby lowering the impact of signal phase optimization. Despite these variations, all locations showed measurable performance improvements, leading to an average reduction of 30.20% in total vehicle waiting time across the assessed scenarios. These findings highlight both the robustness and flexibility of the DeepSIGNAL-ITS framework. Furthermore, they indicate that while the system consistently delivers benefits across different urban typologies, its advantages are most significant in dense, high-volume traffic networks where intelligent signal management can substantially reduce congestion.
Additionally, the average percentage improvement across all tested cities is highlighted below the graph, providing an overall indicator of the algorithm’s effectiveness.
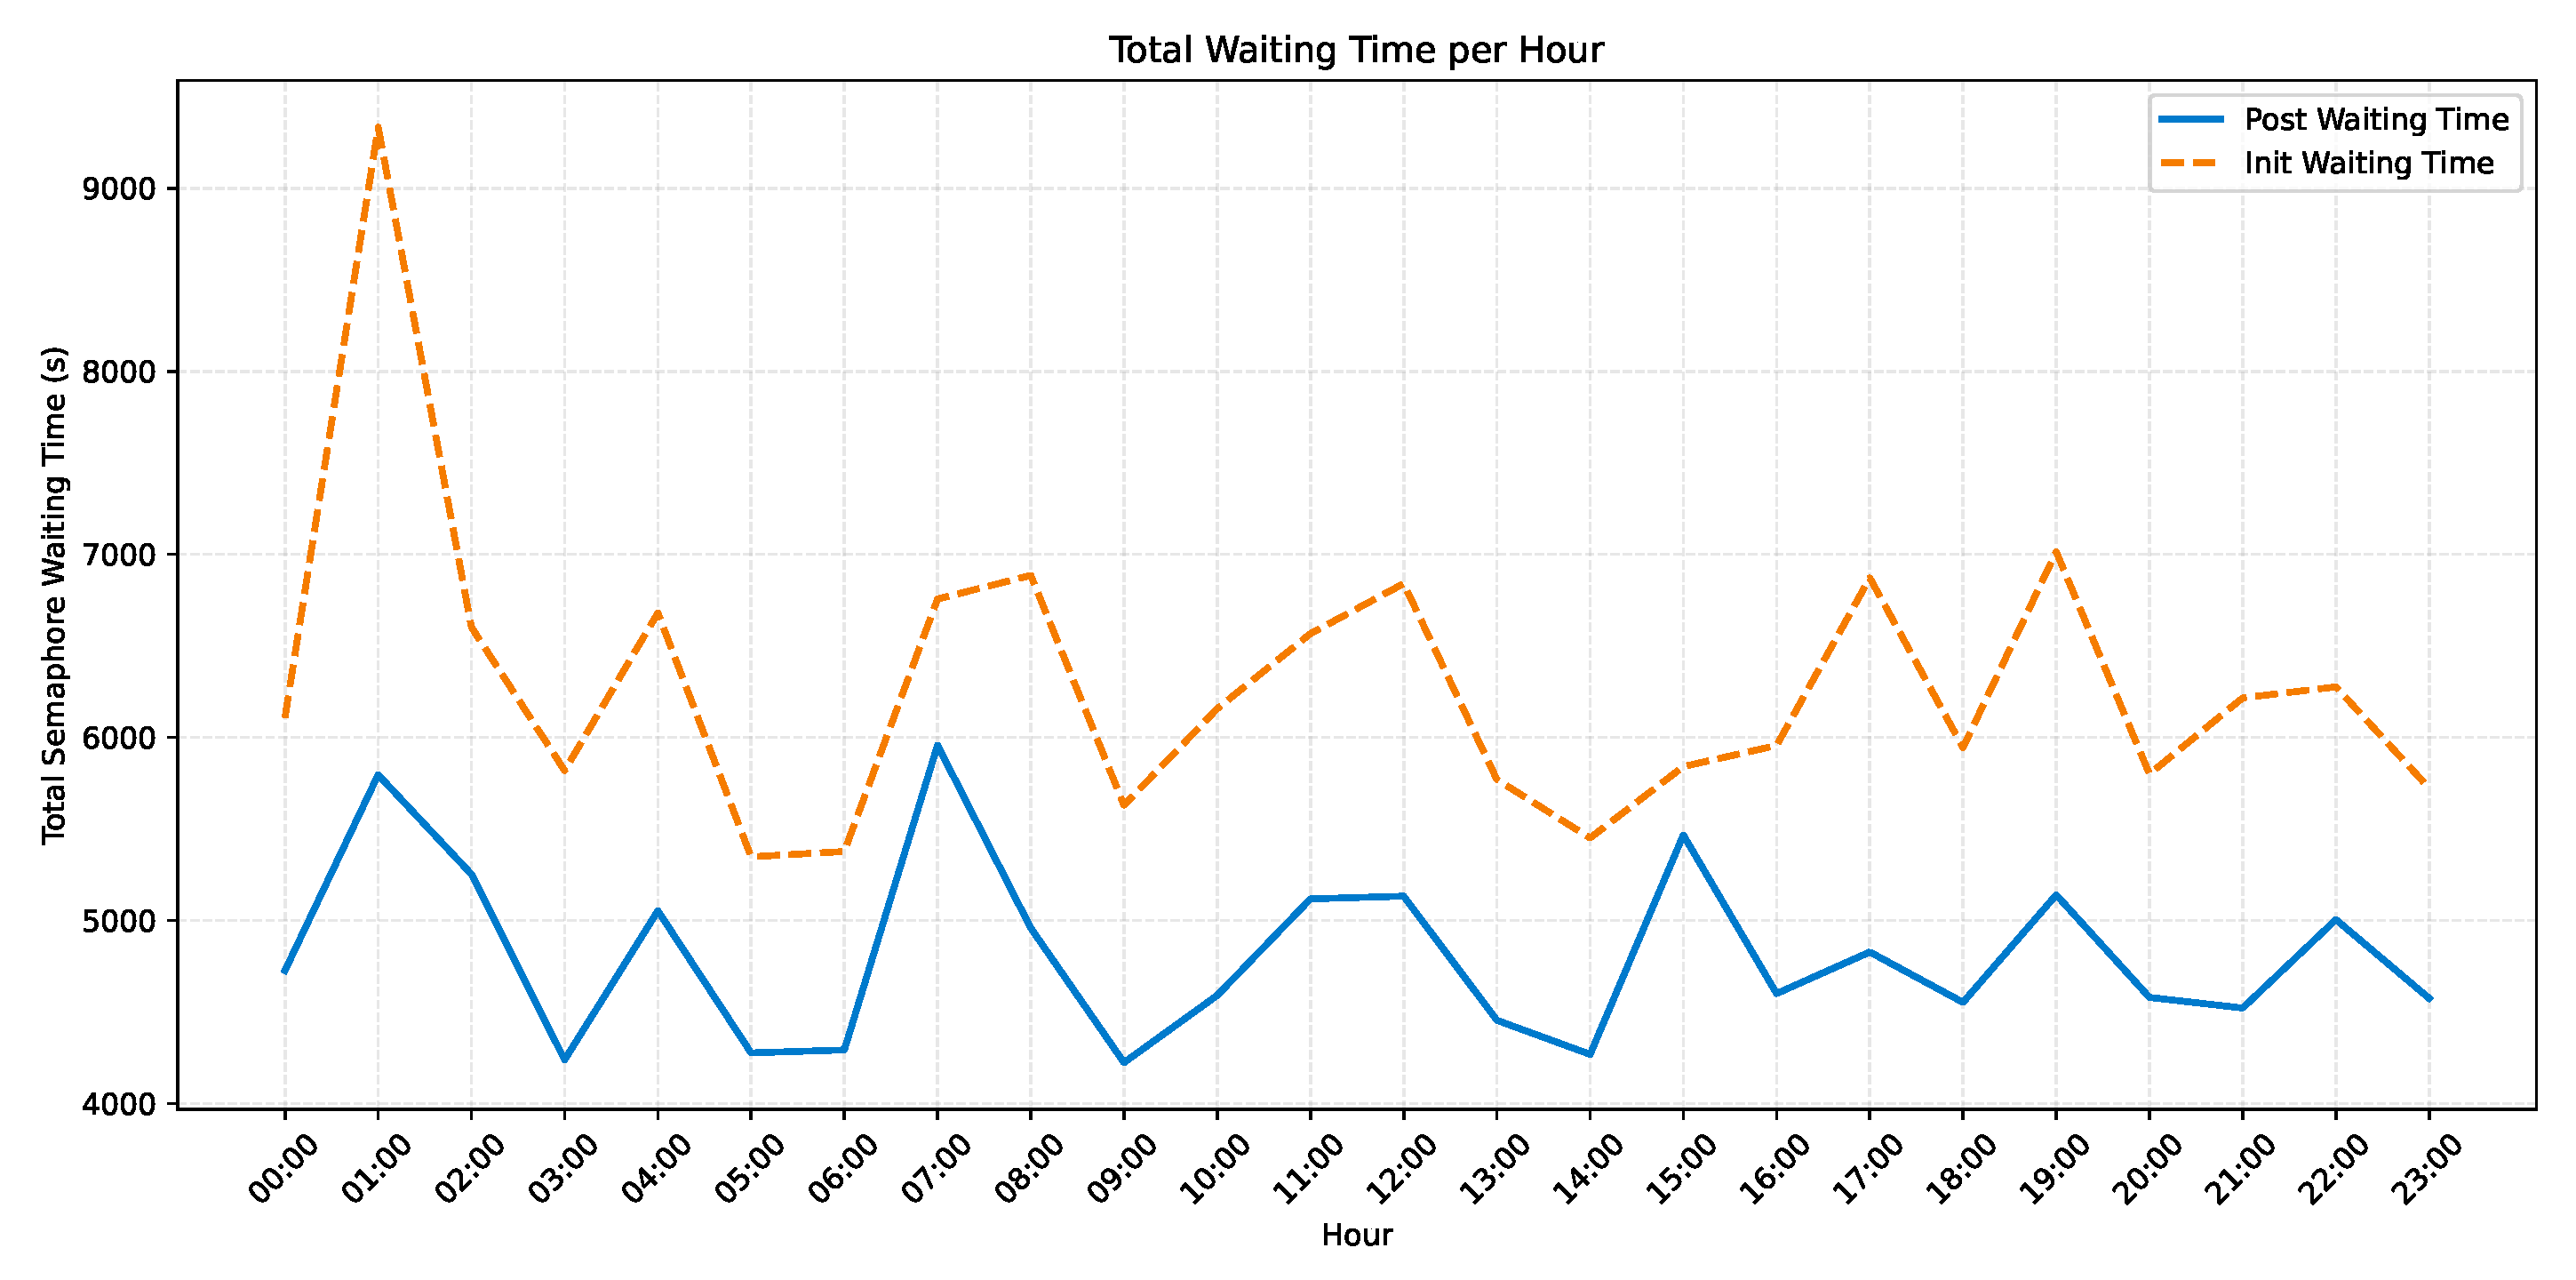
The Figure 6 illustrates the total waiting time at the traffic lights, measured per hour in a full 24-h simulation cycle. The x-axis represents each hour of the day (from 00:00 to 23:00), while the y-axis indicates the cumulative waiting time in seconds, summed across all signalized intersections.
Two curves are plotted for comparison:
  • The Init Waiting Time curve reflects the baseline scenario, before applying any reinforcement learning optimization.
  • The Post Waiting Time curve shows the waiting time after applying the PPO-based signal control adjustments.
Figure 6 shows how total vehicle waiting times at signalized intersections change over 24 h, comparing baseline (fixed-time) control with the PPO-optimized strategy. The PPO-based control consistently exceeds the performance of the baseline at all times, demonstrating both robustness and flexibility to daily traffic flow changes. The biggest differences between the two lines are evident during early morning hours (01:00–03:00) and evening hours (18:00–21:00), when fixed-time planning may struggle to keep up with shifting traffic volumes, resulting in notable inefficiencies. On the other hand, the PPO agent quickly adjusts to demand fluctuations, resulting in decreased waiting times during both low-traffic (e.g., 03:00–06:00) and more variable periods (e.g., 07:00–09:00 and 15:00–20:00). The close alignment of the PPO curve with the lower limit of cumulative waiting time throughout the day indicates that the agent effectively learns across different hourly patterns without overfitting to specific peak times. These findings highlight the method’s potential for real-world use in environments subject to strong temporal traffic demand shifts.
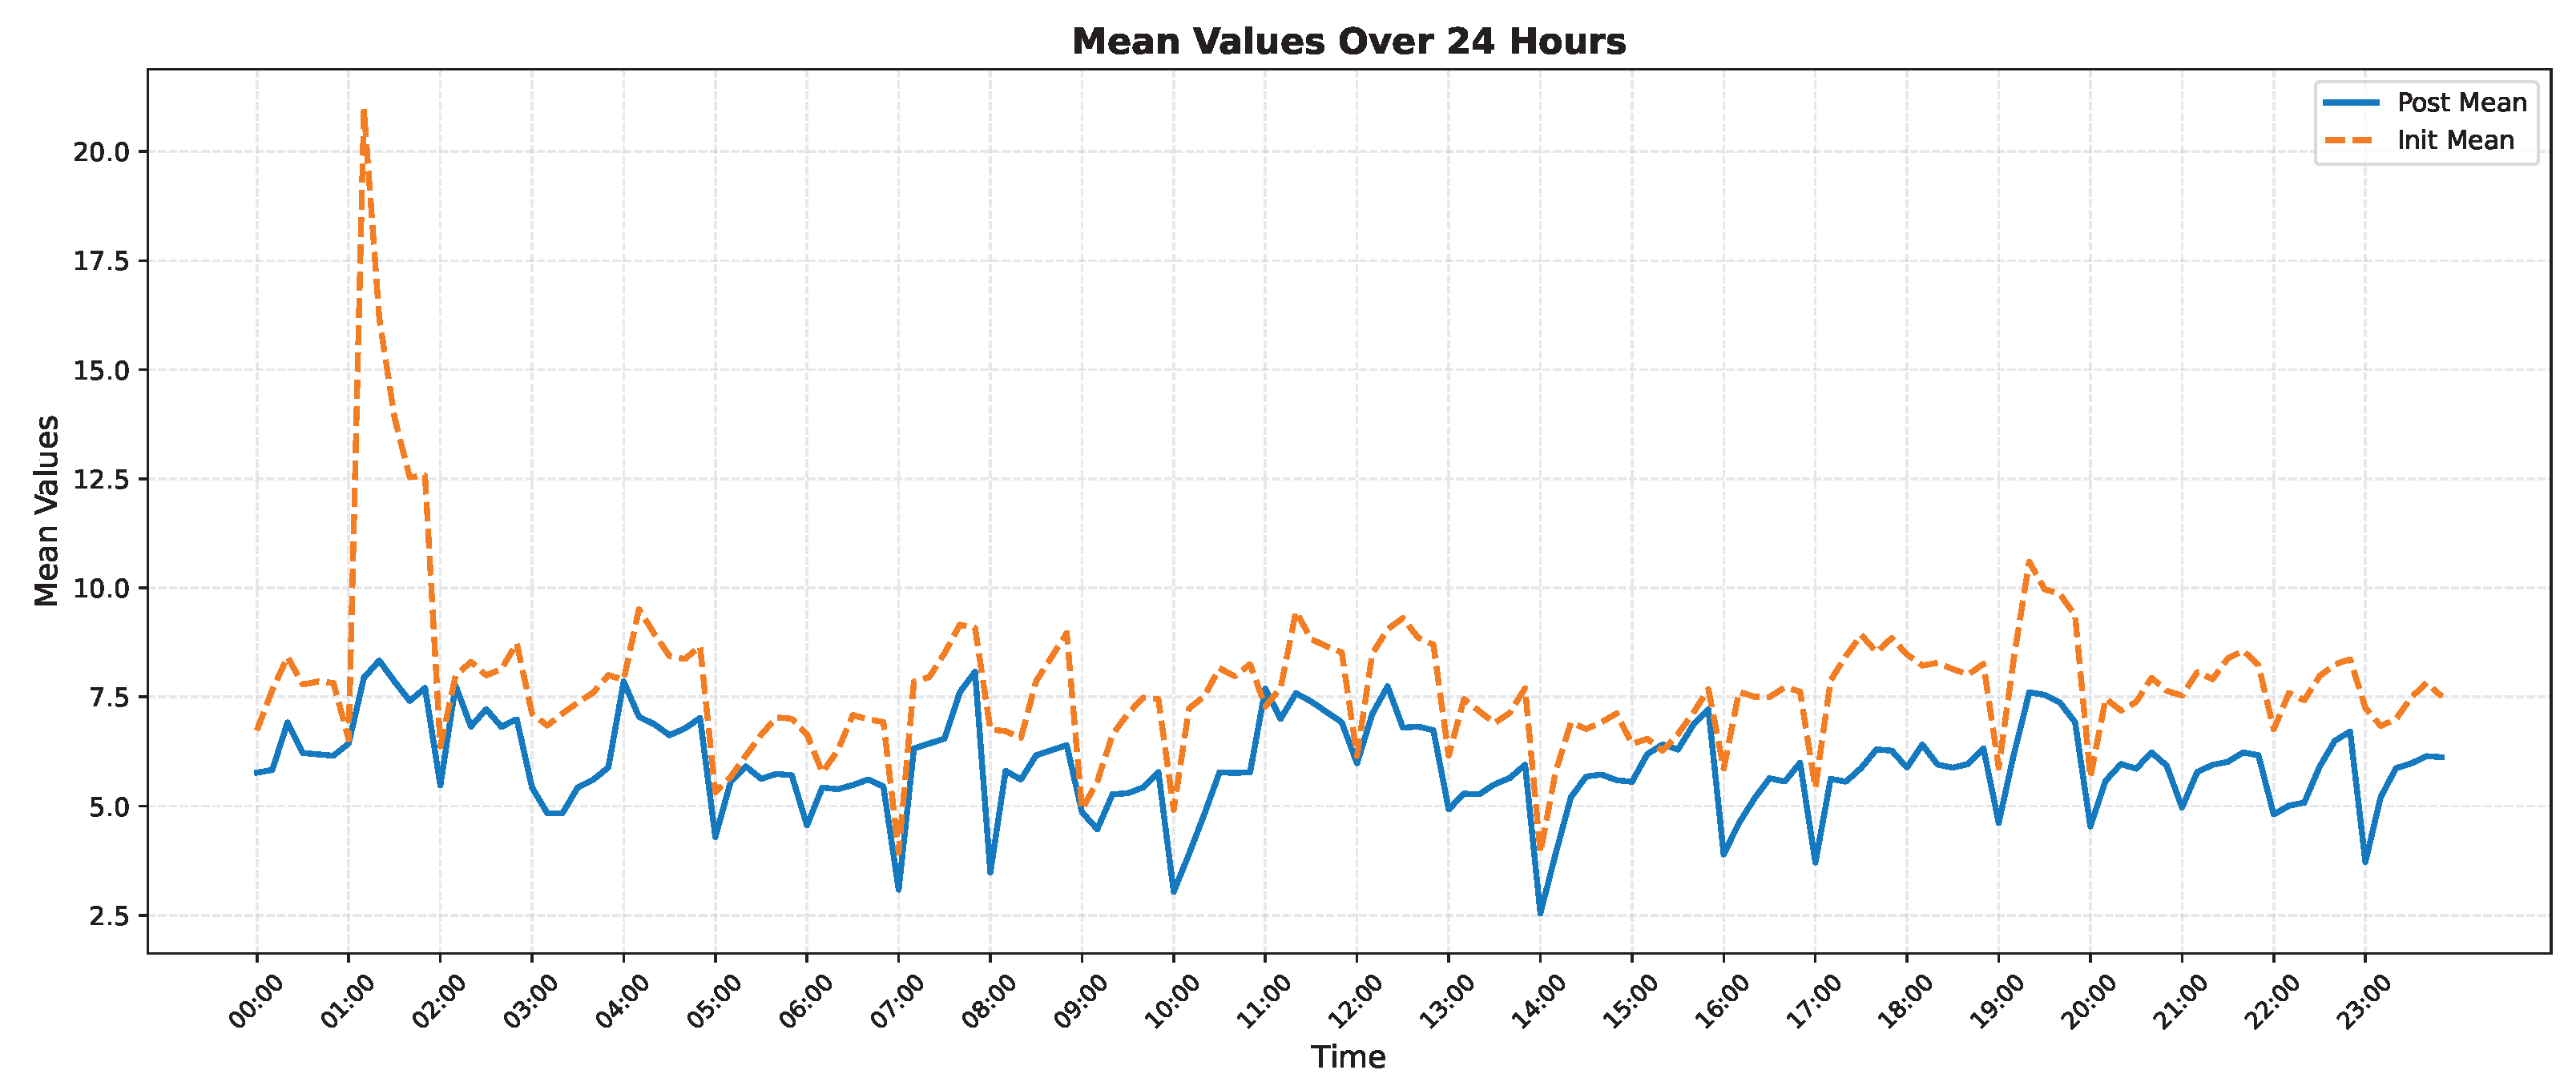
Figure 7 provides a detailed analysis of average vehicle waiting times per 10-min interval, which proves the micro-scale efficiency of the PPO-based traffic signal control strategy. From the perspective of traffic flow, average waiting time can be directly linked to queueing delay and phase service efficiency at intersections. The PPO-based controller (Post Mean) is generally better than the fixed-time baseline (Init Mean), indicating more efficient phase utilization and shorter queue lengths, which are important indicators of Level of Service (LOS) in traffic engineering.
The optimization has a greater impact during off-peak periods (e.g., 00:00–02:00), where fixed-time control results in high average waiting times due to mismatches between green time allocation and actual traffic demand, a known inefficiency in undersaturated conditions. The RL-based controller addresses this by reallocating green time dynamically, aligning with demand-responsive signal control principles. While total delay reflects system-wide performance, mean delay highlights the experience of individual vehicles. The PPO strategy reduces overall delay, as shown in Figure 6, and additionally stabilizes average waiting times, with noticeably fewer spikes and troughs, as shown in Figure 7. This suggests that the PPO agent provides greater temporal fairness and predictability, reducing performance variability over time, which is a desirable trait in stochastic and time-variant traffic systems.
Furthermore, the decreased variance in the Post Mean curve indicates enhanced system stability, which is important for real-world signal control where unexpected peaks can trigger congestion ripple effects. This behaviour aligns with the theory of shockwave propagation, where stable outflow from intersections reduces upstream disturbances.
The effectiveness of the DeepSIGNAL-ITS framework varies across urban environments, as shown in the city-level results in Figure 5 and the temporal performance in Figure 6 and Figure 7. These variations can be achieved due to multiple interconnected factors, such as the number and configuration of signalized intersections, traffic density, road network topology, and temporal flow characteristics.
In high-density sectors such as Bucharest Sector 1 and Bucharest Sector 4, where multiple arterial and collector roads converge, the PPO optimization achieves important reductions in waiting time (52.9% and 54.9%, respectively). These areas typically present complex intersection geometries, frequent signal phases, and high vehicular flow variability, conditions under which fixed-time controllers struggle to adapt, while reinforcement learning agents can continuously refine strategies through feedback. On the other hand, cities such as Galați and Bucharest Sector 3, which present less congestion, simpler signal structures, or fewer intersections under control, show more modest improvements (15% and 11.3%). In these contexts, the baseline inefficiency is lower to begin with, offering reduced opportunity for optimization gains.
Temporal dynamics, as illustrated in Figure 6 and Figure 7 for city Tecuci, further emphasize the adaptability of DeepSIGNAL-ITS. The largest absolute reductions in total waiting time occur during transitional periods, meaning early morning (01:00–03:00) and evening (18:00–21:00), when traffic volume deviates sharply from static expectations. During these hours, fixed-time signals maintain rigid phase sequences, leading to under-allocation or over-allocation of green time. The RL-based agent, on the other hand, adapts in real-time to density inputs, helping to reduce peak inefficiencies. This is shown by the post-optimization curve (blue) moving closer to a stable temporal profile in both cumulative and average waiting times.
From a broader systems engineering perspective, these results align with the principles outlined in the European Commission’s ECoMobility framework [78] and the recommendations of ISO/TS37444:2023 [79], which emphasize the integration of dynamic control in traffic signal operations. The variation in results across cities also supports traffic theories that advocate adaptive strategies in environments with heterogeneous flow patterns and high signal coordination potential, as discussed in European-level evaluations of ITS. Therefore, the algorithm’s learning-based design makes it particularly well-suited for urban regions with a combination of high spatial signal density and volatile temporal demand, environments that traditional fixed-time and even actuated control systems fail to manage efficiently.

4.2.2. Dynamic Vehicle Load Scenario: Congestion-Based Simulation

Since SUMO does not inherently model traffic flow variations across different times of day, we explicitly configured each simulation episode with varying traffic intensities to capture realistic daily traffic dynamics. Specifically, each episode was assigned a unique traffic volume profile representing a range of traffic load scenarios, from low (off-peak) to high (rush hour) congestion. This variation was implemented by adjusting the number and distribution of vehicles generated per episode using randomTrips.py, thereby reflecting realistic temporal traffic patterns observed in the studied urban areas. Consequently, although SUMO does not differentiate between time periods, our simulation setup emulated fluctuations in traffic intensity throughout a typical day. We selected two urban contexts for testing: Bucharest Sector 1, where previous analyses indicated a notable reduction in waiting times, and Tecuci, a smaller city, to explore scalability across different urban scales.
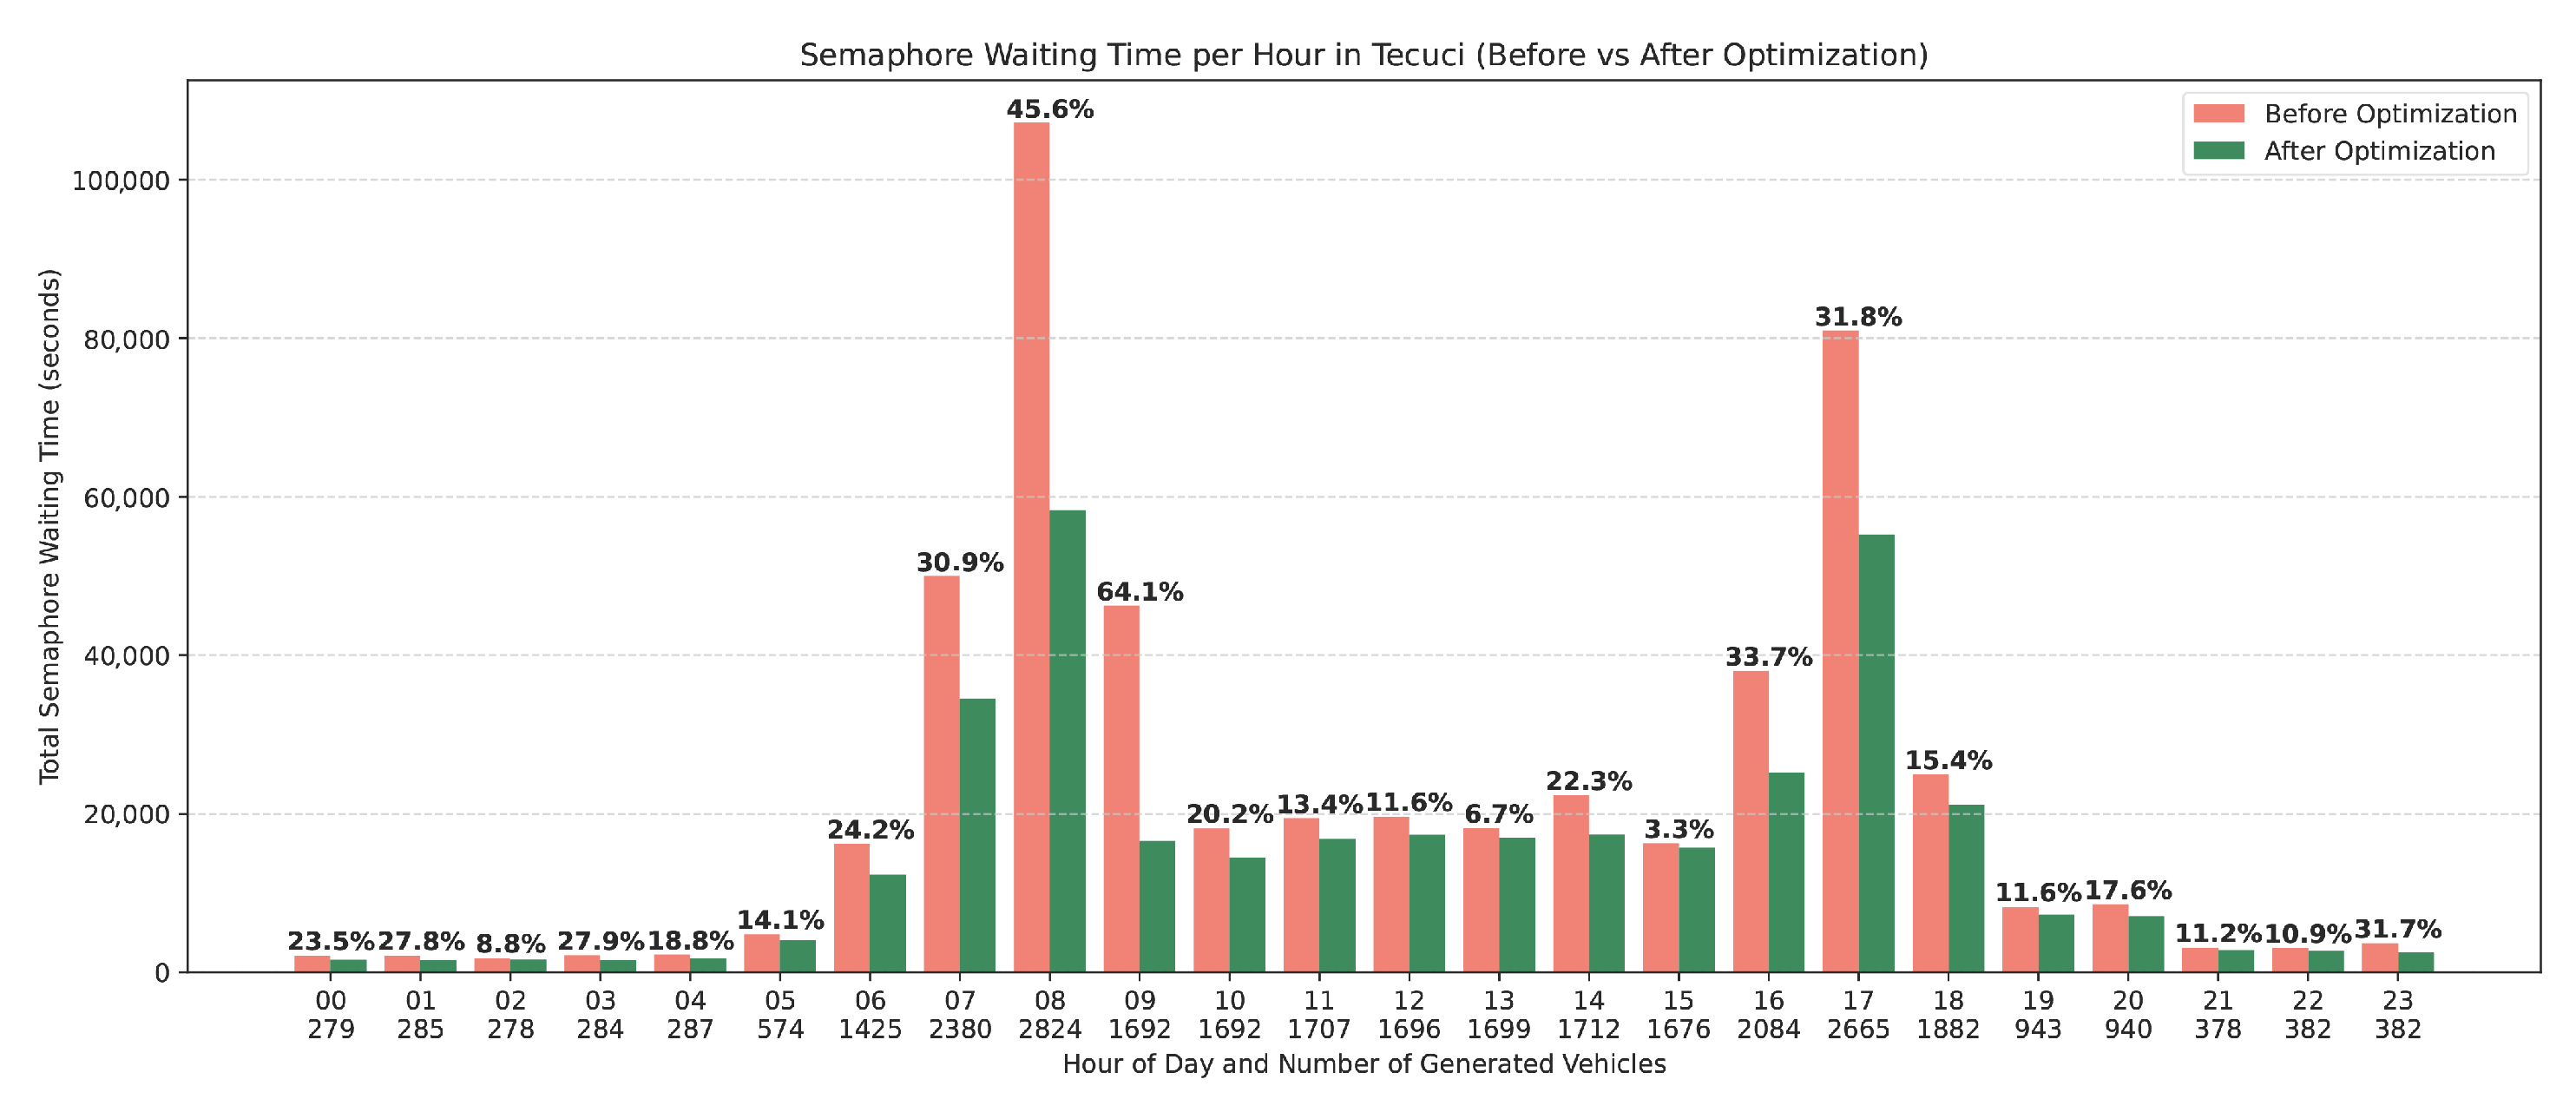
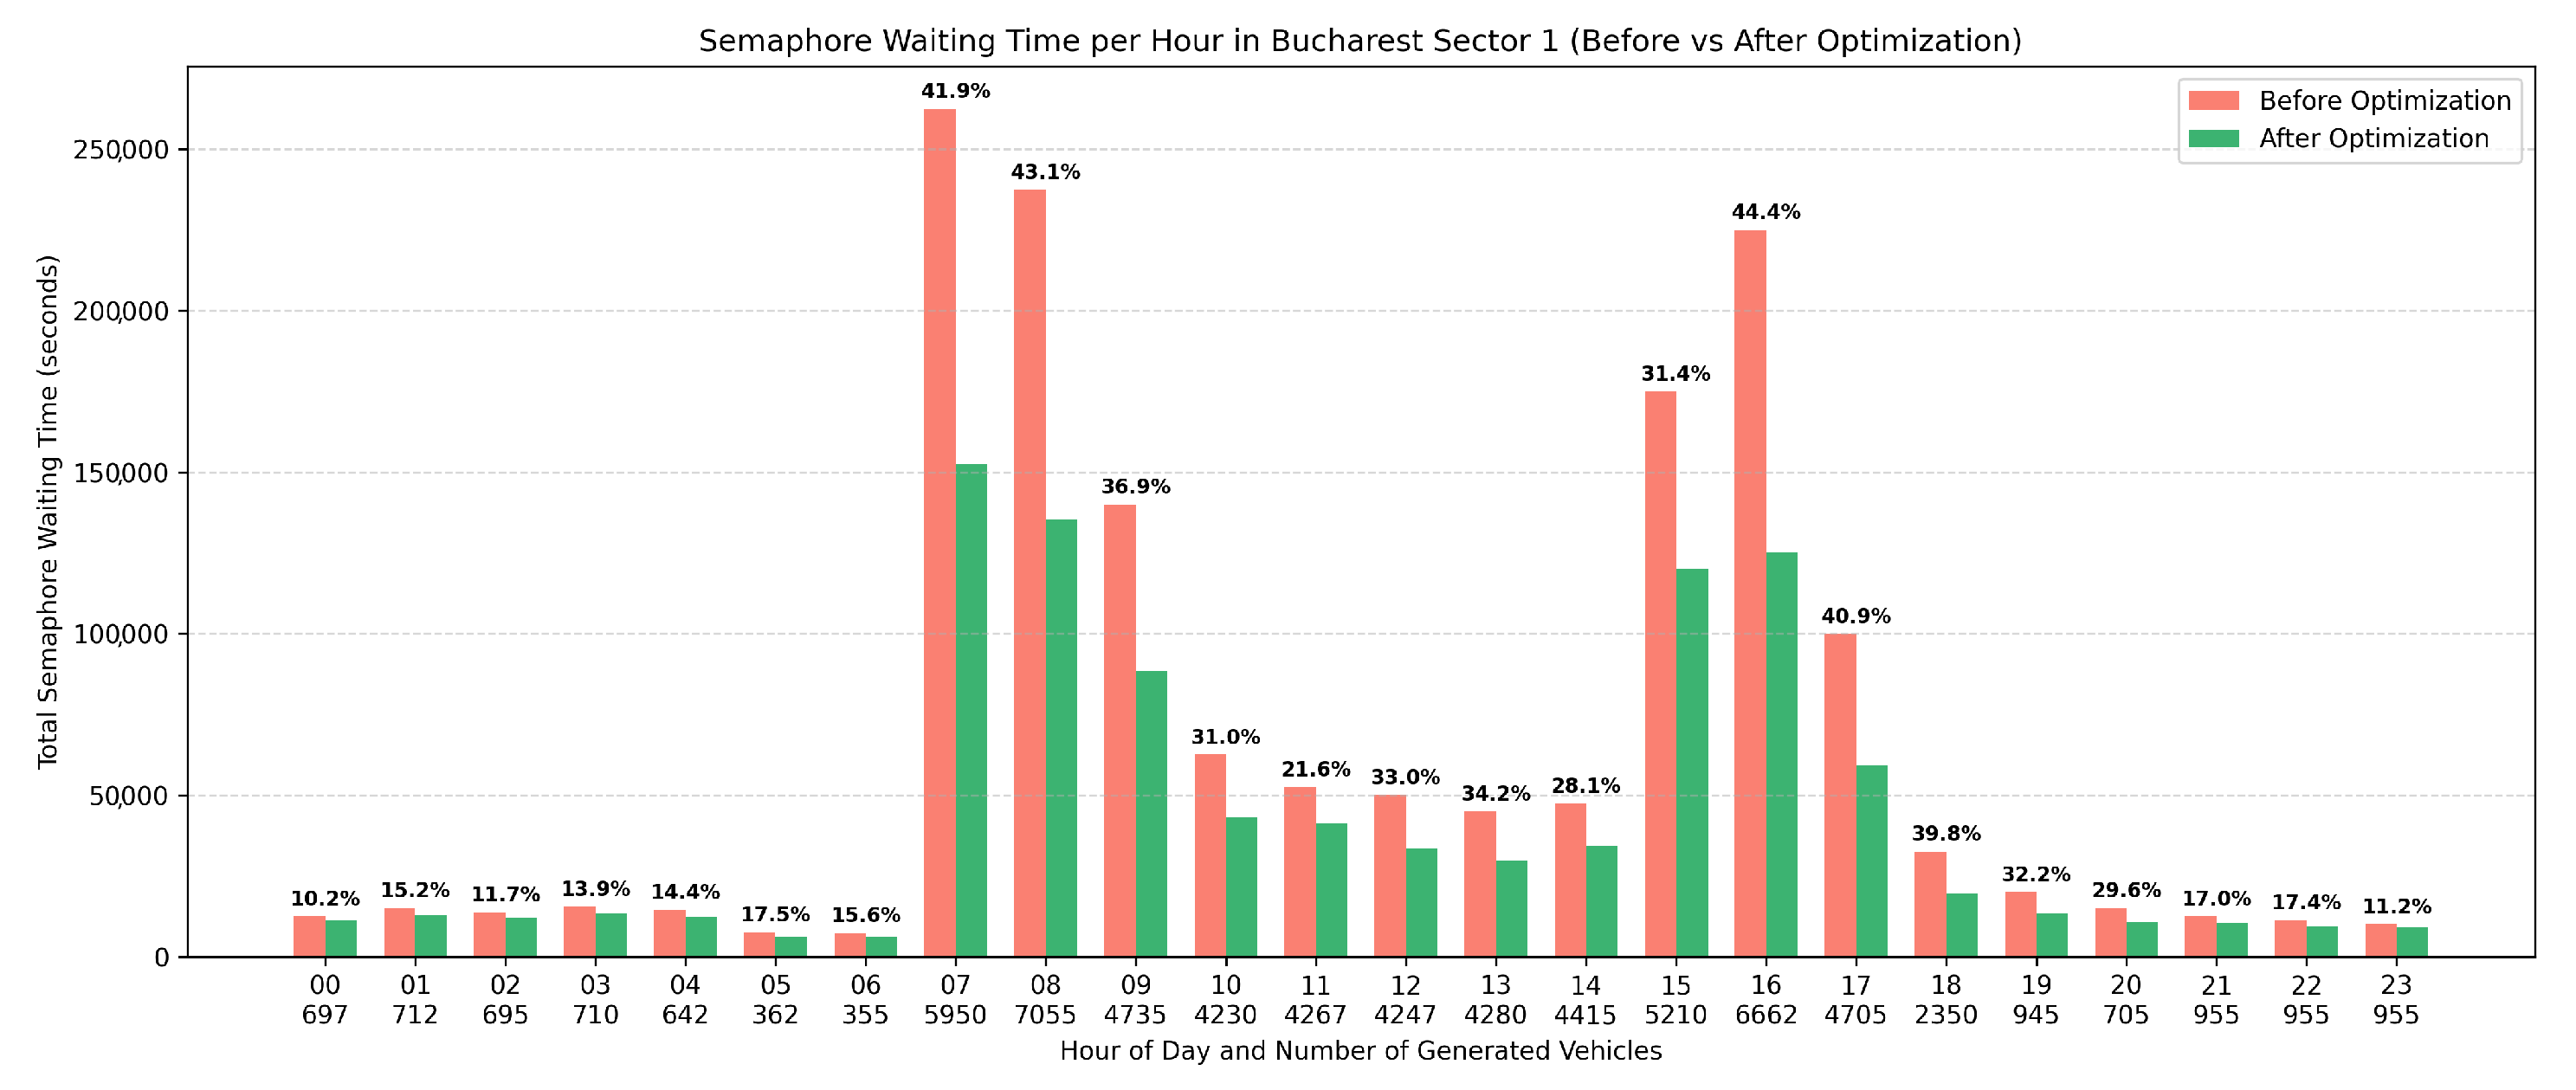
Figure 8 and Figure 9 provide a comparative analysis of total semaphore (traffic light) waiting times in Tecuci and Bucharest Sector 1, recorded hourly over a 24-h period. In each graph, the red bars indicate cumulative waiting times before optimization using fixed-time signal plans, while the green bars show the results following the application of the PPO-based optimization strategy. The percentage reduction in waiting time for each hour is annotated above the bars, and the number displayed below each group represents the total number of vehicles simulated during that time interval.
The results clearly indicate that the PPO-based adaptive traffic control system significantly reduces semaphore waiting times during peak hours. Notably, at 08:00, the waiting time was reduced by 45.6% in Tecuci and 41.9% in Bucharest Sector 1, while at 17:00, reductions of 31.8% and 40.9% were achieved, respectively. These time slots align with typical rush hour periods, characterized by high traffic volumes, 2824 vehicles in Tecuci and 5950 in Bucharest Sector 1 at 08:00, and 2665 and 4705 at 17:00. Moreover, as shown in Figure 8, the most significant improvement in Tecuci occurred at 09:00, with a 64.1% reduction, highlighting the model’s capacity to effectively manage lingering congestion following peak inflows. In contrast, during low-traffic periods (e.g., 01:00–04:00 or 21:00–22:00), the differences between pre-optimization and post-optimization waiting times are less pronounced. In some cases, the reductions are modest (around 8–10%) or show near parity between strategies. This indicates that during off-peak hours, the baseline signal plans are already relatively efficient due to low congestion, and adaptive control offers limited marginal benefit. On the other hand, as shown in Figure 9 in Bucharest Sector 1, the most substantial reductions in semaphore waiting time occur during peak hours—specifically between 07:00 and 17:00, where improvements consistently exceed 30%, reaching up to 44.4% at 15:00 and 43.1% at 08:00. Similarly to Tecuci city, these periods also correspond to the highest traffic volumes, emphasizing the PPO agent’s effectiveness in managing complex, high-density scenarios. The PPO-based control dynamically reallocates green time based on real-time traffic demand, leading to more efficient phase transitions and significantly reduced cumulative delays. This targeted responsiveness demonstrates the framework’s capability to optimize signal timings under variable congestion levels, particularly where traditional fixed-time strategies fail to adapt.
Overall, the results support the conclusion that the PPO-based agent excels in dynamically adjusting to varying traffic volumes throughout the day, yielding the most substantial benefits during congested periods. These gains are particularly relevant for smaller urban areas like Tecuci, where efficient traffic light scheduling can notably improve both mobility and local air quality.

4.3. Impact on Environment

Throughout the implementation process, several measurements were also conducted to assess the environmental impact of the proposed algorithm. While it may seem intuitive that reduced waiting times lead to lower vehicle emissions, this assumption can be misleading. A faster traffic flow characterized by frequent stops and accelerations may in fact generate higher emissions.
To accurately assess environmental impacts, a testing methodology aligned with previous performance evaluations was adopted. A selected urban testbed, care, served as the simulation environment. Using SUMO’s randomTrips.py module, 24 distinct traffic route files were generated to represent varied traffic patterns. SUMO offers built-in support for the Handbook Emission Factors for Road Transport (HBEFA) [80], a widely recognized emission model developed through international collaboration. HBEFA offers standardized emission factors for both regulated and major non-regulated pollutants, along with metrics for fuel and energy consumption, including CO 2 . It is widely used in research, policy-making, and environmental planning due to its ability to generate detailed, context-specific estimates based on vehicle type, speed, and traffic conditions. In SUMO, integration with HBEFA is primarily achieved through the specification of emissionClasses and detailed vehicle type definitions. Prior to applying the optimization algorithm, baseline values were recorded for the following emission categories: carbon CO, CO 2 , HC, fuel consumption, PM, and NOx. The emission measurement process involved aggregating the total emissions produced by each vehicle over the entire simulation period to calculate overall values for each pollutant category. The optimization algorithm was then executed under identical conditions, with emissions re-evaluated based on the adjusted traffic signal timings.
Figure 10 shows strong evidence of environmental benefits from using PPO-based adaptive traffic signal optimization in city Bucharest Sector 1. The steady decline in all pollutant types after optimization suggests a widespread enhancement in traffic flow efficiency. Notably, CO emissions (Figure 10a) dropped by 3.73%, especially during mid-day and evening hours, a time usually marked by congestion from higher urban mobility. CO 2 emissions (Figure 10b), an important measure of greenhouse gases, fell by 3.05%, indicating more consistent driving patterns and fewer sudden stops or idling.
Fuel consumption (Figure 10c) dropped by 3.05%, reflecting the expected decrease due to less stop-and-go traffic. The HC emissions (Figure 10d) decreased by 3.68%, indicating a reduction in unburned hydrocarbons from engine idling and inefficient combustion at intersections. NOx emissions (Figure 10e) fell by 3.28%, aligned with lower acceleration and reduced engine load, which are vital for improving urban air quality. PMx emissions (Figure 10f) decreased by 3.77%, showing that smoother vehicle operation reduces tire and brake wear and limits road dust, leading to cleaner city air.
While these reductions are moderate in absolute numbers, they hold significant environmental value when applied across entire cities and maintained over time. Additionally, the trends support the aims outlined in the ECoMobility Alliance Framework and the CEN Technical Specification TS 17444:2020, which focus on implementing ITS to minimize environmental impact via adaptive traffic control and eco-friendly urban mobility options.

5. Conclusions

Based on the performance metrics and experimental results presented throughout this work, several key conclusions can be drawn. First and foremost, the integration of reinforcement learning into urban traffic control, specifically through the use of the PPO algorithm, has demonstrated clear and consistent improvements in traffic flow efficiency. The experimental results show notable enhancements in urban traffic management performance. On average, the PPO-based controller reduced vehicle waiting times at signalized intersections by 30.20% compared to baseline fixed-time settings from OpenStreetMap. These improvements were steady across various urban layouts, highlighting the system’s flexibility in handling different intersection densities and traffic patterns.
Beyond mobility improvements, the system exhibits clear environmental benefits. Simulations using the HBEFA 4.2 emissions model revealed reductions of up to 3–4% across key pollutant categories (CO, CO2, NOx, PMx, HC) and in fuel consumption. These outcomes align with broader sustainability goals by promoting cleaner air, lower fuel usage, and more efficient energy consumption. Therefore, DeepSIGNAL-ITS has the potential to not only optimize traffic flow but also support healthier and more livable urban environments.
The proposed DeepSIGNAL-ITS framework demonstrates strong adaptability and robustness across cities of varying sizes and traffic complexities, confirming its potential for wide-scale deployment. Its reliance on open-source tools ensures cost-effectiveness, making it accessible to municipalities with limited budgets. Furthermore, the system’s design facilitates quick deployment and operational resilience, while maintaining stable performance under both static and dynamic traffic patterns—highlighting its practicality for real-world intelligent traffic management.

5.1. Limitations

Despite the promising results achieved through the DeepSIGNAL-ITS framework, certain limitations must be acknowledged. The current evaluation is based exclusively on a simulated environment using the SUMO traffic simulator, which, although detailed, does not fully replicate the variability of real-world traffic conditions. Factors such as sensor inaccuracies, communication latency, environmental influences, and driver unpredictability are not captured in the simulation. Moreover, the framework is tested on discrete urban sectors without modeling large-scale interdependencies across a broader city-wide network. Another constraint lies in the traffic demand modeling, which is assumed to be relatively stable, thereby excluding disruptions caused by incidents, weather events, or road maintenance operations. Another limitation lies in the absence of statistical validation (e.g., confidence intervals, variance analysis, or hypothesis testing) to reinforce the observed improvements. This is an area for future enhancement, potentially supported by larger-scale simulations or field trials. Additionally, while the environmental benefits were discussed separately, the correlation between emission reduction and delay minimization could be investigated in more depth to quantify sustainability gains beyond proxy indicators.

5.2. Future Work

To address these limitations, several future research directions are planned. One key area is integrating real-time data from different sources, such as roadside sensors, connected vehicles, and traffic cameras, to test the system in live environments. The framework will also be expanded into a multi-agent reinforcement learning (MARL) configuration, which facilitates decentralized coordination across multiple intersections. Scalability and robustness will be improved by deploying the system within an edge-cloud architecture, leading to low-latency decision-making and efficient resource use. Furthermore, we aim to incorporate behavioral models that capture non-deterministic human driving patterns and assess the system’s resilience to stochastic events. Broader evaluations will include economic feasibility, environmental policy compliance, and stakeholder-focused deployment scenarios, striving to bridge research with real-world intelligent transportation systems.

Author Contributions

Conceptualization, M.M.M. and A.-V.B.; methodology, M.M.M. and A.-V.B.; software, A.-V.B.; validation, M.M.M., A.-V.B. and Ș.L.N.; formal analysis, A.-V.B.; investigation, A.-V.B.; resources, M.M.M.; data curation, A.-V.B.; writing—original draft preparation, M.M.M., A.-V.B. and Ș.L.N.; writing—review and editing, M.M.M., A.-V.B. and Ș.L.N.; visualization, M.M.M.; supervision, Ș.L.N. and N.Ț.; project administration, Ș.L.N. and N.Ț.; All authors have read and agreed to the published version of the manuscript.

Funding

This research received no external funding.

Institutional Review Board Statement

Not applicable.

Informed Consent Statement

Not applicable.

Data Availability Statement

The DeepSIGNAL-ITS framework is available at https://github.com/B0r0B0r0/Optiroad, accessed on 1 August 2025.

Conflicts of Interest

The authors declare no conflicts of interest.

Appendix A. Timestamp JSON Format

Applsci 15 09396 i0a1

Appendix B. Example of Route File

Applsci 15 09396 i0a2a
Applsci 15 09396 i0a2b

Appendix C. TLS Phase JSON

Applsci 15 09396 i0a3

References

  1. Elenwo, E. Health and Environmental Effects of Vehicular Traffic Emission in Yenagoa City Bayelsa State, Nigeria. ASJ Int. J. Health Saf. Environ. 2018, 4, 291–307. Available online: http://www.academiascholarlyjournal.org/ijhse/index_ijhse.htm (accessed on 1 August 2025).
  2. Kaixi, Y. Road Traffic Status and Carbon Emission Estimation Methods. World J. Soc. Sci. Res. 2020, 7, 34. [Google Scholar] [CrossRef]
  3. Tang, C.R.; Hsieh, J.W.; Teng, S.Y. Cooperative Multi-Objective Reinforcement Learning for Traffic Signal Control and Carbon Emission Reduction. arXiv 2023, arXiv:2306.09662. [Google Scholar] [CrossRef]
  4. Xie, D.; Li, M.; Sun, Q.; He, J. Reinforcement Learning Based Urban Traffic Signal Control and Its Impact Assessment on Environmental Pollution. E3S Web Conf. 2024, 536, 01021. [Google Scholar] [CrossRef]
  5. Elouni, M.; Abdelghaffar, H.M.; Rakha, H.A. Adaptive Traffic Signal Control: Game-Theoretic Decentralized vs. Centralized Perimeter Control. Sensors 2021, 21, 274. [Google Scholar] [CrossRef]
  6. Dovzhenko, N.; Mazur, N.; Kostiuk, Y.; Rzaieva, S. INTEGRATION OF IOT AND ARTIFICIAL INTELLIGENCE INTO INTELLIGENT TRANSPORTATION SYSTEMS. Cybersecur. Educ. Sci. Tech. 2024, 2, 430–444. [Google Scholar] [CrossRef]
  7. But, T.; Mamotenko, D. Increasing the economic development of the EU countries through the implementation of the “Smart City” concept. Manag. Entrep. Trends Dev. 2025, 1, 27–37. [Google Scholar] [CrossRef]
  8. Sneharika, P.; Anvitha, B.C.S.S.; Kumar, A.M.; T, P.; Devi, M.M.Y.; Kumar, S. A Comprehensive Analysis on Traffic Prediction Methods for Real-World Deployment: Challenges, Cause and Scope. In Proceedings of the 2024 International Conference on Communication, Computer Sciences and Engineering (IC3SE), Gautam Buddha Nagar, India, 9–11 May 2024; pp. 119–124. [Google Scholar] [CrossRef]
  9. Streimikis, J.; Kortenko, L.; Panova, M.; Voronov, M. Development of a smart city information system. E3S Web Conf. 2021, 301, 05002. [Google Scholar] [CrossRef]
  10. Shaheen, S.; Finson, R. Intelligent Transportation Systems; Transportation Sustainability Research Center, Institute of Transportation Studies, University of California: Berkeley, CA, USA, 2013; Available online: https://escholarship.org/uc/item/3hh2t4f9 (accessed on 26 August 2025).
  11. Barbaresso, J.; Cordahi, G.; Garcia, D.; Hill, C.; Jendzejec, A.; Wright, K. USDOT’s Intelligent Transportation Systems (ITS) ITS Strategic Plan, 2015–2019; Technical Report; United States Department of Transportation: Washington, DC, USA, 2014. [Google Scholar]
  12. Mandžuka, S.; Žura, M.; Horvat, B.; Bićanić, D.; Mitsakis, E. Directives of the European Union on Intelligent Transport Systems and their impact on the Republic of Croatia. Promet-Traffic Transp. 2013, 25, 273–283. [Google Scholar] [CrossRef]
  13. Yuan, T.; Da Rocha Neto, W.; Rothenberg, C.E.; Obraczka, K.; Barakat, C.; Turletti, T. Machine learning for next-generation intelligent transportation systems: A survey. Trans. Emerg. Telecommun. Technol. 2022, 33, e4427. [Google Scholar] [CrossRef]
  14. Ghosh, R.; Pragathi, R.; Ullas, S.; Borra, S. Intelligent transportation systems: A survey. In Proceedings of the 2017 International Conference on Circuits, Controls, and Communications (CCUBE), Bangalore, India, 15–16 December 2017; pp. 160–165. [Google Scholar] [CrossRef]
  15. Shahraz, M.; Ahmed, M. Intelligent Transportation Systems: An Overview of Current Trends and Limitations. Int. J. Sci. Res. Eng. Manag. 2022, 6, 1–7. [Google Scholar] [CrossRef]
  16. Veres, M.; Moussa, M. Deep Learning for Intelligent Transportation Systems: A Survey of Emerging Trends. IEEE Trans. Intell. Transp. Syst. 2020, 21, 3152–3168. [Google Scholar] [CrossRef]
  17. Zhu, Y.; Cai, M.; Schwarz, C.W.; Li, J.; Xiao, S. Intelligent Traffic Light via Policy-based Deep Reinforcement Learning. Int. J. Intell. Transp. Syst. Res. 2022, 20, 734–744. [Google Scholar] [CrossRef]
  18. Faqir, N.; Ennaji, Y.; Chakir, L.; Boumhidi, J. Hybrid CNN-LSTM and Proximal Policy Optimization Model for Traffic Light Control in a Multi-Agent Environment. IEEE Access 2025, 13, 29577–29588. [Google Scholar] [CrossRef]
  19. Lin, T.; Lin, R. Smart City Traffic Flow and Signal Optimization Using STGCN-LSTM and PPO Algorithms. IEEE Access 2025, 13, 15062–15078. [Google Scholar] [CrossRef]
  20. Narmadha, S.; Vijayakumar, V. Spatio-Temporal vehicle traffic flow prediction using multivariate CNN and LSTM model. Mater. Today Proc. 2023, 81, 826–833. [Google Scholar] [CrossRef]
  21. Premaratne, P.; Kadhim, I.J.; Blacklidge, R.; Lee, M. Comprehensive review on vehicle Detection, classification and counting on highways. Neurocomputing 2023, 556, 126627. [Google Scholar] [CrossRef]
  22. Berwo, M.A.; Khan, A.; Fang, Y.; Fahim, H.; Javaid, S.; Mahmood, J.; Abideen, Z.U.; MS, S. Deep learning techniques for vehicle detection and classification from images/videos: A survey. Sensors 2023, 23, 4832. [Google Scholar] [CrossRef]
  23. Mittal, U.; Chawla, P. Vehicle detection and traffic density estimation using ensemble of deep learning models. Multimed. Tools Appl. 2023, 82, 10397–10419. [Google Scholar] [CrossRef]
  24. Jiang, P.; Ergu, D.; Liu, F.; Cai, Y.; Ma, B. A Review of Yolo algorithm developments. Procedia Comput. Sci. 2022, 199, 1066–1073. [Google Scholar] [CrossRef]
  25. Krishna, N.M.; Reddy, R.Y.; Reddy, M.S.C.; Madhav, K.P.; Sudham, G. Object detection and tracking using YOLO. In Proceedings of the 2021 Third International Conference on Inventive Research in Computing Applications (ICIRCA), IEEE, Coimbatore, India, 2–4 September 2021; pp. 1–7. [Google Scholar]
  26. Sarda, A.; Dixit, S.; Bhan, A. Object detection for autonomous driving using yolo algorithm. In Proceedings of the 2021 2nd International Conference on Intelligent Engineering and Management (ICIEM), IEEE, London, UK, 28–30 April 2021; pp. 447–451. [Google Scholar]
  27. Schulman, J.; Wolski, F.; Dhariwal, P.; Radford, A.; Klimov, O. Proximal policy optimization algorithms. arXiv 2017, arXiv:1707.06347. [Google Scholar] [CrossRef]
  28. Sharma, R.; Garg, P. Reinforcement Learning Advances in Autonomous Driving: A Detailed Examination of DQN and PPO. In Proceedings of the 2024 Global Conference on Communications and Information Technologies (GCCIT), Bangalore, India, 25–26 October 2024; pp. 1–5. [Google Scholar] [CrossRef]
  29. Jiang, Y.; Wei, Y. Autonomous Vehicles Driving at Unsigned Intersections Based on Improved Proximal Policy Optimization Algorithm. In Proceedings of the 2024 7th International Conference on Advanced Algorithms and Control Engineering (ICAACE), Shanghai, China, 1–3 March 2024; pp. 1107–1112. [Google Scholar] [CrossRef]
  30. Zhao, J.; Zhao, Y.; Li, W.; Zeng, C. End-to-End Autonomous Driving Algorithm Based on PPO and Its Implementation. In Proceedings of the 2024 IEEE 13th Data Driven Control and Learning Systems Conference (DDCLS), Kaifeng, China, 17–19 May 2024; pp. 1852–9861. [Google Scholar] [CrossRef]
  31. Yao, L. An effective vehicle counting approach based on CNN. In Proceedings of the 2019 IEEE 2nd International Conference on Electronics and Communication Engineering (ICECE), IEEE, Xi’an, China, 9–11 December 2019; pp. 15–19. [Google Scholar]
  32. Majumder, M.; Wilmot, C. Automated vehicle counting from pre-recorded video using you only look once (YOLO) object detection model. J. Imaging 2023, 9, 131. [Google Scholar] [CrossRef]
  33. Asha, C.; Narasimhadhan, A. Vehicle counting for traffic management system using YOLO and correlation filter. In Proceedings of the 2018 IEEE International Conference on Electronics, Computing and Communication Technologies (CONECCT), IEEE, Bangalore, India, 16–17 March 2018; pp. 1–6. [Google Scholar]
  34. Mittal, U.; Chawla, P.; Tiwari, R. EnsembleNet: A hybrid approach for vehicle detection and estimation of traffic density based on faster R-CNN and YOLO models. Neural Comput. Appl. 2023, 35, 4755–4774. [Google Scholar] [CrossRef]
  35. Valdovinos-Chacón, G.; Ríos-Zaldivar, A.; Valle-Cruz, D.; Lara, E.R. Integrating IoT and YOLO-Based AI for Intelligent Traffic Management in Latin American Cities. In Artificial Intelligence in Government; Springer: Berlin/Heidelberg, Germany, 2025; pp. 227–253. [Google Scholar]
  36. Gomaa, A.; Minematsu, T.; Abdelwahab, M.M.; Abo-Zahhad, M.; Taniguchi, R.i. Faster CNN-based vehicle detection and counting strategy for fixed camera scenes. Multimed. Tools Appl. 2022, 81, 25443–25471. [Google Scholar] [CrossRef]
  37. Chen, W.C.; Deng, M.J.; Liu, P.Y.; Lai, C.C.; Lin, Y.H. A framework for real-time vehicle counting and velocity estimation using deep learning. Sustain. Comput. Informatics Syst. 2023, 40, 100927. [Google Scholar] [CrossRef]
  38. Zhang, H.; Zhang, Q.; Gong, Y.; Yao, F.; Xiao, P. MDCFVit-YOLO: A model for nighttime infrared small target vehicle and pedestrian detection. PLoS ONE 2025, 20, e0324700. [Google Scholar] [CrossRef]
  39. Biswas, M. Optimising YOLO and ByteTrack for Robust Vehicle Counting and Classification in Adverse Weather: A Computer-Vision-Based Traffic Monitoring Study Using New Zealand Data. Master’s Thesis, Unitec Institute of Technology, Auckland, New Zealand, 2025. [Google Scholar]
  40. Pan, T.; Hui, M.; Huang, J.; Fu, Z.; Hai, T.; Yao, J. PMSA-YOLO: Lightweight vehicle detection with parallel multi-scale aggregation and attention mechanism. J. Electron. Imaging 2025, 34, 033043. [Google Scholar] [CrossRef]
  41. Rafique, M.T.; Mustafa, A.; Sajid, H. Reinforcement Learning for Adaptive Traffic Signal Control: Turn-Based and Time-Based Approaches to Reduce Congestion. arXiv 2024, arXiv:2408.15751. [Google Scholar]
  42. Shashi, F.I.; Sultan, S.M.; Khatun, A.; Sultana, T.; Alam, T. A study on deep reinforcement learning based traffic signal control for mitigating traffic congestion. In Proceedings of the 2021 IEEE 3rd Eurasia Conference on Biomedical Engineering, Healthcare and Sustainability (Ecbios), IEEE, Tainan, Taiwan, 28–30 May 2021; pp. 288–291. [Google Scholar]
  43. Wang, X.; Abdulhai, B.; Sanner, S. Abdulhai, B.; Sanner, S. A critical review of traffic signal control and a novel unified view of reinforcement learning and model predictive control approaches for adaptive traffic signal control. In Handbook on Artificial Intelligence and Transport; Edward Elgar Publishing: Tallinn, Estonia, 2023; pp. 482–532. [Google Scholar]
  44. Miletić, M.; Ivanjko, E.; Gregurić, M.; Kušić, K. A review of reinforcement learning applications in adaptive traffic signal control. IET Intell. Transp. Syst. 2022, 16, 1269–1285. [Google Scholar] [CrossRef]
  45. Huang, Q. Model-based or model-free, a review of approaches in reinforcement learning. In Proceedings of the 2020 International Conference on Computing and Data Science (CDS). IEEE, Stanford, CA, USA, 1–2 August 2020; pp. 219–221. [Google Scholar]
  46. Liu, X.Y.; Zhu, M.; Borst, S.; Walid, A. Deep reinforcement learning for traffic light control in intelligent transportation systems. arXiv 2023, arXiv:2302.03669. [Google Scholar] [CrossRef]
  47. VB, S.S.K.; Thiruvenkadakrishnan, S. Traffic Signal Optimization using Real-Time Pedestrian and Vehicle Counts. In Proceedings of the 2025 International Conference on Intelligent Computing and Control Systems (ICICCS), IEEE, Changchun, China, 19–21 March 2025; pp. 1297–1301. [Google Scholar]
  48. Swapno, S.; Nobel, S.; Meena, P.; Meena, V.; Azar, A.T.; Haider, Z.; Tounsi, M. A reinforcement learning approach for reducing traffic congestion using deep Q learning. Sci. Rep. 2024, 14, 30452. [Google Scholar] [CrossRef]
  49. Medvei, M.M.; Dima, G.A.; Ţăpuş, N. Approaching traffic congestion with double deep Q-networks. In Proceedings of the 2021 20th RoEduNet Conference: Networking in Education and Research (RoEduNet), IEEE, Iasi, Romania, 4–6 November 2021; pp. 1–6. [Google Scholar]
  50. Chu, X.; Cao, X. Adaptive traffic signal control for road networks based on dueling double deep q-network. In Proceedings of the International Conference on Frontiers of Traffic and Transportation Engineering (FTTE 2024), Lanzhou, China, 22–24 November 2024; SPIE: Bellingham, WA, USA, 2025; Volume 13645, pp. 167–174. [Google Scholar]
  51. Oroojlooy, A.; Nazari, M.; Hajinezhad, D.; Silva, J. Attendlight: Universal attention-based reinforcement learning model for traffic signal control. Adv. Neural Inf. Process. Syst. 2020, 33, 4079–4090. [Google Scholar]
  52. Wijayarathna, K.; Lakmal, H. Adaptive Traffic Control Framework for Urban Intersections. In Proceedings of the 1st International Conference on Advanced Computing Technologies, Ghaziabad, India, 23–24 August 2024; p. 18. [Google Scholar]
  53. Li, Z.; Xu, C.; Zhang, G. A deep reinforcement learning approach for traffic signal control optimization. arXiv 2021, arXiv:2107.06115. [Google Scholar] [CrossRef]
  54. Guo, J.; Cheng, L.; Wang, S. CoTV: Cooperative control for traffic light signals and connected autonomous vehicles using deep reinforcement learning. IEEE Trans. Intell. Transp. Syst. 2023, 24, 10501–10512. [Google Scholar] [CrossRef]
  55. Huang, L.; Qu, X. Improving traffic signal control operations using proximal policy optimization. IET Intell. Transp. Syst. 2023, 17, 592–605. [Google Scholar] [CrossRef]
  56. Li, M.; Pan, X.; Liu, C.; Li, Z. Federated deep reinforcement learning-based urban traffic signal optimal control. Sci. Rep. 2025, 15, 11724. [Google Scholar] [CrossRef] [PubMed]
  57. Wang, L.; Zhang, G.; Yang, Q.; Han, T. An adaptive traffic signal control scheme with Proximal Policy Optimization based on deep reinforcement learning for a single intersection. Eng. Appl. Artif. Intell. 2025, 149, 110440. [Google Scholar] [CrossRef]
  58. Kwesiga, D.K.; Guin, A.; Hunter, M. Adaptive Traffic Signal Control based on Multi-Agent Reinforcement Learning. Case Study on a simulated real-world corridor. arXiv 2025, arXiv:2503.02189. [Google Scholar]
  59. Duan, L.; Zhao, H. An Adaptive Signal Control Model for Intersection Based on Deep Reinforcement Learning Considering Carbon Emissions. Electronics 2025, 14, 1664. [Google Scholar] [CrossRef]
  60. Duan, L.; Nie, J.; Liang, R.; Zhao, H.; He, R. Adaptive Traffic Signal Control Based on A Modified Proximal Policy Optimization Algorithm. In Proceedings of the 2024 4th International Conference on Artificial Intelligence, Robotics, and Communication (ICAIRC), IEEE, Xiamen, China, 27–29 December 2024; pp. 748–752. [Google Scholar]
  61. Zhou, K.; Zhang, C.; Zhan, F.; Liu, W.; Li, Y. Using a single actor to output personalized policy for different intersections. arXiv 2025, arXiv:2503.07678. [Google Scholar]
  62. Fu, X.; Ren, Y.; Jiang, H.; Lv, J.; Cui, Z.; Yu, H. CLlight: Enhancing representation of multi-agent reinforcement learning with contrastive learning for cooperative traffic signal control. Expert Syst. Appl. 2025, 262, 125578. [Google Scholar] [CrossRef]
  63. Michailidis, P.; Michailidis, I.; Lazaridis, C.R.; Kosmatopoulos, E. Traffic Signal Control via Reinforcement Learning: A Review on Applications and Innovations. Infrastructures 2025, 10, 114. [Google Scholar] [CrossRef]
  64. Li, Y.; He, J.; Gao, Y. Intelligent traffic signal control with deep reinforcement learning at single intersection. In Proceedings of the 2021 7th International Conference on Computing and Artificial Intelligence, Guiyang, China, 23–25 July 2021; pp. 399–406. [Google Scholar]
  65. Zhang, Z.; Gunter, G.; Quinones-Grueiro, M.; Zhang, Y.; Barbour, W.; Biswas, G.; Work, D. Phase Re-service in Reinforcement Learning Traffic Signal Control. arXiv 2024, arXiv:2407.14775. [Google Scholar] [CrossRef]
  66. Xu, T.; Barman, S.; Levin, M.W.; Chen, R.; Li, T. Integrating public transit signal priority into max-pressure signal control: Methodology and simulation study on a downtown network. Transp. Res. Part C Emerg. Technol. 2022, 138, 103614. [Google Scholar] [CrossRef]
  67. Wei, H.; Xu, N.; Zhang, H.; Zheng, G.; Zang, X.; Chen, C.; Zhang, W.; Zhu, Y.; Xu, K.; Li, Z. Colight: Learning network-level cooperation for traffic signal control. In Proceedings of the 28th ACM International Conference on Information and Knowledge Management, Beijing, China, 3–7 November 2019; pp. 1913–1922. [Google Scholar]
  68. Wei, H.; Chen, C.; Zheng, G.; Wu, K.; Gayah, V.; Xu, K.; Li, Z. Presslight: Learning max pressure control to coordinate traffic signals in arterial network. In Proceedings of the 25th ACM SIGKDD International Conference on Knowledge Discovery & Data Mining, Anchorage, AK, USA, 4–8 August 2019; pp. 1290–1298. [Google Scholar]
  69. Chen, C.; Wei, H.; Xu, N.; Zheng, G.; Yang, M.; Xiong, Y.; Xu, K.; Li, Z. Toward a thousand lights: Decentralized deep reinforcement learning for large-scale traffic signal control. In Proceedings of the AAAI Conference on Artificial Intelligence, New York, NY, USA, 7–12 February 2020; Volume 34, pp. 3414–3421. [Google Scholar]
  70. Zang, X.; Yao, H.; Zheng, G.; Xu, N.; Xu, K.; Li, Z. Metalight: Value-based meta-reinforcement learning for traffic signal control. In Proceedings of the AAAI Conference on Artificial Intelligence, New York, NY, USA, 7–12 February 2020; Volume 34, pp. 1153–1160. [Google Scholar]
  71. Lin, J.P.; Sun, M.T. A YOLO-Based Traffic Counting System. In Proceedings of the 2018 Conference on Technologies and Applications of Artificial Intelligence (TAAI), Taichung, Taiwan, 30 November–2 December 2018; pp. 82–85. [Google Scholar] [CrossRef]
  72. Hua, H.; Li, Y.; Wang, T.; Dong, N.; Li, W.; Cao, J. Edge Computing with Artificial Intelligence: A Machine Learning Perspective. ACM Comput. Surv. 2023, 55, 1–35. [Google Scholar] [CrossRef]
  73. Han, B.G.; Lee, J.G.; Lim, K.T.; Choi, D.H. Design of a Scalable and Fast YOLO for Edge-Computing Devices. Sensors 2020, 20, 6779. [Google Scholar] [CrossRef]
  74. Rahman, Z.; Ami, A.M.; Ullah, M.A. A Real-Time Wrong-Way Vehicle Detection Based on YOLO and Centroid Tracking. In Proceedings of the 2020 IEEE Region 10 Symposium (TENSYMP), Dhaka, Bangladesh, 5–7 June 2020; pp. 916–920. [Google Scholar] [CrossRef]
  75. Minghini, M.; Frassinelli, F. OpenStreetMap history for intrinsic quality assessment: Is OSM up-to-date? Open Geospat. Data Softw. Stand. 2019, 4, 9. [Google Scholar] [CrossRef]
  76. Garí, Y.; Pacini, E.; Robino, L.; Mateos, C.; Monge, D.A. Online RL-based cloud autoscaling for scientific workflows: Evaluation of Q-Learning and SARSA. Future Gener. Comput. Syst. 2024, 157, 573–586. [Google Scholar] [CrossRef]
  77. Krajzewicz, D. Traffic Simulation with SUMO—Simulation of Urban Mobility. In Fundamentals of Traffic Simulation; Barceló, J., Ed.; Springer: New York, NY, USA, 2010; pp. 269–293. [Google Scholar] [CrossRef]
  78. European Commission. Communication from the Commission to the European Parliament, the Council, the European Economic and Social Committee and the Committee of the Regions: Urban Mobility Package: Together Towards Competitive and Resource-Efficient Urban Mobility; COM/2013/0913 Final. European Commission: Brussels, Belgium, 2013. Available online: https://eur-lex.europa.eu/legal-content/EN/TXT/?uri=CELEX:52013DC0913 (accessed on 1 August 2025).
  79. CEN/TS 17444-1; Intelligent Transport Systems—ESafety—Part 1: Traffic Signal Control Interface—Functional Requirements. Technical Report. European Committee for Standardization (CEN): Brussels, Belgium, 2020.
  80. INFRAS. Handbook Emission Factors for Road Transport (HBEFA) Version 4.2; INFRAS: Zürich, Switzerland, 2022; Available online: https://www.hbefa.net/e/index.html (accessed on 1 August 2025).
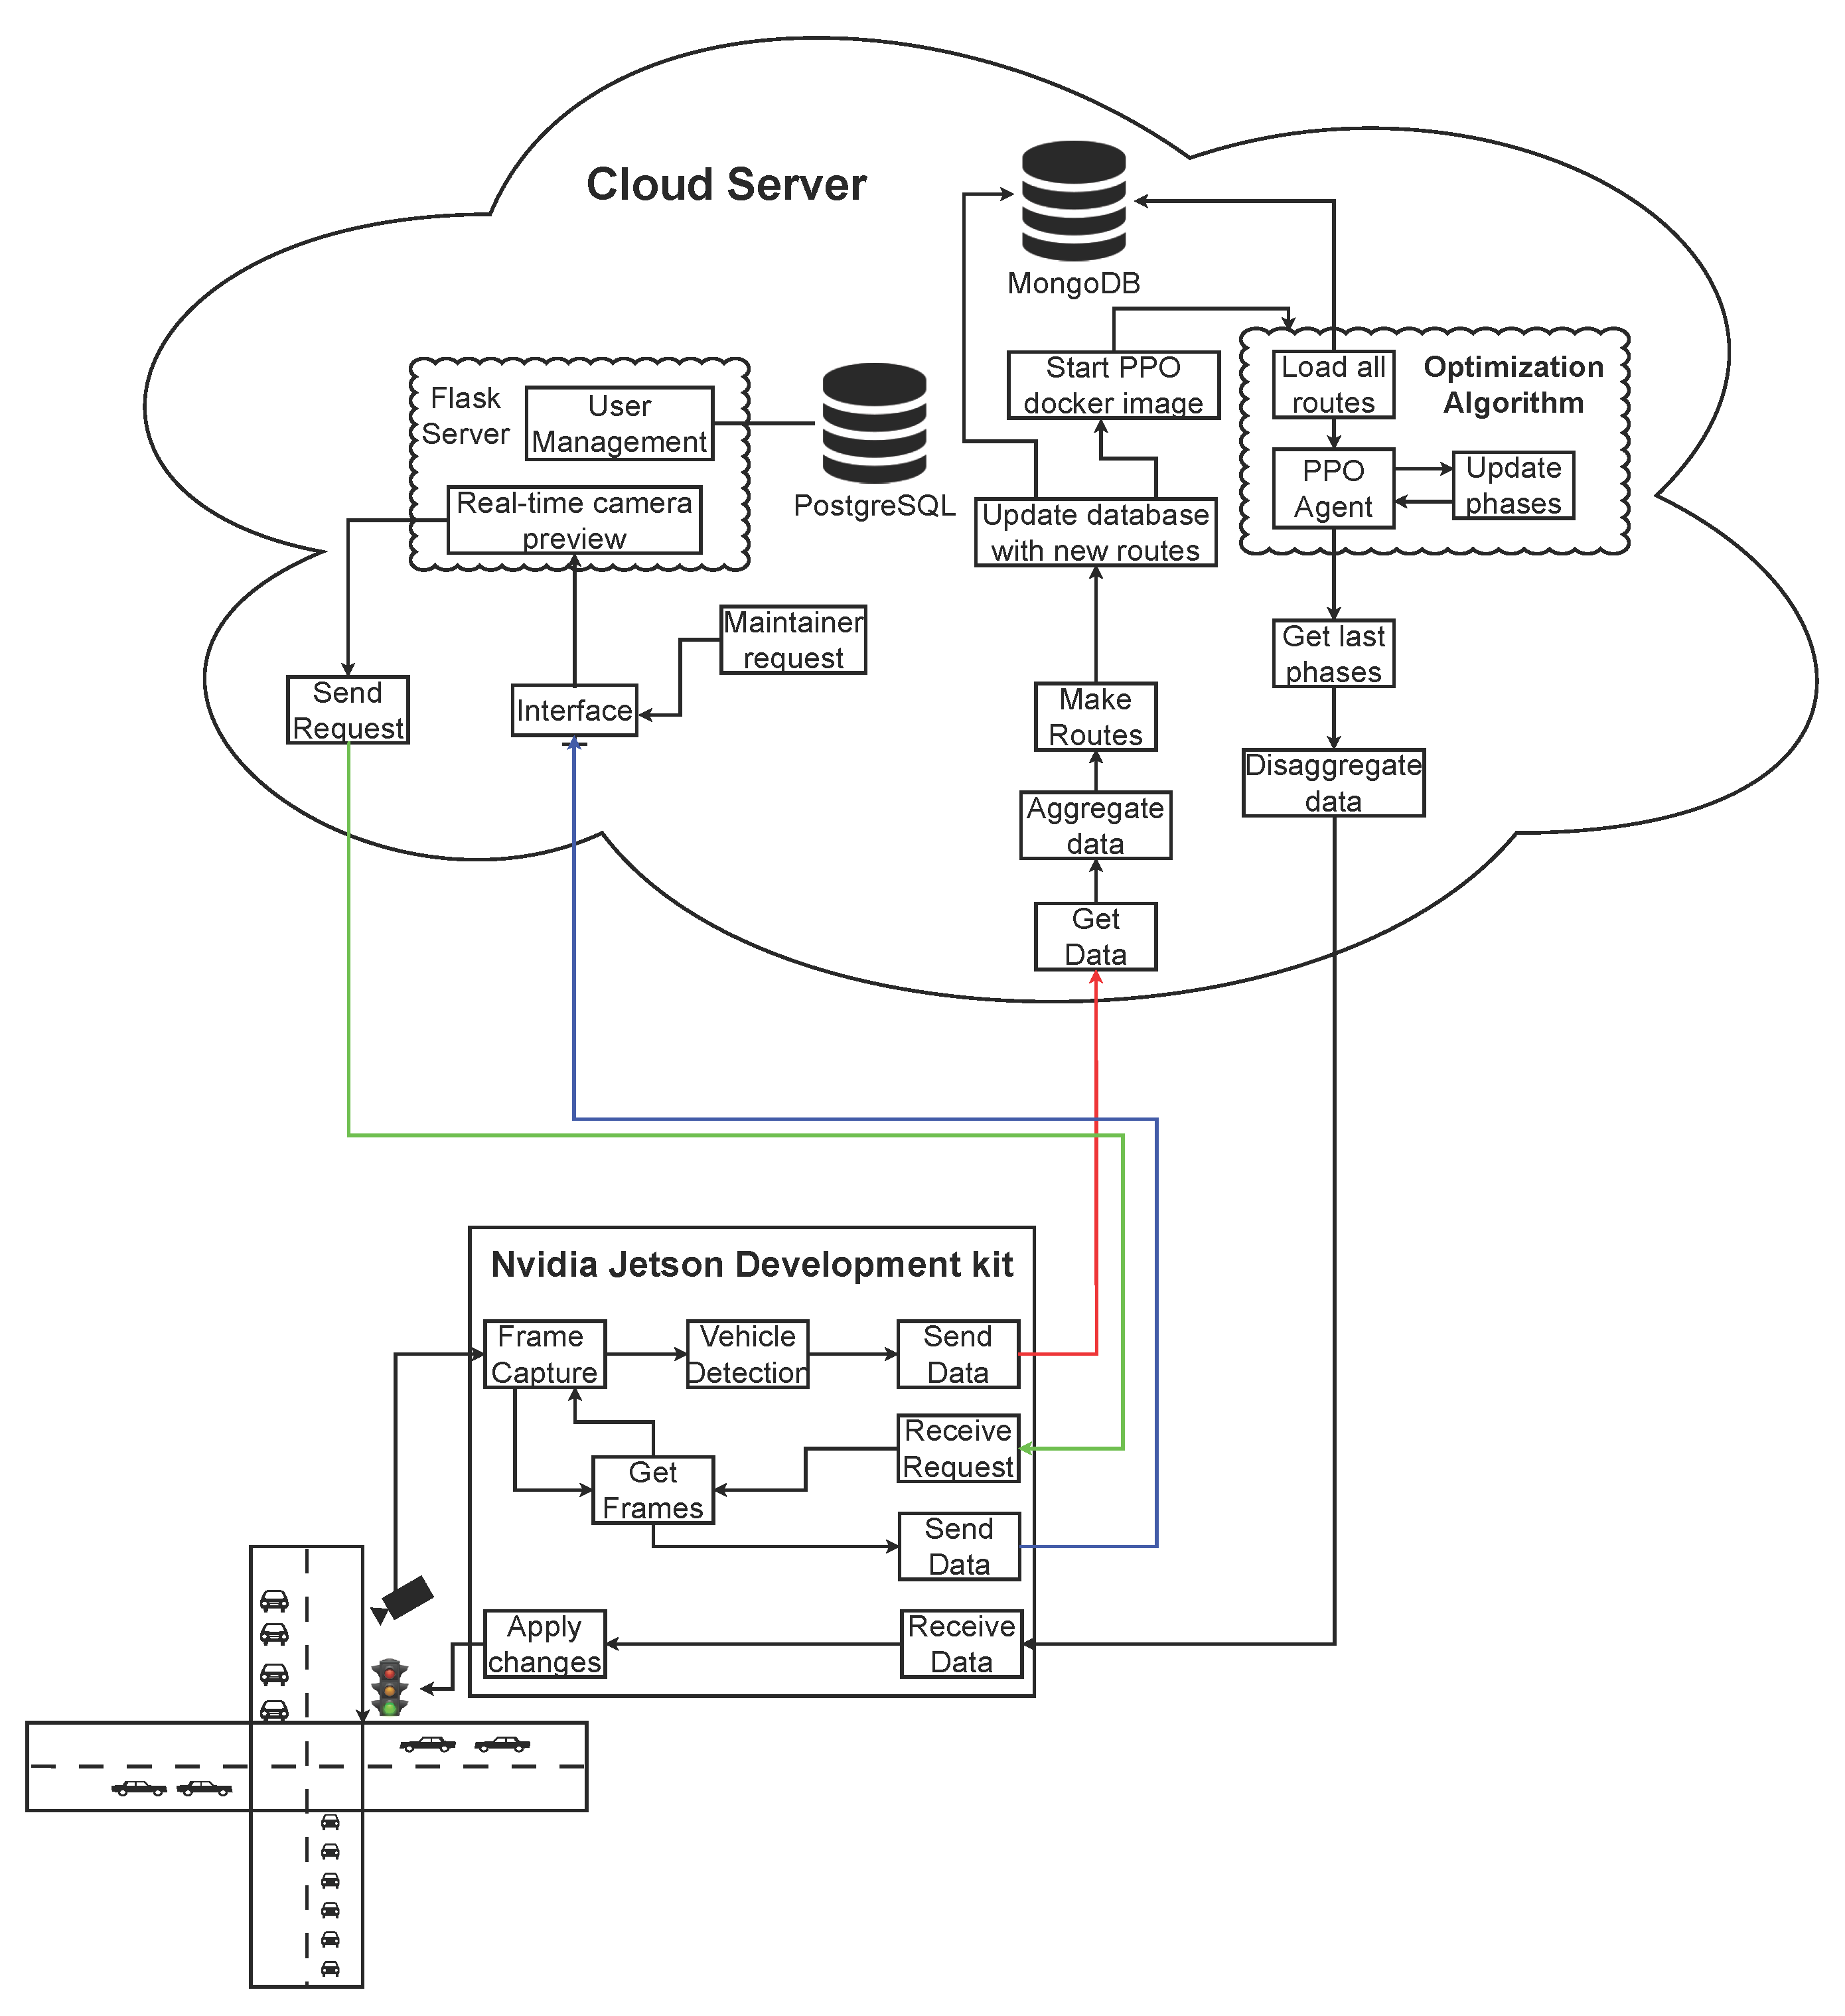
Figure 1. The overall architecture of the DeepSIGNAL-ITS framework consists of four main components: the Data Acquisition and Vehicle Detection module, the Secure Cloud Communication and Data Exchange module, the Cloud-Based Web Interface and RL Model Generation module, and the Reinforcement Learning Decision Logic with Secure Communication and System Integrity module.
Applsci 15 09396 g001
Figure 2. Data Acquisition and Vehicle Detection module processing pipeline.
Applsci 15 09396 g002
Figure 3. CCTV source videos.
Applsci 15 09396 g003
Figure 4. Proposed deployment setup for the vehicle detection and counting module on a RSU, enabling edge-based real-time traffic monitoring.
Applsci 15 09396 g004
Figure 5. The average waiting time at signalized intersections across various cities was analyzed before and after implementing DeepSIGNAL-ITS, showing a reduction of approximately 30.20%.
Applsci 15 09396 g005
Figure 6. Hourly total waiting time at signalized intersections over a 24-h simulation. The x-axis denotes each hour of the day, while the y-axis represents cumulative waiting time (in seconds) across all intersections. The Init Waiting Time curve shows the baseline scenario before optimization, and the Post Waiting Time curve reflects results after applying the PPO-based signal control.
Applsci 15 09396 g006
Figure 7. Average vehicle waiting time over a 24-h simulation, calculated in 10-min intervals. The x-axis represents the time of day (00:00 to 23:00), and the y-axis shows the mean waiting time per vehicle in seconds. The Init Mean curve depicts pre-optimization values, while the Post Mean curve reflects results after applying PPO-based traffic signal control.
Applsci 15 09396 g007
Figure 8. Hourly total semaphore waiting time in Tecuci before and after optimization, with the number of generated vehicles shown below each hour. Percentage labels indicate waiting time reduction.
Applsci 15 09396 g008
Figure 9. Hourly total semaphore waiting time in Bucharest Sector 1 before and after optimization, with the number of generated vehicles shown below each hour. Percentage labels indicate waiting time reduction.
Applsci 15 09396 g009
Figure 10. Emission reduction results across six categories (using HBEFA 4.2) following the implementation of the proposed optimization algorithm. Each panel compares baseline values (solid blue line) with post-optimization values (dotted orange line), reflecting the impact of the proposed adaptive signal control on traffic-related pollutants: (a) CO emissions before and after optimization, showing a notable reduction in overall output. (b) CO 2 emissions comparison, highlighting decreased greenhouse gas production under optimized conditions. (c) Fuel consumption levels under baseline and optimized conditions, demonstrating improved fuel efficiency as a result of reduced idling and smoother flow. (d) HC emissions trend, indicating lower volatile organic compound emissions. (e) NOx emission levels, with reductions tied to decreased acceleration and stop-and-go behavior. (f) PMx emissions, illustrating the benefits of improved traffic flow on fine particle pollutants.
Applsci 15 09396 g010
Table 1. Applications of PPO in traffic control and their core characteristics.
Ref.MethodStateActionRewardTraffic Density
[54]PPOsignal phase, traffic volume, vehicle dynamicsbinary setintersection pressure
[55]LSTM PPOtraffic volume, avg. queue length, waiting time, vehicle speed, lane occupancydiscrete phase switchaverage speed
[19]PPOtraffic flow, vehicle wait times, lane occupancyextend duration of lightstotal vehicle wait timeSTGCN-LSTM
[56]Federated PPOqueue length, waiting time for 8 lanes4 phase selectionaverage vehicle wait time
[18]PPOsignal phase, congestion level, congestion evolution, avg. vehicle speed4 phase selectiontotal vehicle wait timeCNN-LSTM
[17]PPO, DQN, DDQNvehicle position, velocity, and waiting-time matrices, traffic light phase vectorfixed vs. variable intervaltotal vehicle wait and passing time
[65]PPOvehicle queues, non-stopping vehicles, phase timing contextduration of the next phasenegative sum of normalized queue lengths
[58]MA-PPOlane occupancy, signal phase8 phase selectionarterial delay
[59]D3QN, PPO, SACsignal phase, queue length, avg. vehicle speed, number of fuel-powered and electric vehiclesfixed phase sequencesum of CO2 emissions and stopping delays
[61]HAMH-PPOlane occupancy8 phase selectionsum of waiting queue lengths in all lanes
The placeholder in the Traffic Density column indicates that the article does not address the traffic density problem.
Table 2. Performance metrics and simulation environment configurations for PPO-Based traffic signal control systems.
Ref.Performance EvaluationCommentsSimulation EnvironmentNr.
[54]Intersection levelThe work introduces CoTV, a multi-agent system based on PPO that facilitates cooperative control between connected autonomous vehicles (CAVs) and traffic light controllers, aligning their complementary goals to enhance traffic sustainability.SUMO31
[55]Intersection levelThe paper presents an adaptive traffic signal control model that combines LSTM and PPO to improve traffic flow representation and spatiotemporal perception at single-point intersections. LSTM captures temporal traffic features, while the Actor-Critic PPO framework enables intelligent signal phase decisions based on learned patterns.SUMO1
[19]Intersection levelThe study presents a hybrid traffic signal control framework that fuses STGCN and LSTM for predicting traffic flow and uses PPO for real-time signal optimization, while incorporating external factors to improve adaptability in complex urban conditions.custom-built-
[56]Network levelThe study introduces a PPO-based Federated RL framework for traffic signal control that improves agent cooperation and communication efficiency, leading to increased traffic throughput and reduced data transmission.SUMO1
[18]Network levelThe paper introduces a hybrid traffic signal control method integrating CNN-LSTM for state prediction and PPO for control, using cumulative waiting time as a reward to reflect system-wide congestion impact.SUMO2
[17]Intersection levelThe research evaluates and compares the performance of traffic signal controllers trained with DQN, DDQN, and PPO under fixed and variable light phase intervals, concluding that PPO delivers the most effective results.SUMO1
[57]Intersection levelThe article introduces a PPO-based Adaptive Traffic Signal Control (PPO-TSC) approach that utilizes simplified traffic state vectors derived from vehicle waiting times and lane queue lengths, with a reward function designed accordingly.SUMO1
[58]Arterial levelThe study proposes a MA-PPO adaptive signal control algorithm that uses the sum of normalized vehicle delays at each intersection as the reward function, and evaluates its performance along a simulated real-world arterial corridor.PTV-Vissim-MaxTime7
[59]Intersection levelIncorporates CO2 emissions into the reward function alongside vehicle delay, allowing the adaptive signal control to optimize for both traffic flow efficiency and environmental impact.SUMO1
[61]Network levelProposes HAMH-PPO, a shared policy framework that improves parameter efficiency by reducing the number of actor networks required, while still maintaining intersection-level adaptability.CityFlow100
Table 3. Quantitative evaluation of vehicle detection results across multiple traffic scenarios, presenting real and counted vehicle numbers by type and movement direction, accompanied by accuracy and precision metrics per category.
Video EnteredVehicle Type ExitedReal NumberCounted NumberAccuracy (%)Precision (%)
EnteredExitedEnteredExitedEnteredExited
Video 1
Highway
(4 lanes
/side)
Car16016415616997.596.95100.096.45
Truck1313100.0100.0100.0100.0
Motorbike302066.7100.0
Bus0000
Video 2
3 Lanes Enter
/ 1 Exit
Car13012012711897.6998.33100.0100.0
Truck3031100.0100.00.0
Motorbike847287.550.0100.0100.0
Bus3132100.00.0100.050.0
Video 3
4 Lanes Enter
/ 0 Exit
Car1400137097.86100.0
Truck4040100.0100.0
Motorbike12010083.33100.0
Bus7070100.0100.0
Video 4
3 Lanes Enter
/4 Exit
Car12513012713298.498.46100.098.48
Truck102102100.0100.0100.0100.0
Motorbike15713986.6771.43100.077.78
Bus511512100.090.91100.091.67
Accuracy is computed as 1 | Counted Real | Real × 100 per direction, and Precision as TP TP + FP , where true positives (TP) refer to correctly counted vehicles, and false positives (FP) denote vehicles that were incorrectly counted. “—” indicates no vehicles in that direction.
Disclaimer/Publisher’s Note: The statements, opinions and data contained in all publications are solely those of the individual author(s) and contributor(s) and not of MDPI and/or the editor(s). MDPI and/or the editor(s) disclaim responsibility for any injury to people or property resulting from any ideas, methods, instructions or products referred to in the content.