Article

Double Receiving Coils Eccentricity Self-Compensating Small-Loop Transient Electromagnetic System Based on Robustness Analysis

by
Mingxuan Zhang
and
Shanshan Guan
*
College of Instrumentation and Electrical Engineering, Jilin University, Changchun 130012, China
*
Author to whom correspondence should be addressed.
Appl. Sci. 2025, 15(17), 9395; https://doi.org/10.3390/app15179395 (registering DOI)
Submission received: 30 July 2025 / Revised: 23 August 2025 / Accepted: 24 August 2025 / Published: 27 August 2025

Abstract

Featured Application

This work aims to enhance the resolution of small-loop transient electromagnetism in shallow underground detection.

Abstract

The ground small-loop transient electromagnetism (TEM) provides a basis for detecting shallow underground space. However, the strong primary field interference from the transmitting coil to the receiving coil, along with the transition process of the receiving coil, can cause serious distortion of the early secondary field signals. This leads to the loss of effective shallow underground information. In this paper, we utilize the eccentric self-compensating structure to weaken the primary field interference. Aiming at the current position sensitivity of the eccentric structure, we propose a statistical method to realize the robustness analysis of the eccentric structure and find the optimal eccentric position where the primary field coupling between the transmitting and receiving coil is approximated to be zero. To address the impact of the coil transition process, a double receiving coils structure is proposed. This ensures that the number of turns, the secondary field flux and the secondary field response strength in the single receiving coil structure remain unchanged. Compared with the conventional eccentric structure of a single receiving coil, the bandwidth of the receiving coil sensor was increased from 103.5 kHz to 218.3 kHz, and the Signal-to-Noise Ratio (SNR) of the measured early secondary field signals improved from 18.5 to 27.9, representing a 50.81% increase in SNR. This study not only reduces primary field interference but also reduces the impact of the coil transition process, thereby capturing more early secondary field signals and enhancing the shallow detection resolution of the ground TEM.

1. Introduction

The development and utilization of urban underground shallow space is the future direction of land use. It is of great significance to adopt reliable exploration technologies to promptly and accurately assess the geological conditions of construction sites. The ground small-loop transient electromagnetism (TEM) method has a good application prospect in the exploration of urban shallow underground space [1], which uses a coil device with a diameter of no more than 3 m to detect geological formations. It includes the transmitting coil, the receiving coil, the transmitter, and the receiver [2]. The transmitter generates the square wave current in the transmitting coil, producing the primary field, the underground medium excites the induced vortex under the action of the primary field, and the induced vortex will not disappear immediately after the current is turned off. The receiving coil sensor receives the secondary field signal generated by the eddy currents, and the receiver then amplifies and samples the weak secondary field signal. By processing and analyzing this, the spatial distribution and physical properties of the geological structures can be obtained. This method offers the advantages such as a small size of the device, sensitivity to low-impedance anomalies, and high detection efficiency [3]. It is widely used in urban engineering surveys, tunnel exploration, and underground line troubleshooting [4,5]. The key lies in the early signals of the secondary field response, which can reflect the near-surface information [6]. However, due to the strong primary field interference from the transmitting coil to the receiving coil and the transition process of the receiving coil, it is difficult to obtain effective early secondary field signals, resulting in serious loss of shallow space information [7,8]. To reduce the primary field interference, Xi et al. [9] designed an opposing-coils structure using three coils. They injected currents in opposite directions into the opposing coil and the transmitting coil so that the receiving coil experienced nearly zero primary field coupling. However, this approach suppressed the transmitting magnetic moment. Fu et al. [10] proposed a cross-loop design using two coaxial receiving coils arranged with the same winding direction in the plane of the receiving coils. This design reduced the primary field interference and preserved both the transmitting magnetic flux and the secondary field strength, but the structure was more complex. Miles [11] proposed a gradient coil structure, where two identical receiving coils are placed symmetrically along the same axis as the transmitting coil. The primary field is reduced by the opposing responses of the two receiving coils, but this results in a loss of secondary field flux. Because of its simplicity and central symmetry, the bucking structure is commonly employed in a TEM system. However, this scheme weakens the transmitting energy, thereby reducing the decay signal [12]. Liu [13] first proposed a new current-type inverter topology with adjustable turn-off time based on double constant voltage clamping technology, which effectively shortens the turn-off time of the emitter current, thereby reducing primary field interference. Wang [14] obtained the pure secondary field response by converting the responses of different transmission current waveforms into step-wave responses by deconvolution method. Di [15] utilized the pseudorandom binary sequence (PRBS) source to directly invert the TEM response field and extract the secondary field signal. However, the use of signal processing methods inevitably leads to the loss of signal details. Although the above research has reduced primary field interference to a certain extent, it lacks analysis of the impact on the transition process of the receiving coil, and early secondary field signal distortion will still occur. In this paper, we adopt the eccentric self-compensating structure [16]. Compared with the coil structure mentioned above which weakens the primary field, this design offers significant advantages for near-surface space exploration. It can effectively counteract near-surface magnetic flux with greater simplicity and enhanced immunity to interference. Featuring a non-coplanar design, the magnetic fields inside and outside the transmitting coil are oriented in opposite directions. By adjusting the position of the receiving coil, the magnetic fields inside and outside the transmitting coil are simultaneously induced and offset by each other. This configuration enables the primary field interference coupling to be effectively reduced to zero. Taking uncontrollable factors such as installation accuracy error during instrument assembly and vibrations during device operation into account [17], we utilize the sampling statistics method to conduct robustness analysis aimed at optimizing the relative positions of the transceiver coils, which can make the primary field coupling on the receiving coils approximate to zero. While weakening the interference from the primary field, the coil transition process will still make the early secondary field signal loss because of receiving coil self-inductance and distributed capacitance in the coil winding process. [18]. To address this, instead of relying on a single receiving coil in the conventional eccentric self-compensating structure, we increased the number of receiving coils. This approach maintains the same secondary field flux as a single coil while reducing the distributed capacitance and self-inductance generated during winding, thereby increasing the bandwidth and SNR of the receiving coil sensor and improving the shallow detection resolution.

2. Eccentric Self-Compensating Position Determination Based on Robustness Analysis

2.1. Eccentric Coil Mutual Inductance Analysis

The transmitting and receiving coils are wound in a laminated structure. The center of the transmitting coil serves as a reference to establish a spatial right-angled coordinate system. The receiving coil is offset vertically and horizontally along the axis by a certain distance, and the central axes of the transmitting coil and the receiving coil are parallel to each other, and the numerical calculations for this structure are as follows:
According to Neumann’s formula, the mutual inductance coefficient between two single-turn coils is first considered. The mutual inductance Mij between the coils is calculated by taking the i-th turn of the transmitting coil li, and the j-th turn of the receiving coil lj of any layer of transmitting and receiving coils in a cascaded structure. See the following example [19]:
M i j   =   μ 0 4 π l i l j d l i d l j R   =   μ 0 4 π l i l j ( d x i , d y i , d z i ) ( d x j , d y j , d z j ) ( x i     x j ) 2   +   ( y i     y j ) 2   +   ( z i     z j ) 2
Considering the effects of the coil outer diameter, number of turns, laminated structure, and rotation angle, we calculated the mutual inductance between two coils when the center of the receiving coil is vertically offset by a distance z relative to the center of the transmitting coil. We also calculated the positions where the mutual inductance is zero at different height planes to achieve zero coupling between the transmitting and receiving coil. The coordinates of the transmitting coil’s integrating line elements li in Equation (1) are expressed as xi, yi, and zi, while those of the receiving coil integrating line elements lj are expressed as xj, yj, zj, which can be represented as the following:
x i   =   r i cos φ i y i   =   r i sin φ i z i   =   d i
x j   =   D r j cos φ j   +   L x y j   =   D r j sin φ j   +   L y z j   =   D d j   +   L z
where φi is the angle between the transmitting coil’s integral line element and the y-axis direction, and φj is the angle between the receiving coil’s integral line element and the y-axis direction; di is the vertical distance from the center of the wire diameter of the transmitting coil to the center of the whole transmitting coils, and dj is the vertical distance from the center of the wire diameter of the receiving coil to the center of the whole receiving coil; Lx, Ly, and Lz are the distances along each axis from the center of the receiving coil lj relative to the origin of the spatial Cartesian coordinate system; ri is the radius of a single-turn transmitting coil, accounting for the effect of layer thickness due to the transmitting coil wire diameter eT; rj is the radius of a single-turn receiving coil, accounting for the effect of layer thickness due to the receiving coil wire diameter e; D is the coordinate rotation matrix. See the following equation:
r i   =   R T   +   ( n i     1 ) e T ( n T     n i     n T ) r j   =   R R   +   ( n j     1 ) e R ( n R     n j     n R )
where RT is the radius of the transmitting coil skeleton and RR is the radius of the receiving coil skeleton; ni and nj are layer numbers in which the transmitting and receiving coils are located; nT and nR are the total number of layers of the transmitting and receiving coils, respectively; α, β, and γ in the rotation matrix D represent the angles of rotation of the x-axis, the y-axis, and the z-axis of the plane where the receiving coil lj is located, relative to the spatial right-angle coordinate system. Combining Equations (1)–(4), the mutual inductance MTR of the transmitting and receiving coils of the eccentric structure is as follows:
M T R   =   i   =   1 N T j   =   1 N R M i j
where NT and NR are the total number of turns in the transmitting and receiving coils, respectively. In theory, because of the larger size of the receiving coil and the greater number of turns, the sensitivity will be higher. However, this also increases parasitic parameters and reduces the coil’s effective bandwidth. Therefore, before winding the coil, it is necessary to analyze its sensitivity, SNR, and resonance frequency to determine the number of turns and specific dimensions of the receiving coil.
  • Receiving coil sensitivity analysis:
Based on Faraday’s law of electromagnetic induction, the induced electromotive force generated on the receiving coil can be calculated by the following formula:
V s   =   n R · S 0 d B / d t   =   n R π 4 D R 2 d B / d t
The peak value of the coil’s induced voltage is related to the number of the coil’s turns nR and the coil diameter DR. When analyzing sensitivity, the coil induction electromotive force is converted to the following form:
V s   =   n R · S 0 d B / d t   =   π 2 / 2 n R f B D R 2
In the equation, f is the frequency of change in magnetic induction intensity, with units of Hz. The equation clearly illustrates the relationship between the coil’s output voltage, the equivalent area of the coil, and the rate of change of the magnetic field intensity. To ensure the coil’s responsiveness to the magnetic field, the design of the coil’s structural parameters should be given priority. The sensitivity of the coil is as follows:
σ   =   π 2 / 2 n R D R 2
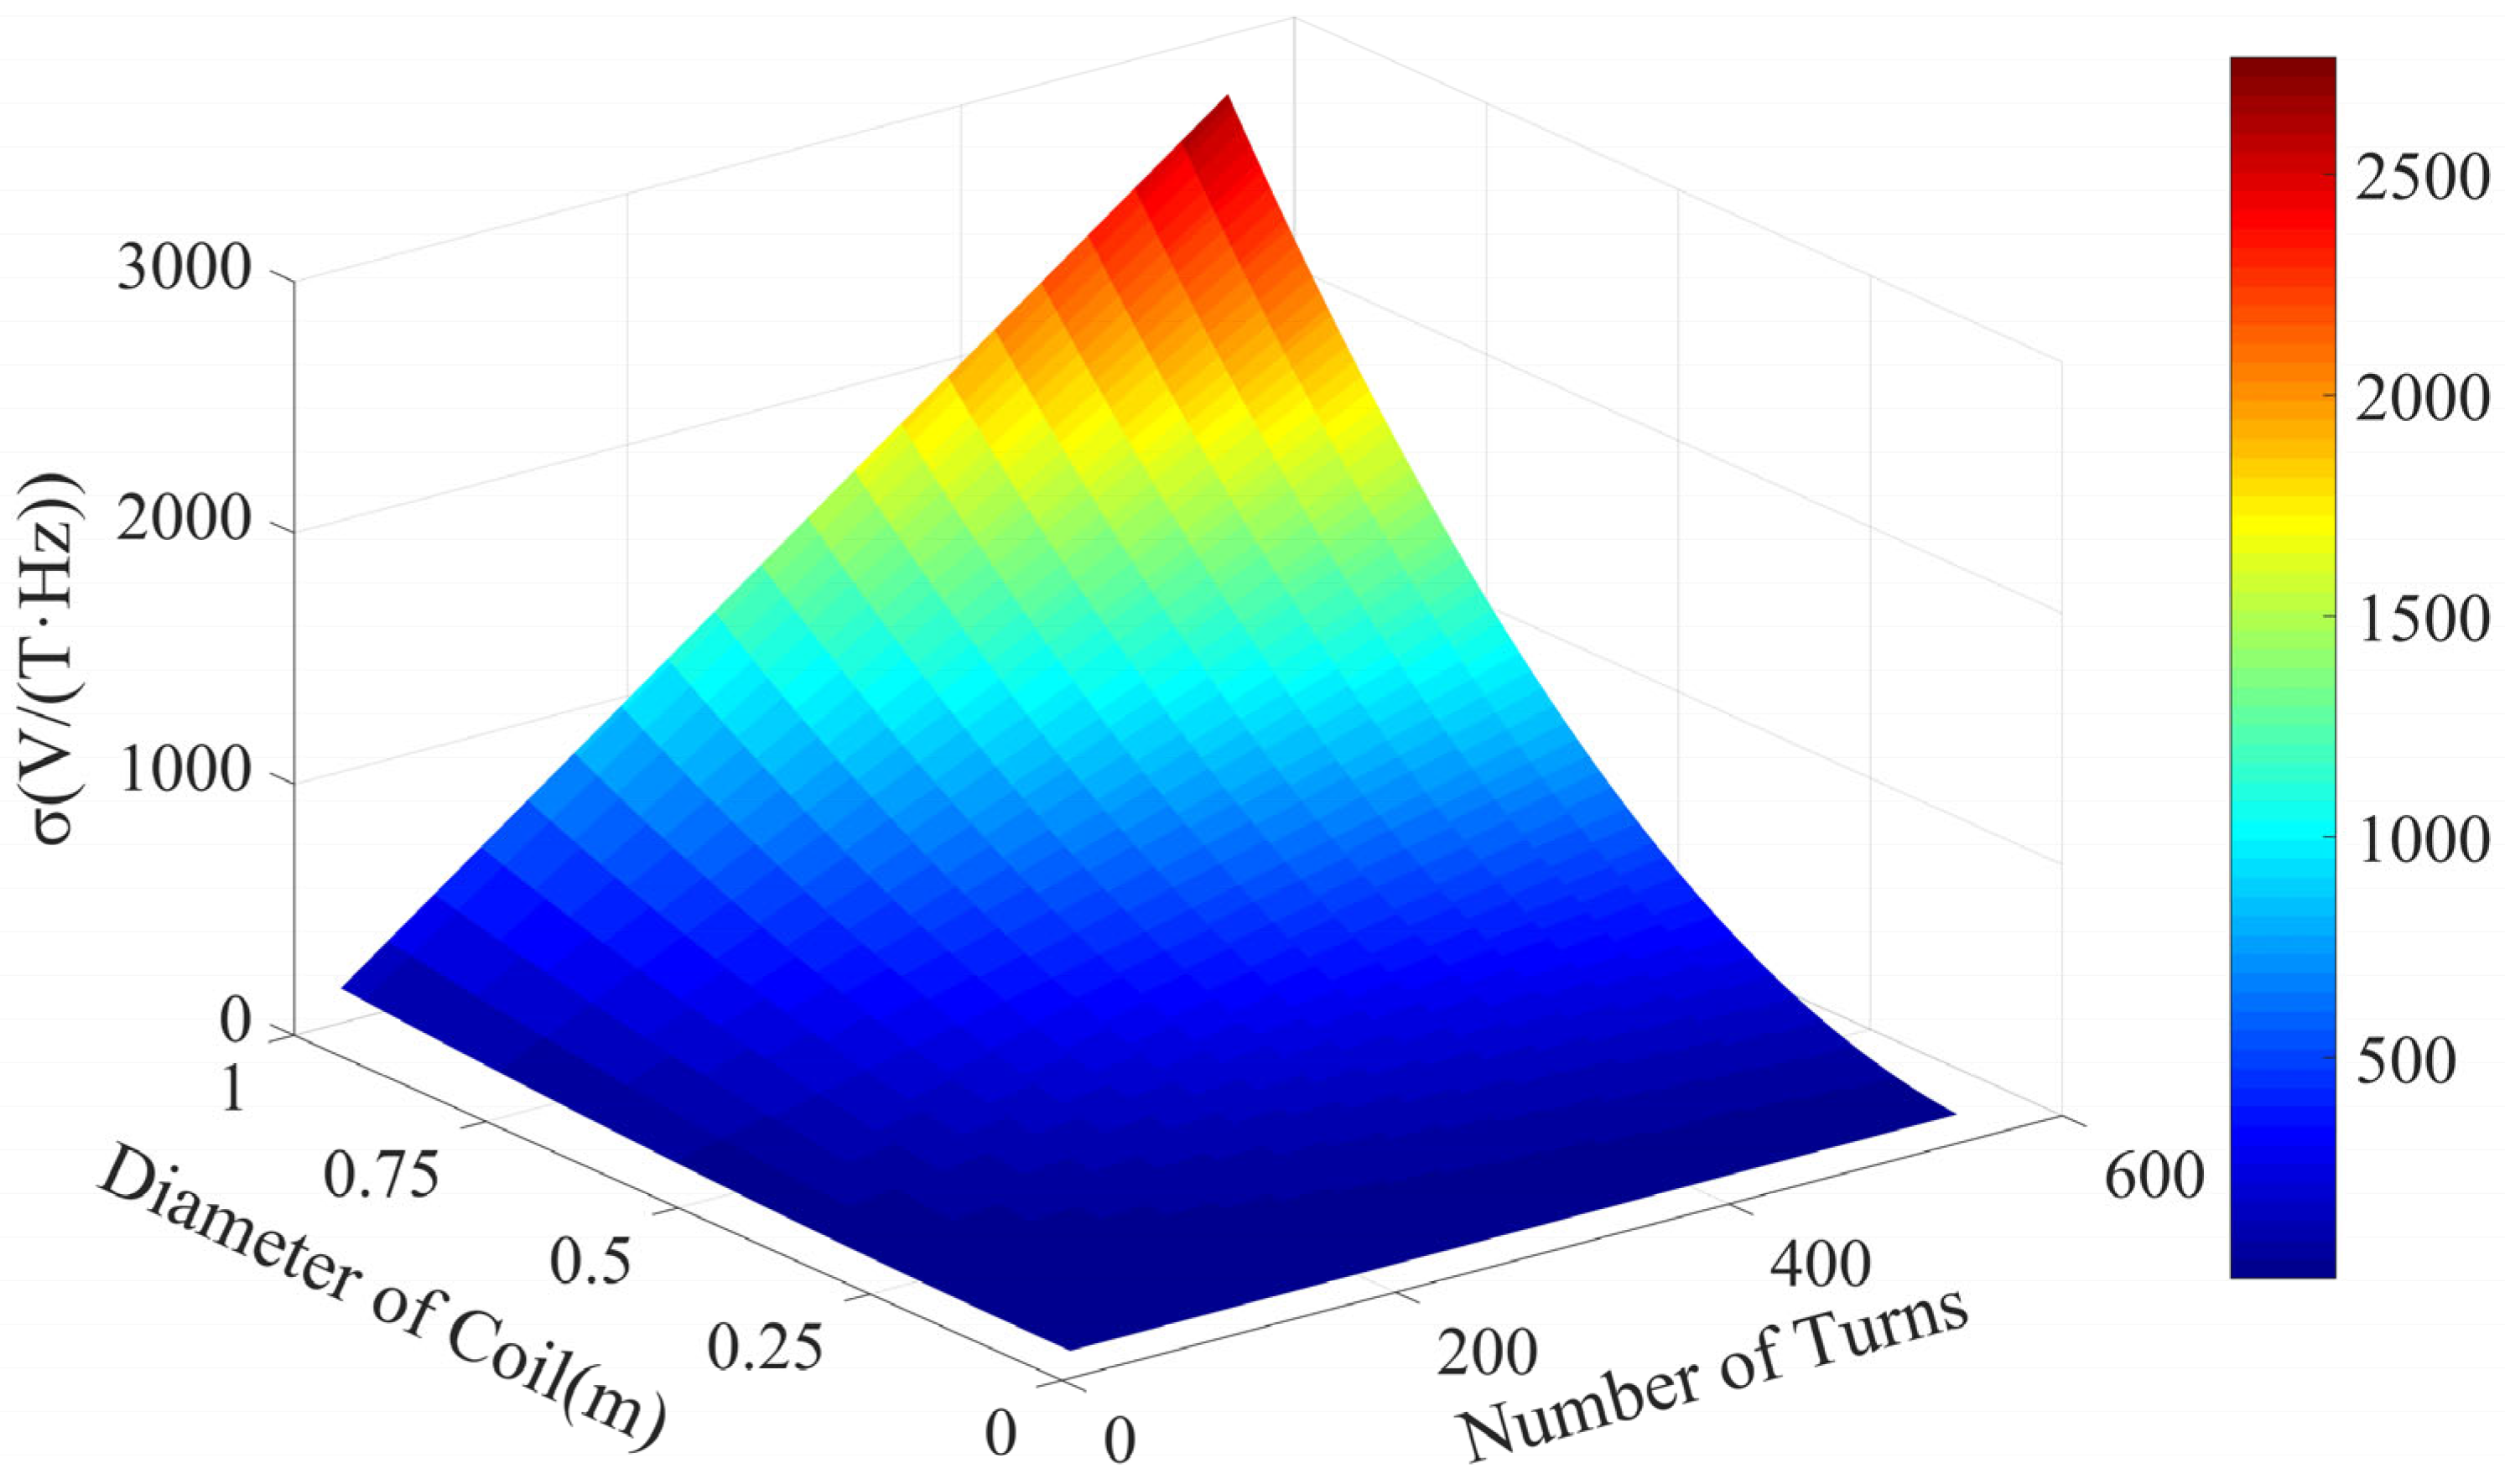
We analyze the mapping relationship between coil’s sensitivity and coil’s turns nR and coil’s diameter DR, as shown in Figure 1. The main detection depth of the small-loop TEM device is the shallow layer several tens of meters below the ground surface. The secondary field characteristics generated at this depth are high frequency and large amplitude, so it is not necessary to use excessive sensitivity as a constraint.
2.
Receiving coil SNR analysis:
The noise generated by the coil itself is mainly thermal noise produced by the resistance of the conductor. Since the coil is the first stage in the signal acquisition process, excessive noise can significantly degrade signal quality. The DC internal resistance of the receiving coil is as follows:
R   =   4 ρ R n R ( D   +   h R ) d w 2
In the equation, ρR is the resistivity of the central conductor of the wire used, with units of Ω·m; D is the diameter of the coil frame, with units of m; dw is the diameter of the inner core of the wire, with units of m. Combining with Equation (9), the thermal noise Vn of the receiving coil resistance is given by:
V n   =   4 k B T R   =   4 k B T ρ R n R D R d w
In the equation, DR = D + hR, where DR is the average diameter considering the stacking thickness of the coil layers, hR is the stacking thickness of the wire, kB is the Boltzmann constant with a value of 1.38 × 10⁻²³ W s/K, and T is the absolute temperature, with units of K. According to Equations (6) and (10), the SNR of the response signal, considering thermal noise from the coil’s internal resistance, can be calculated as follows:
S N R   =   V s V n   =   π 16 d w k B T ρ R n R D R 3 2 d B / d t
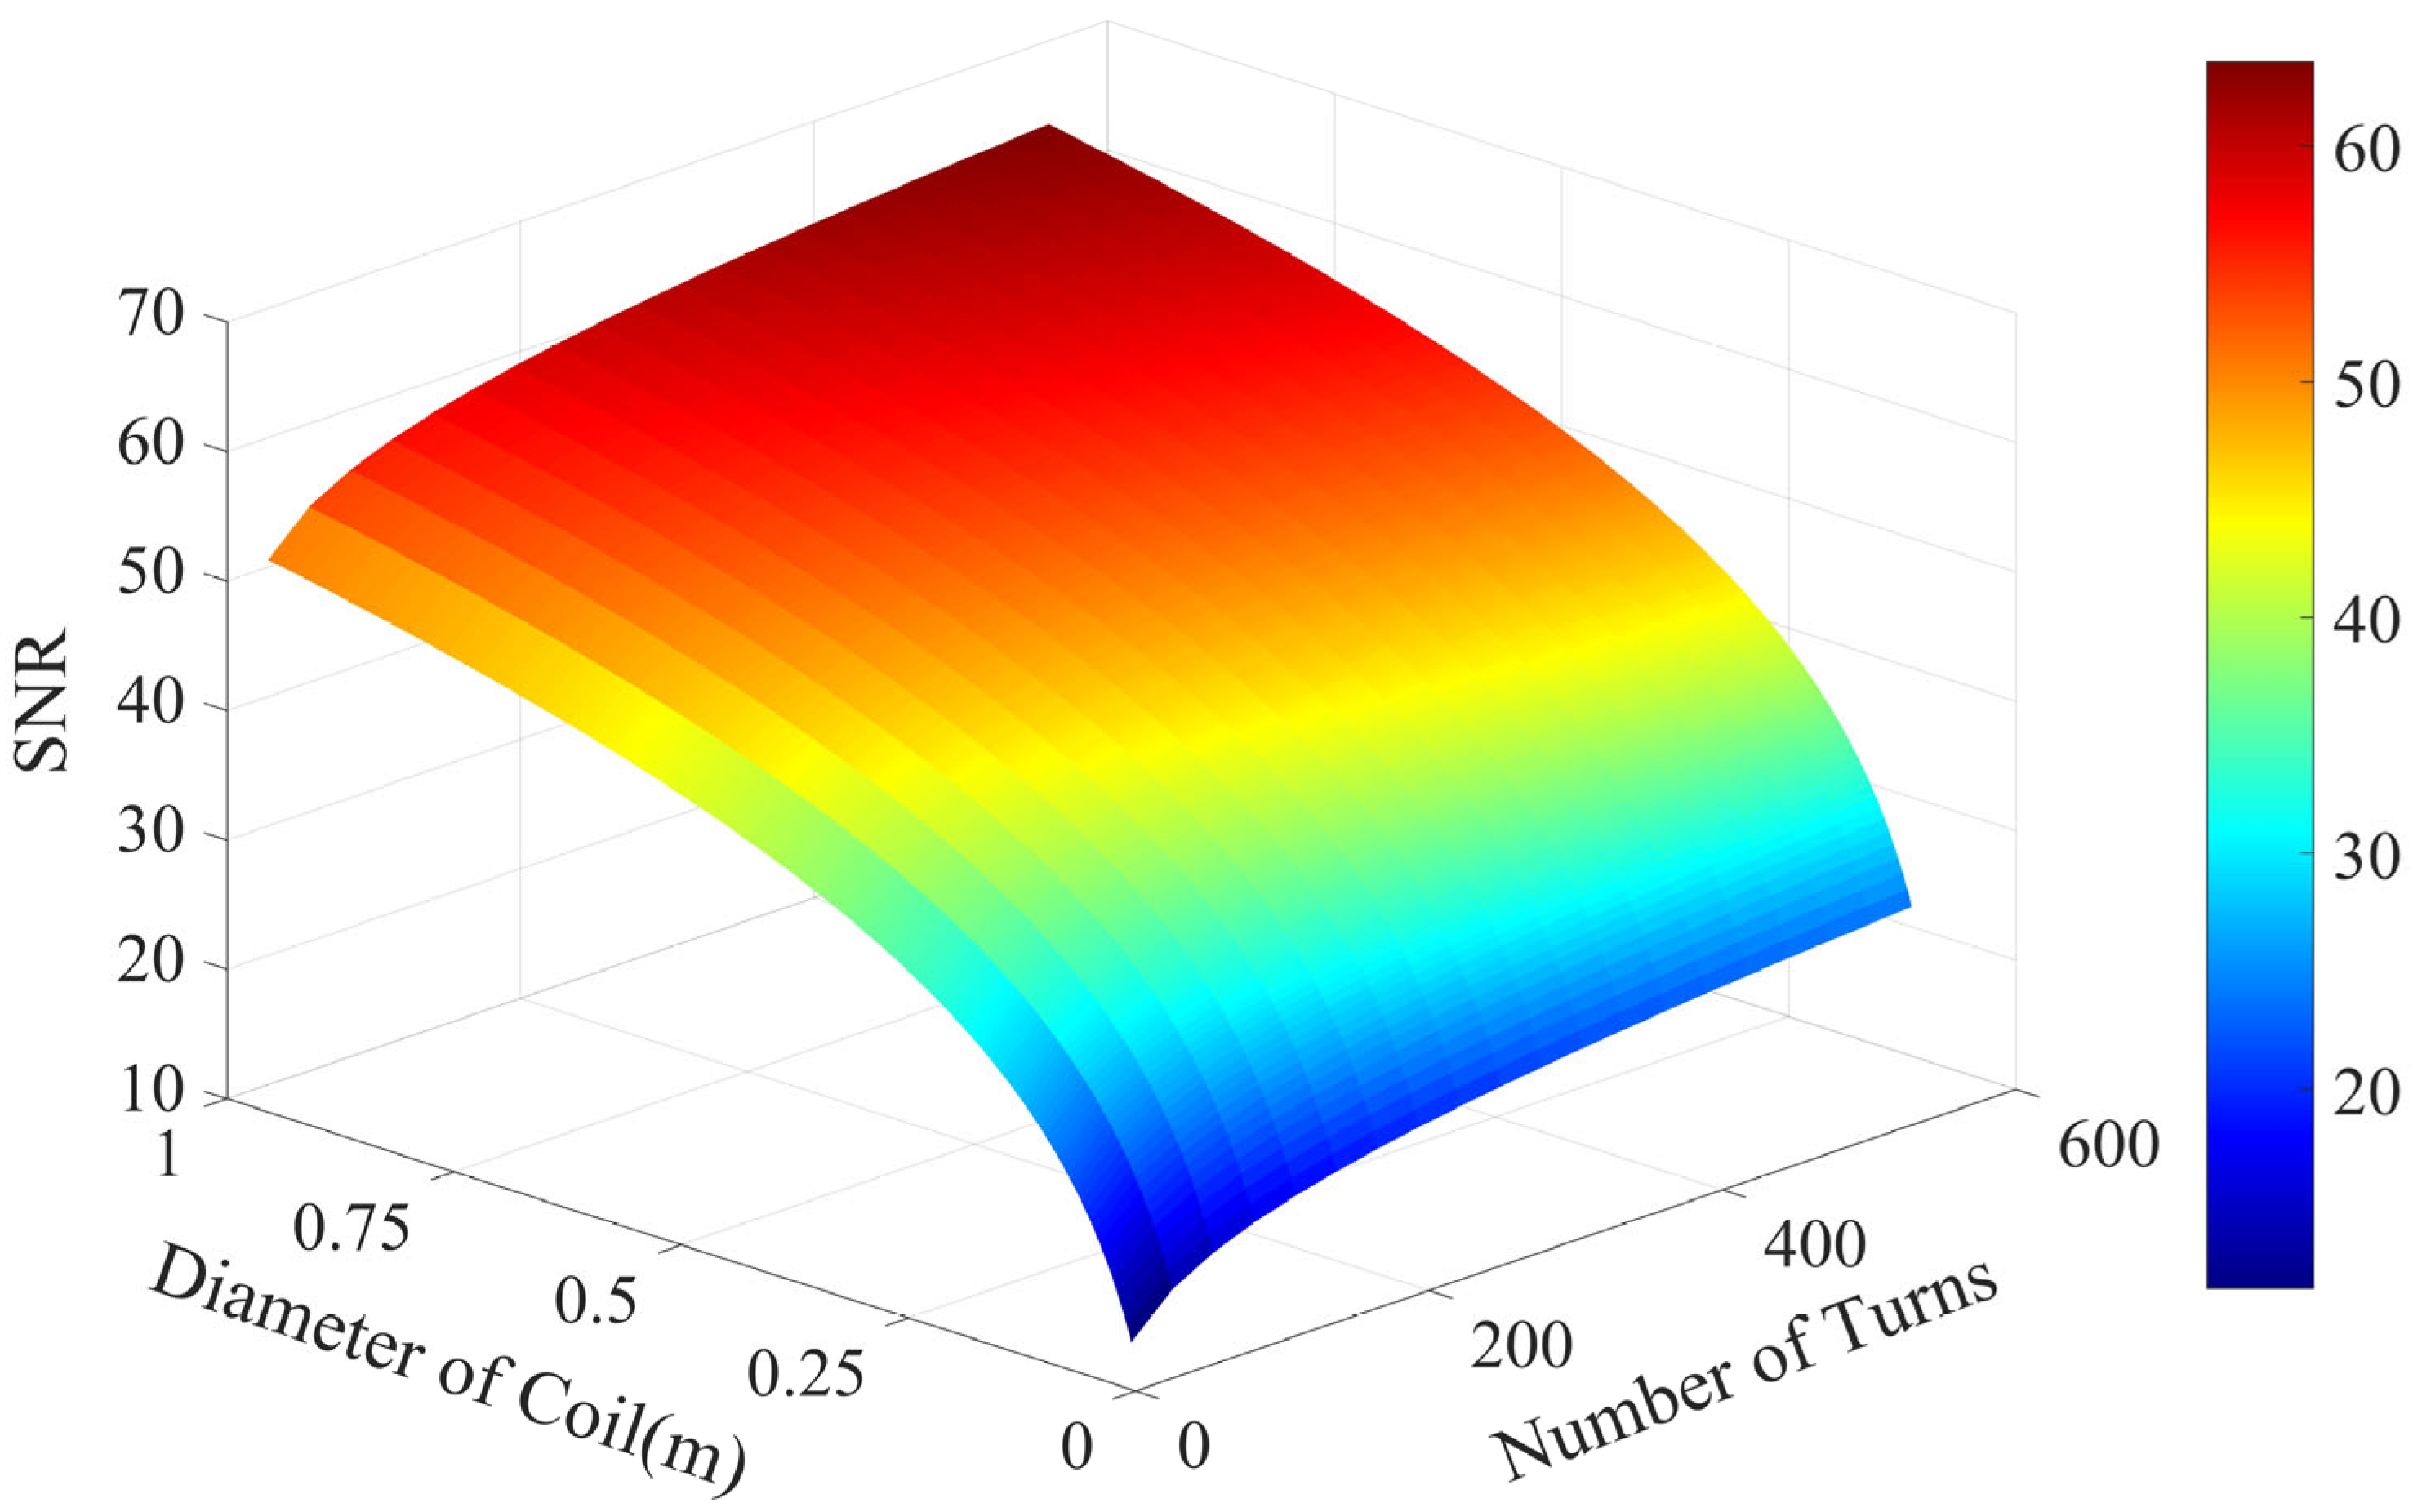
At room temperature, the resistivity of the wire is determined. According to the Equation (11), when the wire diameter and winding method are fixed, the SNR of the coil is only related to the number of turns nR and the average diameter of the coil DR. To ensure the ability of the receiving coil sensor to capture signals, the rate of change of the magnetic field induction intensity is set to 1 nT/s. The relationship between the SNR and the number of turns and average coil diameter is calculated, as shown in Figure 2. The resistivity of the wire used is R = 2.35 × 10⁻⁸ Ω·m, and the inner diameter of the wire is dw = 0.66 × 10⁻³ m. As can be clearly seen from the figure, increasing the number of turns or the average diameter of the coil both cause the thermal noise voltage to increase. However, overall, the SNR improves as the equivalent area increases.
3.
Receiving coil resonance frequency analysis:
The self-inductance and distributed capacitance of the coil produce inductive reactance and capacitive reactance, respectively. Under the influence of an AC signal, the coil exhibits pure resistive behavior, and resonance occurs when the inductive reactance and capacitive reactance cancel each other out. Therefore, the resonance frequency depends only on the self-inductance and distributed capacitance, and follows the relationship shown below:
1 f 0   =   2 π L C
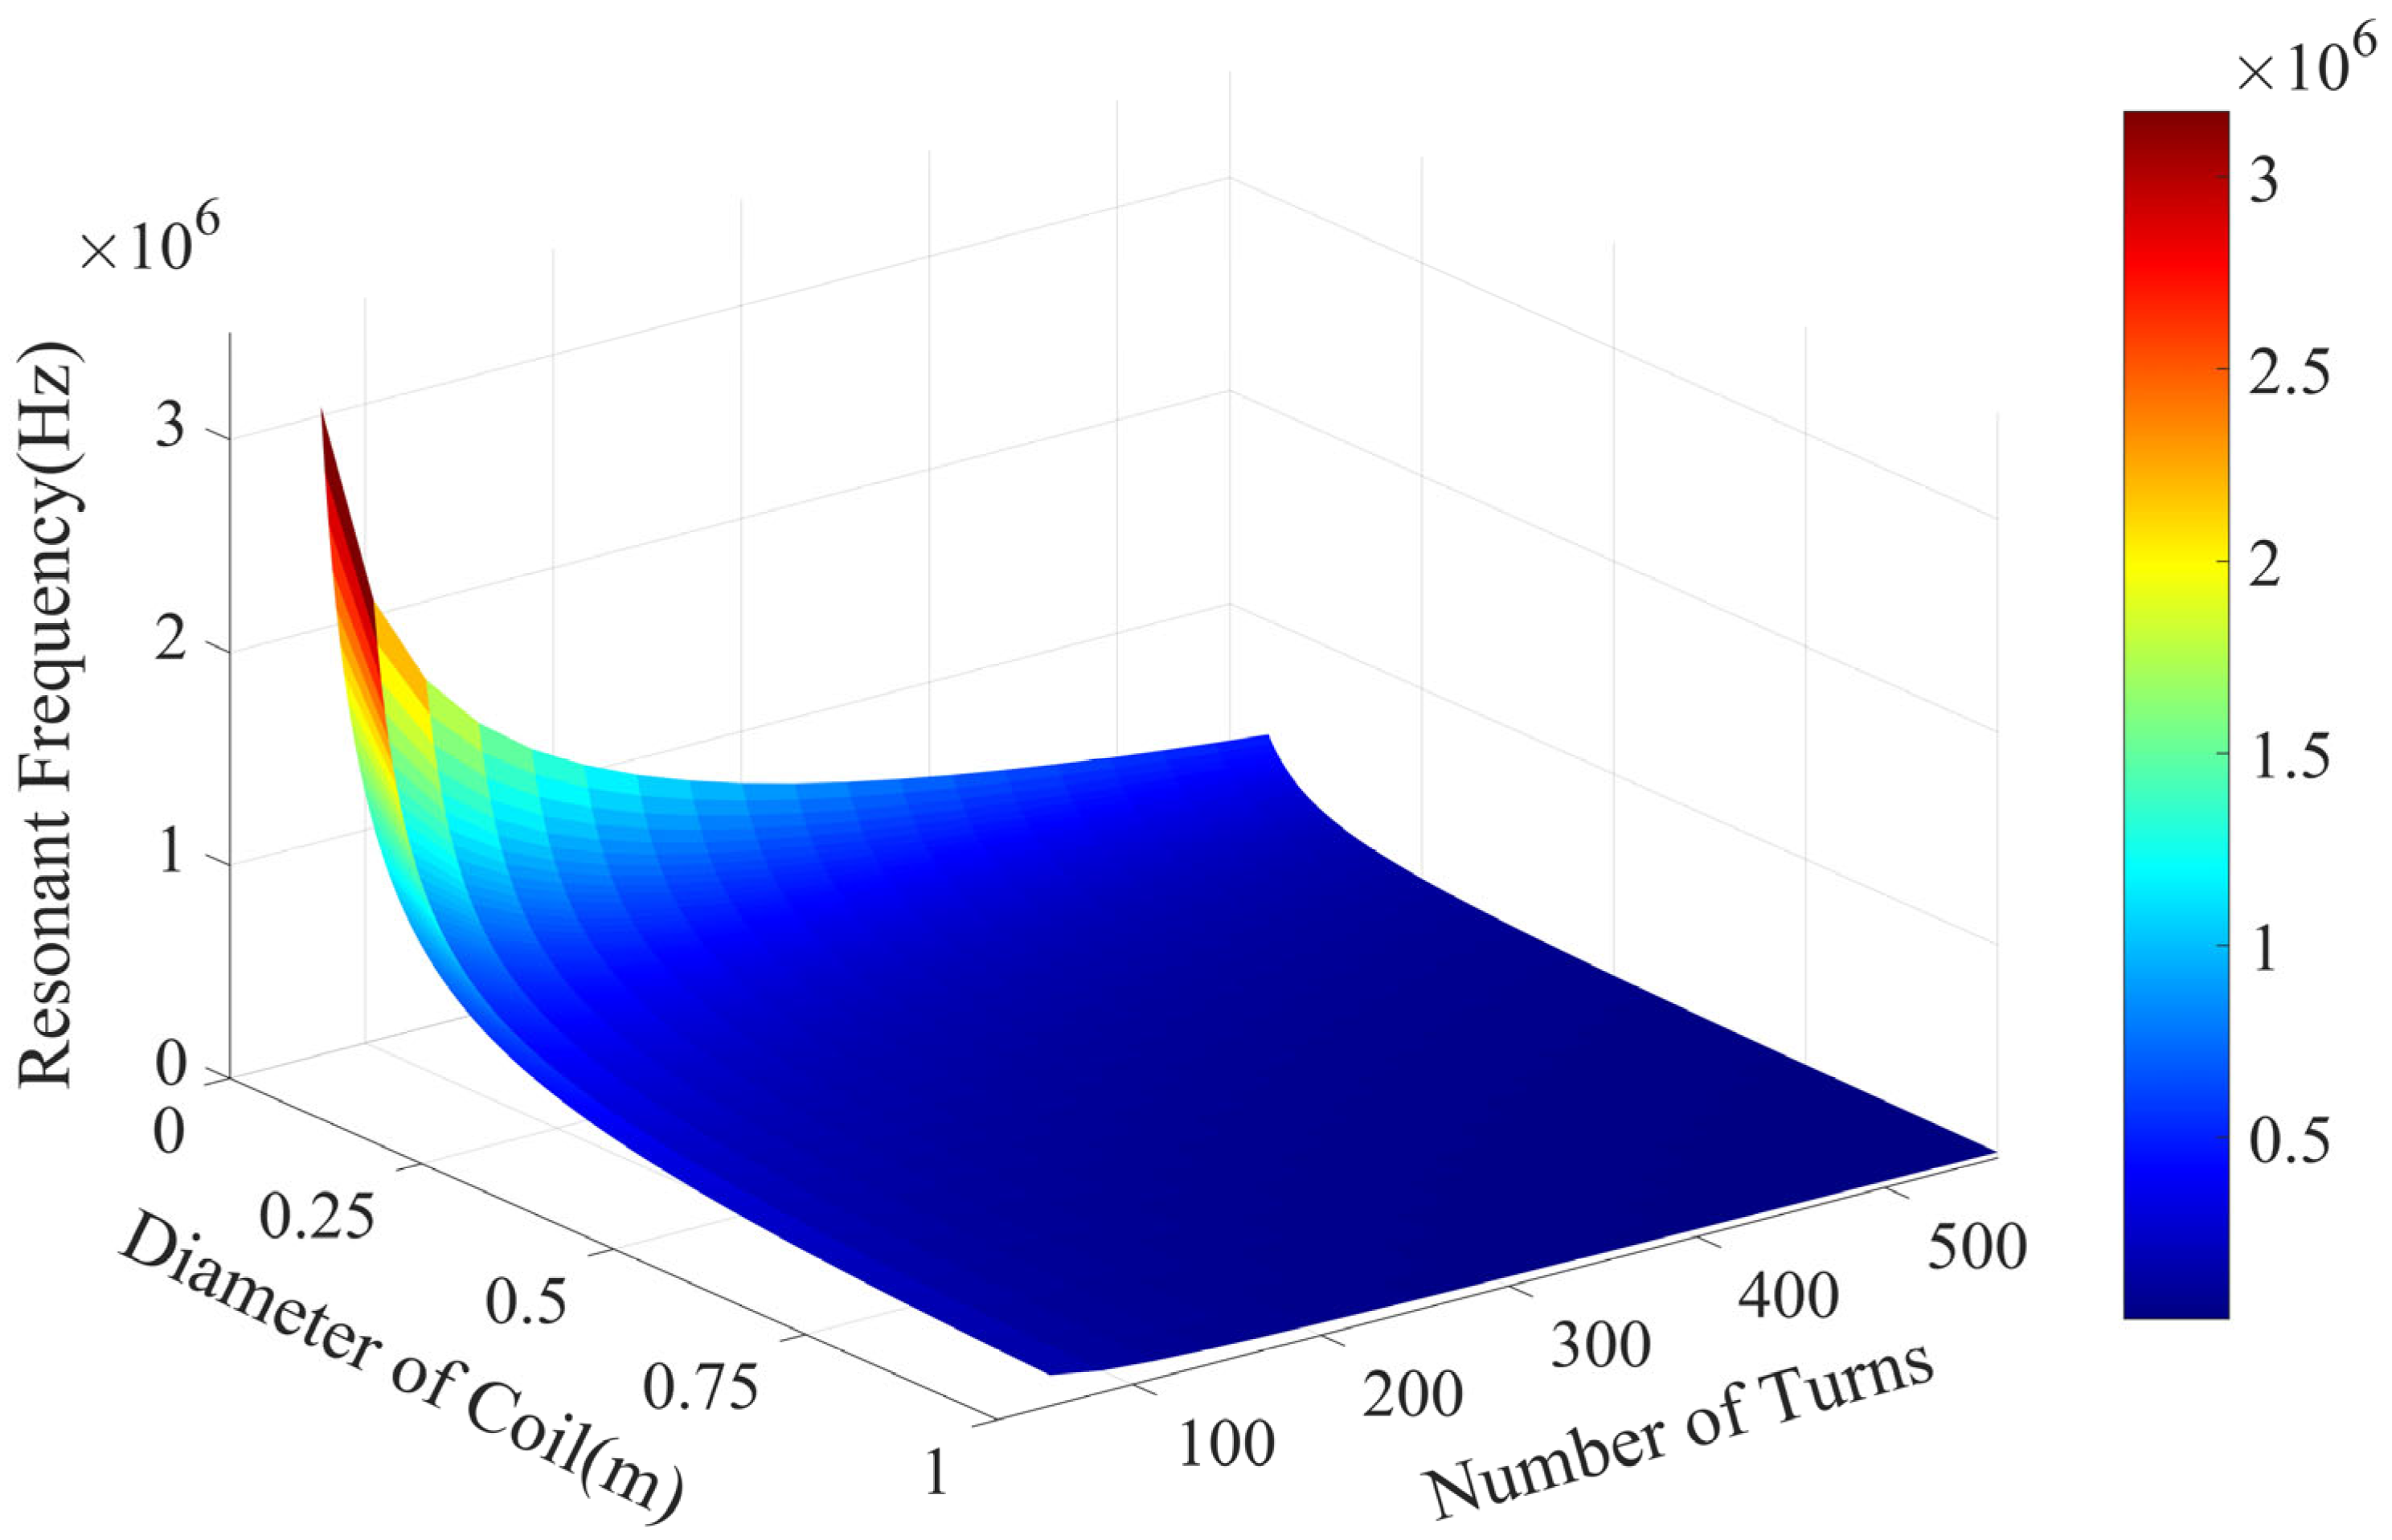
Using an empirical formula that combines the coil’s self-inductance and distributed capacitance, with the relative dielectric constant εp = 5 of the wire insulation film, the relative permittivity of the nylon skeleton εn = 3, the thickness of the insulation layer between the wires δ0 = 0.3 mm, the interlayer distance δ1 = 0.5 mm, and the width between the skeleton slots e = 4 mm, the relationship between the coil’s resonance frequency, the number of turns, and the average coil diameter is obtained, as shown in Figure 3.
The coil’s resonance frequency corresponds to the sensor’s bandwidth. A wider bandwidth allows the sensor to capture a more complete signal. To enhance the shallow detection capability of the small-loop TEM, the coil sensor’s bandwidth must be greater than 100 kHz. Based on this analysis, the sensitivity and SNR of the coil are mutually constrained by the bandwidth. Considering the detection performance of the small-loop TEM for shallow layers, this paper selects 128 turns for the receiving coil with a radius of 0.2 m. Based on the principles of small-loop TEM and practical testing experience, while ensuring sufficient transmission magnetic moment and facilitating detection in narrow spaces, the transmitting coil is designed with 12 turns and a radius of 0.5 m.
Based on the analysis above, we developed simulation models to calculate the mutual inductance values between the transmitting and receiving coils. The radius of the transmitting coil RT is set to 0.5 m, and the radius of the receiving coil RR is set to 0.2 m; the number of turns of the transmitting coil NT is 12, and the number of turns of the receiving coil NR is 128; the wire diameter of the transmitting coil eT is 4.4 × 10⁻³ m, and the wire diameter of the receiving coil eR is 0.66 × 10⁻³ m. The center of the transmitting coil is taken as the origin, and the horizontal offset of the receiving coil L is set to range from 0 to 1 m, with a sampling interval of 0.02 m; vertical offset H ranges from 0 to 0.4 m, with a sampling interval of 0.01 m. A total of 2000 positional mutual inductance values were calculated. Using the sampling statistics method, we analyzed the 10 locations with the smallest mutual inductance values to assess robustness. The magnitudes and corresponding locations of these 10 mutual inductance values are presented in Table 1.

2.2. Robustness Analysis Based on Statistical Methods

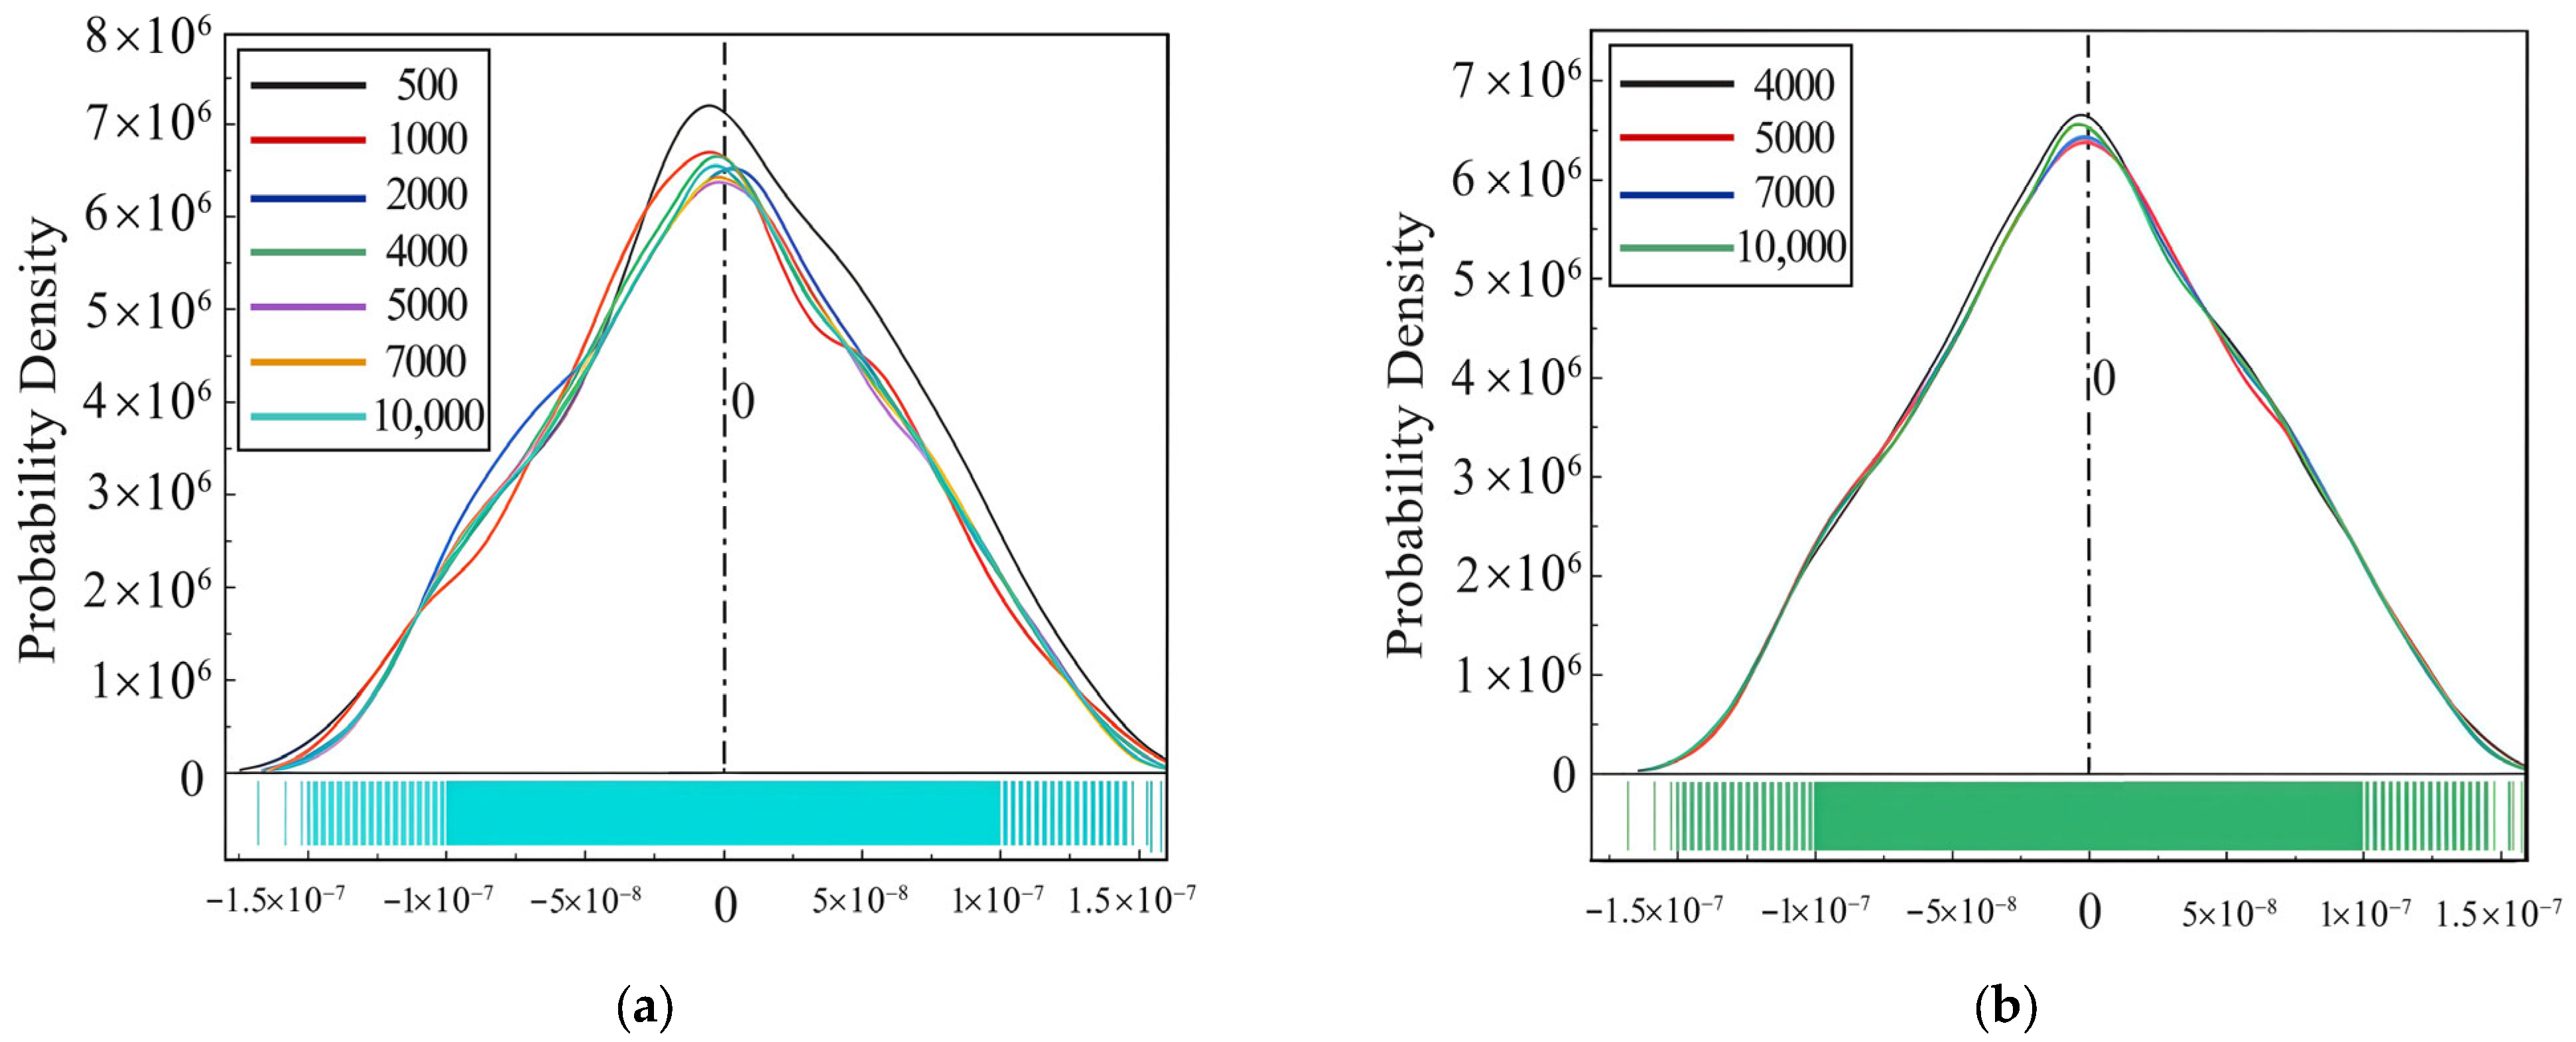
First, we determined the number of the sampling times N. In the eccentric self-compensating structure described in Section 2.1, there are 10 parameters: the number of turns of the two coils RT and RR; the outer diameters of the wires eT and eR; the angles of rotation α, β, γ, and the three-direction offset distances of Lx, Ly, and Lz. These parameters are sampled n times, generating random values following a normal distribution for the analysis. We selected position 7 (L = 0.76 m, H = 0.37 m), which was sampled 500 times, 1 k times, 2 k times, 4 k times, 5 k times, 7 k times, and 10 k times.
As shown in Figure 4a, the probability density distributions of the seven experimental instances with sampling times of 500–10 k times are messy and irregular compared to each other, yet these are different upward and downward trends, and there is a large gap between the peaks. As shown in Figure 4b, the upward and downward trends of the probability density distribution curves are almost identical with each other when the sampling times are more than 4 k times and there is not much difference between the peaks. To further verify this result, we used the Kolmogorov–Smirnov test which is a goodness-of-fit test to validate it two by two. The test results are shown in Table 2.
Groups M, N, P, and Q represent the probability distributions of 4 k, 5 k, 7 k, and 10 k samples, respectively. The D-value is the maximum difference between the two empirical distribution functions, and the Z-value is the test statistic of the K-S test for the two samples. It can be found that the asymptotic probabilities > |D| between the two distributions are all close to 1, indicating that, at the 0.05 level, there is no significant difference among the four distributions. Therefore, considering computational efficiency and time constraints, the final number of samples for each group was set to be 4000.
Based on the number of samples, the mutual inductance was statistically calculated for 10 locations. The central parameters of the transient electromagnetic device were consistent with the model constructed in Section 2.1. The remaining parameters are taken as follows:
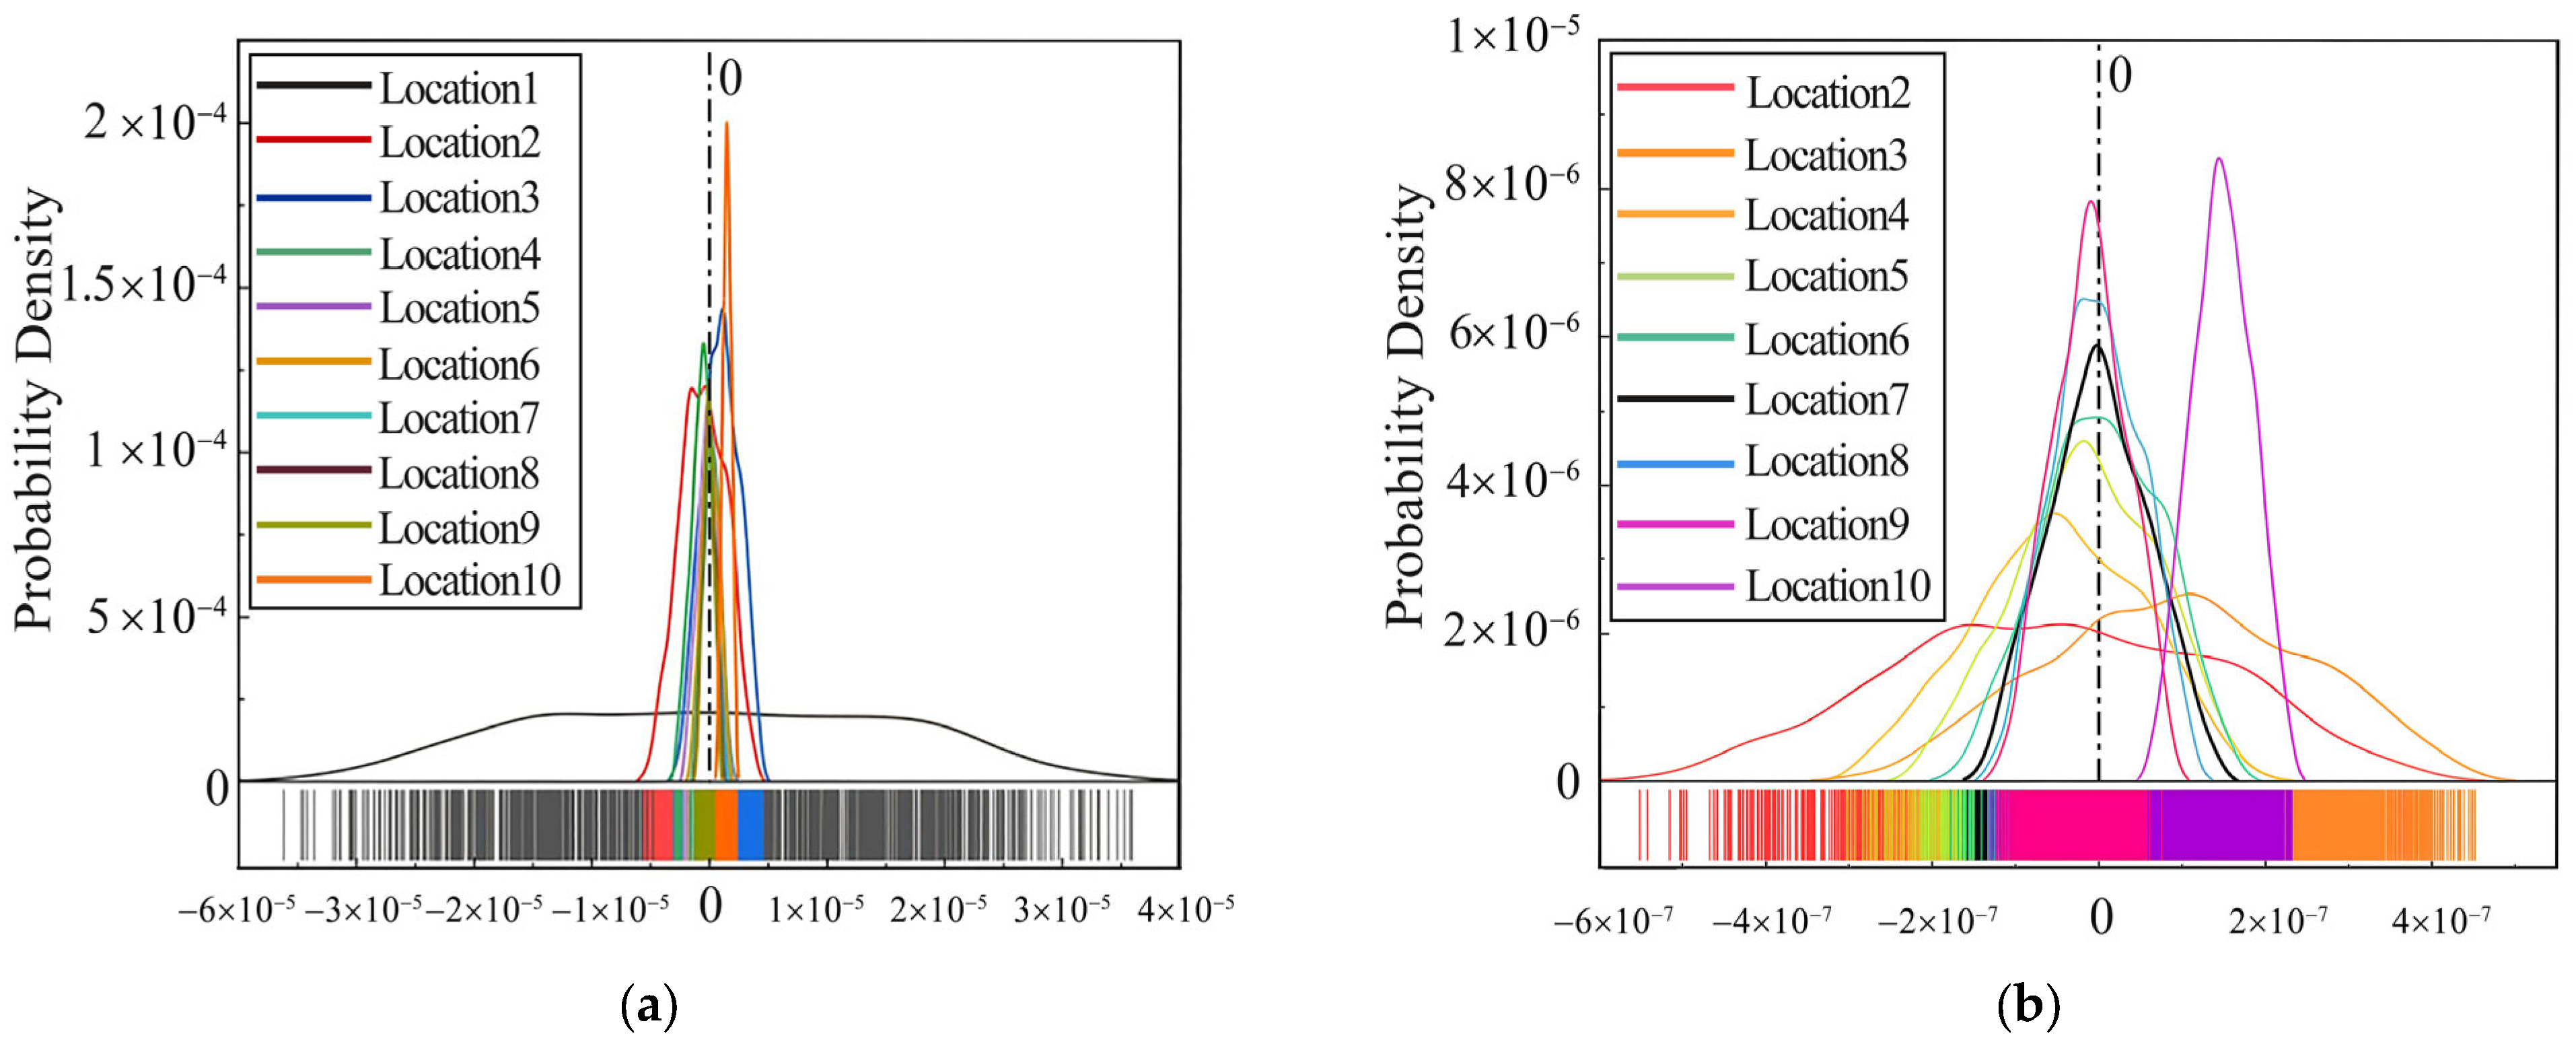
The radius of the transmitting–receiving coil is represented by a 4000 × 1 matrix of random numbers following a normal distribution, with the theoretical radius as the mean and 0.003 m/3 as the standard deviation; The outer diameter of the transmitting–receiving coil wire is a 4000 × 1 matrix of random numbers following a normal distribution, with the theoretical outer diameter as the mean and the theoretical outer diameter value as the standard deviation. The angle of rotation of the transmitting coil around the XY axis is a 4000 × 1 matrix of random numbers following a normal distribution with 0 as the mean and 5/360*2*pi/3 as the standard deviation; The XZ axis offset distance of the receiving coil is a 4000 × 1 random array that follows a continuous uniform distribution of values taken in a closed interval of plus or minus 5 mm on the horizontal and vertical offsets of position “n”; The Y axis offset distance of the receiving coil is a 4000 × 1 random array that follows a continuous uniform distribution of values taken in a closed interval with 0 as the center amount plus or minus 5 m. Based on the parameters above, 4000 sets of mutual inductance values are obtained for each location, and their probability density distribution images are plotted, respectively, as shown in Figure 5a. The probability density distribution of the data at location 1 obviously does not follow a normal distribution and differs significantly from other data sets. Therefore, only the data from locations 2 to 10 are analyzed and processed, as shown in Figure 5b.
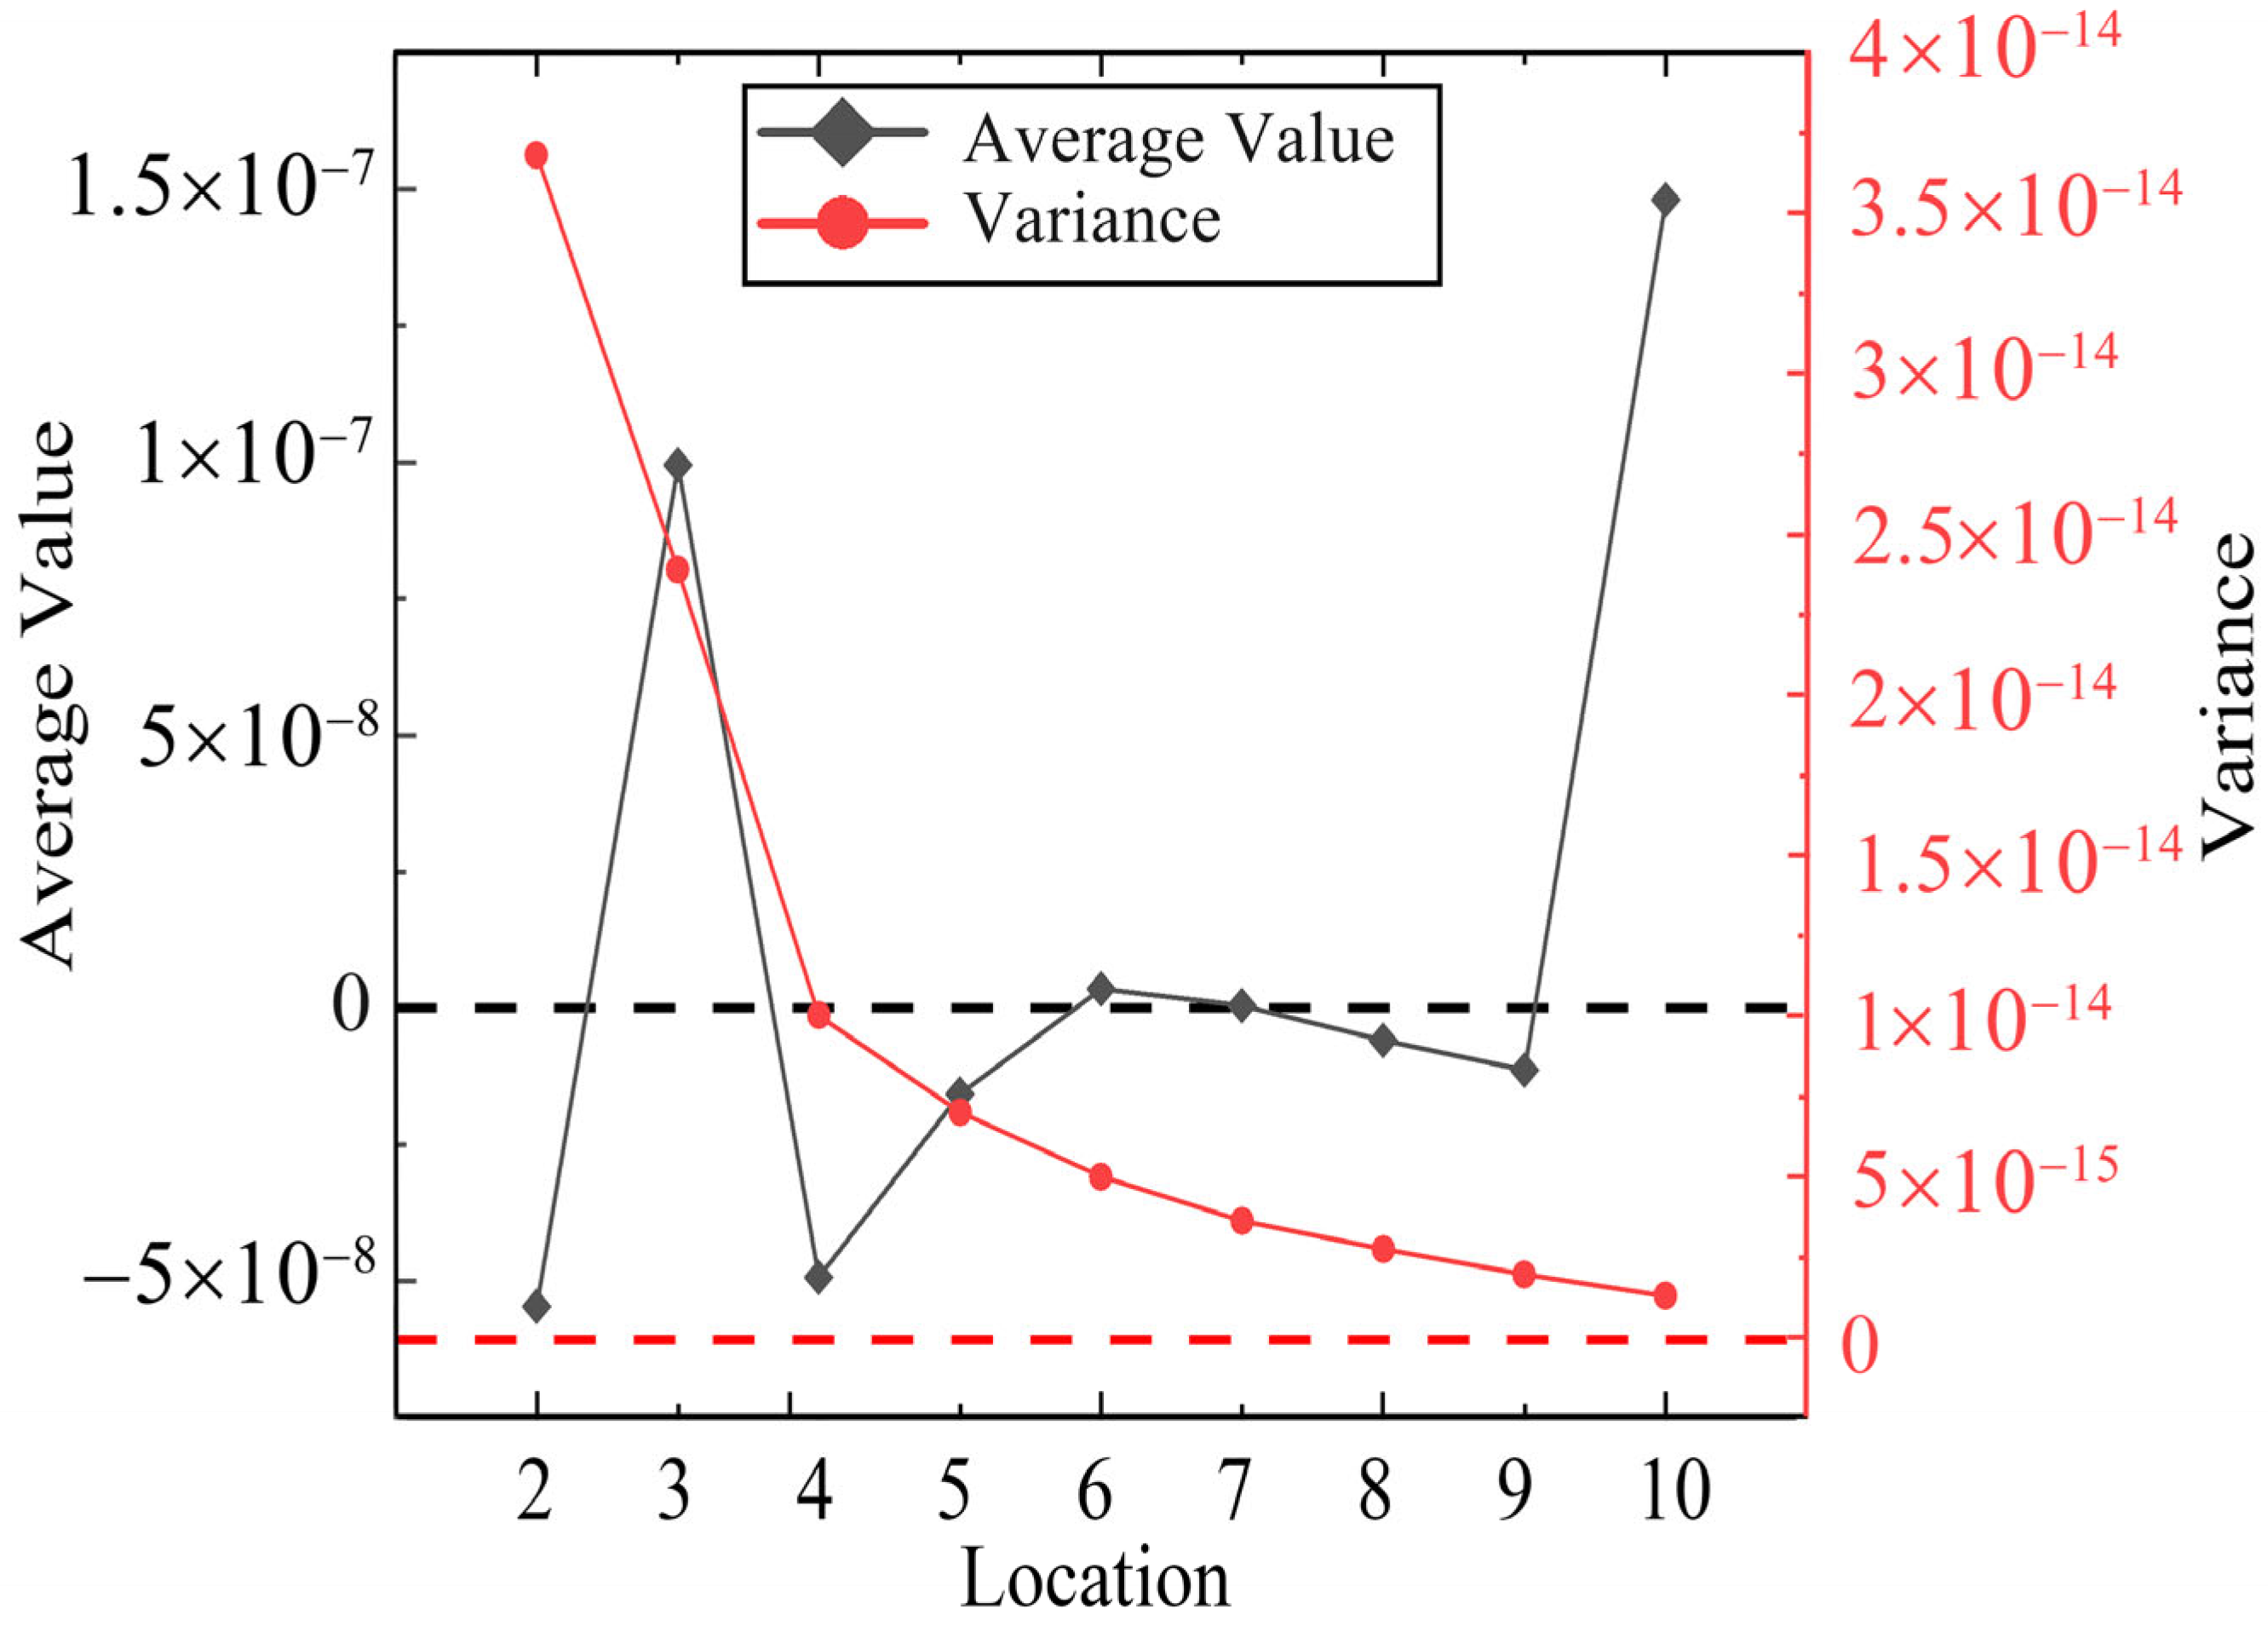
The mean and variance are calculated and compared, as shown in Figure 6. Although location 10 has the smallest variance, its mean value is obviously too large and not close to zero. The variances at locations 2 to 6 are not ideal, and their mean values are not optimal. The mean and variance at locations 7, 8, and 9 are similar to each other, these mean values are close to zero, and the variances are very small. When no error is considered, the mean value and the mutual inductance coefficient at location 7 are theoretically the smallest. Additionally, since the closer the receiving coil is to the ground, the larger the amplitude of the secondary field voltage induced by the geoid; we thus select location 7 as the final relative position of the transmitting and receiving coils for the eccentricity self-compensation. Its horizontal offset is 0.76 m, and its vertical offset is 0.37 m.
3. Double Receiving Coils Sensor Structure Design

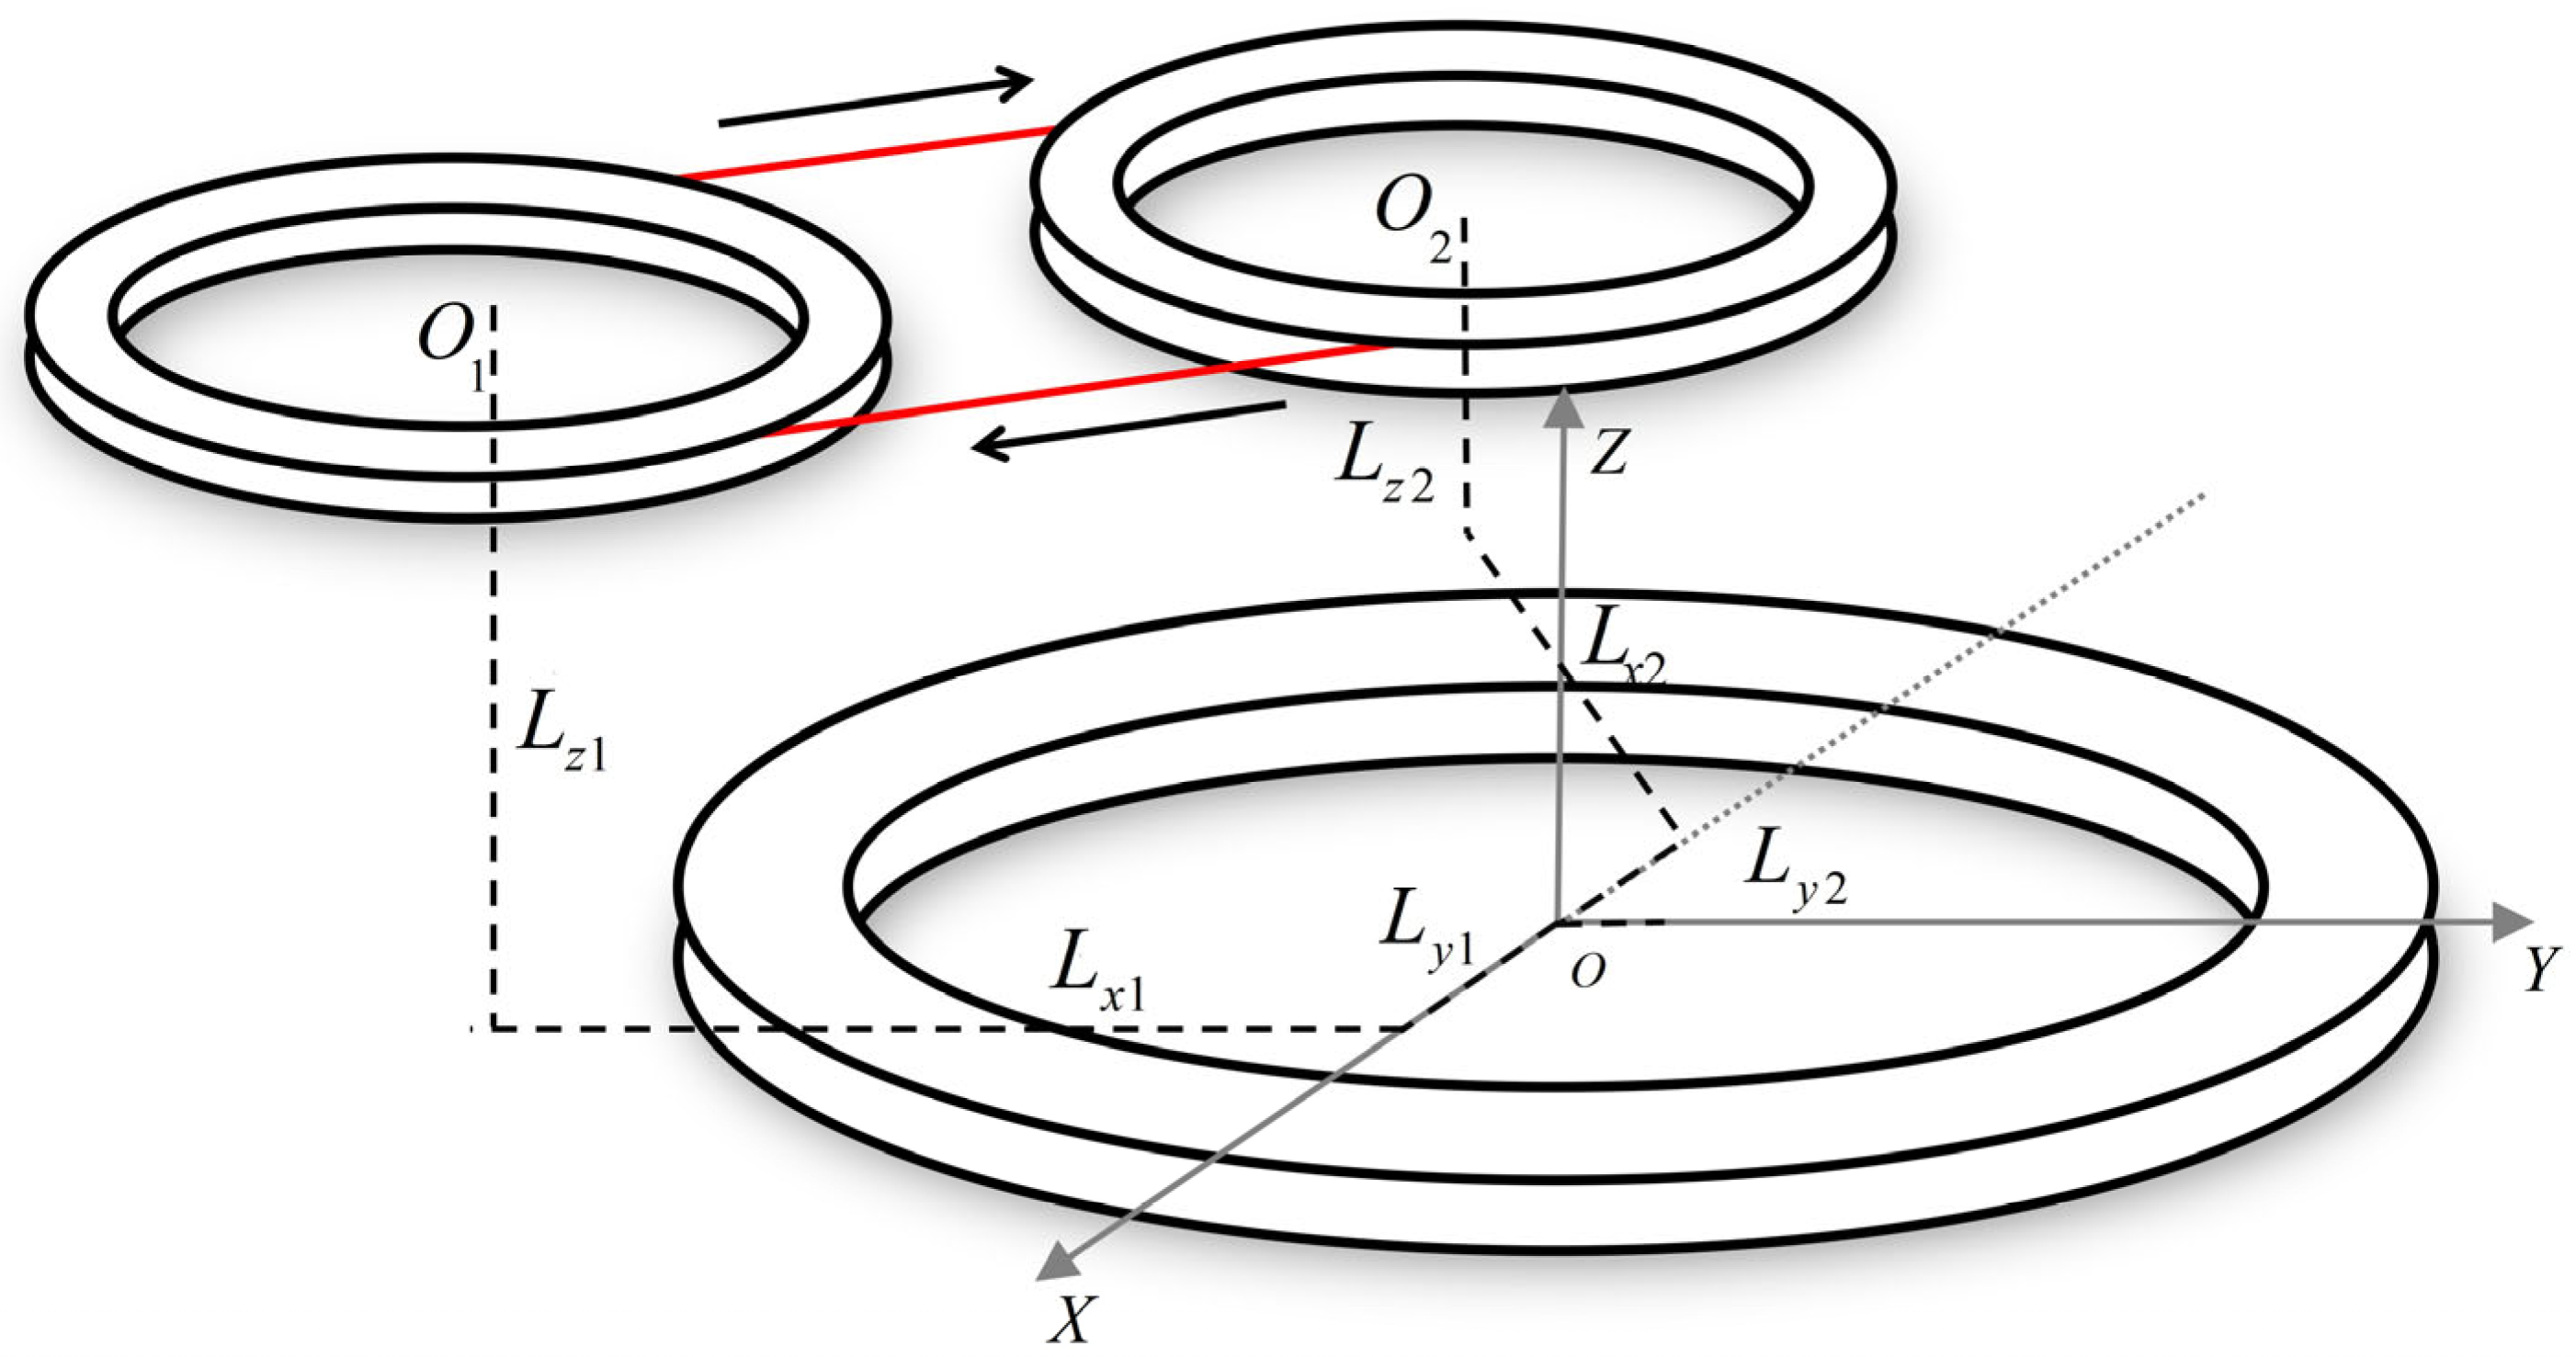
Based on the eccentric position determined in Section 2, we redesigned the conventional eccentric structure by increasing the single receiving coil to two receiving coils. The eccentric structure is shown in Figure 7. Both receiving coils are wound in the same direction, as indicated by the red line in Figure 7. According to the eccentric position calculations described above, the horizontal and vertical offsets of the two coils are set to the same values: the horizontal offsets Lx1 = Lx2 = L = 0.76 m, and vertical offsets Lz1 = Lz2 = H = 0.37 m. This configuration reduces the primary field interference caused by the transmitting current on each receiving coil, achieving an approximately zero primary field coupling.
According to the Biot–Savart law, the magnetic induction B generated by a current-carrying circular coil at any point P(x, y, z) in the space is as follows:
B   =   L d B   =   μ 0 4 π 0 L I d l   ×   r r 3 I d l   =   I R d α ( i sin α   +   j cos α ) r   =   ( x     R cos α ) i   +   ( y     R sin α ) j   +   x 2   +   y 2   +   z 2 cos θ k
where R is the radius of the current-carrying circular coil; I is the current flowing through the coil; μ0 is the vacuum permeability; Idl is the current element on the coil, which forms an angle of α with the X-axis in the forward direction; r’ is the vector leading from the current element Idl to the field point P; and θ is the angle between point P and the center of the circle in the vertical direction. For the eccentric self-compensating coil structure, only the magnetic field strength in the perpendicular z-direction is considered. The magnetic field strength BZ produced by the transmitting coil in a single receiving coil is given by the following:
B Z   =   d B z   =   μ 0 4 π 0 2 π I R ( R r sin θ cos α ) ( R 2   +   r 2     2 R r sin θ cos α ) 3 2 r   =   x 2   +   y 2   +   z 2
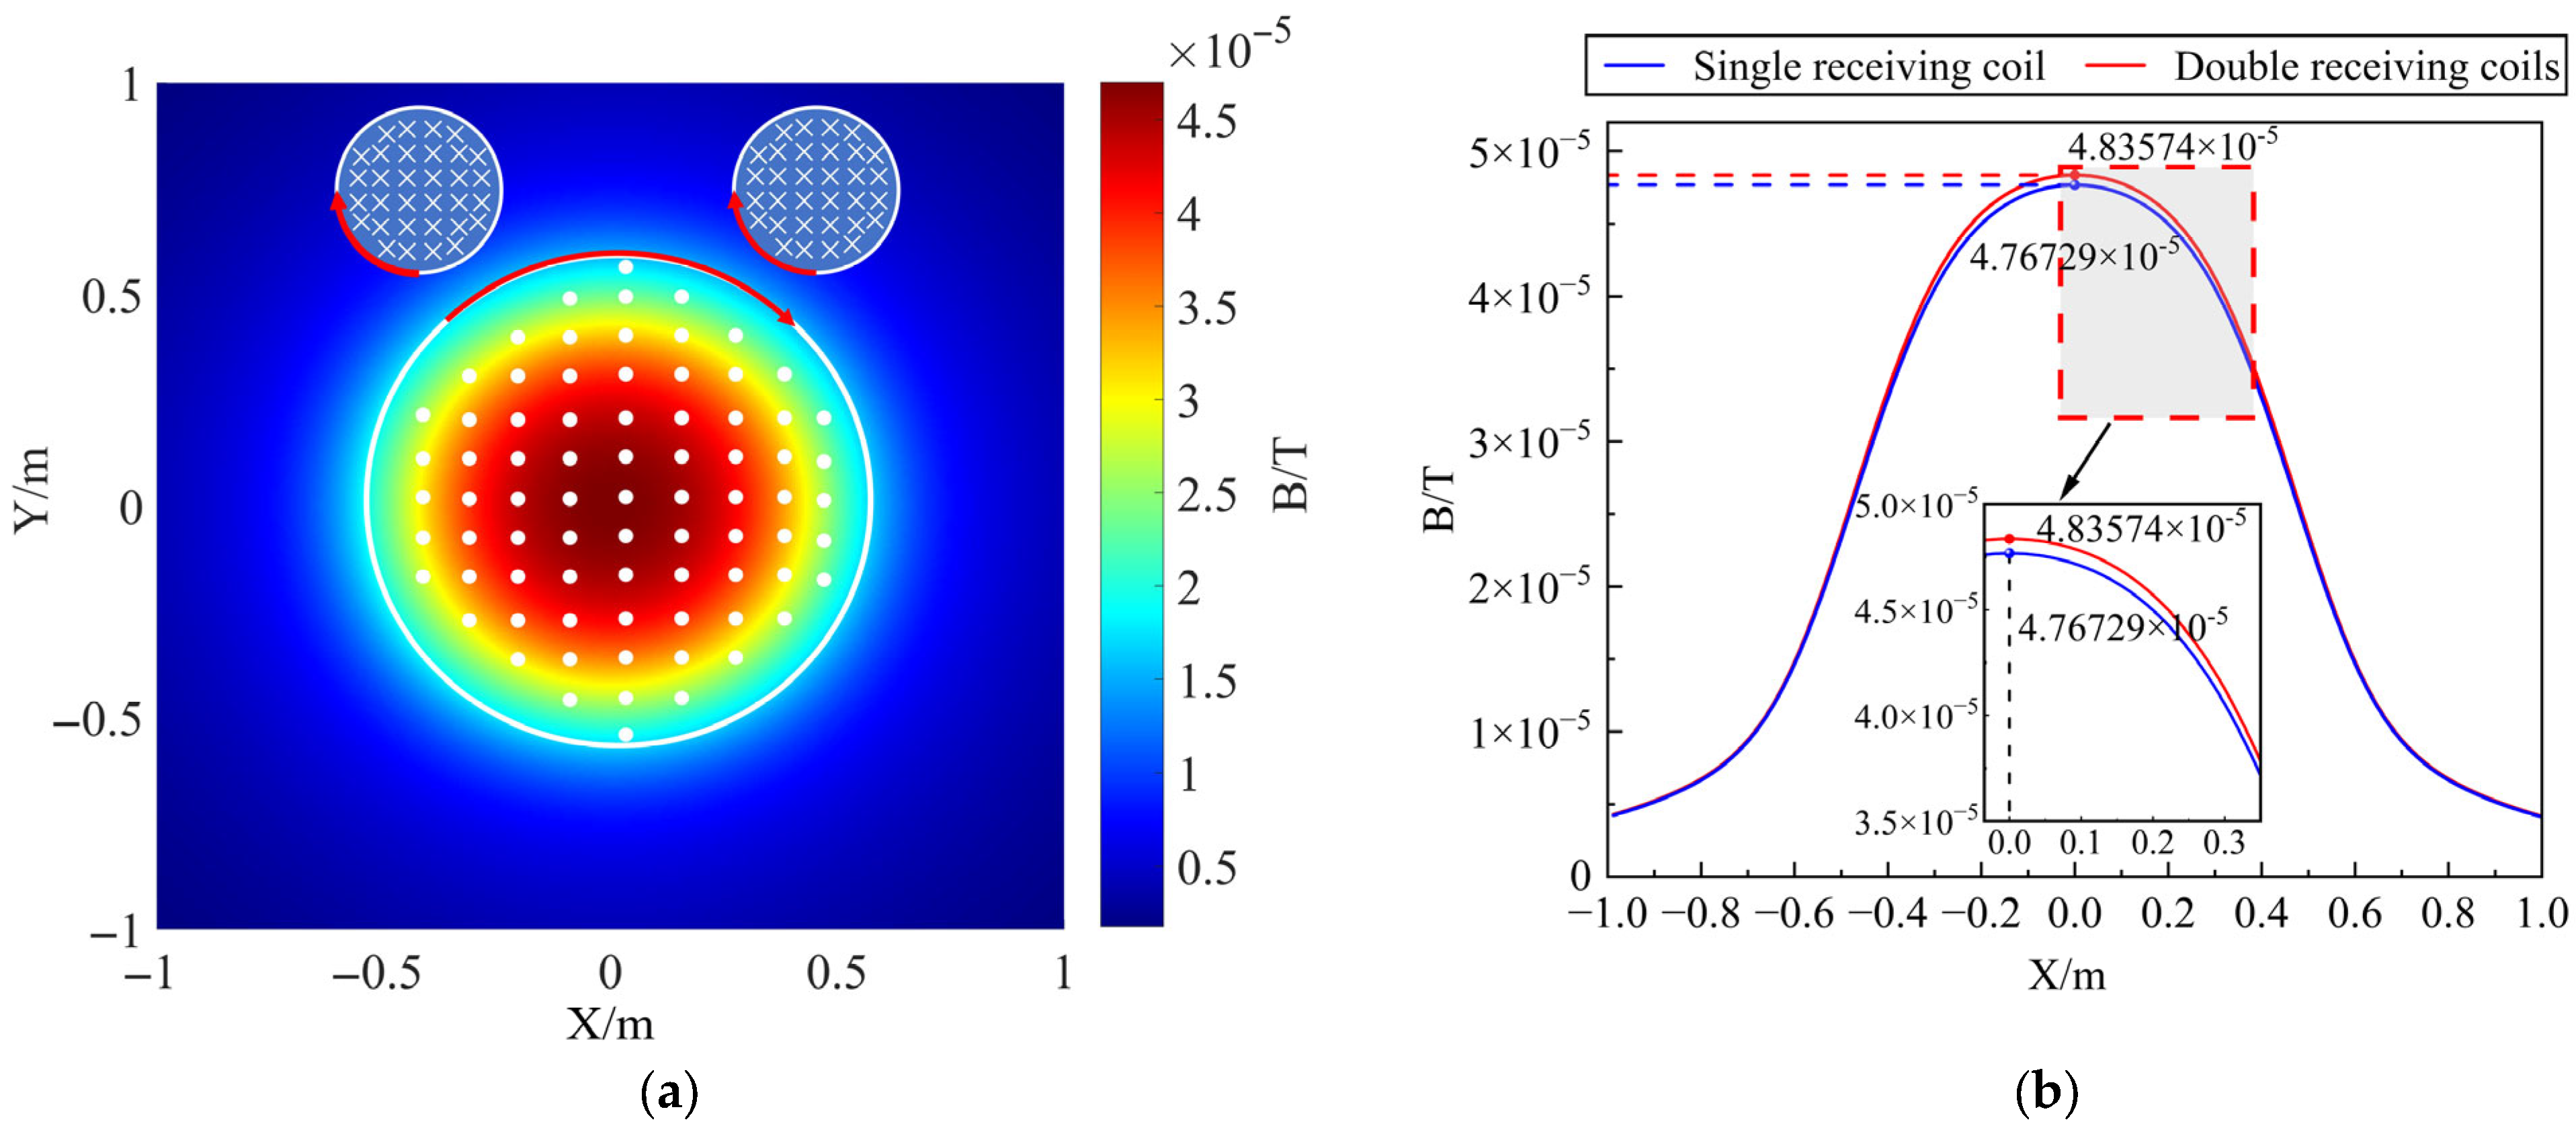
Since the two coils are wound in the same direction, the magnetic field strength generated by the transmitting coil at the receiving coils is the vector sum of the magnetic field strengths at each coil: BZ = Bz1 + Bz2, BZ1, and BZ2 are the magnetic field strengths of the transmitting coil passing through the two receiving coils, respectively. According to the calculation of the eccentric position in Section 2, the receiving coil is placed at 0.37 m from the center of the transmitting coil. When z = 0.37 m, according to Equations (13) and (14), the calculated magnetic field generated by the transmitting coil is shown in Figure 8. Figure 8a illustrates the magnetic field distribution of the transmitting coil around the two receiving coils when the current I = 3 A, the radius R of the transmitting coil is 0.5 m, and the number of turns is 12. In Figure 8b the blue and red lines represent the magnetic field strength generated at a single receiving coil and at double receiving coils, respectively. From the Figure, it can be observed that the vector sum of the magnetic field strengths of the double receiving coils is nearly the same as that of the single receiving coil, and the trend of the magnetic field variation is similar.
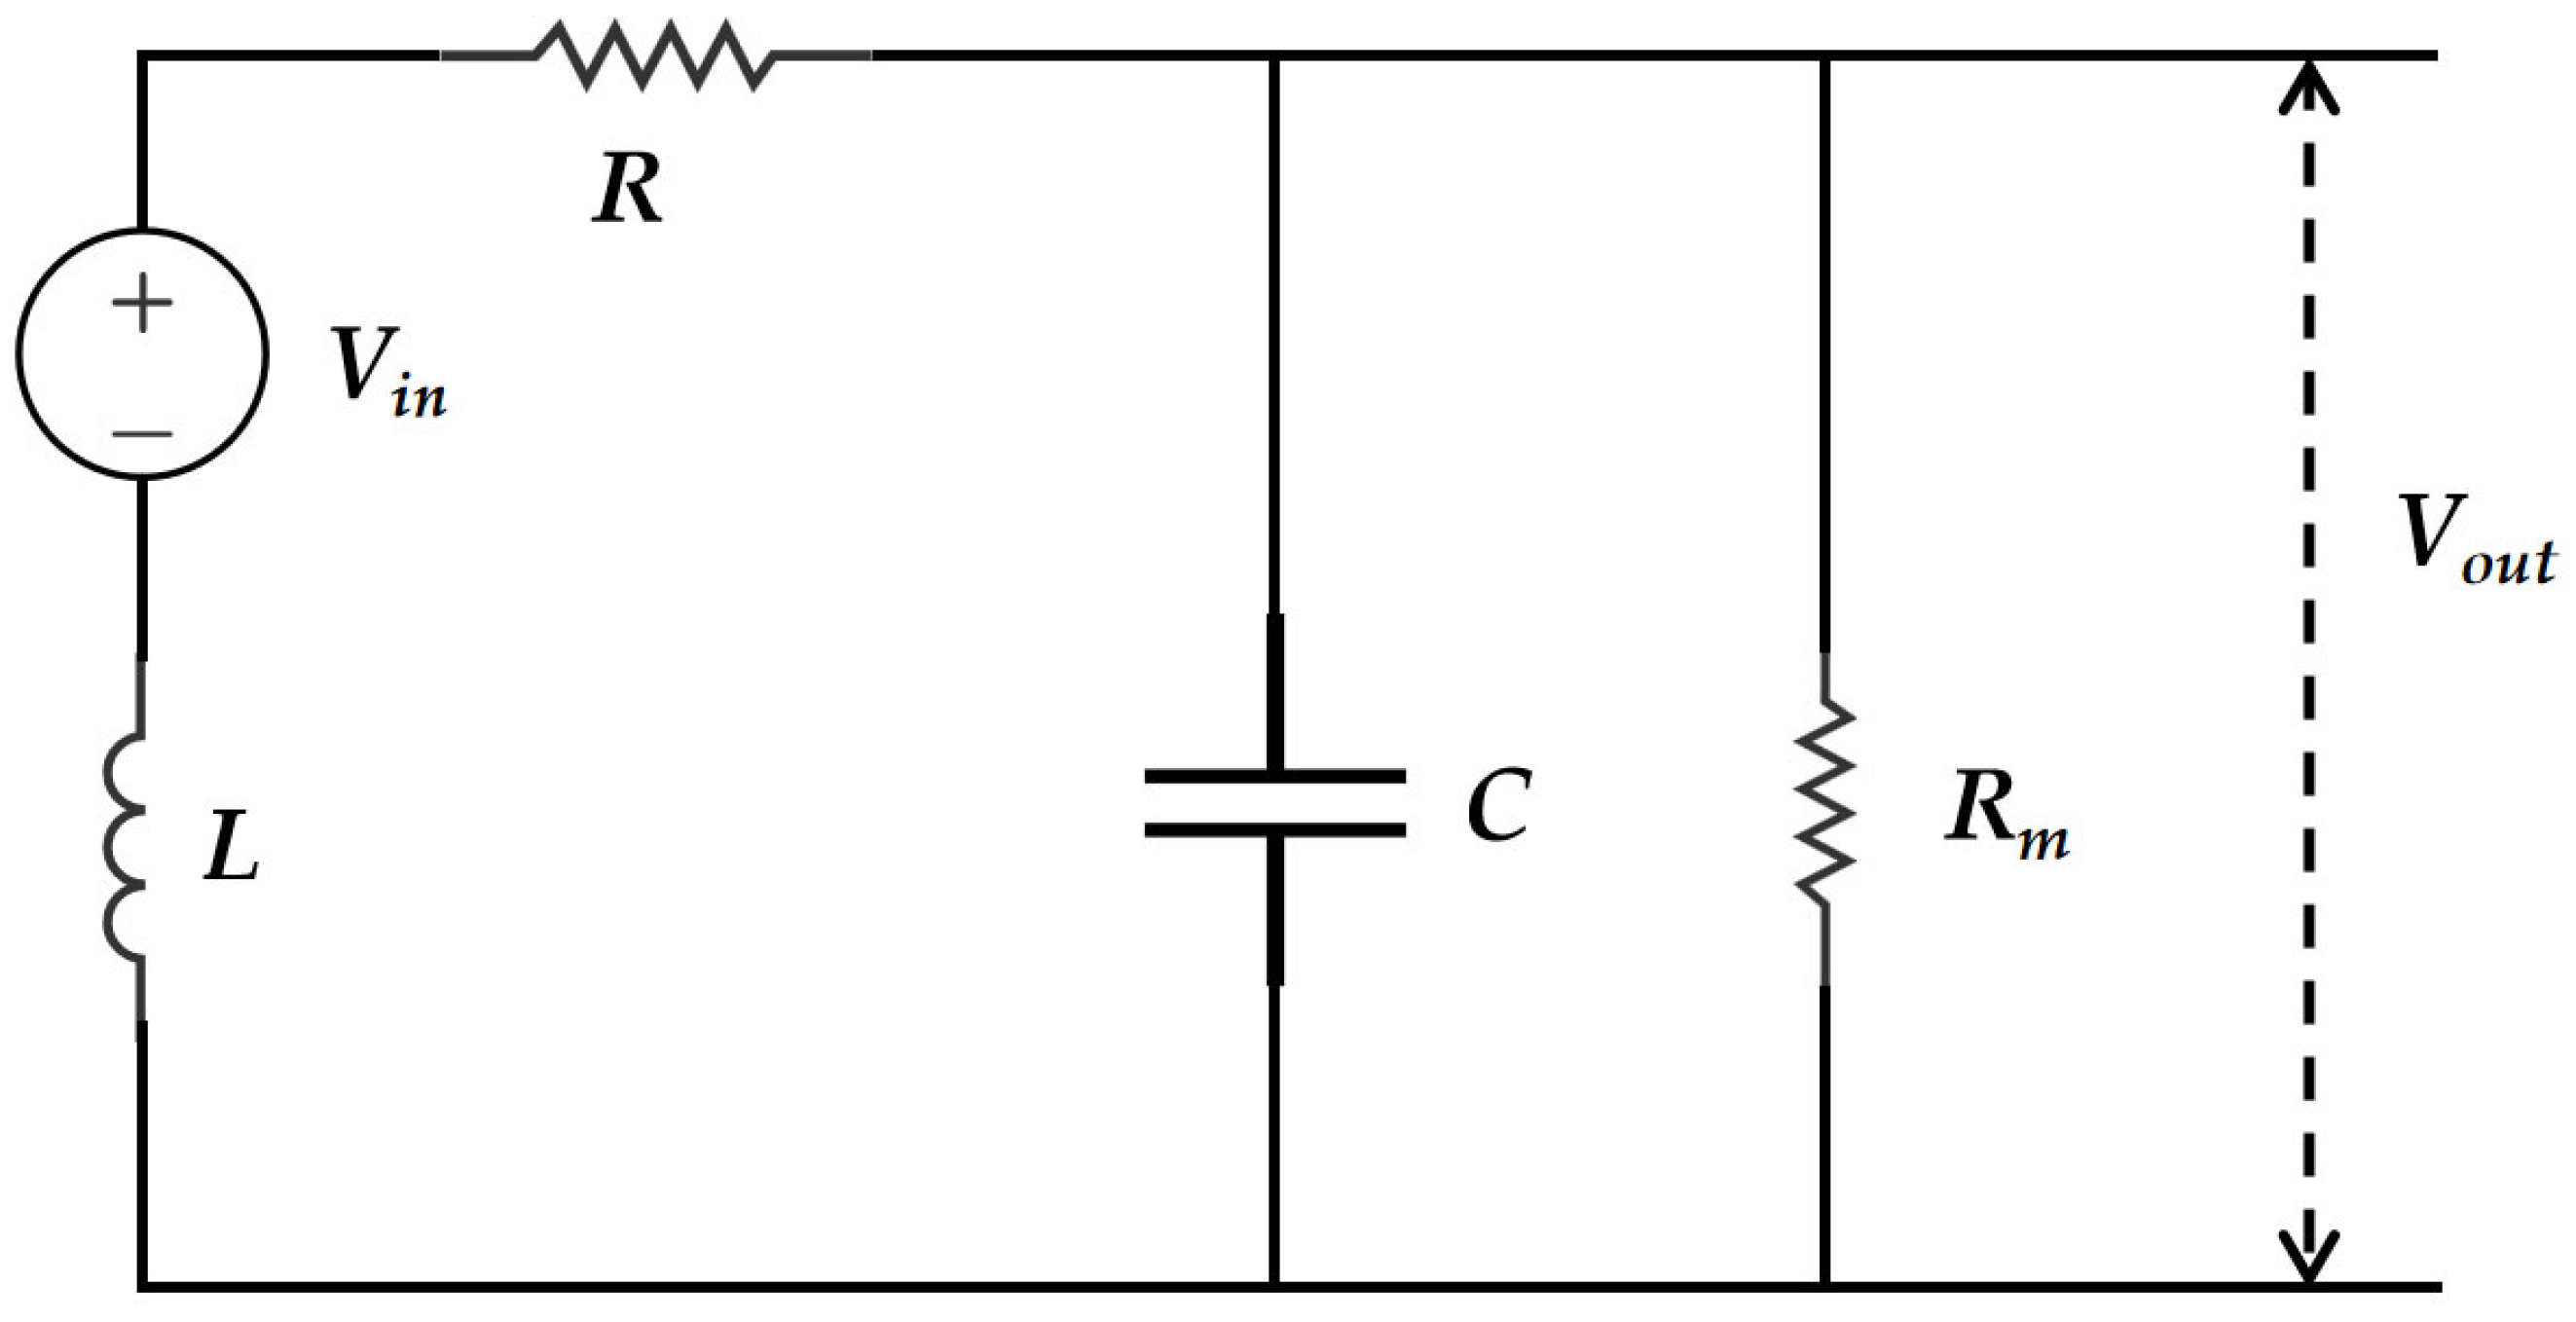
The Equation (7) illustrates the relationship between the output voltage of the receiving coil, the coil’s equivalent area, and the rate of change of the magnetic field strength. To enhance the coil’s responsiveness to the magnetic field, the equivalent area and the number of turns of the coil can be increased, assuming a constant frequency of change in the magnetic induction strength. This increase can raise the peak value of the secondary field response. The receiving coil equivalent circuit model is shown in Figure 9:
The receiving coil can be regarded as an ideal voltage source, R is own resistance, L is own inductance, and C is distributed capacitance. To modify the coil’s damping characteristic, a matching resistor Rm is typically connected in parallel across the coil terminals. However, due to the extrusion and stacking of the receiving coil produced during the winding process, the presence of distributed capacitance and self-inductance results in significant parasitic parameters, which limit the bandwidth of the receiving coil sensor. The transition process of the coil leads to a degradation in the integrity of the secondary field signal in the early stage, which reduces the shallow detection energy of the TEM. The transfer function and damping coefficient of the receiving coil are given by Equations (15) and (16). When the damping coefficient K < 1, the secondary field response oscillates, and no useful information about the geoid can be obtained from it. When the damping coefficient K > 1, the response cannot reach its peak, and both amplitude distortion and aberration increase as K increases. Therefore, we selected the resistance value of the matching resistance Rm under the critical damping at K = 1.
H   =   1 s 2 L C   +   s ( R C   +   L R m )   +   ( R R m   +   1 )
K   =   R m R C   +   L 2 L C R m ( R   +   R m )
According to the calculations in Section 2, we used 128 turns for the receiving coil sensor. We wound 128 turns on a single coil and on double receiving coils. Then we used an LCR digital bridge meter to take 10 measurements and calculated standard error of the mean (SEM) of the measurements. We combined them with Equation (12) to derive each parameter of single and double receiving coils sensor, as is shown in Table 3:
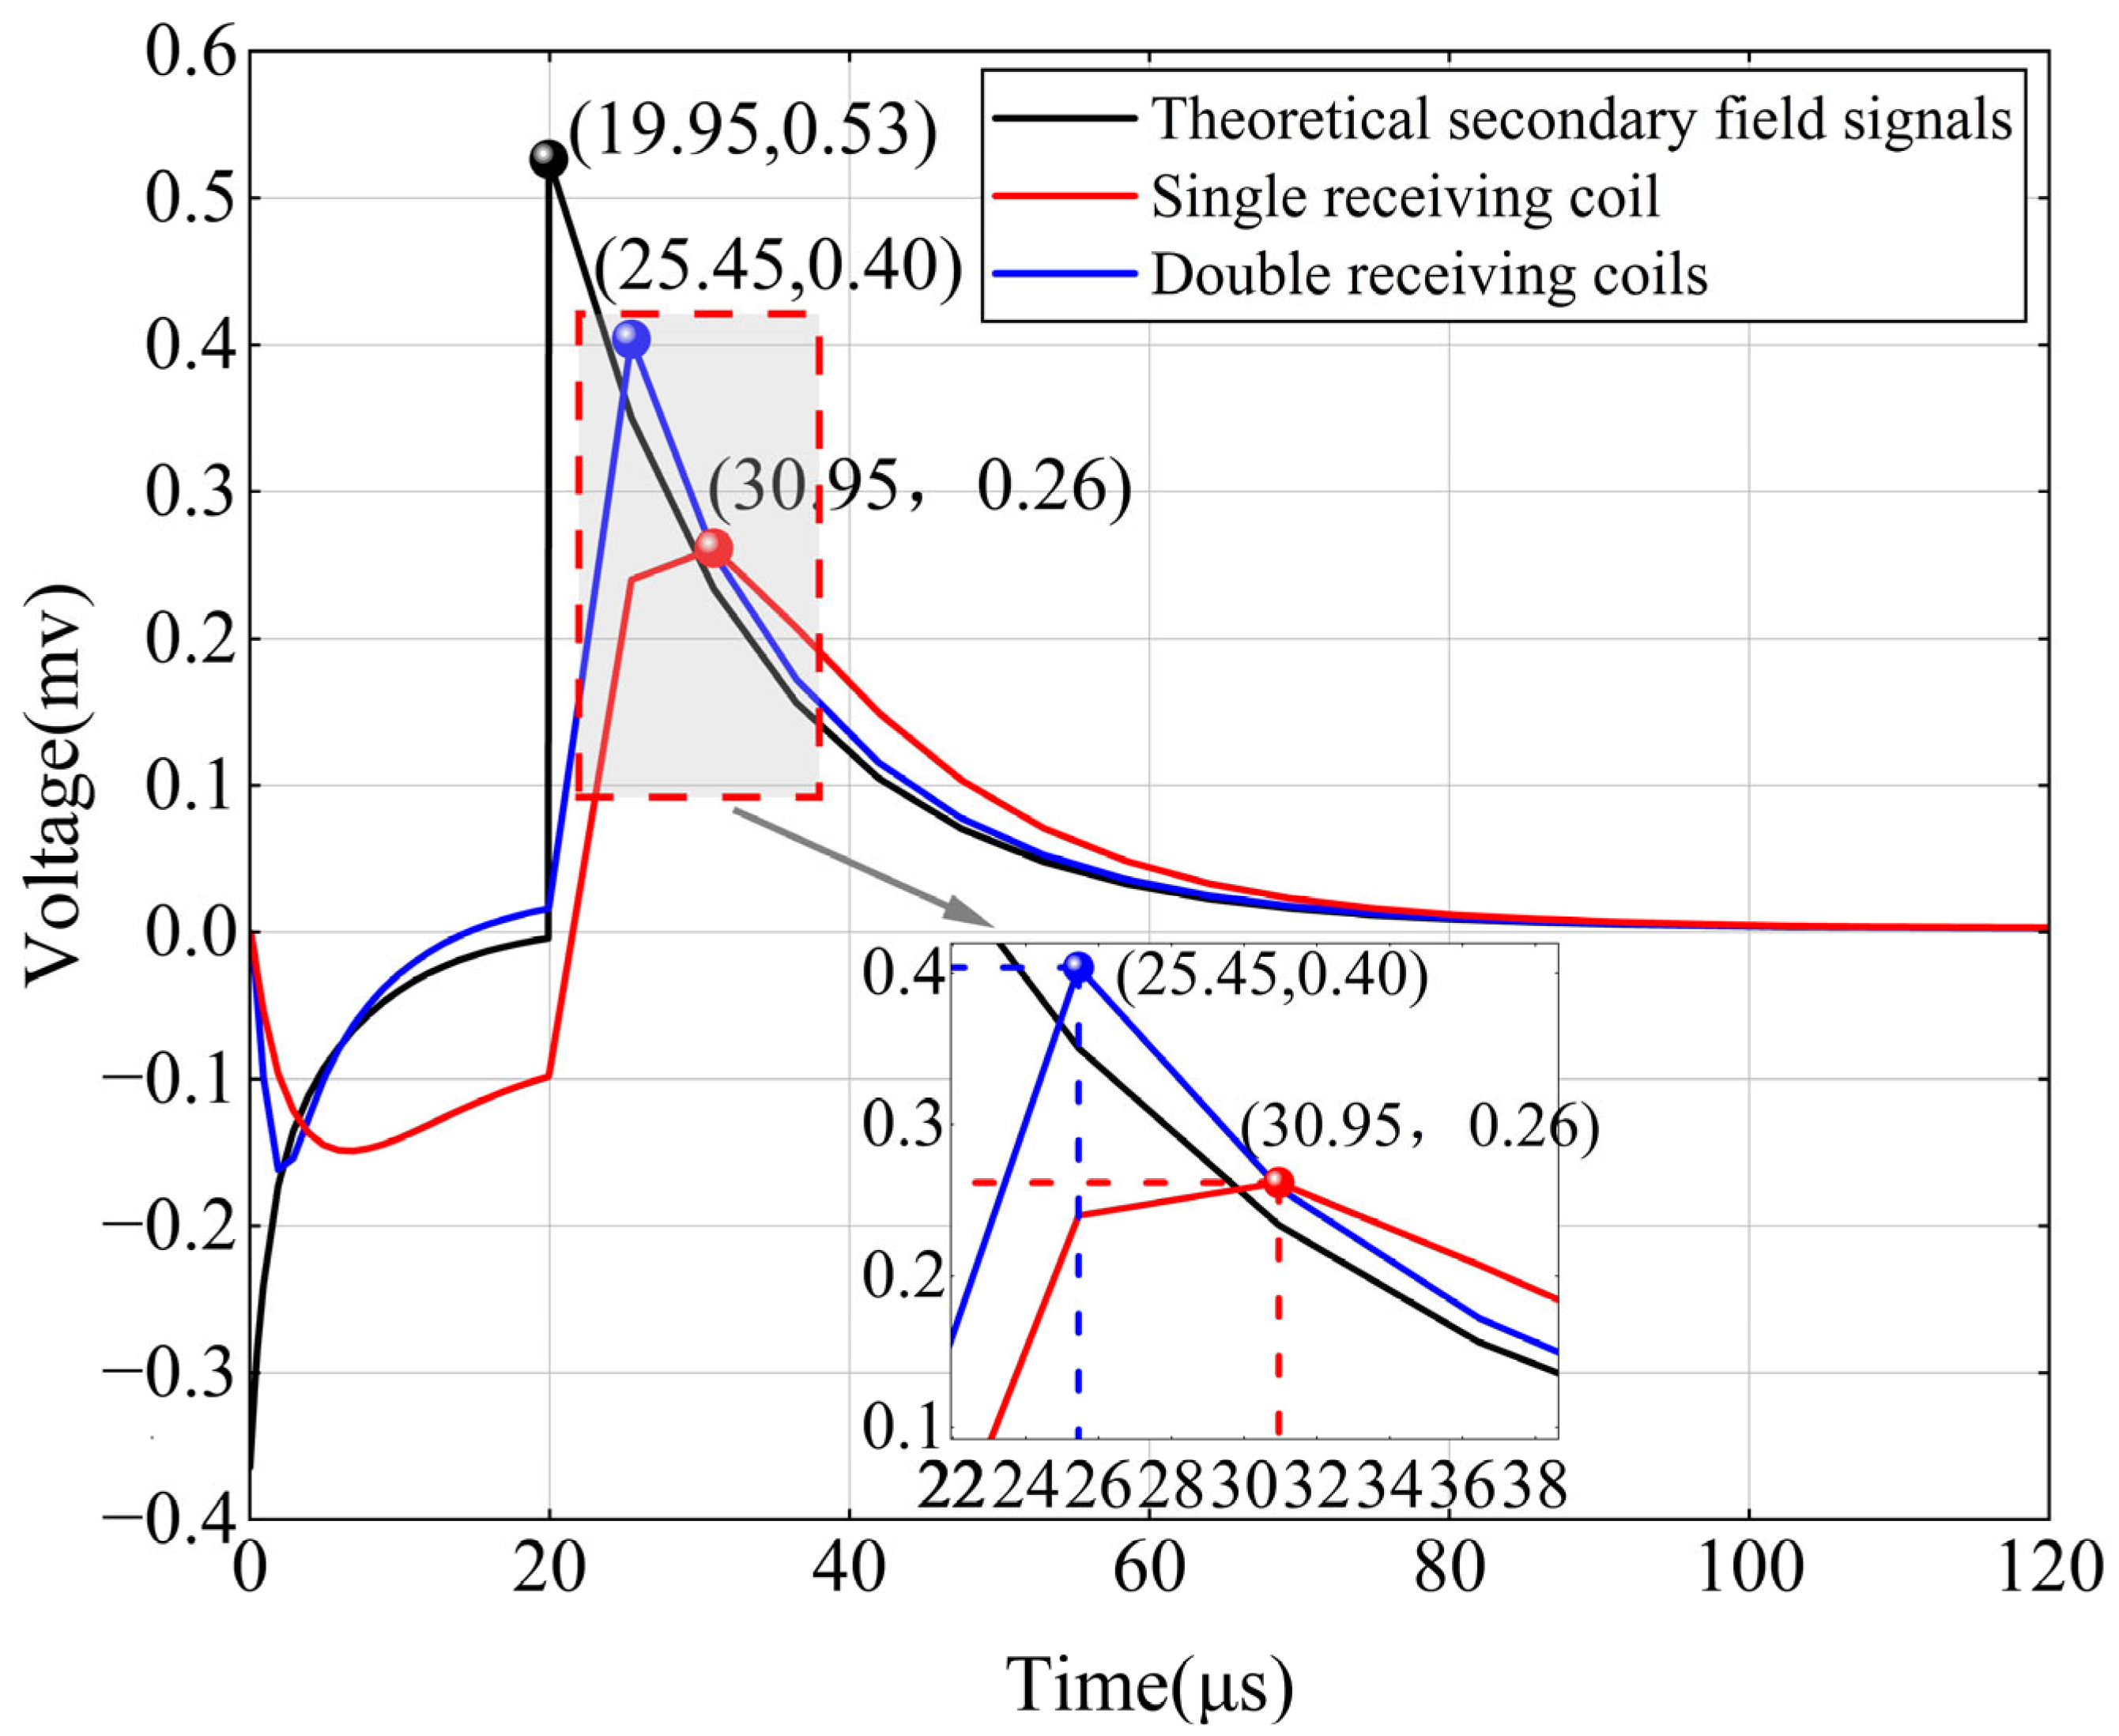
From the table, it is evident that the parasitic parameters of the double receiver coils sensor are smaller. Using the resonance method, we measured the resonant frequency of the single receiving coil sensor to be 103.5 kHz, while that of the double receiving coils sensor is 218.3 kHz, indicating that the bandwidth of the double receiving coils sensor is larger. As shown in Figure 10, the peak time for the secondary field signal of the single receiving coil is 30.95 μs, whereas the peak time for the double receiving coils is 25.45 μs. Compared with the theoretical secondary field signal, it can be concluded that the double receiving coils sensor shortens the transition process of the secondary field signal and t advances the peak of the secondary field response. This verified that the double receiving coils structure can effectively reduce the parasitic parameters, increase the bandwidth of the receiving coil sensor, and preserve more early secondary field signals. When comparing the proposed double receiving coils structure with opposing coils structure and gradient coils structure under the same number of receiving coil turns, as shown in Table 4, the proposed coil structure effectively increases the bandwidth range of the receiving coil sensor compared to other coil structures.

4. Field Experiments and Results

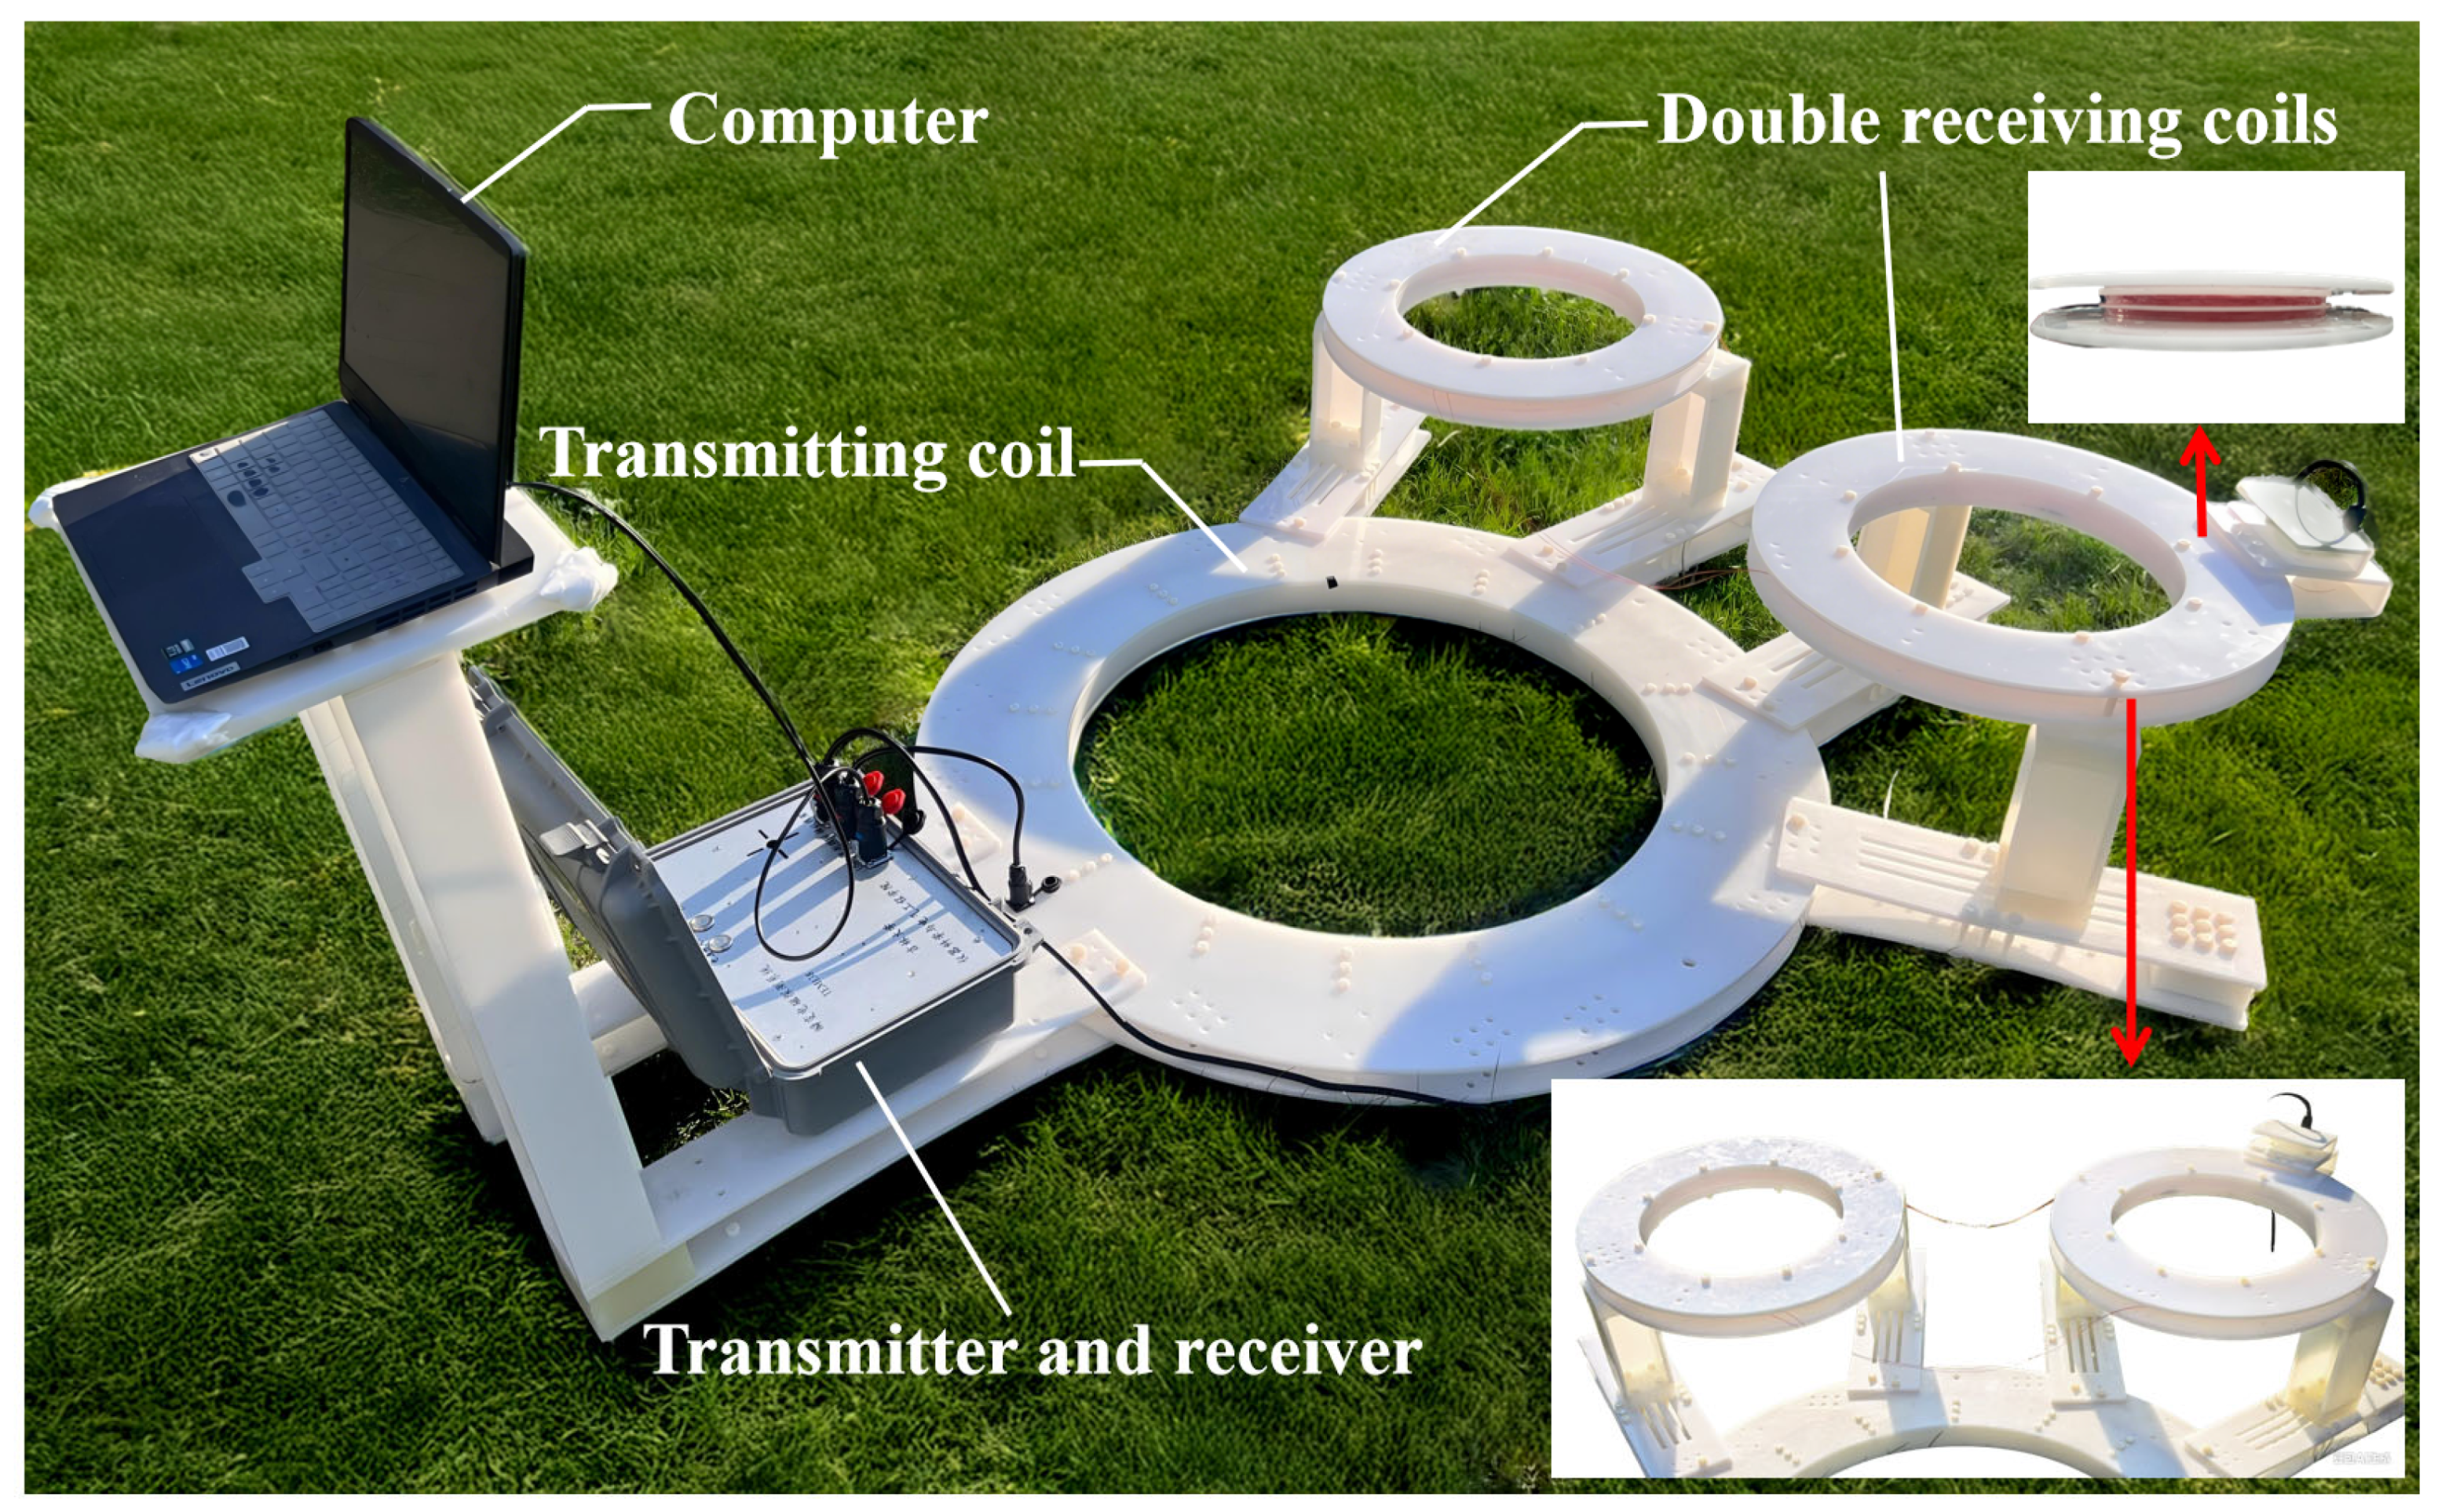
To verify the capability of the double receiving coils eccentric structure in enhancing the resolution of near-surface detection, a double receiving coils eccentric self-compensating coil structure was fabricated based on the calculation methods and parameters discussed in the previous section. Additionally, a small-loop TEM system was constructed, as shown in Figure 11. The entire coil structure is made of polyethylene (pp) with a machining accuracy of 1 mm. The transmitter and receiver of the small-loop TEM system are integrated into a single unit. The transmitter delivers an output current of 3.5 A with a shutdown time of 20.2 μs, while the receiver operates at a sampling rate of 1 Msps.
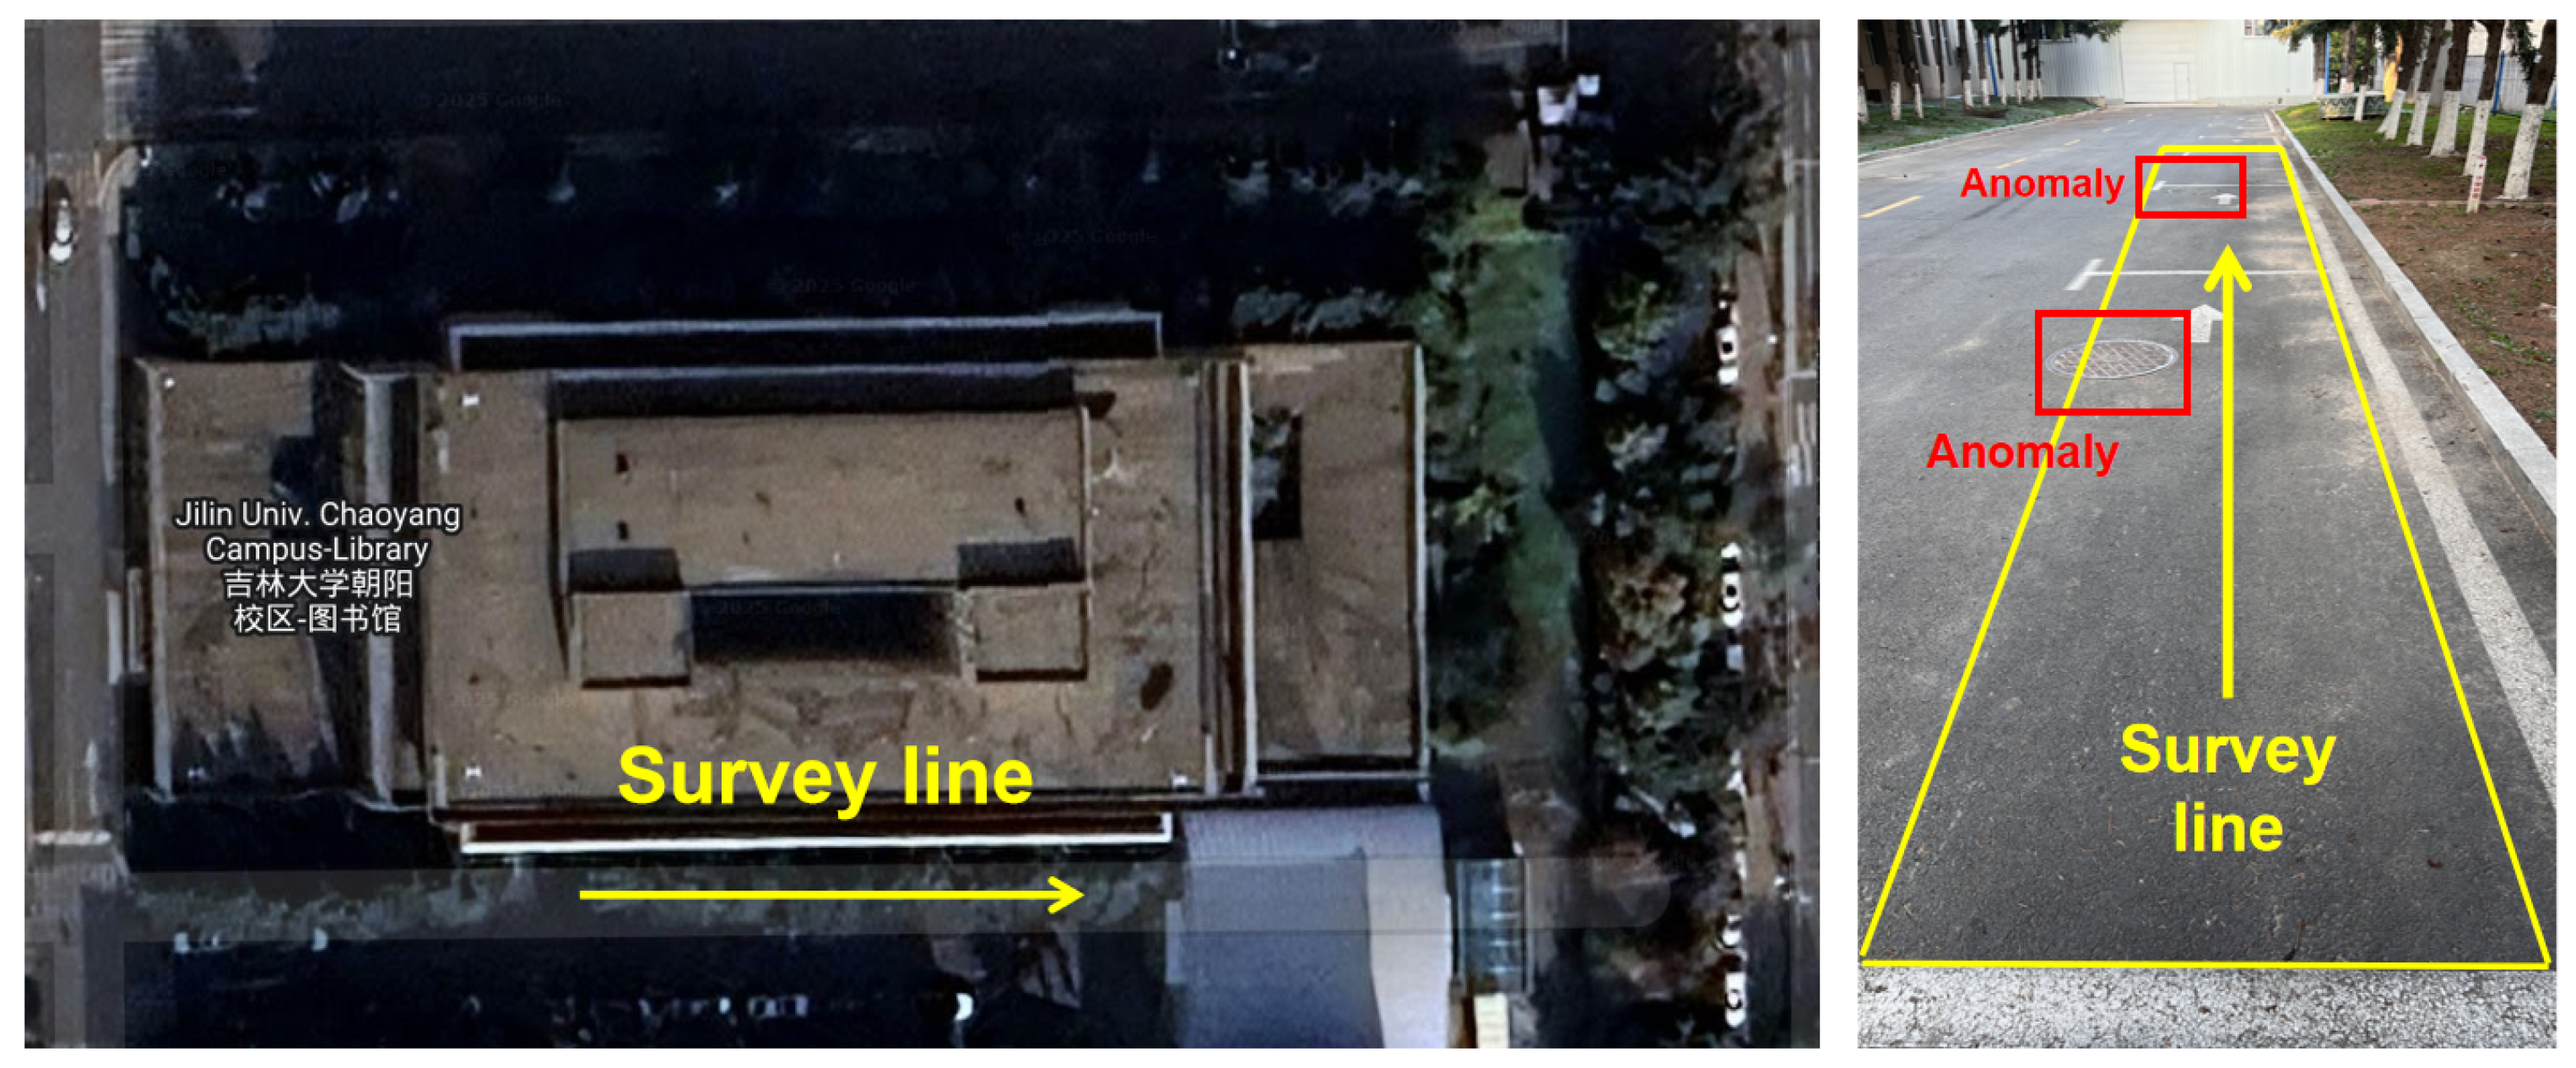
Field experiments were conducted in Changchun, China, using the small-loop TEM system equipped with a single receiving coil and double receiving coils eccentric self-compensating structure, respectively. The experimental location and test site are shown in Figure 12, with the whole test line oriented from west to east. Test points were taken at 1 m intervals, with a total of 20 points measured.
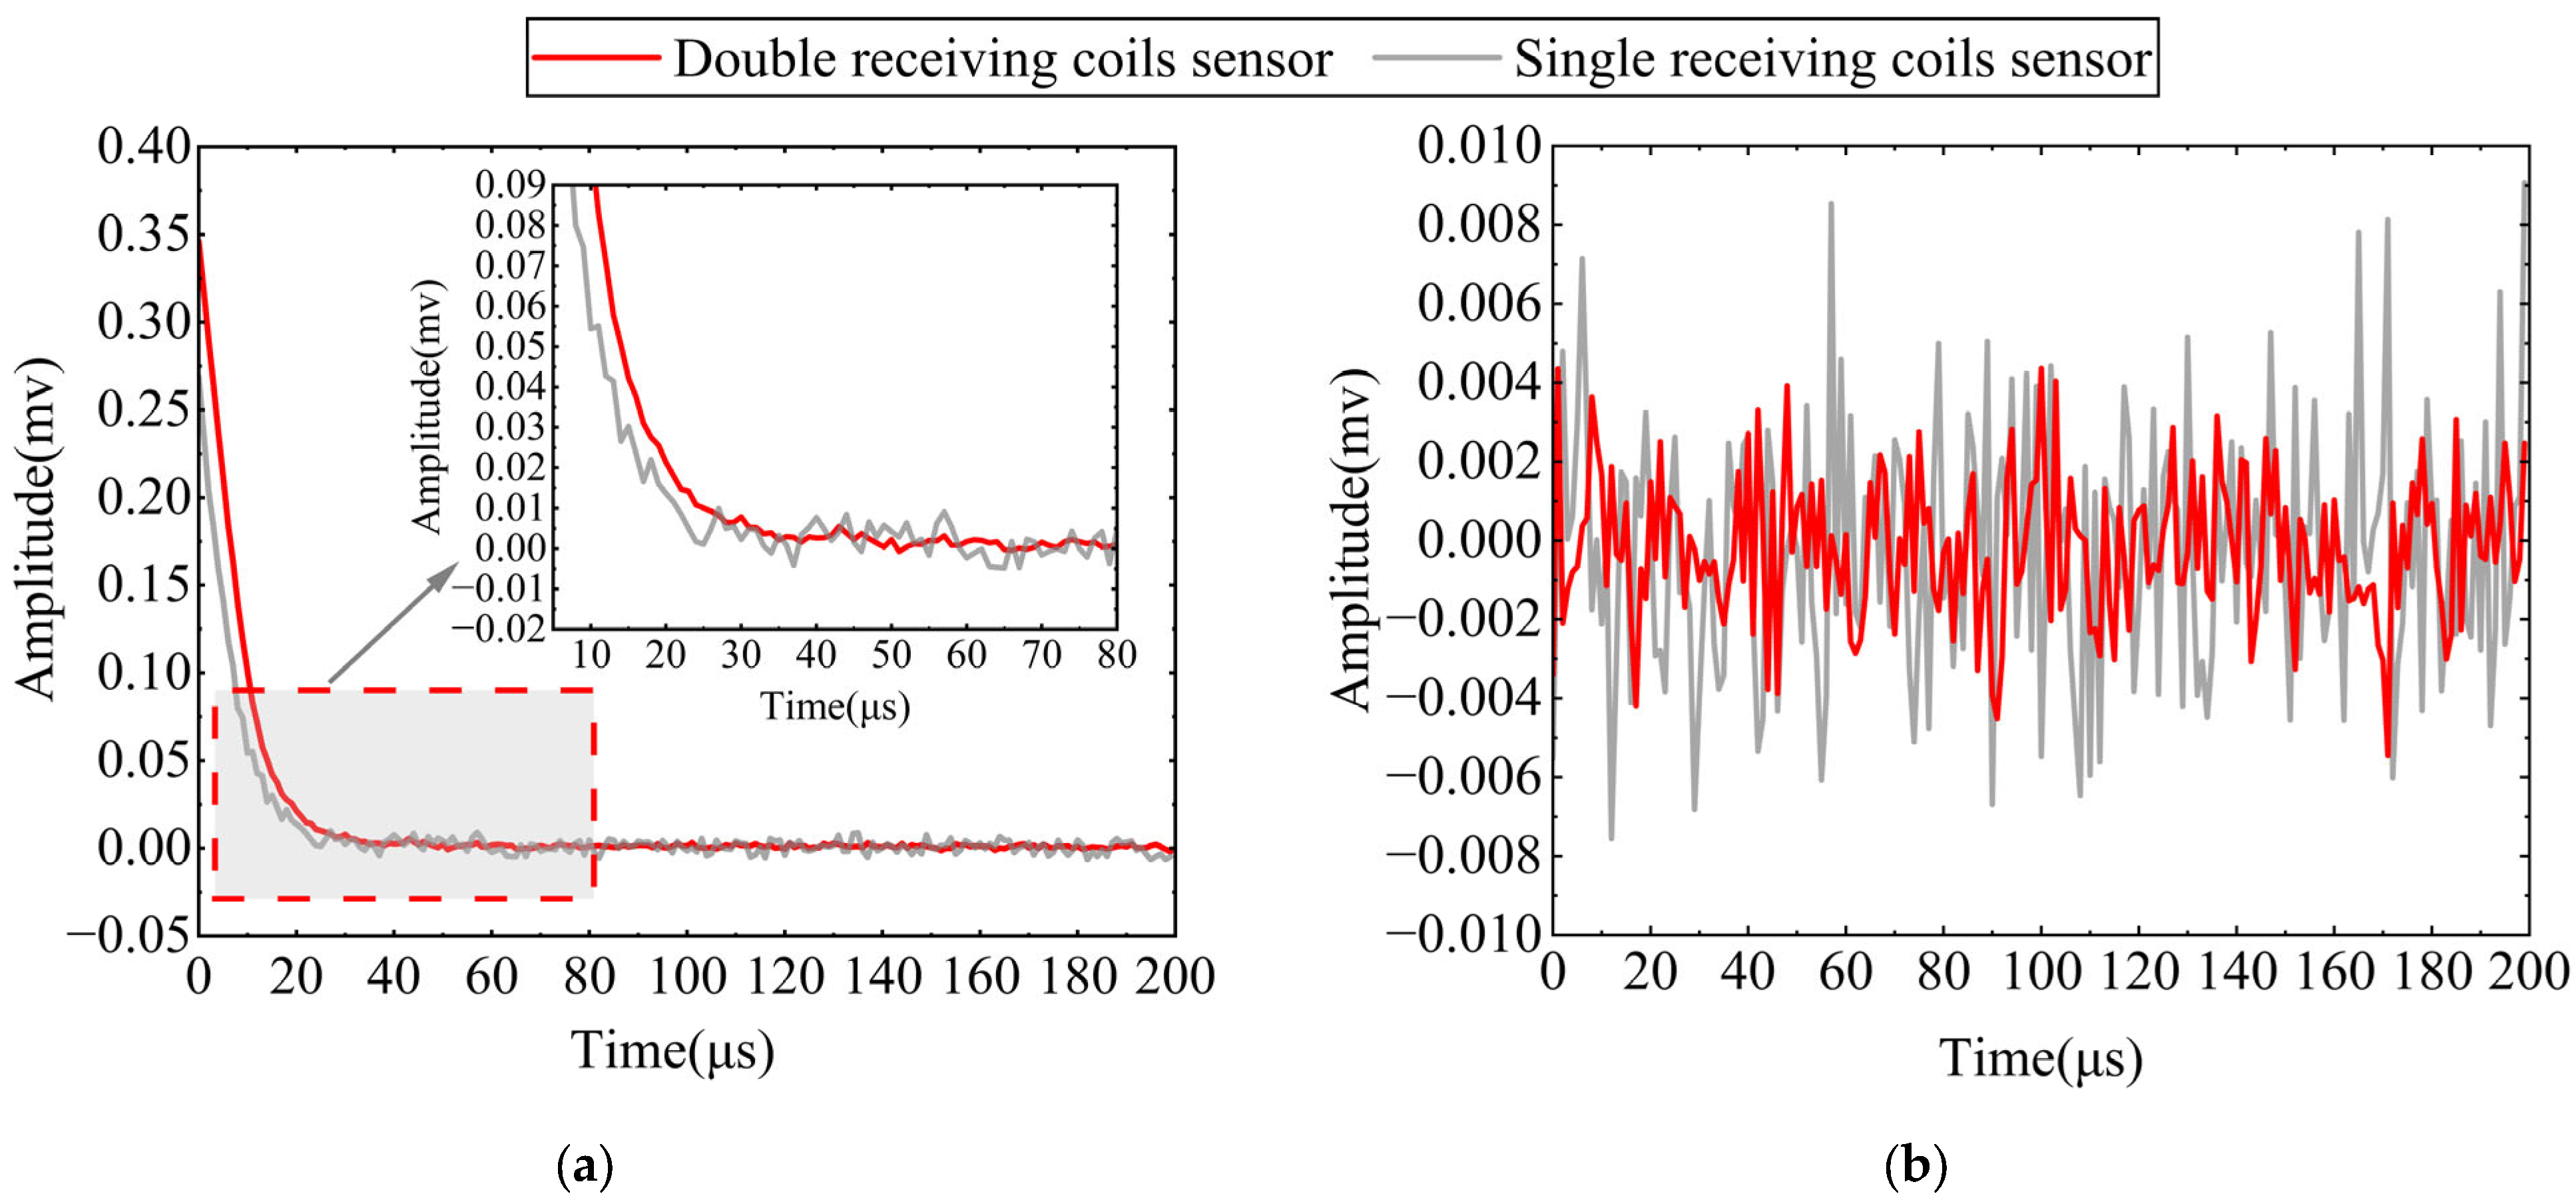
A comparison of the measured data from the single receiving coil eccentric structure and double receiving coils eccentric structure was conducted, and an analysis of the SNR for both types of coil sensors is presented in Figure 13. Since shallow geological information is contained in the early secondary field signals, the analysis was limited to the time interval from the onset of the peak in the measured secondary field signals until their decay to zero. Starting from the peak point within a cycle, a total of 200 data points were collected. As shown in Figure 13a, the peak voltage of the secondary field in the double receiving coils structure is higher than that in the single receiving coil structure. This indicates that the peak voltage of the secondary field occurs earlier, allowing for the acquisition of more early secondary field signals. Between 10 μs and 80 μs, the secondary field signals continuously decay, and it can be observed that the signal received by the single receiving coil sensor contains a higher level of noise. Noise analysis of the two coil structures in an electromagnetic shielding room is presented in Figure 13b. The double receiving coils sensor structure experiences less noise interference, resulting in a cleaner secondary field signal. Based on Equations (7)–(11) and the experimental measurements, the SNR of the double receiving coils sensor is calculated to be 27.9, while that of the single receiving coil sensor is 18.5, representing an improvement of 50.81%.
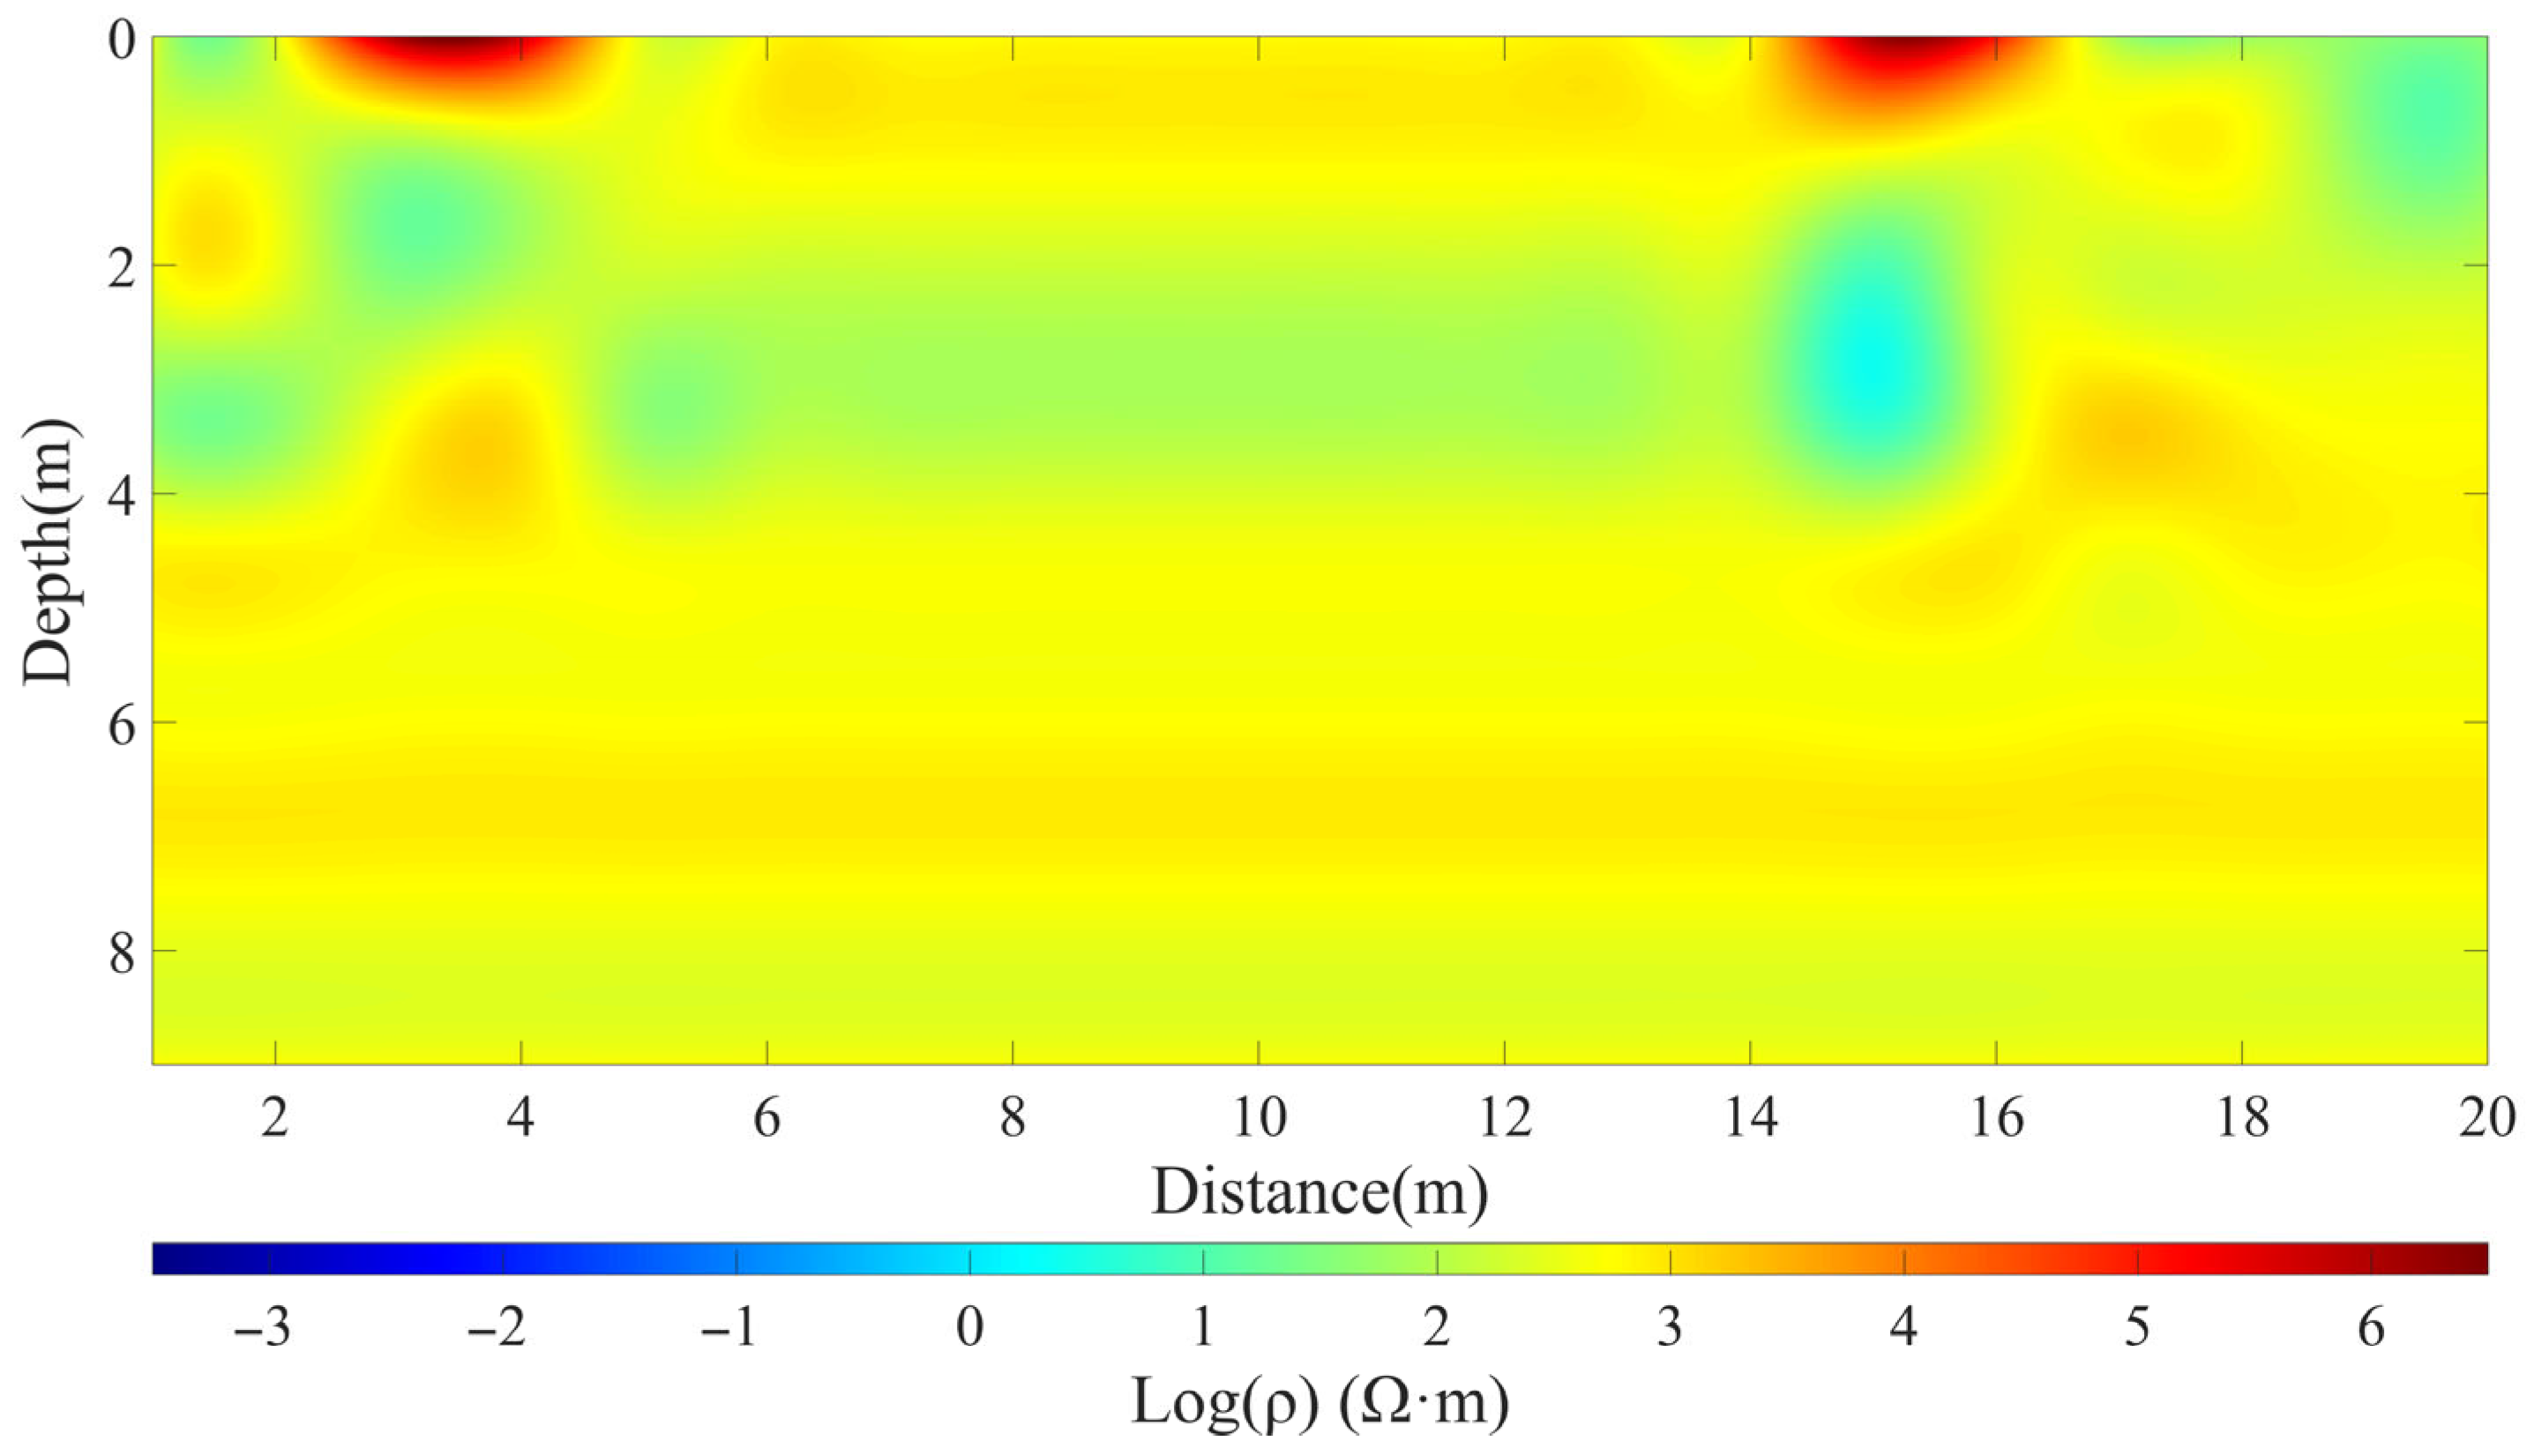
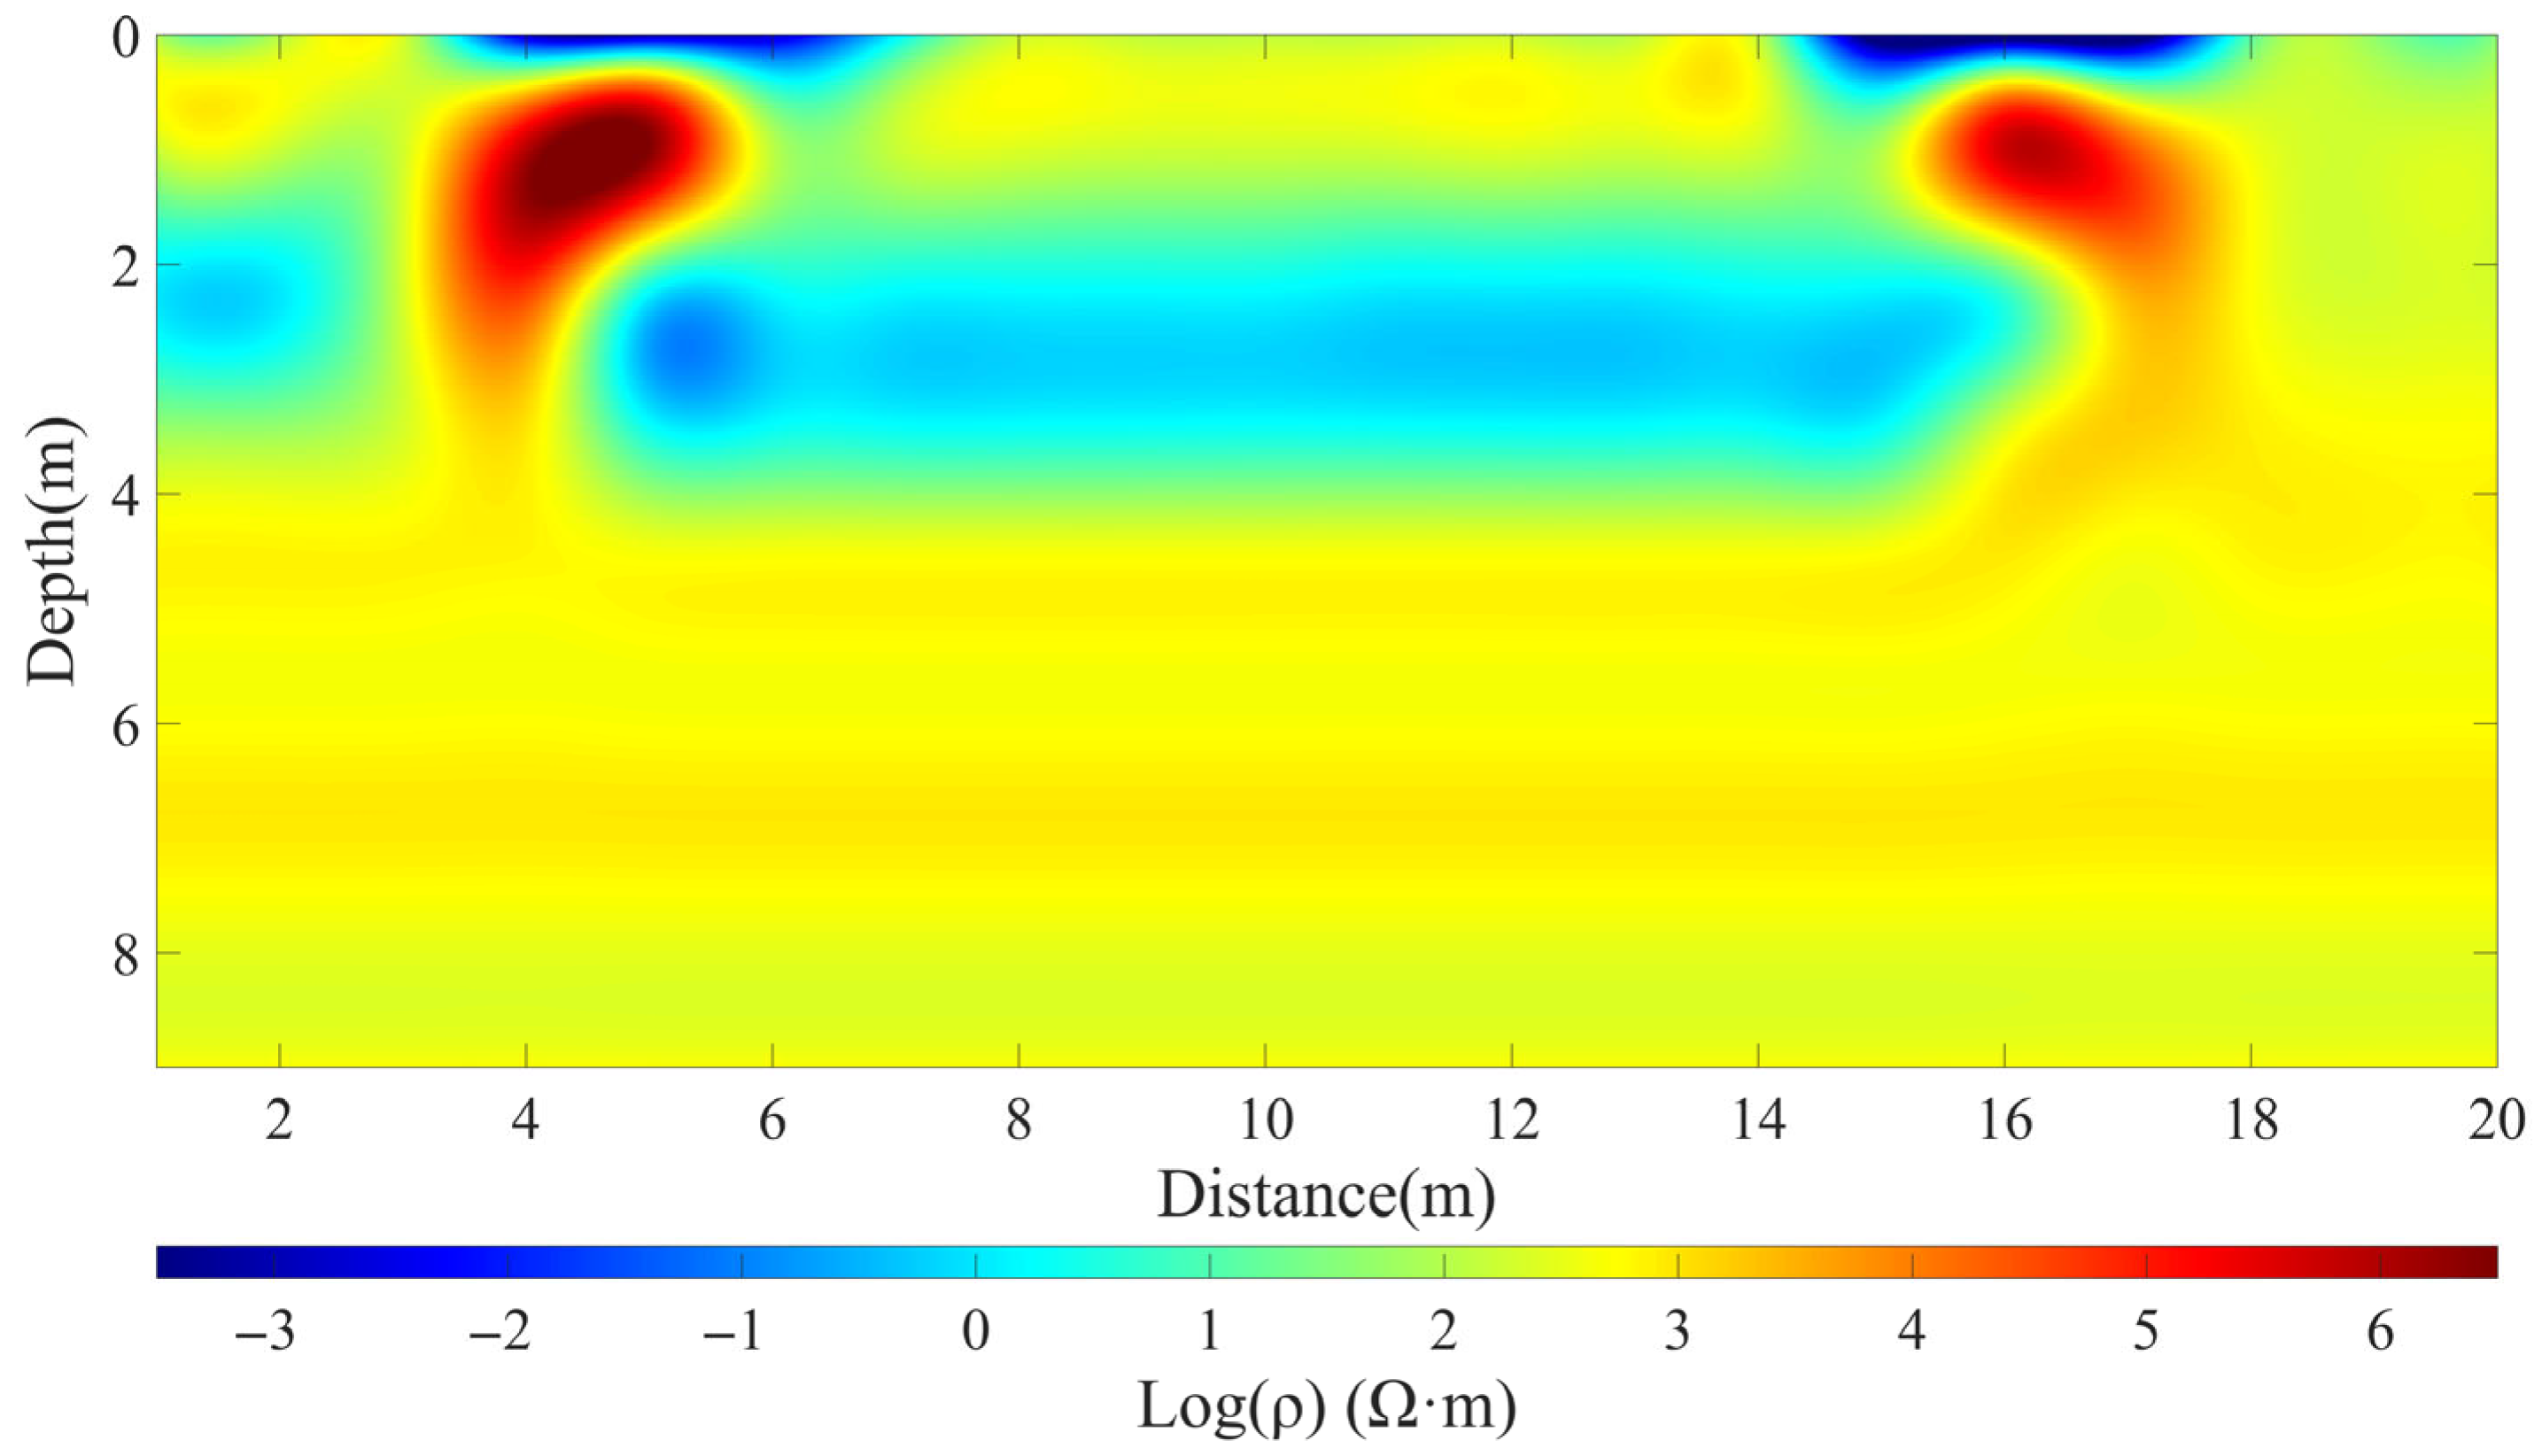
Furthermore, we compared the inversion images generated by the Occam method with the measured data from both the single receiving coil and the double receiving coils eccentric structures. Figure 14 and Figure 15 present the comparison results of the inversion images. Figure 14 illustrates the imaging based on the measured data from the single receiving coil eccentric structure. Due to the large parasitic parameters, the early secondary field signal distorted, reducing the effective data segment. This distortion led to errors in the imaging results. Additionally, a shallow blind zone was present, which prevented the detection of low-resistance metal anomalies on the surfaces of the two manhole covers and hindered the low-resistance anomalies of the drainage pipe between the two covers. Figure 15 illustrates the imaging based on the measured data from the double receiving coils eccentric structure. Two high-resistance anomalies appear at a depth of 1 m below the ground at 3–4 m and 16–17 m of the measurement line. These anomalies correspond to field environment of the air inside the manhole covers, detected after passing through the manhole covers at two places along the test line. Additionally, low-resistance anomalies are observed at depths of 2–3 m below the ground at 6–16 m of the test line, and the low-resistance anomalies of the drain pipe can be identified here. A comparison of the imaging results confirms that the use of the double receiving coils effectively reduces the influence of the coil transition process effect, enabling the detection of near-surface shallow anomalies at depths of 1 m or less. Based on actual site measurements, the positional error of the anomalies was ±0.1 m, enhancing the shallow anomaly resolution capability of small-loop TEM detection.

5. Conclusions and Outlook

This study proposes a robust analysis method for the determining position of an eccentric self-compensating small-loop TEM coil structure. By using statistical methods, the eccentric self-compensating position is optimized to identify the optimal zero-coupling position between the transmit and receive coils. This optimization reduces the impact of positional errors during actual detection and achieves zero coupling of the primary field interference. To address the effects of coil transition process, a double receiving coil structure was proposed. Compared to the single receiving coil structure, this configuration increased the bandwidth of the receiving coil sensor from 103.5 kHz to 218.3 kHz, thereby reducing the impact of coil transition process. The measured SNR of the early secondary field signals improved from 18.5 to 27.9, representing a 50.81% increase. The significant contribution of this study lies in its robustness analysis, which builds upon the existing research on weakening primary field coupling. It comprehensively considers the impact of coil transition processes on detection performance and proposes new methods to effectively improve the coil transition process and expand the coil bandwidth range. This work provides important theoretical foundations and technical references for enhancing the resolution capabilities of small-loop TEM system in urban shallow underground space detection. However, it should be noted that the practical effectiveness of this study in extremely complex geological environments still requires further verification and improvement. Additionally, regarding the double receiving coils structure adopted in this study, future research could explore increasing the number of receiving coils (e.g., using three or four receiving coils) under the same vertical and horizontal offset conditions to significantly enhance the bandwidth range and signal capture capability of the receiving system. Furthermore, more advanced signal processing algorithms and imaging methods could be explored to further improve the identification and resolution of underground micro-anomalies, thereby promoting the practical and refined application of this method in a broader range of engineering scenarios.

Author Contributions

All authors contributed to the study’s conception and design. M.Z. (First Author): Conceptualization, investigation, software, field experiments, writing—original draft. S.G.: Methodology, resources, supervision, funding acquisition, formal analysis, writing—review and editing. All authors have read and agreed to the published version of the manuscript.

Funding

The research of this paper was supported by the National Natural Science Foundation of China under the project “Research on Three-dimensional Numerical Simulation of Aero-electromagnetic Equivalent Physical Parameters and Efficient Detection Techniques for Complex Terrain of Sichuan-Tibet Railway” (42174179), and we would like to express our heartfelt gratitude.

Data Availability Statement

The data used in this study are confidential due to the project’s private nature. If necessary, contact the corresponding author to obtain the data.

Conflicts of Interest

The authors declare no conflicts of interest.

References

  1. Xu, Z.; Liao, X.; Liu, L.; Fu, N.; Fu, Z. Research on small-loop transient electromagnetic method forward and nonlinear optimization inversion method. IEEE Trans. Geosci. Remote Sens. 2023, 61, 1–13. [Google Scholar] [CrossRef]
  2. Shi, Y.T.; Liu, L.H.; He, D.K.; Huang, J.J.; Li, J.K.; Yan, S.C.; Fang, G.Y. Noncoplanar positive compensation decoupling technology in a small-loop transient electromagnetic system. IEEE Trans. Instrum. Meas. 2025, 74, 12. [Google Scholar] [CrossRef]
  3. Xu, Z.; Liu, L.; Liao, X.; Shao, K.; Fu, N.; Hu, X.; Fu, Z. Research and application of small-loop transient electromagnetic inversion method using improved flcpso-ifah optimization algorithm. J. Appl. Geophys. 2025, 239, 105759. [Google Scholar] [CrossRef]
  4. Liu, L.; Qiao, L.; Liu, L.; Geng, Z.; Shi, Z.; Fang, G. Applying stray inductance model to study turn-off current in multi-turn loop of shallow transient electromagnetic systems. IEEE Trans. Power Electron. 2020, 35, 1711–1720. [Google Scholar] [CrossRef]
  5. Asten, M.W.; Duncan, A.C. The quantitative advantages of using b-field sensors in time-domain em measurement for mineral exploration and unexploded ordnance search. Geophysics 2012, 77, 137–148. [Google Scholar] [CrossRef]
  6. Spies, B.R. Depth of investigation in electromagnetic sounding methods. Geophysics 1989, 54, 872–888. [Google Scholar] [CrossRef]
  7. Shi, Z.; Liu, L.; Xiao, P.; Geng, Z.; Liu, F.; Fang, G. Simulation and analysis of the effect of ungrounded rectangular loop distributed parameters on tem response. J. Appl. Geophys. 2018, 149, 105–113. [Google Scholar] [CrossRef]
  8. Schamper, C.; Auken, E.; Sorensen, K. Coil response inversion for very early time modelling of helicopter-borne time-domain electromagnetic data and mapping of near-surface geological layers. Geophys. Prospect. 2014, 62, 658–674. [Google Scholar] [CrossRef]
  9. Xi, Z.; Long, X.; Huang, L.; Zhou, S.; Song, G.; Hou, H.; Chen, X.; Wang, L.; Xiao, W.; Qi, Q. Opposing-coils transient electromagnetic method focused near-surface resolution. Geophysics 2016, 81, E279–E285. [Google Scholar] [CrossRef]
  10. Fu, Z.; Wang, H.; Wang, Y.; Fu, N.; Tai, H.-M.; Qin, S. Elimination of mutual inductance effect for small-loop transient electromagnetic devices. Geophysics 2019, 84, E143–E154. [Google Scholar] [CrossRef]
  11. Miles, P. Multi-Sensor System for Airborne Geophysical Prospecting and Method. US-20160178782-A1, 22 June 2016. [Google Scholar]
  12. Pi, S.; Lin, J. Accurate modeling approach and uncertainty quantification for tem weak-coupling coil: A case study on bucking coil. IEEE Sens. J. 2023, 23, 18108–18117. [Google Scholar] [CrossRef]
  13. Liu, L.H.; Li, J.T.; Huang, L.; Liu, X.J.; Fang, G.Y. Double clamping current inverter with adjustable turn-off time for bucking coil helicopter transient electromagnetic surveying. IEEE Trans. Ind. Electron. 2021, 68, 5405–5414. [Google Scholar] [CrossRef]
  14. Wang, S.P.; Yu, Y.B.; Zhao, X.J.; Wang, Y.; Gao, Q.M.; Ji, Y.J. Characterization of excitation effects and data interpretation of combined time-domain multiwaveform transmission currents. IEEE Sens. J. 2023, 23, 17159–17172. [Google Scholar] [CrossRef]
  15. Di, Q.; Li, H.; Xue, G.; Zhang, L. Pseudo-2-d transdimensional bayesian inversion of the full waveform tem response from prbs source. IEEE Trans. Geosci. Remote Sens. 2020, 58, 7602–7610. [Google Scholar] [CrossRef]
  16. Huang, J.; Wang, H.; Fu, Z.; Fu, W. Analysis of primary field shielding stability for the weak coupling coil designs. Sensors 2020, 20, 519. [Google Scholar] [CrossRef]
  17. Sternberg, B.K.; Dvorak, S.L.; Feng, W.J. Design and verification of large-moment transmitter loops for geophysical applications. J. Appl. Geophys. 2017, 136, 211–218. [Google Scholar] [CrossRef]
  18. Kamenetsky, F.; Oelsner, C. Distortions of em transients in coincident loops at short time-delays. Geophys. Prospect. 2008, 48, 983–993. [Google Scholar] [CrossRef]
  19. Yu, D.Z.; Chen, B.C.; Luo, Y.; Zhou, X.L.; Yu, Y.; Yang, X.Y.; Xiang, Y.K. Mutual inductance calculation for rectangular and circular coils with parallel axes. IET Electr. Power Appl. 2024, 18, 379–388. [Google Scholar] [CrossRef]
Figure 1. The relationship between coil’s sensitivity, number of turns, and diameter.
Applsci 15 09395 g001
Figure 2. Relationship between coil’s SNR, number of turns, and average coil diameter.
Applsci 15 09395 g002
Figure 3. Coil resonance frequency calculation results.
Applsci 15 09395 g003
Figure 4. Schematic representation of probability density distribution at different sampling times: (a) number of samples 500 to 10,000; (b) number of samples over 4000.
Applsci 15 09395 g004
Figure 5. Probability density images of 4000 sampled values at different locations: (a) location 1–10; (b) location 2–10.
Applsci 15 09395 g005
Figure 6. Comparison of means and variances at different locations.
Applsci 15 09395 g006
Figure 7. Double receiving coils eccentric structure.
Applsci 15 09395 g007
Figure 8. Magnetic field distribution inside the receiving coils: (a) magnetic field distribution around a circular conductive coil; (b) comparison of single and double receiving coils magnetic fields.
Applsci 15 09395 g008
Figure 9. Receiving coil equivalent circuit model.
Applsci 15 09395 g009
Figure 10. Comparison of the secondary fields received by the single receiving coil structure and the double receiving coils structure with the theoretical secondary field.
Applsci 15 09395 g010
Figure 11. Small-loop TEM system with double receiving coils eccentric self-compensating structure.
Applsci 15 09395 g011
Figure 12. Map location and site of the experimental survey line.
Applsci 15 09395 g012
Figure 13. Comparison of measured signals. (a) Comparison of measured secondary field signals. (b) Comparison of measured noise received by two coils.
Applsci 15 09395 g013
Figure 14. Inverse imaging map of data acquired by the single receiving coil structure.
Applsci 15 09395 g014
Figure 15. Inverse imaging map of data acquired by the double receiving coils structure.
Applsci 15 09395 g015
Table 1. 10 locations where mutual inductance is minimized.
Location12345
L/m0.540.640.660.70.72
H/m0.210.240.260.310.33
MTR/H−6.75 × 10−8−6.89 × 10−88.76 × 10−8−4.98 × 10⁻⁸−1.61 × 10⁻⁸
Location678910
L/m0.740.760.780.80.84
H/m0.350.370.390.410.43
MTR/H−2.14 × 10−91.64 × 10−10−4.13 × 10⁻⁹−1.191 × 10−81.4723 × 10−7
Table 2. Kolmogorov–Smirnov test.
DZAsymptotic Probability > |D|
M, N group0.008830.412040.99471
N, P group0.002800.150081
P, Q group0.003150.195191
Table 3. Parameters of the two kinds of receiving coil sensors.
RL/mHC/pFn
Single receiving coil40.71 ± 0.47.97 ± 0.01296.69 ± 0.0510
Double receiving coils37.16 ± 0.47.13 ± 0.0174.55 ± 0.0210
Table 4. Comparison of bandwidths for different coil structures.
Coil StructureValue
Gradient coils structure107.8 kHz
Opposing coils structure112.4 kHz
Single receiving coil structure105.3 kHz
Double receiving coils structure218.2 kHz
Disclaimer/Publisher’s Note: The statements, opinions and data contained in all publications are solely those of the individual author(s) and contributor(s) and not of MDPI and/or the editor(s). MDPI and/or the editor(s) disclaim responsibility for any injury to people or property resulting from any ideas, methods, instructions or products referred to in the content.