Article

Improvement and Radiation-Resistance Study of an Optical Displacement Sensing System Based on a Position Sensitive Detector

1
Technology and Engineering Center for Space Utilization, Chinese Academy of Sciences, Beijing 100094, China
2
Department of Mathematics and Physics, North China Electric Power University, Baoding 071003, China
*
Authors to whom correspondence should be addressed.
These authors contributed equally to this work.
Appl. Sci. 2025, 15(17), 9383; https://doi.org/10.3390/app15179383
Submission received: 15 June 2025 / Revised: 12 August 2025 / Accepted: 14 August 2025 / Published: 27 August 2025

Abstract

We report a method of improving the precision and resolution of sensing systems based on position sensitive detectors (PSDs). In the method, we improved the precision and resolution by reducing the gain of the condition circuit and conducting spatial filtering on the measured spot position. To demonstrate the method, we experimentally built a PSD-based displacement sensing system. With the system, a precision of 0.3 μm and a resolution of 0.5 μm were obtained. The precision is two orders of magnitude better than that obtained with the use of a commercial condition circuit (SPC02, SiTek, Partille, Sweden) and without using any filter. Moreover, we tested the radiation-resistance performance of the system using a 60Co radiation source. The system kept the precision and resolution after exposure to radiation with a dose set to 100 krad. Our study is very useful to realize high-precision PSD-based sensing in space.

1. Introduction

Active vibration isolation systems play a critical role in space experiments and exploration, precise machining and metrology, and scientific research such as particle physics [1,2,3,4,5,6]. An indispensable part of an active vibration system is displacement measurement systems, which provide spatial vibration information used for vibration isolation [7,8,9]. A displacement measurement system should have high precision, resolution, and accuracy to meet the requirements of the above applications. For space applications, a displacement measurement system should additionally meet the requirements of small volume, light weight, and high radiation resistance so that it can be used as a payload. A displacement measurement system based on a position sensitive detector (PSD) is very attractive since it features a compact size, rapid response, and simplicity in principle [10]. Besides the popularity in space experiments, PSDs have wide applications, such as sensing humidity [11] and seawater refraction index [12], detecting underwater propeller wake [13] and the main shaft of wind turbines [14], distinguishing parenteral artificial nutrition injected to patients [15], and calibrating field for robots [16] and localizing robots [17]. As the resolution of a position sensing system based on a PSD is inversely proportional to the photocurrents of the PSD and proportional to the noise of the sensing system [18], studies on increasing the photocurrent of a PSD and decreasing the noise of such a measuring system have been widely reported. A promising way to increase photcurrents is using two-dimensional (2D) materials, such as graphene, and transition-metal chalcogenides instead of silicon [19,20]. In 2020, Wenhui Wang et al. demonstrated that the position sensitivity of a PSD using 2D materials and incident laser power just at the nano-watt level is an order of magnitude higher than that with using silicon materials and incident laser power at the milli-watt level [20]. In 2021, Hao jiang et al. demonstrated a 10-fold increase in the generated photocurrent by introducing gate manipulation in a graphene–silicon-on-insulator structure, compared with the counterpart without the gate modulation [21]. The noise of a PSD-based sensing system primarily originates from ambient light on the PSD, the PSD board, its condition circuit, and movements that cause the sensing system to shake. To get rid of ambient stray light, methods such as introducing a light cut-off filter, optimizing the configuration of the sensing system, and modulation detection and sample-hold detection are generally used [22]. In 2014, Mehdi Rahimi et al. proved that noise could be effectively removed by averaging a set of replicate measurements in the time domain [23]. What is more, Siwei Sun et al. reported a method to improve the position resolution of most types of PSDs, in which barrel distortion was introduced deliberately to enhance the positional resolution of a PSD through changing the sheet resistance ratio of the photosensitive area and border resistor [24]. The noise from the condition circuit is mainly caused by the amplifier [25]; hence, a possible way to decrease the noise of a PSD-based sensing system is by reducing the gain of the amplifier. However, currently, commercially available condition circuits generally have large gain, leading to a high noise level. To decrease the output noise voltage, self-designed circuits have been studied, e.g., condition circuits based on low-noise OPA111 op-amp [26] and TL074 op-amp [27] have been reported. Although the noise of these self-designed circuits is already lower than that of commercially available circuits, further decreasing the noise and optimizing other specifications are very important for many practical applications.
In this paper, we report a method for improving the precision and resolution of sensing systems based on PSDs and the radiation-resistance properties of a PSD-based displacement sensing system. In the method, we improved the precision and resolution by reducing the gain of the amplifier of the condition circuit and conducting spatial filtering on the measured spot position. We designed a condition circuit with a gain of the amplifier of ten thousand, which is an order of magnitude lower than that of a commercial condition circuit (SPC02, SiTek, Partille, Sweden), and compensated the gain by increasing the light power impinging on the PSD sensor. We experimentally demonstrated the method in a PSD-based displacement sensing system. We obtained a precision of 3.9 μm in the x direction and 3.3 μm in the y direction with the use of our condition circuit, which is an order of magnitude better than that obtained with the use of the commercial condition circuit. We further improved the precision to 0.3 μm by implementing spatial filtering employing a Butterworth low-pass filter with a cut-off frequency of 1 Hz. With the use of our method, a displacement resolution of 0.5 μm was acquired. In addition, the system kept the precision and resolution after being exposed to 60Co radiation with a dose of 100 krad. Our study is very useful to realize high-precision PSD-based sensing in space.

2. Methods

Figure 1a depicts the schematic of a 2D PSD (2L10_SU7, SiTek, Partille, Sweden) and our designed condition circuit. This PSD was selected because its typical position non-linearity of 0.3% in the whole 10 mm × 10 mm active area is superior. The material of the PSD was silicon. The PSD had a three-layer structure, the P-type resistive layer with two contacts at the opposite ends as the front side, the middle low-doped N-type layer, and the N-type resistive layer with two contacts at opposite ends placed orthogonally to the contacts on the front side as the back side. The center of the PSD was defined as the origin point, the direction parallel to the contacts on the back side was defined as the x direction, and the direction parallel to the contacts on the front side was defined as the y direction. The condition circuit was composed of an amplifier module, an analog-to-digital (AD) module, and a control module. The amplifier module consisted of four amplifiers, A1, A2, A3, and A4 (ADTL084ARZ, Analog Devices, Inc., Wilmington, MA, USA), which were used to convert the four-output current signal, Iy1, Iy2, Ix1, and Ix2, of the PSD sensor to voltage signals and amplified the voltage signals by ten-thousand times. The amplifier had a noise value of 16 nV/√Hz and a bandwidth of 5 MHz. The voltage signal in the y direction had the opposite sign to the voltage signal in the x direction, which was required according to the manual of the PSD sensor. The AD module was used to digitalize the analog voltage signals. It consisted of an AD converter (ADS1258, Texas instruments, Dallas, TX, USA) and a peripheral circuit to operate the AD. The converter had 16 channels and 24 bit. The clock (CLK) and chip-selecting (CS) signals of this module were provided by the control module with FPGA (XC7Z020-CLG484, Xilinx, Santa Clara, CA, USA) for logic programming. The digital signal generated in the AD module was transmitted to the control module through the data communication ports in the two modules (TX in the AD module and RX in the control module). The digital signal was then transmitted to a computer by the control module through a serial port (SP) with a baud rate set to 115,200. The commands used to operate the AD module were sent by the control module through the command communication ports (RX in the AD module and TX in the control module). In the computer, we performed spatial filtering and calculated the position of the light spot on the PSD sensor. Figure 1b is a photo of the designed condition circuit. Figure 1c shows the displacement sensing system that was built to verify the performance of the designed condition circuit. The light source was LED (L10596-02, Hamamatsu, Iwata, Japan) with an output power of 3 mW, which was high enough to enhance the output signal of the condition circuit with low amplification gain. The beam diameter was collimated to ~2 mm. The distance between the LED and PSD sensor was about 3 cm. This distance guaranteed that the beam had not diverged at the PSD sensor. During the experiment, we carefully aligned the PSD and LED so that the light beam impinged the active surface of the PSD orthogonally to avoid any deterioration in precision and resolution and to make sure that the measured displacement reflected real displacement. An enclosure was used to shield the experiment from environmental disturbance as much as possible. The experiment was conducted on a marble optical platform with a vibration-isolated system at room temperature so that effects, such as vibration and temperature variation, on the experiments were negligible.

3. Results

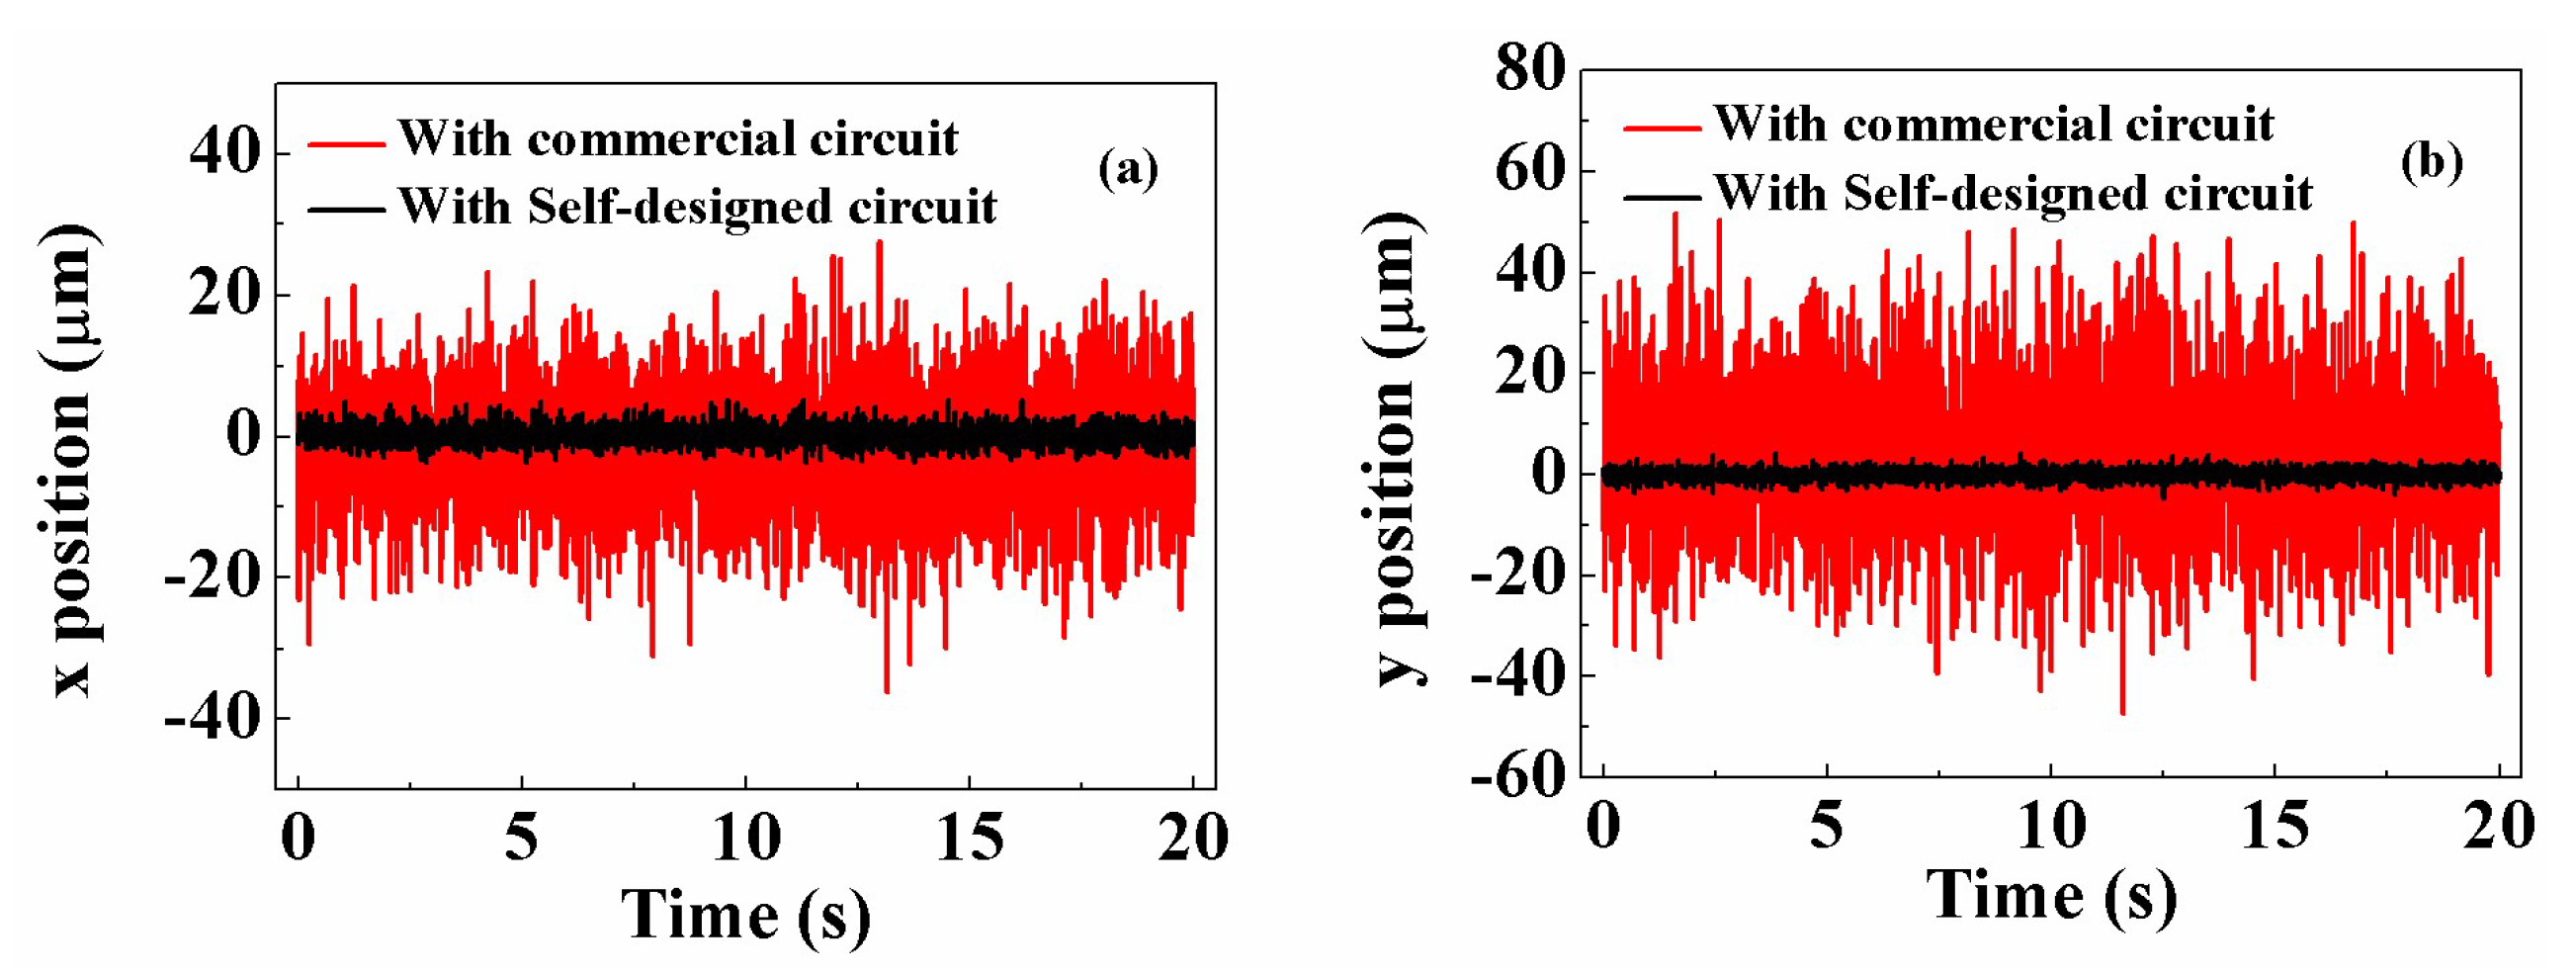
We characterized the precision of our system. We aligned the light spot to the center of the PSD and then acquired the output of the PSD for about 20 s with the use of our self-designed condition circuit. We also acquired the output of the PSD employing a commercial condition circuit with the same time period for comparison. We obtained the position of the light spot on the PSD according to Equations (1) and (2), where Vx1, Vx2, Vy1, and Vy2 are the voltage converted from the output current of the PSD and L is half of the width of the PSD. Figure 2a and 2b, respectively, show the measured light-spot position using the two-condition circuit in the x direction and y direction. It can be seen that the variation in the spot position measured by the commercial circuit is much larger than that measured by our self-designed circuit in both directions. The standard deviation was about 8.4 μm in the x direction and 14.2 μm in the y direction for the commercial circuit, while these values were 1.3 μm in the x direction and 1.1 μm in the y direction for the self-designed circuit. The corresponding 3-sigma precision was about 25.2 μm in the x direction and 42.6 μm in the y direction for the commercial circuit and 3.9 μm in the x direction and 3.3 μm in the y direction for the self-designed circuit. Our circuit improves the precision almost by an order of magnitude. We then employed a Butterworth low-pass filter with a cut-off frequency of 1 Hz to further improve precision. Figure 3a and 3b, respectively, show the light-spot position when using the filter together with those without using the filter in the x direction and y direction. The precision in both directions was about 0.3 μm when the filter was used. With the use of the Butterworth low-pass filter, the precision effectively improved. Thus, in the following measurement, the self-designed driven circuit and Butterworth low-pass filter were used.
x = Vx 1 Vx 2 Vx 2 + Vx 1 L
y = Vy 1 Vy 2 Vy 2 + Vy 1 L
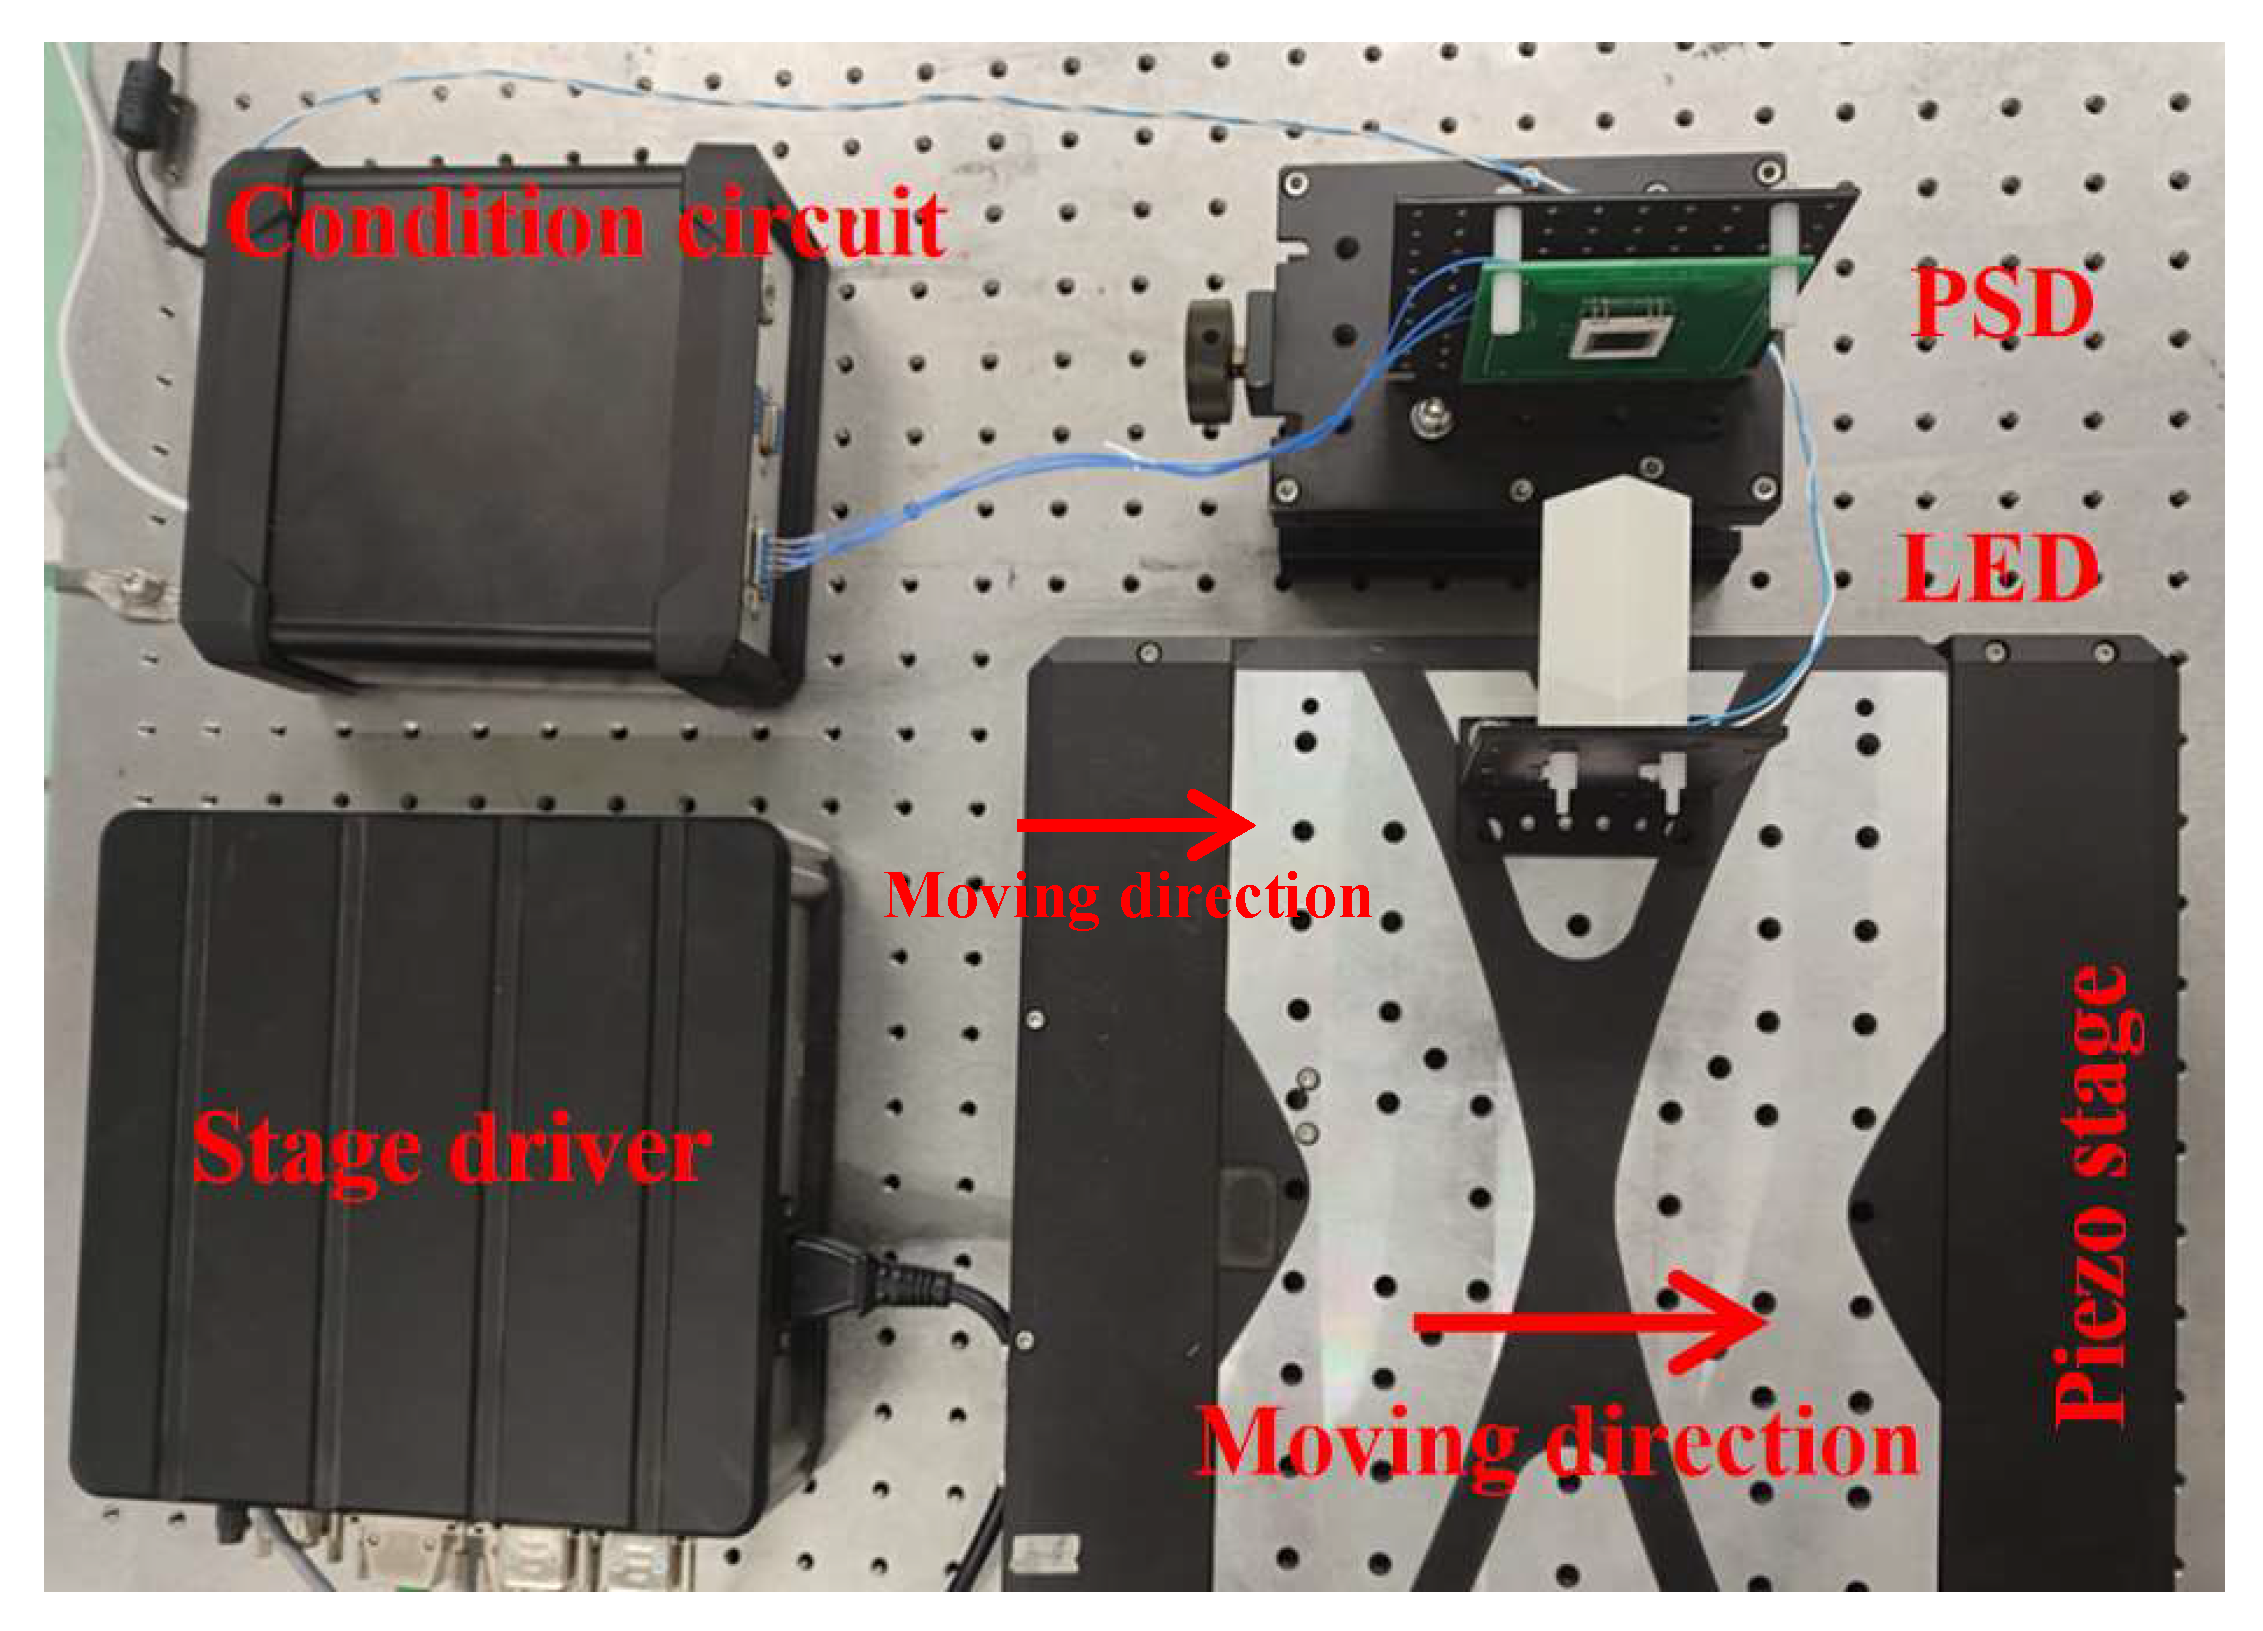
We estimated the resolution of our displacement measurement system. The schematic of the setup for this estimation is shown in Figure 4. We put the light source on a piezo stage (L-731.4ASD, Physik Instrumente, Karlsruhe, Germany) with a unidirectional repeatability of 50 nm and the PSD on the optical bench. We aligned the light source so that the output beam was incident on the area near the center of the PSD, which was the actual start point. We set a displacement and velocity value for the piezo stage. We controlled the stage to move in steps in the negative x direction and used the PSD to acquire the signal simultaneously. The measurement continued for 20 s after the displacement was finished. The above process was repeated 11 times. Similarly, we conducted the measurement in the y direction by rotating the PSD by 90°. We conducted this measurement on the area near the center of the PSD, although the measurable displacement range of the system was 8 mm, which was calculated by subtracting the spot diameter from the size of the PSD sensor. This is because the non-linearity in the center area is generally smaller than that in the outer area; thus, an accurate position of the light spot was obtained without any calibration. By subtracting two adjacent positions of the light spot, the displacement of the LED was achieved.
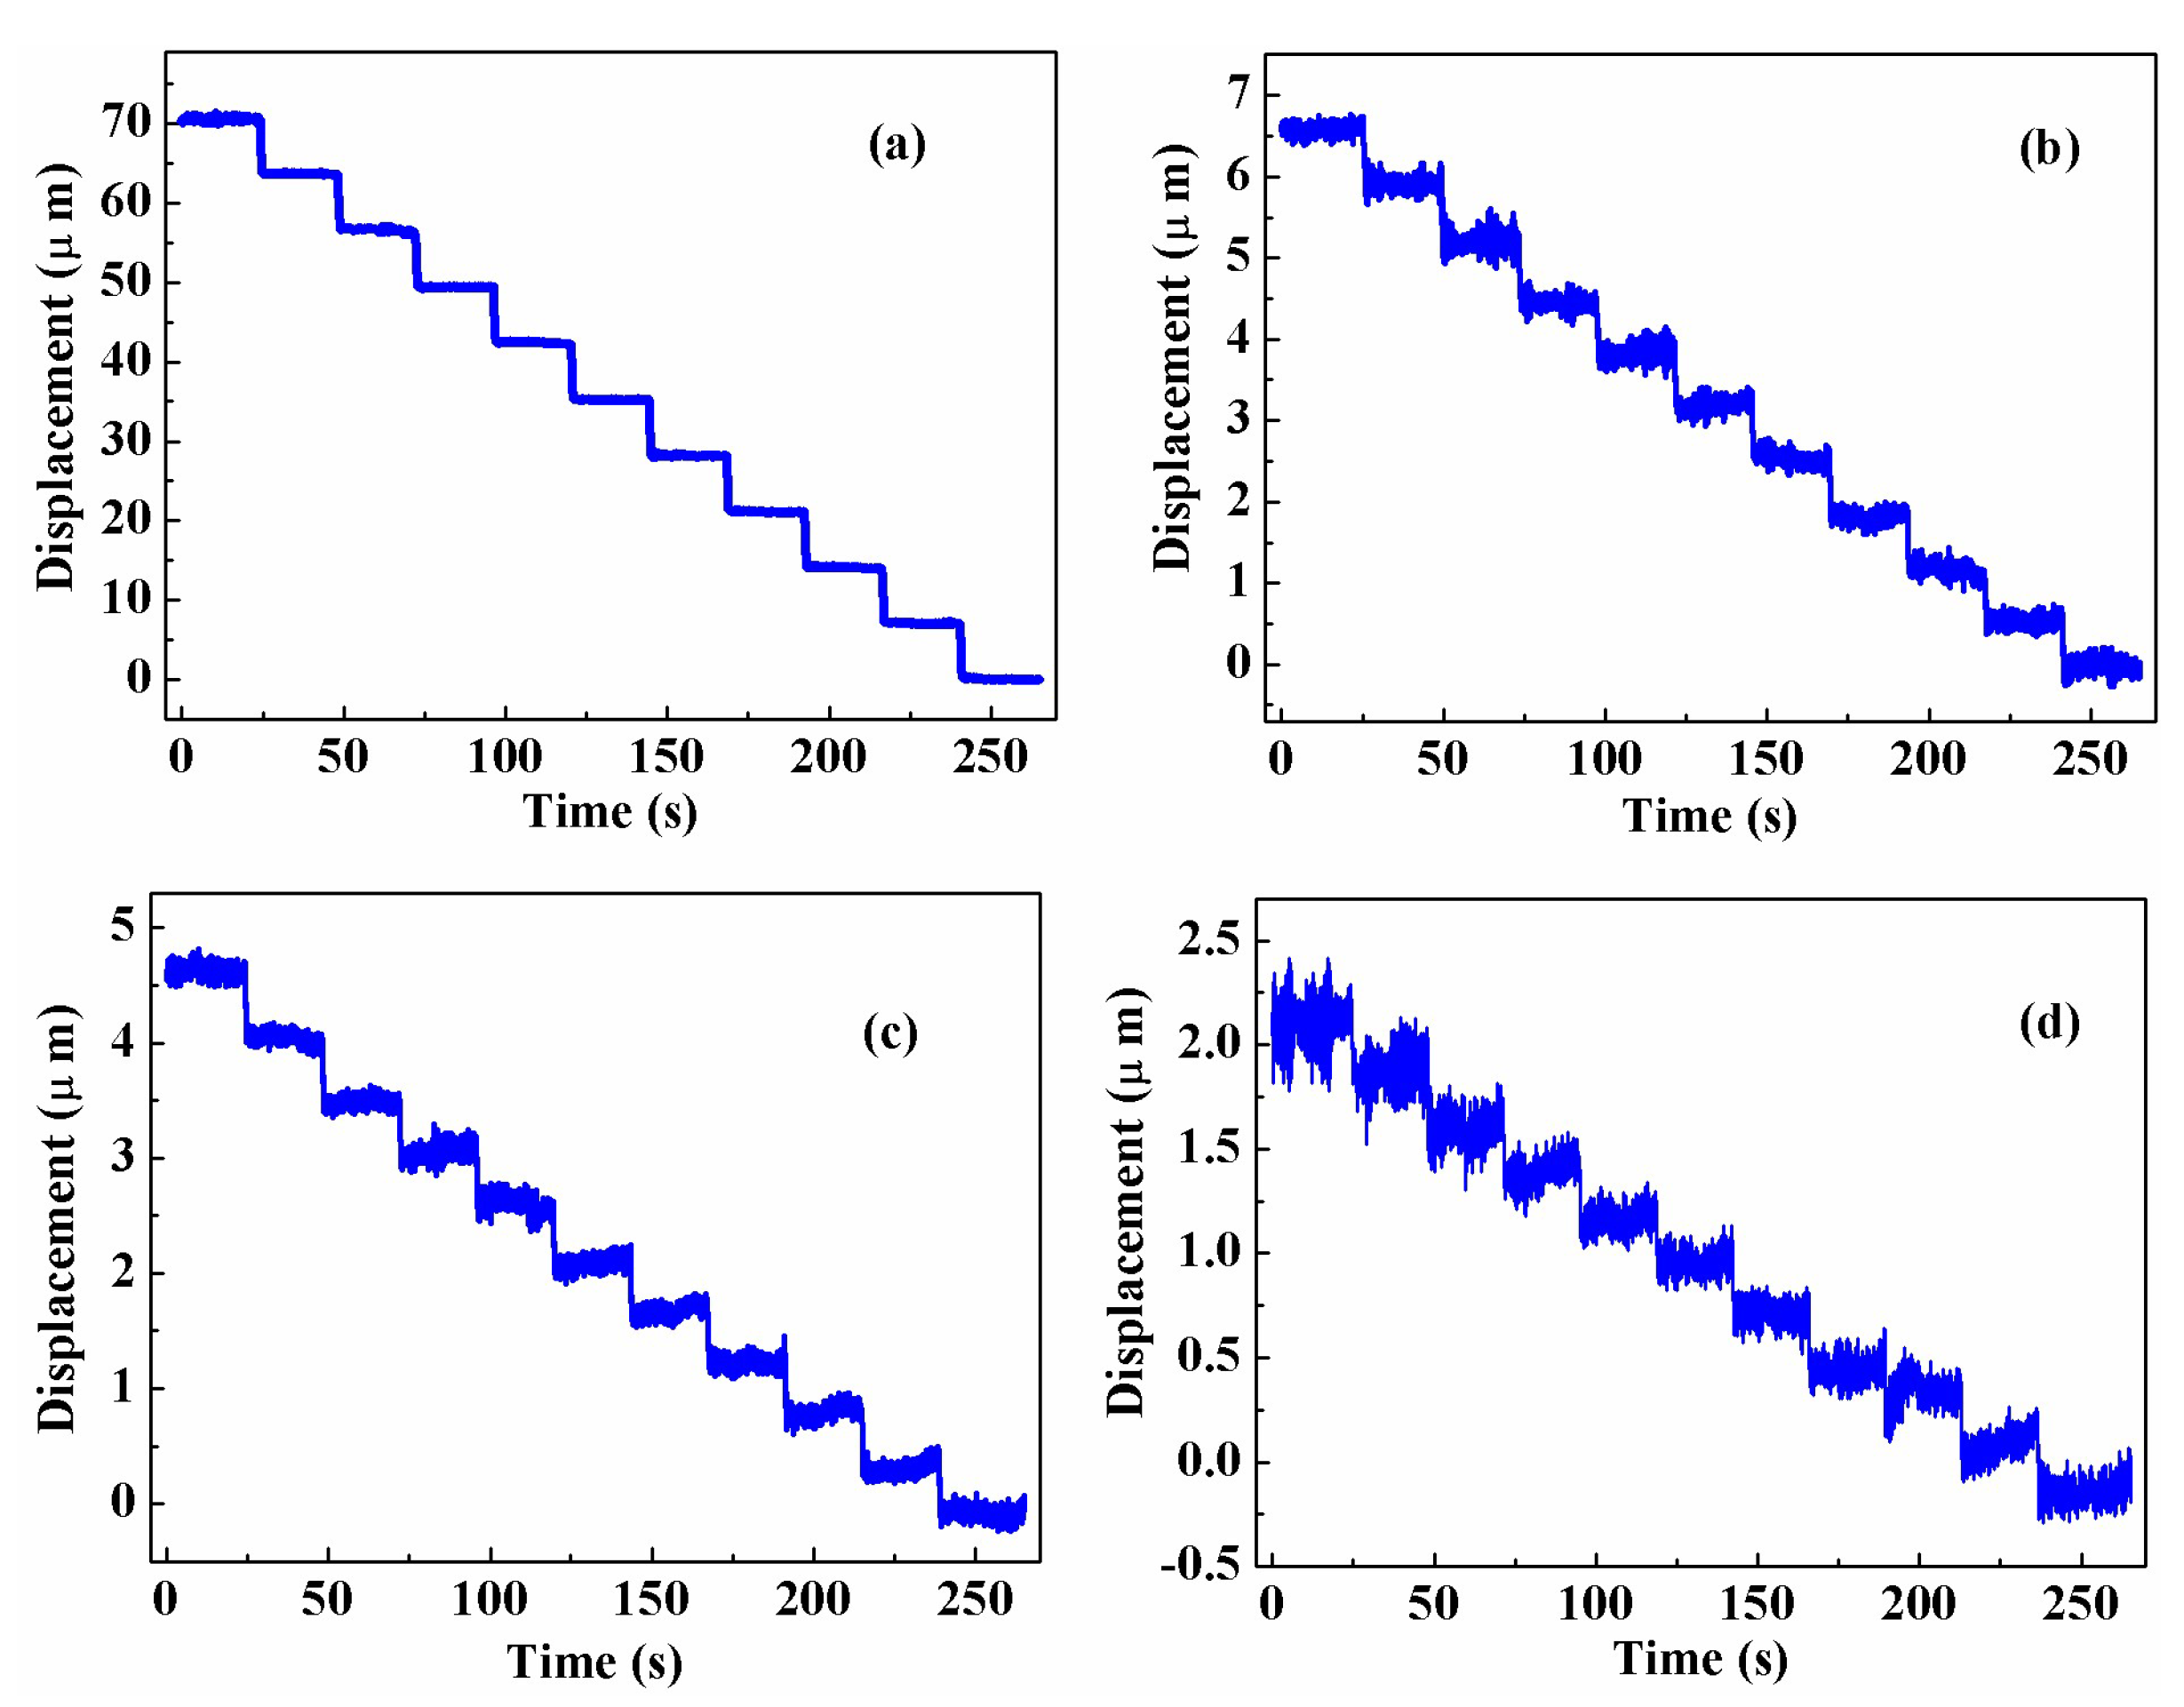
The results obtained in the two directions are very similar. Figure 5a, 5b, 5c, and 5d, respectively, show typical displacements measured in the x direction when we set the step size of the piezo stage to 7 μm, 0.7 μm, 0.5 μm, and 0.3 μm. Here, to show the results intuitively, we offset the date points so that the end points were at the origin point. It is shown that the response of the PSD in the time domain is a step function. We explain this phenomenon by the ratio of the movement time of the stage to the static measurement time. The time for the stage to finish each displacement was about 1 s, while the static measurement time was set to 20 s. Because of the small time ratio, the stage-moving process is not visible in Figure 5; thus, a step phenomenon can be observed. The system clearly resolved the displacement set to the piezo stage when the step size was 0.5 μm and above, and cross-talk happened when the step size was 0.3 μm. Thus, we defined 0.5 μm as the resolution of our system.
We tested the performance of our displacement measurement system when exposed to 60Co radiation. The experiment was performed at the Institute of Low-Energy Nuclear Physics at Beijing Normal University. The 60Co source was a single-grid planar source placed in a water well, which had a radioactivity value of 3.7 × 10¹⁴ Bq. Its dose rate was calibrated using Fricke dosimeters, both from Beijing Normal University and the National Institute of Metrology [28]. The total uncertainty of nominal doses was estimated at ±2% (2 sigma). We set the radiation dose from 50 krad to 100 krad with a step size of 10 krad. This dose range was chosen because components at high orbits generally have to withstand a total irradiation dose of 100 krad, and components that can only withstand a total irradiation dose below 50 krad are hardly considered at high orbits. The step size was chosen to ensure sufficient data points while maintaining time efficiency. The distance between the 60Co source and our system was about 15 cm. Initially, we measured the system’s precision in this experimental platform with the 60Co radiation source turned off. The 60Co radiation source was raised to the experiment platform when it was turned on. We measured precision at each dose step for 100 s to fully study the effect of 60Co radiation on precision. Figure 6a depicts the variation in radiation dose and the corresponding spot position in the x direction with time. When the 60Co radiation source was turned off, the standard deviation and precision were 0.22 μm and 0.66 μm. When the radiation dose was set from 50 krad to 100 krad, the precision was hardly affected. Figure 6b depicts the variation in radiation dose and the corresponding spot position in the y direction with time. The standard deviation and precision were 0.18 μm and 0.54 μm at the beginning and were not affected when the 60Co radiation source was turned on. Here, the precision was a little higher than that measured above; this is probably because it is difficult to completely block environment light and isolate environment vibration. Our system has good resistance to 60Co radiation.
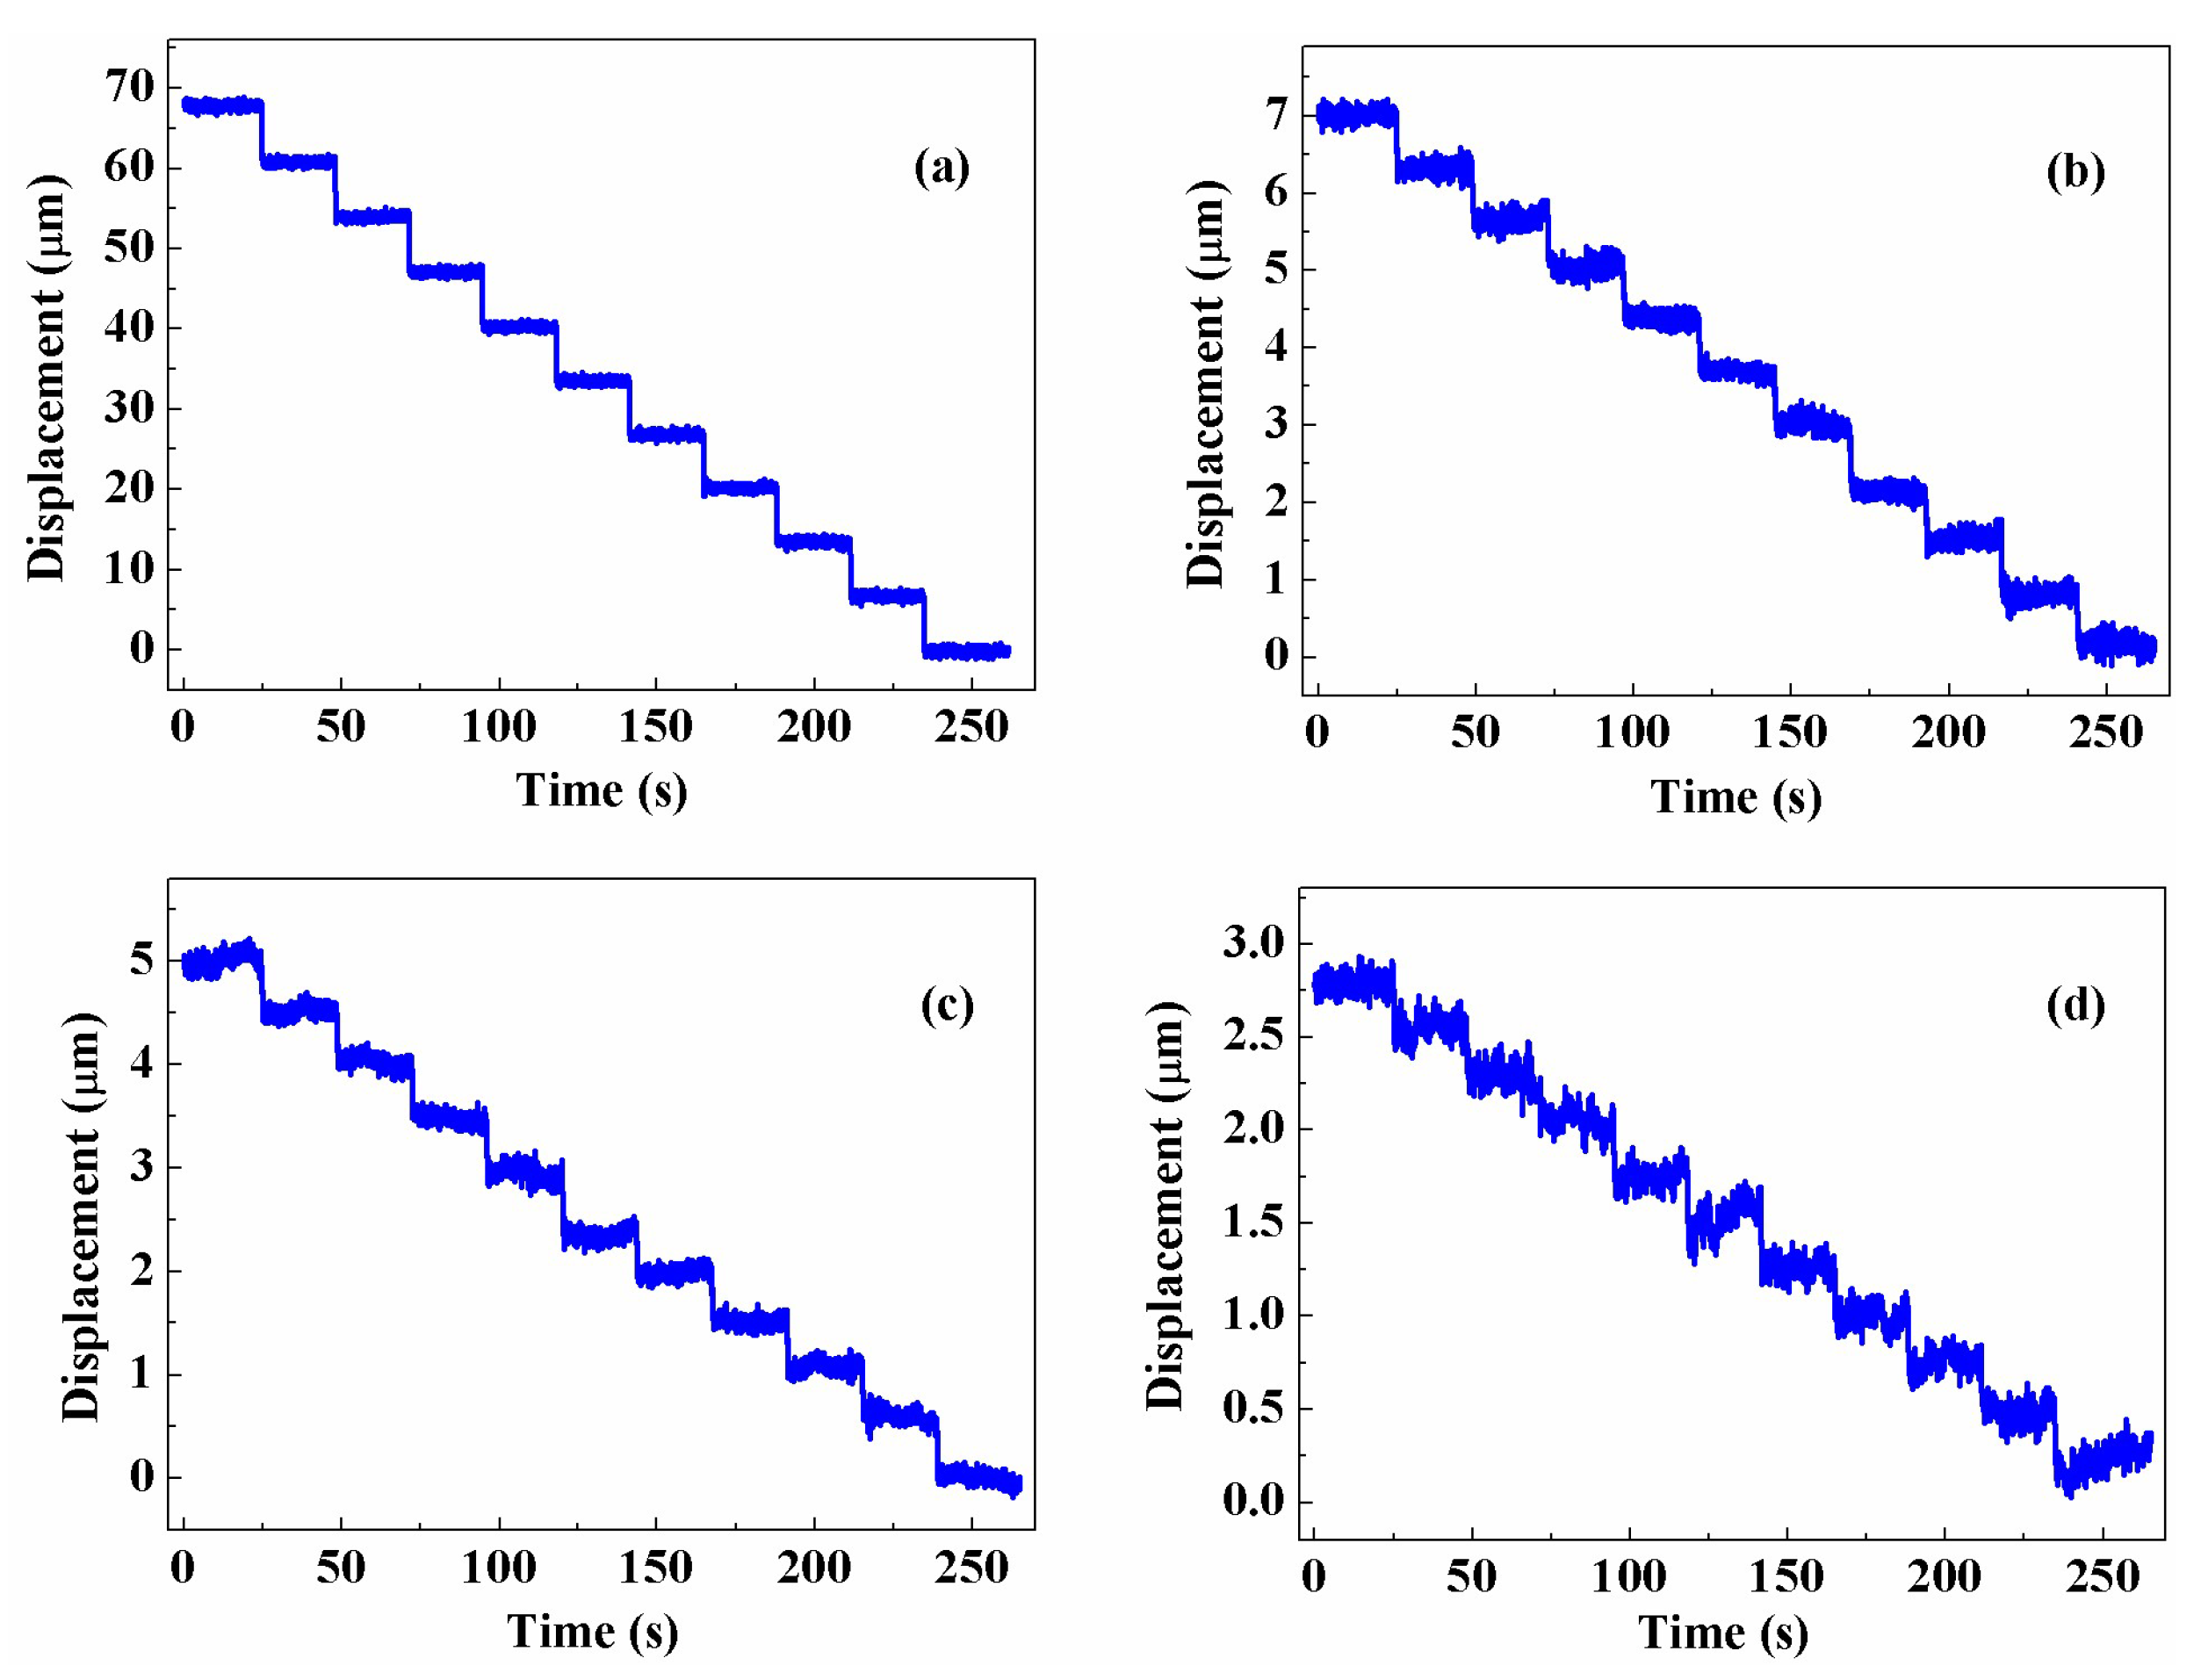
We measured the precision and resolution of our system after 48 h of annealing to fully estimate the influence of 60Co radiation. We conducted the measurement in the same way as that conducted before radiation. Figure 7a shows the light-spot position measured in a 20 s period after annealing, together with that measured before radiation in the x direction. The standard deviation and precision after annealing were 0.15 μm and 0.45 μm, which are comparable with the values obtained before being exposed to radiation. A similar trend was obtained in the y direction, as shown in Figure 7b. The standard deviation and precision after annealing were 0.12 μm and 0.36 μm. Figure 8 shows the displacement measured by our annealed system when step displacements of 7 μm, 0.7 μm, 0.5 μm, and 0.3 μm were set. The results are similar to those shown in Figure 5, which means that our system kept the resolution of 0.5 μm after 48 h of annealing after being exposed to 60Co radiation. When combining the results measured before radiation, during the radiation process, and after annealing, it can be concluded that our system is highly resilient to 60Co radiation.

4. Discussion

The resolution of a PSD ΔR is determined by Equation (3), where L is the length of the photosensitive area, In is the noise current, and Io is the total photocurrent. In is calculated using Equation (4), where Is is the shot noise current originating from the photocurrent and dark current, Ij is thermal noise current generated from the interelectrode resistance on the PSD sensor, and Ien is the noise current from the equivalent input voltage noise of the amplifier. Is, Ij, and Ien are, respectively, expressed by Equations (5)–(7), where q is the electron charge, B is the bandwidth, k is Boltzmann’s constant, T is absolute temperature, Rie is the interelectrode resistance, and en is the equivalent input voltage noise of the amplifier. According to Equation (3), increasing the photocurrent and decreasing noise play an equal role in improving the resolution of a PSD. Although the use of 2D materials can effectively increase the photocurrent, the PSD using 2D materials is yet to be produced. A practical way is to design a condition circuit with low noise to increase the resolution. Compared to the commercial SPC02 circuit from Sitek, the noise of our circuit is about 30-times lower [29]. Moreover, our circuit outperforms in terms of bandwidth and operating temperature [29], as shown in Table 1. The noise, bandwidth, and operating temperature of our circuit are also superior to those of the commercial circuits from Hamamatsu [30]. Compared to the self-designed circuits that use elements with a similar operating temperature range [26,27], our circuit has lower-voltage noise density.
R = L × I n I o
I n = I s 2 + I j 2 + I e n 2
I s = 2 q ( I o + I D ) B
I j = 4 k T B R i e
I e n = e n R i e B

5. Conclusions

In summary, we introduced a method for improving the precision and resolution of sensing systems based on PSDs and the radiation-resistance properties of a PSD-based displacement sensing system. We improved the precision and resolution by reducing the gain of the amplifier of the condition circuit and conducting spatial filtering to the measured spot position. We designed a condition circuit with a gain of the amplifier of ten thousand, which is an order of magnitude lower than that of a commercial condition circuit, and compensated the gain by increasing light power impinging on the PSD sensor. We then conducted spatial filtering on the measured spot position using a Butterworth low-pass filter with a cut-off frequency of 1 Hz. With the use of our method, a precision of 0.3 μm and a resolution of 0.5 μm were obtained. The precision is two orders of magnitude better than that obtained with the use of a commercial condition circuit and without using any filter. In addition, the system kept the precision and resolution after being exposed to 60Co radiation with the dose set to 100 krad. Our study is very useful to realize high-precision PSD-based sensing in space.

Author Contributions

Conceptualization, M.Y.; methodology, M.Y. and G.C.; software, T.Z., K.D. and G.C.; validation, A.X. and Z.Y.; formal analysis, G.C.; investigation, G.C., T.Z., K.D. and H.C.; resources, M.Y. and A.X.; data curation, X.R.; writing—original draft preparation, G.C. and X.R.; writing—review and editing, X.R.; visualization, X.R.; supervision, M.Y.; project administration, M.Y.; funding acquisition, M.Y. and X.R. All authors have read and agreed to the published version of the manuscript.

Funding

This research was funded by the National Nature Science Foundation of China (No. 12304332) and Center of Space Utilization, Chinese Academy of Sciences (No. T318231).

Institutional Review Board Statement

Not applicable.

Informed Consent Statement

Not applicable.

Data Availability Statement

The data presented in this study are available on request from the corresponding authors due to privacy.

Conflicts of Interest

The authors declare no conflicts of interest.

References

  1. Preumont, A. Active Damping, Vibration Isolation, and Shape Control of Space Structures: A Tutorial. Actuators 2023, 12, 122. [Google Scholar] [CrossRef]
  2. Liu, C.; Jing, X.; Daley, S.; Li, F. Recent advances in micro-vibration isolation. Mech. Syst. Signal Process. 2015, 56–57, 55–80. [Google Scholar] [CrossRef]
  3. Tu, H. An overview of the development of intelligent materials and active vibration isolation systems for vehicles. J. Phys. Conf. Ser. 2023, 2649, 012020. [Google Scholar] [CrossRef]
  4. Schmidt, R.H. Ultra-precision engineering in lithographic exposure equipment for the semiconductor industry. Philos. Trans. A Math. Phys. Eng. Sci. 2012, 370, 3950–3972. [Google Scholar] [CrossRef]
  5. Li, H.; Li, D.; Lou, Q.; Liu, C.; Lan, T.; Yu, X. Advancements in Optical Resonator Stability: Principles, Technologies, and Applications. Sensors 2024, 24, 6473. [Google Scholar] [CrossRef]
  6. Gong, W.; Li, A.; Huang, C.; Che, H.; Feng, C.; Qin, F. Effects and Prospects of the Vibration Isolation Methods for an Atomic Interference Gravimeter. Sensors 2022, 22, 583. [Google Scholar] [CrossRef]
  7. Yuan, Z.; Zhang, Z.; Zeng, L.; Li, X. Key technologies in active microvibration isolation systems: Modeling, sensing, actuation, and control algorithms. Measurement 2023, 222, 113658. [Google Scholar] [CrossRef]
  8. Liu, J.; Zhang, X.; Wang, C.; Yan, R. Active vibration control technology in China. IEEE Instrum. Meas. Mag. 2022, 25, 36–44. [Google Scholar] [CrossRef]
  9. Zhao, Y.; Wang, X. A Review of Low-Frequency Active Vibration Control of Seat Suspension Systems. Appl. Sci. 2019, 9, 3326. [Google Scholar] [CrossRef]
  10. Meng, X.; Sun, S.; Yan, X.; Liu, F.; Cao, L.; Wang, Q.; Sun, Y. Six-Degree-of-Freedom Posture Measurement Technologies Using Position Sensitive Detectors (PSDs): State of the Art. Micromachines 2022, 13, 1903. [Google Scholar] [CrossRef]
  11. Yu, H.S.; Yu, N.C.; Rim, J.A.; Jo, M.J. Widely sensitive optical humidity module by using acrylic resin and a position sensitivity detector. Opt. Quantum Electron. 2020, 52, 469. [Google Scholar] [CrossRef]
  12. Zhou, G.; Li, L.; Zhou, Y.; Chen, X. High-Sensitivity Seawater Refraction Index Optical Measurement Sensor Based on a Position-Sensitive Detector. Sensors 2024, 24, 2050. [Google Scholar] [CrossRef]
  13. Zhou, G.; Liu, Q.; Wang, H.; Li, L.; Zhou, Y.; Chen, X. Optical Detection of Underwater Propeller Wake Based on a Position-Sensitive Detector. Photonics 2024, 11, 732. [Google Scholar] [CrossRef]
  14. Zhang, W.; Wang, L.; Li, G.; Zheng, H.; Pang, C. High-Precision Main Shaft Displacement Measurement for Wind Turbines Using an Optimized Position-Sensitive Detector. Electronics 2024, 13, 5055. [Google Scholar] [CrossRef]
  15. Bello, V.; Bodo, E.; Merlo, S. Optical Identification of Parenteral Nutrition Solutions Exploiting Refractive Index Sensing. Sensors 2022, 22, 6815. [Google Scholar] [CrossRef]
  16. Wang, Z.; Liu, Y.; Wang, X.; Zhang, D.; Qin, L.; Liu, J.; Li, M.; Liu, J.C. Field calibration method for industrial robots based on single position sensitive device. IEEE Trans. Instrum. Meas. 2023, 72, 7506112. [Google Scholar] [CrossRef]
  17. Blank, S.; Shen, Y.; Xi, N.; Zhang, C.; Wejinya, U.C. High precision PSD guided robot localization: Design, mapping, and position control. In Proceedings of the 2007 IEEE/RSJ International Conference on Intelligent Robots and Systems, San Diego, CA, USA, 29 October–2 November 2007; pp. 52–57. [Google Scholar]
  18. Fortunato, E.; Lavareda, G.; Martins, R.; Soares, F.; Fernandes, L. Large-area 1D thin-film position-sensitive detector with high detection resolution. Sens. Actuators A Phys. 1995, 51, 135–142. [Google Scholar] [CrossRef]
  19. Hu, C.; Wang, X.; Song, B. High-performance position-sensitive detector based on the lateral photoelectrical effect of two-dimensional materials. Light Sci. Appl. 2020, 9, 88. [Google Scholar] [CrossRef]
  20. Wang, W.; Lu, J.; Ni, Z. Position-sensitive detectors based on two-dimensional materials. Nano Res. 2020, 14, 1889–1900. [Google Scholar] [CrossRef]
  21. Jiang, H.; Fu, J.; Nie, C.; Sun, F.; Tang, L.; Sun, J.; Meng, Z.; Shen, J.; Feng, S.; Shi, H.; et al. Gate modulation enhanced position-sensitive detectors using graphene/silicon-on-insulator structure. Carbon 2021, 184, 445–451. [Google Scholar] [CrossRef]
  22. Song, H.X.; Wang, X.D.; Ma, L.Q.; Cai, M.Z.; Cao, T.Z. Design and Performance Analysis of Laser Displacement Sensor Based on Position Sensitive Detector (PSD). J. Phys. Conf. Ser. 2006, 48, 217–222. [Google Scholar] [CrossRef]
  23. Rahimi, M.; Luo, Y.; Harris, F.C.; Dascalu, S.M.; Shen, Y. Improving measurement accuracy of position sensitive detector (PSD) for a new scanning PSD microscopy system. In Proceedings of the 2014 IEEE International Conference on Robotics and Biomimetics (ROBIO 2014), Bali, Indonesia, 5–10 December 2014; pp. 1685–1690. [Google Scholar]
  24. Sun, S.; Zheng, Q.; Meng, X.; Sun, P.; Liu, F.; Cao, L. High positional resolution pin-cushion position sensitive detector by deliberately introducing barrel distortion. IEEE Sens. J. 2021, 22, 1280–1286. [Google Scholar] [CrossRef]
  25. Narayanan, C.; Buckman, A.B.; Busch-Vishniac, I. Noise analysis for position-sensitive detectors. IEEE Trans. Instrum. Meas. 1997, 46, 1137–1144. [Google Scholar] [CrossRef]
  26. Ivan, I.A.; Ardeleanu, M.; Laurent, G.J. High dynamics and precision optical measurement using a position sensitive detector (PSD) in reflection-mode: Application to 2D object tracking over a Smart Surface. Sensors 2012, 12, 16771–16784. [Google Scholar] [CrossRef]
  27. Geng, L.; Cao, G.; Shang, C.; Ding, H. Absolute Photoelectric Encoder Based on Position-Sensitive Detector Sensor. Electronics 2024, 13, 1446. [Google Scholar] [CrossRef]
  28. Xie, L.Q.; Song, H.B.; Wang, P.C.; Zhang, Y.F.; Gu, H.C.; Liu, X.G. Dosimetry of a 3-5 MeV linear electron accelerator for radiation processing. In Proceedings of the 6th Japan-China bilateral symposium on radiation chemistry, Tokyo, Japan, 6–11 November 1994; pp. 338–343. [Google Scholar]
  29. SiTek Electro Optics. Available online: https://www.sitek.se/ (accessed on 11 August 2025).
  30. Hamamatsu Photon Is Our Business. Available online: https://www.hamamatsu.com/us/en/product/optical-sensors/distance-position-sensor/psd/psd-circuit.html (accessed on 11 August 2025).
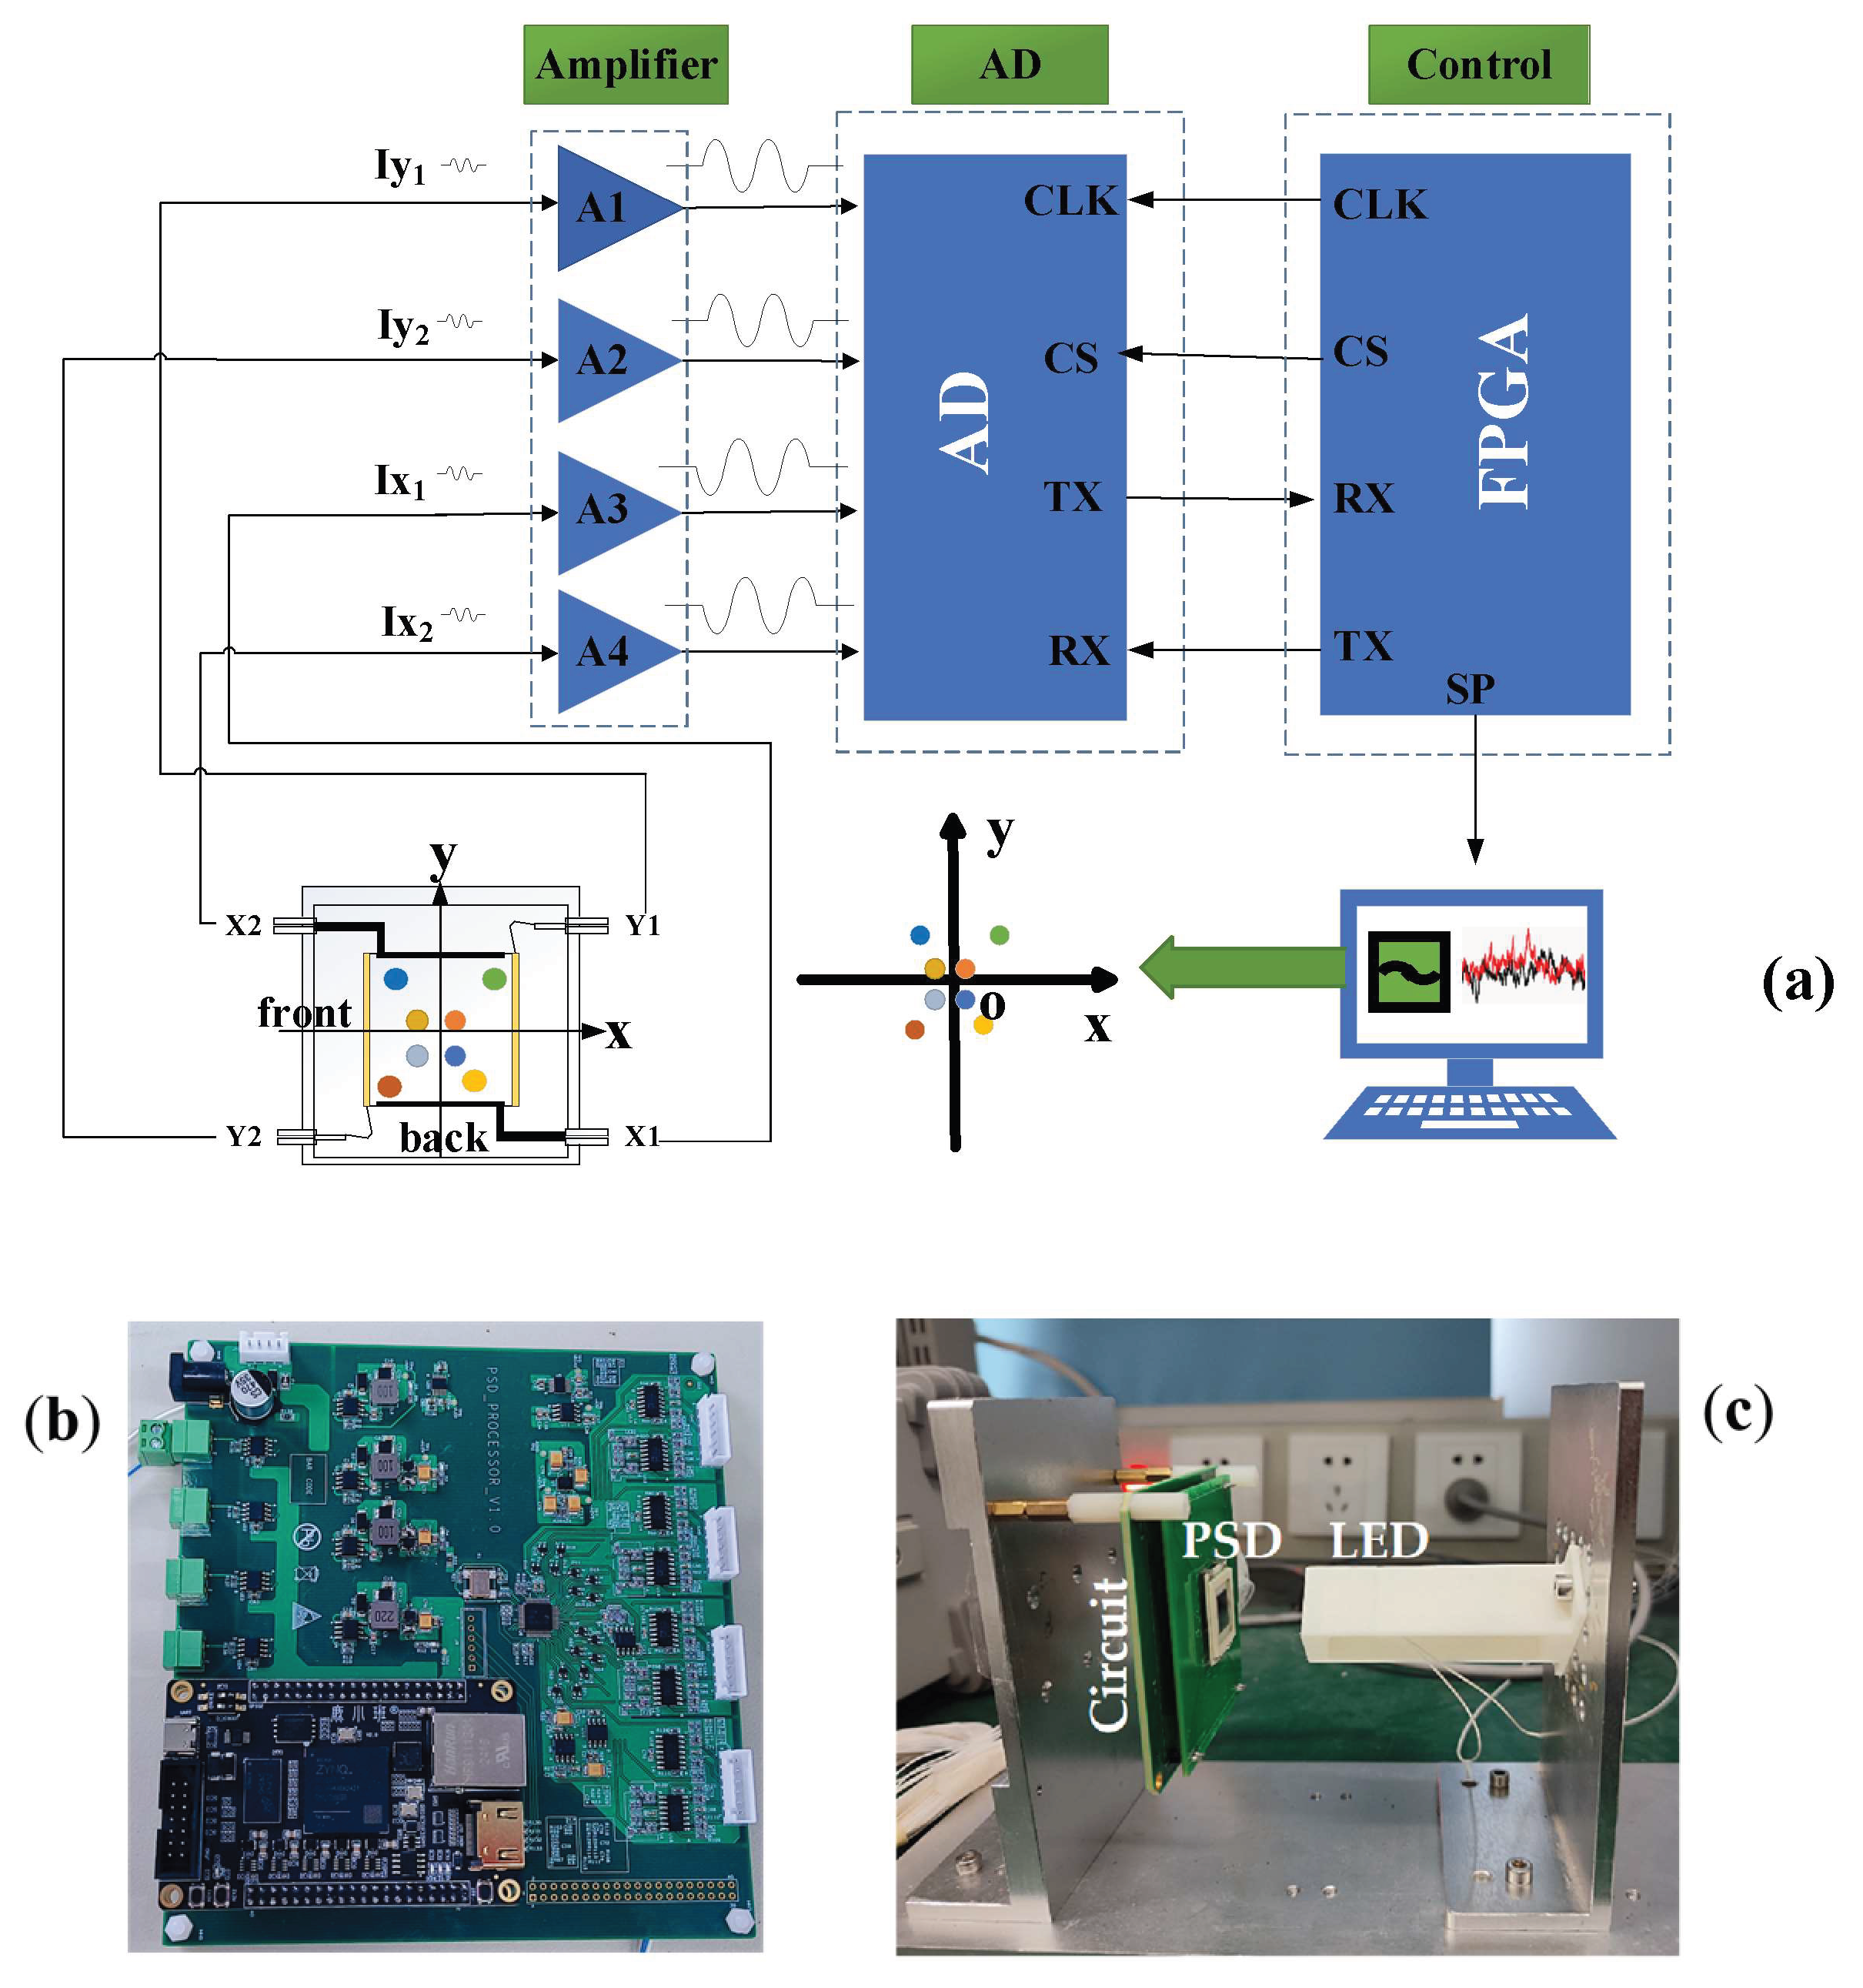
Figure 1. (a) Schematic of a 2D PSD and the self-designed condition circuit. (b) A photo of the self-designed condition circuit. (c) The PSD-based sensing system used to demonstrate the self-designed condition circuit. AD: analog-to-digital converter; FPGA: field programmable gate array; CLK: clock; CS: chip-selecting; RX: receiver; TX: transmitter; SP: serial port.
Applsci 15 09383 g001
Figure 2. Variation in the position of the light spot on the PSD with time measured using the self-designed condition circuit and a commercial condition circuit: (a) in the x direction and (b) in the y direction.
Applsci 15 09383 g002
Figure 3. Variation in the position of the light spot on the PSD with time with and without using a Butterworth low-pass filter: (a) in the x direction and (b) in the y direction.
Applsci 15 09383 g003
Figure 4. Schematic of the setup used to characterize the system’s resolution.
Applsci 15 09383 g004
Figure 5. Displacement measured by our system when the step size was set to (a) 7 μm, (b) 0.7 μm, (c) 0.5 μm, and (d) 0.3 μm.
Applsci 15 09383 g005
Figure 6. Variation in the radiation dose and corresponding position of the light spot on the PSD with time: (a) in x direction; (b) in y direction.
Applsci 15 09383 g006
Figure 7. Variation in the position of the light spot on the PSD with time measured after 48 h of annealing and before radiation: (a) in the x direction and (b) in the y direction.
Applsci 15 09383 g007
Figure 8. Displacement measured by our system after annealing when the step size was set to (a) 7 μm, (b) 0.7 μm, (c) 0.5 μm, and (d) 0.3 μm.
Applsci 15 09383 g008
Table 1. Comparison between commercial circuit and self-designed circuit.
SPC02 CircuitSelf-Designed Circuit
Noise voltage3 mV0.1 mV
Bandwidth400 kHz5 MHz
Dimension
(Amplification part)
21 mm × 21 mm33 mm × 33 mm
Operating temperature70 °C maximum−40~125 °C
Disclaimer/Publisher’s Note: The statements, opinions and data contained in all publications are solely those of the individual author(s) and contributor(s) and not of MDPI and/or the editor(s). MDPI and/or the editor(s) disclaim responsibility for any injury to people or property resulting from any ideas, methods, instructions or products referred to in the content.