Article

Analysis of Variables in Accelerated Carbonation Environment for the Processing of Electric Arc Furnace Slag Aggregate

1
Doctoral Program in Engineering at the MacroFacultad de Ingeniería UFRO-UBB-UTAL, Temuco 4780000, Chile
2
Department of Civil Engineering, Universidad de La Frontera, Temuco 4780000, Chile
3
Escuela Superior de Ingeniería y Tecnología, Universidad Internacional de La Rioja, Avda. de la Paz, 137, 26006 Logroño, Spain
4
Facultad de Ingeniería, Universidad Autónoma de Chile, Talca 3460000, Chile
*
Author to whom correspondence should be addressed.
Appl. Sci. 2025, 15(17), 9360; https://doi.org/10.3390/app15179360
Submission received: 21 March 2025 / Revised: 17 April 2025 / Accepted: 23 April 2025 / Published: 26 August 2025
(This article belongs to the Special Issue Development and Application of Innovative Construction Materials)

Abstract

Emission reduction in the steel industry has become a challenge due to its high environmental impact, being responsible for 7% of anthropogenic emissions. Several strategies have emerged to mitigate its carbon footprint; among them, carbon capture and storage (CCS) has become a promising long-term alternative. In this work, two low-energy mineral carbonation methods—aqueous and semi-dry—were considered for the processing of a commercial slag derived from electric arc furnace (EAF) steelmaking. These methods were selected for their lower energy and water requirements, as they operate at atmospheric pressure, moderate temperatures, and involve minimal use of chemical additives. Variables such as temperature, time, and the use of sodium carbonate were analysed. Aqueous carbonation favoured a higher carbonate precipitation compared to semi-dry carbonation. However, this process also led to an increase in microcracks on the surface. With respect to the theoretical sequestration rate, carbon dioxide fixation was relatively low, reaching values close to 3%. Nevertheless, when evaluating the overall impact of carbonation on the final material properties, the results suggest that low-consumption mineral carbonation, particularly under simplified operational conditions, is a promising strategy for industrial application. In addition to contributing to CO2 sequestration, this process improves physical properties, which reinforces its potential in carbon capture and storage strategies.

1. Introduction

Steel production is responsible for approximately 7% of anthropogenic emissions [1,2]. This sector, along with the cement industry, is referred to as the heavy carbon industry [1,3,4] because of the environmental impact associated with its high global demand compared to other industries. As for the steel industry, because it has been the subject of debate in recent years [5], various actions have been carried out to achieve a reduction in carbon footprint [6,7]. Promising long-term technologies like CCS are being researched and assessed. Such techniques are widely used in universities but are still uncommon in industries, despite having operational facilities in certain countries [8].
Mineral carbonation with geological and oceanic storage are some of the climate change strategies that CSS offers. Mineral carbonation is generally considered a slow process, with limited reaction rates that pose challenges for commercial deployment [9]. To accelerate this process, a number of solutions have been investigated; their effectiveness is dependent upon the parameters in which the process takes place, for example, the properties of gas, such as its temperature and pressure, and the concentration and solubility of carbon dioxide in the presence of alkaline materials [10].
Due to its potential use, the accelerated carbonation of different materials that come from industrial by-products and wastes has been studied [10]. One of these that has the potential to undergo carbonation is steel-industry slags, mostly composed of metal oxides and inorganic compounds (CaO and MgO). Due to their high pH (higher 11.5) and reduced redox potential (Eh), some slags undergo volumetric expansion, which, in some cases, affects their reusability [11]. This situation is reversed through accelerated mineral carbonation, which, in turn, acts as a carbon dioxide sequestration mechanism and provides additional reuse opportunities.
There are two main forms of carbonation: (1) direct carbonation, which, as the name implies, is a direct reaction that can be carried out in either a dry (gas–solid) or wet (aqueous) manner. Although the process of dry carbonation may appear to be a relatively simple process, it requires elevated temperatures to be effective. And aqueous carbonation is a less energy-intensive and faster process, provided the reaction mechanisms are controlled [12]. On the other hand, indirect carbonation (2) is a process that facilitates the production of high-quality carbonates, as the alkali metals in the material are extracted after several processes and then carbonated. Although this method is more efficient, it thus also increases the value of the technology [13].
The accelerated carbonation environment refers to a set of controlled conditions that enhance the rate of CO2 fixation in the material. This is achieved through the utilisation of pressurised or chemically enriched CO2 sources, elevated or controlled temperatures, and specific liquid–solid ratios that favour dissolution and precipitation reactions [9,13].
Accelerated carbonation has been investigated in slags. It has been demonstrated that this process affects the leaching behaviour of steel slags, increasing the silica and vanadium concentrations and decreasing the calcium concentrations [14]. Furthermore, this carbonation process could enhance environmental classification, which would increase its valorisation possibilities [14]. Different carbonation methods, such as thin-film and slurry-phase routes, have been investigated, with this last carbonation achieving a higher CO2 uptake [15]. Although numerous studies have focused on the carbonation of steelmaking slags, these typically involve basic oxygen furnace slags (BOF) or ladle slags with higher availability and reactivity. Conversely, the investigation of EAF slags remains comparatively limited despite their growing industrial significance. In recent years, the carbonation of steel slags has gained increasing attention as a viable method for CO2 sequestration and waste valorisation, with several studies focusing on optimising process efficiency and material compatibility [13,16].
The novelty of this study lies in the evaluation of two simple and low-consumption mineral carbonation methods applied to a commercially available EAF slag. In addition, the aim was to reduce the pH and the percentage of free lime and free MgO in the material in order to improve carbon dioxide capture. Since this is an industrial study, an attractive method for the scalability of the steel slag carbonation process was sought. A commercial slag product called ‘ERHA®’ was used, and lower-consumption carbonation methods were considered. Variables such as temperature, time, and the use of sodium carbonate were investigated. Finally, the objective of this comparison of techniques was not to achieve high efficiency in the capture of CO2 but to reduce free lime and free MgO and possible expansions in the slag. This, together with the capture of CO2, could make this material a possible substitute for aggregates in the production of concrete mixes.

2. Materials and Methods

2.1. Aggregates

The slag aggregate (ERHA®) used in this study was obtained from EcoAza (Región Metropolitana, Chile), responsible for managing the industrial by-products of electric arc furnace steel production. To obtain the ERHA®, the material is crushed into different sizes. In this case, the aggregates used in this instance had a particle size distribution of less than 2 mm, as show in Figure 1.

2.2. Methods

2.2.1. Aqueous Carbonation

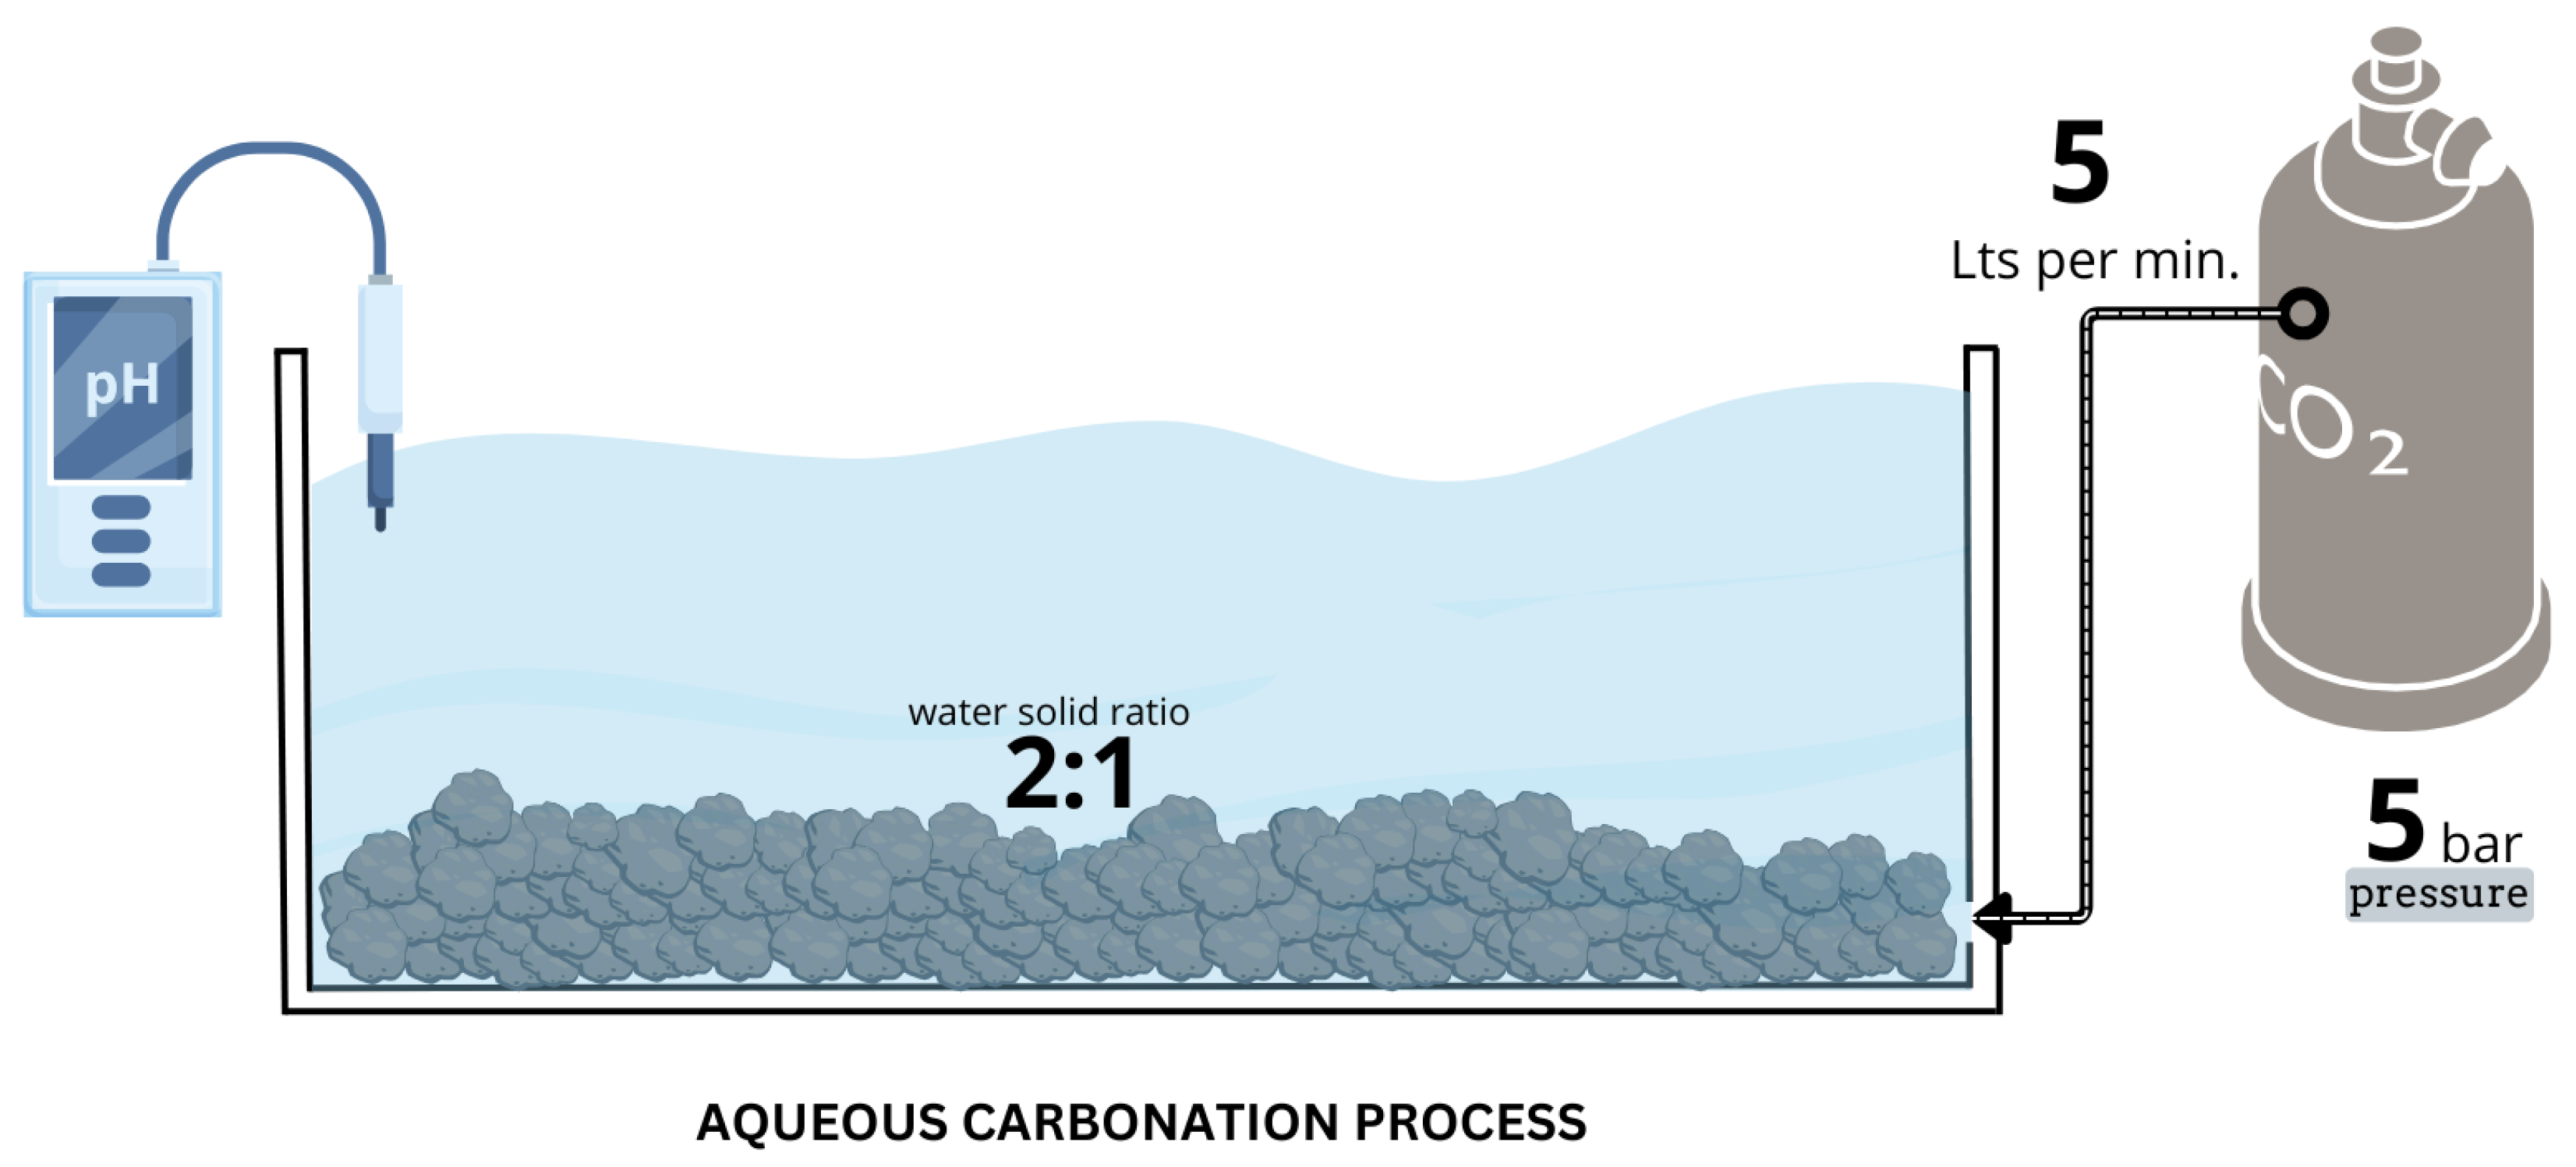
The experiments were conducted at atmospheric pressure within a vessel measuring 15 × 20 × 30 cm, as illustrated in Figure 2. Prior to each process, the aggregates were dried at 80 °C until a constant mass was achieved. All L/S ratios mentioned in this study are expressed as litres of liquid per kilogram of solid (L/kg); for this process, a liquid/solid ratio of 2 L:1 kg was set. The amount of water utilised in the carbonation process has an effect on CO2 diffusion, Ca2+ leaching, and hydration precipitation [17]. According to this parameter, we can have wet carbonation, which is described as a process with an L/S parameter higher than 5:1. Similarly, some research indicates that an L/S ratio of up to 1.5 is referred to as a “thin film method” [18,19]. However, studies also indicate that the presence of excessive water formed a transfer barrier that slowed down the dissolution rate of Ca2+ [20]. Conversely, when the L/S ratio is lower than 2:1, the solid and liquid fail to mix adequately, resulting in lower CO2 transfer efficiency and Ca2+ leaching into the liquid and thereby giving rise to poor CO2 sequestration [21].
The variables analysed are indicated in Table 1. Temperature plays a crucial role in the carbonation process, affecting both the solubility of CO2 and the availability of calcium ions. Previous studies have indicated that the optimal ranges for this process are typically between 50 and 85 °C [22,23,24].
Increases in temperature have been demonstrated to expedite the dissolution of minerals, thus facilitating the release of Ca2+ and promoting the formation of carbonates. Nevertheless, this effect may be counteracted with a decrease in the solubility of carbon dioxide in solution, thereby partly limiting its availability for carbonation. Moreover, an increase in temperature can accelerate the evaporation of water, affecting ion diffusion and thus reducing the efficiency of the process [25].
Conversely, lower carbonation temperatures promote the solubility of carbon dioxide. This means an increased availability in solution and a subsequent enhancement of the process. Nevertheless, under such conditions, calcium leaching has been shown to diminish, thereby impeding the reaction rate and, consequently, the conversion of carbonates [25,26].
Due to the existence of these opposing effects, the optimum temperature for carbonation is not an absolute value but, rather, is contingent on the interaction between the solubility of CO2 and the availability of calcium within the system. Finding a balance between these factors is imperative to optimise the efficiency of the process. The temperature is the value that the ERHA® presented at the time of carrying out the process. Therefore, it was decided to test three different temperatures. In addition, the temperature indicated corresponds to the value reached with the ERHA® at the time of the process. For this purpose, it was previously adjusted to the desired temperature in ovens.
Another controlled parameter was the use of sodium carbonate in solution with distilled water. Aqueous carbonation using sodium compounds is a promising strategy for CO2 capture and utilisation, with sodium carbonate (Na2CO3) being able to facilitate CO2 uptake despite its relatively slow kinetics potentially limiting its efficiency under certain conditions [27]. Its use in aqueous media can improve the availability of carbonate ions, promoting calcium carbonate precipitation, and favour the carbonation process. Finally, the pH value of the solution was also controlled, which, in turn, influenced the carbonation time; see Table 1.
In precise terms, the protocol comprised the addition of ERHA® to the container containing distilled water, at an L/S ratio. An initial measurement was obtained for the pH level of the solution. The injection of gas was then commenced through the base of the vessel at a rate of 5 L/min at 5 bars of pressure. The solution was continuously stirred until a low pH of 9 was achieved. It is important to note that carbonation lowers the natural pH of the steel slag. In this process, both the rate and extent of calcium leaching are inversely related to pH, meaning that maintaining a balanced pH is essential to achieving process efficiency [26,28].

2.2.2. Semi-Dry Carbonation

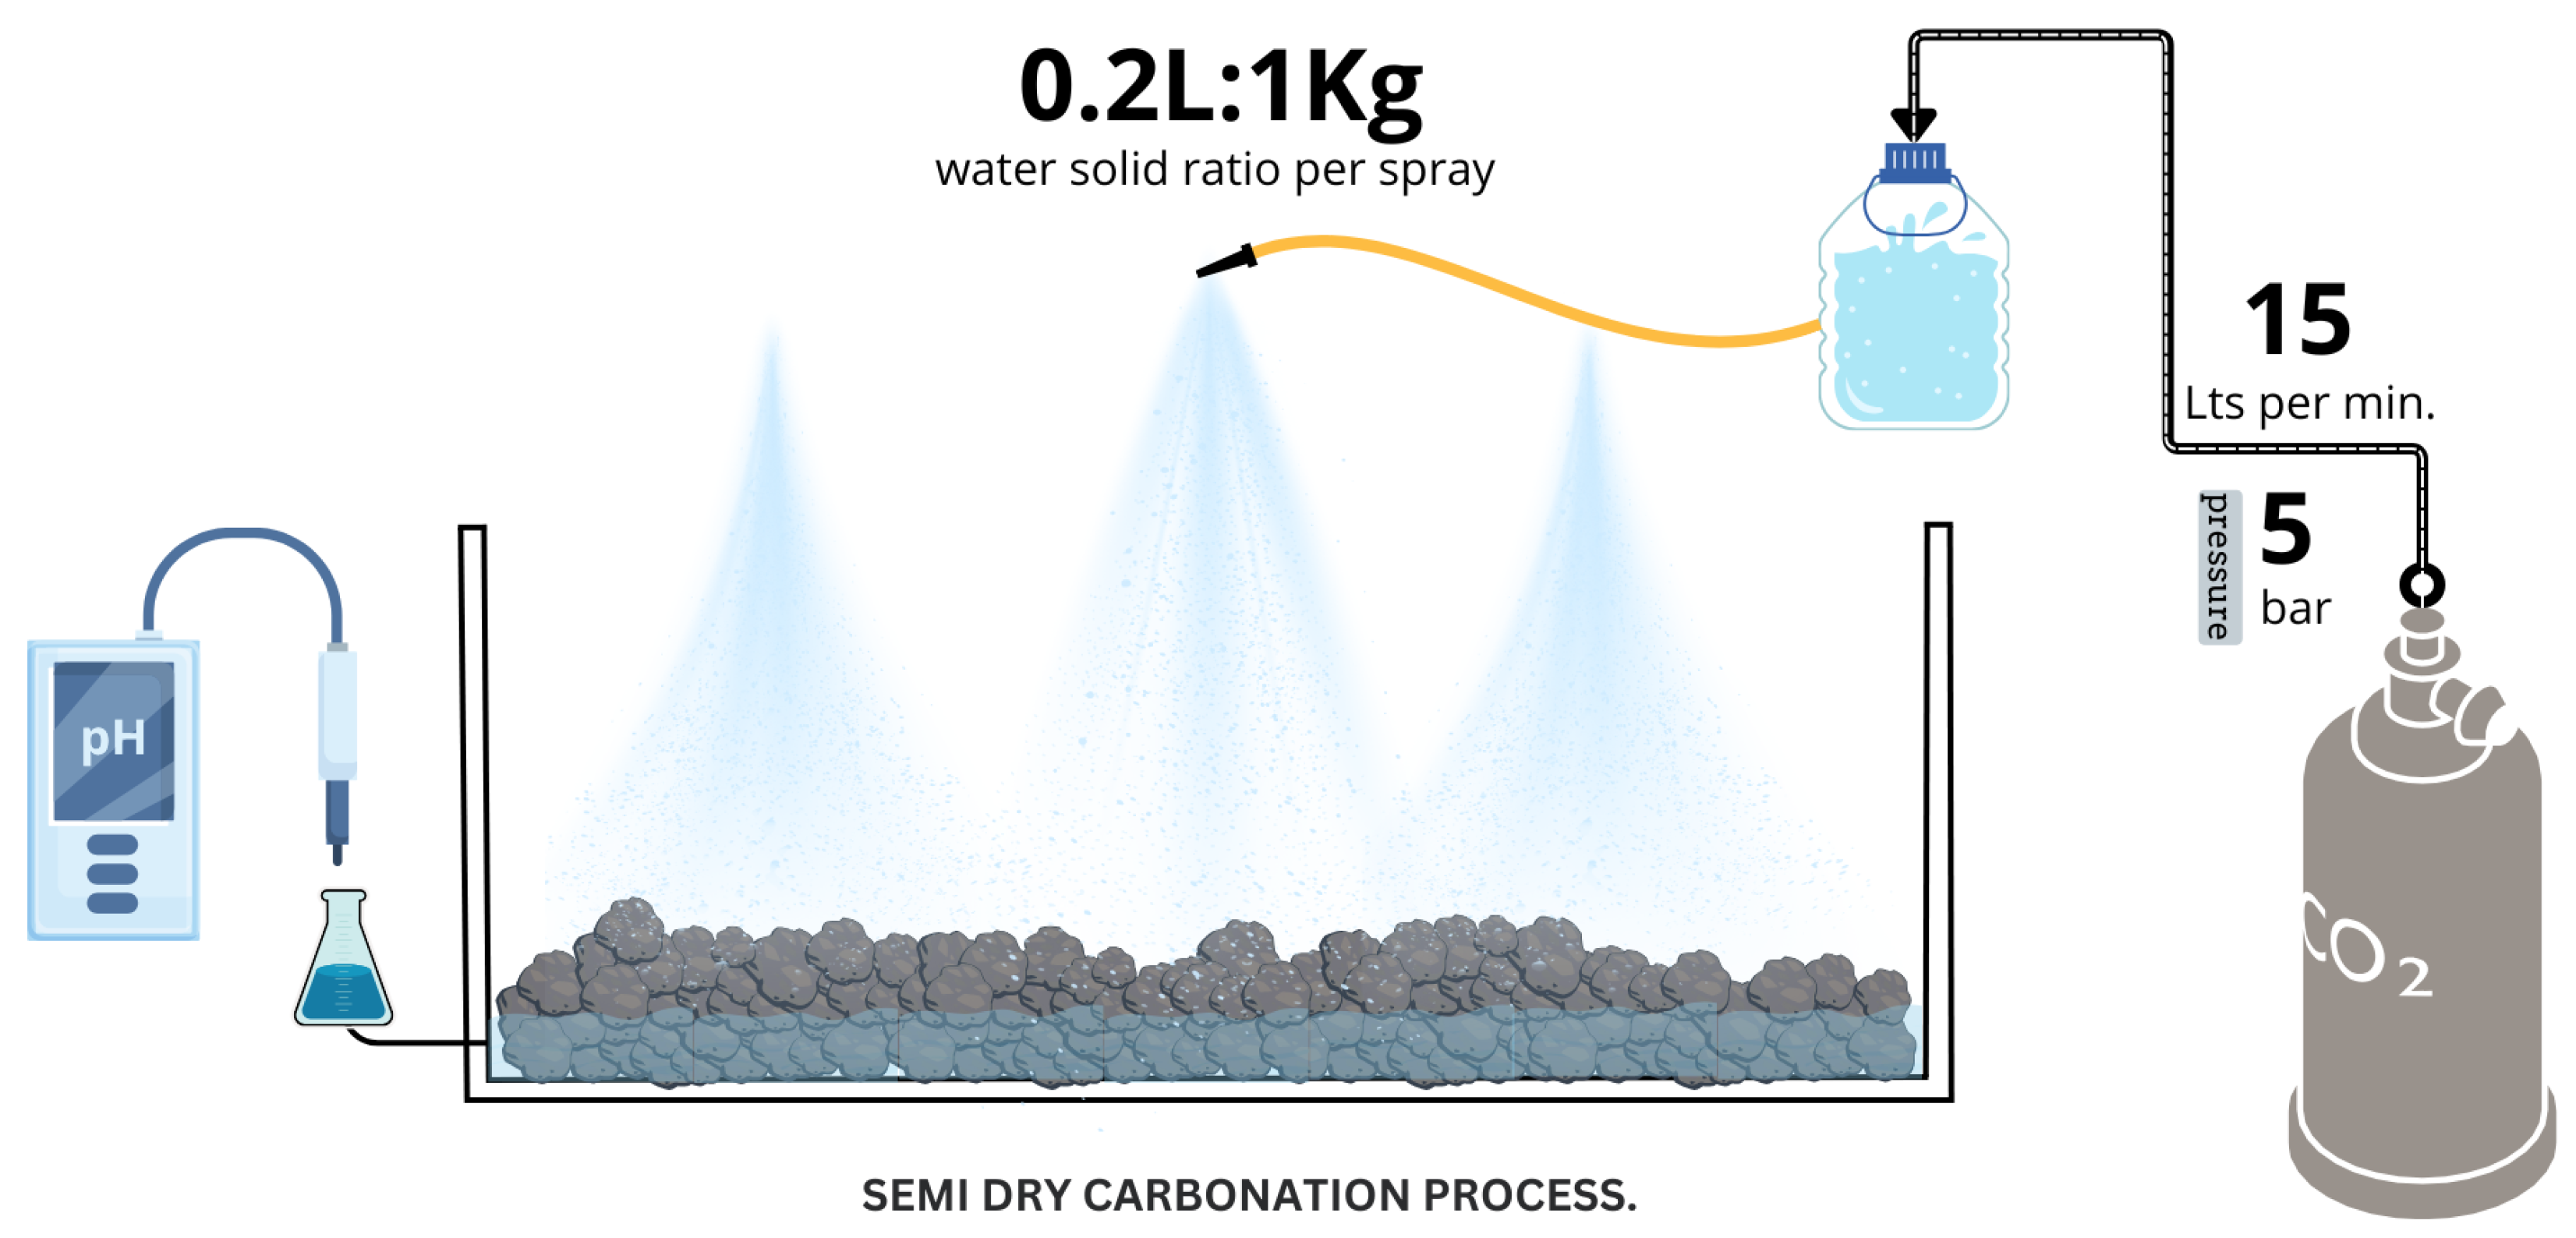
Similar to the previous process, this experiment was carried out at atmospheric pressure. Previously, gas (CO2) was injected at a rate of 15 L/min and a pressure of 5 bars into an airtight vessel containing distilled water; see Figure 3. In addition, in a 15 × 30 × 40 cm container, approximately 1 kg of ERHA® was dispersed in a thin layer of the material.
The material was then sprayed with water at a liquid/solid ratio of 0.2 L:1 kg for each spray. To ensure the homogeneity of the process, the material was stirred at intervals until it was observed that the water had been absorbed. Similar to the aqueous carbonation process, different environmental parameters were taken into account. The number of sprays was analysed. Spraying was repeated after a certain period of time, as described in Table 2. The use of sodium carbonate in the spraying solution was also analysed. After spraying, the container with the ERHA® was left at room temperature until the next spraying.

2.2.3. Characterisation

To characterise the ERHA® samples before and after the different carbonation methods, different physical–chemical and structural tests were carried out.
The bulk density, specific gravity, and water absorption of the aggregates were determined according to NCh1239 [29], which is based on ASTM C128 [30] for fine and coarse aggregates. Bulk density was determined as the ratio between the oven-dry mass and apparent volume, while absorption and porosity were estimated based on water uptake and mass differences under saturated and dry conditions, respectively. Thereafter, the ERHA® samples were ground to a powder with a diameter of less than 75 μm for the subsequent analyses. The chemical composition was determined via X-ray fluorescence spectroscopy (XRF). Furthermore, thermogravimetric analysis (TGA) and X-ray diffraction (XRD) were utilised in order to characterise the material. These are complementary techniques that also allow the characterisation of the material and evaluation of the changes in the composition of the material after carbonation.
The specific surface area of the samples was determined via nitrogen adsorption at 77 K using the multipoint BET method. The analysis was conducted with a Micromeritics 3Flex 4.02 instrument (Micromeritics Instrument Corp., Norcross, GA, USA). Before measurement, the samples were degassed under vacuum with a temperature ramp up to 100 °C and held for 4 h.
XRD analysis was performed on the samples using a D2 Phaser Bruker diffractometer (Bruker AXS GmbH, Karlsruhe, Germany). The diffraction patterns were obtained at an interval of 2 Θ , varying from 25° to 65°, with a step size of 2.5°. The quantification of the mineral phases was performed with the Rietveld refinement method, using Profex software Version 5.2.8 and CIF structure files obtained from the Cambridge Crystallographic Data Centre (CCDC). The refinement’s accuracy was evaluated using Rwp weighting, with values below 5% indicating a reliable fit [31].
A thermogravimetric analysis was carried out using a Q600 thermal analyser, with the sample being heated to 950 °C at a rate of 10 °C per minute. Subsequently, in order to evaluate its microstructure, an analysis was conducted on the HITACHI SU3500 (Hitachi High-Tech Corporation, Tokyo, Japan), utilising a voltage of 10 kV. Coupled with an energy-dispersive spectrometer (EDS) was obtained using a backscattered electron imaging detector and an energy-dispersive spectrometer.

2.2.4. CO2 Capture

The analysis of the CO2 uptake in materials was performed by means of thermogravimetric curves, a process which is utilised for the calculation of the degree of carbonation associated with the mass difference that is associated with carbonates. However, given that calcium carbonate is often present in different crystalline structures and in an amorphous form, it is necessary to determine a suitable temperature range in order to ensure the inclusion of the decomposition reaction. In the present study, in line with several research articles in this field, the CO2 content and CO2 sequestration were evaluated while the mass loss in the temperature range of 550–850 °C was taken into account, as shown in Equations (1) and Equation (2), respectively [23,32,33].
m CO 2 ( % ) = ( m 550 C m 850 C ) m i · 100
% CO 2 uptake = Δ CO 2 m i % CO 2 content % CO 2 initial 1 ( % CO 2 content )
CO2 uptake is often compared to the theoretical carbonation potential (ThCO2), which is maintained for the maximum degree of carbonation. ThCO2 is obtained via Equation (3) [23,34,35], based on Steinour’s formula [31], and is calculated from the oxide content resulting from an X-ray fluorescence analysis. This theoretical carbonation potential resulting from the EAF slag was approximately 26%.
% ThCO 2 = 0.785 × % CaO 0.56 × % CaCO 3 0.7 × % SO 3 + 1.091 × % MgO + 0.71 × % Na 2 O + 0.468 × % K 2 O % KCl

3. Results

3.1. Properties of ERHA®

Table 3 shows the physical characteristics of ERHA®. Its high bulk density (3.71 g/cm3) stands out when compared to a fine aggregate, which averages between 2.36 and 2.53 g/cm3 [36]. Regarding absorption, with a value of 2.9%, it is similar to natural aggregates in the Chilean geographical area, where the NCh163 standard requires a maximum absorption of 3% for natural aggregates [37].
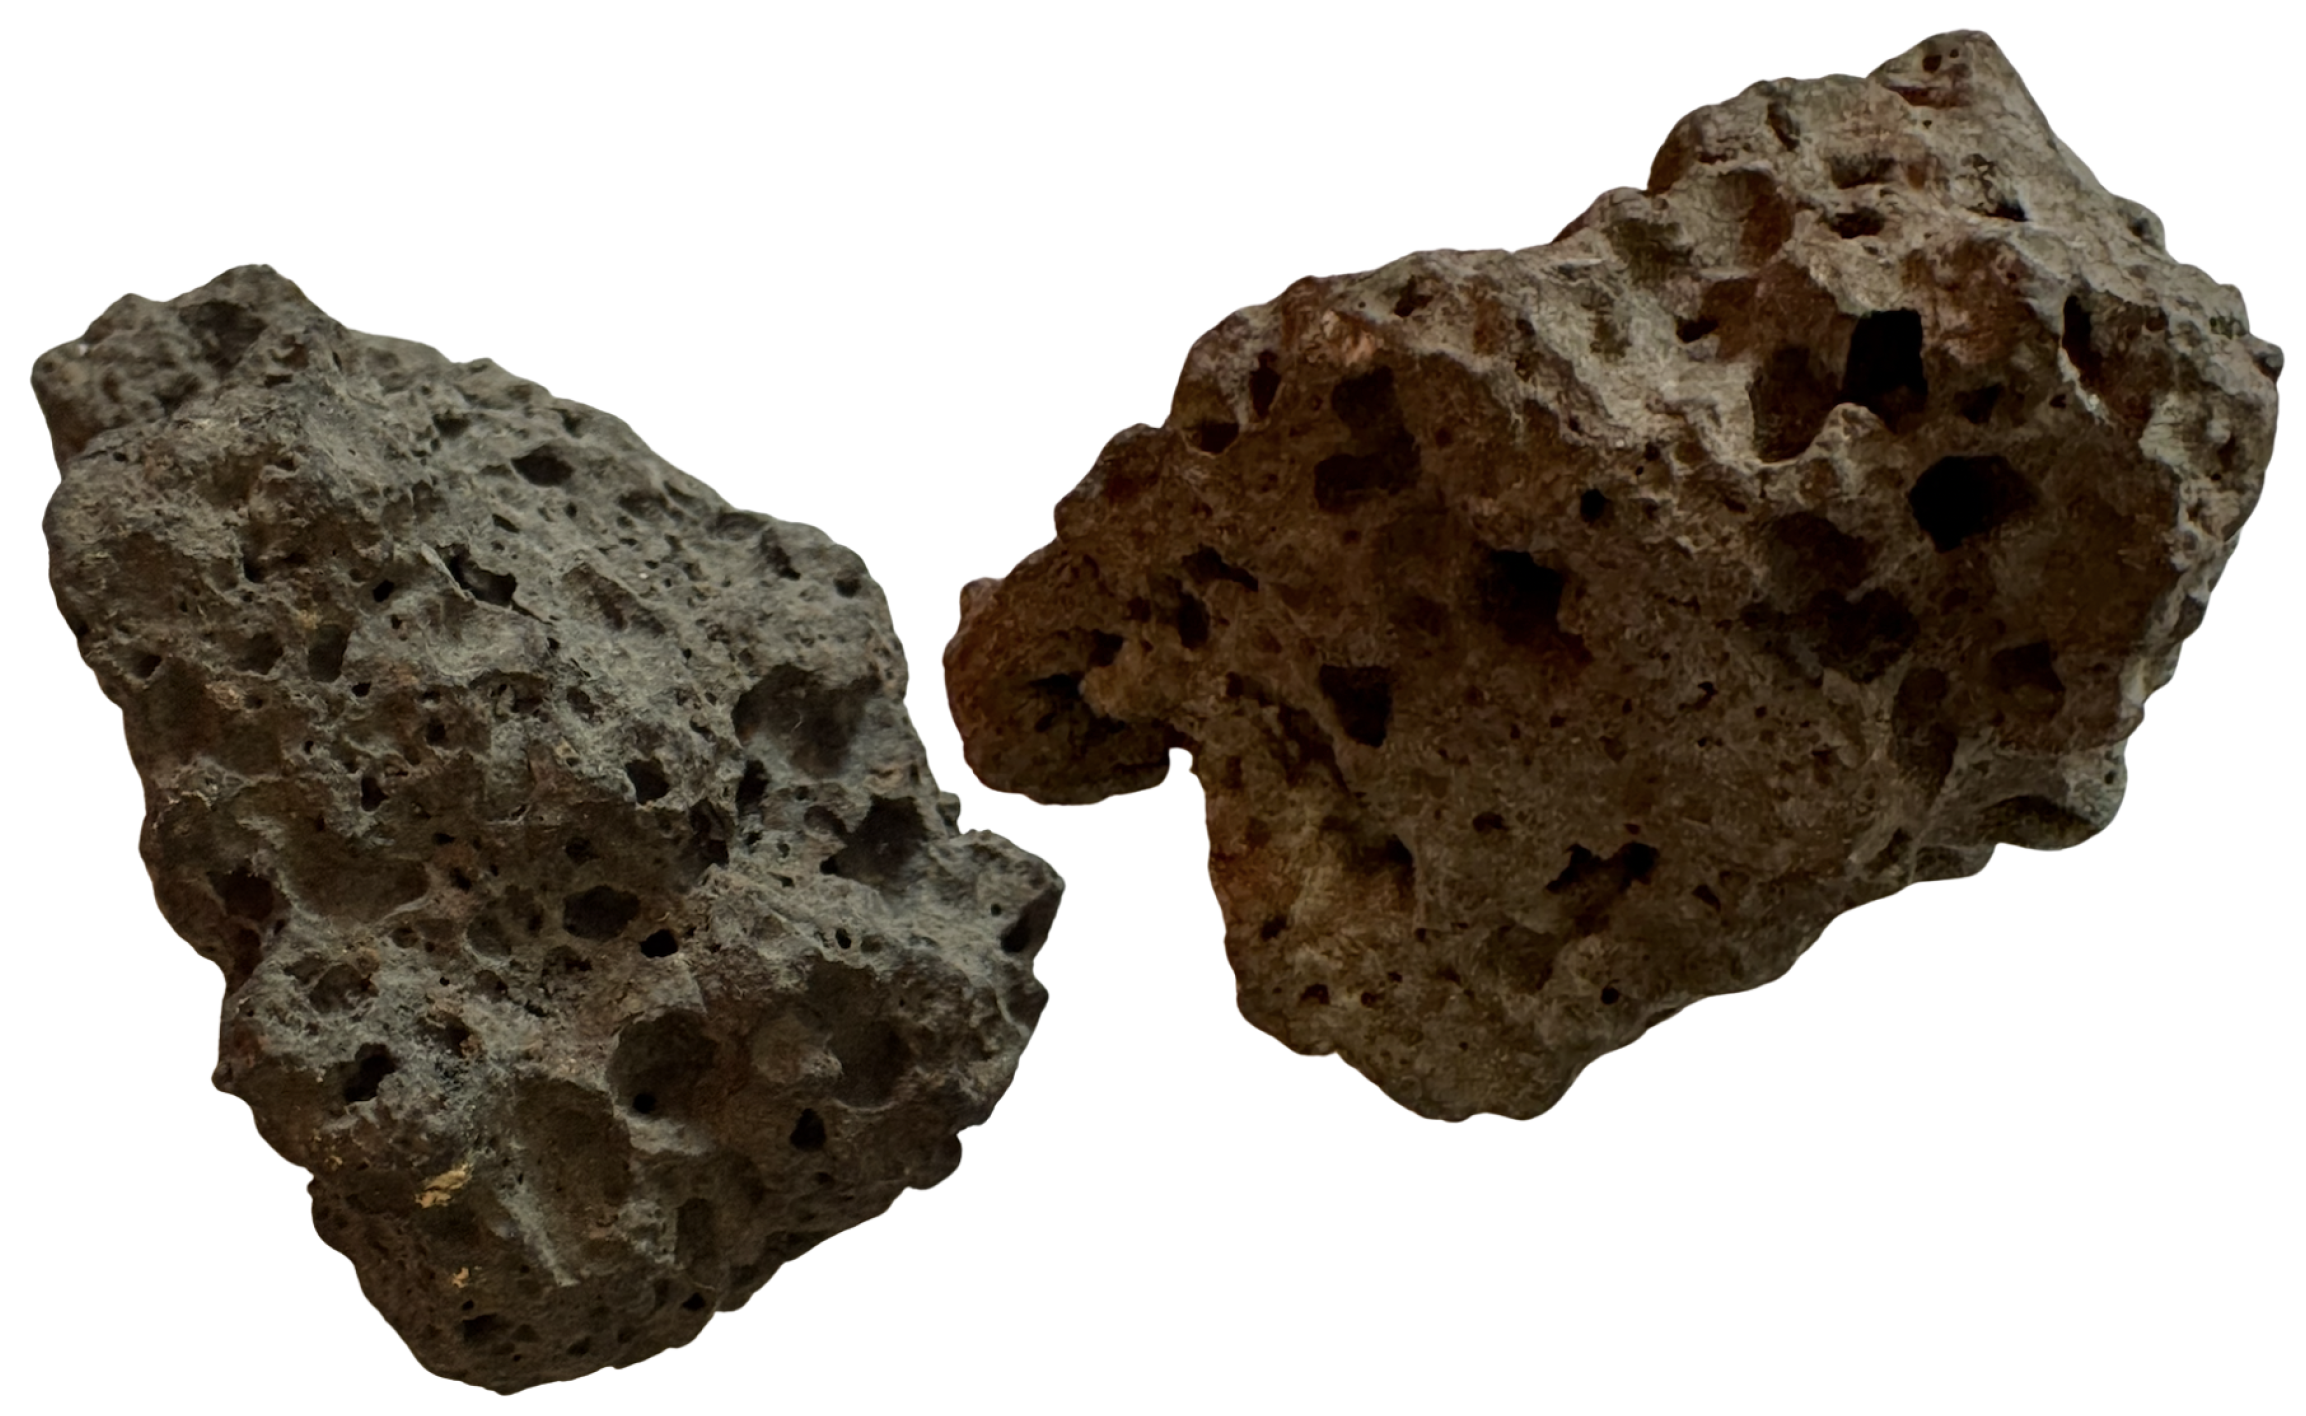
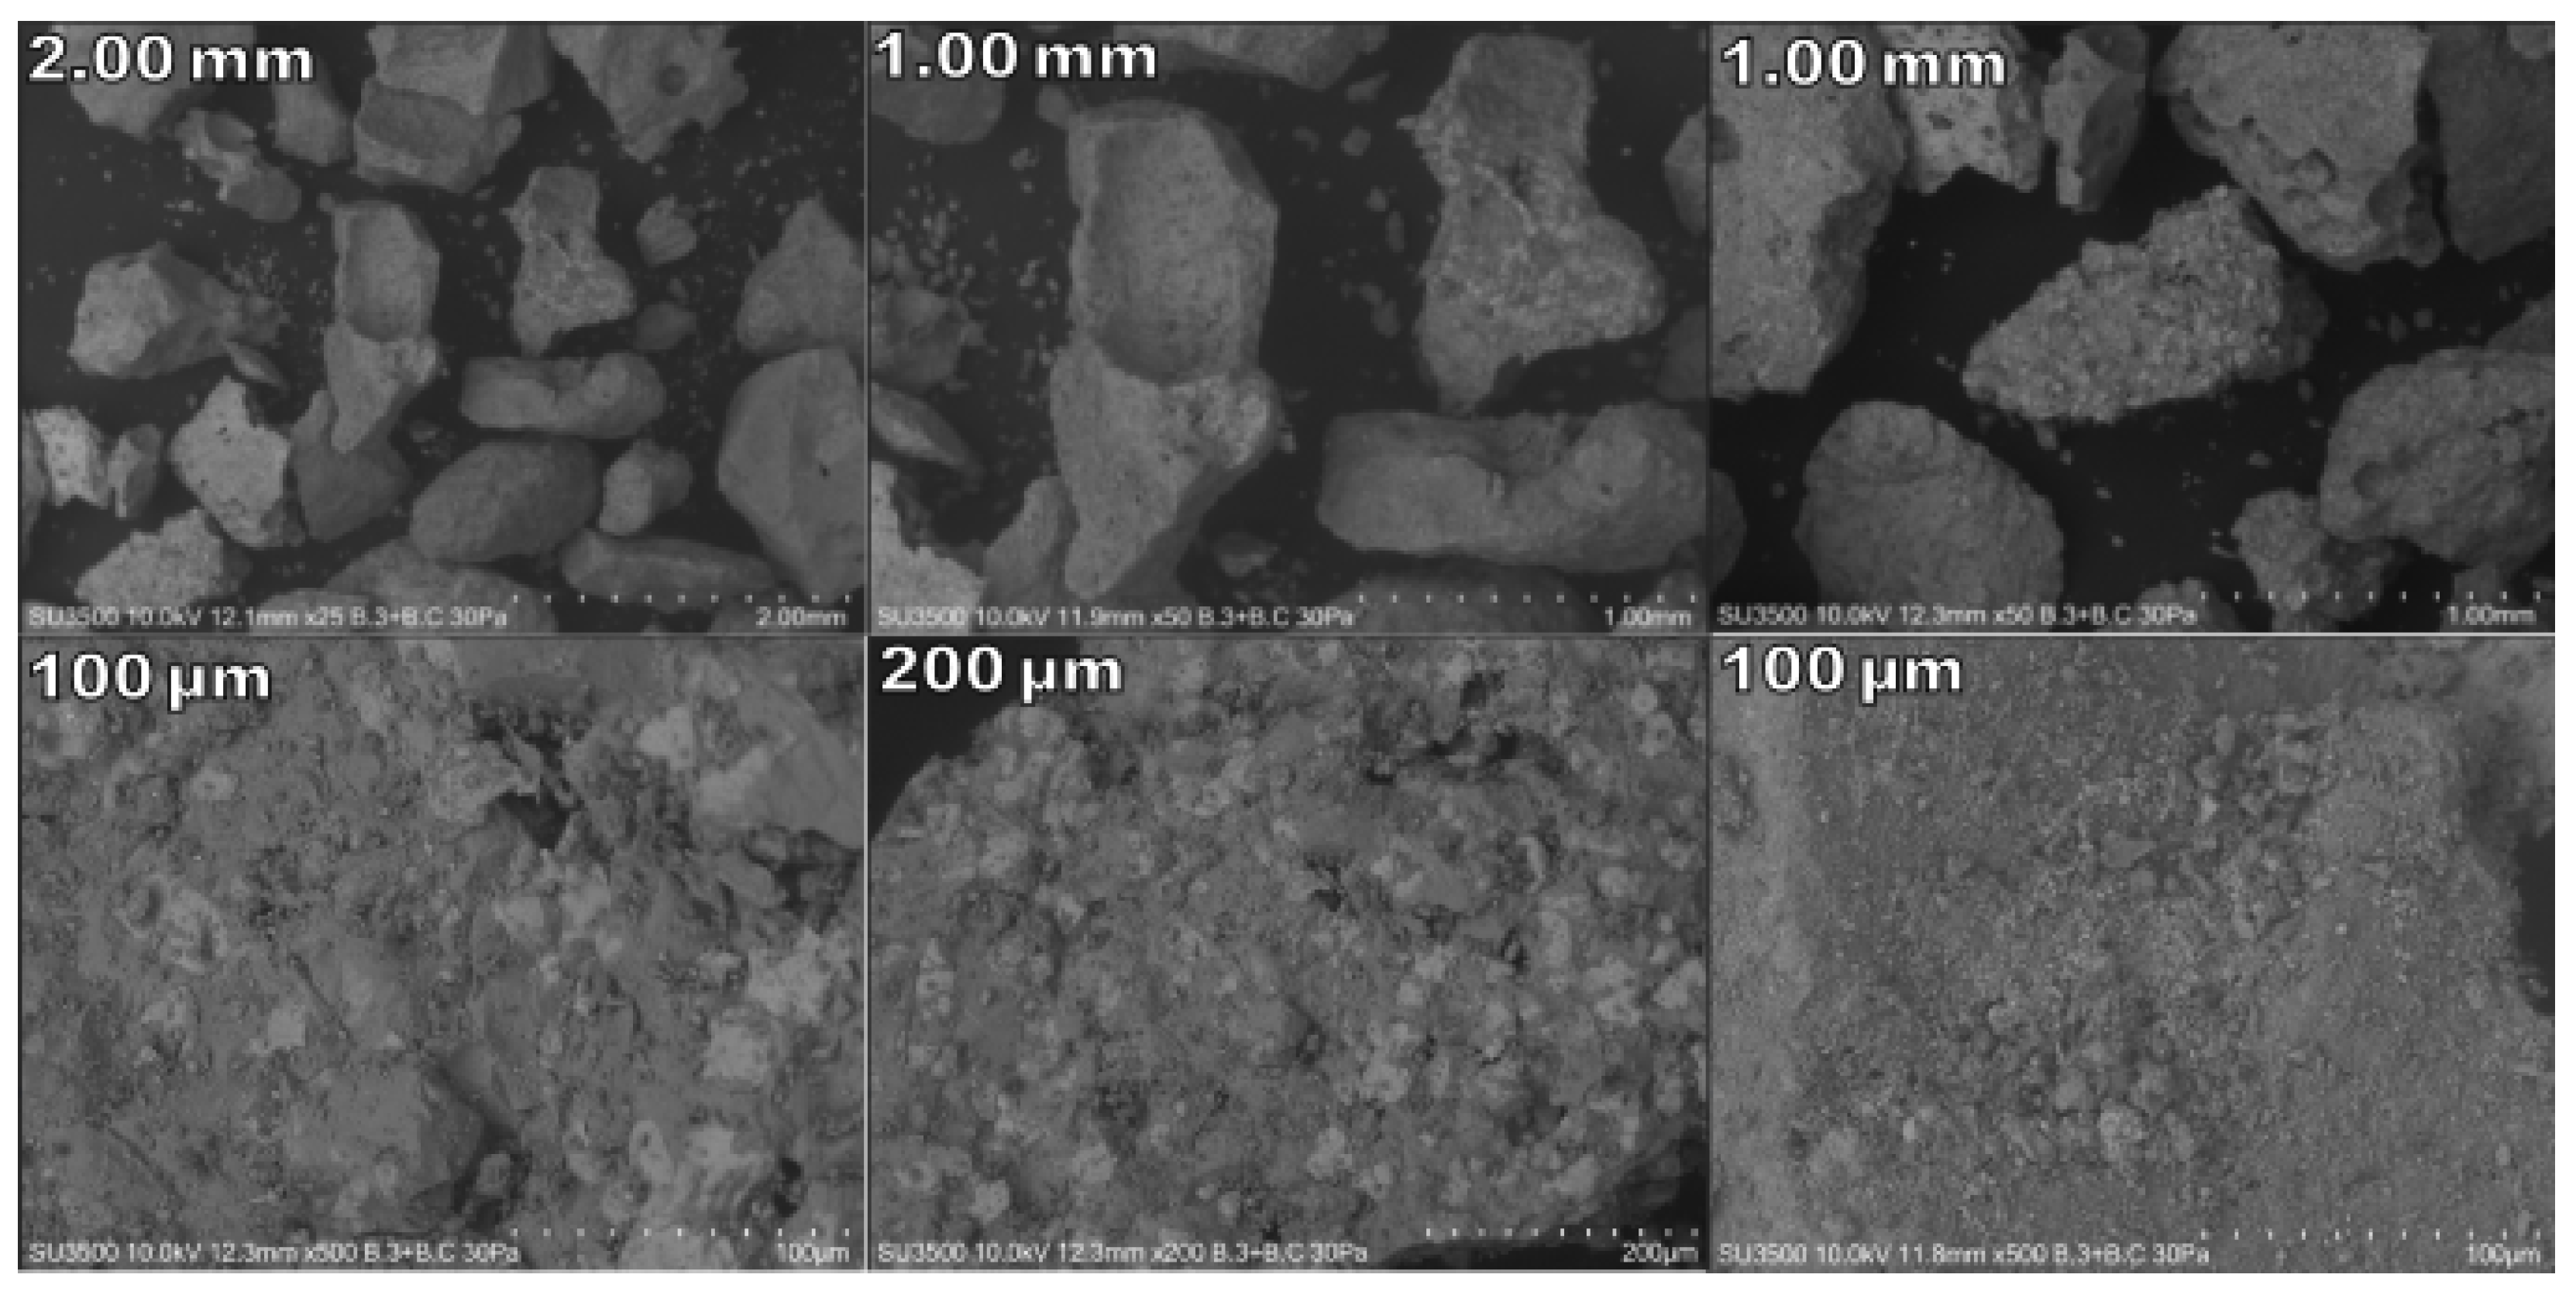
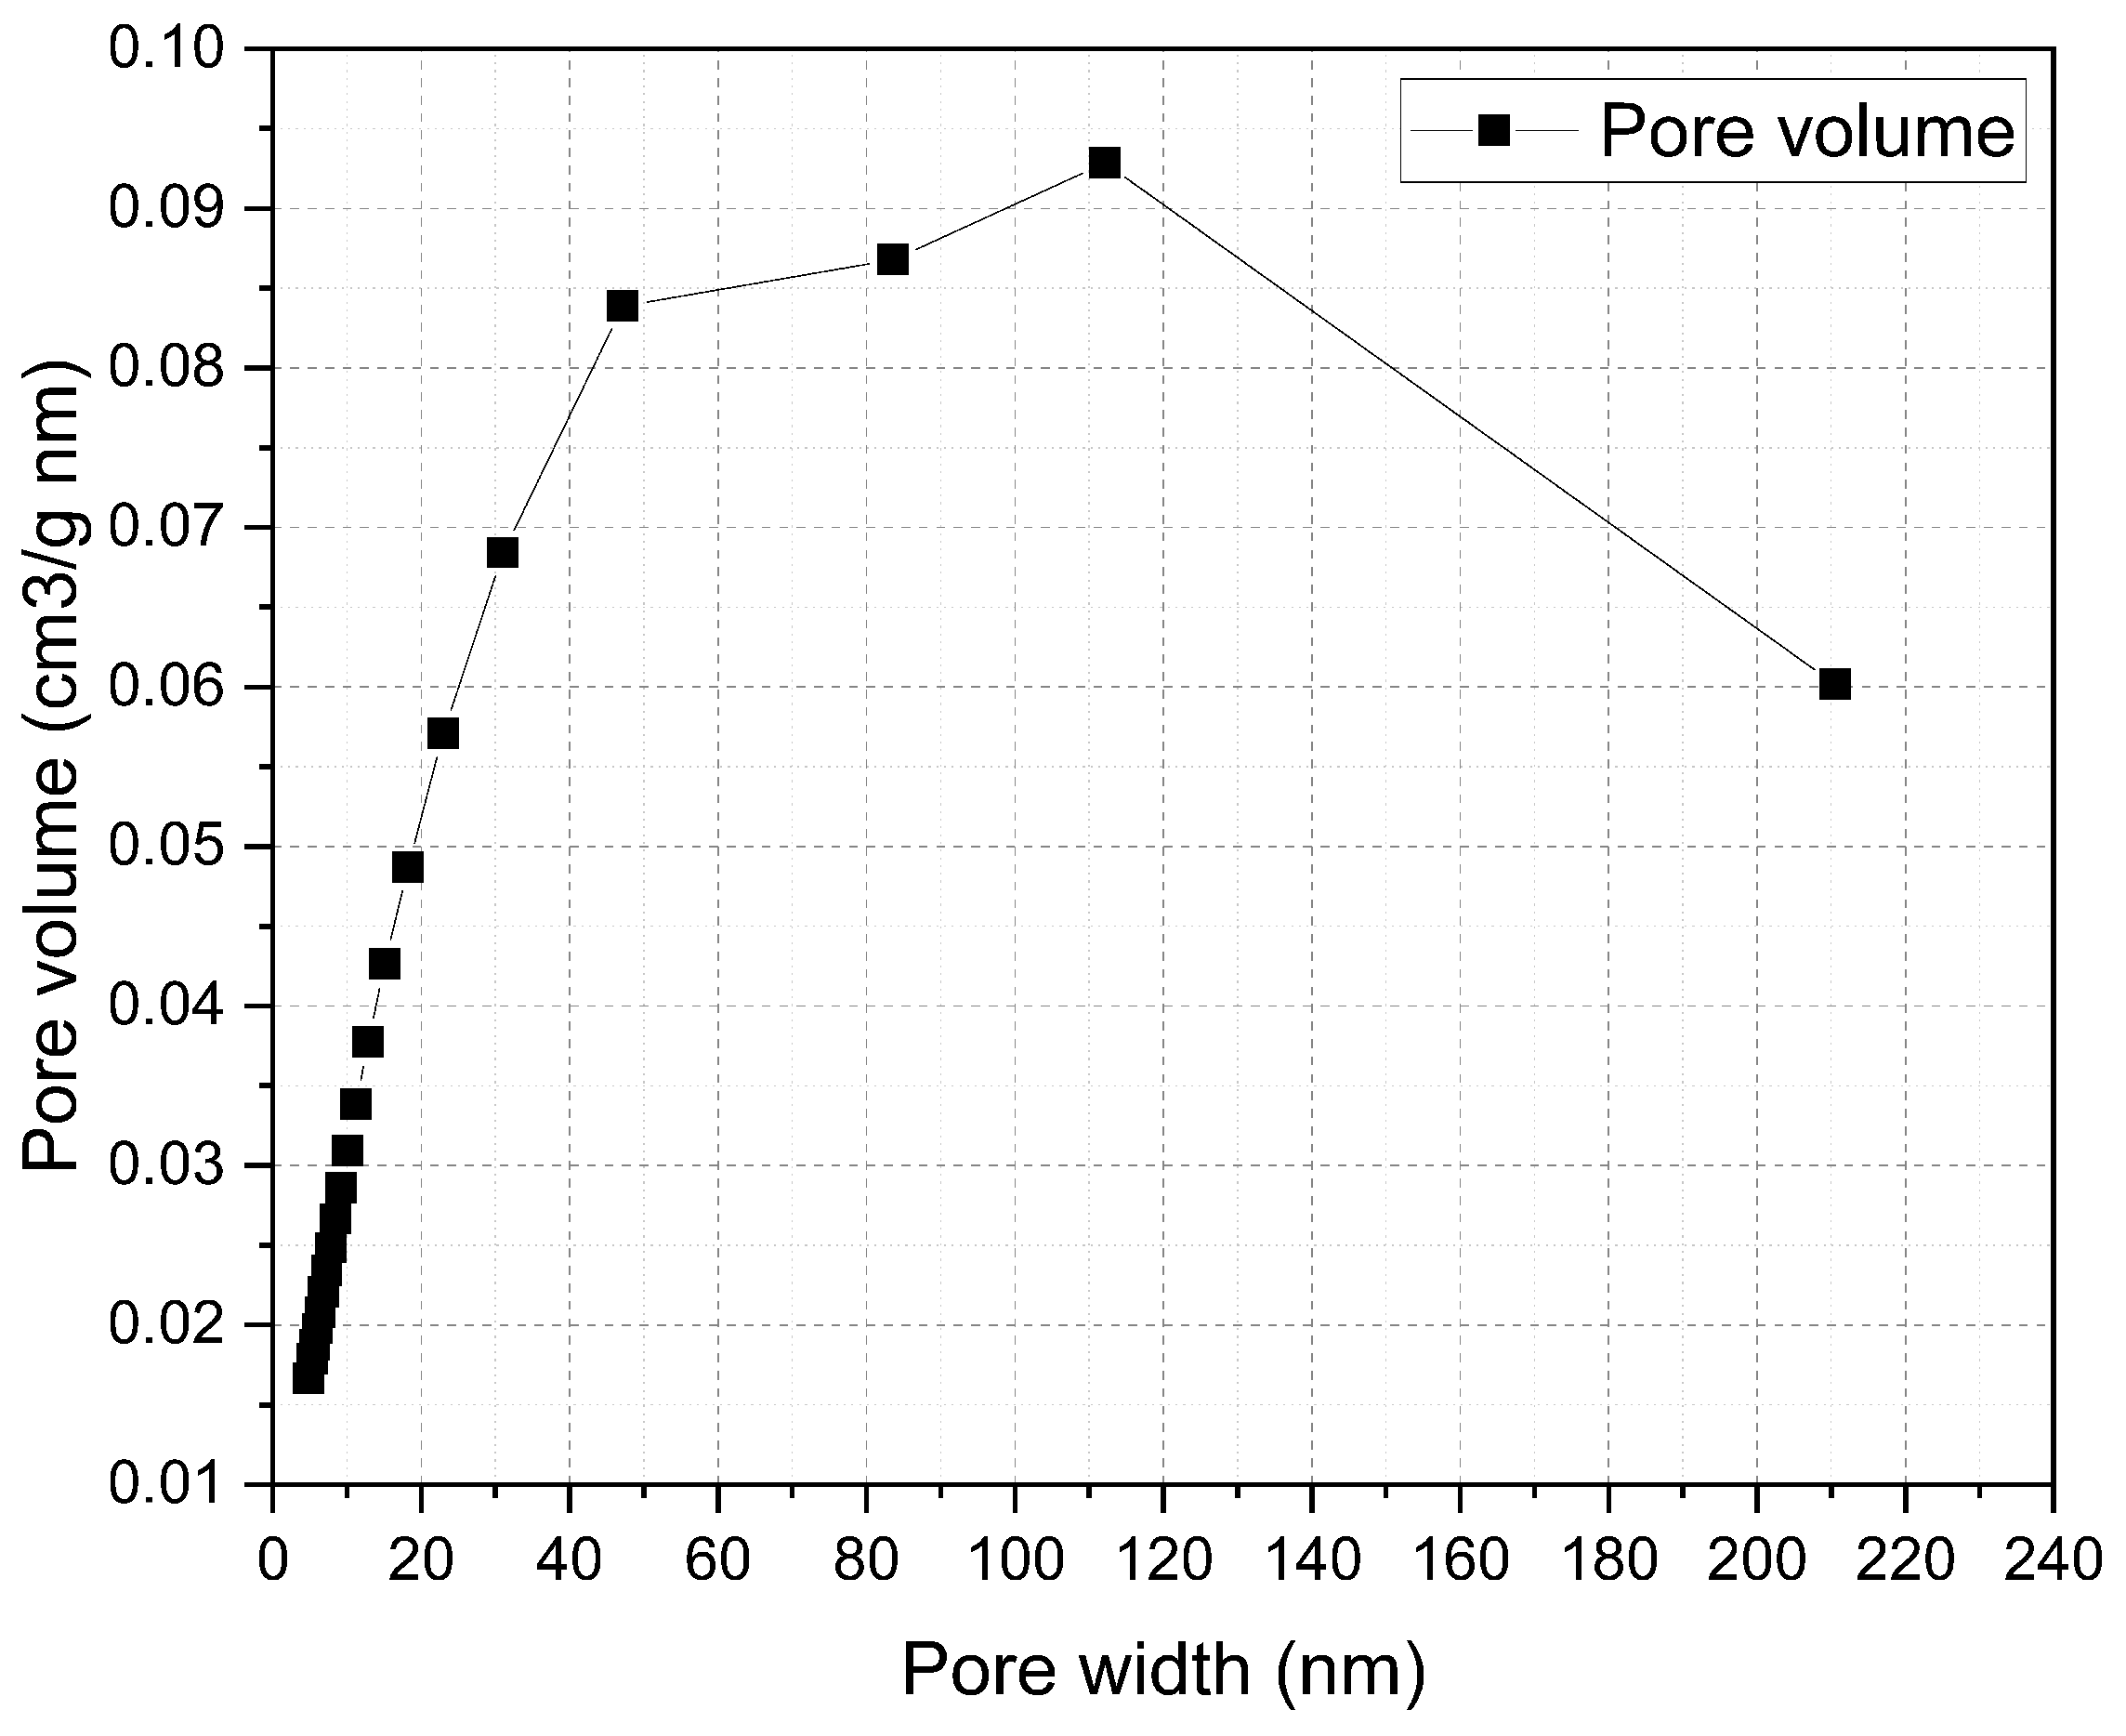
In terms of porosity, at first impression, the material has a porous appearance (Figure 4). In the SEM analysis that was carried out on the images of 200 μm and 100 μm (Figure 5), the material has a rough surface with few open pores. To complement this, a BET analysis was carried out, which gave a BET surface area of 2.6 m2/g, an average adsorption pore diameter [nm] of 0.005 cm3/g, and an average desorption pore diameter [nm] of 0.003 cm3/g, whereas the pore volume distribution is shown in Figure 6.
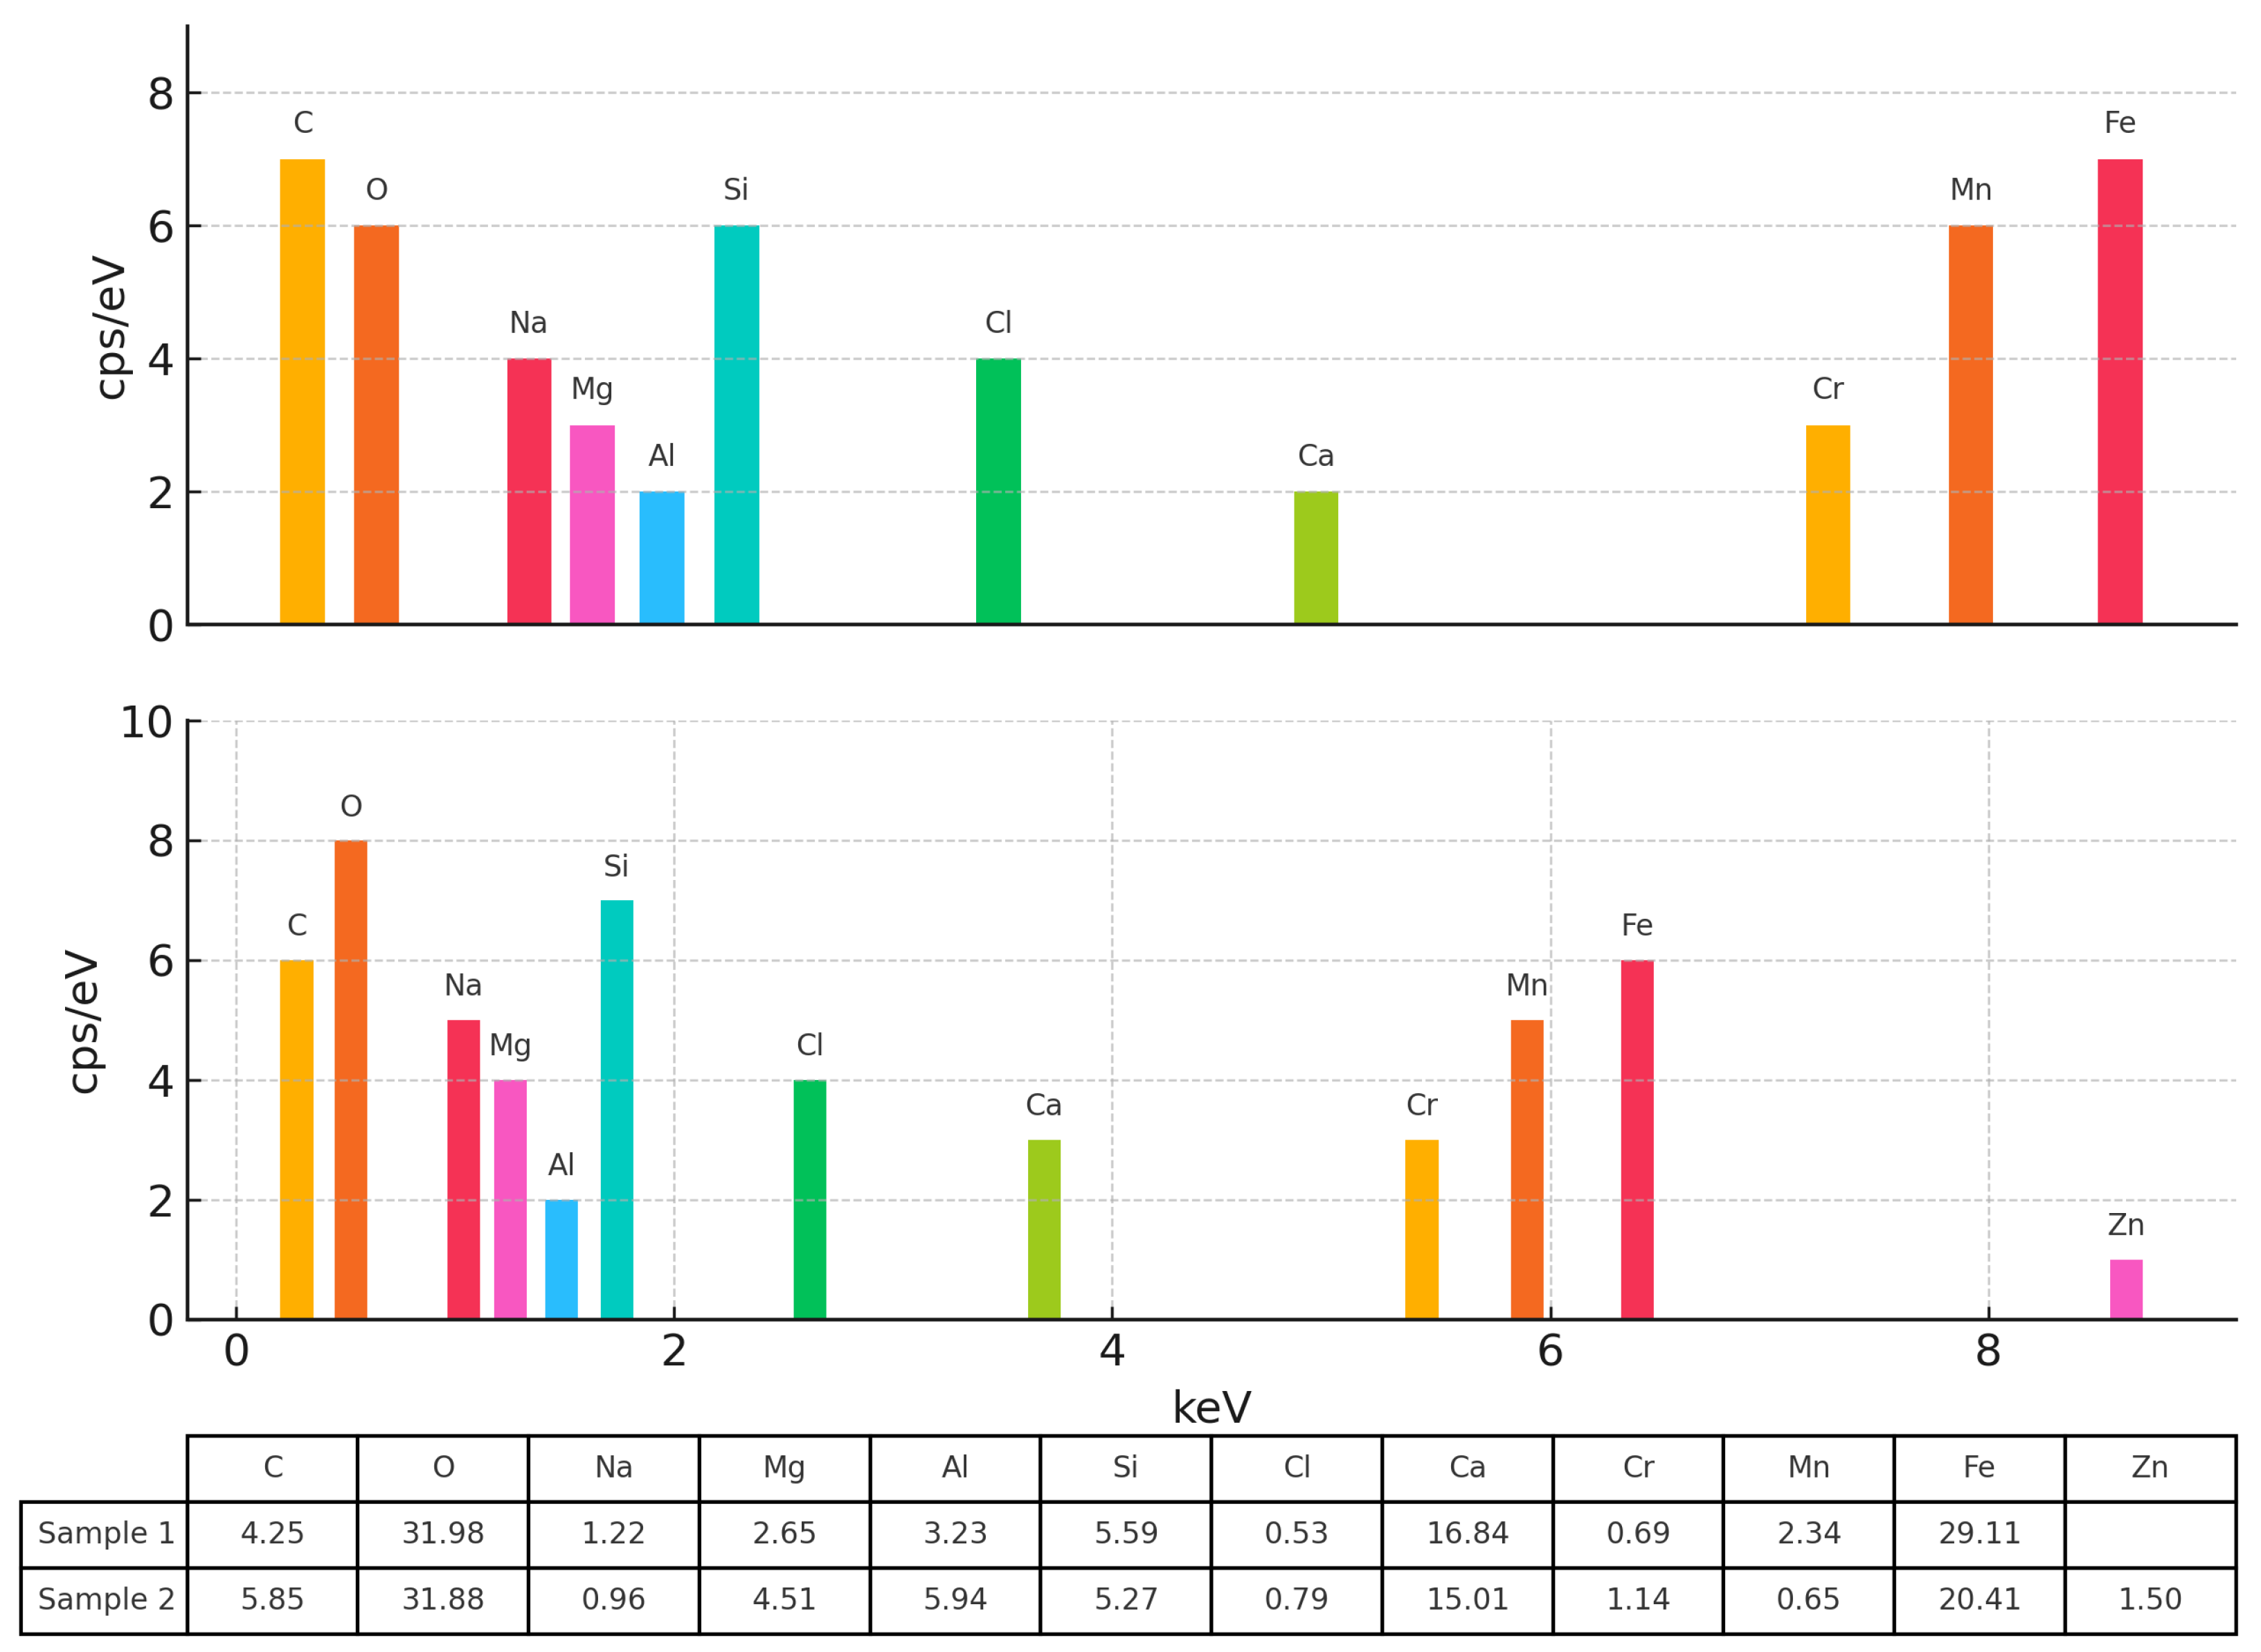
Concerning the mineralogical composition, the data obtained from the EDS analysis are presented in Figure 7, where a higher presence of calcium, iron, and oxygen (related to oxides) is observed. The presence of chromium, magnesium, and manganese was also detected in lower percentages, in agreement with the results obtained via X-ray fluorescence (Table 4). In agreement with the literature, ERHA® is mainly composed of CaO, SiO 2 , Al 2 O 3 , and MgO [38]. The presence of chromium, barium, and vanadium has been reported in untreated EAF slag in previous characterisations [17]. Although not quantified in this study, these elements are known to pose environmental and health risks, and their potential mobilisation will be addressed in future leaching analyses.
Another relevant aspect of this material is its iron oxide content, which is usually between 5 and 20% [38]. In this case, its high concentration can have several effects. It can retard or limit the carbonation process since, when combined with free calcium oxide (f-CaO), it forms CaO-FeOx systems, reducing the reactivity of f-CaO with CO2 and hindering the hydration of magnesium and calcium oxides, which negatively impacts their volumetric stability [39].
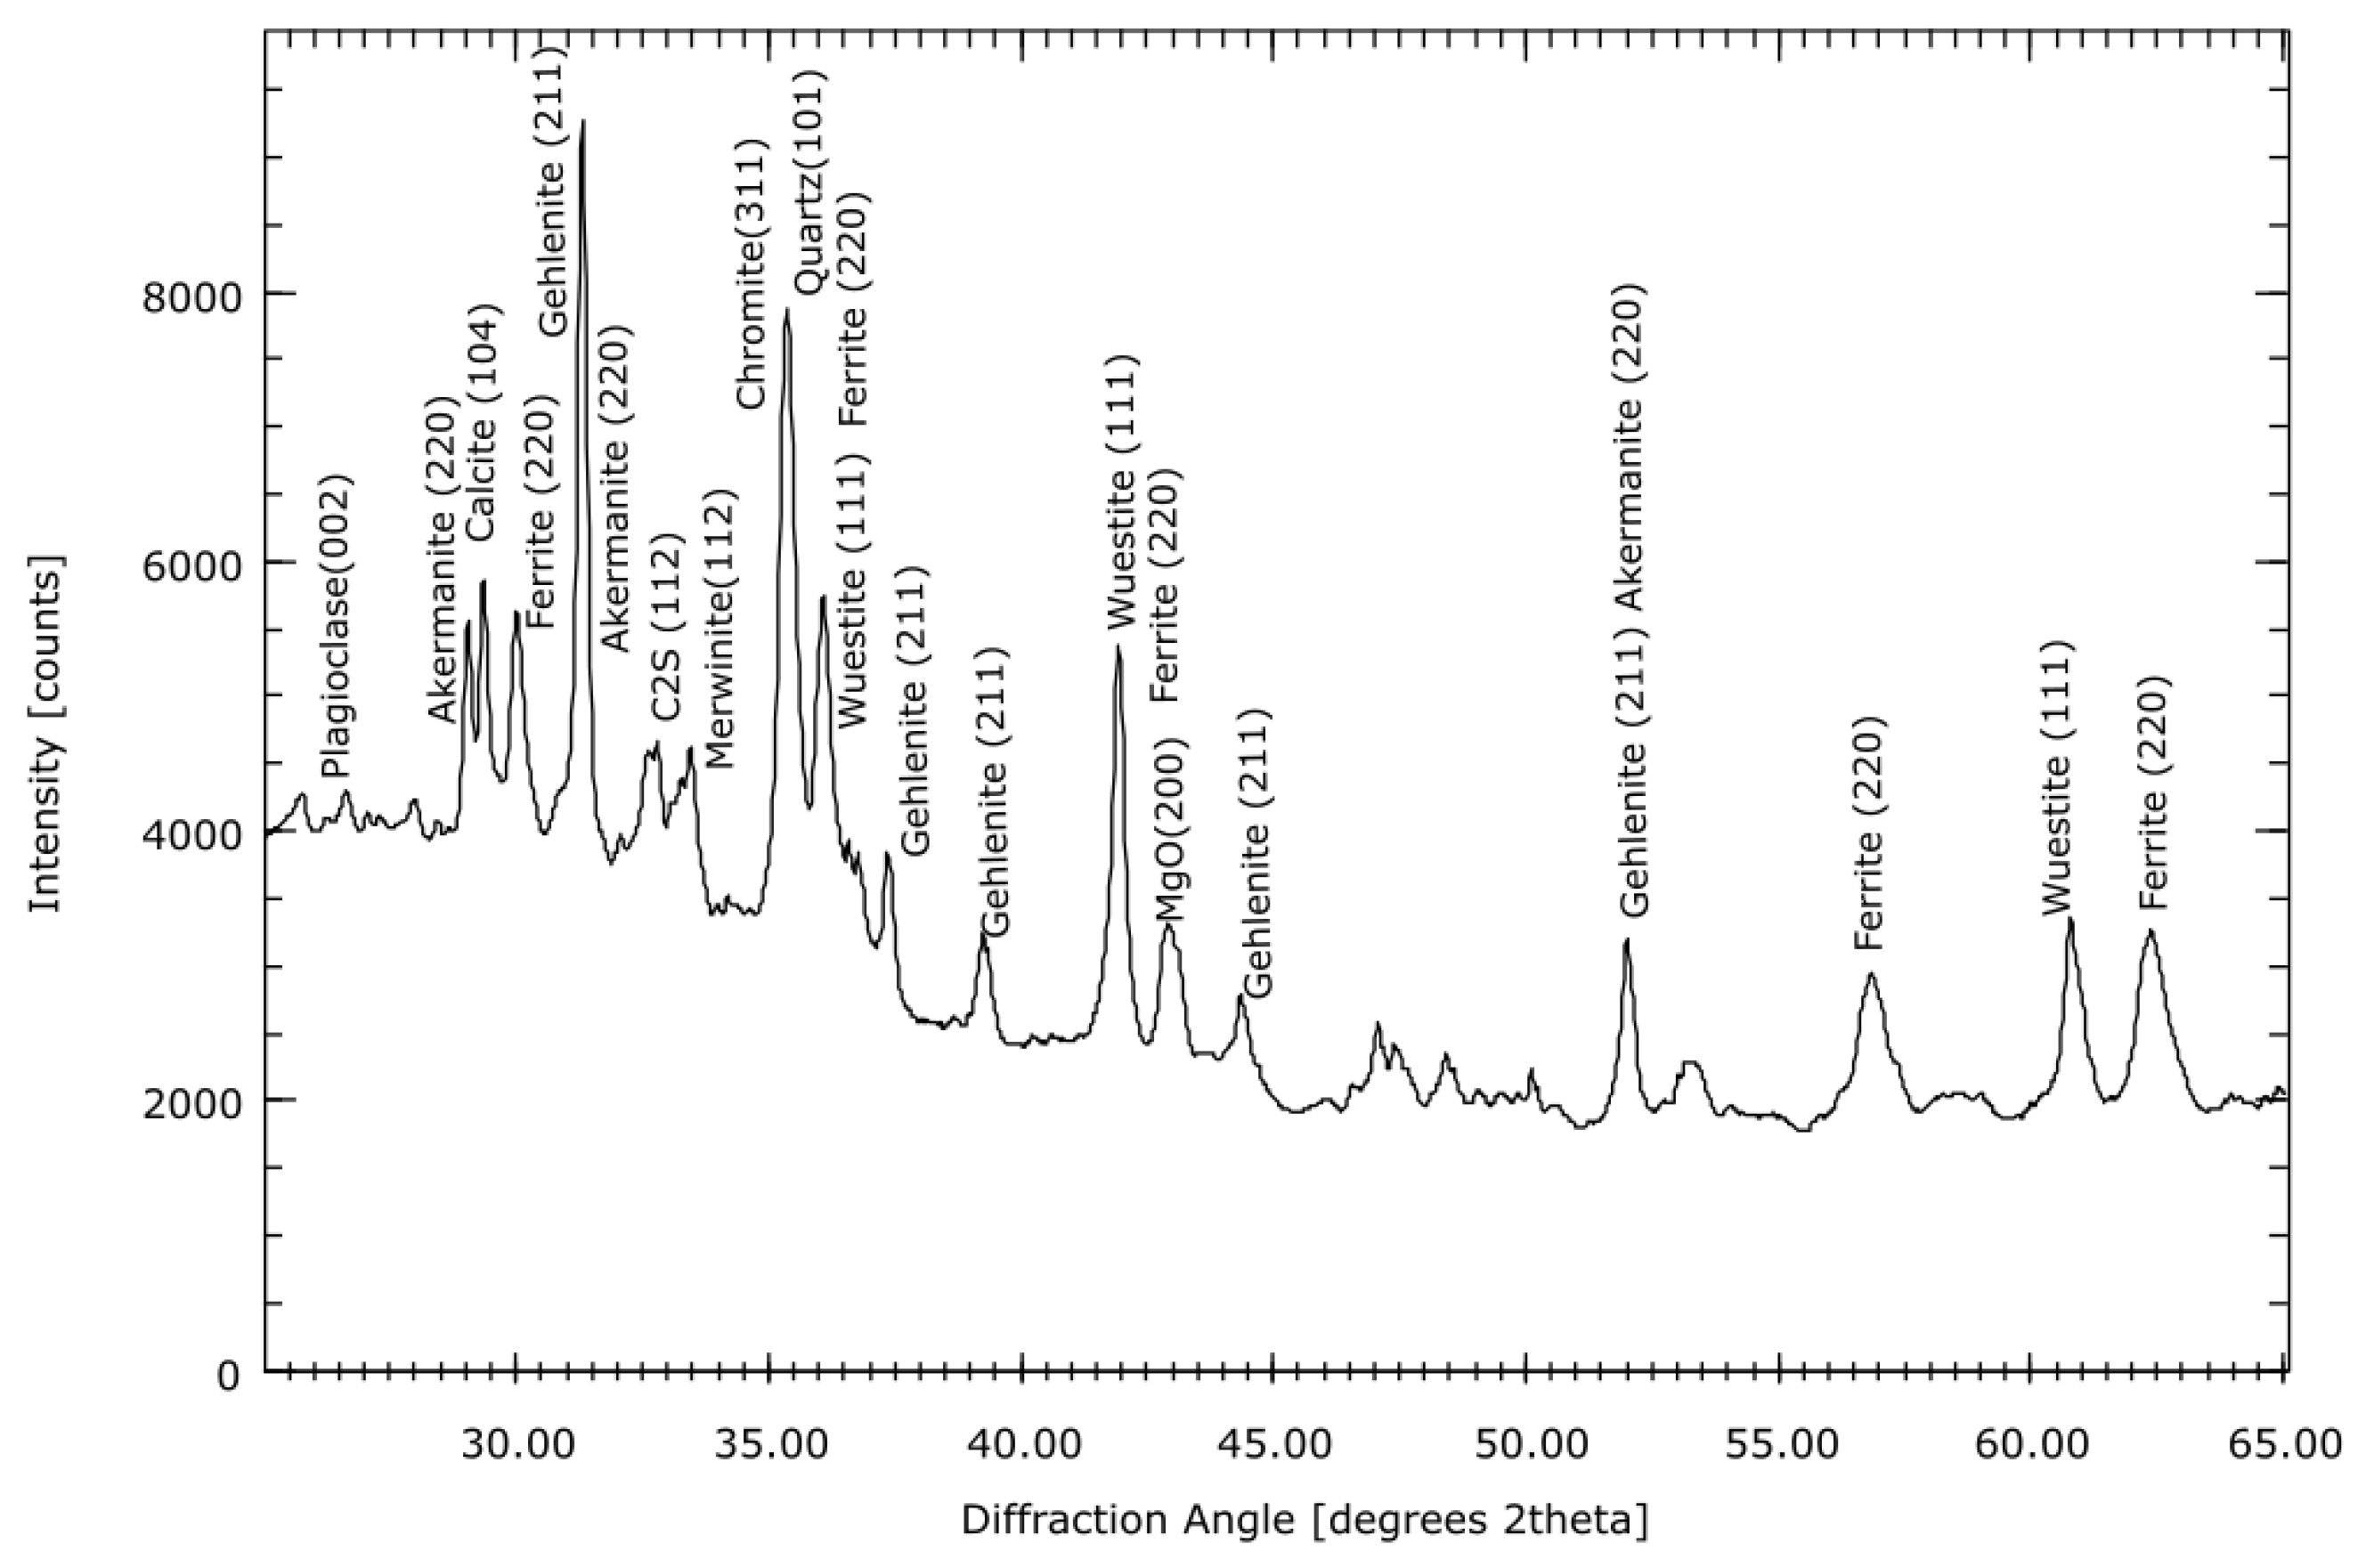
A key aspect in the characterisation of the mineralogical phases in electric arc furnace slags is the large variety of phases, which can make it difficult to carry out an accurate analysis. ERHA® is no exception, as it comes from the steel industry, where different types of steel are recycled, contributing to a complex mineralogical composition. Figure 8 shows the XRD analysis carried out, where the most predominant crystalline phases in this material are identified.
According to the literature, different mineral phases commonly present in EAF slags have been identified and described [40]. At this opportunity, phases of the melilite group, such as akermanite and gehlenite, were observed. These react with CO2 in water to form aqueous bicarbonate ions [40]. Wüstite and ferrite phases have also been identified due to the high content of iron oxides. Finally, other phases commonly found in slags were also detected in the ERHA®, such as merwinite, γ - C 2 S and CaO, with the latter two being associated with volumetric expansions [41].

3.2. Effects of Temperature on Carbonation

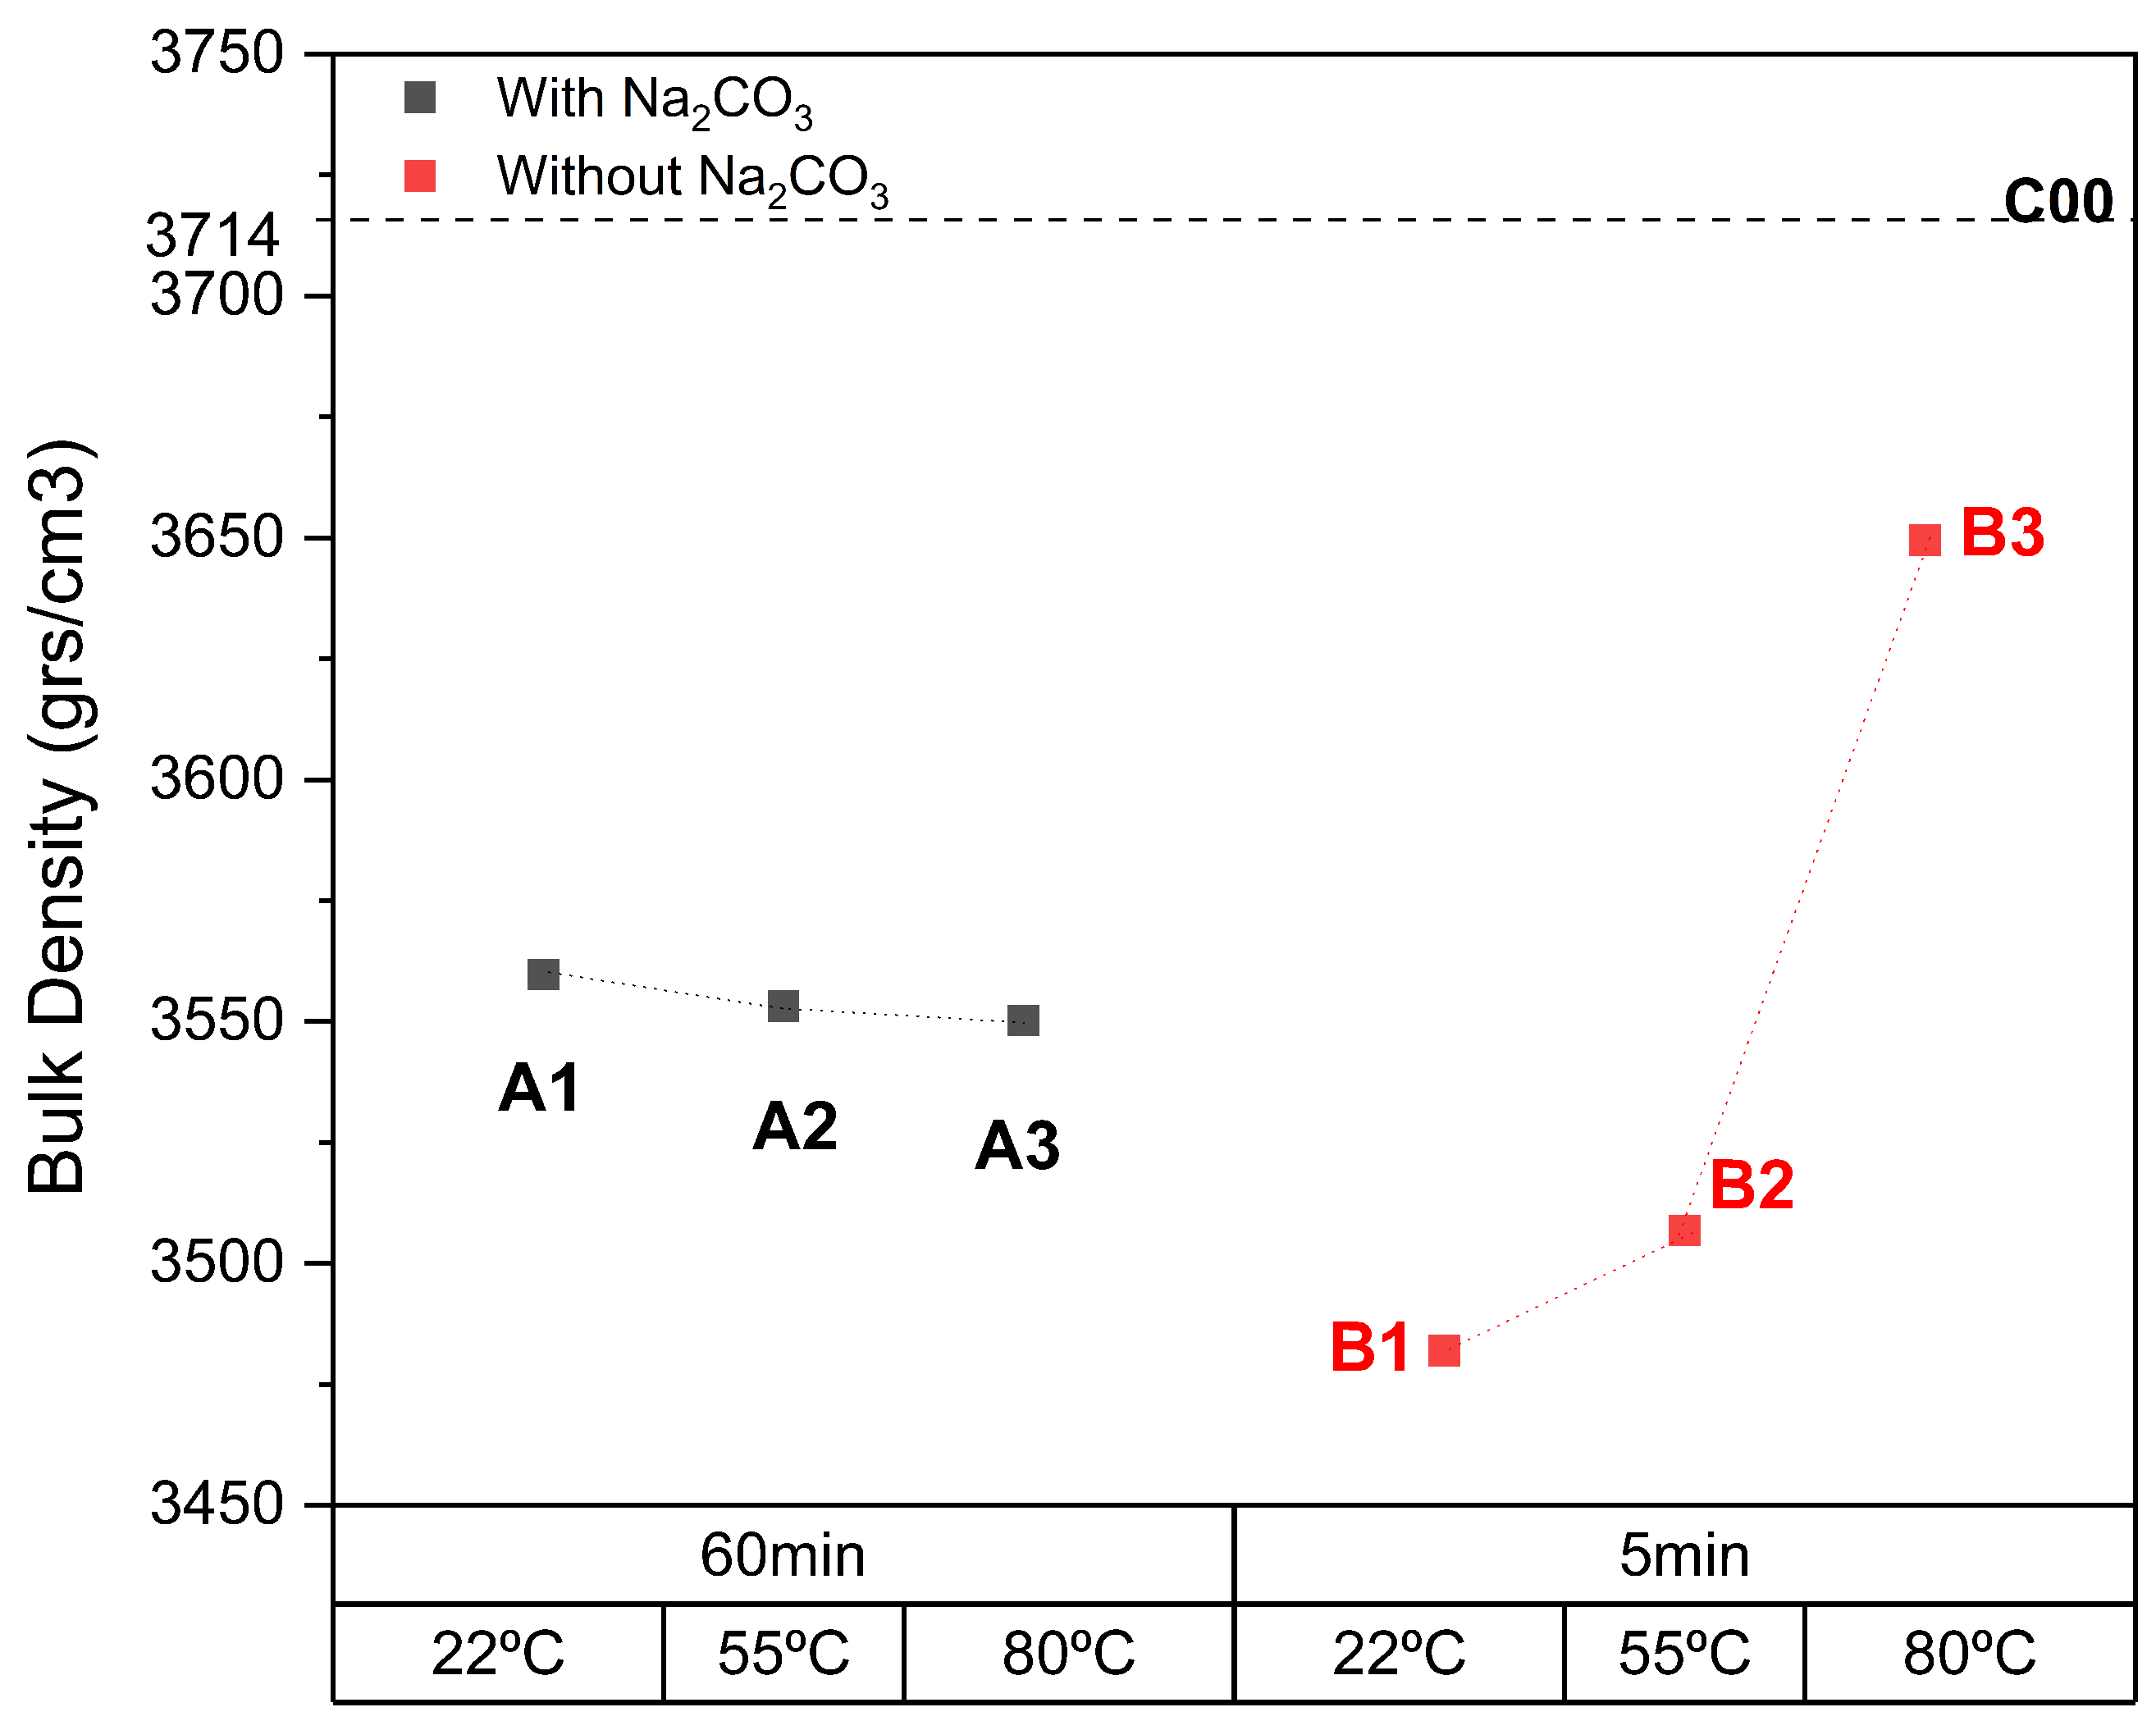
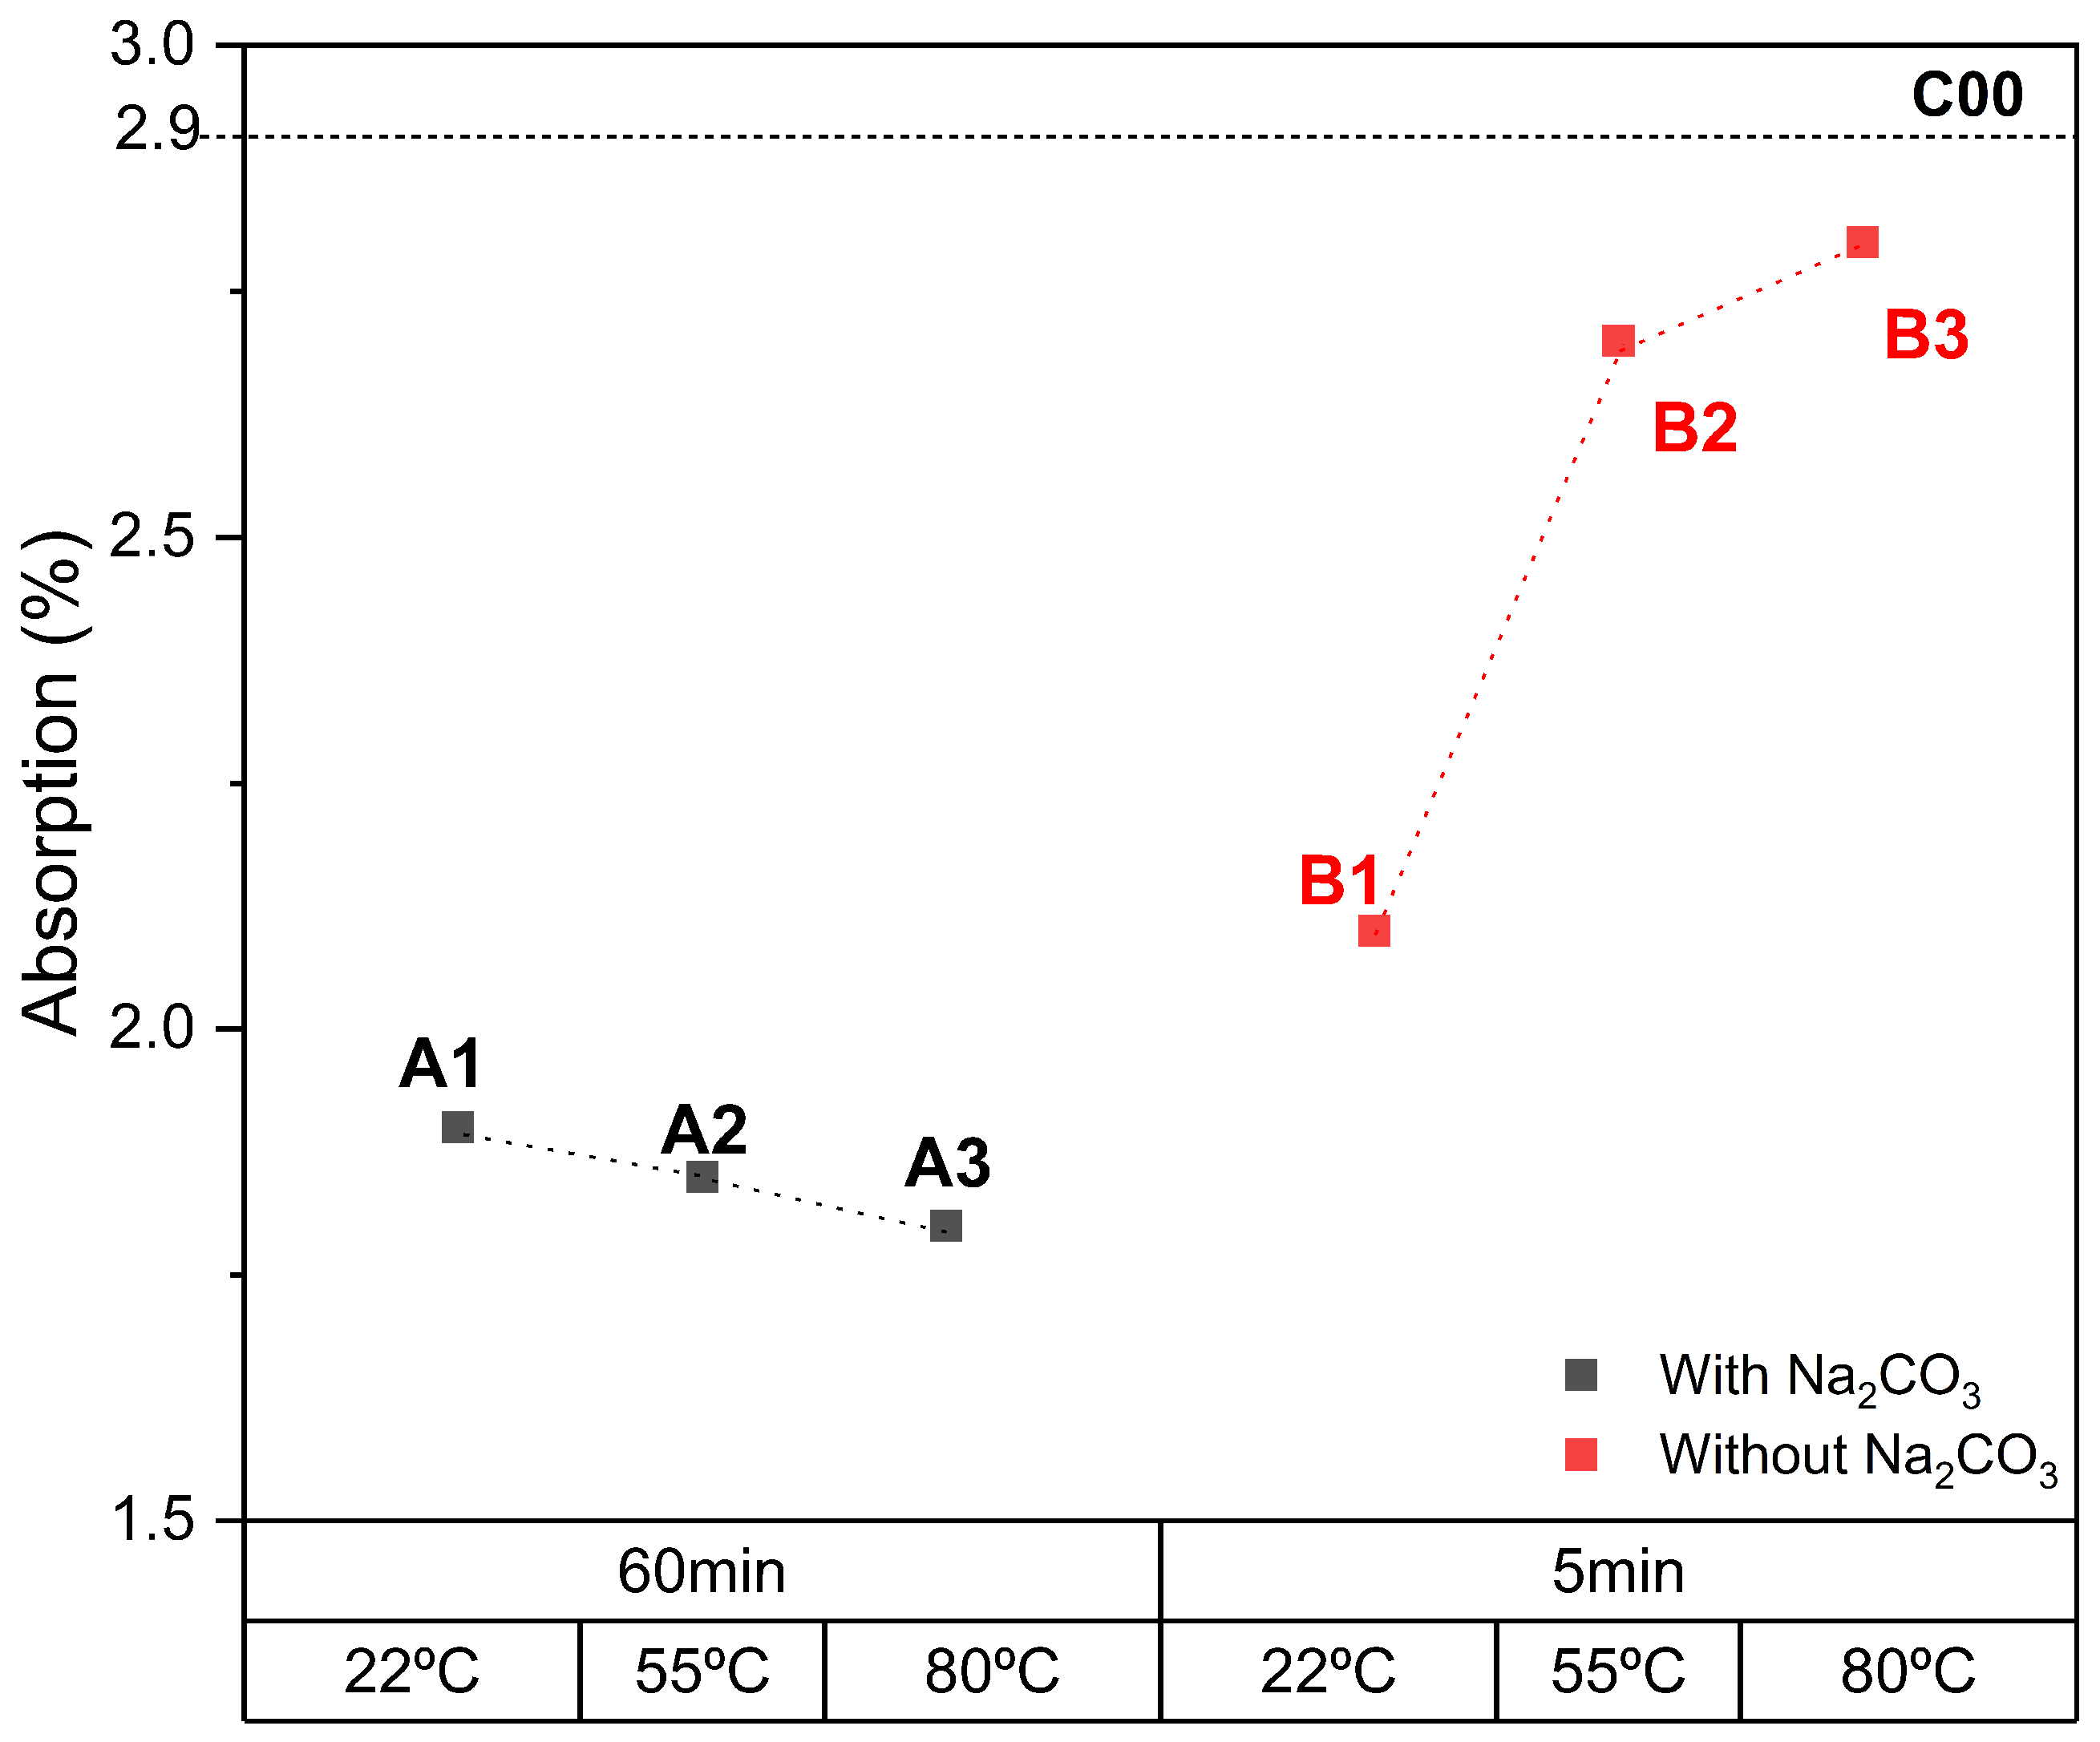
Temperature variation is a critical factor in the carbonisation of materials because it influences the kinetics and thermodynamics of the process itself, affecting the composition, microstructure, and properties of the carbonate material [28]. In aqueous carbonation, specifically the Na2CO3 incorporated process (A series), the physical properties were not affected by the temperature increase. Specific gravity had a tendency to decrease compared to the control series. However, this effect was smaller among the carbonated series. It decreased by 1.3% when the temperature of the ERHA® was increased from 20 °C to 55 °C and remained constant when the temperature reached 80 °C; see Figure 9. Bulk density also remained stable, averaging 3.55 g/cm3. However, with respect to the control series, these values have a variation of 4.7%; see Figure 10. Water absorption, however, showed a more marked change in Figure 11. As far as water absorption is concerned, the results ranged from 1.8 and 1.9% compared to the control sample, which has absorption of 2.9%.
This behaviour suggests that aqueous carbonation with Na2CO3 helps reduce the absorption of slag samples. Previous studies have shown similar results in cementitious materials. Wang et al. (2019) investigated the influence of sodium carbonate and sodium bicarbonate on the hydration and properties of Portland cement [42]. They found that the addition of sodium carbonate accelerated the formation of calcium carbonate, which modified the porosity and consequently improved the durability of the material [42]. While Coppola et al. (2020) analysed the effect of sodium and lithium carbonate on the physical and mechanical properties of mortars, their results showed that the addition of sodium carbonate affects the density, which, in turn, affects the mechanical strength of mortars [43].
In contrast, series B, which did not include Na2CO3 in the solution, had a more pronounced effect with an increasing temperature. The absorption increased by 28.6% when the temperature of the ERHA® was increased from 20 °C to 80 °C. However, the absorption values of the samples obtained are lower than those of the control series. Bulk density and specific gravity increased by 4.8% and 3.2%, respectively. This suggests a direct relationship with the carbonation time, an aspect that will be discussed in the next section. The pH of the solution decreased rapidly, indicating more abrupt carbonation, probably due to increased ion diffusion at higher temperatures. However, higher temperatures may also reduce the solubility of CO2, which could limit the amount of carbonates formed [25,44]. These results show that, even when the same material is worked with, different effects can be obtained, highlighting the importance of evaluating variables such as carbonation temperature in each specific case.
Although the bulk density reduction observed in this case was an unusual effect of carbonation, it may be related to the formation of microcracks on the surface after carbonation. The reduction in density may be related to the formation of microcracks on the surface after carbonation. The formation of microcracks or fractures at the microscopic level has been reported by other researchers using other materials. Han et al. (2012) investigated microstructural changes in hardened cement pastes due to carbonation using three-dimensional (3D) X-ray computed tomography, where carbonation induced the appearance of microcracks due to CSH decalcification [45]. On the other hand, Zhu et al. (2016) investigated the carbonation of olivine. Using X-ray microtomography imaging, they observed cracks initiating in the surface layers and propagating into the interior of the olivine aggregate due to an increase in solid volume of up to 44% [46].
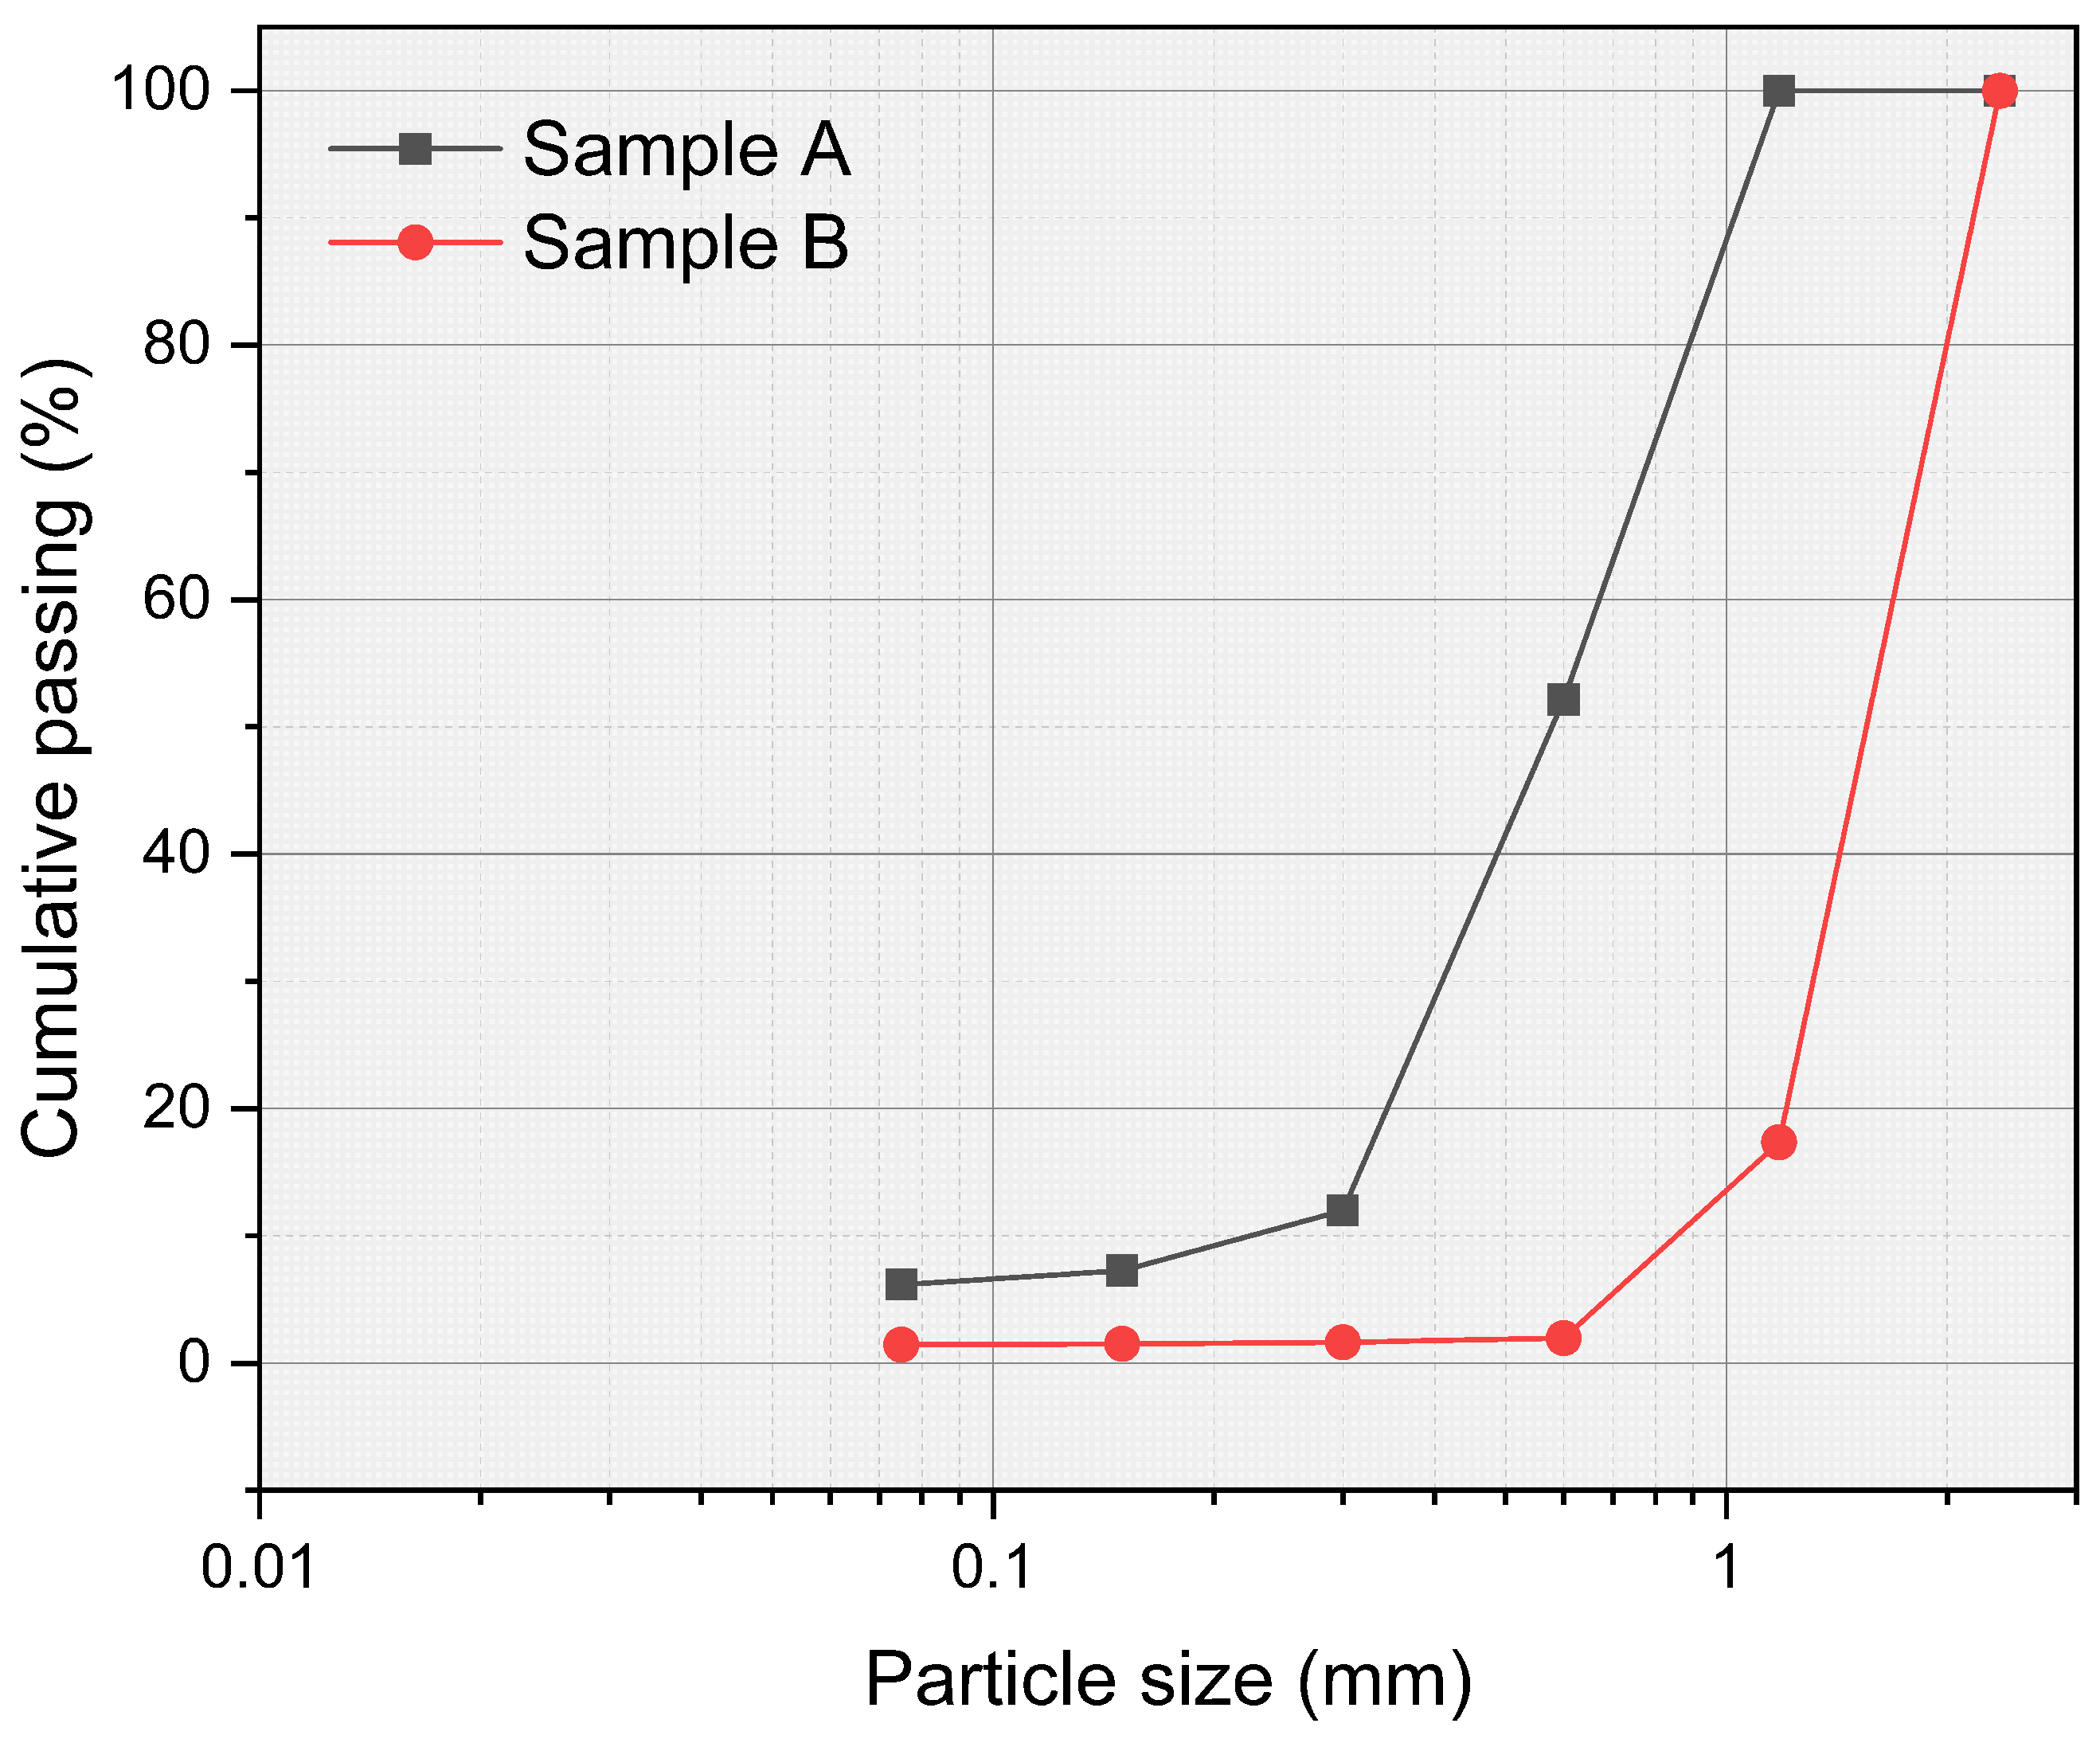
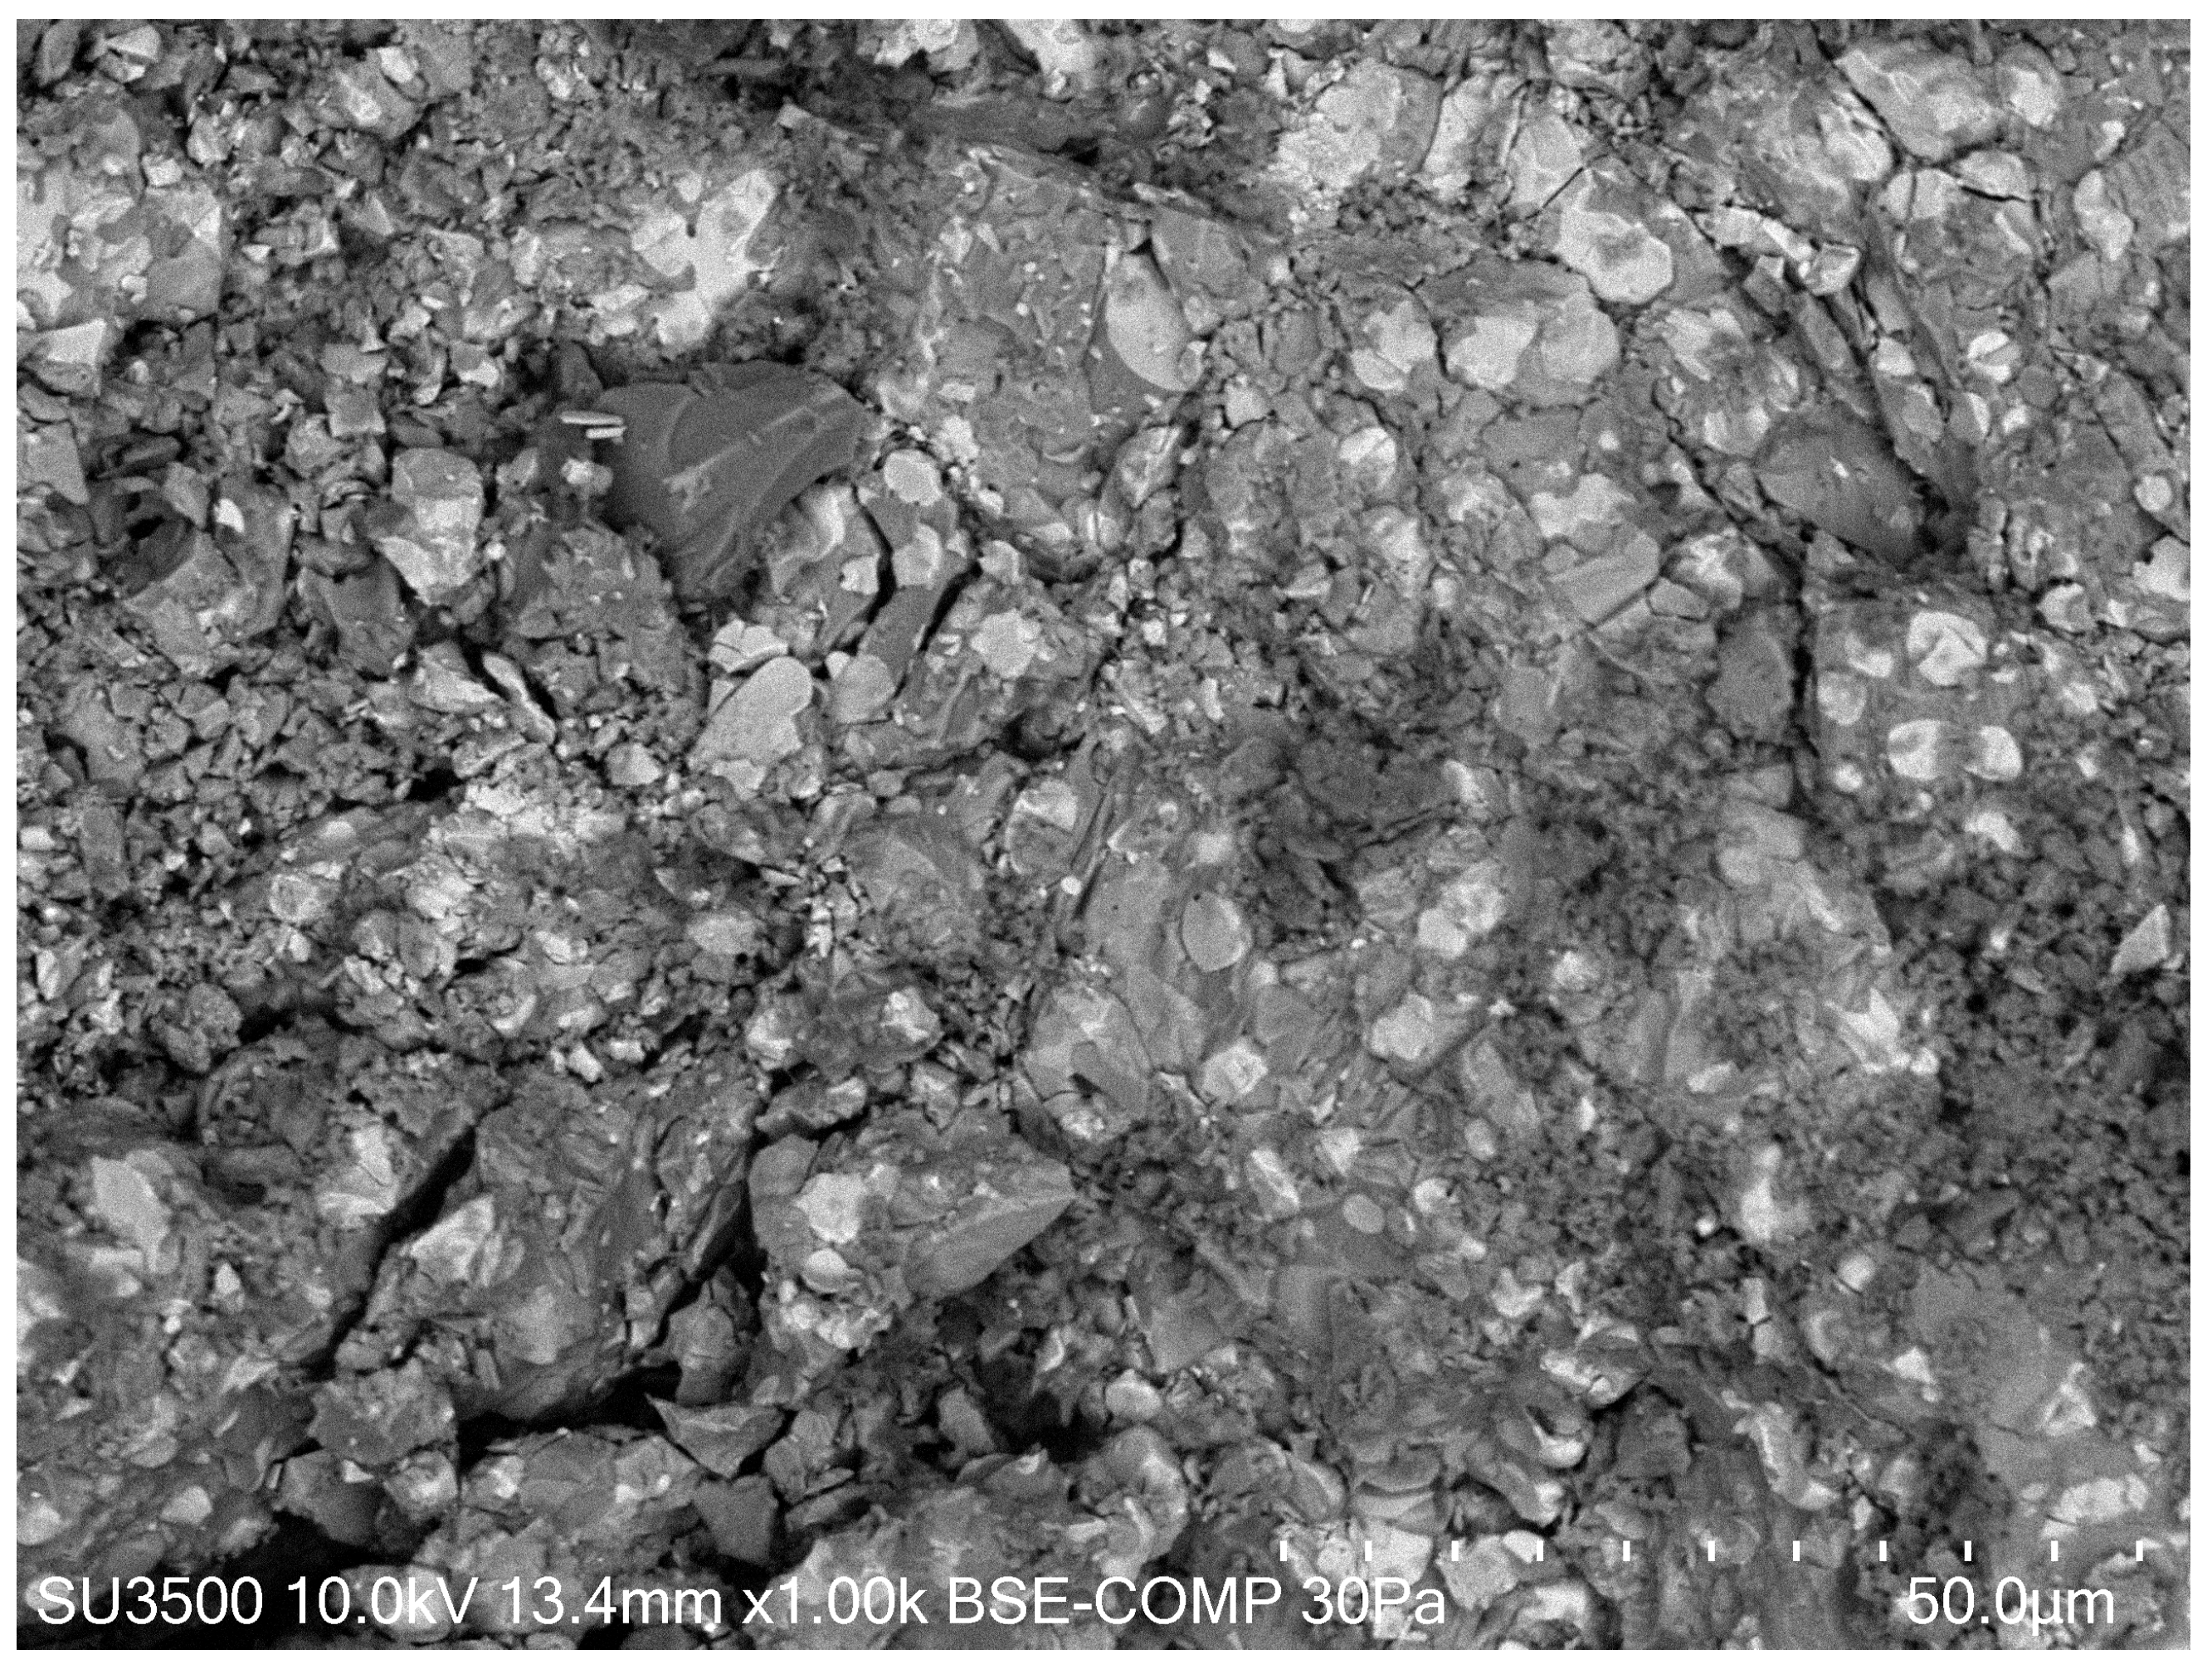
In this case, the effect was enhanced in the presence of pre-existing calcium carbonates in the ERHA® due to previous natural carbonation. This suggests that aqueous carbonation not only promotes the formation of microcracks but can also amplify pre-existing cracks, thereby affecting the density of the material. To evaluate this effect, a known mass (250 g) of two specific sizes of ERHA® (2.36 mm and 0.3 mm) was particle size-distributed. These were carbonated via aqueous carbonation, and the results show the disaggregation of the particle size and are presented in Figure 12 and Figure 13. This interpretation is further supported with an SEM image shown in Figure 14, where visible microcracks can be observed on the surface of an ERHA® subjected to aqueous carbonation.

3.3. Effects of Time on Carbonation

In the aqueous series, the use of Na2CO3 (process A) increased the pH of the solution and prolonged the carbonation time. The pH remained above 9 for 60 min, which may have favoured the formation of cracks in the ERHA® aggregates. In contrast, in the B-series, the pH remained above 9 for 5 min. The precipitation of calcium carbonate is determined by the ratio between Ca2+ and CO 3 2 and the pH of the reaction system. Therefore, the carbonation reaction takes place under alkaline conditions, as the high pH induces the formation of CO 3 2 [47]. According to Li et al. (2025), when the pH is lowered from even 9, the excess CO2 reacts with the existing carbonates to form easily soluble Ca(HCO3)2 [48].
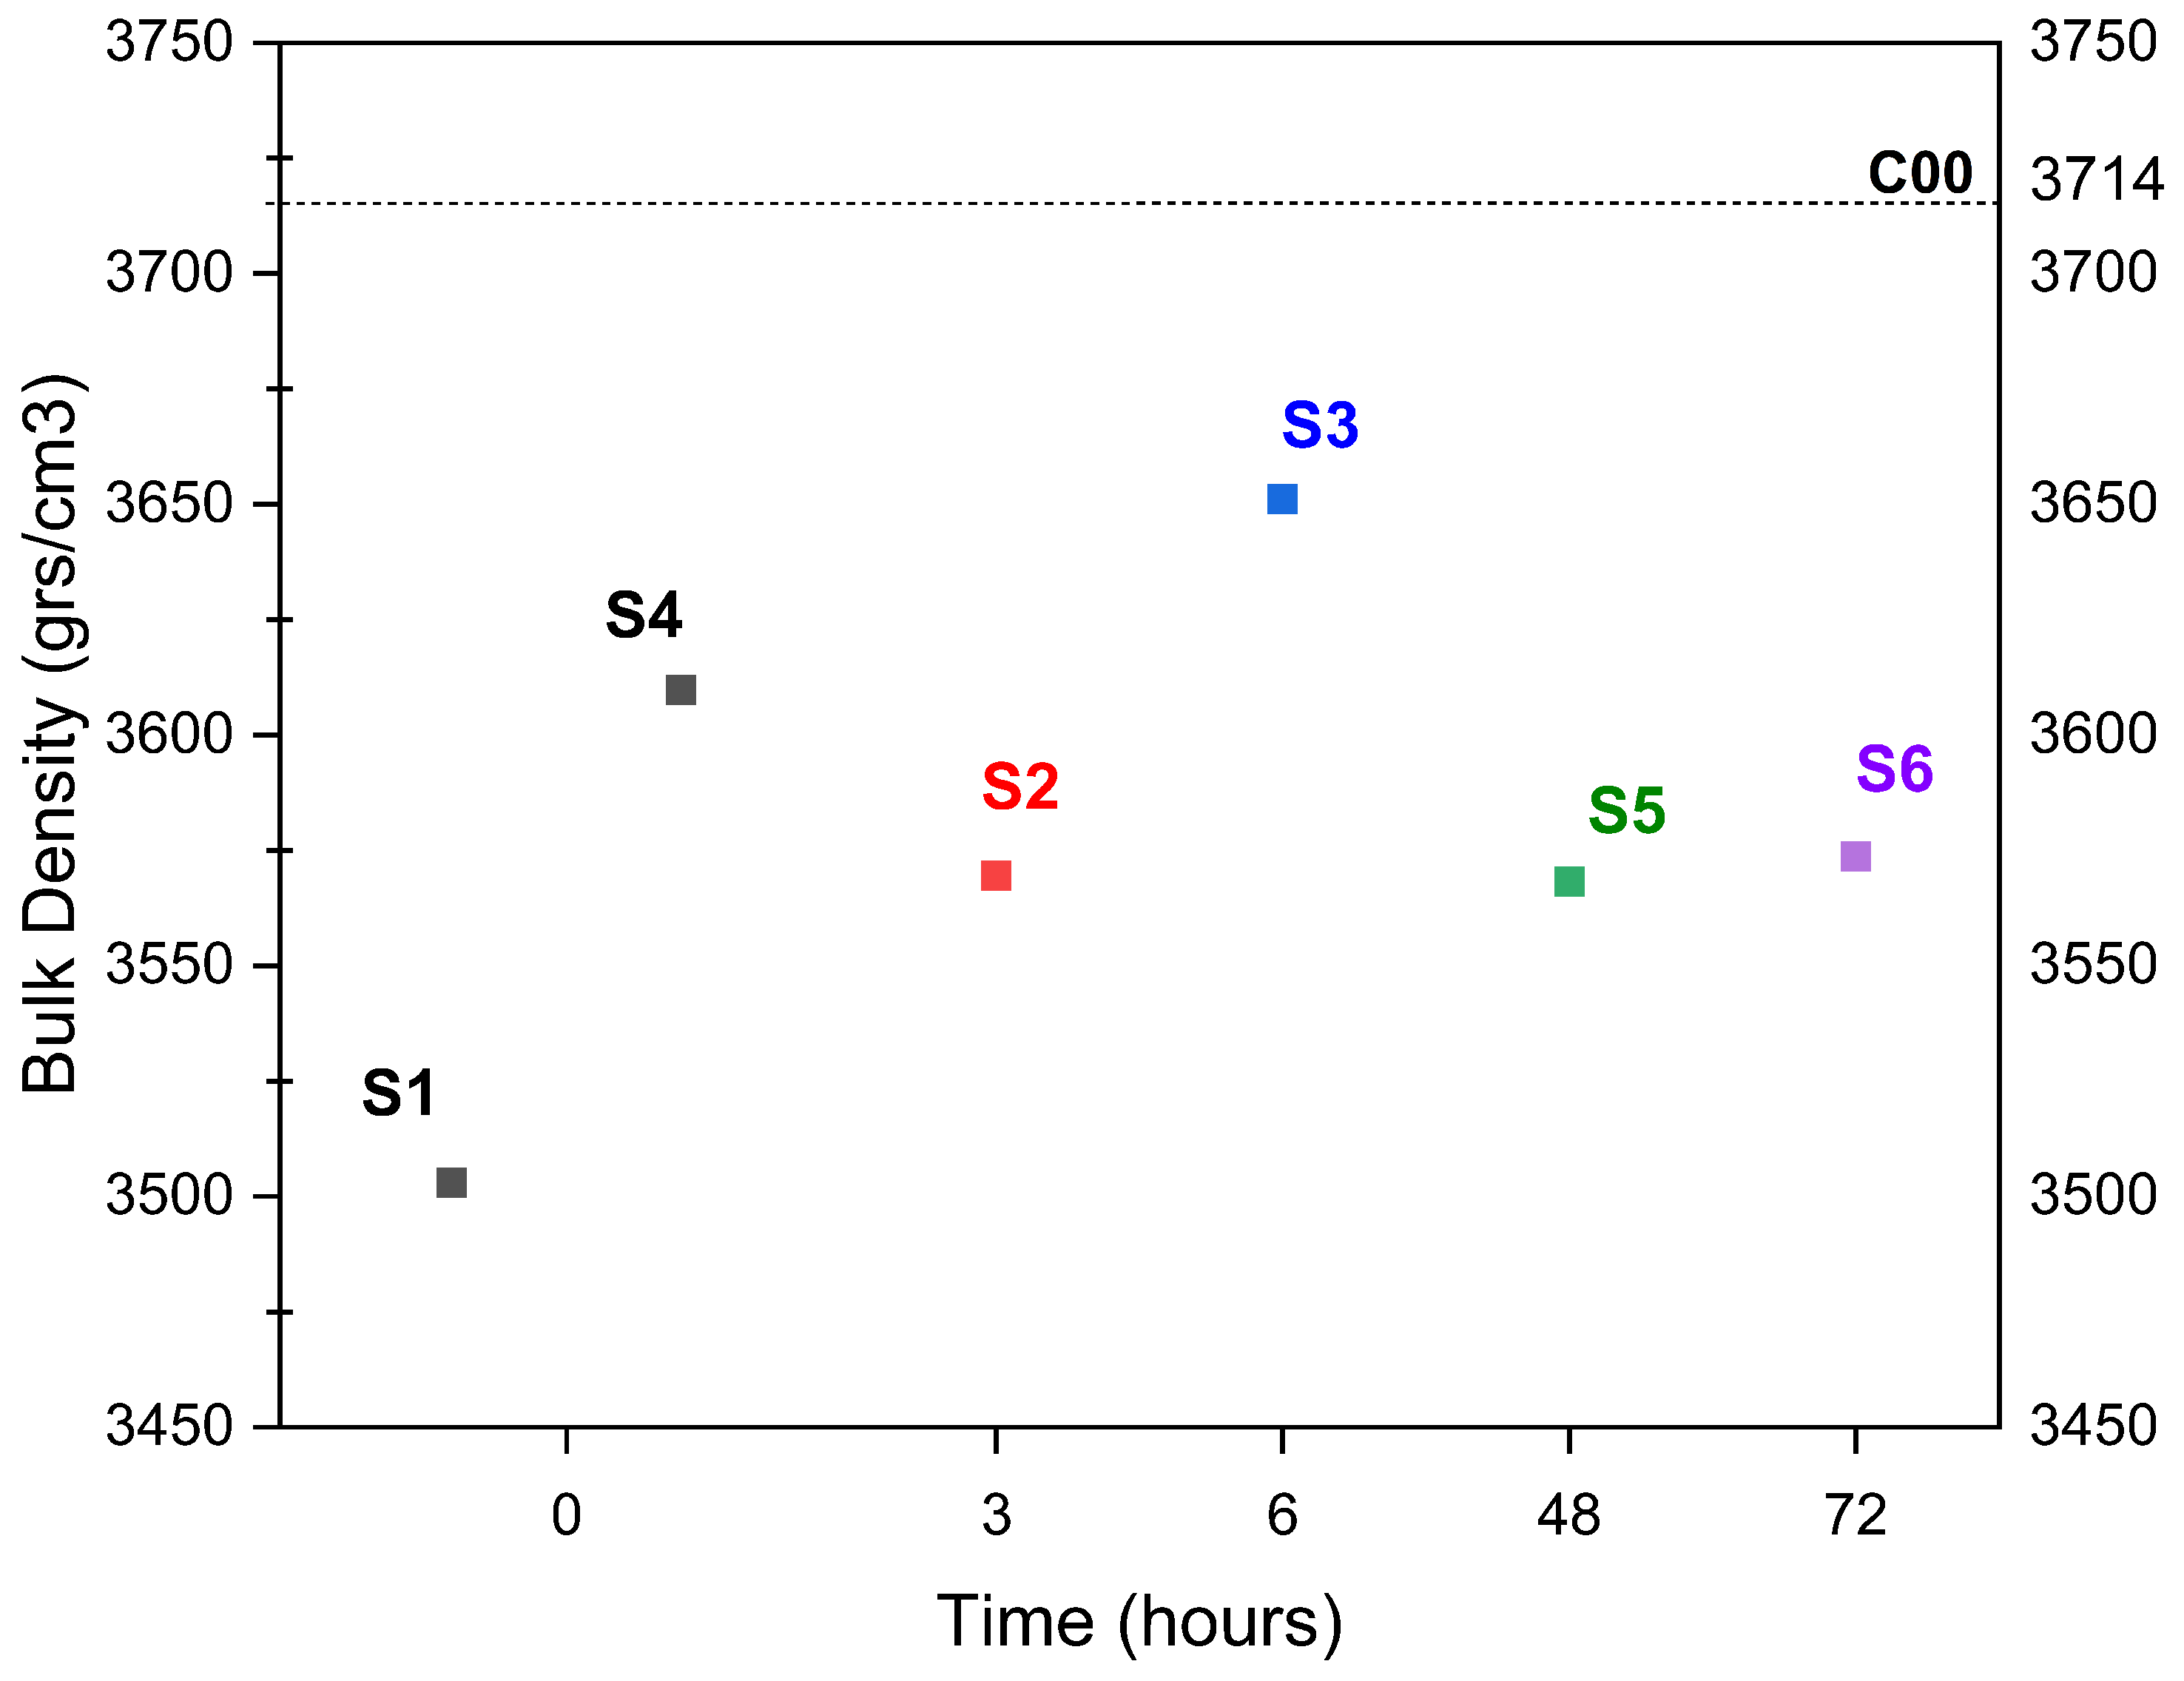
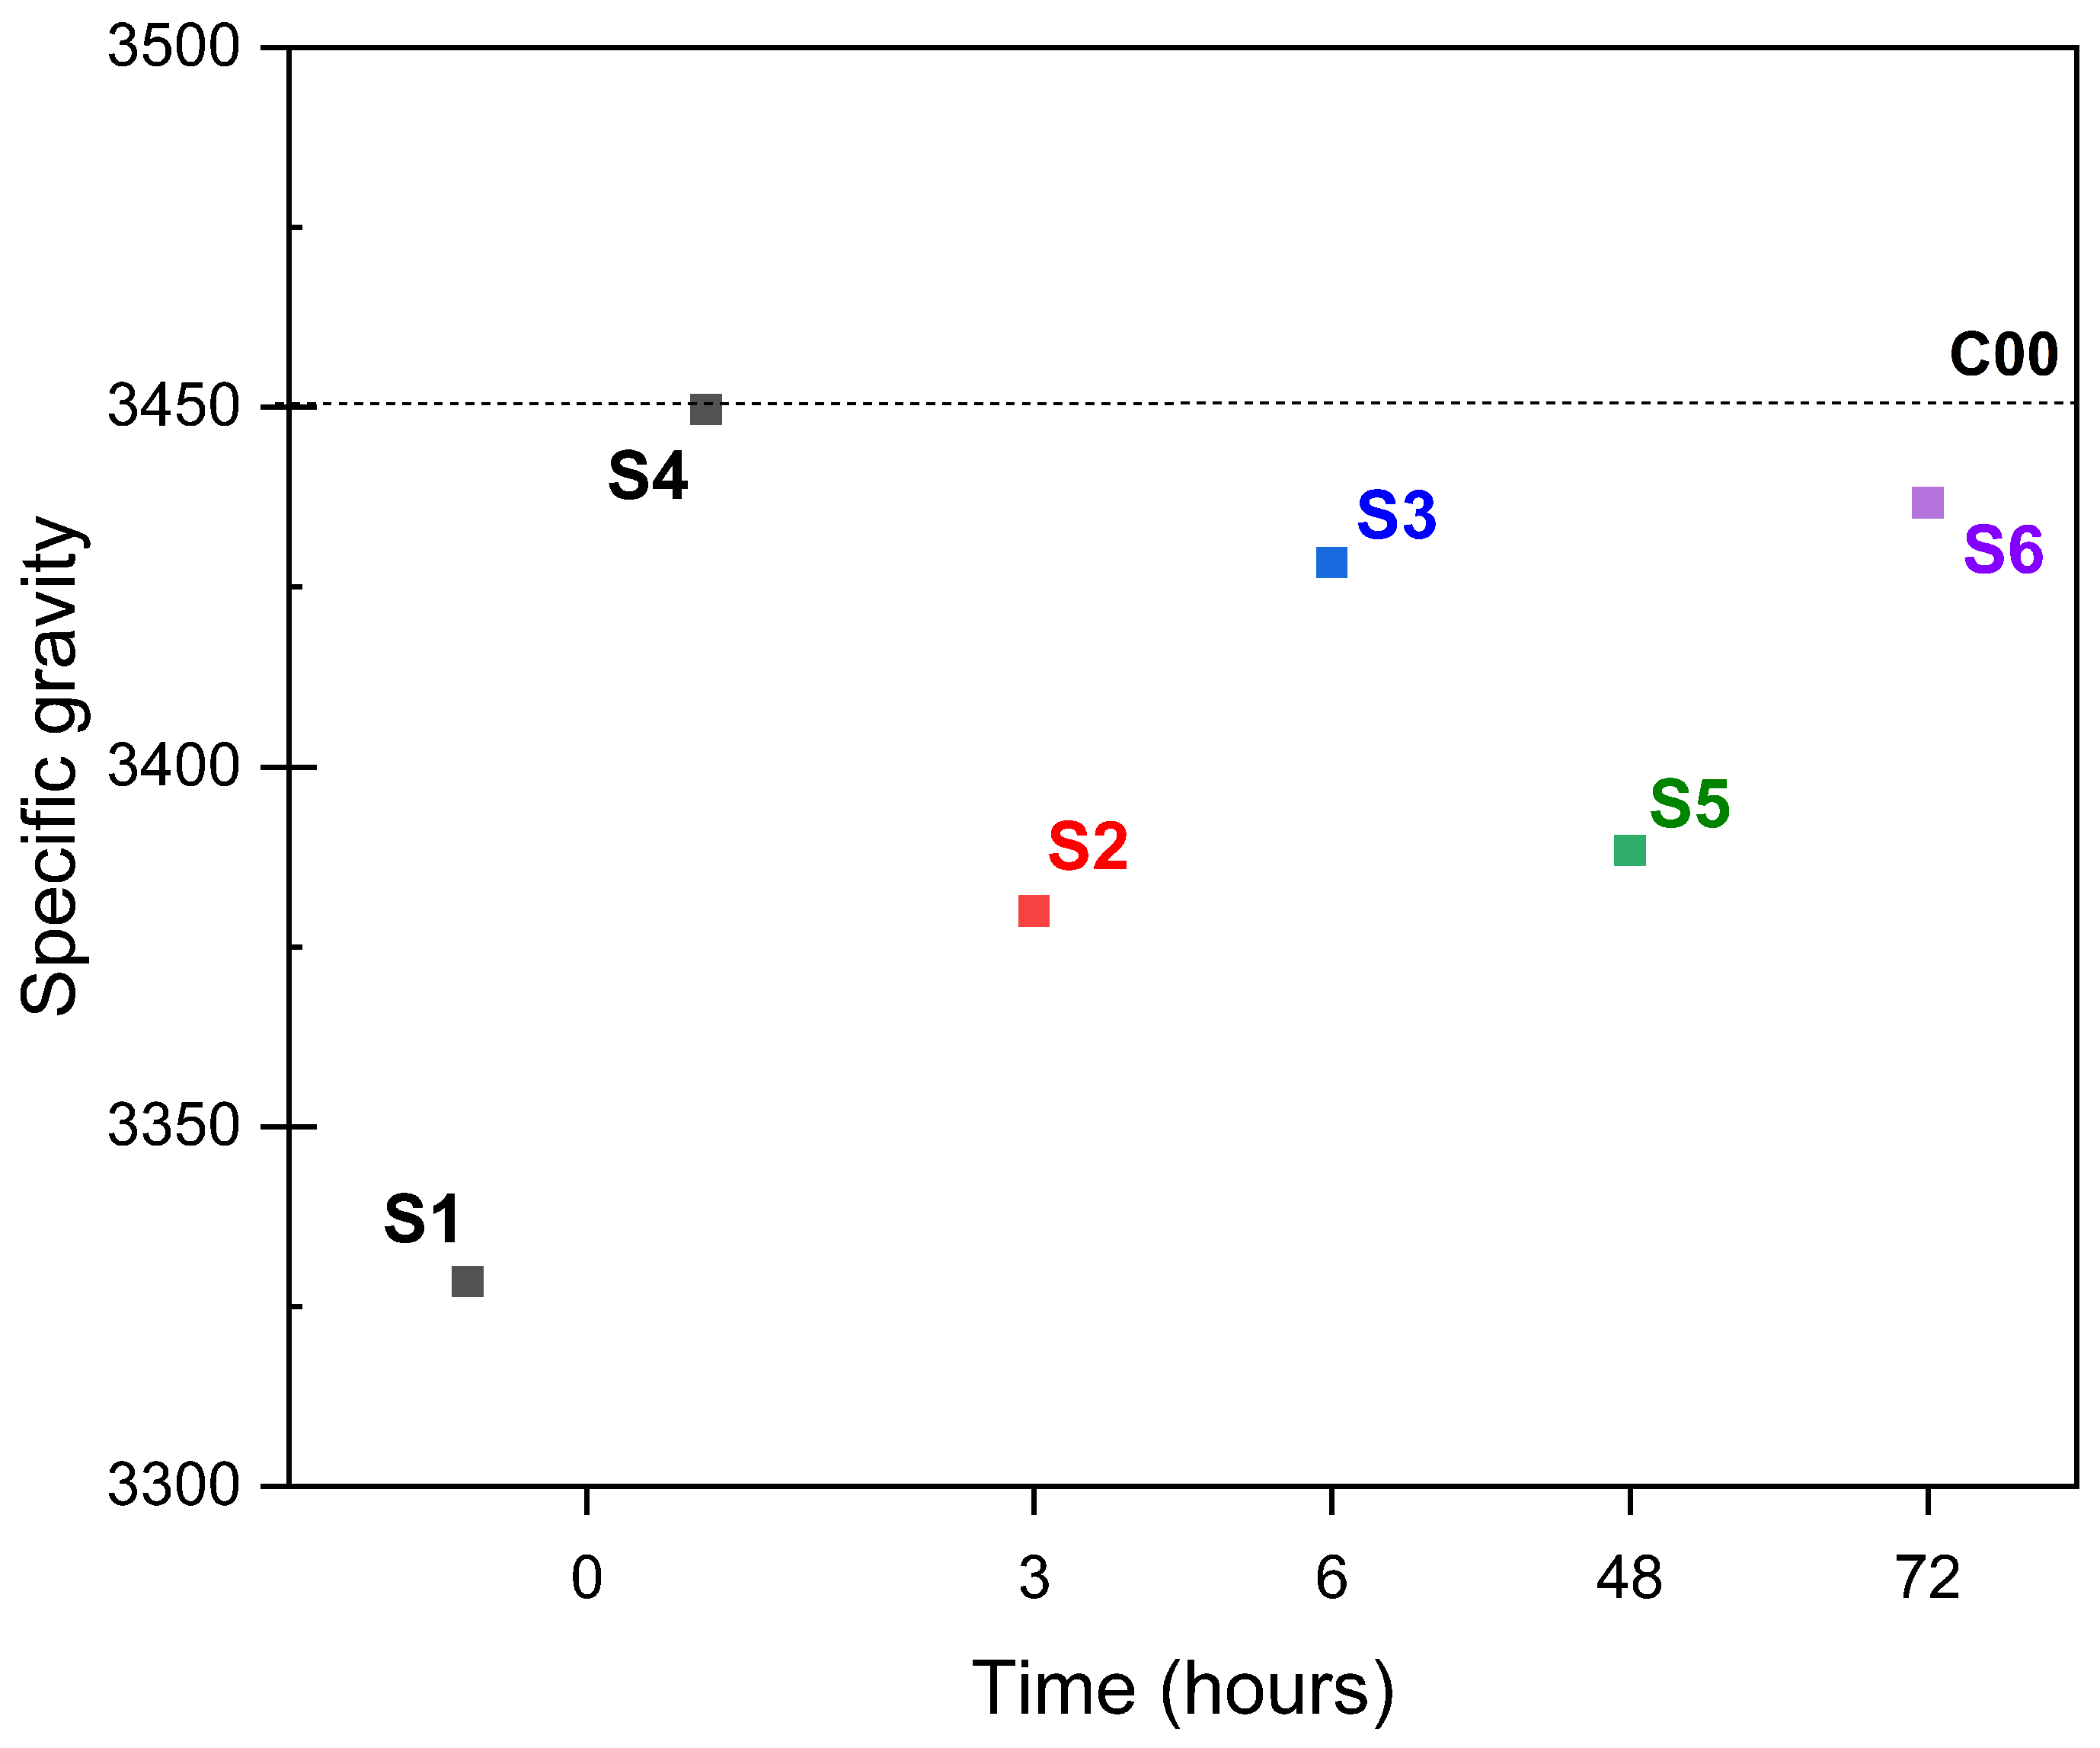
As shown in Figure 15, in semi-dry carbonation, the application of a constant spray during the day increased the bulk density, resulting in an increase in absorption of 4.8% (S1 and S2) and 13.6% (S2 and S3). This increase could be attributed to the formation of a layer of carbonation products, such as portlandite or amorphous silica [26], which limit CO2 penetration and favour surface compaction.
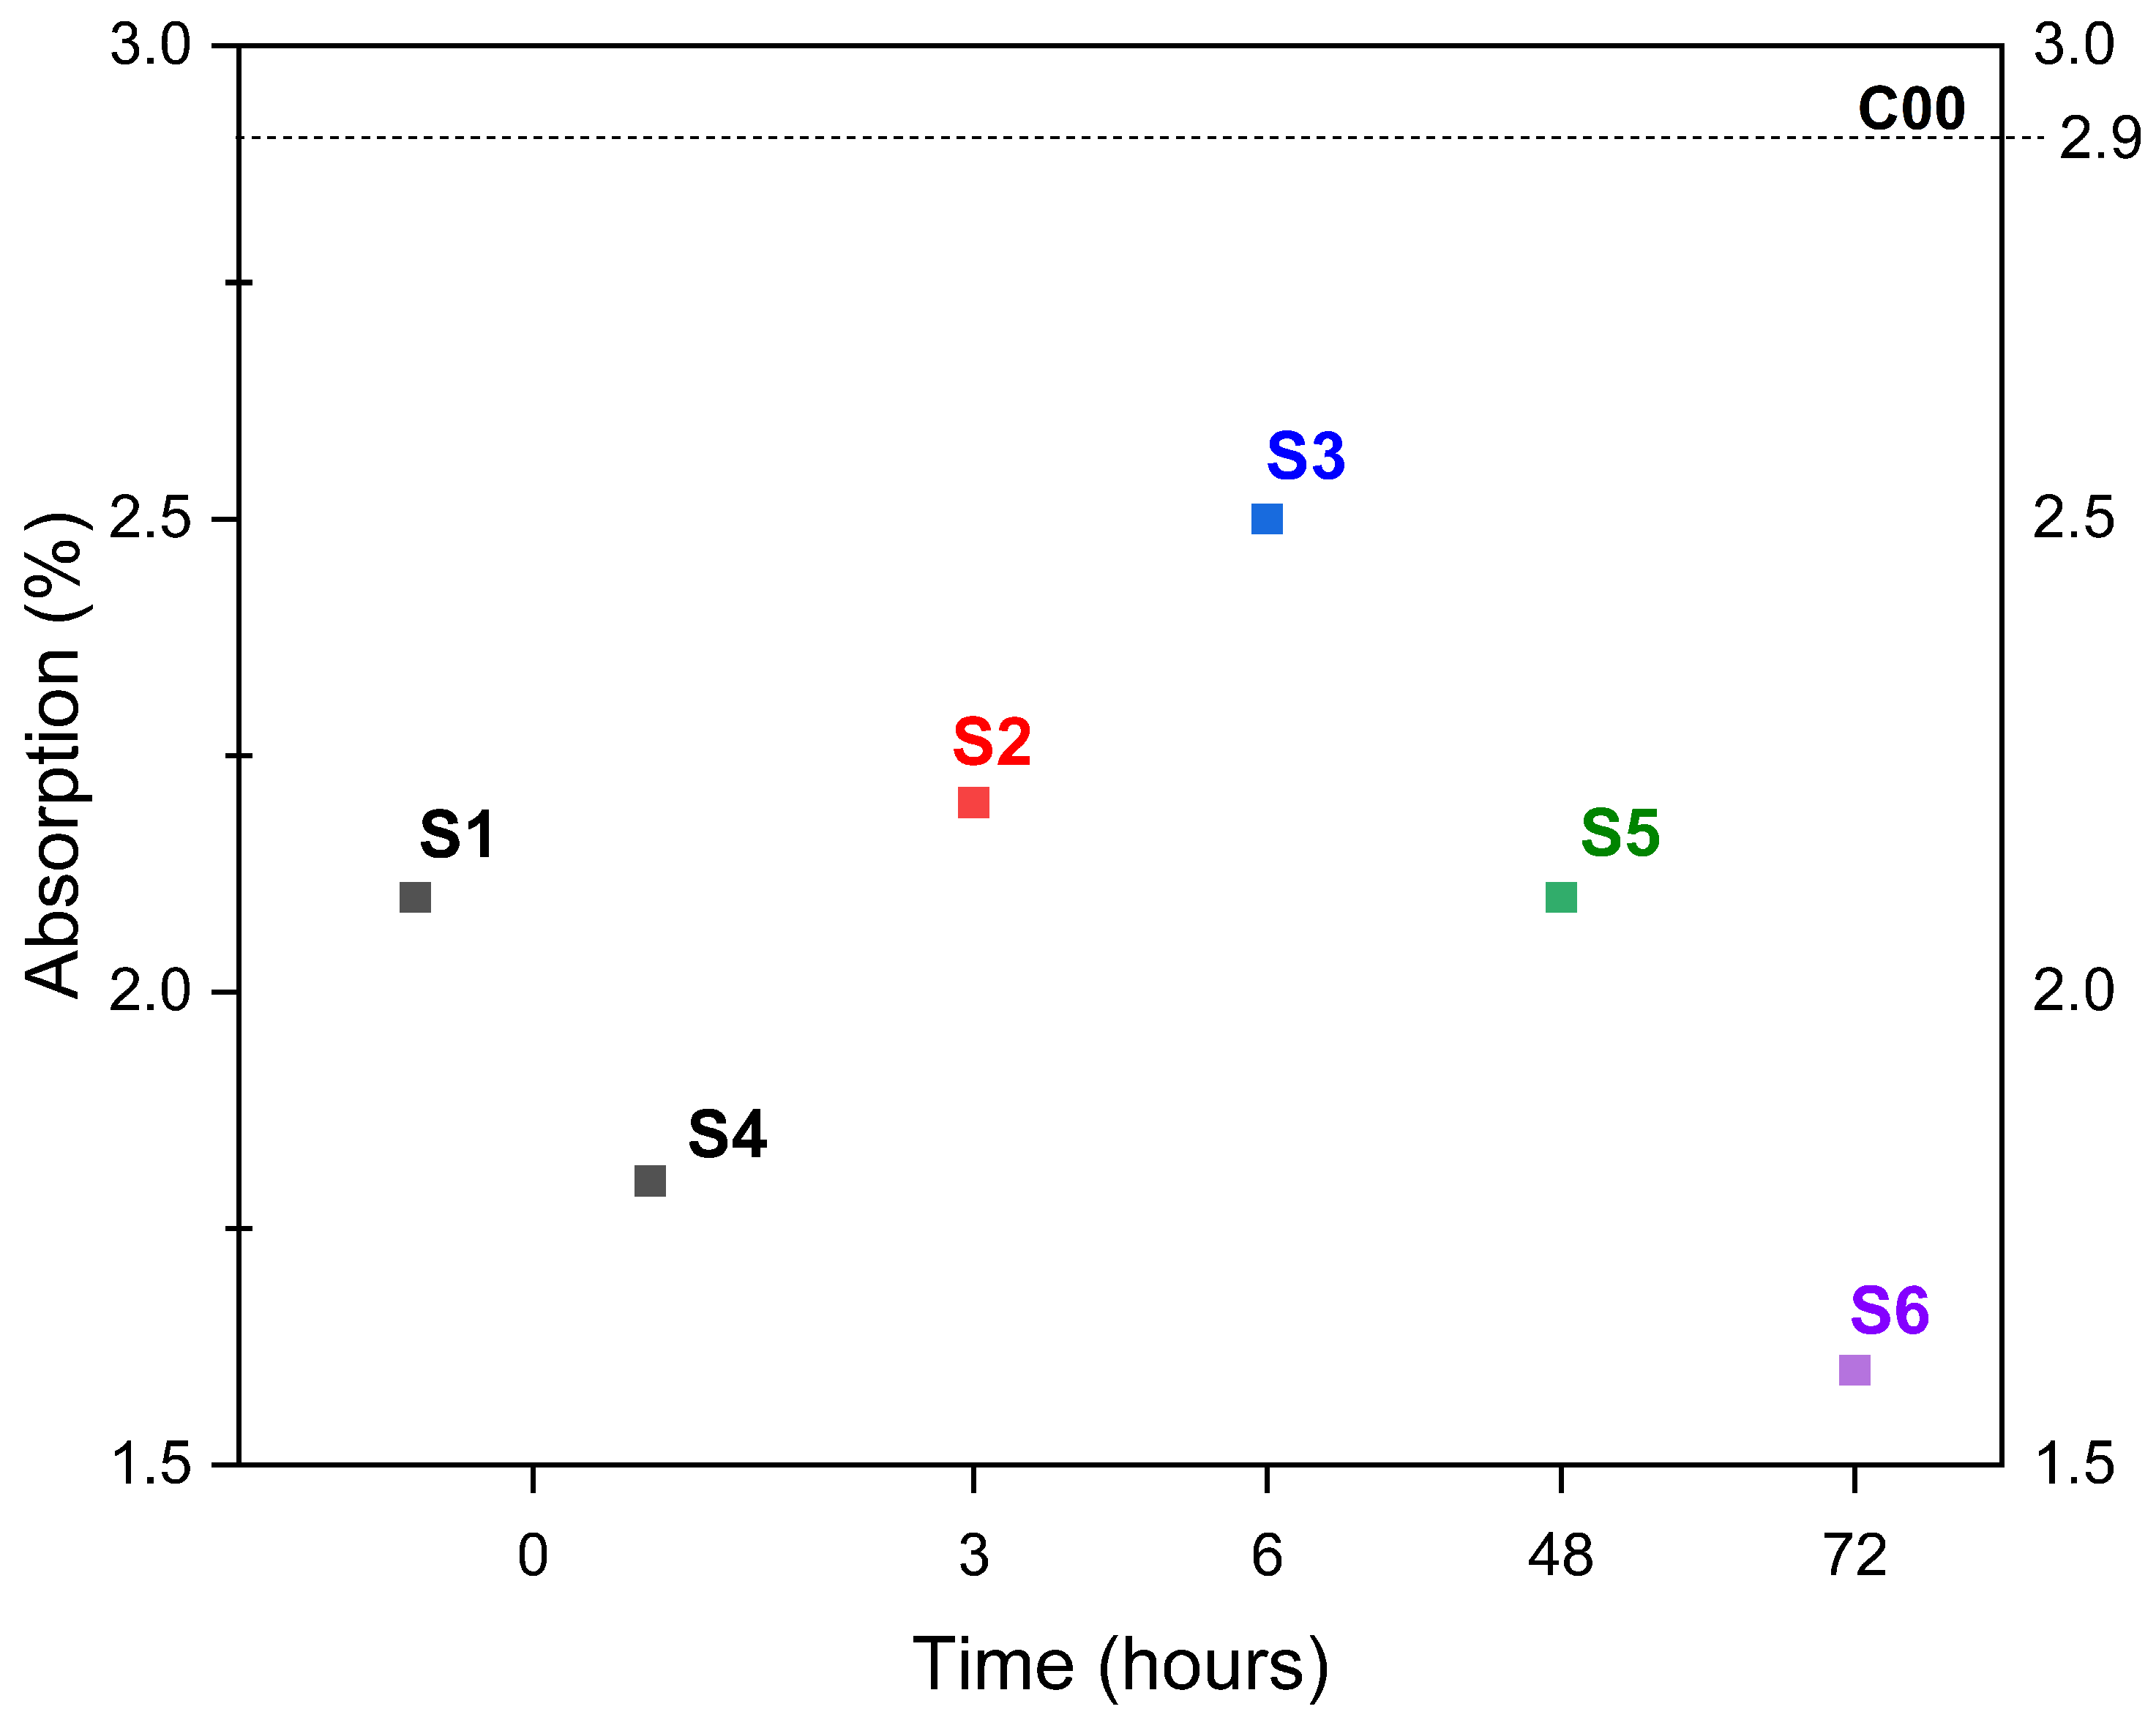
However, heterogeneous nucleation can create gaps or cavities, increasing adsorption and explaining this scenario [49,50]. As well as the specific gravity results indicated in Figure 16. Researchers indicate that semi-wet carbonation has been observed to result in a slightly different layer than dry carbonation that is less porous [19,51]. Compared to the control series, spraying at different frequencies (1, 3, and 6 times per day) reduced the uptake by 27.6%, 24.1%, and 13.8%, respectively; see Figure 17. In addition, the series with less frequent spraying but for a longer period had a greater reduction in uptake. In this context, after studying the effect of curing temperature on carbonation behaviour, Luo et al. (2021) suggested that increasing the carbonation curing time could also improve the degree of crystallinity of the product [25].

3.4. Thermogravimetric Analysis

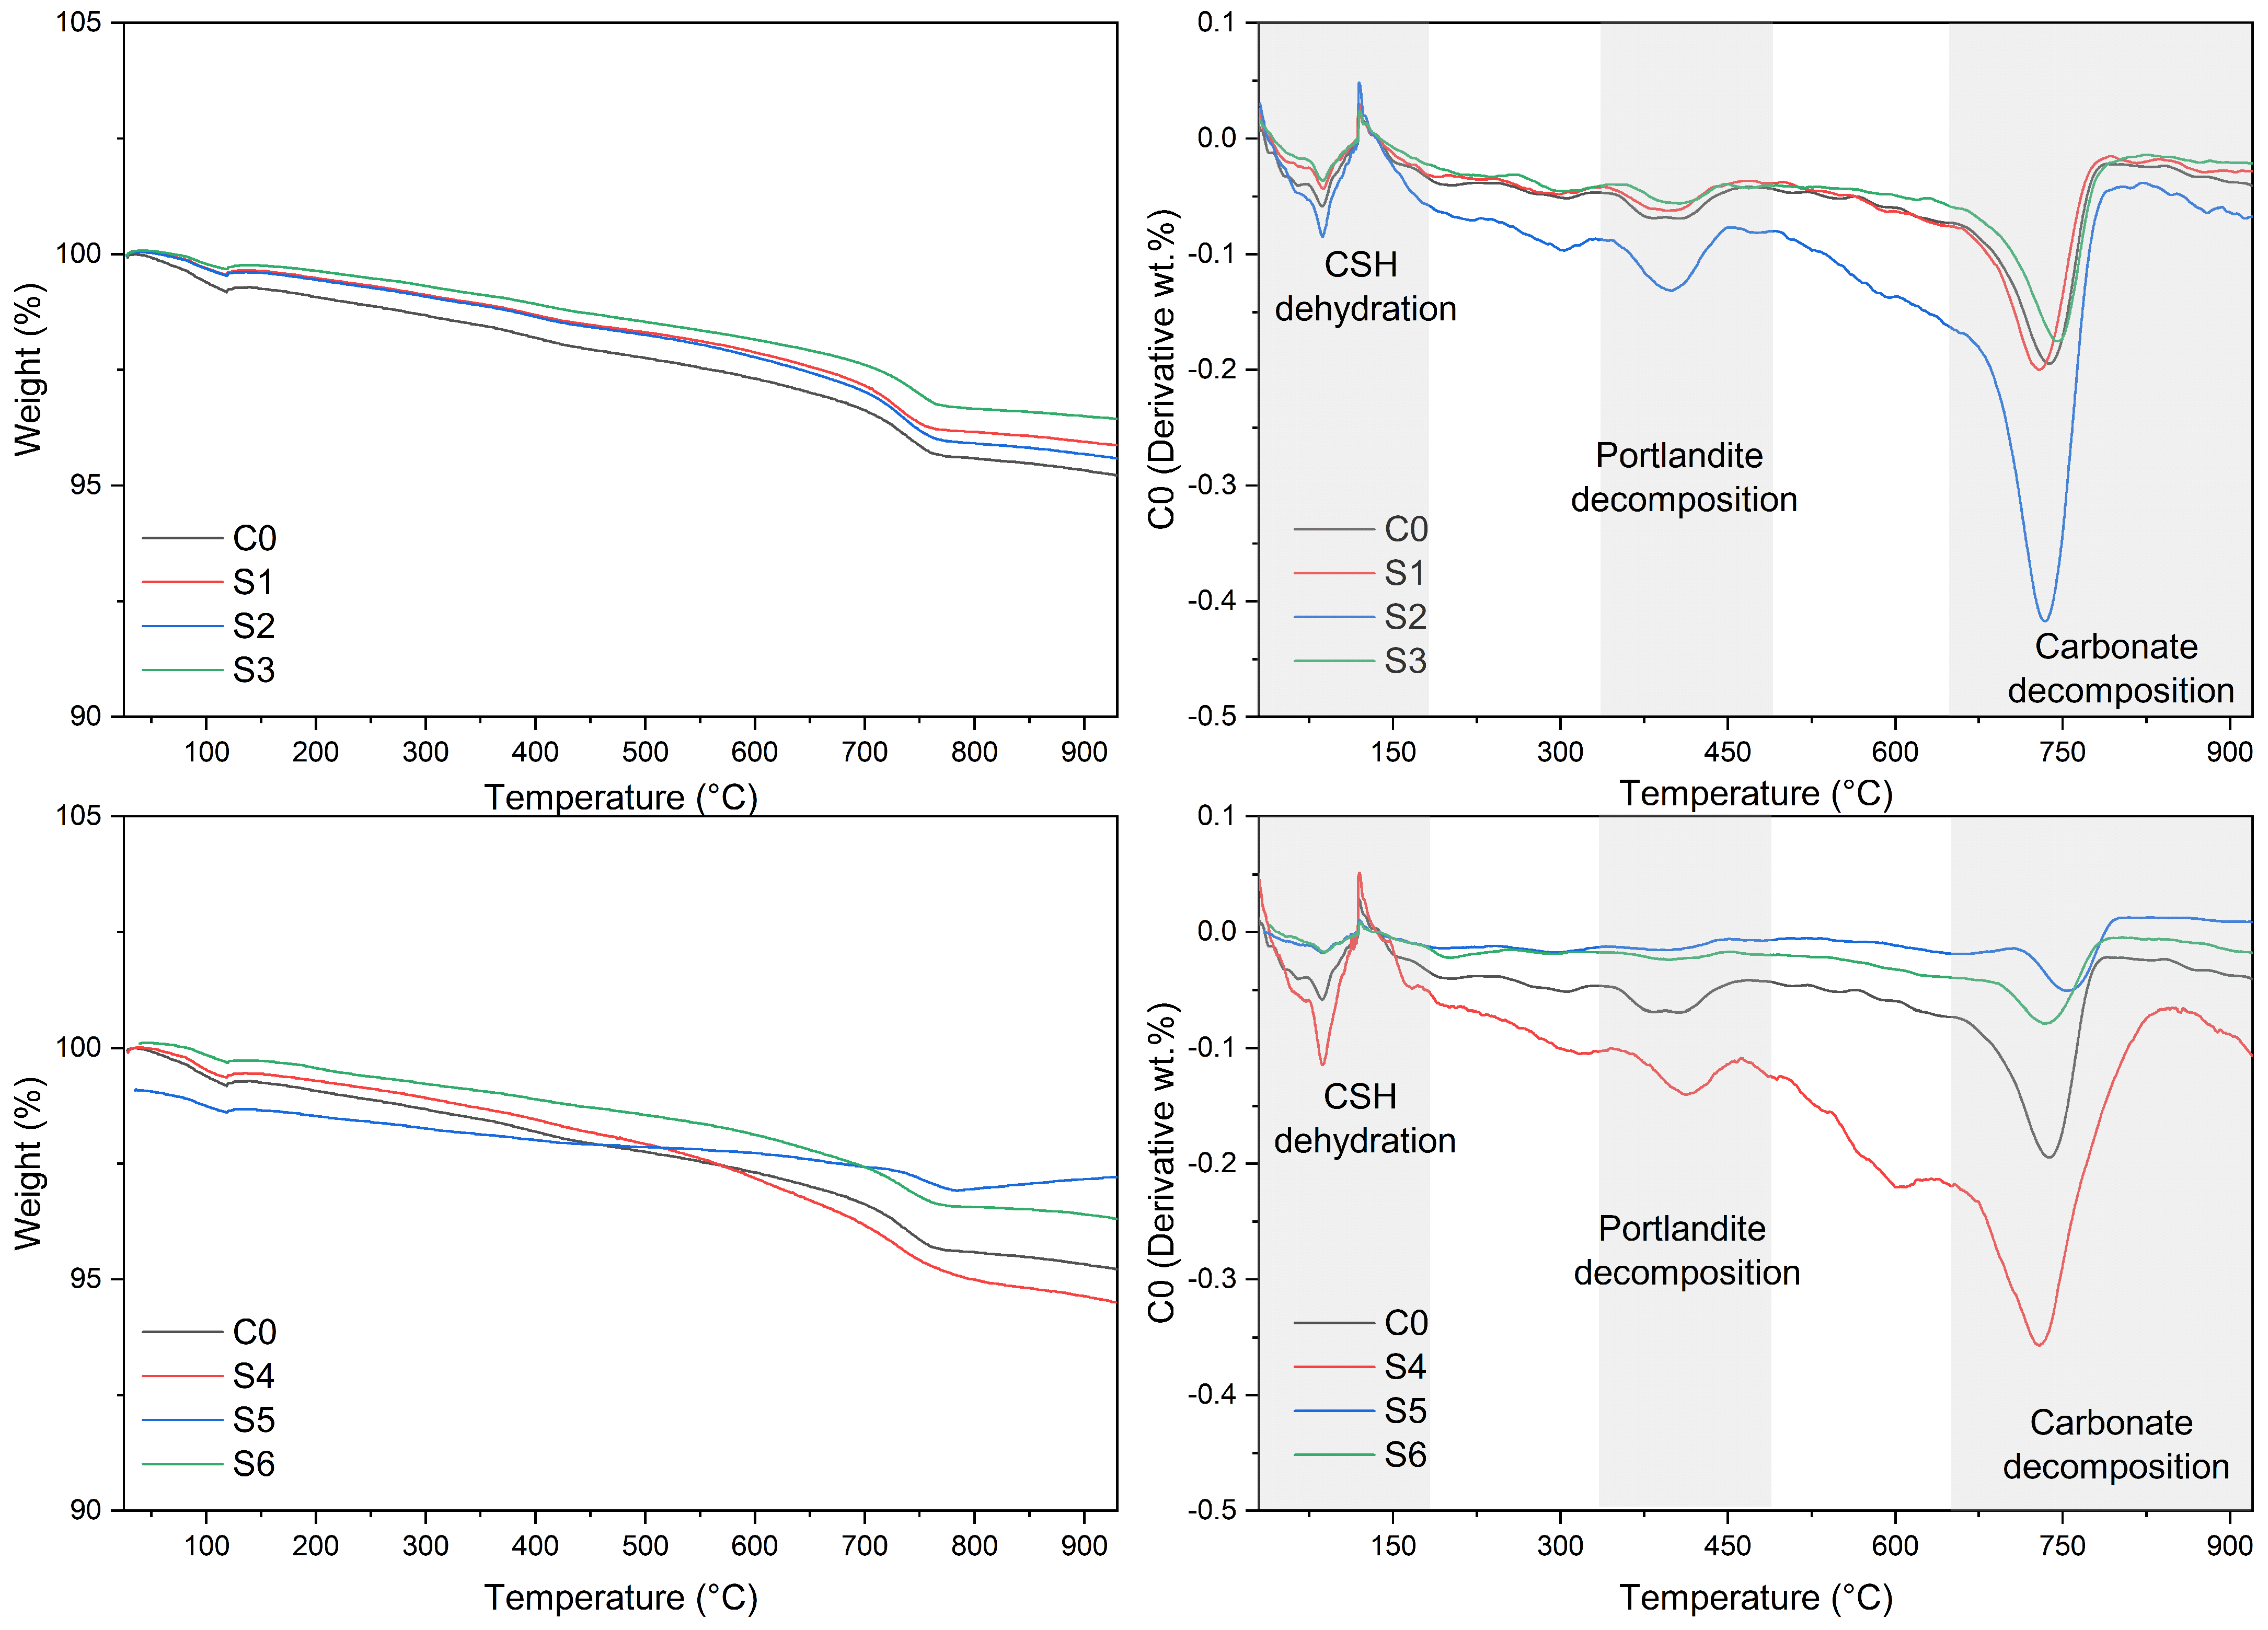
Based on the TGA data (Figure 18 and Figure 19), it was observed that an increase in the ERHA® temperature results in a decrease in the mass associated with carbonates (650–900°), as well as portlandite (350–500 °C) and gel silica (50–200 °C) in aqueous carbonation with Na2CO3 (Series A). This may be related to the effect of process temperature. While it is true that series A had a longer reaction time, the increase in temperature may have limited the leaching of calcium ions and the dissolution of CO2 in water [17]. Series B shows an increase in the curves associated with silica gel and carbonates compared to the control series. Furthermore, in this case, a shift of the thermal curve to the right is observed, suggesting an increase in the crystallinity of the carbonates. The higher the crystallinity, the higher the temperature required for decomposition [28,44,52].
In the case of semi-dry carbonation, a higher frequency of spraying during the day resulted in a moderate increase in the masses associated with carbonates, reaching up to 0.32% (S2 series). Meanwhile, the series in which the spray water contained Na2CO3 obtained an increase of up to 0.64% compared to the control series. Also, for all carbonation types B, the mass ranges for portlandite and CSH compounds did not exceed the mass decomposition of the control series. This could indicate a reaction of these compounds with carbon dioxide to form carbonates. Finally, in the case of the 2- and 3-day series, they did not achieve any increase in the three curves shown in the graphs.

3.5. Mineralogical Analysis

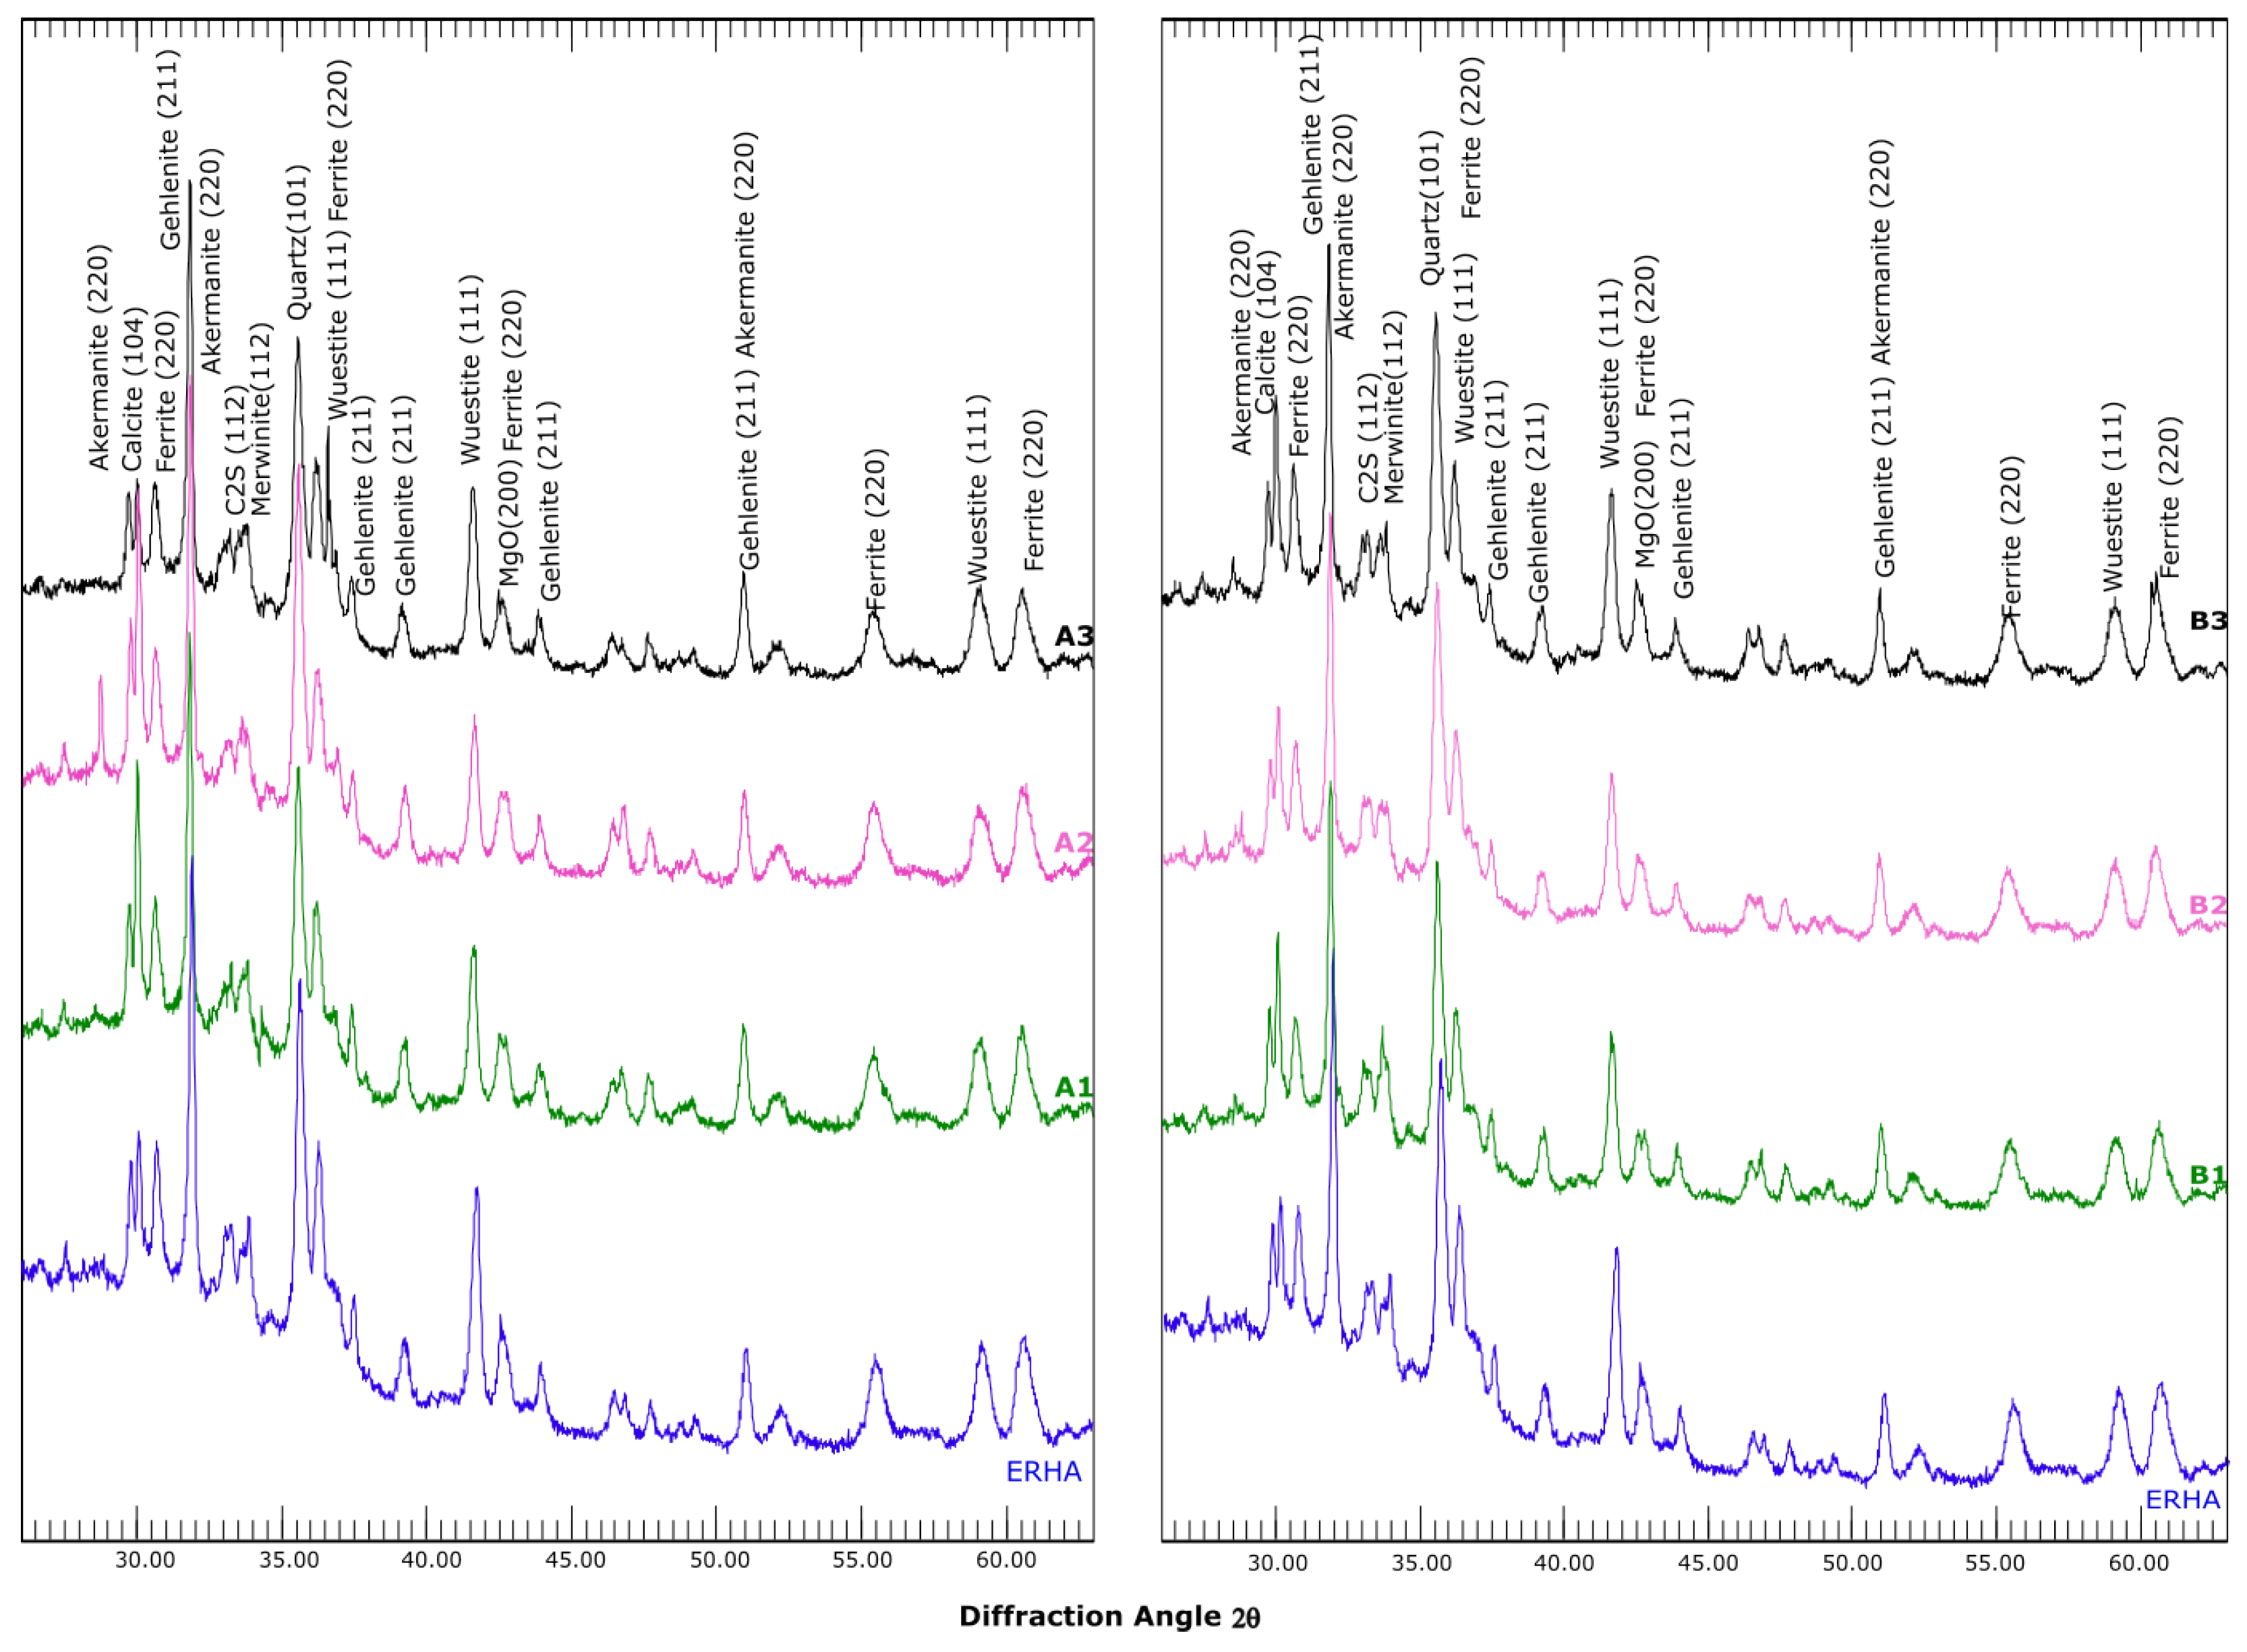
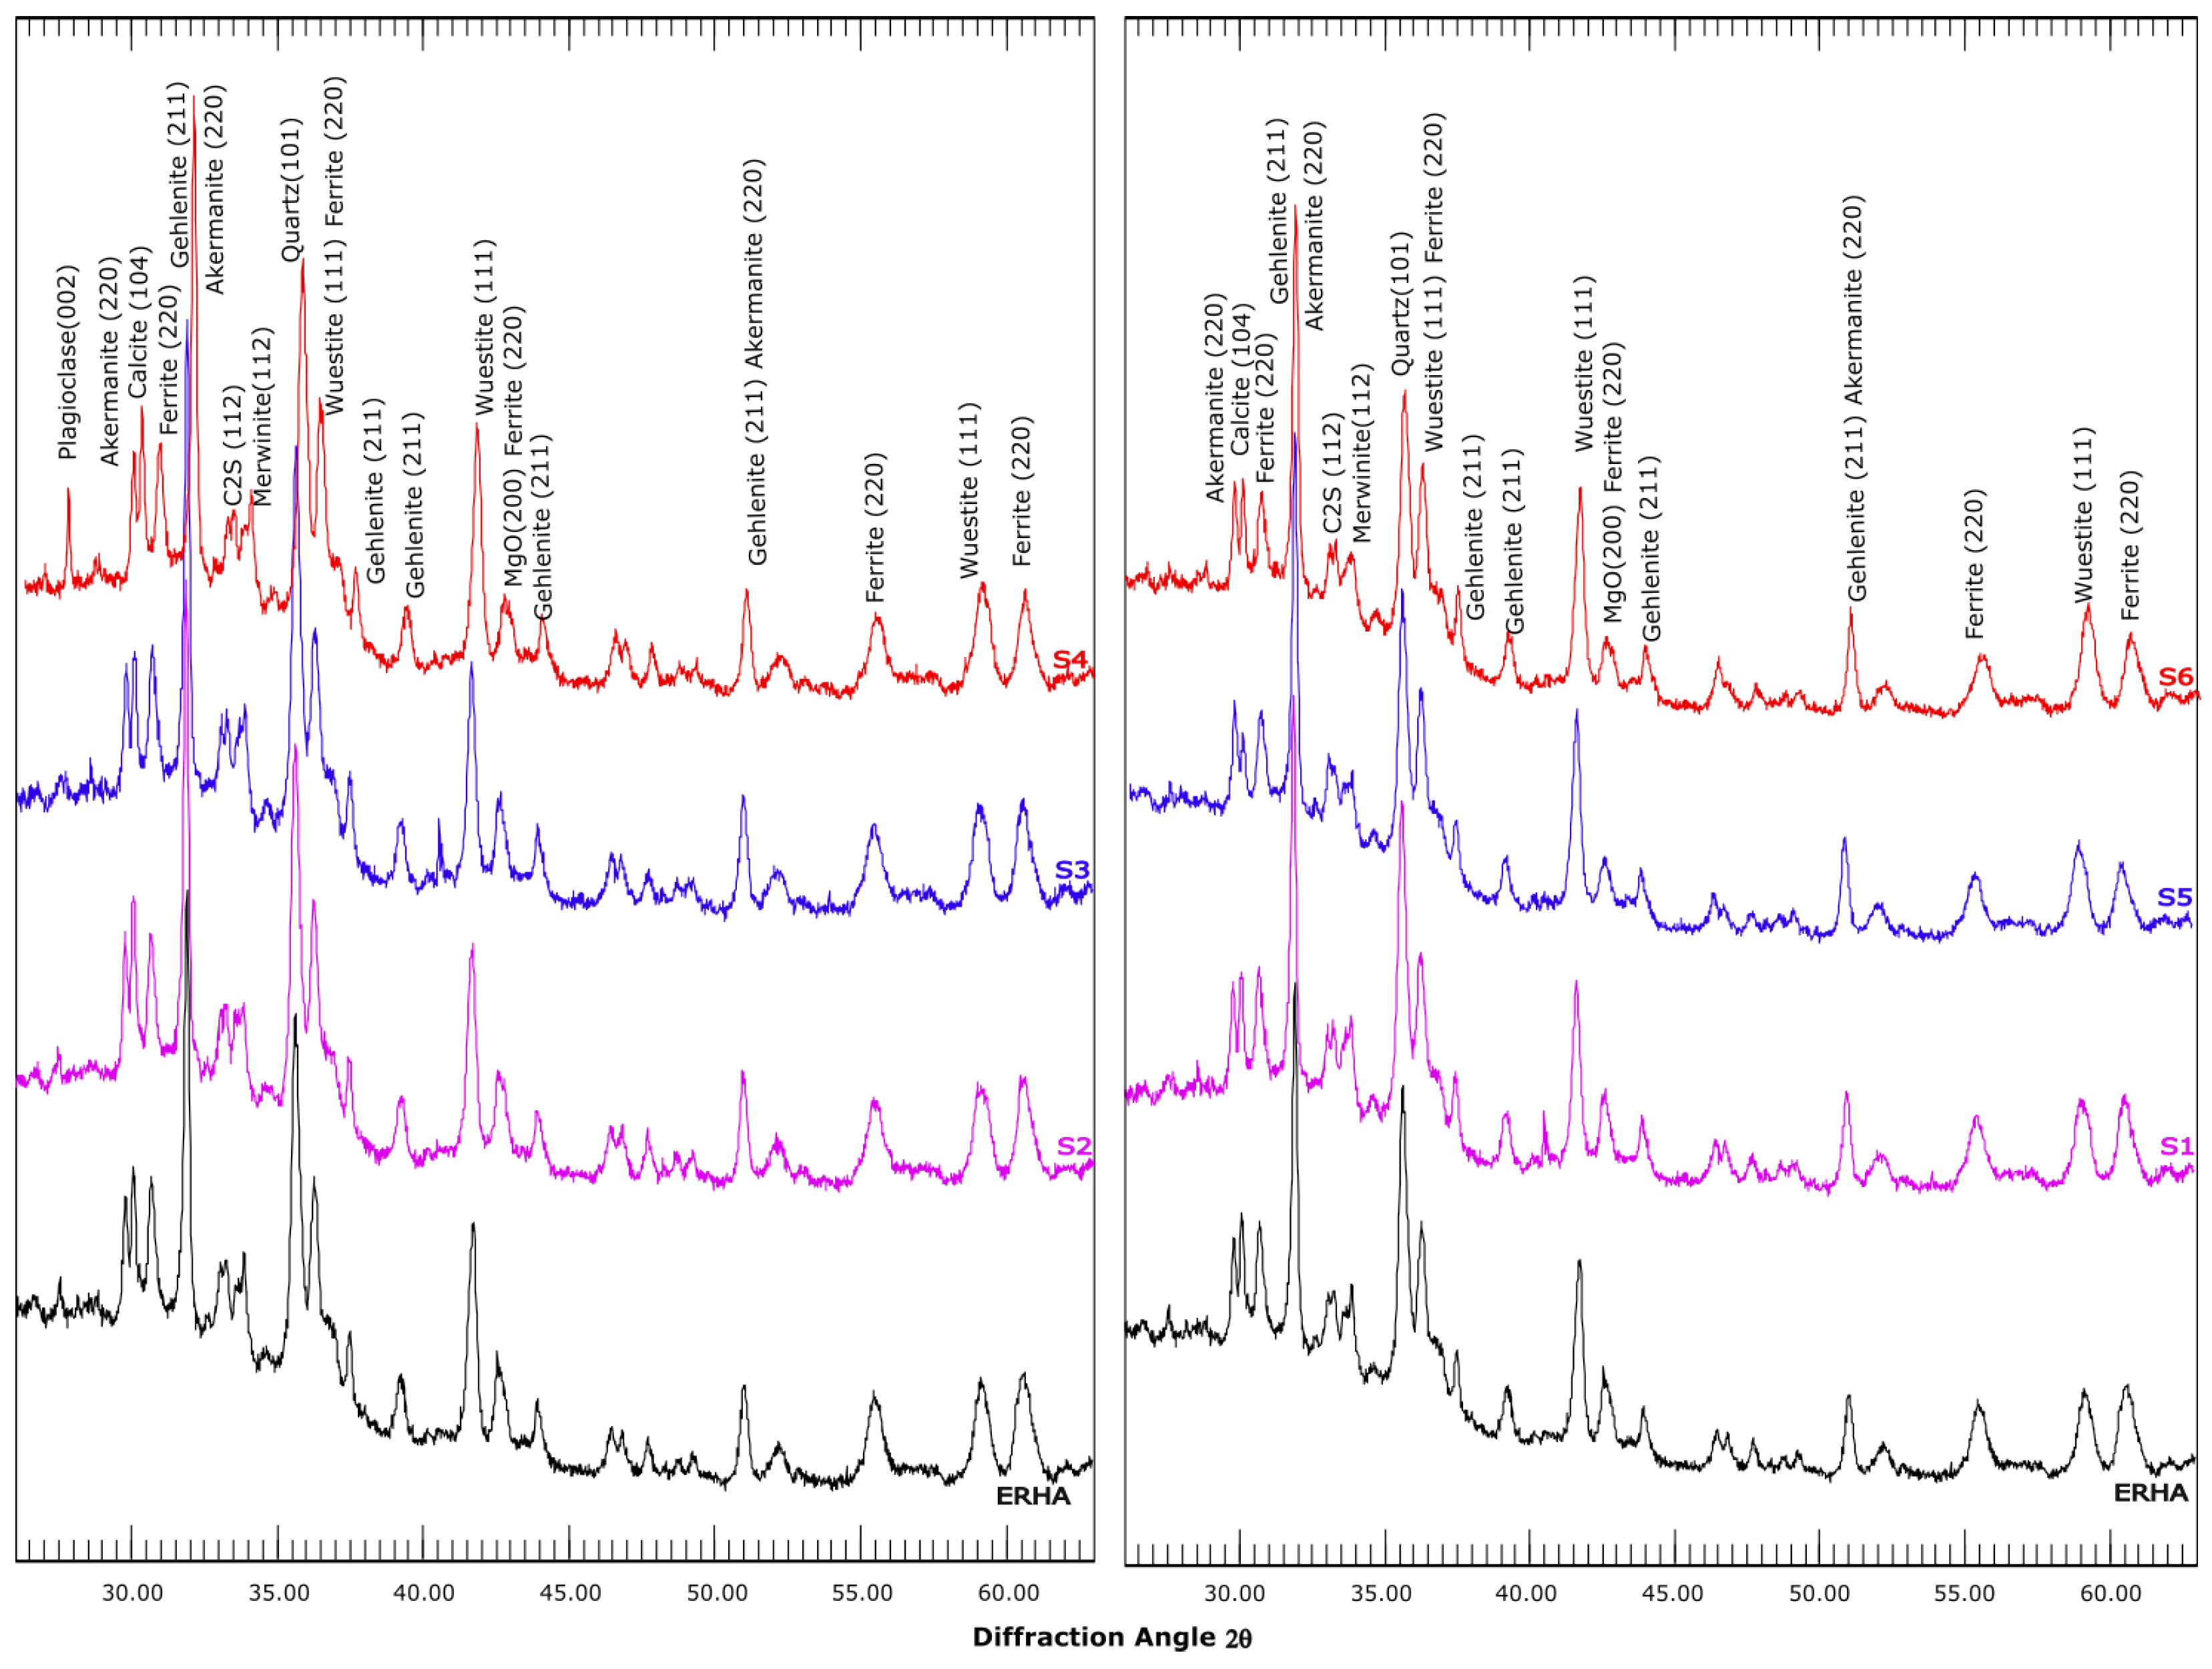
As shown in Figure 20 and Figure 21, in the mineralogical analysis, they observed no significant discrepancies between the X-ray diffraction patterns of the samples subjected to aqueous and semi-dry carbonation and the control, and they observed peaks of Ca-Mg silicates, Ca-silicates, and brownmillerite, commonly found in electric arc furnace slags [38]. However, the results of the Rietveld analysis performed at Profex are complementary to the TGA and in some cases contradictory. A thermogavimetric analysis allows the quantification of the mass loss associated with the thermal decomposition of carbonates and provides an indirect estimate of the carbonate content of the slag but does not distinguish between different crystalline phases. X-ray diffraction and Rietveld refinement help to identify these phases, helping to differentiate the different forms of calcium carbonate for example. However, this analysis may underestimate the presence of amorphous or poorly crystallised carbonates. These methodological differences explain why, in some cases, TGA and XRD results may appear contradictory, reflecting the complexity of the carbonation process and the heterogeneity of the analysed material.
In this case, as shown in Figure 22, a higher production of carbonates was observed in both aqueous carbonation series, especially in process B, related to the results of the TGA analysis previously discussed. Also, in the A series, the A3 series, compared to the control sample, showed a higher decrease in the amount of carbonates. This suggested that the temperature increase could induce a less efficient carbonation.
Also in the B series, there was no major difference in the presence of carbonates between the same series. However, an increase in CSH was observed, with the B3 series having two times more CSH than the control series. According to Ye et al. (2024), who studied the aqueous carbonation in high magnesium slags at temperatures of 40, 60, and 80 °C, the increase in silica gel was observed in the B3 series [44]. The increase in silica gives way to the formation of new CSH and CaCO3 phases, which act as nucleation sites in the early stages of hydration. This suggests that this increase in CSH in the series may be related to the curves associated with the silica gel in the thermogravimetric analysis of the same series [44,53].
In the most aqueous carbonation series, a decrease in C2S (dicalcium silicate) was observed. This is a compound that can react with CO2 and water to form C-S-H, calcium and magnesium hydroxides, and calcium carbonate [26,54,55]. Furthermore, the presence of monohydratocalcite, an intermediate product in the transition from amorphous calcium carbonate to more stable forms such as aragonite or calcite, was detected in the series [56]. This would indicate that the carbonation process was present in the samples but not effective. On the other hand, there was no significant decrease in magnesium and calcium oxides. This effect may be related to several factors, such as the formation of metal carbonates or complex silicates that inhibit further dissolution of metals [57]. Finally, the presence of hydrated silicates was observed; they could lead to the formation of impermeable coatings on the surface, preventing further reaction [26].
Similar to aqueous carbonation, the diffractograms of the carbonated series with the semi-dry process did not show any significant changes in the most representative peaks. However, it is observed that the MgO, CaO, and C2S compounds decrease. Therefore, carbonate samples have a lower risk of expansion. The most expansive phases in steel slags are mainly free CaO and free MgO, and the transformation of dichalcium silicate (C2S) from the β -phase to the γ -phase can also contribute to the volumetric expansion of the slag [57].
An increase in the amount of carbonates compared to the control series was observed in the series that had a constant spray during the day. According to the analysis, it was possible to detect aragonite in the S2 series. This series had the highest amount of carbonates. The presence of aragonite confirms that carbonates were formed as a result of the reaction between CO2 and slag components, particularly calcium and magnesium [58]. This indicates that carbonation has occurred and that carbon dioxide is fixed in the ERHA® structure.

3.6. Sequestration Capacity

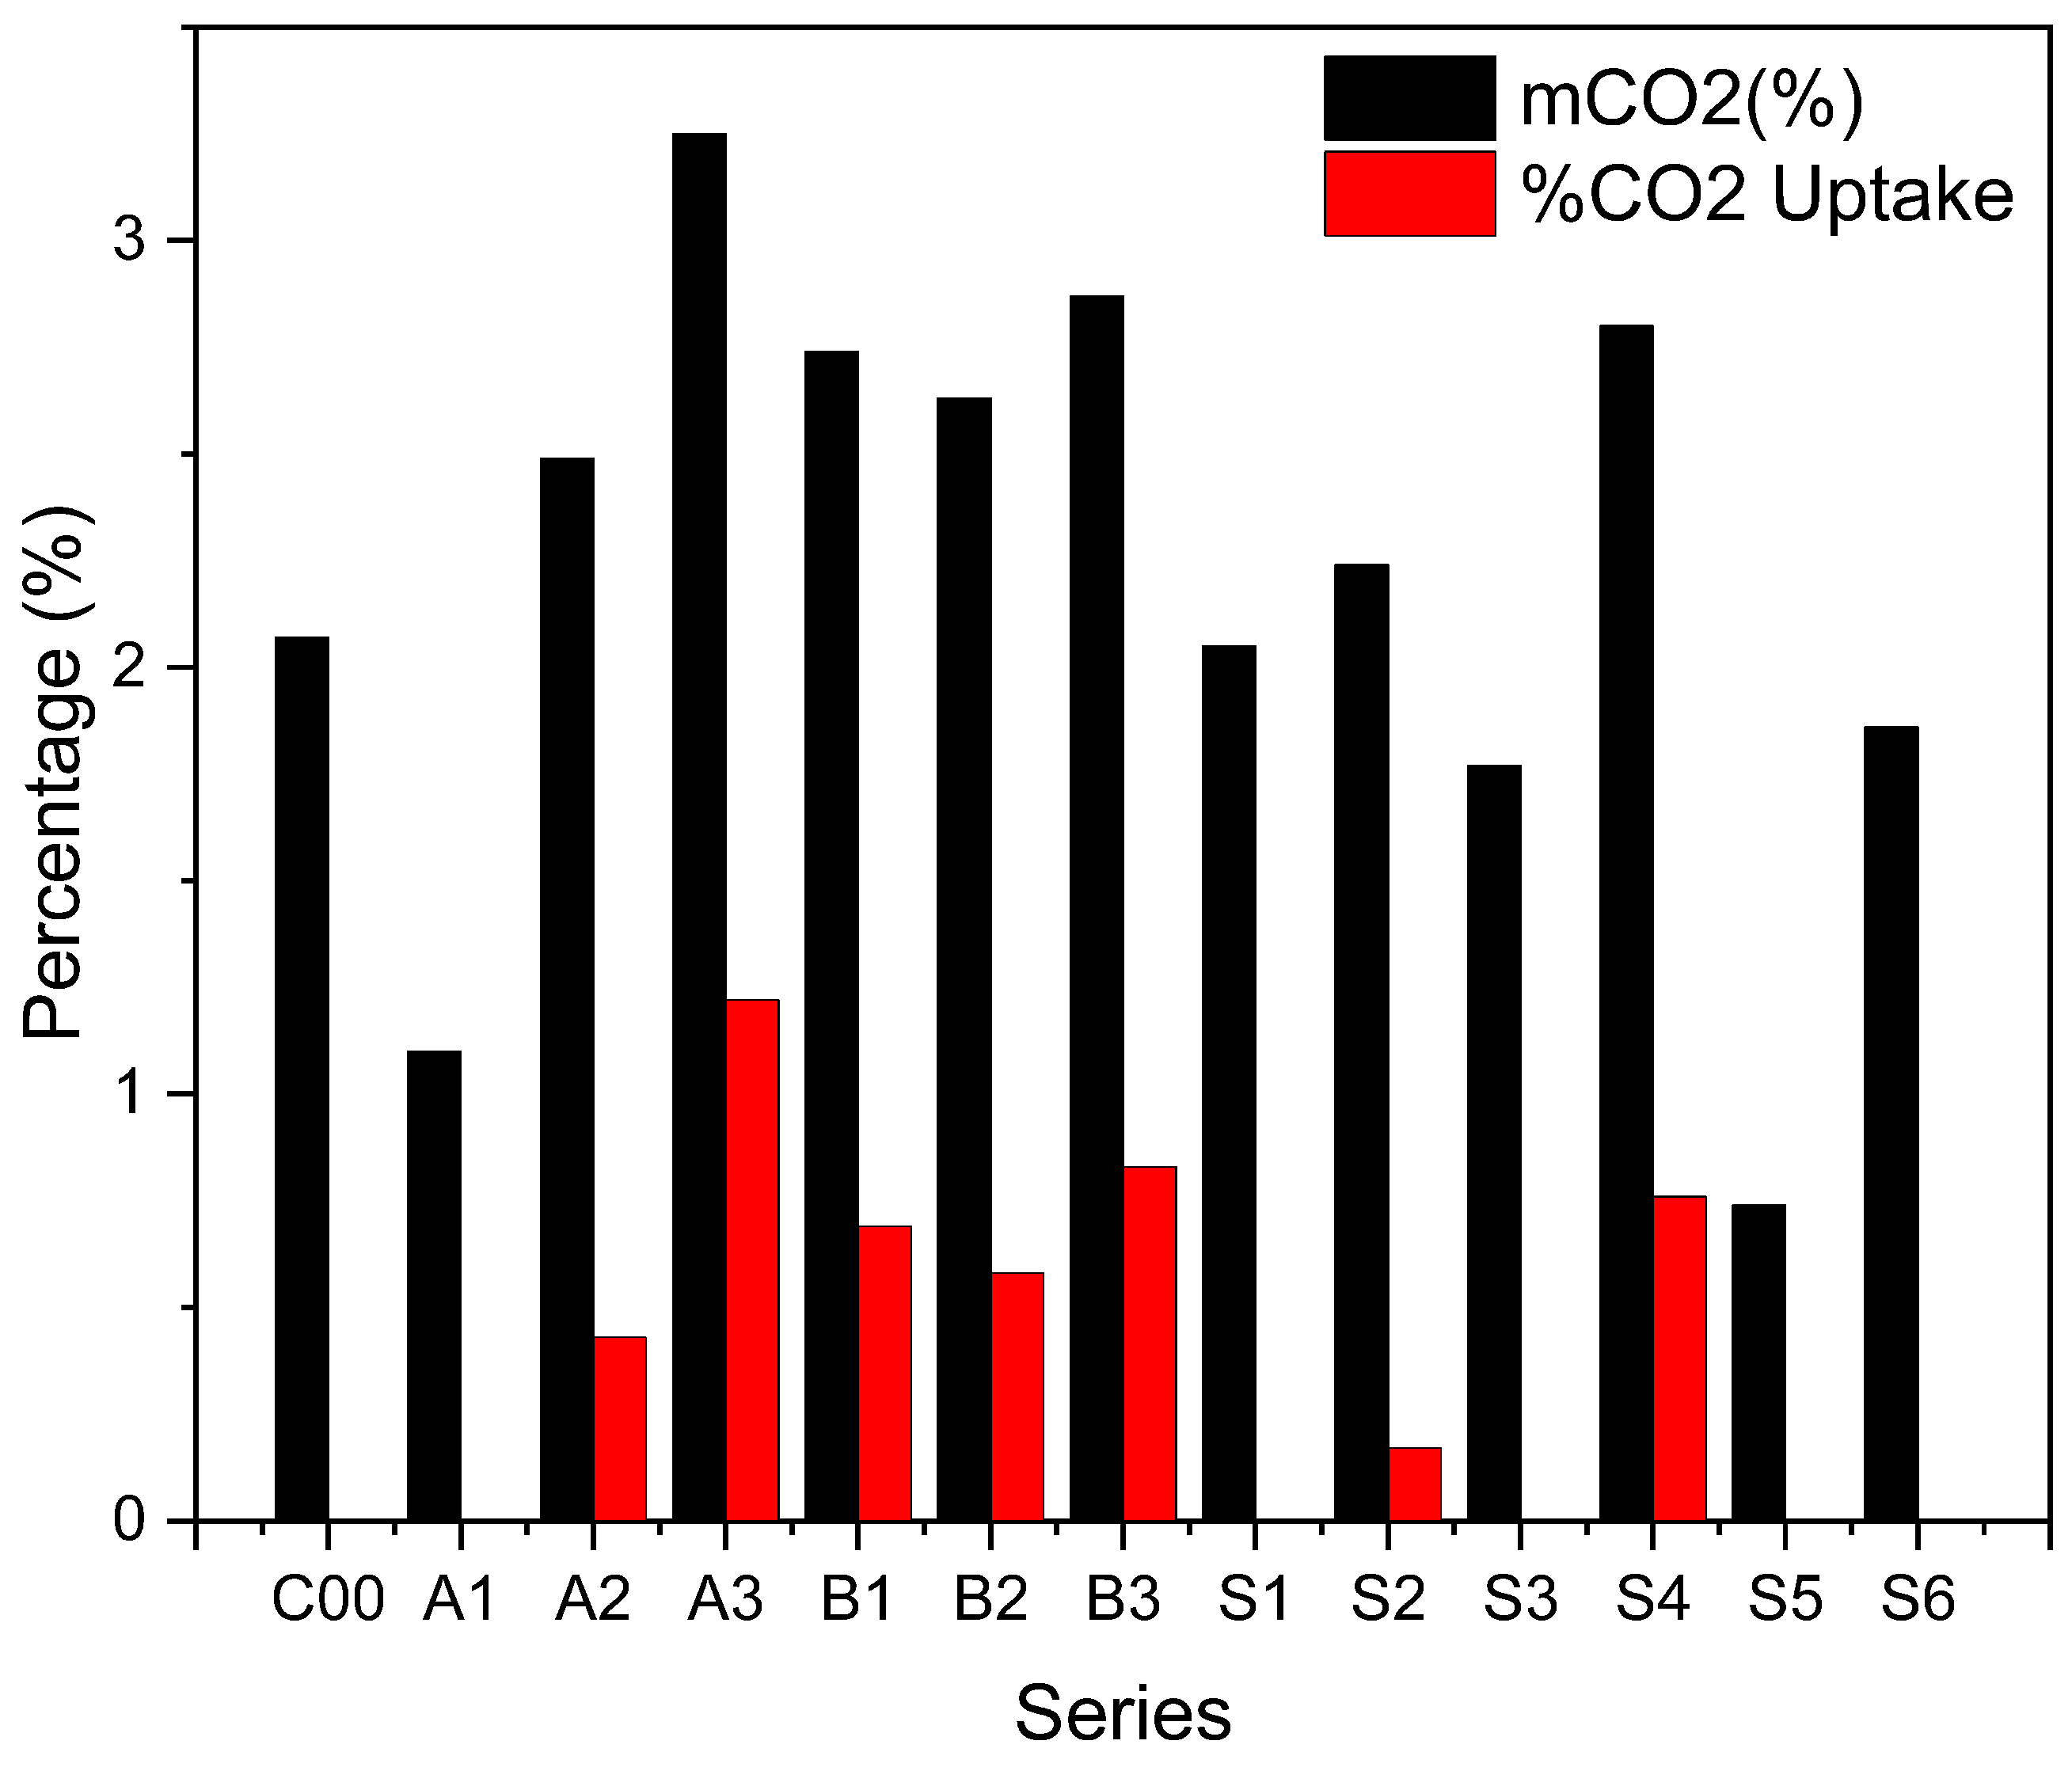
TGA and Rietveld analyses indicate that the aqueous carbonation series achieved higher CO2 sequestration, with values up to 3.25% for series A3 and 2.87% for series B3. The semi-dry series showed lower performance, with only two series outperforming the control series: S2 (2.24%) and S4 (2.8%). In the Rietveld analysis results, the higher number of carbonates detected in the aqueous series reinforces the conclusion that this method has a higher potential for CO2 sequestration compared to the semi-dry method.
Although the sequestration capacity in some series was relatively low as shown in Figure 23, this behaviour does not imply an unfavourable result. Previous research has reported cases where carbonation efficiency varies as a function of material composition and process conditions. Bonfante et al. (2024) indicate that, in certain cementitious materials and slags, the partial conversion of CaO to carbonates is not only common but can also lead to improvements in other material properties, such as dimensional stability and mechanical strength [59]. In this study, the CO2 fixation values (3%) were significantly lower than the theoretical carbonation potential estimated for the material (26%). This discrepancy is consistent with other studies that employed moderate operating conditions (e.g., ambient pressure, limited temperature), which tend to yield lower conversion rates [16]. Furthermore, the ERHA® used presents lower contents of reactive phases (e.g., free lime) compared to other slags such as BOF, which are more frequently studied for high-efficiency carbonation. Reduced CO2 sequestration could also be associated with the formation of intermediate or amorphous phases that, although not detected as crystalline carbonates in the analyses performed, contribute to the hardening and densification process of the material [13,16].

4. Conclusions

Based on the evaluation of the methods of accelerated carbonation of electric arc furnace slag for processing, the following conclusions were drawn:
  • Aqueous and semi-dry carbonation achieved a reduction in material absorption. However, increasing the temperature in the aqueous carbonation process resulted in a decrease in bulk density. In the case of semi-dry carbonation, changes in the physical properties of ERHA® were achieved as soon as a spray was applied. Based on the physical properties measured, the carbonated slag meets the requirements established with NCh163 for its use as a fine aggregate. Although mechanical testing of the aggregate itself was not performed, this material is being considered for future incorporation in cementitious mixtures to further evaluate its structural performance.
  • In the aqueous carbonation series exposed for a longer period of time and at higher temperatures, a decrease in bulk density was observed. This is a very unusual effect, but after a particle size distribution was performed, it suggests an increase in microcracks in ERHA®. Notably, ERHA® already contained calcium carbonates present prior to the application of the processes.
  • Thermogravimetric and X-ray diffraction analyses indicated an increase in carbonates in the carbonate samples. Aragonite was even identified in the semi-dry S3 series. An increase in vaterite was observed in most of the aqueous and semi-dry series. Furthermore, a decrease in the expansive phases, such as C2S, MgO and CaO, was observed in the samples.
  • The use of sodium carbonate in aqueous carbonation implied an increase in the process time. Meanwhile, in semi-dry carbonation, it increased the formation of carbonates.
  • According to the XRF, the maximum sequestration capacity of ERHA® is approximately 26%. This value is far from the carbon dioxide fixation value calculated on the basis of the thermogravimetric analysis for the series. As a result, not all series were able to exceed the value calculated for the control series.
  • Based on the comparative analysis of both carbonation processes, the semi-dry method appears more attractive for industrial scalability due to its lower operational complexity, reduced water use, and absence of thermal energy requirements. Future work will focus on scaling up this method and validating its performance in full-size mortar and concrete applications.
In conclusion, the study that was carried out highlights the importance of defining and controlling the parameters of accelerated carbonation. Notably, in some cases, there was a decrease in the bulk density of the samples associated with microcracks in the material. However, as carbonation processes are low-energy and easy to implement, dioxide fixation was also achieved in the samples. This, together with reductions in the absorption and expansive phases, could optimise their use in cementitious materials.

5. Limitations and Future Work

Following the execution of this study, several aspects and limitations were identified for future research. Notably, the scope did not include the mechanical testing of the aggregates, an expansion behaviour assessment, or a leachate analysis of process water to determine the presence of potentially hazardous elements. Additionally, the process parameters investigated here must be validated at an industrial scale. Nevertheless, the findings suggest that a reduction in free CaO content, along with improvements in physical properties, may contribute to lowering the risks of volumetric instability and environmental impact. A comparative economic assessment of the different processes was not conducted in this study. Such an analysis would require pilot-scale implementation and detailed data regarding environmental and energy performance. This constitutes a critical step for the potential transfer of the proposed method to industrial applications. Lastly, given the potential for large-scale deployment, there is a need for rapid and practical analytical techniques to monitor key physical parameters. The current reliance on laboratory-based oxide quantification and water analysis represents a constraint to process scalability. Future efforts should focus on simplifying and adapting these assessments for real-time operational use.

Author Contributions

Conceptualization, V.L. and M.B.; methodology, V.L. and M.B.; software, M.B.; validation, M.B. and R.H.; formal analysis, M.B. and R.H.; investigation, R.H. and M.B.; resources, V.L. and M.B.; data curation, M.B. and R.H.; writing—original draft preparation, M.B. and R.H.; writing—review and editing, V.L. and P.M.; visualization, P.M.; supervision, V.L. and P.M.; project administration, V.L. and M.B.; funding acquisition, M.B. All authors have read and agreed to the published version of the manuscript.

Funding

This research was funded by Agencia Nacional de Investigación (ANID) grant number Beca 21231311 and the APC was funded by Universidad de La Frontera.

Institutional Review Board Statement

Not applicable.

Informed Consent Statement

Not applicable.

Data Availability Statement

The data presented in this study are available on request from the corresponding author. The data are not publicly available due to company privacy.

Conflicts of Interest

The authors declare no conflicts of interest.

Abbreviations

The following abbreviations are used in this manuscript:
AOD    Argon oxygen decarburisation
ASTM    American Society for Testing and Materials
BET    Brunauer–Emmett–Teller (surface area method)
BOF    Basic oxygen furnace
COD    Crystallography Open Database
CO2    Carbon dioxide
EAFElectric arc furnace slag
EDSEnergy dispersive X-ray spectroscopy
ERHA®Commercial electric arc furnace slag product
JCPDSJoint Committee on Powder Diffraction Standards
NChNorma Chilena (Chilean Standard)
SEMScanning electron microscopy
SSDSaturated surface-dry
TGAThermogravimetric analysis
XRDX-ray diffraction
A1, A2, A3Samples treated via aqueous carbonation with different variables
S1, S2, S3Samples treated via semi-dry carbonation with different variables

References

  1. Baciocchi, R.; Costa, G.; Di Bartolomeo, E.; Polettini, A.; Pomi, R. Carbonation of Stainless Steel Slag as a Process for CO2 Storage and Slag Valorization. Waste Biomass Valor. 2010, 1, 467–477. [Google Scholar] [CrossRef]
  2. Green Steel Production: How G7 Countries Can Help Change the Global Landscape. Available online: https://www.industrytransition.org/insights/g7-green-steel-production/#:~:text=G7%20governments%20should%20accelerate%20the,funds%20dedicated%20to%20industrial%20decarbonization (accessed on 27 February 2025).
  3. Baena-Moreno, F.M.; Cid-Castillo, N.; Arellano-García, H.; Reina, T.R. Towards emission free steel manufacturing—Exploring the advantages of a CO2 methanation unit to minimize CO2 emissions. Sci. Total Environ. 2021, 781, 146776. [Google Scholar] [CrossRef]
  4. Benavides, K.; Gurgel, A.; Morris, J.; Mignone, B.; Chapman, B.; Kheshgi, H.; Herzog, H.; Paltsev, S. Mitigating emissions in the global steel industry: Representing CCS and hydrogen technologies in integrated assessment modeling. Int. J. Greenh. Gas Control 2024, 131, 103963. [Google Scholar] [CrossRef]
  5. European Commission. EU Climate Targets: How to Decarbonise the Steel Industry. Available online: https://joint-research-centre.ec.europa.eu/jrc-news-and-updates/eu-climate-targets-how-decarbonise-steel-industry-2022-06-15_en (accessed on 27 February 2025).
  6. Rashid, M.I.; Yaqoob, Z.; Mujtaba, M.A.; Fayaz, H.; Saleel, C.A. Developments in mineral carbonation for Carbon sequestration. Heliyon 2023, 9, e21796. [Google Scholar] [CrossRef]
  7. Gunka, V.; Hidei, V.; Sidun, I.; Demchuk, Y.; Stadnik, V.; Shapoval, P.; Sobol, K.; Vytrykush, N.; Bratychak, M. Wastepaper Sludge Ash and Acid Tar as Activated Filler Aggregates for Stone Mastic Asphalt. Coatings 2023, 13, 1183. [Google Scholar] [CrossRef]
  8. Ma, J.; Li, L.; Wang, H.; Du, Y.; Ma, J.; Zhang, X.; Wang, Z. Carbon Capture and Storage: History and the Road Ahead. Engineering 2022, 14, 33–43. [Google Scholar] [CrossRef]
  9. Zhang, N.; Chai, Y.E.; Santos, R.M.; Šiller, L. Advances in process development of aqueous CO2 mineralisation towards scalability. J. Environ. Chem. Eng. 2020, 8, 104453. [Google Scholar] [CrossRef]
  10. Song, X.; Chen, X.; Lin, Q.; Liu, Y. A Review of Mineral Carbonation from Industrial Waste. IOP Conf. Ser. Earth Environ. Sci. 2019, 401, 012008. [Google Scholar] [CrossRef]
  11. van Zomeren, A.; van der Laan, S.R.; Kobesen, H.B.A.; Huijgen, W.J.J.; Comans, R.N.J. Changes in mineralogical and leaching properties of converter steel slag resulting from accelerated carbonation at low CO2 pressure. Waste Manag. 2011, 31, 2236–2244. [Google Scholar] [CrossRef]
  12. Neeraj; Yadav, S. Carbon storage by mineral carbonation and industrial applications of CO2. Mater. Sci. Energy Technol. 2020, 3, 494–500. [Google Scholar] [CrossRef]
  13. Sanna, A.; Uibu, M.; Caramanna, G.; Kuusik, R.; Maroto-Valer, M.M. A review of mineral carbonation technologies to sequester CO2. Chem. Soc. Rev. 2014, 43, 8049–8080. [Google Scholar] [CrossRef]
  14. Spanka, M.; Mansfeldt, T.; Bialucha, R. Influence of Natural and Accelerated Carbonation of Steel Slags on Their Leaching Behavior. Steel Res. Int. 2016, 87, 798–810. [Google Scholar] [CrossRef]
  15. Baciocchi, R.; Costa, G.; Di Gianfilippo, M.; Polettini, A.; Pomi, R.; Stramazzo, A. Thin-film versus slurry-phase carbonation of steel slag: CO2 uptake and effects on mineralogy. J. Hazard. Mater. 2015, 283, 302–313. [Google Scholar] [CrossRef]
  16. Lin, X.; Zhang, Y.; Liu, H.; Boczkaj, G.; Cao, Y.; Wang, C. Carbon dioxide sequestration by industrial wastes through mineral carbonation: Current status and perspectives. J. Clean. Prod. 2024, 434, 140258. [Google Scholar] [CrossRef]
  17. Zhang, X.; Zhao, J.; Liu, Y.; Li, J. Use of steel slag as carbonation material: A review of carbonation methods and evaluation, environmental factors and carbon conversion process. J. CO2 Util. 2024, 88, 102947. [Google Scholar] [CrossRef]
  18. Gunning, P.J.; Hills, C.D.; Carey, P.J. Accelerated carbonation treatment of industrial wastes. Waste Manag. 2010, 30, 1081–1090. [Google Scholar] [CrossRef]
  19. Zajac, M.; Song, J.; Skocek, J.; Ben Haha, M.; Skibsted, J. Composite cements with aqueous and semi-dry carbonated recycled concrete pastes. Constr. Build. Mater. 2023, 407, 133362. [Google Scholar] [CrossRef]
  20. Chang, E.E.; Pan, S.Y.; Chen, Y.H.; Chu, H.W.; Wang, C.F.; Chiang, P.C. CO2 sequestration by carbonation of steelmaking slags in an autoclave reactor. J. Hazard. Mater. 2011, 195, 107–114. [Google Scholar] [CrossRef]
  21. Huijgen, W.J.J.; Witkamp, G.J.; Comans, R.N.J. Mineral CO2 Sequestration by Steel Slag Carbonation. Environ. Sci. Technol. 2005, 39, 9676–9682. [Google Scholar] [CrossRef]
  22. Chang, E.E.; Chen, C.H.; Chen, Y.H.; Pan, S.Y.; Chiang, P.C. Performance evaluation for carbonation of steel-making slags in a slurry reactor. J. Hazard. Mater. 2011, 186, 558–564. [Google Scholar] [CrossRef]
  23. Polettini, A.; Pomi, R.; Stramazzo, A. CO2 sequestration through aqueous accelerated carbonation of BOF slag: A factorial study of parameters effects. J. Environ. Manag. 2016, 167, 185–195. [Google Scholar] [CrossRef]
  24. Zhu, F.; Cui, L.; Liu, Y.; Zou, L.; Hou, J.; Li, C.; Wu, G.; Xu, R.; Jiang, B.; Wang, Z. Experimental Investigation and Mechanism Analysis of Direct Aqueous Mineral Carbonation Using Steel Slag. Sustainability 2024, 16, 81. [Google Scholar] [CrossRef]
  25. Luo, Z.; Wang, Y.; Yang, G.; Ye, J.; Zhang, W.; Liu, Z.; Mu, Y. Effect of curing temperature on carbonation behavior of steel slag compacts. Constr. Build. Mater. 2021, 291, 123369. [Google Scholar] [CrossRef]
  26. Mohamed, A.M.O.; El Gamal, M.; Hameedi, S.M.; Paleologos, E.K. Chapter 9—Carbonation of steel slag. In Sustainable Utilization of Carbon Dioxide in Waste Management; Mohamed, A.M.O., El Gamal, M., Hameedi, S.M., Paleologos, E.K., Eds.; Elsevier: Amsterdam, The Netherlands, 2023; pp. 327–372. [Google Scholar] [CrossRef]
  27. Cai, T.; Chen, X.; Johnson, J.K.; Wu, Y.; Ma, J.; Liu, D.; Liang, C. Understanding and Improving the Kinetics of Bulk Carbonation on Sodium Carbonate. J. Phys. Chem. C 2020, 124, 23106–23115. [Google Scholar] [CrossRef]
  28. Nielsen, P.; Boone, M.A.; Horckmans, L.; Snellings, R.; Quaghebeur, M. Accelerated carbonation of steel slag monoliths at low CO2 pressure—Microstructure and strength development. J. CO2 Util. 2020, 36, 124–134. [Google Scholar] [CrossRef]
  29. NCh1239:2009; Aridos para Morteros y Hormigones—Determinación de las Densidades Real y Neta y de la Absorción de Agua de las Arenas. Instituto Nacional de Normalización: Santiago, Chile, 2009.
  30. ASTM C128-22; Standard Test Method for Relative Density (Specific Gravity) and Absorption of Fine Aggregate. American Society for Testing and Materials: West Conshohocken, PA, USA, 2023.
  31. Steinour, H.H. Some Effects of Carbon Dioxide on Mortars and Concrete-Discussion. J. Am. Concr. Inst. 1959, 30, 905–907. [Google Scholar]
  32. Mo, L.; Zhang, F.; Deng, M. Mechanical performance and microstructure of the calcium carbonate binders produced by carbonating steel slag paste under CO2 curing. Cem. Concr. Res. 2016, 88, 217–226. [Google Scholar] [CrossRef]
  33. Moon, E.J.; Choi, Y.C. Development of carbon-capture binder using stainless steel argon oxygen decarburization slag activated by carbonation. J. Clean. Prod. 2018, 180, 642–654. [Google Scholar] [CrossRef]
  34. Huntzinger, D.N.; Gierke, J.S.; Kawatra, S.K.; Eisele, T.C.; Sutter, L.L. Carbon Dioxide Sequestration in Cement Kiln Dust through Mineral Carbonation. Environ. Sci. Technol. 2009, 43, 1986–1992. [Google Scholar] [CrossRef]
  35. Huntzinger, D.N.; Gierke, J.S.; Sutter, L.L.; Kawatra, S.K.; Eisele, T.C. Mineral carbonation for carbon sequestration in cement kiln dust from waste piles. J. Hazard. Mater. 2009, 168, 31–37. [Google Scholar] [CrossRef]
  36. Yang, K.H.; Chung, H.S.; Ashour, A.F. Influence of Type and Replacement Level of Recycled Aggregates on Concrete Properties. ACI Mater. J. 2008, 105, 289–296. [Google Scholar]
  37. NCh163:2024; Áridos para Hormigones y Morteros—Requisitos. Instituto Nacional de Normalización: Santiago, Chile, 2024.
  38. Chen, Z.; Cang, Z.; Yang, F.; Zhang, J.; Zhang, L. Carbonation of steelmaking slag presents an opportunity for carbon neutral: A review. J. CO2 Util. 2021, 54, 101738. [Google Scholar] [CrossRef]
  39. Zhang, Z.; Cao, P.; Wang, Y.; Zhao, X.; Liu, J. Effect of Fe and Mn on the hydration activity of f-CaO in steel slag. Constr. Build. Mater. 2024, 421, 135719. [Google Scholar] [CrossRef]
  40. Chukwuma, J.S.; Pullin, H.; Renforth, P. Assessing the carbon capture capacity of South Wales’ legacy iron and steel slag. Miner. Eng. 2021, 173, 107232. [Google Scholar] [CrossRef]
  41. Yildirim, I.Z.; Prezzi, M. Chemical, Mineralogical, and Morphological Properties of Steel Slag. Adv. Civ. Eng. 2011, 2011, 463638. [Google Scholar] [CrossRef]
  42. Wang, Y.; He, F.; Wang, J.; Hu, Q. Comparison of Effects of Sodium Bicarbonate and Sodium Carbonate on the Hydration and Properties of Portland Cement Paste. Materials 2019, 12, 1033. [Google Scholar] [CrossRef]
  43. Coppola, L.; Coffetti, D.; Crotti, E.; Dell’Aversano, R.; Gazzaniga, G.; Pastore, T. Influence of Lithium Carbonate and Sodium Carbonate on Physical and Elastic Properties and on Carbonation Resistance of Calcium Sulphoaluminate-Based Mortars. Appl. Sci. 2020, 10, 176. [Google Scholar] [CrossRef]
  44. Ye, J.; Liu, S.; Fang, J.; Zhang, H.; Zhu, J.; Guan, X. Effect of temperature on wet carbonation products of magnesium slag. Constr. Build. Mater. 2024, 425, 135949. [Google Scholar] [CrossRef]
  45. Han, J.; Sun, W.; Pan, G.; Wang, C.; Rong, H. Application of X-ray computed tomography in characterization microstructure changes of cement pastes in carbonation process. J. Wuhan Univ. Technol.-Mater. Sci. Ed. 2012, 27, 358–363. [Google Scholar] [CrossRef]
  46. Zhu, W.; Fusseis, F.; Lisabeth, H.; Xing, T.; Xiao, X.; De Andrade, V.; Karato, S.i. Experimental evidence of reaction-induced fracturing during olivine carbonation. Geophys. Res. Lett. 2016, 43, 9535–9543. [Google Scholar] [CrossRef]
  47. Ho, H.J.; Iizuka, A. Mineral carbonation using seawater for CO2 sequestration and utilization: A review. Sep. Purif. Technol. 2023, 307, 122855. [Google Scholar] [CrossRef]
  48. Li, Y.; Liao, H.; Guo, Y. Aqueous carbonation of steel slag and preparation of calcium carbon: A new strategy for the utilization of steel slag. J. Environ. Chem. Eng. 2025, 13, 115951. [Google Scholar] [CrossRef]
  49. Lin, J.Y.; Garcia, E.A.; Ballesteros, F.C.; Garcia-Segura, S.; Lu, M.C. A review on chemical precipitation in carbon capture, utilization and storage. Sustain. Environ. Res. 2022, 32, 45. [Google Scholar] [CrossRef]
  50. Vollprecht, D.; Wohlmuth, D. Mineral Carbonation of Basic Oxygen Furnace Slags. Recycling 2022, 7, 84. [Google Scholar] [CrossRef]
  51. Jiang, Y.; Ma, Z.; Gao, Y.; Shen, P.; Poon, C.S. A review on the impact of water in accelerated carbonation: Implications for producing sustainable construction materials. Cem. Concr. Compos. 2025, 157, 105902. [Google Scholar] [CrossRef]
  52. Ding, X.; Li, W.; Chang, J. Preparation of aragonite from calcium carbonate via wet carbonation to improve properties of steel slag building materials. Constr. Build. Mater. 2024, 451, 138763. [Google Scholar] [CrossRef]
  53. Zhao, D.; Williams, J.M.; Li, Z.; Park, A.H.A.; Radlińska, A.; Hou, P.; Kawashima, S. Hydration of cement pastes with calcium carbonate polymorphs. Cem. Concr. Res. 2023, 173, 107270. [Google Scholar] [CrossRef]
  54. Fang, Y.; Su, W.; Zhang, Y.; Zhang, M.; Ding, X.; Wang, Q. Effect of accelerated precarbonation on hydration activity and volume stability of steel slag as a supplementary cementitious material. J. Therm. Anal. Calorim. 2022, 147, 6181–6191. [Google Scholar] [CrossRef]
  55. Bulatbekova, D.; Vashistha, P.; Kim, H.K.; Pyo, S. Effects of basic-oxygen furnace, electric-arc furnace, and ladle furnace slags on the hydration and durability properties of construction materials: A review. J. Build. Eng. 2024, 92, 109670. [Google Scholar] [CrossRef]
  56. Rodriguez-Blanco, J.D.; Shaw, S.; Bots, P.; Roncal-Herrero, T.; Benning, L.G. The role of Mg in the crystallization of monohydrocalcite. Geochim. Et Cosmochim. Acta 2014, 127, 204–220. [Google Scholar] [CrossRef]
  57. Gao, J.; Huang, Y.; Wang, S.; Zhu, Z.; Song, H.; Zhang, Y.; Liu, J.; Qi, S.; Zhao, J. Mineral transformation and solidification of heavy metals during co-melting of MSWI fly ash with coal fly ash. Environ. Sci. Pollut. Res. Int. 2024, 31, 45793–45807. [Google Scholar] [CrossRef] [PubMed]
  58. Baena-Moreno, F.M.; Rodríguez-Galán, M.; Reina, T.R.; Zhang, Z.; Vilches, L.F.; Navarrete, B. Understanding the effect of Ca and Mg ions from wastes in the solvent regeneration stage of a biogas upgrading unit. Sci. Total Environ. 2019, 691, 93–100. [Google Scholar] [CrossRef] [PubMed]
  59. Bonfante, F.; Ferrara, G.; Humbert, P.; Garufi, D.; Tulliani, J.M.C.; Palmero, P. CO2 Sequestration Through Aqueous Carbonation of Electric Arc Furnace Slag. J. Adv. Concr. Technol. 2024, 22, 207–218. [Google Scholar] [CrossRef]
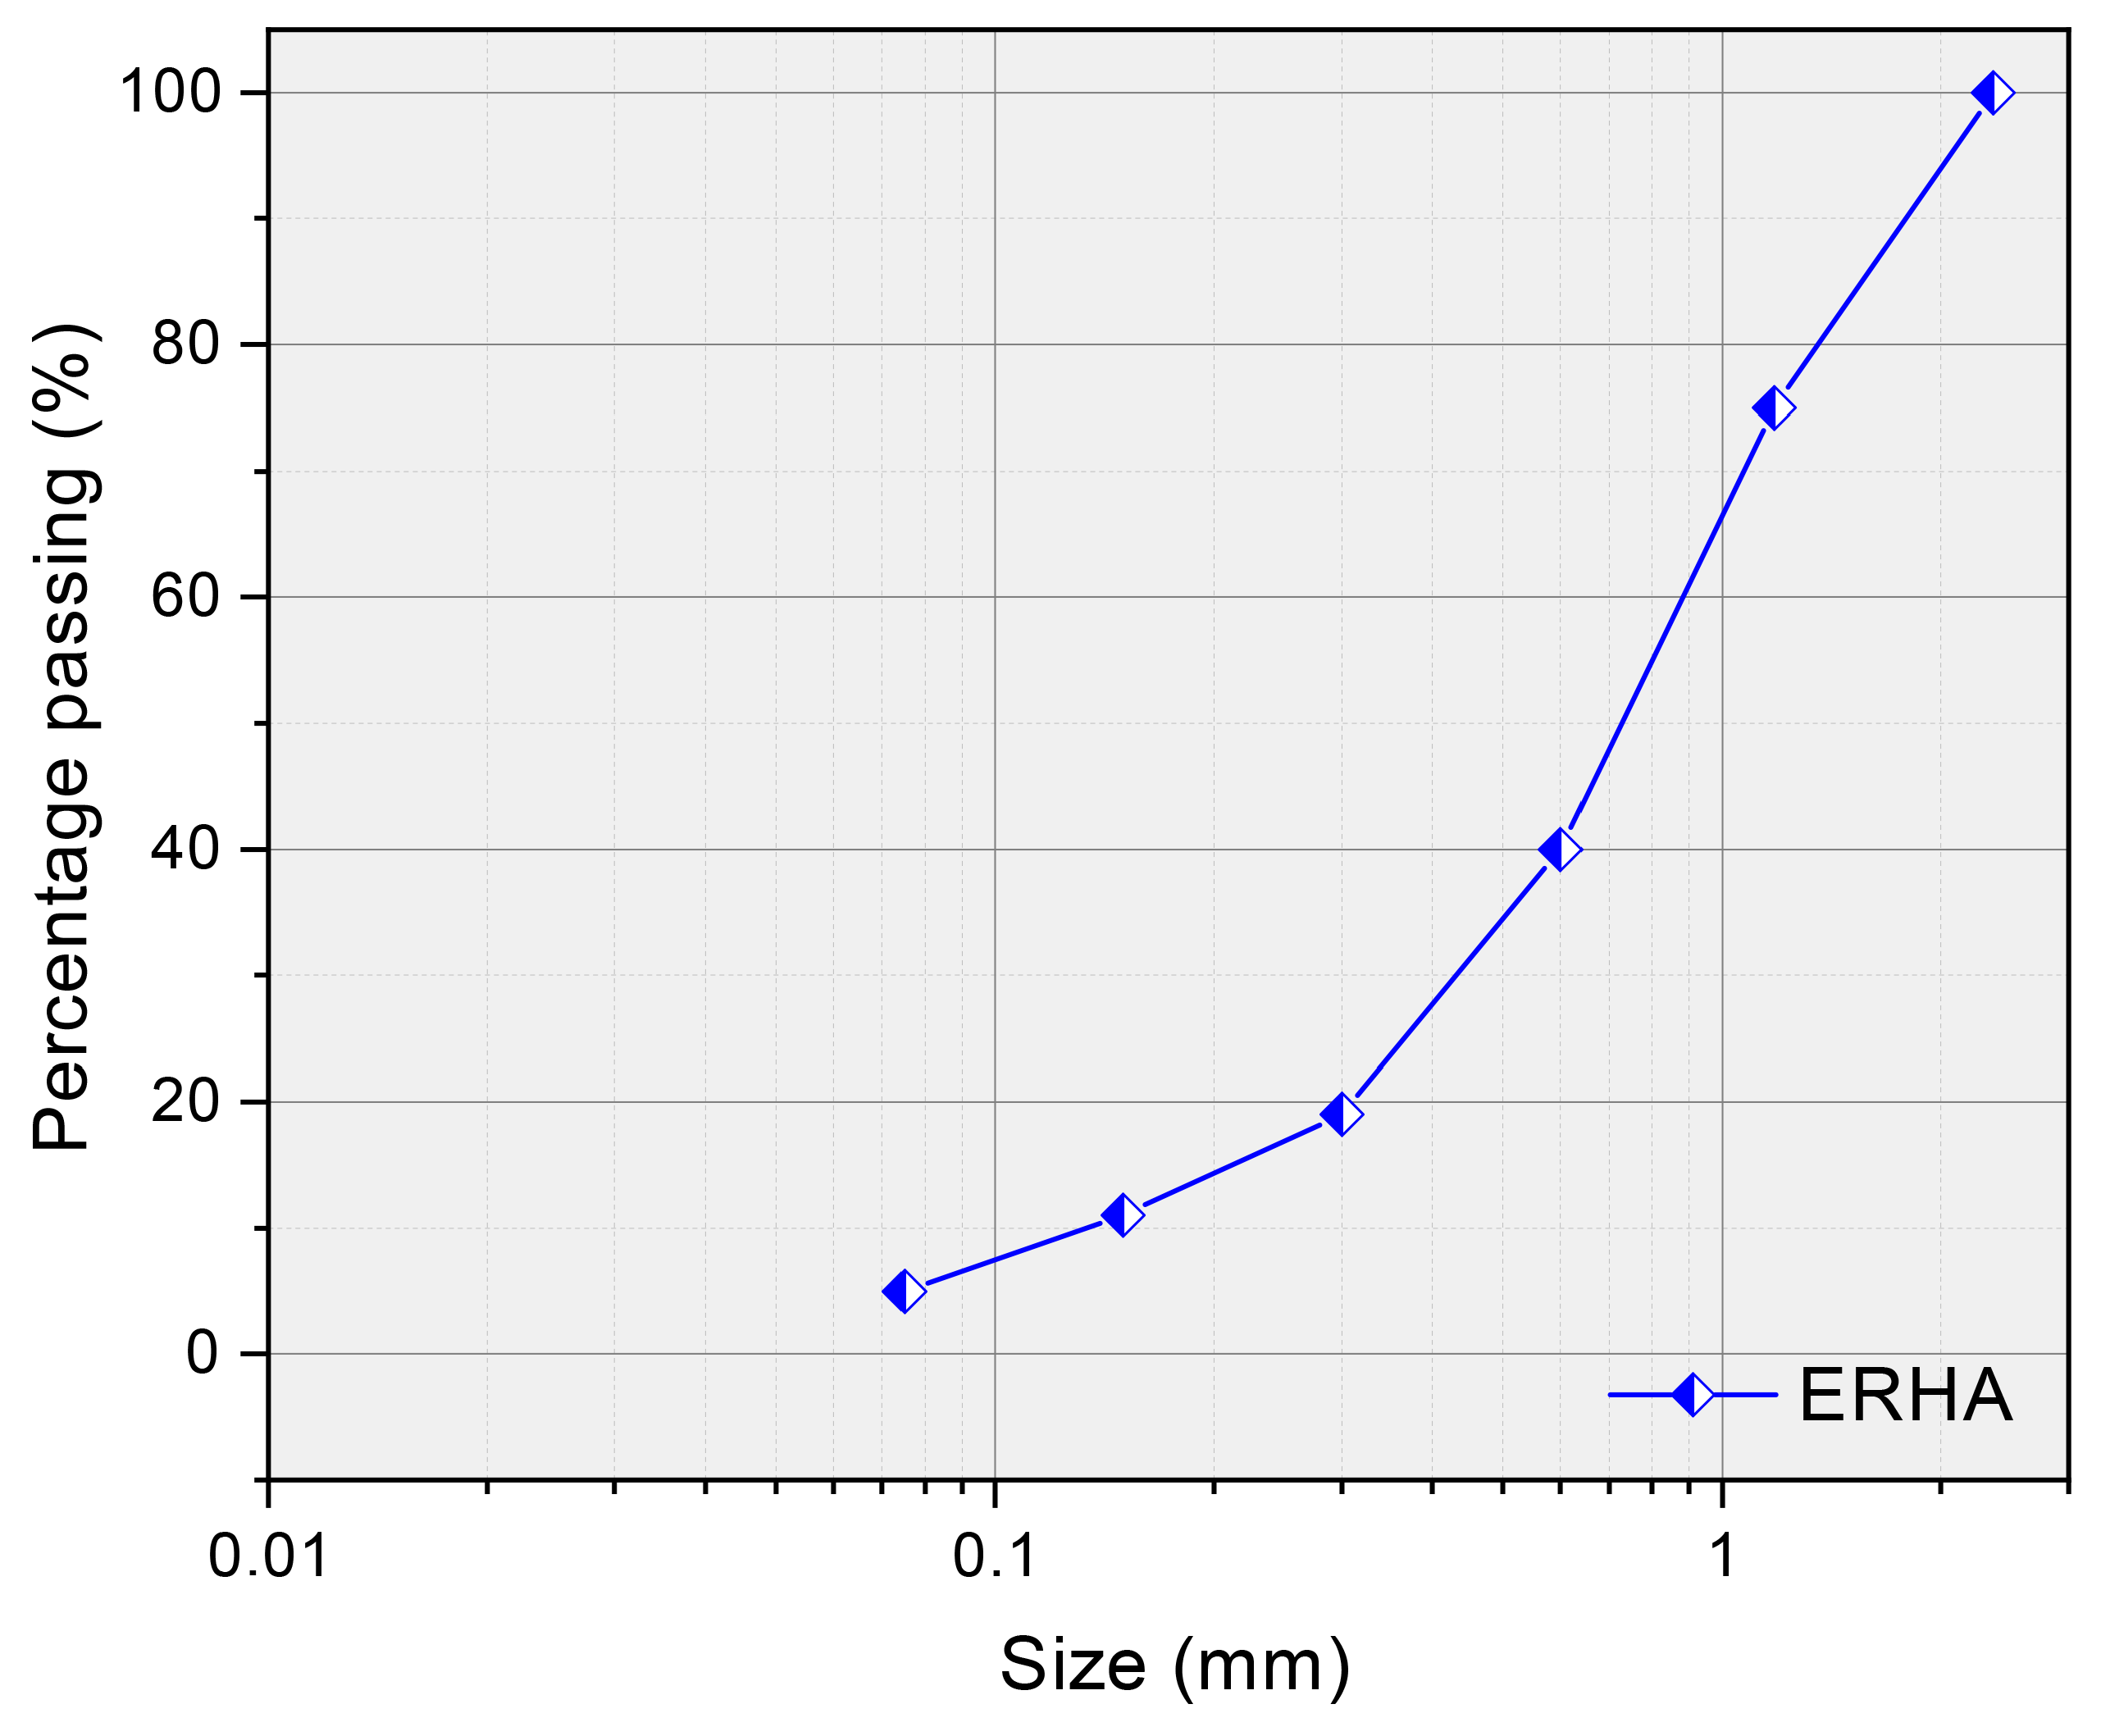
Figure 1. Granulometric distribution.
Applsci 15 09360 g001
Figure 2. Diagram of the aqueous process.
Applsci 15 09360 g002
Figure 3. Diagram of the semi-dry carbonation process.
Applsci 15 09360 g003
Figure 4. ERHA®.
Figure 4. ERHA®.
Applsci 15 09360 g004
Figure 5. SEM images of the ERHA®.
Applsci 15 09360 g005
Figure 6. Result of the BET for ERHA®.
Applsci 15 09360 g006
Figure 7. EDS of the ERHA® samples.
Applsci 15 09360 g007
Figure 8. X-ray diffraction pattern of the untreated ERHA®. Crystalline phases identified: calcite (104)—COD 9000009, C2S (112)—COD 9008664, gehlenite (211)—COD 9008803, akermanite (220)—COD 9008699, merwinite (112)—COD 9011582, wustite (111)—COD 9000049, magnesium oxide (200)—COD 9000735, ferrite (220)—COD 9007589, quartz (101)—COD 9000015, and chromite (311)—COD 9007858. Miller indices (hkl) correspond to the most intense peaks for each phase, based on matches with the Crystallography Open Database (COD).
Applsci 15 09360 g008
Figure 9. Results of the specific gravity in a series of aqueous carbonation.
Applsci 15 09360 g009
Figure 10. Results of the bulk density in a series of aqueous carbonation.
Applsci 15 09360 g010
Figure 11. Absorption capacity in a series of aqueous carbonation.
Applsci 15 09360 g011
Figure 12. Diagram of crack formation in ERHA®.
Applsci 15 09360 g012
Figure 13. Granulometric distribution of ERHA® after aqueous carbonation. Sample A: initial mass on 0.3 mm sieve. Sample B: initial mass on sieve 2.36 mm.
Applsci 15 09360 g013
Figure 14. SEM image of an ERHA® subjected to aqueous carbonation. Surface microcracks are visible, likely associated with internal expansion or incomplete carbonation reactions.
Applsci 15 09360 g014
Figure 15. Results of the bulk density in a series of semi-dry carbonation.
Applsci 15 09360 g015
Figure 16. Results of the specific gravity in a series of semi-dry carbonation.
Applsci 15 09360 g016
Figure 17. Absorption capacity in a series of semi-dry carbonation.
Applsci 15 09360 g017
Figure 18. Termogravimetric results of the aqueous carbonation series.
Applsci 15 09360 g018
Figure 19. Termogravimetric results of the semi dry carbonation series.
Applsci 15 09360 g019
Figure 20. X-ray diffraction patterns of aqueous carbonated samples. The main crystalline phases identified in the samples include the following: akermanite (220)—COD 9008699, gehlenite (211)—COD 9008803, calcite (104)—COD 9000009, C 2 S (112)—COD 9008664, merwinite (112)—COD 9011582, quartz (101)—COD 9000015, portlandite (011)—COD 9009785, wüstite (111)—COD 9000049, MgO (200)—COD 9000735, and ferrite (220)—COD 9007589. Miller indices (hkl) correspond to the most intense reflections for each phase, based on matches with the Crystallography Open Database (COD). Variations in intensity and the presence of specific peaks across samples reflect differences in the extent of carbonation and mineralogical transformation.
Applsci 15 09360 g020
Figure 21. X-ray diffraction patterns of semi-dry carbonated samples. The main crystalline phases identified in the samples include akermanite (220)—COD 9008699, gehlenite (211)—COD 9008803, calcite (104)—COD 9000009, C 2 S (112)—COD 9008664, merwinite (112)—COD 9011582, quartz (101)—COD 9000015, portlandite (011)—COD 9009785, wüstite (111)—COD 9000049, MgO (200)—COD 9000735, and ferrite (220)—COD 9007589. Miller indices (hkl) correspond to the most intense reflections for each phase, based on matches with the Crystallography Open Database (COD). Variations in intensity and the presence of specific peaks across samples reflect differences in the extent of carbonation and mineralogical transformation.
Applsci 15 09360 g021
Figure 22. X-ray diffraction results of Rietveld analysis.
Applsci 15 09360 g022
Figure 23. CO2 uptake rates in each of the series.
Applsci 15 09360 g023
Table 1. Aqueous carbonation series.
SerieTemperature (°C)Time (min)Na2CO3
C00220Without
A12260With
A25560With
A38060With
B1225Without
B2555Without
B3805Without
Table 2. Semi-dry carbonation series.
SeriesSpray (Times)TimeNa2CO3
C000-Without
S11-Without
S21 every 4 h8 hWithout
S31 every 6 h12 hWithout
S41-With
S51 per day2 daysWithout
S61 per day3 daysWithout
Table 3. Physical characteristics of ERHA®.
PropertiesResult
Specific gravity3.45
Bulk density (g/cm3)3.71
Absorption (%)2.90
Table 4. Result of XRF for ERHA®. “*” indicates values below the detection limit of the instrument.
ComponentERHA® [%]
Fe2O330.99
CaO23.84
SiO214.56
Al2O313.42
MgO6.73
MnO5.14
Cr2O32.43
TiO20.75
Na2O0.45
P2O50.31
ZnO0.29
SO30.27
BaO0.27
Cl0.14
V2O50.12
K2O0.05
NiO*
CuO0.04
Ga2O3*
SrO0.07
ZrO20.02
Nb2O50.03
WO30.05
PbO*
Disclaimer/Publisher’s Note: The statements, opinions and data contained in all publications are solely those of the individual author(s) and contributor(s) and not of MDPI and/or the editor(s). MDPI and/or the editor(s) disclaim responsibility for any injury to people or property resulting from any ideas, methods, instructions or products referred to in the content.