Article

Properties of Stress and Deformation of Internal Geomembrane–Clay Seepage Control System for Rockfill Dam on Deep Overburden

1
China Power Construction Municipal Construction Group Co., Ltd., Tianjin 300392, China
2
College of Water Conservancy and Hydropower Engineering, Hohai University, Nanjing 210098, China
*
Author to whom correspondence should be addressed.
Appl. Sci. 2025, 15(17), 9324; https://doi.org/10.3390/app15179324
Submission received: 28 June 2025 / Revised: 20 August 2025 / Accepted: 21 August 2025 / Published: 25 August 2025

Abstract

An internal geomembrane (GMB)–clay seepage control system is an important form of seepage control structure for rockfill dams. In order to investigate the stress and deformation characteristics of GMB in GMB–clay core-wall rockfill dams (GMCWRD) under different construction and operation conditions, the stress and deformation fields of GMCWRDs were calculated by numerical simulation under a variety of working conditions. The stress and deformation characteristics of the dam and GMB during the impoundment period were investigated, and the influences of the spreading thickness of the clay core-wall and the location of the GMB defects and hydraulic head on the stress and deformation of the GMB were analyzed. The results show that the maximum tensile strain of the GMB upstream of the clay core-wall during the impoundment period occurs at the anchorage of the GMB and the concrete cut-off, with a maximum tensile strain of 2.70%. With the increase in the spreading thickness of the clay core-wall, the maximum tensile stress and strain of the GMB fluctuated. Under the dam construction and foundation conditions in this paper, when the spreading thickness of the clay core-wall was 2 m, the tensile stress and strain of GMB were at the lowest level. As the defect location of the GMB decreases, the phreatic line of the dam gradually increases, and the seepage discharge of the dam and the tensile strain of the GMB gradually increase, with the maximum tensile strain of 3.98%. The maximum deformation of the GMB in each case is much smaller than the maximum elastic deformation range of the selected PVC GMB, and the conclusion of the study provides a certain scientific basis for the design and construction of the seepage control of the core rockfill dam.

1. Introduction

The geomembrane–clay core-wall rockfill dam (GMCWRD) is an innovative dam structure designed to mitigate seepage and stress-induced deformation in conventional rockfill dams. It features a central impervious core constructed with high-performance geomembranes, complemented by flanking rockfill shells composed of graded rock and gravel materials [1]. GMCWRDs offer notable advantages, including enhanced foundation deformation compatibility, streamlined construction processes, and cost-effectiveness compared to traditional clay core alternatives. For high-head clay core-wall rockfill dams, using only clay core-walls or GMB lining measures for waterproofing results in suboptimal waterproofing performance. However, combining waterproofing clay core-walls with GMBs to form a composite waterproofing system can effectively mitigate the risk of reduced waterproofing efficiency or localized failure of the dam [2,3,4]. Compared to concrete-faced rockfill dams, where faced joints are prone to misalignment and leakage when settlement exceeds design values, GMCWRDs are widely favored due to the GMB’s excellent elongation properties and low risk of cracking [5]. While GMB applications as seepage control barriers have gained widespread adoption in low-height embankments, recent advancements demonstrate a growing trend toward implementing composite GMBs in higher dams [6,7,8]. Beyond enhancing the seepage control efficiency of rockfill dams, GMBs effectively reduce the phreatic line elevation and improve dam stability.
Stress–deformation analysis of GMB–clay core-wall seepage control systems provides a critical methodology for evaluating the operational characterization of GMCWRDs under diverse loading scenarios, offering scientific foundations for optimizing design and construction parameters [2,9]. Consequently, the deformation characteristics of GMCWRDs have garnered increasing attention in geotechnical engineering practice [10]. Earlier, GMBs failed to be applied in high rockfill dams due to doubts about the safety of GMCWRD operation. For the application of GMB in core-wall rockfill dams, Shu and Li et al. [3] analyzed the deformation mechanisms of the GMB within the GMCWRD. They concluded that the key factor controlling how large dam displacements are transferred to the GMB is the GMB’s deformation behavior, rather than its modulus or strength. Subsequently, Xing et al. [2] employed numerical modeling to demonstrate that hybrid GMB–clay core-wall systems significantly reduce the phreatic line elevation, mitigate arching effects, and eliminate scenarios where principal stresses in the core fall below hydrostatic pressures at equivalent elevations. The findings of these two studies have improved the understanding of design concepts for GMCWRDs. Since then, a large amount of research has emerged in the form of numerical simulation studies, focusing on the force and deformation of GMCWRDs. Ding and Ren et al. [9] utilized numerical simulation to map stress–strain distributions in GMCWRDs, while Jiang et al. [5] focused on rockfill shell behavior but overlooked GMB-specific deformations. Yao et al. [11] investigated the effect of composite GMB on the stress deformation of the dam under the effect of earthquake through numerical simulation. Their findings indicated that the composite GMB significantly mitigated the stress deformation of the dam. However, the deformation of the GMB itself was not a focal point of the study. Recent advances validate GMBs’ efficacy in GMCWRDs: Xu et al. [12] identified superior mechanical performance in S-shaped GMB layouts compared to linear configurations. In addition, the main function of GMB in GMCWRDs is seepage control, so the generation of GMB defects will seriously affect the seepage safety of GMCWRDs. Although GMBs are considered to be impermeable, defects will inevitably occur during the production, transportation, and laying construction of GMBs [13,14,15]. It has been reported that even well-laid GMB typically exhibit a range of 2 to 5 holes per hectare [16,17,18,19,20,21]. Based on this, Huang et al. [22] revealed through numerical simulation that defects alter seepage patterns, inducing leakage and impairing dam functionality. Weber emphasized in his research that leaks caused by geomembrane defects pose a serious threat to the structure of dams [23]. Furthermore, Yang et al. also found in their latest research that geomembrane defects can cause the seepage line of dams to rise, thereby inducing slope instability [24]. Despite the plethora of studies conducted on the impact of GMB on the stress deformation of core-wall rockfill dams, a comprehensive review of the extant literature reveals a paucity of research addressing the relationship between GMB type and dam stress deformation. However, there has been no research on the deformation state of the GMB itself, the thickness of the clay core-wall, and the effect of GMB defect location on the deformation of dams in GMCWRDs. These factors are of paramount importance to the safe operation of dams and must not be disregarded. Consequently, this paper conducts pertinent computational studies.
The objective of this study was to investigate the stress and deformation characteristics of the GMB in GMCWRDs under different construction and operation conditions. The aim was to optimize the design and construction parameters of the GMB in the dam. To this end, the stress and deformation fields of the GMCWRDs were calculated by numerical simulation. The stress field and deformation field were calculated by means of numerical simulation. An investigation was conducted into the stress and deformation characteristics of the dam and GMB of the GMCWRD during the impoundment period. The influence of the thickness of the clay core-wall and the location of the GMB defect on the force and deformation of the GMB was analyzed. Furthermore, the influence of the different hydraulic heads on the force and deformation of the GMB was investigated. The objective of this study was to provide a scientific basis for the design and construction of the GMB in GMCWRDs.

2. Numerical Simulation

2.1. Methods

To accurately simulate the mechanical response of GMBs and their interaction with the dam structure, the GMB was modeled using the M3D3 membrane element available in ABAQUS software [25], a methodology successfully validated in prior studies of GMB cofferdam behavior [12]. Membrane elements are defined as flexible tensile materials, the purpose of which is to sustain in-plane stresses. They are distinguished by their lack of bending stiffness, a quality that enables them to effectively capture the fundamental mechanical properties of GMBs. Contact interfaces between the GMB and the upstream/downstream rockfill materials were modeled to simulate interfacial interactions. Mechanical models of contact surfaces can be categorized into normal and tangential models, enabling a realistic representation of critical mechanisms such as tensile detachment and shear slippage at the GMB-dam interface.

2.2. Numerical Model and Material Parameters

The clay core-wall rockfill dam in question has a crest elevation of 1414.00 m, a maximum height of 59.00 m, a crest length of 363.00 m, and a crest wide of 8.00 m. The upstream slopes are graded at 1:2 and 1:2.25, while the downstream slopes are 1:1.8 and 1:2, respectively. The normal reservoir water level is maintained at 1410.00 m, and the downstream design flood level is 1361.54 m. The dam foundation consists of interbedded sandstone and shale layers. The hydropower station has an installed capacity of 43.5 MW, with a total reservoir storage of 775.2 million m3 and an annual energy output of 282.1 GWh. To enhance seepage control, a 3.0 mm polyvinyl chloride (PVC) GMB was installed upstream of the clay core-wall as the primary impermeable barrier.

2.2.1. Numerical Model

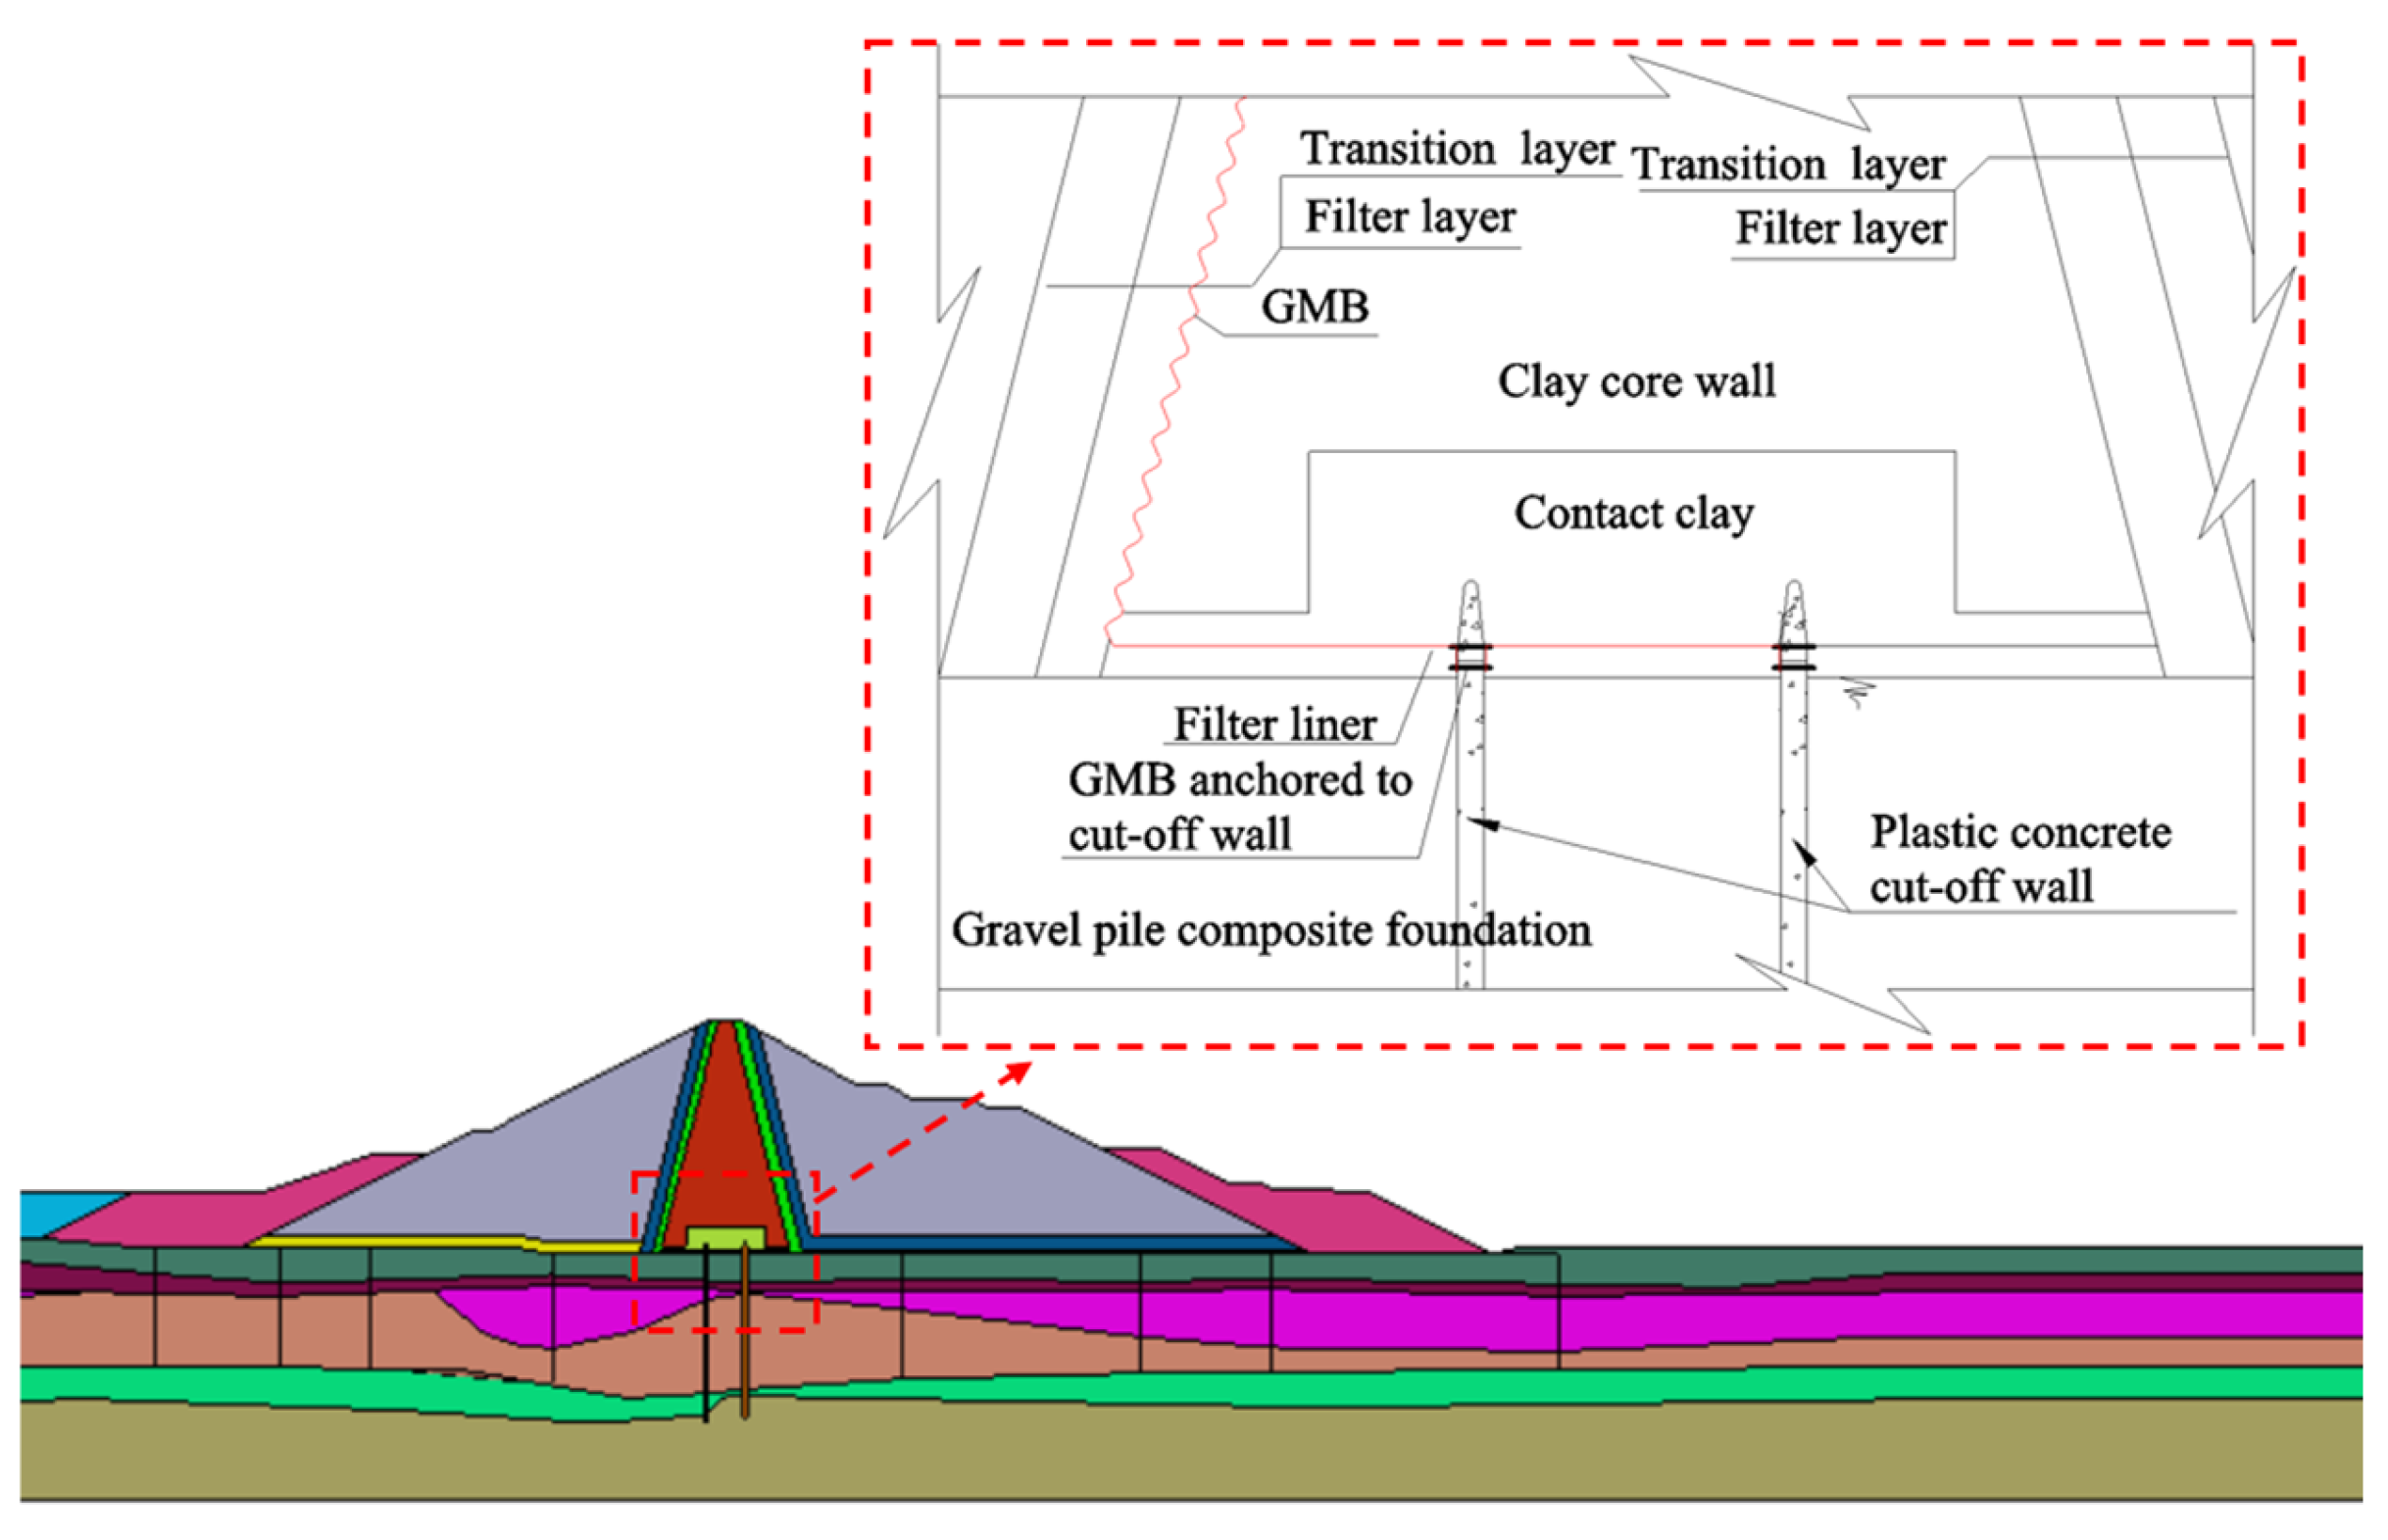
The typical cross-sectional view of the dam is presented in Figure 1. The computational domain extends 2.0 times the dam height upstream from the toe and 2.5 times the dam height downstream from the toe. The bedrock foundation extends downward at 1.0 times the dam height from the lowest point of the dam base. Stone columns arranged in square patterns with replacement ratios of 0.35, 0.30, 0.25, and 0.20 were implemented in different zones beneath the dam foundation. The stone column-reinforced zones were modeled as composite ground through equivalent material parameter conversion. The boundary conditions were defined as follows: full fixity constraints at the model base, normal displacement constraints at the truncated lateral boundaries (upstream, downstream, and side faces). The upstream face of the dam is assigned a fixed water head of 55 m. In the model, the downstream dam foundation is set to zero hydraulic head, and the downstream dam slope is set to a free discharge surface. A three-dimensional numerical model was developed with membrane elements, maintaining consistent parameters along the thickness direction, which was set at 1 m. The coordinate system was established with: X axis (streamwise direction, positive downstream), Y axis (dam axis direction, positive inward), and Z axis (vertical direction, positive upward). The grid division of the numerical model is consistent with established methodologies [26,27].
The configuration of the clay core-wall, highly plastic clay base, and GMB is shown in Figure 2. A GMB was installed between the clay core-wall and filter layer using an “S” configuration [12], with its lower end anchored to the concrete cut-off wall’s crest. The filter layer was constructed with an overall slope gradient of 1:0.25.

2.2.2. Material Parameters

The Duncan–Chang constitutive model was adopted for the analysis of soil behavior. Table 1 presents a concise overview of the parameters employed in the Duncan–Chang model for the analysis of dam materials and foundation strata. The geotechnical parameters of the in situ soil layers were primarily determined based on the geotechnical investigation data, while the computational parameters for the dam materials were derived through analogous project comparisons. Key parameters include ρsat—saturated density; ρ—natural density; n0—initial porosity; Sr0—initial saturation ratio; c—cohesion; φ0—initial internal friction angle; Δφ—incremental friction angle; Rf—failure ratio; K and n—the base and exponent, respectively, for the initial elastic modulus; Kb, m—hyperbolic constants for initial bulk modulus; Kur—unloading–reloading modulus constant.
As shown in Table 2, the composite ground parameters for stone column-improved zones are presented, along with replacement ratios of 0.35, 0.30, and 0.25. A comprehensive list of the permeability coefficients of dam materials and foundation strata was presented in Table 3. The GMB was assigned a density of 1.35 g/cm3 and a permeability coefficient of 1.0 × 10⁻¹⁰  cm/s. GMBs use a linear elastic model. The elastic modulus of the material was specified as 20 MPa, and its interface friction coefficient against adjacent geotextiles was determined to be 0.34. The interface friction between the geomembrane and the soil was set according to reference [28]. The concrete cut-off wall was modeled with a density of 2.4 g/cm3, an elastic modulus of 2000 MPa, and a 90-day compressive strength of 8.0 MPa.

2.2.3. Numerical Cases

The finite element analysis employed a staged loading procedure to replicate the actual construction sequence. The first stage simulated the geostatic stress equilibrium of the foundation and concrete cut-off wall. Subsequent stages modeled the clay core-wall and dam construction process over 10 phases, with the first clay core-wall spreading thickness specified at 5 m and subsequent spreading thickness at 6 m each. Two critical operational conditions were analyzed: the post-construction phase and the reservoir impoundment phase. The reservoir water level during the impoundment phase was maintained at 55 m over the course of 9 stages. A total of 15 simulation cases were evaluated (see Table 4), with case GK1 comprising 155,631 elements and other cases maintaining comparable mesh densities. Cases GK1~GK4 were designed to investigate the influence of clay core-wall spreading thickness on GMB stress–deformation behavior, considering four spreading thicknesses of 1 m, 2 m, 4 m, and 6 m. Cases GK2 and GK5~GK12 were developed to analyze hydraulic head effects on GMB performance. Nine hydraulic heads were evaluated, with the maximum head corresponding to the design reservoir water level of 55 m, measured from the dam foundation crest.
Cases GK13, GK14, and GK15 were designed to evaluate the influence of GMB defect location height on stress–deformation behavior. A total of three defect heights were examined—10 m, 30 m, and 50 m, respectively, measured from the dam foundation crest. These defect heights represent defects at the dam base, mid-section, and crest. Case GK2, which exhibited a GMB without defect, was designated as the control scenario. The square-shaped defect model, measuring 2 cm × 2 cm, was developed based on field investigations and existing literature [22,29,30], assuming a single localized damage point. The defect zone was assigned a permeability coefficient of 10 m/s to simulate high hydraulic conductivity. Considering the symmetry of the defect hole, the center of the defect hole is set at the edge of the model, and half of the defect hole is set in the direction of the model’s dam axis.

3. Results and Analysis

3.1. Stress–Deformation Behavior of Dam and Geomembrane Under Normal Reservoir Water Level

Consistent stress–deformation patterns were observed in the dam and GMB across all cases. Using case GK2 as a representative example, the stress–deformation behavior of the dam and GMB during the reservoir impoundment phase was analyzed in this section.

3.1.1. Stress–Deformation Behavior of the Dam

As shown in Figure 3, the principal stress distribution within the dam during the reservoir impoundment phase is presented. It has been demonstrated that all primary stresses are compressive, exhibiting an increase in magnitude that is dependent upon depth. The downstream section exhibits higher stress magnitudes compared to the upstream section when subjected to reservoir water pressure. The maximum major principal stress of approximately 1.82 MPa is located at the base of the downstream overburden layer. This stress distribution pattern aligns with the characteristic mechanical behavior of clay core-wall dams. This stress distribution pattern corresponds with the characteristic mechanical behavior of clay core-wall dams under self-weight conditions [31].
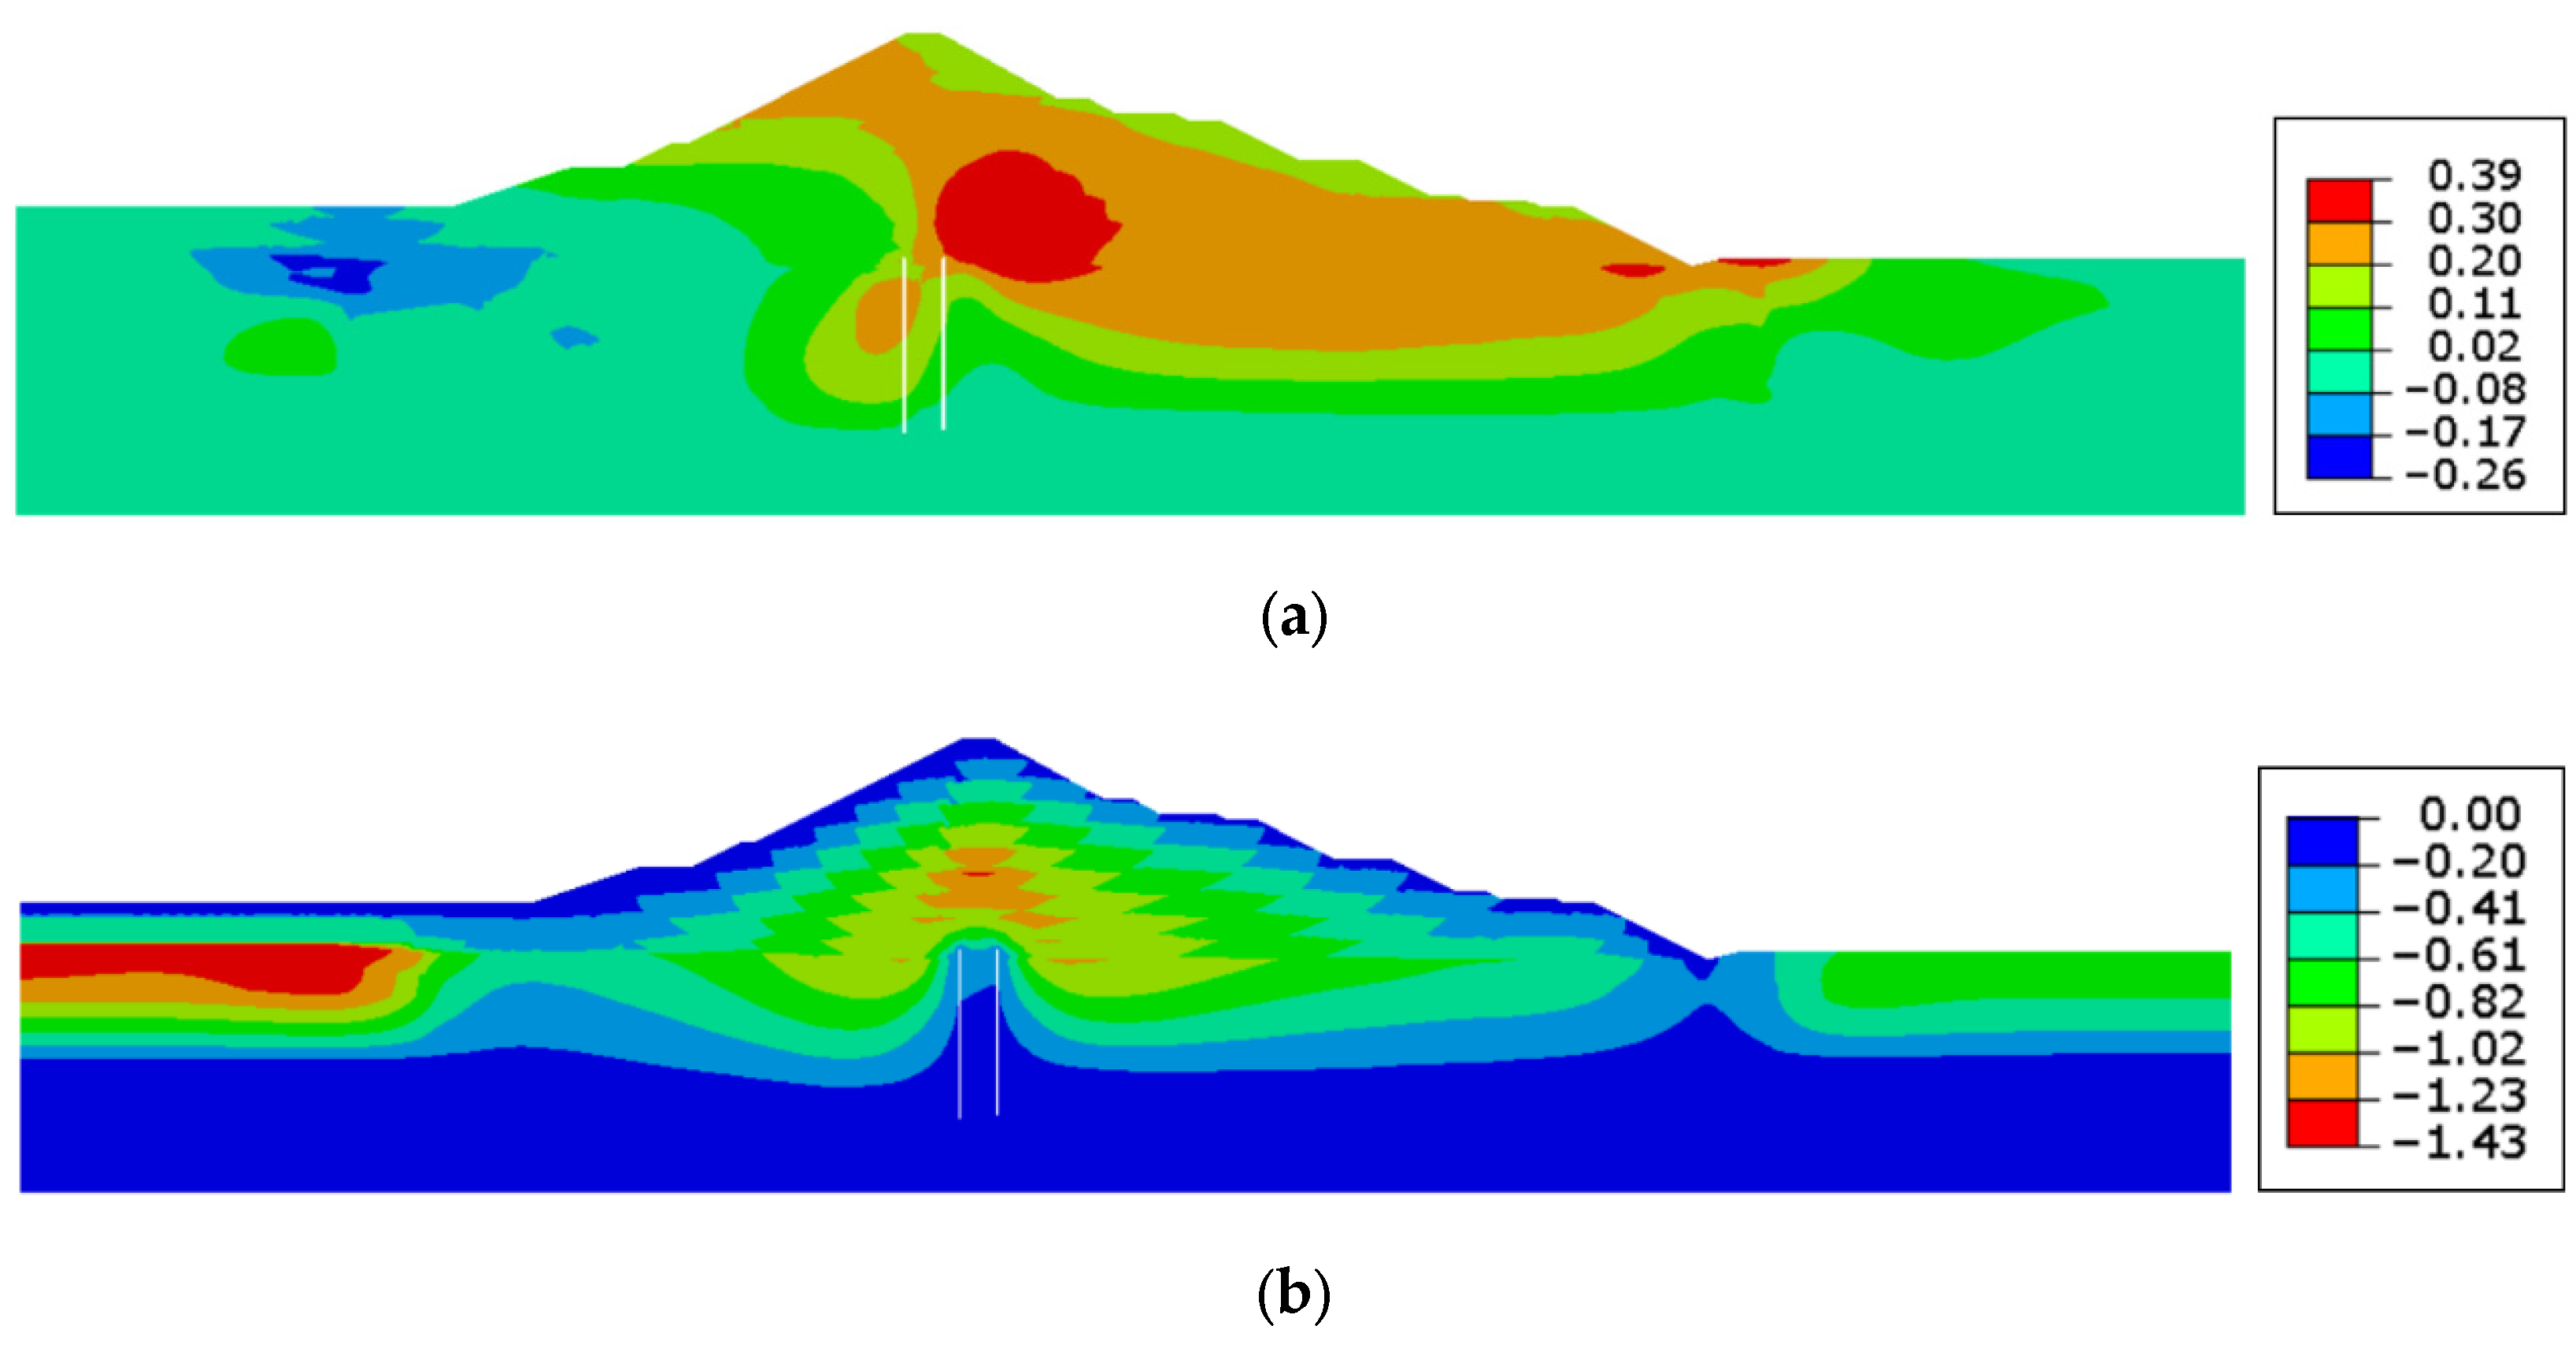
As shown in Figure 4, the displacement distribution of the dam during the reservoir impoundment phase is presented. As shown in Figure 4a, upon reaching the normal reservoir water level, the maximum downstream displacement of 0.39 m was observed at the upper section of the right concrete cut-off, while the maximum upstream displacement measured 0.26 m, demonstrating greater downstream deformation magnitudes. This is mainly due to pore water pressure. As shown in Figure 5, the distribution of pore water pressure in the dam during the impoundment period is clearly illustrated. From the distribution of pore water pressure in the dam, it can be seen that during the impoundment period, due to the presence of the seepage control system, the water pressure load acts only on the upstream side. Therefore, due to the influence of pore water pressure, the lateral displacement of the upstream section decreased compared to the post-construction stage, while that of the downstream section increased, attributable to the effects of pore water pressure. As shown in Figure 4b, the maximum foundation settlement was reduced to 1.43 m (from 1.54 m post-construction phase), and the core-wall maximum settlement decreased to 1.08 m (from 1.11 m post-construction), with the latter occurring at a height of 22 m within the clay core-wall. These deformation patterns are consistent with the characteristic behavior of clay core-wall rockfill dams under hydraulic loading. This finding is consistent with the laws obtained from the centrifugal model experiments conducted by Xu et al. [12].

3.1.2. Stress–Deformation Behavior of GMB

As shown in Figure 6, the variations in principal tensile stress and strain along the GMB upstream of the clay core-wall during reservoir impoundment are presented, with the length measurement initiated from the GMB at the dam crest. The principal tensile stress remains near zero across most of the GMB length but increases significantly within its horizontal segment near the clay core-wall base. The maximum tensile stress of 0.68 MPa occurs at the anchorage location of the GMB to the cut-off wall, corresponding to the transition between horizontal and vertical GMB segments. The changes law of the principal tensile strain of the GMB during the impoundment phase is similar to that of the principal tensile stress. The tensile strain of the GMB exhibits a substantial increase within the horizontal laying section of the GMB near the bottom of the core-wall. The maximum tensile strain value of 2.70% is observed in the anchorage location of the GMB to the cut-off wall.
The stress–deformation responses of the dam demonstrate minimal variation across different GMB laying parameters. Therefore, the subsequent analysis focuses on elucidating the influence of GMB properties on its intrinsic stress–strain behavior.

3.2. Influence of Clay Core-Wall Spreading Thickness on Stress–Deformation Response of GMB

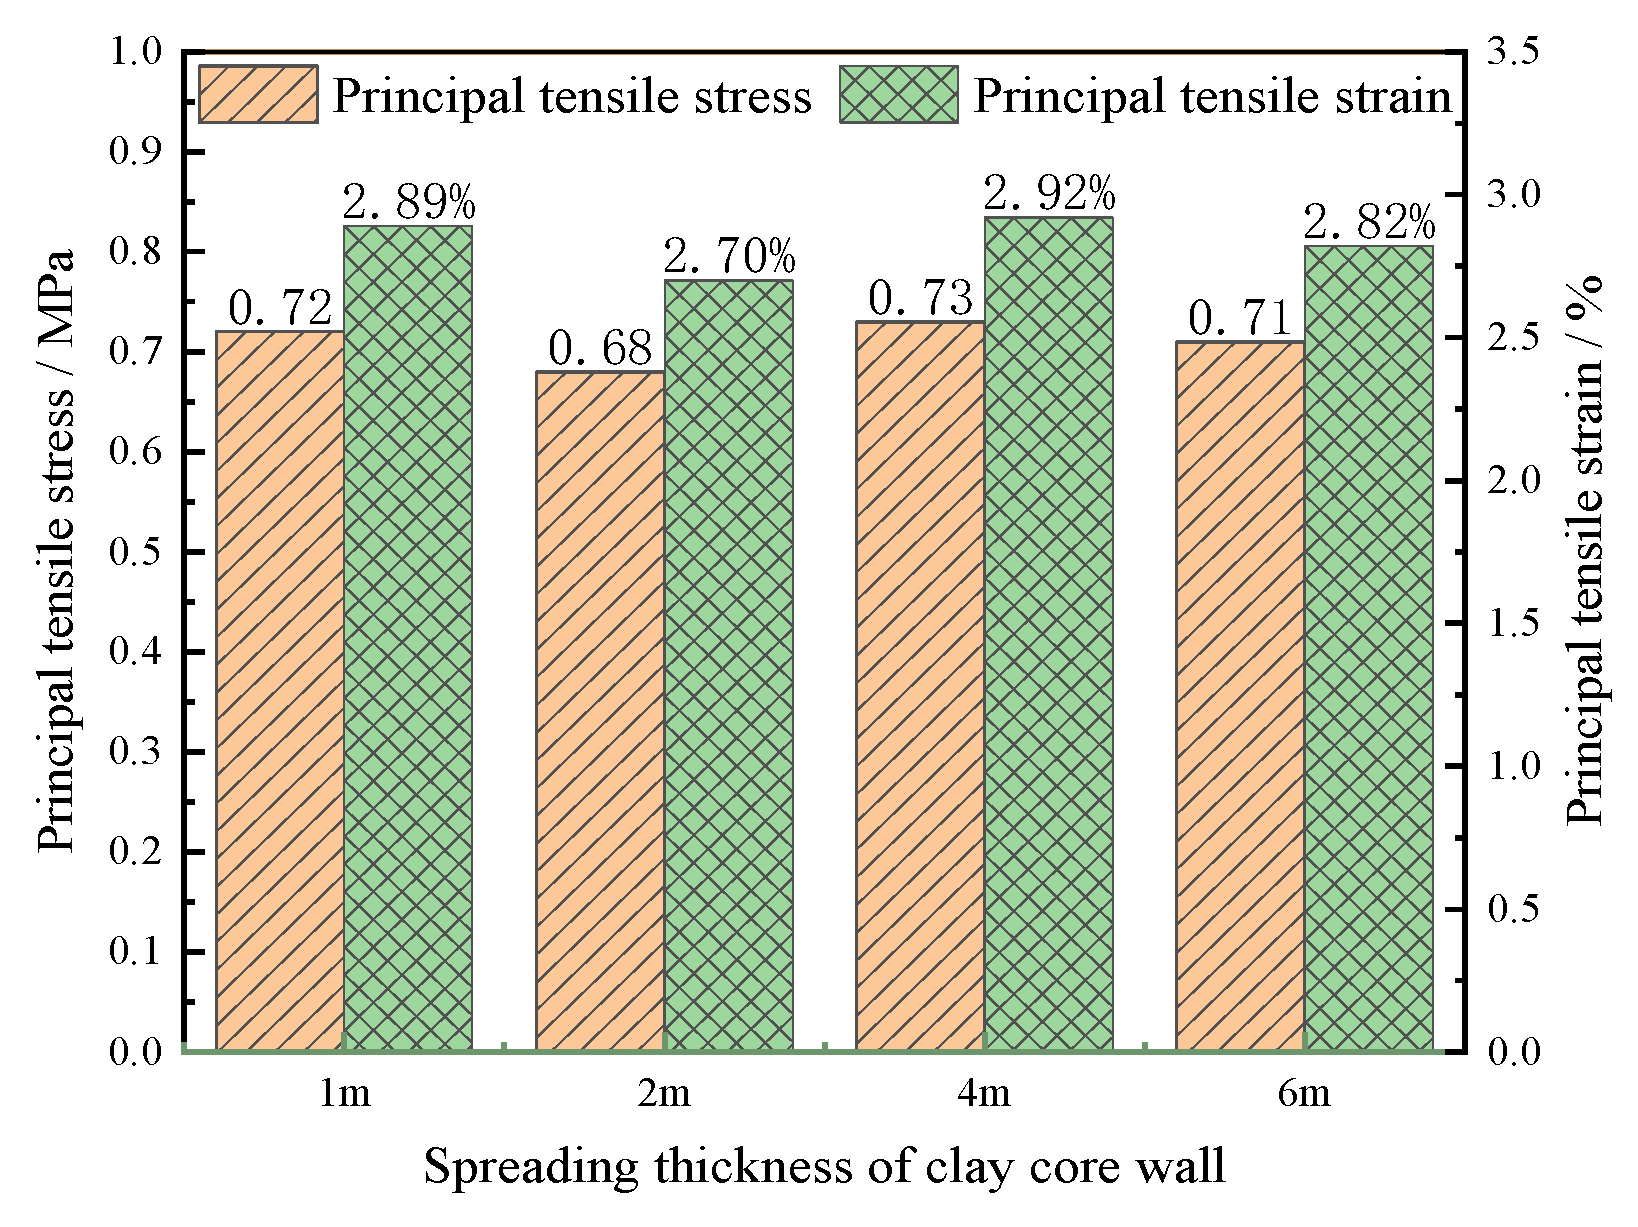
A series of simulations was conducted on cases GK1~GK4 to ascertain the impact of varying the clay core-wall spreading thickness on the stress–deformation behavior of GMBs. The spreading thicknesses for these cases were set at 1 m, 2 m, 4 m, and 6 m under the design hydraulic head of 55 m. As shown in Figure 7, the maximum tensile stresses and strains in the GMB during the impoundment phase are presented across these configurations. The findings indicate minor fluctuations in peak tensile stresses and strains with increasing spreading thickness, with both parameters attaining their minimum values at a thickness of 2 m. Specifically, the maximum GMB settlements were recorded as 1.01 m, 1.00 m, 1.04 m, and 1.02 m for spreading thicknesses of 1 m, 2 m, 4 m, and 6 m, respectively, demonstrating optimal deformation control at the 2 m configuration. Horizontal displacements demonstrated consistency across all cases, and the maximum displacements ranged between 0.23 m and 0.24 m. Despite the proposal of four schemes for the thickness of clay core-wall layers by this study, it is imperative to acknowledge that while a reduction in layer thickness results in more compacted clay core-walls, an excessively diminutive layer thickness has a substantial adverse effect on construction efficiency. Conversely, an excessively large layer thickness can have a substantial impact on the compaction quality of the clay core-wall. Consequently, the selection of the optimal layer thickness for this project is of paramount importance. Preliminary calculations indicate that when the thickness of each layer of the clay core-wall is set at 2 m, the impact on stress concentration of the geomembrane is minimized. A comprehensive consideration of the GMB force and deformation characteristics, as well as the utilization of the S-shaped laying method for construction, indicates that the thickness of the clay core-wall spreading should neither be excessively large nor excessively small. In this paper, under the conditions of the dam and dam base, it is determined that a spreading thickness of 2 m is more appropriate.
As shown in Figure 8, the horizontal and vertical displacement profiles along the GMB upstream of the clay core-wall are presented under varying spreading thicknesses during reservoir impoundment. The horizontal displacements of the GMB exhibit a consistent orientation downstream, with greater magnitudes observed in the upper dam section compared to the lower portion. Increasing the spreading thickness has been shown to generally reduce horizontal displacement magnitudes. For spreading thicknesses of 1 m, 2 m, 4 m, and 6 m, the maximum horizontal displacements were found to be 0.242 m, 0.234 m, 0.236 m, and 0.231 m, respectively. The minimum values ranged between 0.045 m and 0.065 m. These extremes consistently occurred at heights of 18 m and 54 m below the dam crest. The GMB settlement demonstrates a non-monotonic trend along its length, initially increasing before decreasing, a pattern attributed to the S-shaped laying configuration. The maximum settlements under 1 m, 2 m, 4 m, and 6 m spreading thicknesses reach 0.998 m, 1.005 m, 1.040 m, and 1.022 m, respectively, peaking near 36 m below the dam crest. The magnitude of settlement demonstrates an initial rise followed by a subsequent decline with increasing spreading thickness.

3.3. Influence of Defect Location on Stress–Deformation Behavior of GMB

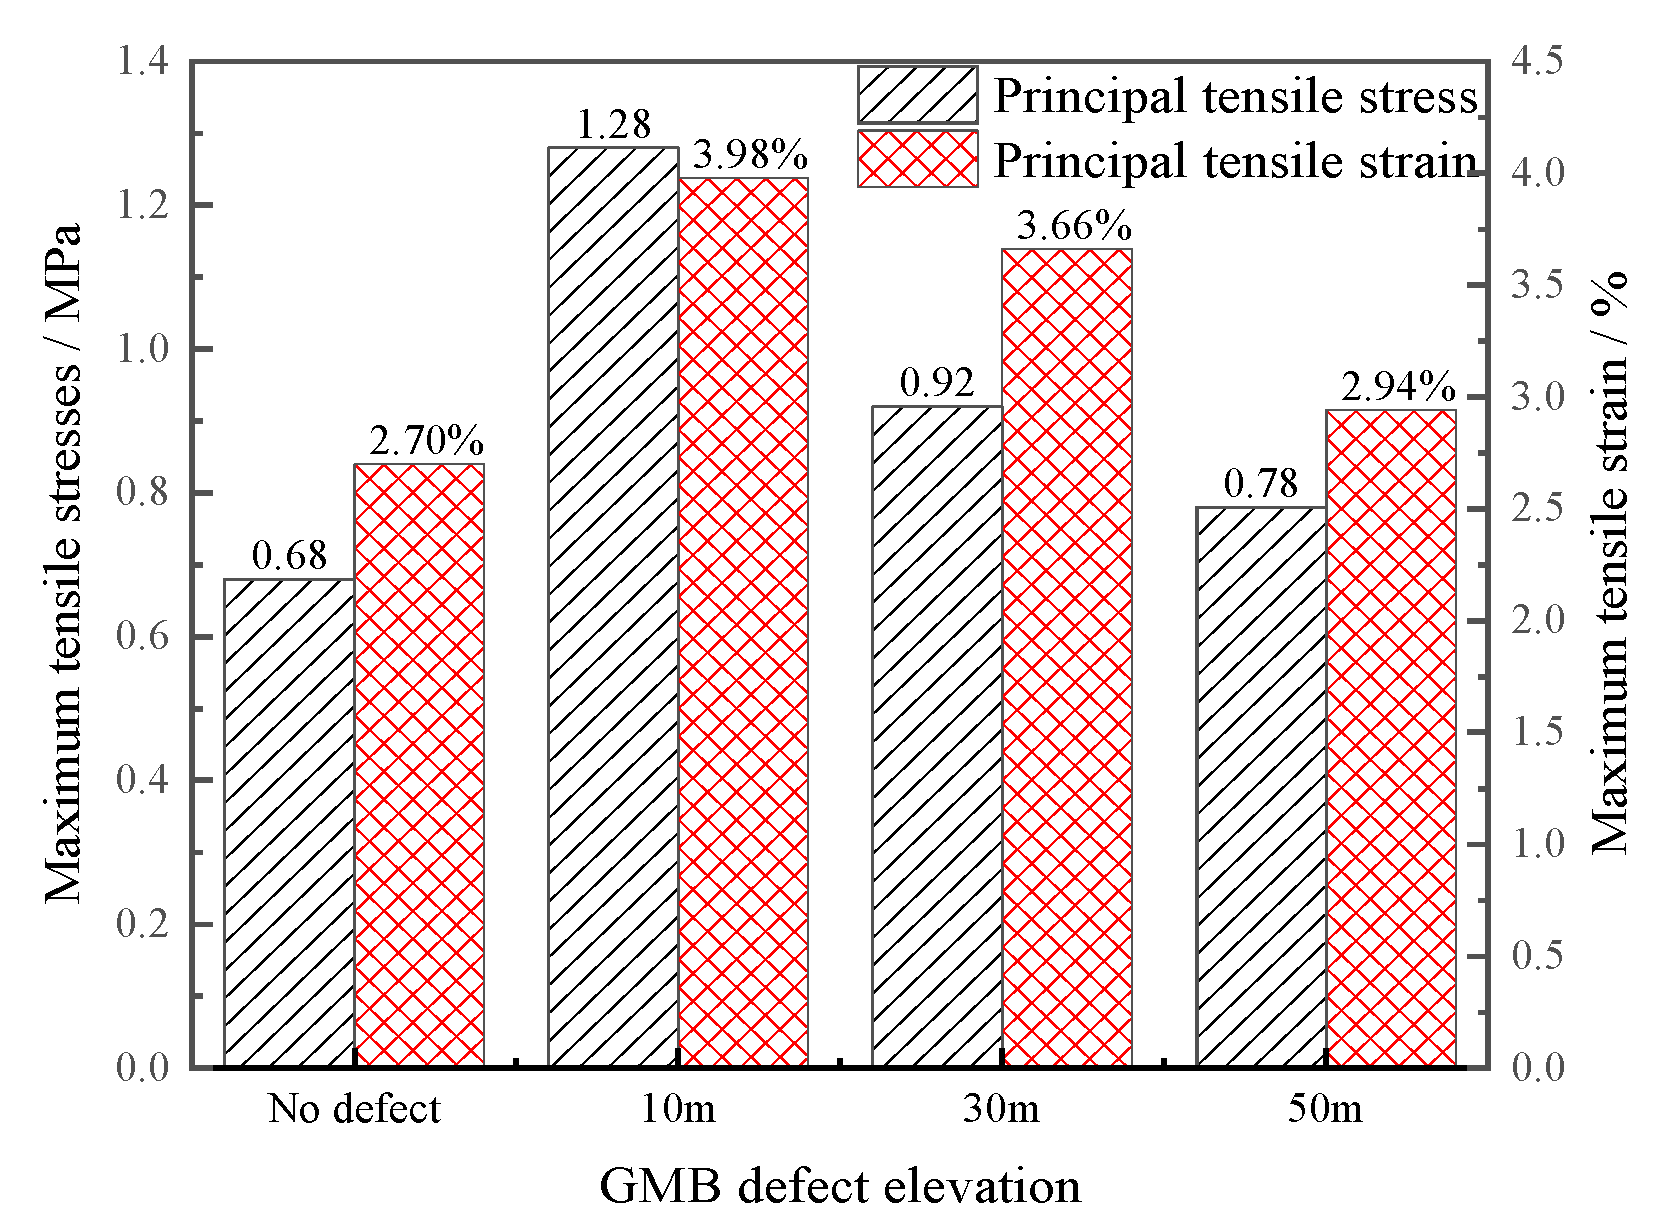
A series of simulations were conducted on cases GK13~GK15 to assess the impact of GMB defect height on the stress–deformation behavior of the dam and GMB when subjected to the design reservoir water level of 55 m. A total of three defect heights were subjected to analysis in relation to the dam foundation crest. The dam base measures 10 m, the mid-section 30 m, and the dam crest 50 m. Figure 9 provides a comparison of the maximum tensile stresses and strains in the GMB across these configurations. The presence of defects has been shown to significantly amplify tensile stresses and strains in the GMB, with magnitudes inversely correlated to defect height. The maximum tensile strain of the GMB is 3.98% when the defect height is 10 m, which is about 1.47 times greater than that without defects.
As shown in Figure 10, the seepage discharge and phreatic line height are shown to vary with defect height. The seepage discharge was calculated per meter spreading thickness across the entire dam. The presence of defects led to an increase in the seepage discharge, measuring 0.62 m3/d, 0.59 m3/d, and 0.56 m3/d for defect heights of 10 m, 30 m, and 50 m, respectively. A negative correlation has been demonstrated between defect heights and seepage discharge, a finding that has been substantiated by Sun et al. [30]. Furthermore, an analysis was conducted to ascertain the height of the phreatic line of the dam at the contact surface between the GMB and the core-wall. It was determined that the height of the phreatic line was 14.81 m when the GMB was not defective. However, the phreatic line began to rise after the GMB was defective. It has been demonstrated that the height of the phreatic line is directly proportional to the defect height, with an inverse relationship between the two. Furthermore, it has been observed that when the defect height is 10 m, the height of the phreatic line rises to 20.11 m. Horizontal displacements and settlements of the GMB remain largely unaffected by defect height variations. The findings indicate that lower defect heights (e.g., near the dam base) exert a greater detrimental effect on both seepage control and structural stability. This phenomenon is attributable to heightened hydrostatic pressure at reduced defect heights, thereby amplifying the risks of localized hydraulic fracturing and stress redistribution within the dam.

3.4. Influence of Hydraulic Head Magnitude on Stress–Deformation Behavior of Geomembrane

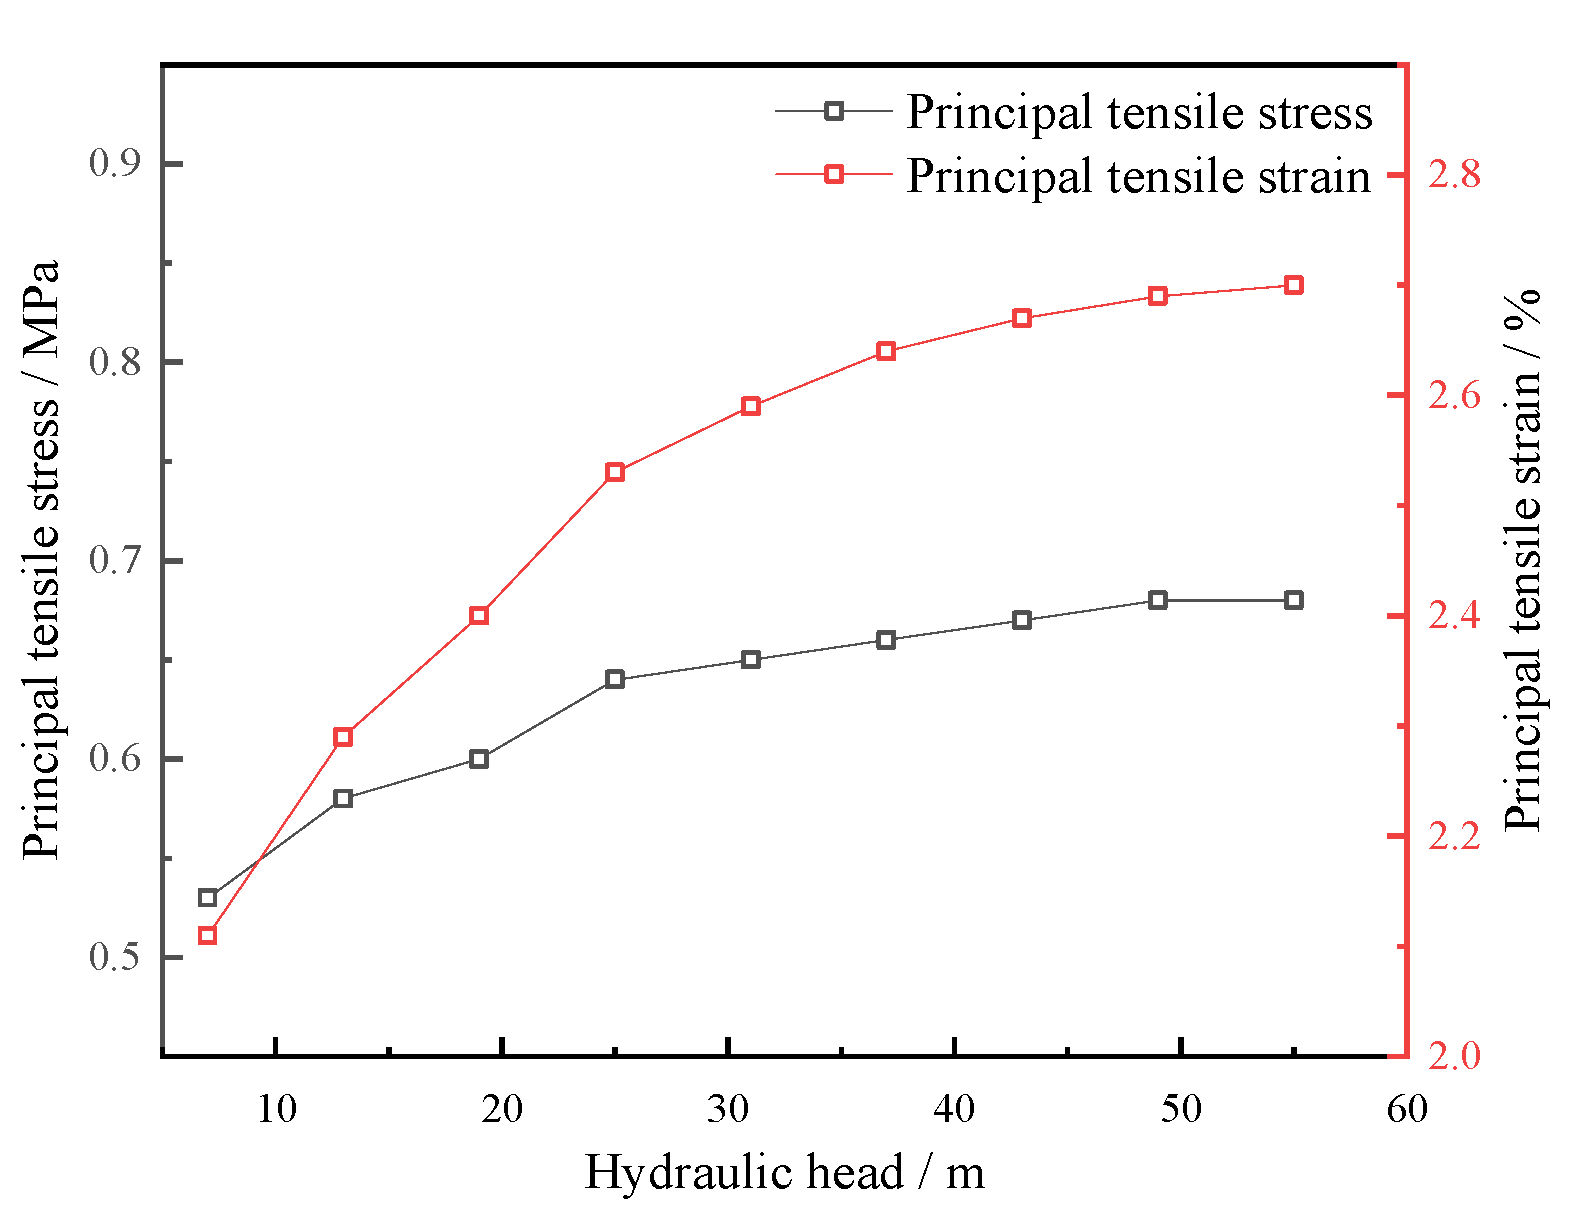
In cases GK2 and GK5~GK12, the influence of hydraulic head magnitude on the stress–deformation behavior of the GMB was examined. The considered water levels were 7 m, 13 m, 19 m, 25 m, 31 m, 37 m, 43 m, 49 m, and 55 m. The reservoir water level was measured from the dam foundation, with the maximum simulated head of 55 m corresponding to the design reservoir water level.
Figure 11 presents a graph of the maximum values of tensile stress and tensile strain of the GMB at different hydraulic heads. As shown in Figure 11, with an increase in hydraulic head, the tensile stress and tensile strain of the GMB exhibited a gradual increase and subsequent stabilization, accompanied by a concurrent decrease in the rate of increase. It is noteworthy that an augmentation in the hydraulic head from 49 m to 55 m results in an escalation of the tensile stress and tensile strain of the GMB to their maximum levels. The maximum tensile stress and tensile strain of the GMB are recorded as 0.68 MPa and 2.70%, respectively. As the magnitude of the hydraulic head increases, the horizontal displacement and settlement of the GMB also increase. When the hydraulic head increases from 7 m to 55 m, the maximum horizontal displacement of the GMB pointing downstream increases from 0.10 m to 0.24 m, and the maximum value of GMB settlement increases from 0.97 m to 1.00 m. It can be concluded that the larger the hydraulic head, the larger the GMB force and deformation are. According to the recent report on the mechanical properties of PVC GMBs, the critical value of elastic strain for a 3.0 mm PVC GMB is 62.3% [32], which is considerably larger than the maximum tensile strain of PVC GMB subjected to each working condition in the present study. Therefore, it can be concluded that the GMB is within an acceptable range for each working condition in the present study.

4. Conclusions

The stress–deformation behavior of GMCWRD’s seepage control system under varying construction and operational conditions was investigated in this paper, focusing on the effects of spreading thickness of clay core-wall, GMB defect height, and hydraulic head magnitude on coupled dam-GMB responses. The key findings are summarized as follows:
(1) During reservoir impoundment, the GMB exhibited consistent downstream-oriented horizontal displacements, with magnitudes in upper dam sections exceeding those at lower heights. Settlement values displayed a non-monotonic relationship with embedment depth, initially increasing before decreasing toward the dam base. The maximum tensile strain of the GMB (2.70%) during the impoundment phase occurred at the anchorage of the GMB to the cut-off wall.
(2) The maximum values of GMB tensile stresses and strains fluctuate as the thickness of the clay core-wall increases. In the context of the dam construction and foundation parameters delineated in this paper, it is observed that the tensile stress and tensile strain of the GMB attain their minimum levels when the spreading thickness is set at 2 m. As the water level in the reservoir rises, the horizontal displacement and settlement of the GMB gradually increase, and the tensile stress and strain of the GMB also gradually increase and stabilize.
(3) As the height of the GMB defect location decreases, the seepage discharge through the dam progressively increases, and the phreatic line rises, which leads to an increase in the tensile strain of the GMB. The height of the GMB defect location is directly proportional to the water pressure at the defect location. This, in turn, has a negative impact on the dam and GMB. Subsequent to the occurrence of GMB defects, the GMB experienced a substantial increase in both tensile stress and tensile strain. Notably, at a defect location 10 m above ground level, the maximum tensile strain value of the GMB exhibited an augmentation of 1.47 times compared to the period preceding the defect’s presence.
(4) The maximum tensile strains on the GMB for varying clay core-wall spreading thicknesses, GMB defect locations, and hydraulic head were considerably less than the maximum elastic deformation range of the selected PVC GMB.
(5) According to the findings of this study, the impact of GMB defects on the safety of dam structures warrants adequate consideration. Consequently, it is imperative to prioritize the protection of GMBs during construction. Furthermore, the present study was conducted under specific engineering geological conditions and dam material properties conditions and can provide some reference value for similar projects. However, it is important to note that the findings of this study should not be universally applied to all GMB application projects.

Author Contributions

Conceptualization, W.W. and Q.L.; methodology, B.L. and H.W.; software, W.W. and Q.L.; validation, B.L. and H.W.; formal analysis, B.L. and W.W.; resources, Q.L. and H.W.; data curation, B.L.; writing—original draft preparation, B.L. and W.W.; writing—review and editing, B.L., W.W., H.W. and Q.L.; visualization, B.L.; supervision, H.W. and Q.L.; project administration, H.W. and Q.L.; funding acquisition, H.W. All authors have read and agreed to the published version of the manuscript.

Funding

The research was supported by the National Natural Science Foundation of China, No. 51409083.

Institutional Review Board Statement

Not applicable.

Informed Consent Statement

Not applicable.

Data Availability Statement

The original contributions presented in this study are included in the article. Further inquiries can be directed to the corresponding author.

Acknowledgments

The authors would like to thank the reviewers for their critical reviews and suggestions for improving the quality of this manuscript.

Conflicts of Interest

Author Baoyong Liu and Qiankun Liu were employed by the company China Power Construction Municipal Construction Group Co., Ltd. The remaining authors declare that the research was conducted in the absence of any commercial or financial relationships that could be construed as a potential conflict of interest.

References

  1. Xing, Y.L.; Shu, Y.M.; Hua, J.F.; Li, Y.H.; Zhou, W.Y. Improvement of Arch Action at Clay Core-Wall of High Rockfill Dam by United Seepage Control with Geomembrane; Springer: Berlin/Heidelberg, Germany, 2008. [Google Scholar] [CrossRef]
  2. Xing, Y.L.; Shu, Y.M.; Hua, J.F.; Li, Y.H.; Zhou, W.H. Effect of geomembrane and core-wall united impervious system on arch effect of core-wall in high earth-rock dams. J. Hohai Univ. 2007, 4, 456–459. [Google Scholar] [CrossRef]
  3. Shu, Y.M.; Li, Y.H. Design of impervious structure with geomembrane for high earth rock dams. J. Hohai Univ. 2006, 1, 60–64. [Google Scholar] [CrossRef]
  4. Lin, D.X. Study on Some Key Issues in Design and Construction of Geomembrane Central Core Earth and Rockfll Dams. Master’s Thesis, Dalian University of Technology, Dalian, China, 2002. [Google Scholar]
  5. Jiang, H.B. Stress and Strain of High Earth-rock Dam with Composite Geomembrane Core-wall and Inclined-wall. J. Chang. River Sci. Res. Inst. 2014, 31, 53–57+76. [Google Scholar] [CrossRef]
  6. Honkanadavar, N.P.; Kumar, N.; Ratnam, M. Modeling the behavior of alluvial and blasted quarried rockfill materials. Geotech. Geol. Eng. 2014, 32, 1001–1015. [Google Scholar] [CrossRef]
  7. Sharma, P.; Mahure, N.V.; Ratnam, M. Influence of different stress conditions on behavior of rockfill materials. Geotech. Geol. Eng. 2011, 29, 1035–1048. [Google Scholar] [CrossRef]
  8. Wu, H.M.; Zhang, Z.; Shu, Y. Stress and Deformation Property of Geomembrane Surface Barrier for High Rock-fill Dam. MATEC Web Conf. 2019, 275, 03003. [Google Scholar] [CrossRef]
  9. Ding, D.Y.; Ren, J.M. Analysis of Stress Deformation Characteristics of Composite Geomembrane Rock-Fill Dam with Core Wall. Appl. Mech. Mater. 2014, 470, 962–965. [Google Scholar] [CrossRef]
  10. Koerner, R.M.; Hsuan, Y.G. Lifetime Prediction of Polymeric Geomembranes Used in New Dam Construction and Dam Rehabilitation. 2003. Available online: https://www.researchgate.net/publication/238679247 (accessed on 28 June 2025).
  11. Yao, T.B.; Ding, D.Y.; Ren, J.M. Stress deformation analysis of composite geomembrane wall rock-fill dam under earthquake. South North Water Transf. Water Sci. Technol. 2015, 13, 127–131+144. [Google Scholar] [CrossRef]
  12. Xu, H.; Li, B.; Pan, J.J.; Li, H.-M. Stress and Deformation Characteristics of Composite Geomembrane Cofferdam with Different Patterns of Laying and Connection. J. Chang. River Sci. Res. Inst. 2022, 39, 111–115. [Google Scholar] [CrossRef]
  13. Fox, P.J.; Ross, J.D.; Sura, J.M.; Thiel, R. Geomembrane damage due to static and cyclic shearing over compacted gravelly sand. Geosynth. Int. 2011, 18, 272–279. [Google Scholar] [CrossRef]
  14. Li, T.Y.; Sun, D.A.; Fu, X.L.; Chen, Z.; Wang, L.; Du, Y.J. Two-dimensional migration characteristics of contaminants considering time-dependent contaminant sources and GM defects. Chin. J. Geotech. Eng. 2024, 46, 2450–2456. [Google Scholar] [CrossRef]
  15. Rowe, R.K. Systems engineering: The design and operation of municipal solid waste landfills to minimize contamination of groundwater. Geosynth. Int. 2011, 18, 391–404. [Google Scholar] [CrossRef]
  16. Giroud, J.; Bonaparte, R. Leakage through liners constructed with geomembranes—Part, I. Geomembrane liners. Geotext. Geomembr. 1989, 8, 27–67. [Google Scholar] [CrossRef]
  17. Giroud, J.P.; Gross, B.A.; Bonaparte, R.; McKelvey, J. Leachate Flow in Leakage Collection Layers Due to Defects in Geomembrane Liners. Geosynth. Int. 1997, 4, 215–292. [Google Scholar] [CrossRef]
  18. Rowe, R.K. Geosynthetics the minimization of contaminant migration through barrier systems beneath solid waste. In Proceedings of the 6th International Conference on Geosynthetics, Atlanta, GA, USA, 25–29 March 1998; Industrial Fabrics Association International: Roseville, MN, USA, 1998; pp. 27–103. [Google Scholar]
  19. Rowe, R.K. Long-term performance of contaminant barrier systems. Geotechnique 2005, 55, 631–678. [Google Scholar] [CrossRef]
  20. Rowe, R.K. Short-long-term leakage through composite liners. The 7th arthur casagrande lecture 1This lecture was presented at the 14th pan-American conference on soil mechanics geotechnical engineering Toronto ont October 2011, and a pre-print appeared in the conference proceedings. Can. Geotech. J. 2012, 49, 141–169. [Google Scholar] [CrossRef]
  21. Rowe, R.K. Protecting the environment with geosynthetics: 53rd Karl Terzaghi lecture. J. Geotech. Geoenviron. Eng. 2020, 146, 4020081. [Google Scholar] [CrossRef]
  22. Huang, J.; Wang, J.J.; Yi, L. Study on the Working Characteristics of Core Wall Rockfill Dam Considering Geomembrane Permeation. Water Resour. Power 2024, 42, 142–146. [Google Scholar] [CrossRef]
  23. Weber, C.T. Leakage Through Defects in Geomembrane Liners under High Hydraulic Heads. Master’s Thesis, University of Texas at Austin, Austin, TX, USA, 2008. [Google Scholar]
  24. Yang, Z.Y.; Gong, C.Y.; Xing, H.T.; Lv, H. Equivalent treatment methods for geomembrane defects in earth-rockfill dam seepage control systems and dam breach mechanisms induced by severe defects. Water Resour. Hydropower Eng. 2025, 1–15. Available online: https://link.cnki.net/urlid/10.1746.tv.20250709.1523.004 (accessed on 28 June 2025).
  25. Zhuang, Z. The Beginner’s Guide to ABAQUS Finite Element Software, Version 6.4; Tsinghua University Press: Beijing, China, 2004.
  26. Li, Z.M. Earth and Rockfill Dam FEM Automatic Mesh Generation Process. Master’s Thesis, Dalian University of Technology, Dalian, China, 2009. [Google Scholar]
  27. Wu, H.M.; Shu, Y.M.; Dai, L.J.; Teng, Z.M.; Jiang, S.P. Development verification of composite geomembrance-cushioninterface constitutive model in FLAC 3D. J. Hydraul. Eng. 2014, 45 (Suppl. S2), 167–174. [Google Scholar] [CrossRef]
  28. Bacas, B.M.; Canizal, J.; Konietzky, H. Frictional behaviour of three critical geosynthetic interfaces. Geosynth. Int. 2015, 22, 355–365. [Google Scholar] [CrossRef]
  29. Gunaratne, M.; Demirdogen, S. Discussion on stability analysis of embankment dams with defective internal geomembrane liners. Int. J. Geotech. Eng. 2022, 16, 1165–1175. [Google Scholar] [CrossRef]
  30. Sun, D.; Shen, Z.Z.; Cui, J.J. Seepage Numerical Simulation of Geomembrane Gravel Dam Caused by Geomembrane Defect. Water Resour. Power 2013, 31, 69–73. [Google Scholar] [CrossRef]
  31. Wang, B.; Shen, X.D. Stress and Strain Calculation of Asphalt Concrete Core for Earth-rock Dam. J. Eng. Heilongjiang Univ. 2008, 2, 52–55. [Google Scholar] [CrossRef]
  32. Zhao, H.Y.; Wu, H.M.; Shu, Y.M.; Yi, F. Experimental Study on Elastic Deformation Property of Geomembrane used as barrier in Upper Reservoir of Pumped Storage Power Station. Chin. J. Geotech. Eng. 2024. Available online: https://link.cnki.net/urlid/32.1124.TU.20240905.1724.002 (accessed on 28 June 2025).
Figure 1. Cross-sectional diagram of a clay core-wall rockfill dam.
Applsci 15 09324 g001
Figure 2. Diagram of a GMB–core-wall combined seepage control structure.
Applsci 15 09324 g002
Figure 3. Major principal stress of the dam during the reservoir impoundment phase (Unit: KPa).
Applsci 15 09324 g003
Figure 4. Displacement of dam during reservoir impoundment phase (a) Lateral displacement; (b) Settlement.
Applsci 15 09324 g004
Figure 5. Pore water pressure distribution of the dam in the impoundment period.
Applsci 15 09324 g005
Figure 6. Principal tensile stress and strain of GMB during the reservoir filling period.
Applsci 15 09324 g006
Figure 7. Principal tensile stress and strain of GMB during the reservoir impoundment phase under different spreading thicknesses.
Applsci 15 09324 g007
Figure 8. Horizontal displacement and settlement of GMB during the reservoir impoundment phase.
Applsci 15 09324 g008
Figure 9. Maximum tensile stress and tensile strain of GMB at different defect heights.
Applsci 15 09324 g009
Figure 10. Seepage discharge and phreatic line height of the dam at different defect heights.
Applsci 15 09324 g010
Figure 11. Maximum tensile stress and tensile strain of GMB at different hydraulic heads.
Applsci 15 09324 g011
Table 1. Duncan–Chang model parameters for dam and stratum materials.
Materialsρsat (g/cm3)Ρ (g/cm3)n0Sr0c/kPaφo (°)Δφ (°)KnRfKurKbm
Clay core-wall1.731.660.470.85302501800.50.80540900.6
Filter material2.011.960.23--50.18.46300.330.7412602500.31
Transition material2.152.120.23--52.58.07500.250.7115003000.30
Dam shell mixture materials2.011.960.23--43.33.95000.380.6310002000.32
Drainage material2.062.010.26--45.0 6.0 600 0.36 0.65 12002400.31
Backfill and waste material1.921.810.28-67.928.3 02200.46 0.67 440900.40
Contact clay1.691.620.50.8551601080.350.6270450.45
①Silty sand with muddy soil1.961.960.600.95313-400.750.70120160.7
②Medium-fine sand2.02.00.30.95027-3000.40.76001200.5
③-1 Silty clay1.531.530.641.0028.822.8-520.500.6156150.45
③-2 Peaty soil1.591.590.621.0030.323.0-530.500.6159150.60
④Sandy gravel with cobbles2.052.030.281.0003805100.450.6810002300.28
Concrete cut-off wall2.42.4--100639-16,6280.240.6319,9541699.8−0.015
Table 2. Duncan–Chang model parameters for composite foundation.
MaterialsStone Column Replacement Ratio: 0.35Stone Column Replacement Ratio: 0.3
c (kPa)φ(◦)KnKurKbmc (kPa)φ(◦)KnKurKbm
Post-reinforcement Layer ①2.024.64110.57822195.90.552.121.83580.59716170.20.57
Post-reinforcement Layer ②032.05800.371160263.50.19030.85400.3810802430.19
Post-reinforcement Layer ③-119.429.8418.80.44837.6195.30.3922.328.1366.40.45732.8169.50.40
Post-reinforcement Layer ③-220.729.7419.50.44839195.20.3520.928.1367.10.45734.2169.50.36
MaterialsStone column replacement ratio: 0.25Stone column replacement ratio: 0.20
c (kPa)φ (◦)KnKurKbmc (kPa)φ(◦)KnKurKbm
Post-reinforcement Layer ①2.320.43050.61610144.50.592.419.02520.66536118.80.61
Post-reinforcement Layer ②030.25000.381000222.50.18029.54600.389202020.17
Post-reinforcement Layer ③-123.927.23140.46628143.80.4123.026.4261.60.46564.81180.41
Post-reinforcement Layer ③-222.427.3314.80.46629.5143.80.3724.226.5262.40.46567.21180.37
Table 3. Permeability coefficients of the dam and stratum materials.
MaterialsPermeability (cm/s)MaterialsPermeability (cm/s)
Clay core-wall1 × 10−5③-1Silty clay1 × 10−6
Filter material5 × 10−3③-2Peaty soil1 × 10−7
Transition material5 × 10−2④ Sandy gravel with cobbles5 × 10−3
Dam shell mixture materials5 × 10−3Concrete cutoff wall1 × 10−7
Drainage material1 × 10−2Bedrock1 × 10−5
Backfill and waste material1 × 10−3Post-reinforcement Layer ① (0.35/0.3/0.25/0.2)1.76 × 10−3/1.51 × 10−3/
1.26 × 10⁻³/1.01 × 10−3
Contact clay1 × 10−6Post-reinforcement Layer ② (0.35/0.3/0.25/0.2)1.82 × 10−3/1.57 × 10−3/
1.33 × 10⁻³/1.08 × 10−3
① Silty sand with muddy soil1 × 10−5Post-reinforcement Layer ③-1 (0.35/0.3/0.25/0.2)1.75 × 10−3/1.50 × 10−3/
1.25 × 10⁻³/1.0 × 10−3
② Medium-fine sand1 × 10−4Post-reinforcement Layer ③-2 (0.35/0.3/0.25/0.2)1.75 × 10−3/1.50 × 10−3/
1.25 × 10⁻³/1.0 × 10−3
Table 4. Numerical simulation case.
NumberThe Spreading Thickness of the Clay Core-Wall/mWater Level/mThe Height of the GMB Defect Location/m
GK1155No defect
GK2255No defect
GK3455No defect
GK4655No defect
GK527No defect
GK6213No defect
GK7219No defect
GK8225No defect
GK9231No defect
GK10237No defect
GK11243No defect
GK12249No defect
GK1325550
GK1425530
GK1525510
Disclaimer/Publisher’s Note: The statements, opinions and data contained in all publications are solely those of the individual author(s) and contributor(s) and not of MDPI and/or the editor(s). MDPI and/or the editor(s) disclaim responsibility for any injury to people or property resulting from any ideas, methods, instructions or products referred to in the content.