1. Introduction
In modern optical precision measurement, microscopic digital holography is an important technology [
1]. In recent years, to improve measurement accuracy, researchers have employed illumination light with different phase structures to illuminate the object plane, effectively enhancing the amplitude resolution of the image light field [
2,
3,
4,
5,
6,
7,
8]. However, in detection studies, accurately obtaining the amplitude and phase of the object under coherent light illumination is equally important research work [
9,
10,
11]. When using illumination light with different phase structures to illuminate the object plane, the phase of the reconstructed hologram image is inevitably altered. To eliminate phase interference from the illumination light and accurately obtain the complex amplitude of the object being measured, it is necessary to establish a quantitative computational relationship between the complex amplitude of the light wavefield on the object plane and the complex amplitude of the light wavefield on the image plane. However, the imaging theory currently widely adopted is the formula for the amplitude distribution of the image light field derived from the optical classic
Introduction to Fourier Optics [
12]. Since the theoretical derivation of this formula approximates the impulse response of the imaging system, it can only be used when the object size is smaller than one-quarter of the diameter of the optical system’s entrance pupil. Therefore, it is difficult to obtain the amplitude and phase of the object based on this formula. Additionally, according to this formula, a coherent optical imaging system is a linear space-invariant system, and the amplitude resolution on the image plane is the same everywhere, which does not align with experimental measurements. Therefore, in 2016, Horstmeyer et al. [
13] cited the imaging theory in [
12] and suggested that when reporting research results on improving the reconstruction image resolution of microscopic digital holography, one should provide amplitude images of a radiation pattern grating (Siemens star) at different positions on the image plane. They also recommended that scientists provide mathematical methods for obtaining the amplitude and phase of the object light field based on digital holograms. However, this issue remains unresolved to this day.
After years of effort, we derived the formula for calculating the complex amplitude of the image field in an imaging system described by 2 × 2 matrix elements [
14]. Further research showed that, following the research method described by Professor Goodman in
Introduction to Fourier Optics, but without approximating the impulse response of the imaging system, it is also possible to derive an expression that can accurately calculate the complex amplitude of the image field.
This paper is based on the impulse response expression derived by Professor Goodman [
12] and presents two different approximations for the impulse response. It introduces the amplitude distribution calculation formula provided in
Introduction to Fourier Optics and the formula for approximating the complex amplitude of the image light field. Subsequently, through rigorous mathematical analysis, an accurate formula for calculating the complex amplitude of the image light field is derived, the new physical significance of the transfer function is introduced, and theoretical calculations and comparisons with digital holographic experimental image reconstruction are performed for the three formulas. For practical application, experimental and digital processing techniques for obtaining the complex amplitude of the detected object are introduced [
15]. To prove that coherent optical imaging systems are not linear space-invariant systems, the image light amplitude resolution of the Siemens star at different positions on the image plane is calculated using the formula. Finally, this research is discussed and conclusions are drawn.
2. Three Formulas for Calculating the Imaging Light Field of a Lens Imaging System
Following Professor Goodman’s research method [
12], we define the spatial rectangular coordinate system O-xyz, with the z-axis coinciding with the optical axis.
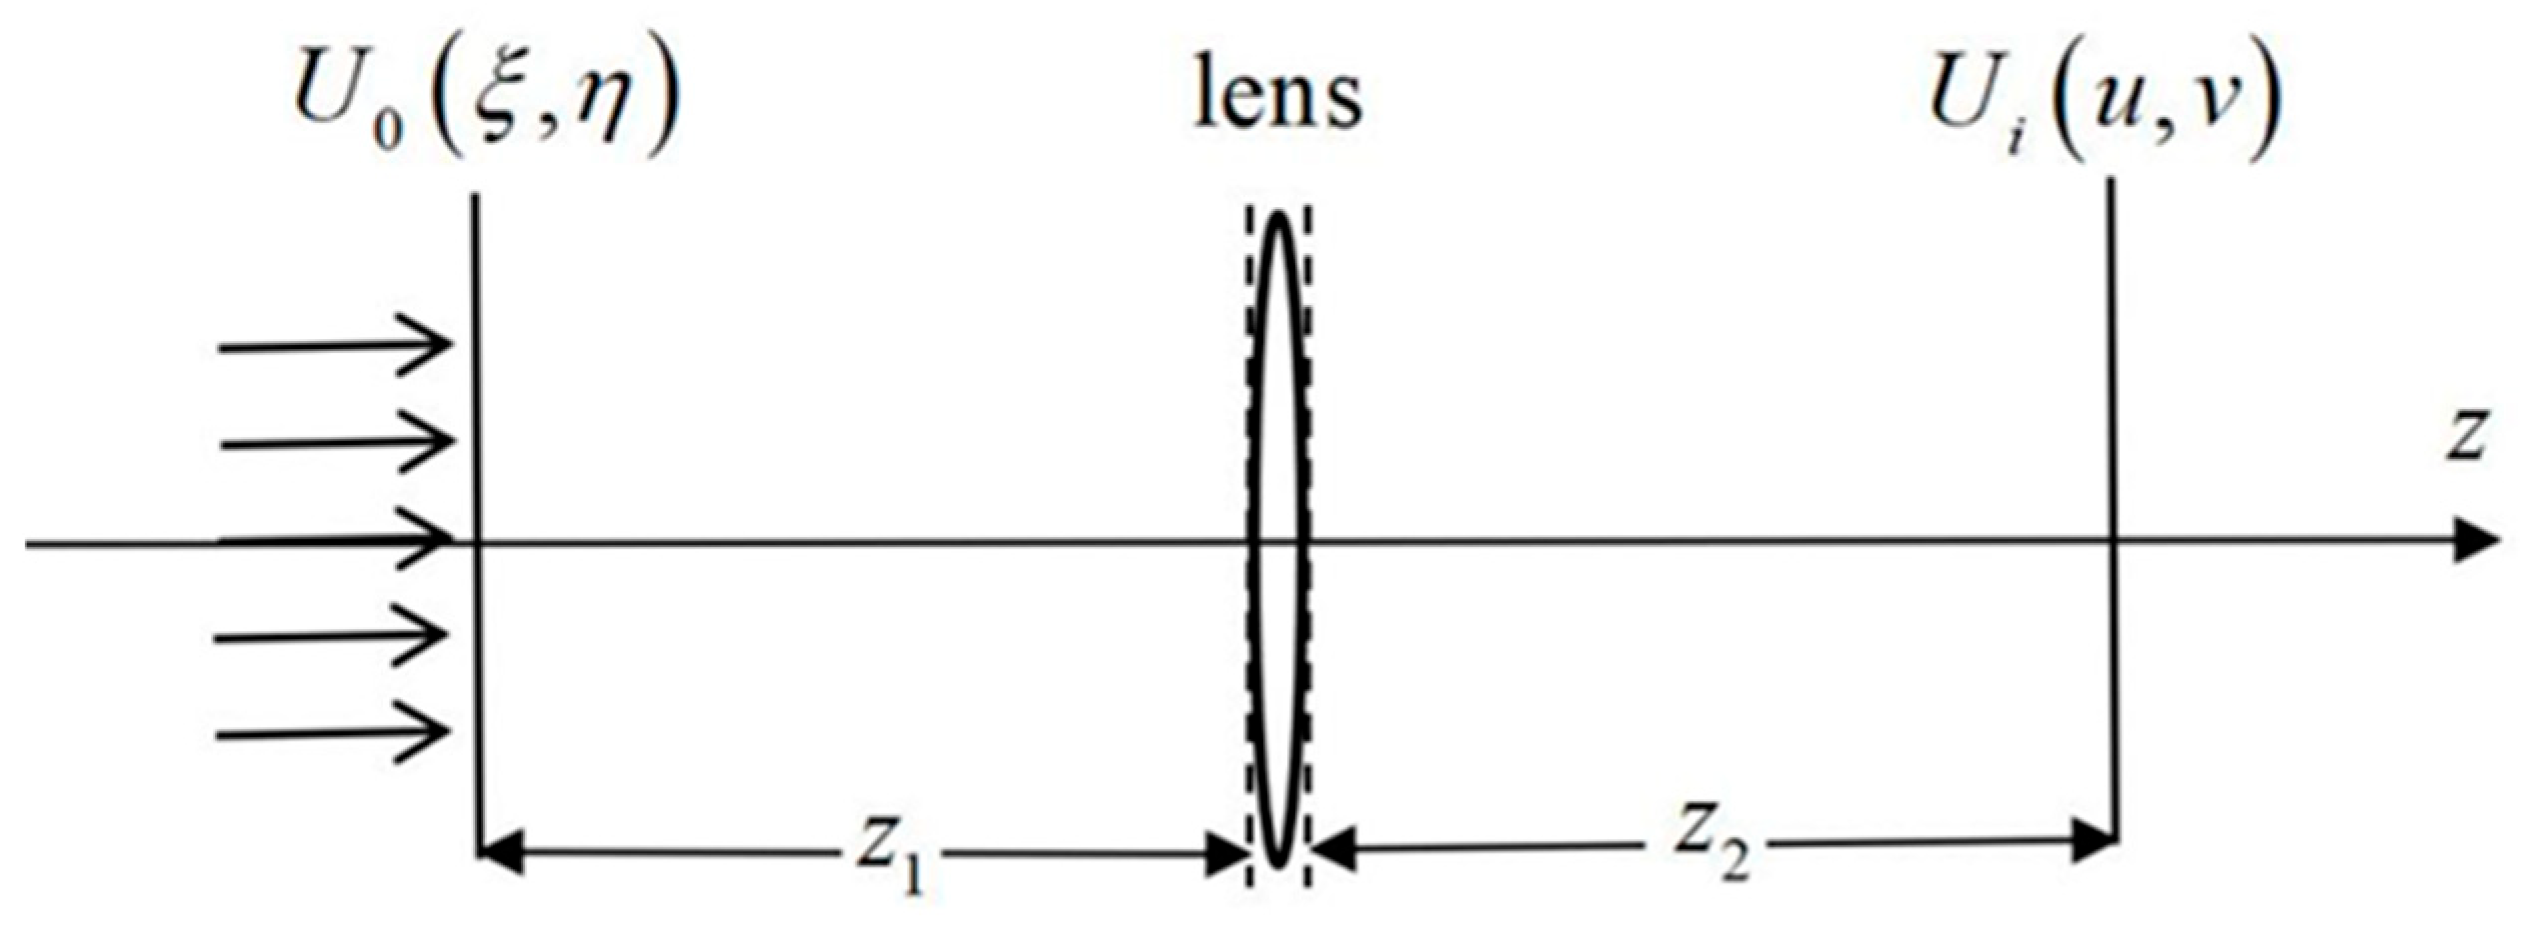
Figure 1 shows a schematic diagram of a single-lens imaging system illuminated by coherent light along the optical axis. Let the distance from the object plane to the first principal plane of the lens be z
1 and the distance from the image plane to the second principal plane of the lens be z
2.
The optical system is regarded as a linear system, and the object plane coordinates are
, the optical wave field is
, the image plane coordinates are
, and the image light field
can be expressed as the lower integral (the formula of reference [
12] (6–28)).
where
is the image made in the image plane by a light wave emitted from a point source with coordinates
in the object plane, called the impulse response. The focal length of the imaging lens is
f, and the pupil function is
P(
x,
y), and their expressions are as follows (the formula of reference [
12] (6–33)):
where
,
is the wavelength of light.
When substituting Equation (
2) into Equation (
1) to calculate the light wave field at the image plane, the resulting expression remains highly complex. Therefore, the literature [
12] states the following: “Equations (6–28) and (6–33) now provide a formal solution specifying the relationship between the object U
0 and the image U
i. However, it is difficult to determine the conditions under which U
i can reasonably be considered an image of U
0 unless further simplifications are made.”
Through a series of simplifications [
12], we finally get (formula of reference [
12] (6–42))
where
is the transverse magnification of the image,
where
is the spectral coordinate. According to the study of chapter 7 in reference [
8], the Fourier transform and inverse transform symbol are introduced, and Equation (
3) can be rewritten as
where
is the spectrum of the ideal image, and
is called the amplitude transfer function [
12]. For a circularly symmetric imaging system, its physical meaning is a low-pass filter for the spectrum of the ideal image.
If the phase factor
in Equation (
2) is retained, because the term does not participate in the integration operation of Equation (
1), the approximate calculation formula of the complex amplitude of the imaging light field based on Equation (
5) can be written as
Since the image plane
, the quadratic phase factor within the formula integral can be omitted, and using
, Equation (
2) can be rewritten using Equation (
4) as
put Equation (
7) into Equation (
1)
Let
and
, which results in
For ease of comparison with Equations (
5) and (
6), Equation (
9) can be written as a calculation formula expressed by Fourier transform and inverse transform
here, three different forms of the image light field calculation formula are derived.
The following study on the transmission of physical meaning will show [
16] that Equation (
10) can be applied to the calculation of the complex amplitude of the image light field for any size of the exit pupil.
4. Theoretical Simulation and Experimental Proof
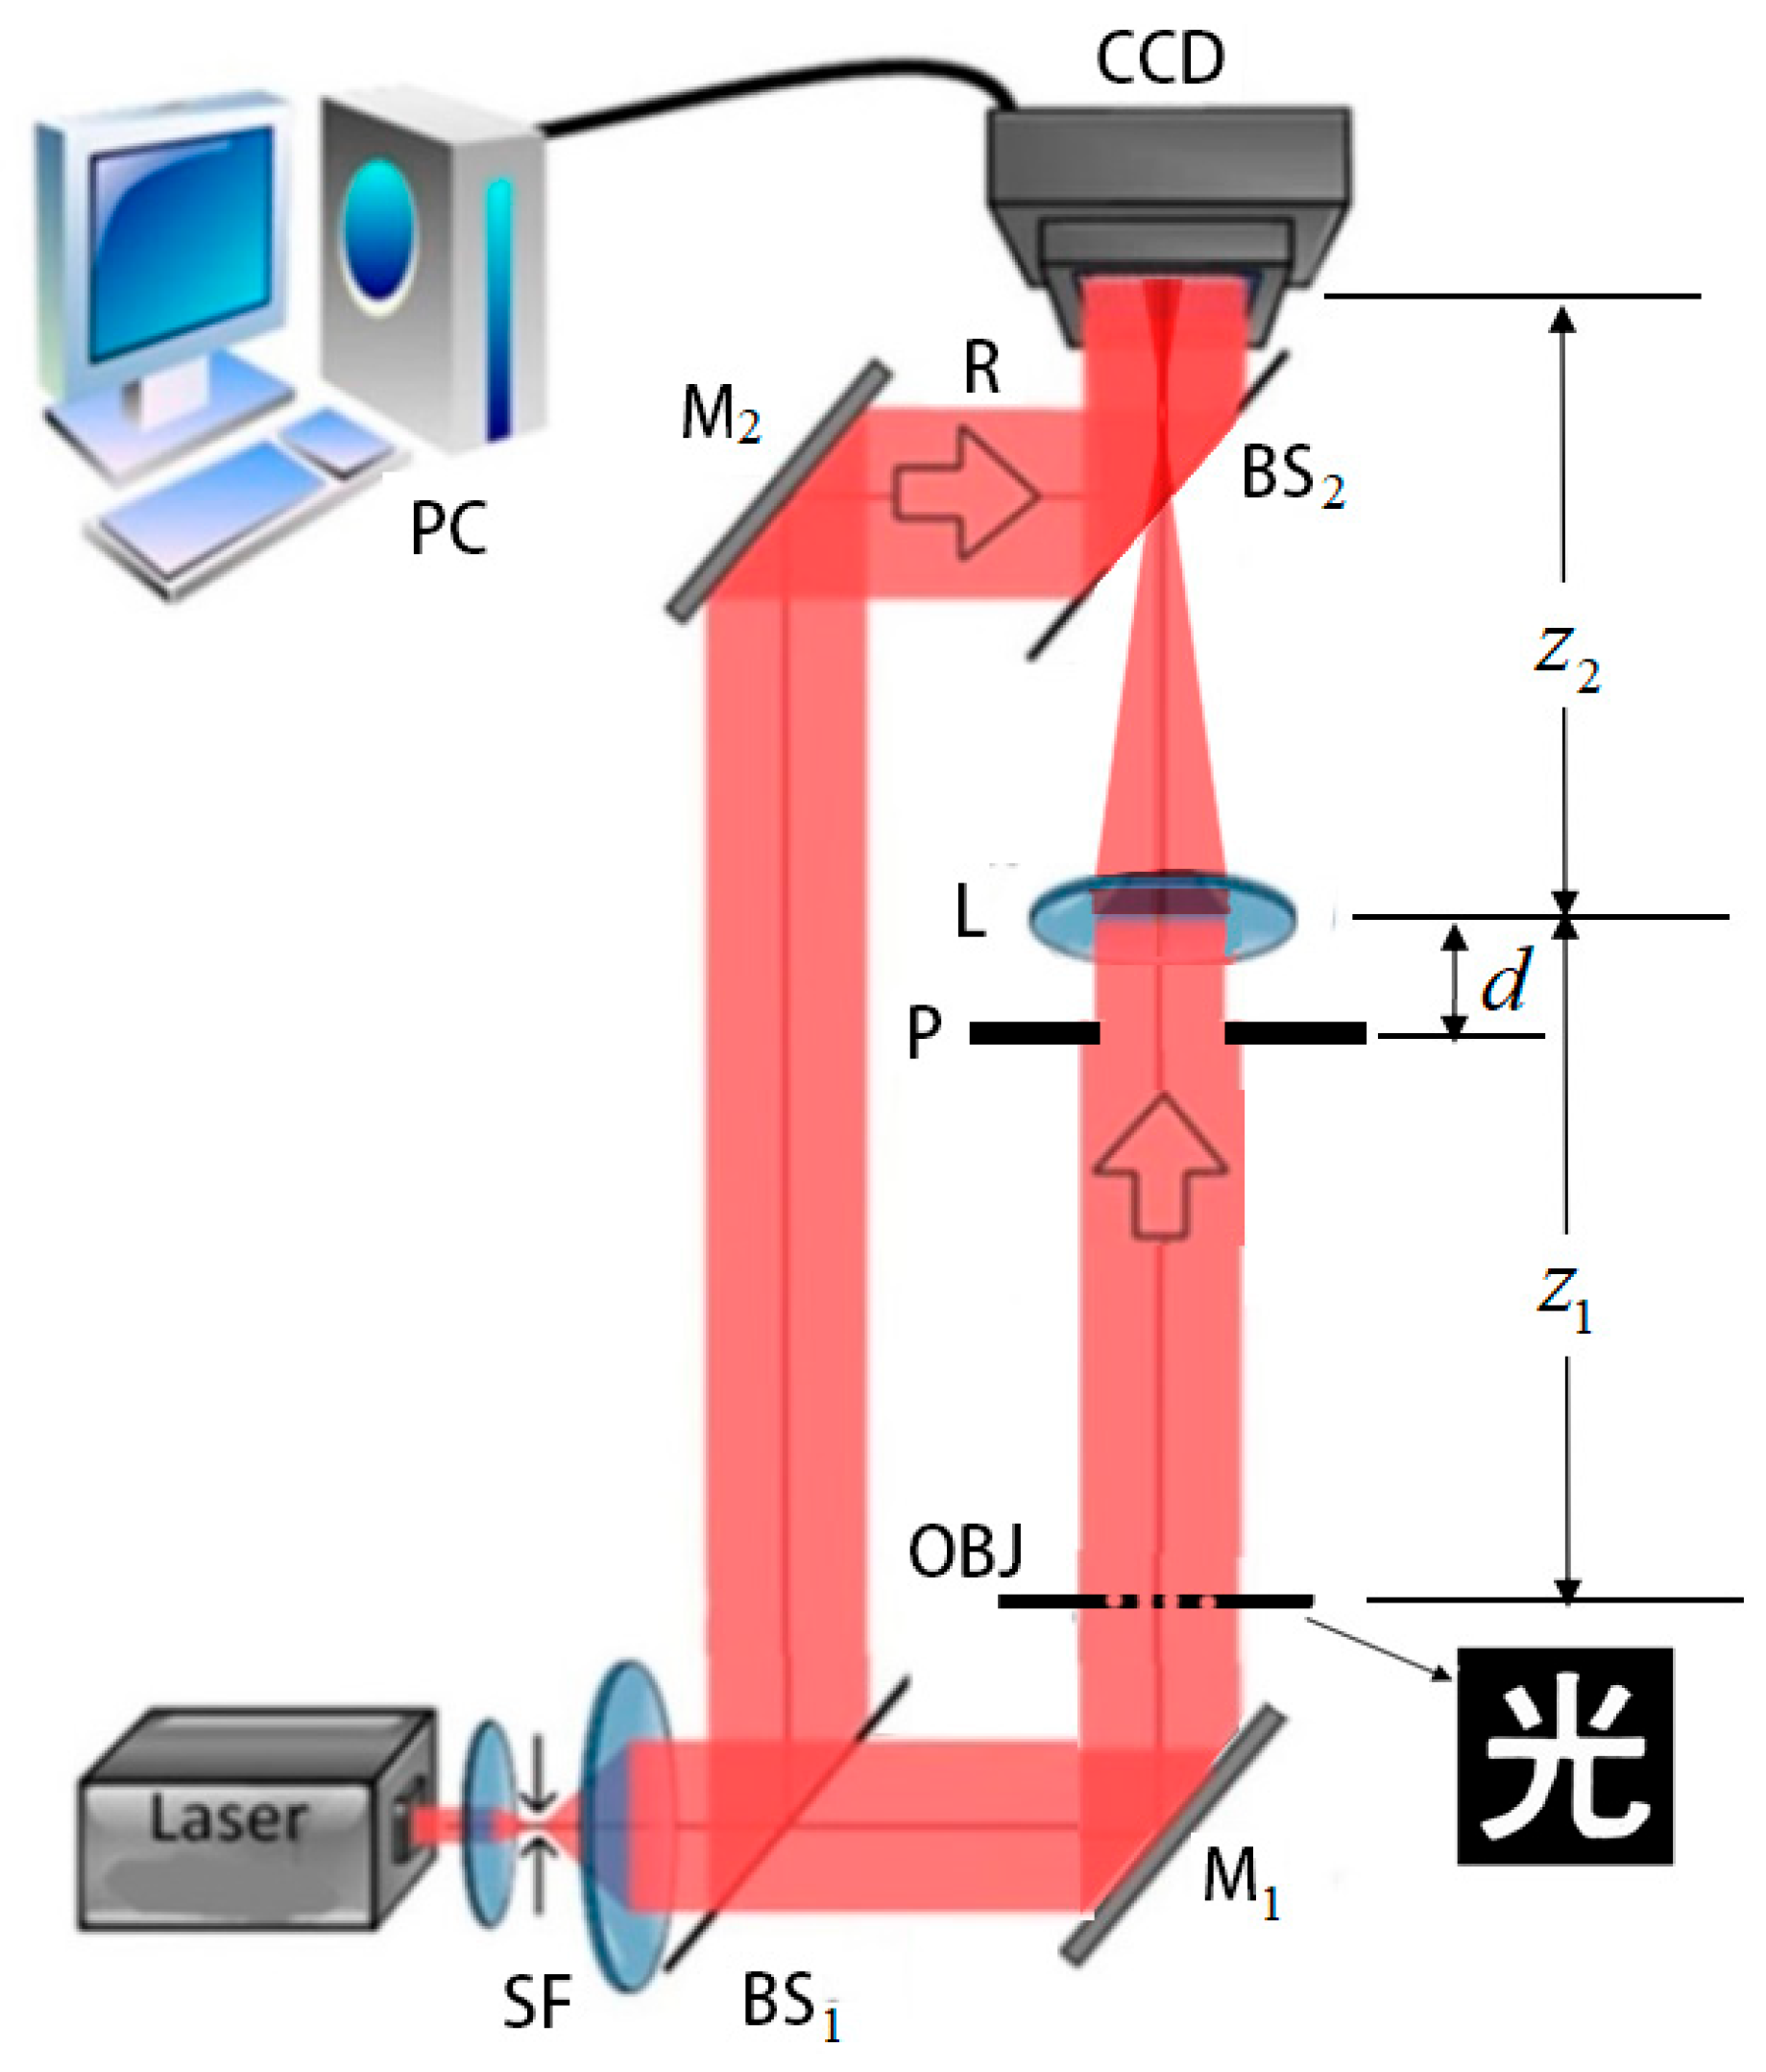
To validate the findings of this paper, we conducted a digital holographic experiment. The optical path of the experimental system is shown in
Figure 2. In the figure, a HeNe laser (200 mw) with a wavelength of
passes through a spatial filter (Daheng Optics, Beijing, China) and beam expander system, SF, to become a plane wave, which is then directed toward the beam splitter, BS1 (Daheng Optics, Beijing, China). The light waves passing through BS1 are reflected by the plane mirror, M1 (Daheng Optics, Beijing, China), and illuminate the object plane, OBJ. The object plane is formed by a transparent aperture in the shape of the Chinese character for “light” (光). The light waves passing through the aperture are imaged on a CCD (Point Grey, Wilsonville, OR, USA) detector controlled by a microcomputer PC via the imaging lens, L, and the beam splitter, BS2. The focal length of the convex lens L is
, and the aperture is 75 mm. To verify whether the derived formulas are unaffected by the size of the incident light pupil, a circular aperture diaphragm, P, with a diameter
is placed at a distance
in front of the lens. The reference light for the digital holographic system comes from the reflective surface of beam splitter BS1. This light beam is reflected by mirror M2 and beam splitter BS2 before reaching the CCD. (The light waves passing through lateral beam splitter BS2, which are irrelevant to the theoretical study, are omitted in the figure.) In the experimental study, the object distance
and the image distance
, i.e., the magnification ratio
. Two off-axis digital holograms were recorded by the CCD with and without the diaphragm, P.
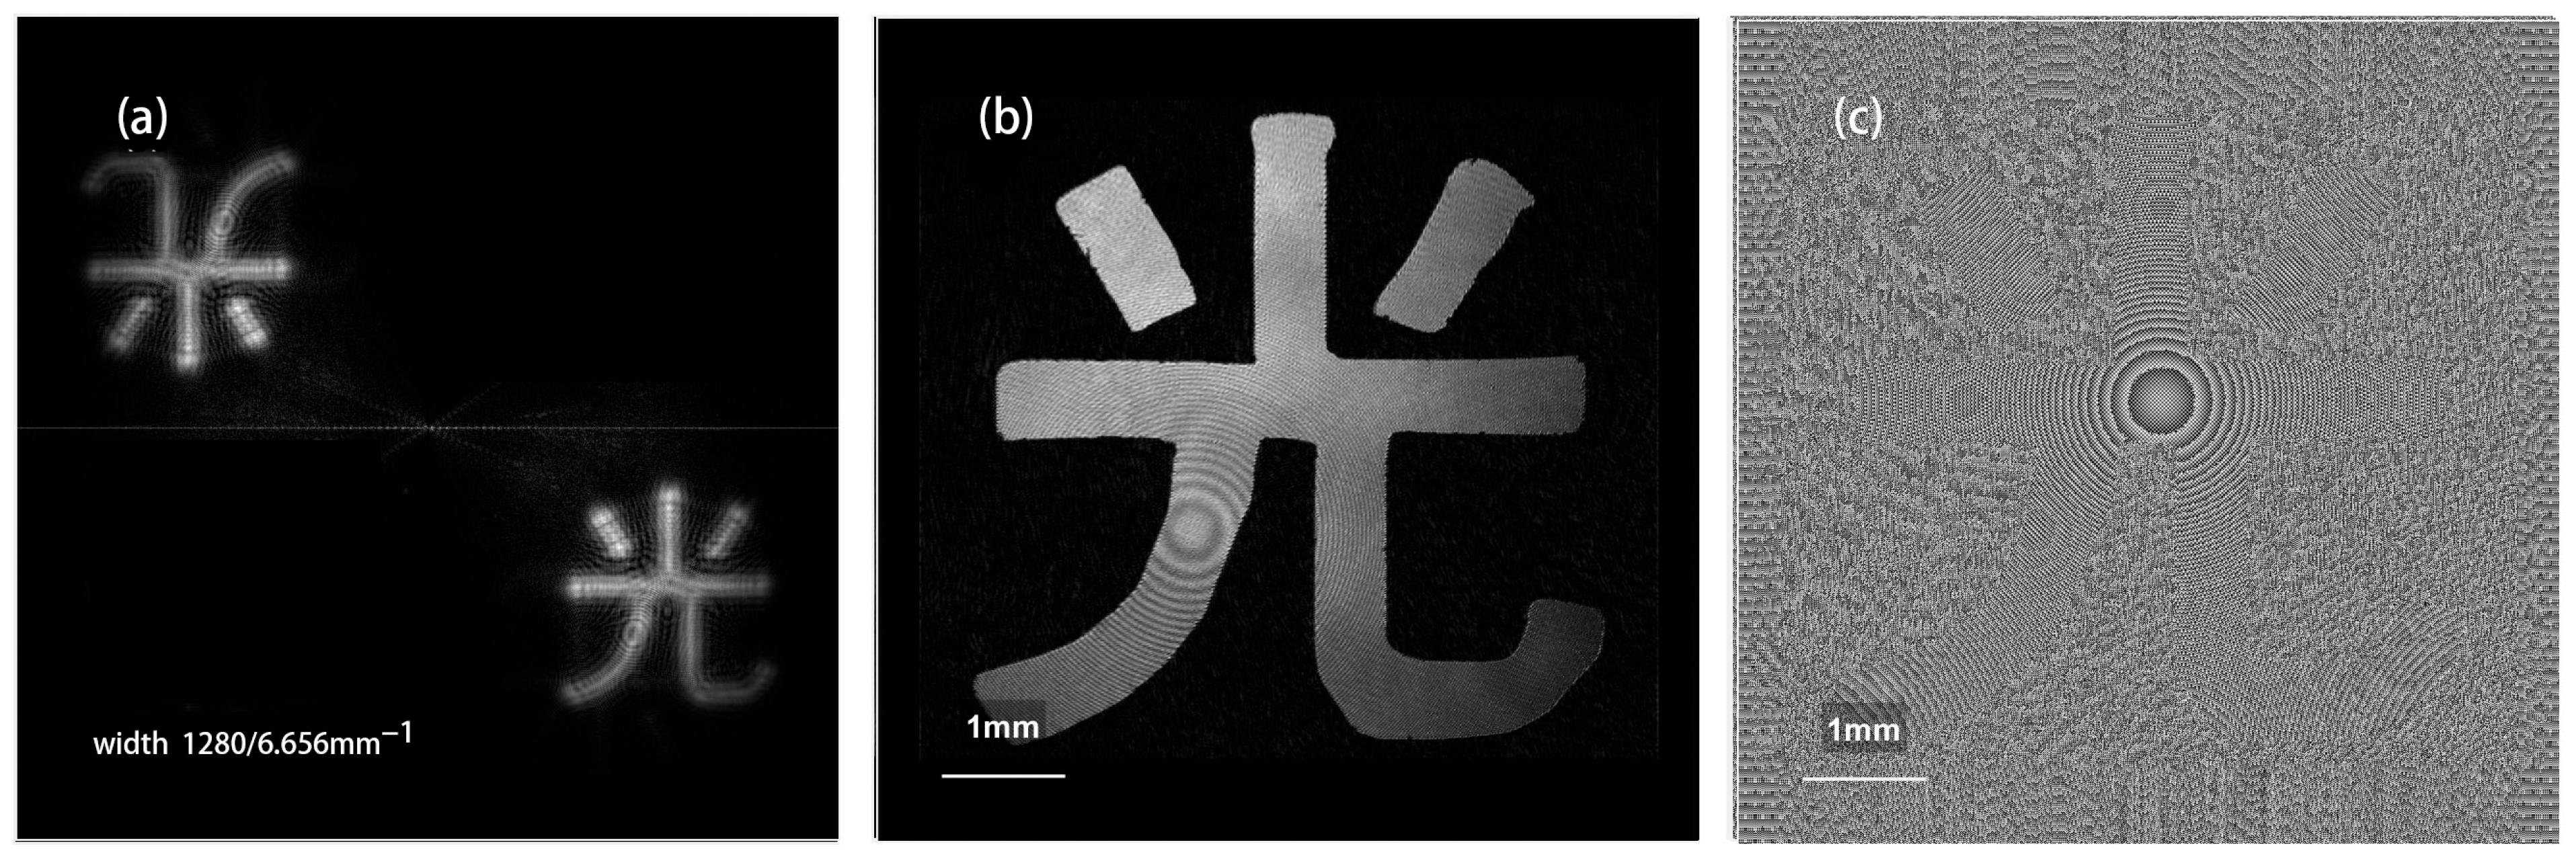
The pixel width of the experimental CCD is 0.0052 mm, with a pixel count of 1280 × 1024. When processing the experimental data, zero padding is used to transform the hologram into a square hologram with a width of 1280 pixels and a width of
Li = 6.656 mm. After processing the hologram to eliminate zero-order diffraction interference [
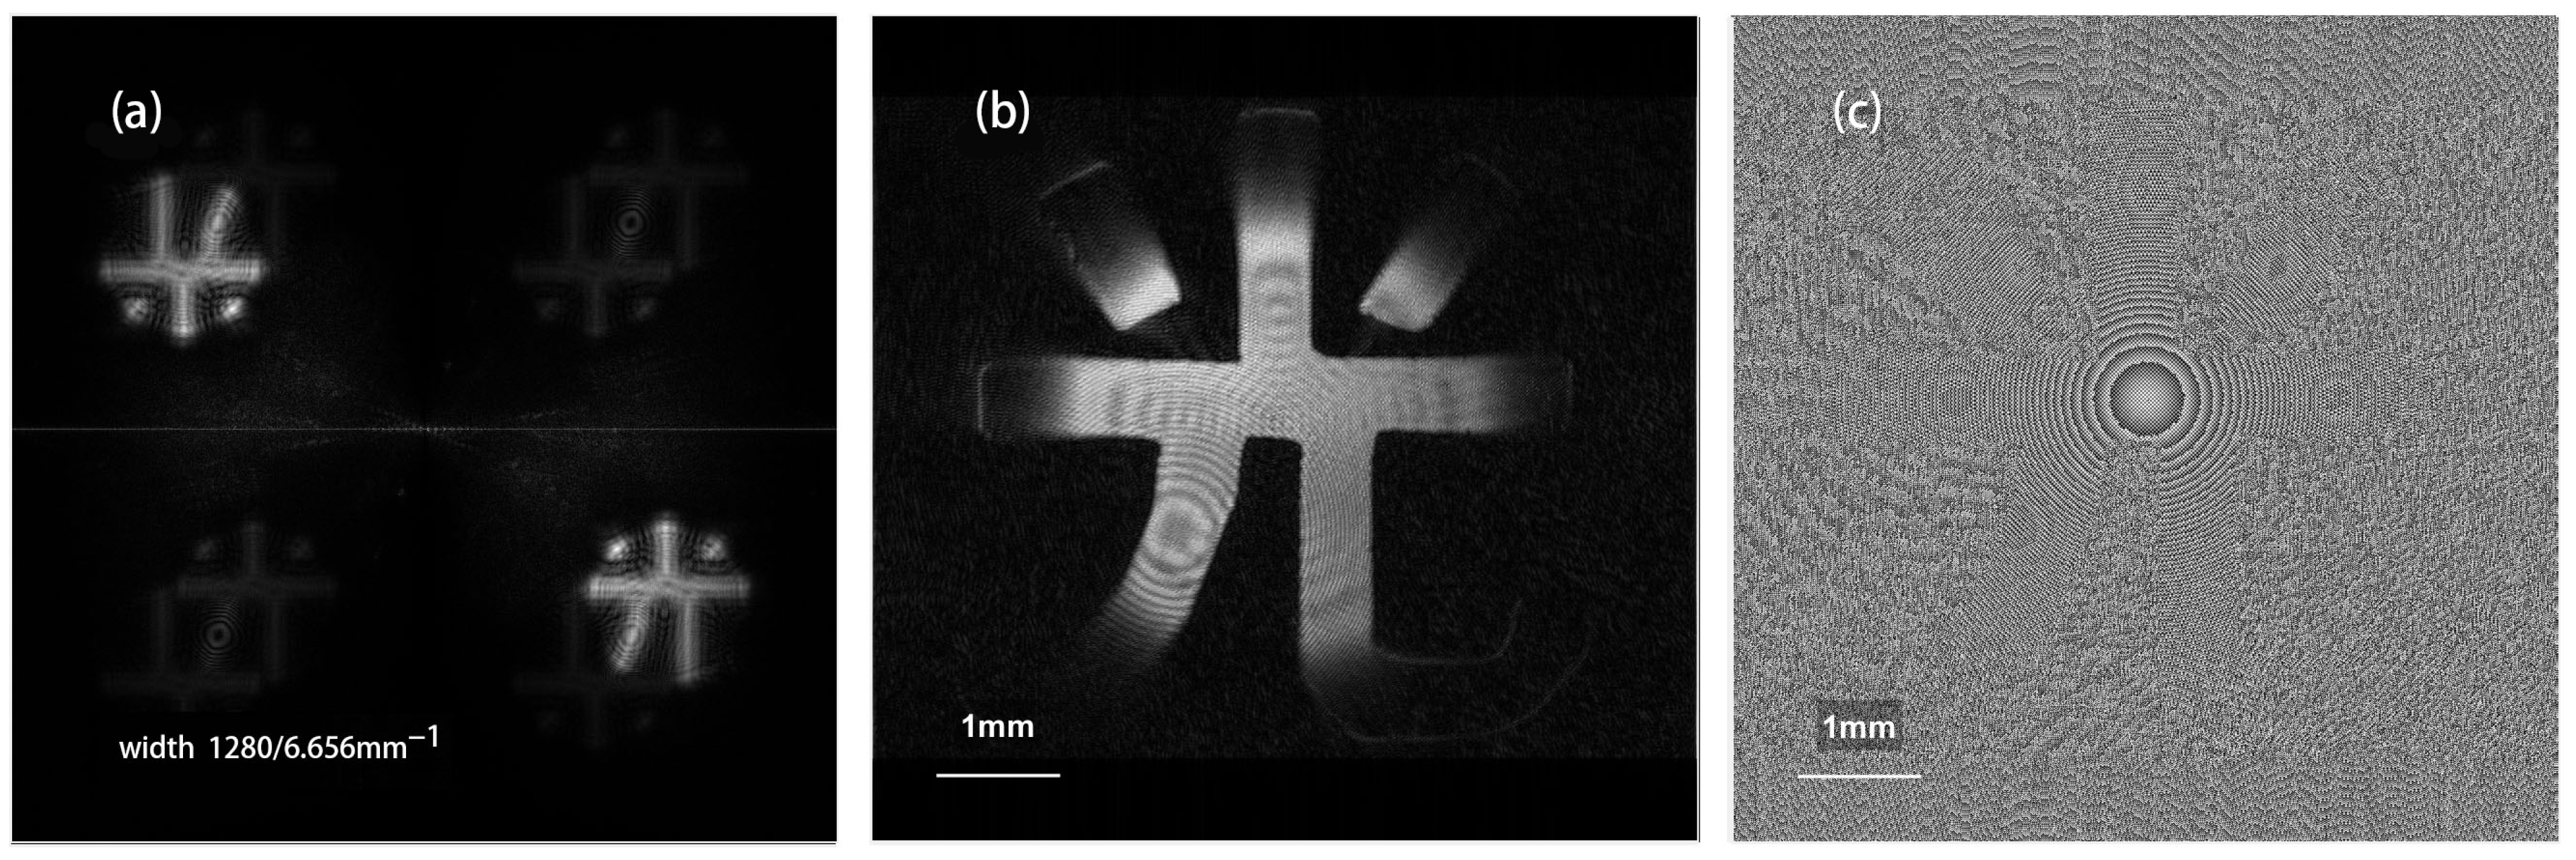
1], the spectrum image is obtained by the Fast Fourier Transform (FFT), as shown in
Figure 3a. After extracting the spectrum from the lower right corner, the reconstructed image of the amplitude of the image light field is obtained by the Inverse Fast Fourier Transform (IFFT), as shown in
Figure 3b, and
Figure 3c shows the phase distribution image of the image light field.
In order to use FFT to simulate the three formulas derived above, the diameter of the filter window with diaphragm P is first calculated. According to
Figure 2, the exit pupil is the image formed by diaphragm P through lens L, located 52.94 mm below the lens, and the diameter of the exit pupil is
Dp = 9.41 mm. Thus, the distance between the exit pupil and the image plane is
dpi = 502.94 mm, and the diameter of the filter window formed by the spectral plane
. Because the spectral plane width is
pixels, the filter window is
diameter in pixels.
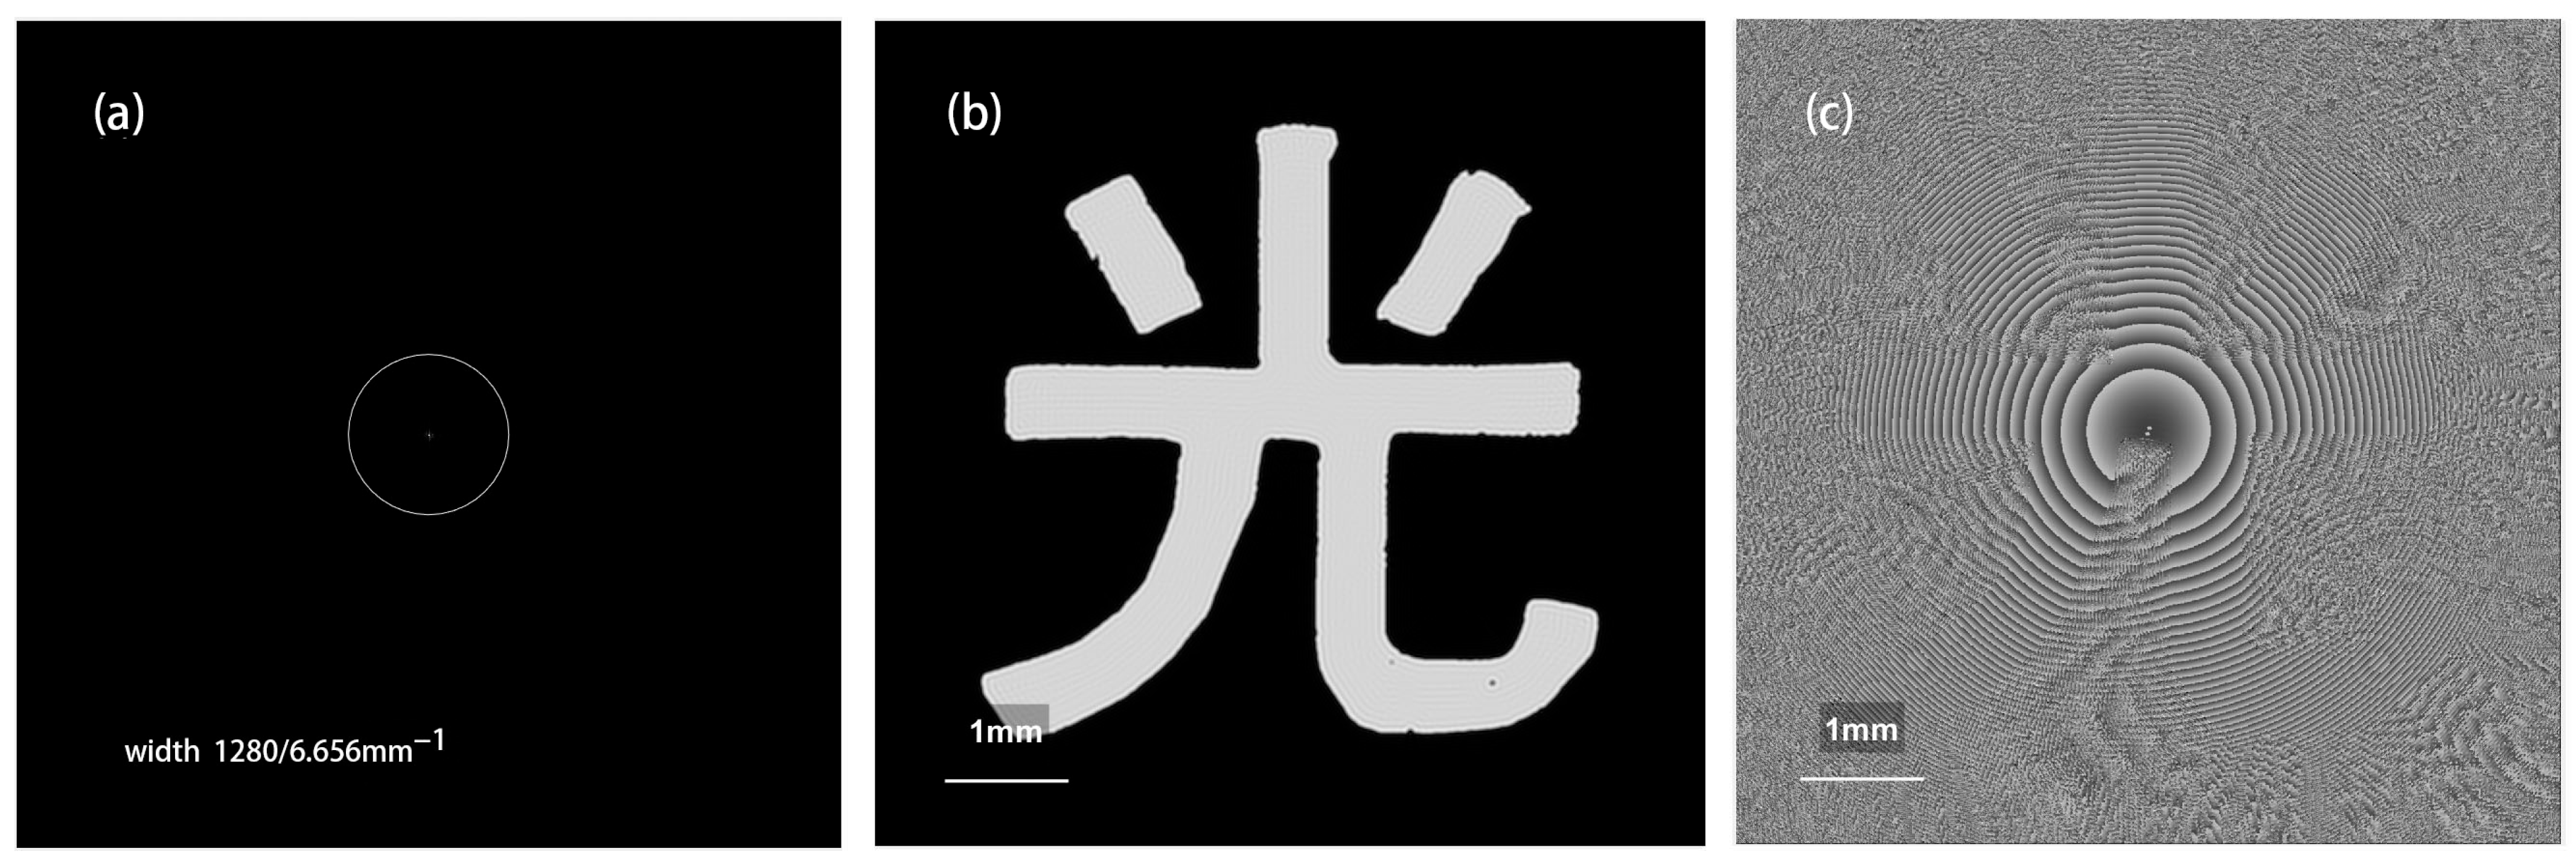
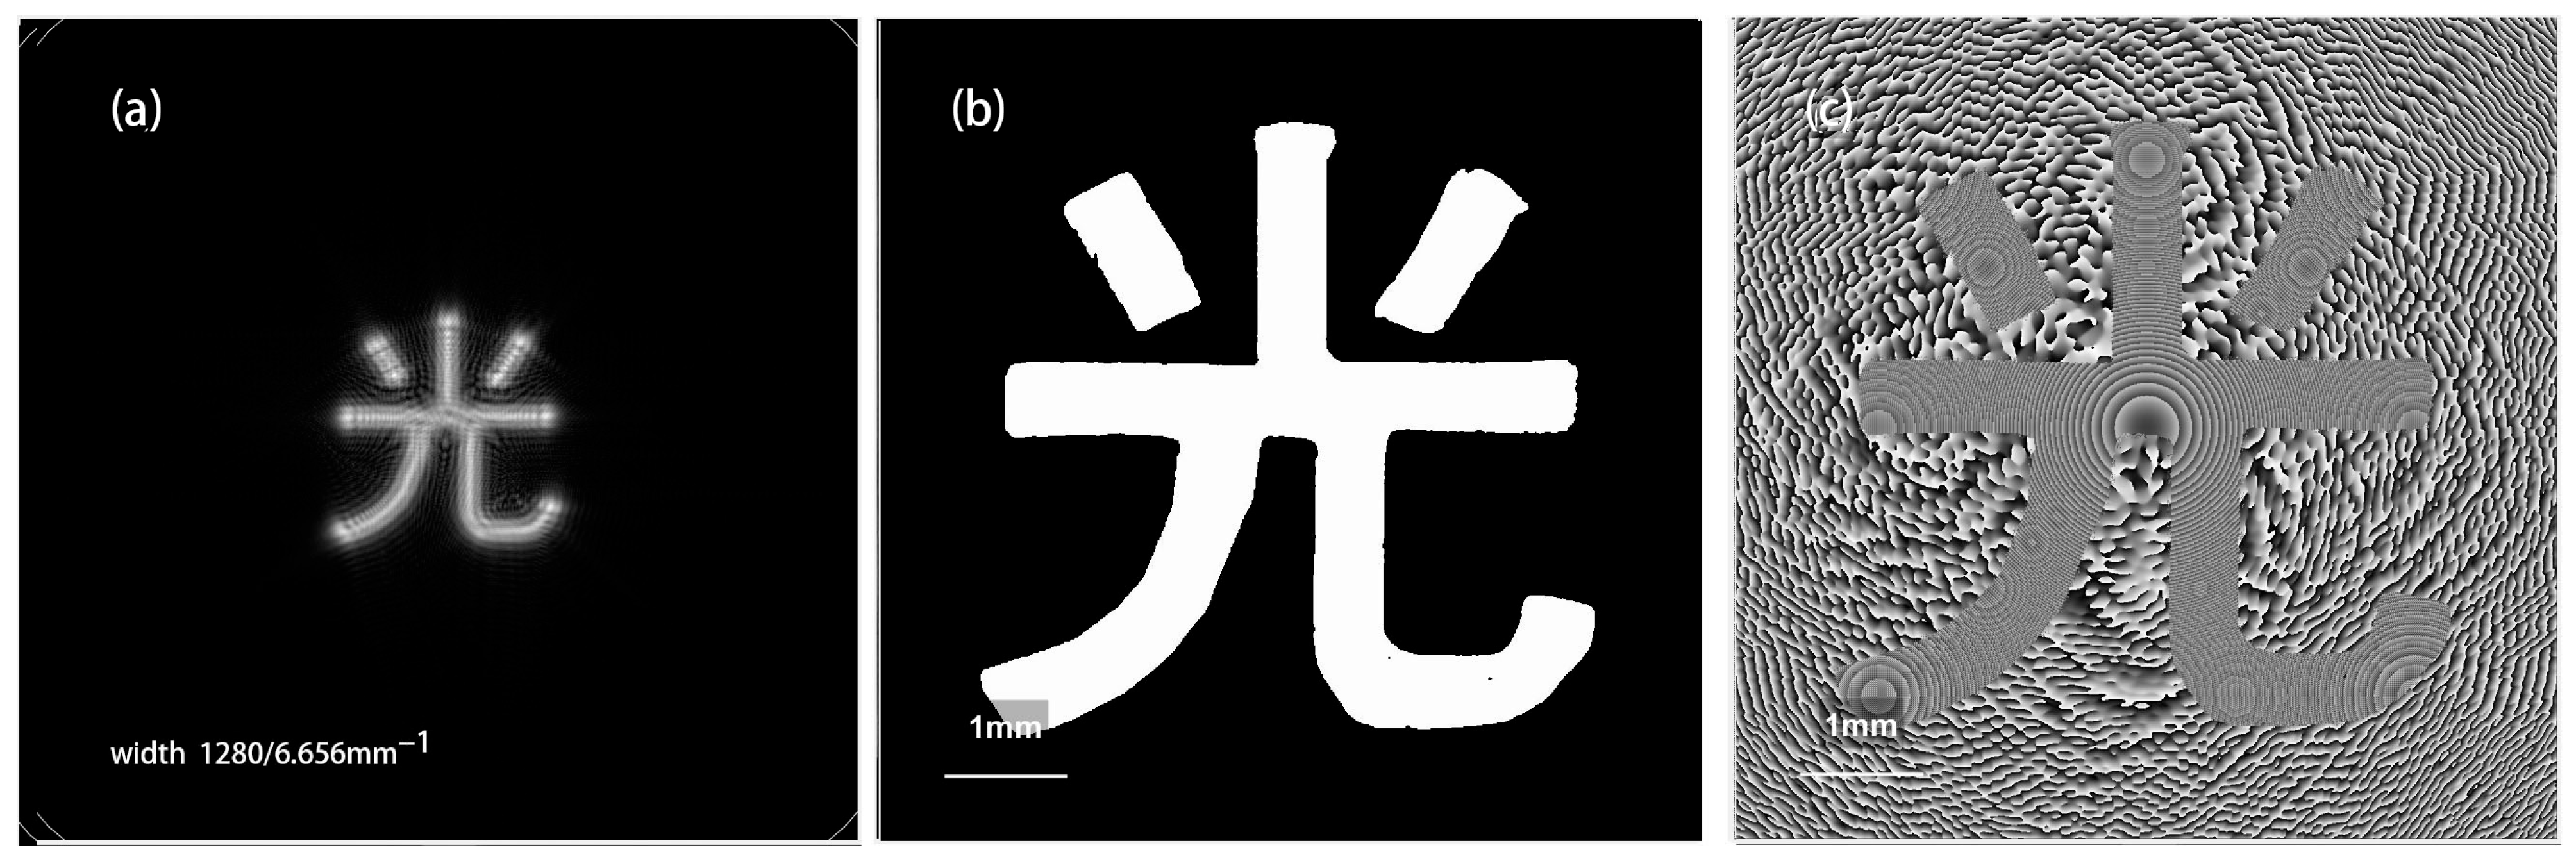
A theoretical simulation image of Equation (
10) with the diaphragm is shown in
Figure 4.
Figure 4a is a spectral amplitude image of the ideal image with a secondary phase factor in Equation (
10), where the ring is a filter window formed by the transfer function. The imaging light field amplitude obtained by inverse Fourier transformation based on the spectrum within the filter window is shown in
Figure 4b, and its phase image is shown in
Figure 4c. It can be seen that the spectral amplitude image of the ideal image with a secondary phase factor is similar to the Fresnel diffraction image with a distance of
. Because the “spatial filtering” effect of the transfer function window makes the reconstruction look like an incomplete image, the physical significance of the transfer function discussed above is a good proof. A comparison with
Figure 3 shows that the theoretical simulations yield excellent agreement with the experimental measurements.
According to the experiment with diaphragm P, the use conditions of Equation (
5) are not met.
Figure 5 shows a simulated calculation image using Equation (
6).
An analysis of
Figure 5 shows that the amplitude image of the simulated image does not match the experimental measurements. Since the exit pupil in the calculation process of Equation (
6) is a low-pass filter of the ideal image, the image obtained after Fourier transformation is a complete image that has lost some high-frequency components. Although Equation (
6) can calculate the phase distribution of the image light field, it cannot accurately obtain the same phase as the experimental measurements (
Figure 3c). A quantitative analysis will be performed later.
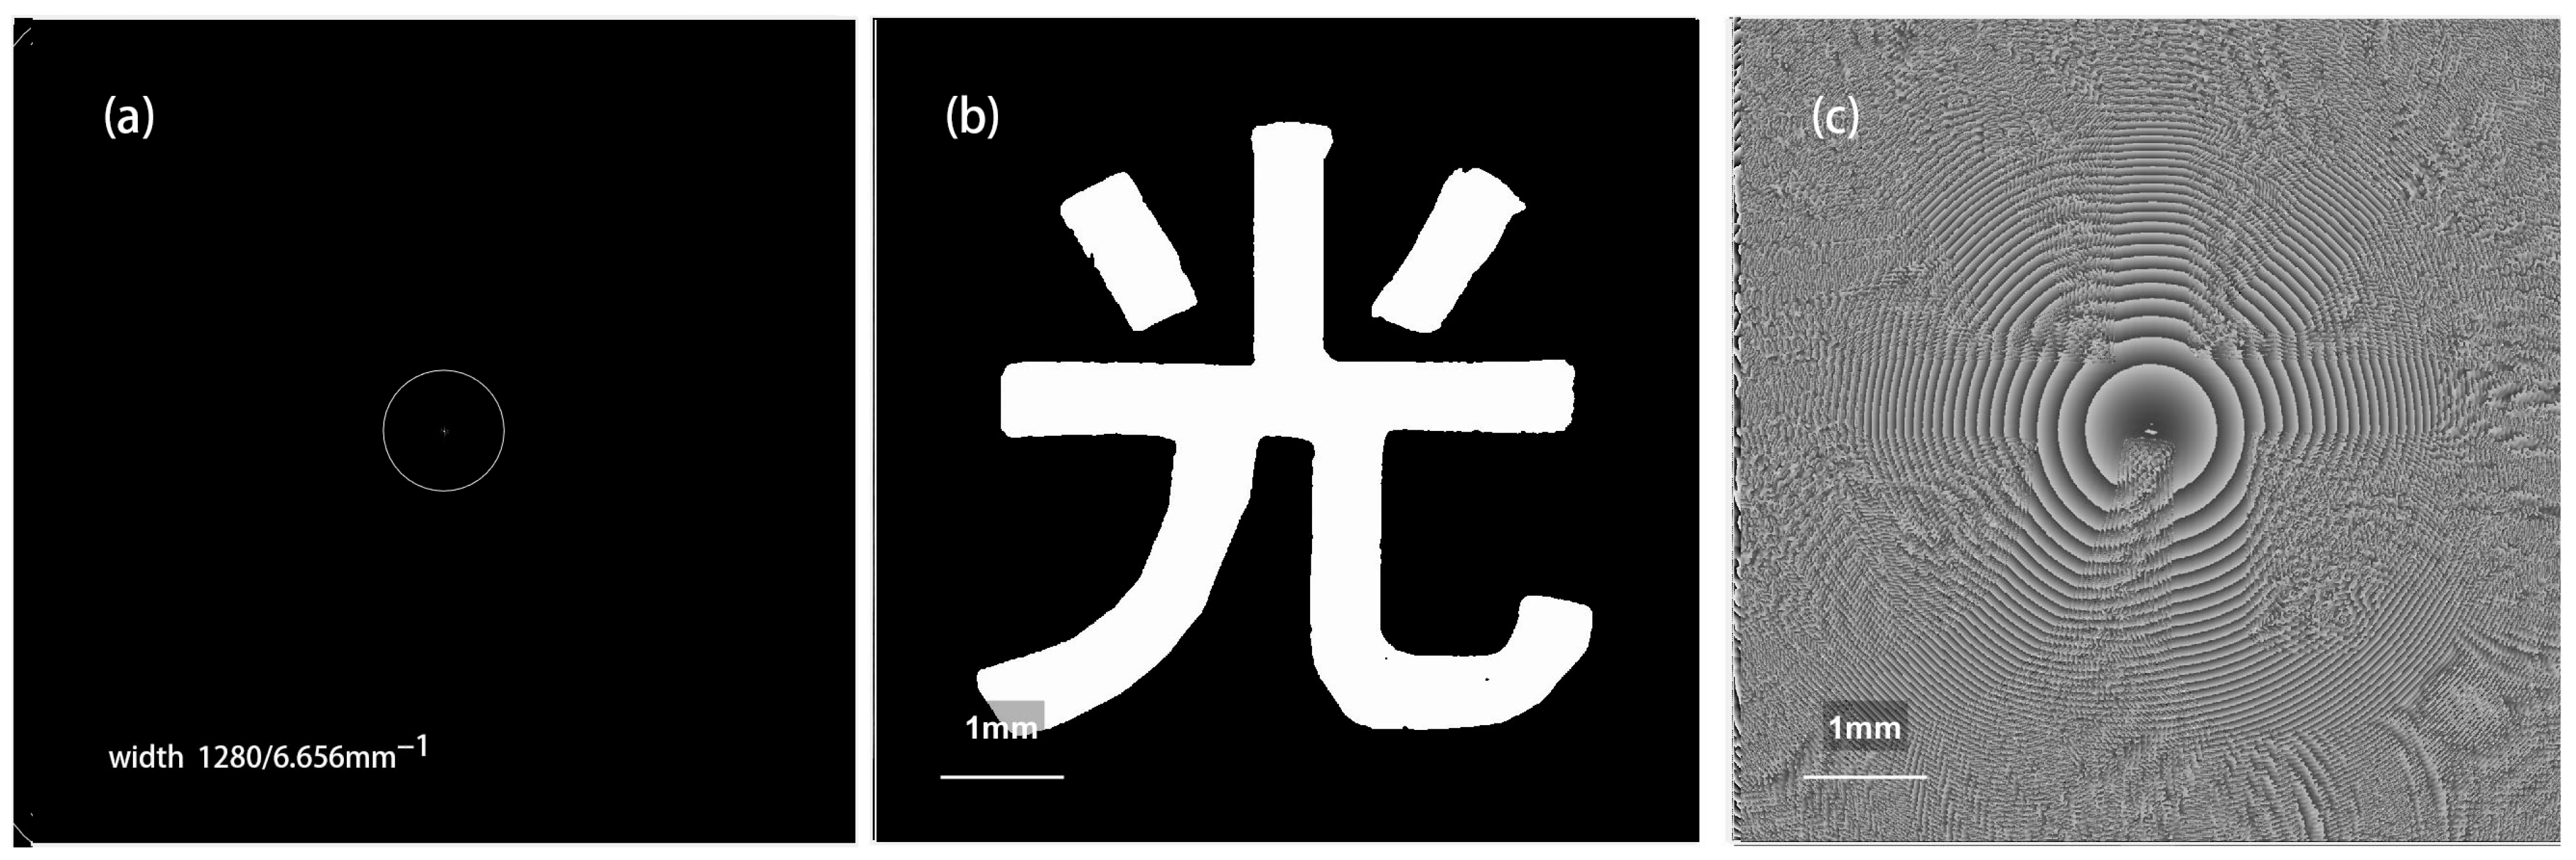
Figure 6 shows the reconstructed image of the digital hologram without diaphragm P. Specifically; the spectral images obtained by using FFT are shown in
Figure 6a. After removing the lower right frequency spectrum, the image of IFFT is obtained, as shown in
Figure 6b, and
Figure 6c is the phase distribution image of the image light field.
When there is no diaphragm P, the 75 mm diameter lens pupil essentially meets the usage conditions of Equation (
5), allowing the image light field to be simulated using three separate formulas. Since the exit pupil is the same as the lens pupil at this point, the distance from the exit pupil to the image plane is
dpi = 450 mm, and the filter window diameter is 1754 pixels, which is greater than the calculated plane width. Therefore, all numerical values from the spectral plane can be directly used for calculations in all three formulas.
Figure 7 shows a simulated calculation image using Equation (
10). It is evident that the amplitude and phase of the reconstructed image are in excellent agreement with the experimental image in
Figure 6.
Figure 8 shows theoretical simulation images using Equations (
5) and (
6), where (
Figure 8a) and (
Figure 8b) are the spectrum of the ideal image and the amplitude of the reconstructed image, respectively, and
Figure 8c is the phase image simulated by Equation (
6). Compared with
Figure 6, it can be seen that the three formulas can simulate the amplitude distribution of the imaging light field quite well.
To quantitatively assess the differences between the phase distributions simulated by Equations (
6) and (
10) and the experimentally measured values, we examined the phase within the horizontal line range of the transmitted light hole image. We counted the number of stripes showing phase changes in
Figure 6c,
Figure 7c and
Figure 8c, yielding the following results: 60 stripes in
Figure 6c, 58 stripes in
Figure 7c, and 26 stripes in
Figure 8c. Since the phase change value between adjacent lines is 2π, compared to Equation (
6), Equation (
10) yields phase values that better align with experimental measurements. Therefore, Equation (
10) can accurately calculate the amplitude and phase of the image light field.
5. Experimental Techniques for Accurately Obtaining the Complex Amplitude of the Object Light Field
In digital holographic detection research, accurately obtaining the amplitude and phase of the object plane light wave field through digital holograms is equally important. Over the past decade, significant progress has been made in optical frequency shifting technology, which uses illumination light with different phase structures to illuminate objects in order to improve the amplitude resolution of reconstructed images [
17,
18]. However, it is not difficult to see from Equation (
10) that if the illumination light is represented by function
, Equation (
10) can be rewritten as
This means that digital holographic reconstruction images will introduce amplitude and phase interference from the illumination light, which is inconvenient for phase-sensitive optical detection. Here, we introduce the technique we proposed in reference [
9] to eliminate this interference.
If the exit pupil of the optical system is sufficiently large, transfer function
in Equation (
12) can be simplified to
If there are no objects on the object plane, then the image formed by the illumination light on the image plane is simplified to
from the above two equations, we obtain
This means that when performing digital holographic inspection using structured light illumination, an “Null-object digital hologram” can first be recorded without the inspection object. Using this hologram, image
of the illumination light can be obtained. Subsequently, the inspection object is placed, and after obtaining
using the hologram, the image light field can be obtained using Equation (
15), facilitating the accurate determination of the amplitude and phase of the object light field. Since Equation (
15) has been experimentally validated [
9], for simplicity,
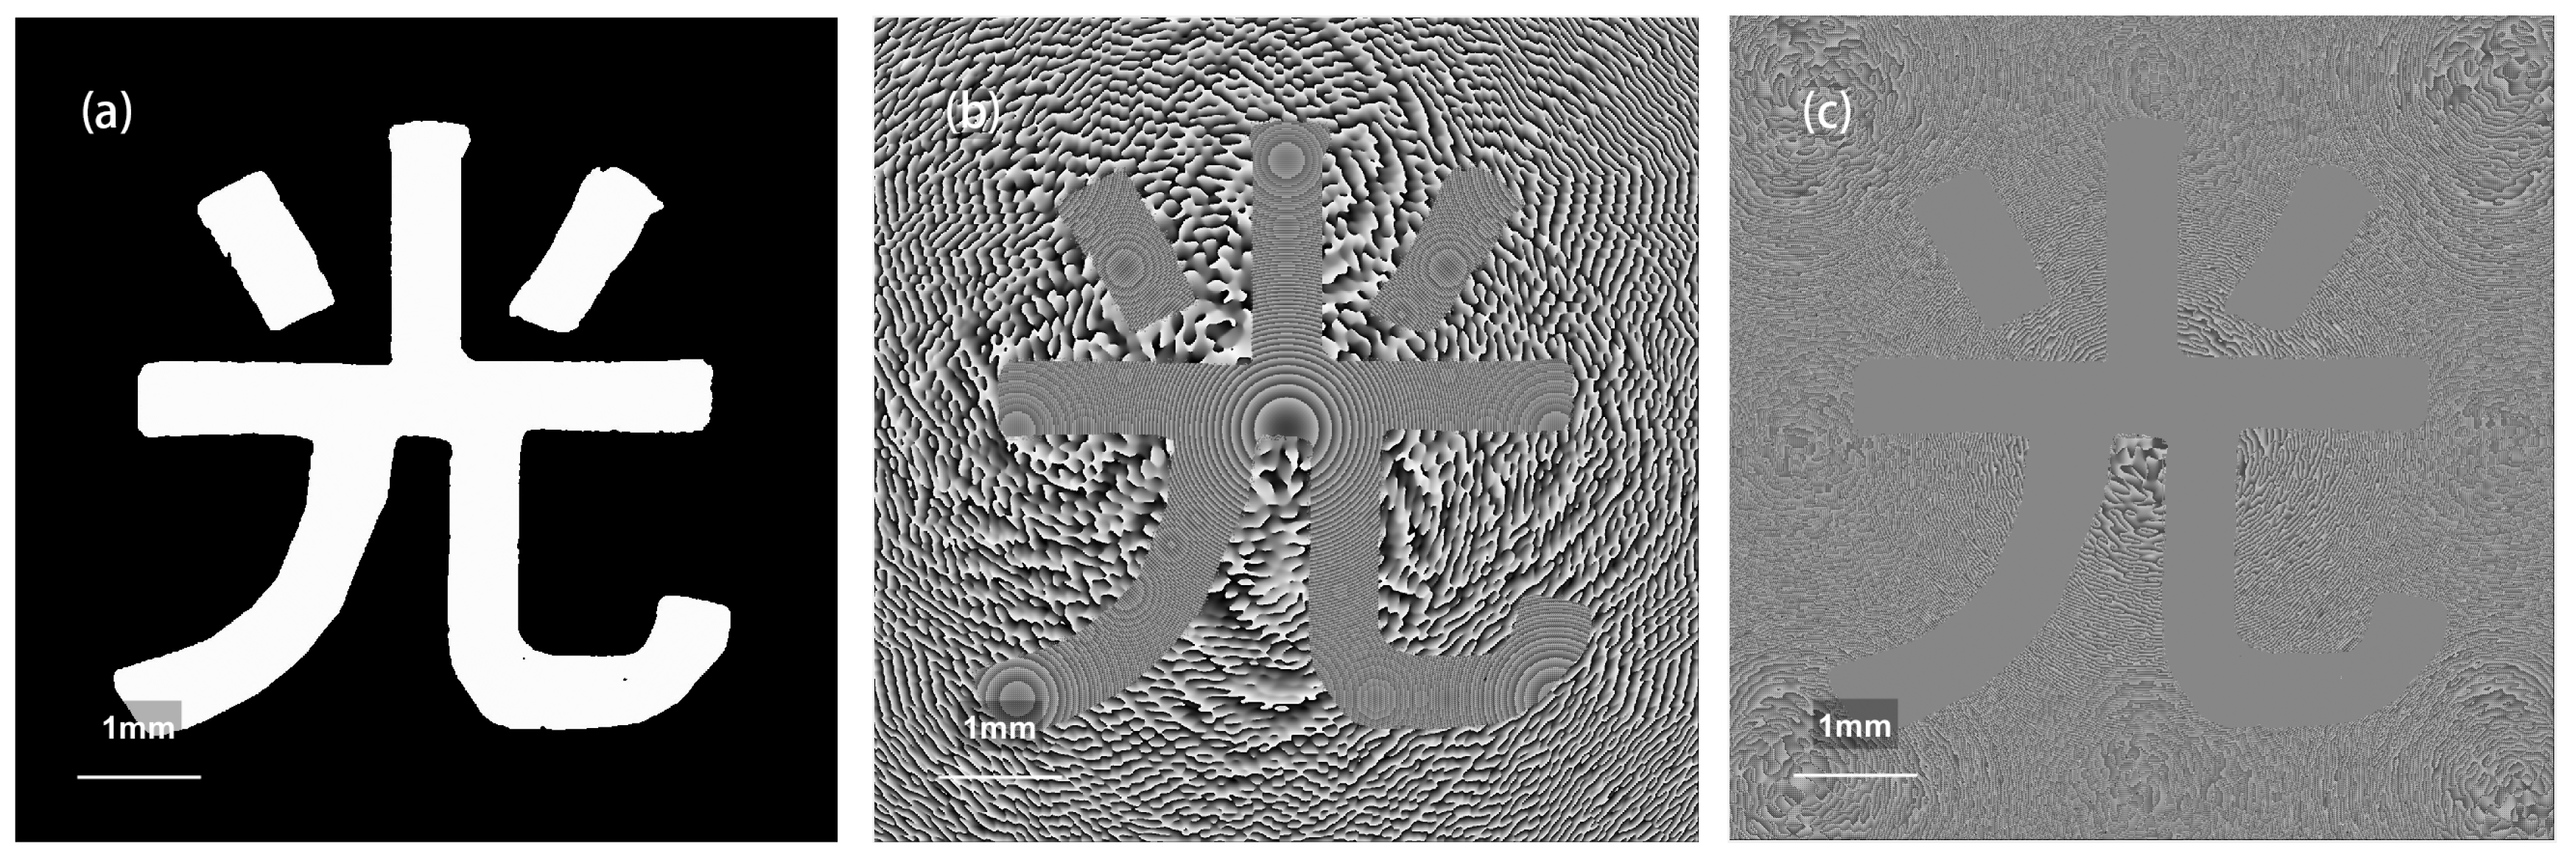
Figure 9 shows a theoretical simulation example of the optical system in
Figure 2 without diaphragm P.
Figure 9a,b show the amplitude and phase distribution images of the image light field obtained using a hologram. Since the object plane is formed by the “光” character, the transmission holes should have an equal phase distribution. However,
Figure 9b clearly shows a spherical wave phase distribution influenced by the illumination light and the imaging components of the imaging system, which does not match the actual situation. However, after obtaining the illumination light image light field without an object through numerical simulation, the accurate phase image in
Figure 9c can be obtained using Equation (
15).
6. A Study on the Amplitude Resolution of Light Fields in Different Regions of a Plane Image
Based on the theoretical analysis of Equation (
10), coherent optical imaging systems are no longer linear space-invariant systems. To clearly verify this conclusion, we follow the suggestion in reference [
9] and replace the object plane in the experimental system shown in
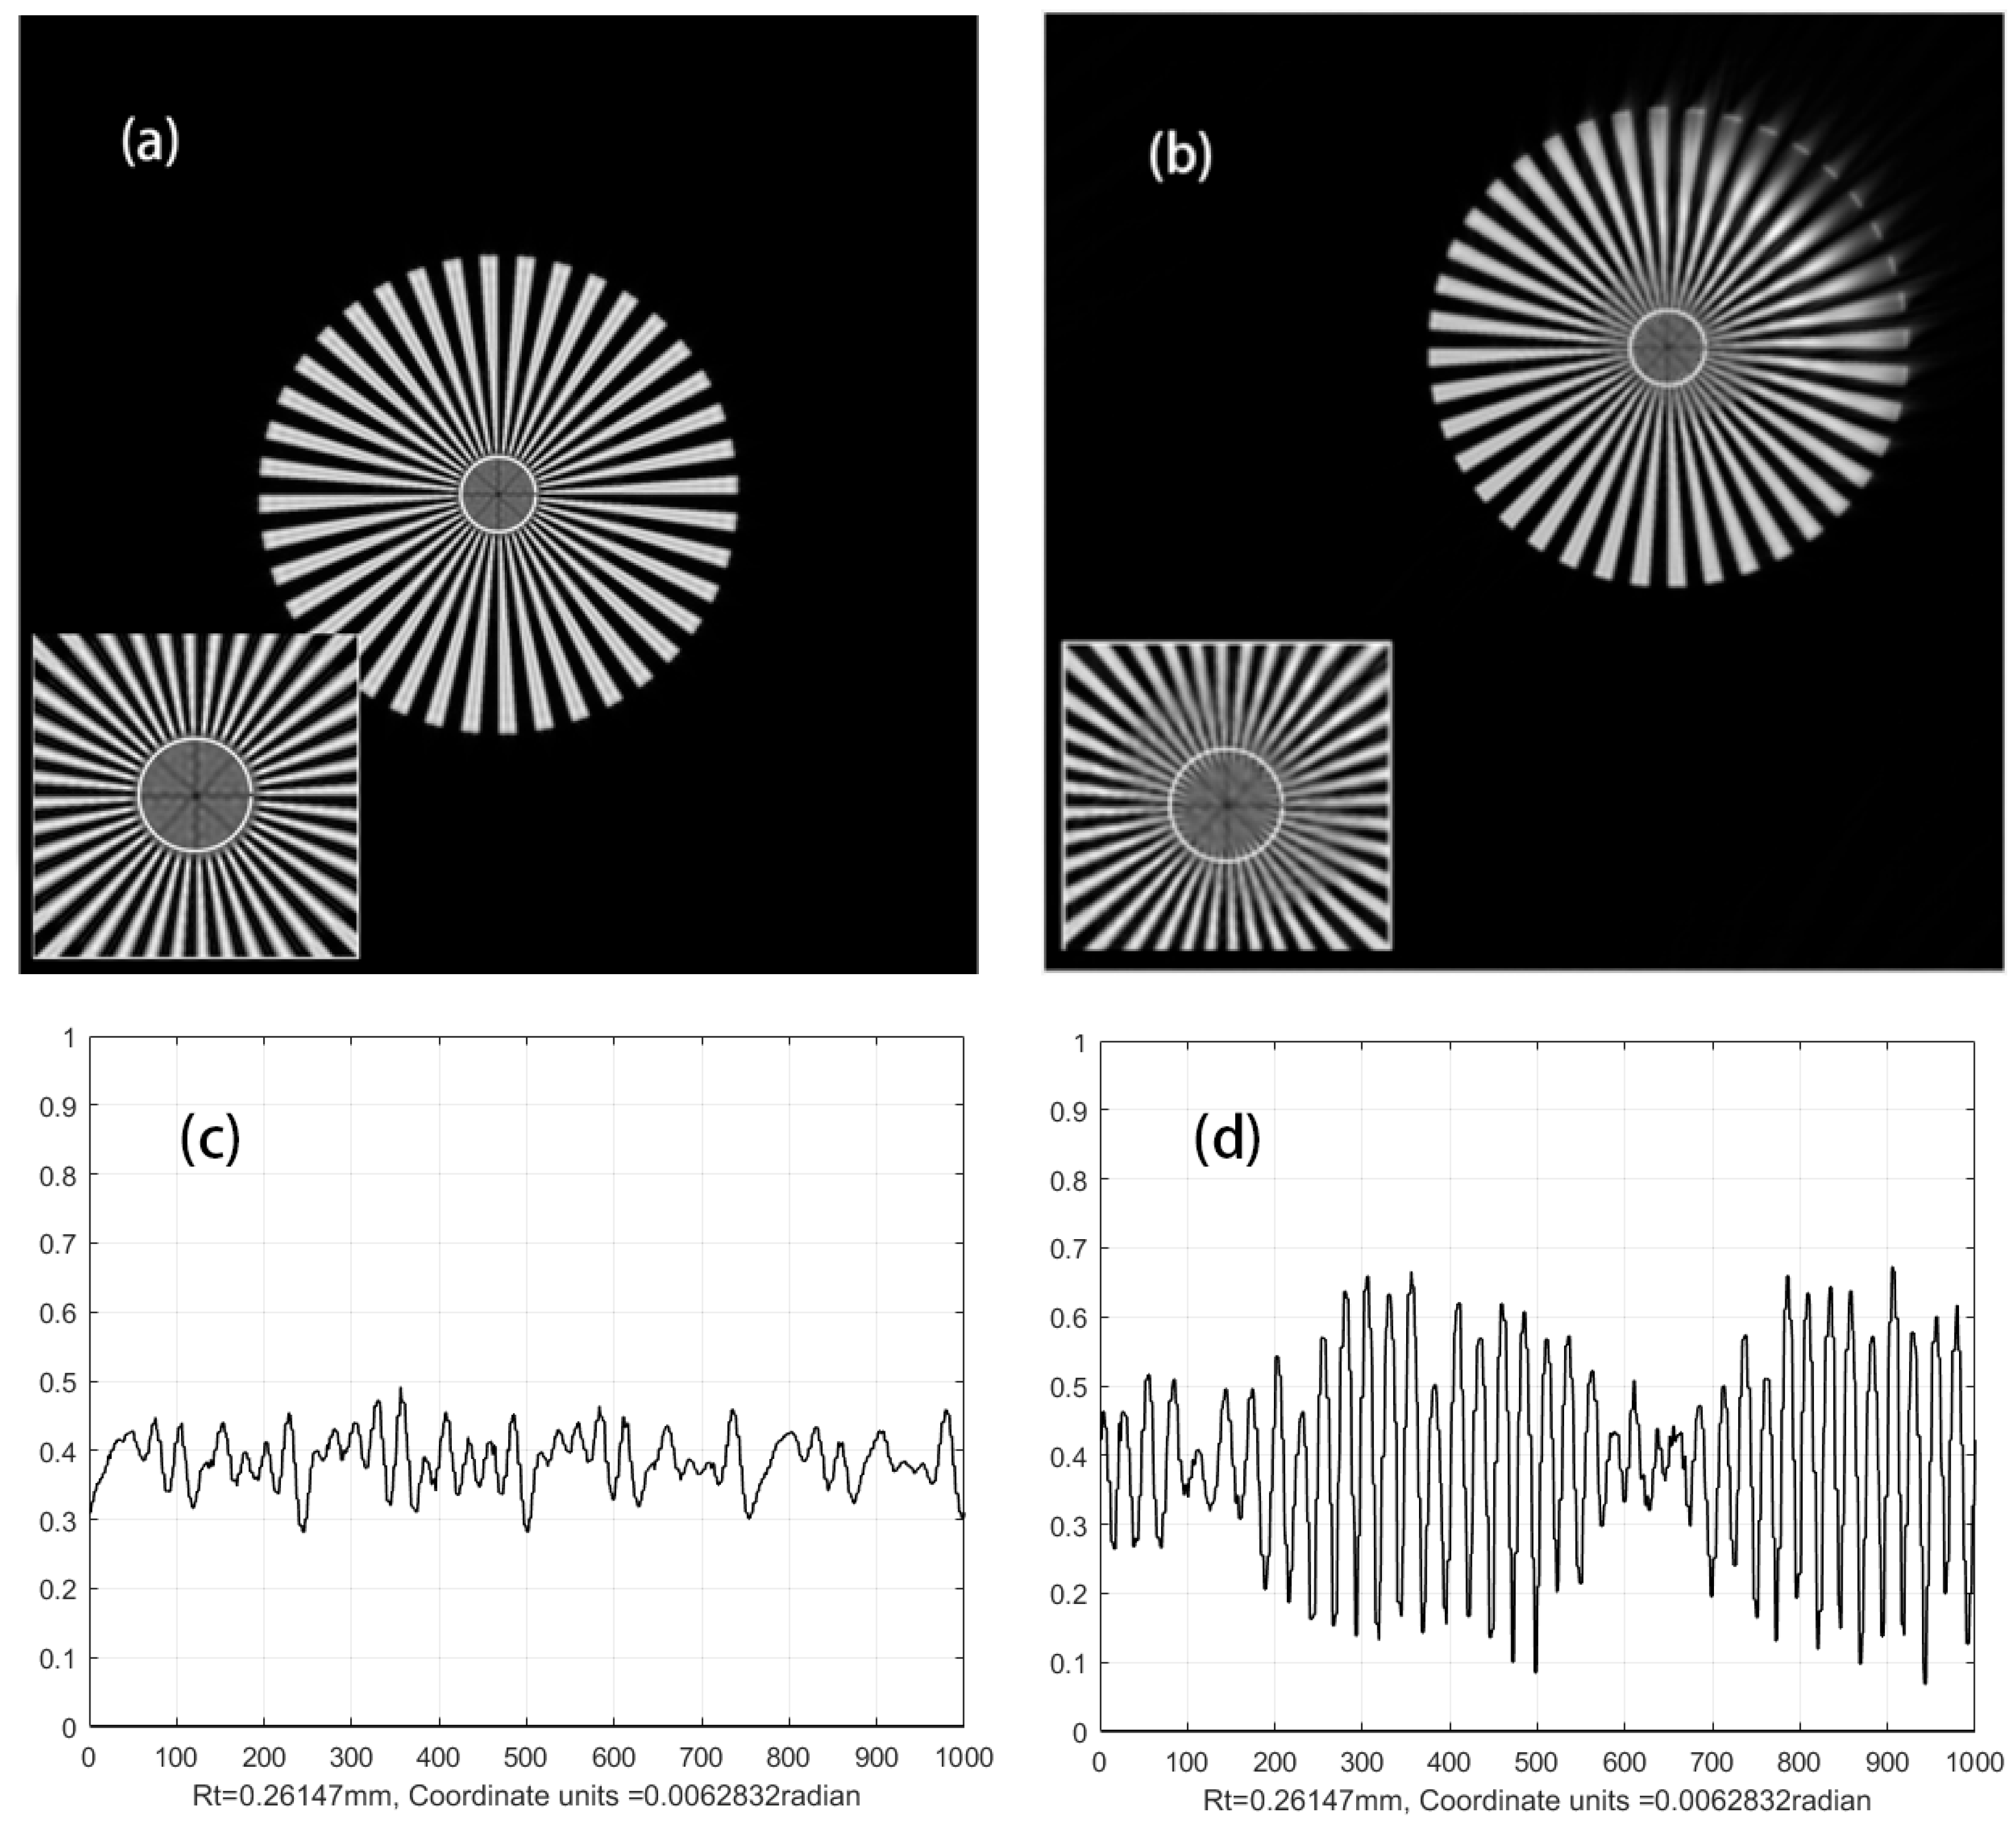
Figure 2 with a 40-petal Siemens star while retaining diaphragm P. We then perform theoretical calculations on the image light field of the Siemens star’s center, both on the optical axis and off the optical axis. The theoretical simulations indicate that the amplitude resolution varies across different regions of the image plane, with the resolution increasing as the distance from the optical axis increases. As an example,
Figure 10 presents theoretical study images of resolution across different regions of the image plane.
Figure 10a,b show the amplitude distribution of the image field normalized to a grayscale range of 0–255 when the center of the Siemens star coincides with the optical axis and when the center coordinates of the Siemens star are (u = 1 mm, v = 1 mm). The lower left corner of each figure displays a magnified image of the observed region. To study changes in amplitude resolution, sampling rings with a radius of 0.26 mm were drawn on each image with the center of the Siemens star as the center.
Figure 10c shows the amplitude curve of the ring sampled counterclockwise along the right side of the ring in
Figure 10a, and
Figure 10d shows the amplitude curve of the ring sampled counterclockwise along the right side of the ring in
Figure 10b.
The improvement in image resolution deviating from the optical axis can be explained by the physical meaning of the coherent transfer function. For this experimental system, the circular hole-shaped transfer function is similar to the ideal image passing through a spatial filter window with a distance of Fresnel diffraction. If the image plane is regarded as a combination of several small pixels, the small pixels in the edge area have higher spectral values than those in the central area during imaging. In addition, due to the “Fresnel diffraction” of small pixels in the boundary area at a distance of , the low-frequency components of their spectrum are gradually blocked to a greater extent, and finally, the amplitude value of the image formed in the boundary area gradually decreases.
7. Discussion
In the theoretical study of coherent optical imaging [
12], given that the impulse response expression of the imaging system is a double integral of a relatively complex complex function, it is difficult to obtain a mathematical expression for the image light field that is convenient for calculation through superposition integration. In order to obtain a simpler calculation formula, Professor Goodman simplified the impulse response expression and derived a formula that can only calculate the amplitude distribution of the image light field. The work presented in this paper can be regarded as solving a challenging mathematical problem proposed by Professor Goodman over 50 years ago.
Since Professor Goodman’s impulse response is derived from the Fresnel diffraction integral, we recently directly tracked the spatial propagation of light waves through the imaging system using the Fresnel diffraction integral [
19] and derived the same calculation formula as in Equation (
10).
In laser application research, formulas capable of calculating the complex amplitude of an image light field are not only important theoretical research tools for microscopic digital holography but also hold significant importance in application studies related to coherent optical imaging. As far back as the 1980s, when we used the formula derived from reference [
12] to study an infrared strong laser transformation system with a wavelength of 10.6 μm, we had to artificially introduce the phase of the image light field to approximately describe the interference issues between image light fields in experimental studies. Now, using Equation (
10) derived in this paper, we can successfully resolve this challenge encountered 30 years ago [
20].
We sincerely hope that the work presented in this paper will serve as a useful supplement to research on coherent optical imaging and its applications.
