Article

Numerical Analyses of the Influences of Connector Structures on the Performance of Flat-Tube SOFC

School of Energy and Power Engineering, University of Shanghai for Science and Technology, Shanghai 200093, China
*
Author to whom correspondence should be addressed.
Appl. Sci. 2025, 15(17), 9251; https://doi.org/10.3390/app15179251
Submission received: 8 July 2025 / Revised: 14 August 2025 / Accepted: 18 August 2025 / Published: 22 August 2025

Abstract

This study investigates how three flat-tube connector structures—conventional, ribbed flat-tube, and flange-connected—affect solid oxide fuel cell (SOFC) performance. The analysis employs a multi-physics modeling approach to examine the coupled effects of flow fields, gas species transfer, electrochemical reaction, and solid–liquid heat transfer. Results indicate that, under specific conditions, adding internal connector structures can enhance gas transport within the cell, leading to improvements in current density and output power. The flange-connected structure SOFC demonstrated superior output performance, particularly at a flange length of 30 mm, at which it achieved a 4.13% increase in power density compared to the conventional flat-tube SOFC and promoted a more uniform temperature distribution, effectively alleviating uneven temperature distribution inside the cell.

1. Introduction

Compared to traditional energy sources, fuel cells offer advantages such as efficient energy conversion, reliable operation, and long durability and can directly convert chemical energy into electrical energy [1,2]. In particular, the solid oxide fuel cell (SOFC) is a clean, efficient, and sustainable energy conversion device, considered one of the ideal options to replace fossil energy sources [3,4,5].
The high-temperature operating characteristics of solid oxide fuel cells (SOFCs) bring about issues such as material limitations, high costs, and system complexity, which still restrict their large-scale application. In particular, the performance of the single cells studied in this paper is easily affected. Individual differences after stacking may lead to local overcurrent or overheating, reducing overall reliability. This problem is particularly prominent in systems above the 100-kilowatt level. Therefore, we need to conduct more detailed research on single cells.
The interconnector is a component of the SOFC, used to connect the anode and cathode of adjacent cells in the stack, providing a pathway for electron transport [6]. Additionally, since the interconnector is located within the fuel gas channel, it also serves to distribute the fuel gases and provide structural support [7]. The structure of the interconnector directly affects the utilization efficiency of the fuel and oxygen, as well as the overall lifespan of the fuel cell, significantly influencing the comprehensive performance of the SOFC. Electrolyte thickness, electrode (anode/cathode) thickness, and cell area are key geometric parameters. Electrolyte conductivity, electrode catalytic activity, and material thermal expansion coefficient (TEC) are the material parameters that have major impacts. In addition, microstructural parameters such as electrode porosity also affect the output performance of single cells. This paper mainly studies the influence of flow channels with different shapes on the output performance of the cell by changing the anode area of the cell. Nowadays, research on fuel cells has gradually become a hot research direction [8,9,10].
Numerical simulation and experiments have distinct advantages. Simulation excels in broad parameter exploration, cost efficiency, and operability under extreme conditions, fitting early-stage rapid scheme screening. Experiments, with core value in data authenticity and simulation verification, act as the “gold standard” for confirming theoretical feasibility. In practice, three to five optimal parameter sets are first selected via simulation, and then models are verified and revised experimentally. Only their combination achieves efficient, reliable research goals.
In recent years, many research teams have made improvements to the flow channel structure of fuel cells, achieving notable results. Wu et al. [11] proposed a new type of flow channel with an expansion dock, and through simulation software, determined its optimal expansion range, which increased the peak power of the cell by 18.44%. Zhan et al. [12] used metal foam to replace the conventional straight-through interconnector, increasing the power of the cell by 13.74%. Chen et al. [13] designed a new dual-layer interconnector structure to increase the flow velocity of the fuel gas, enhancing mass transfer in the porous medium. Liu et al. [14] compared different rib spacing sizes and studied the impact of rib interconnector spacing on cell performance, determining the optimal distance between two ribs. Yan et al. [15] designed a spiral-shaped interconnector that increased the velocity distribution in the vertical direction by altering the flow direction of the fuel gas, improving the overall hydrogen concentration distribution. Moreno et al. [16] compared different sizes of straight-through channels and found the optimal parameters for different dimensions. Obviously, the above structural modification of the gas channel or interconnector can be thought of as helpful attempts to improve SOFC performance. A large body of research indicates that besides experimental results, numerical simulations can efficiently and accurately complete the design and optimization of SOFCs, helping to understand the influence of various parameters on cell performance. Cimen et al. [17] studied the effect of electrode layer and electrolyte layer thickness on the output power of flat-tube solid oxide fuel cells and determined the highest output power and maximum conductivity at several operating temperatures. Yang et al. [18] proposed a novel symmetric flat-tube solid oxide fuel cell with double-sided cathodes (DSC cells), and the study found that the duration of the oxidation process is the main factor affecting the stability of the cell. Lin et al. studied the influence of rib dimensions on concentration polarization and found that reducing the rib width can improve the gas uniformity and decrease both the ohmic polarization and the concentration polarization [19]. The flat-tube SOFC combines the advantages of flat plate cells, providing a relatively large surface area, which increases the power of the cell [20,21]. This allows the flat-tube SOFC to deliver more power within a relatively small volume [22]. Li et al. [23] established three-dimensional models of SOFCs with four different connecting body structures, namely traditional straight rib, cylindrical rib, rectangular, and concave types. It was found that under different electrode porosities, the cylindrical, rectangular, and concave connecting body structures are all superior to the traditional straight rib connecting body structure. Qiao et al. [24] studied the effect of rib spacing on resistance and conductivity in flat-tube solid oxide fuel cells. Additionally, the flat-tube SOFC benefits from the good sealing properties of tubular cells, requiring only the sealing of the inlet. The structure of the flat-tube cells makes it easier to stack and integrate them into larger power systems to meet energy demands of different scales [25]. The above results indicate that the performance of solid oxide fuel cells can be improved by changing the shape of the interconnector structure, so studies on new structures are of significance.
This study establishes a model of flat-tube solid oxide fuel cells (SOFCs) with conventional, ribbed, and flange-connected interconnectors and investigates the influences of the different interconnecting structures on gas molar amount, current density, power density, and temperature distribution, aiming to provide some references for the design of interconnected structures in solid oxide fuel cells.

2. The Geometric Modeling and Numerical Methods

2.1. Geometric Modeling

This study used the DesignModeler of Ansys 2019 for modeling and established a three-dimensional steady-state model of the SOFC with different connector structures. The flat-tube SOFC mainly consists of the interconnector, gas channels, porous anode and cathode electrode layers, and dense electrolyte layer, as shown in Figure 1. The geometric details were listed in Table 1. The primary function of the interconnector is to connect the anode and cathode inside the cell, providing a pathway for electron transport. Additionally, since the interconnector is located within the fuel gas channel, it also serves to distribute the fuel gases and provide structural support. Due to the long time required for finite element simulations, a repeated unit was chosen as the simulation domain to reduce the computation time.
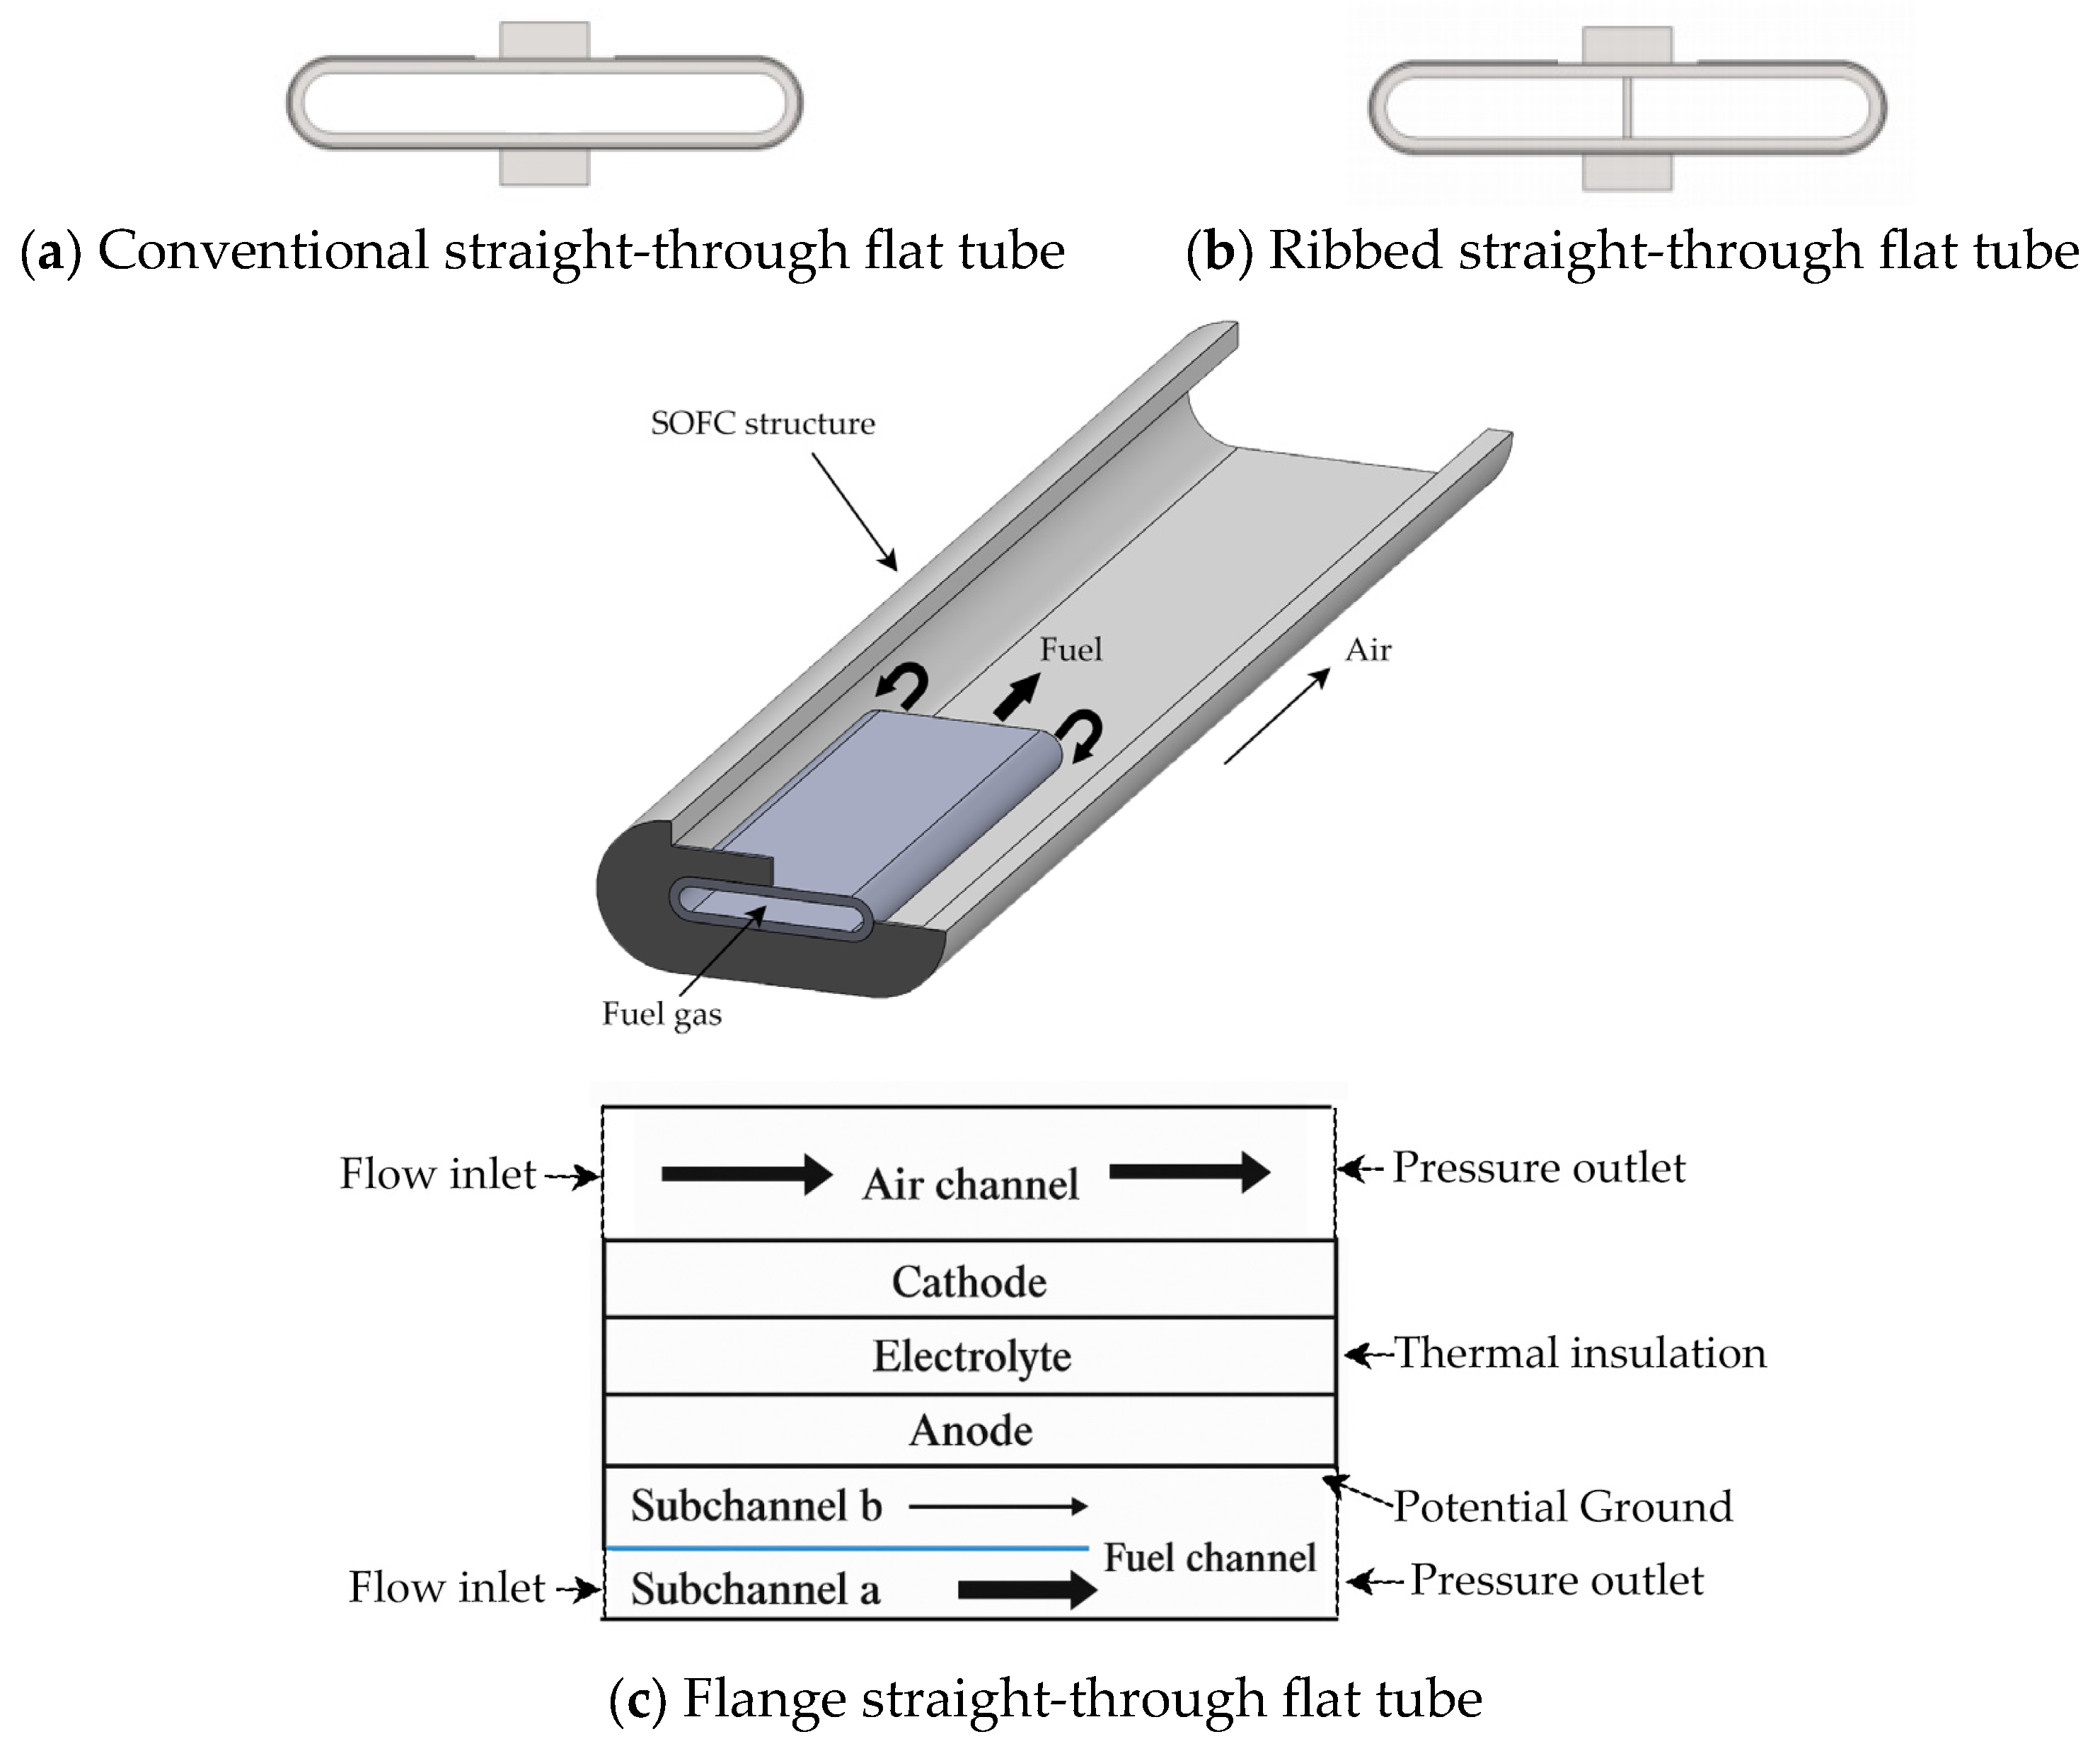
The 3D models of the three different structural types of connectors are shown in Figure 2. Figure 2a shows the straight-through flat-tube SOFC structure. Compared to the traditional cylindrical structure [9,26], it helps achieve better heat distribution, and reduces heat loss and temperature fluctuations, thereby enhancing the stability of the cell at high temperatures. Additionally, the flat-tube structure allows for more compact arrangement of multiple cell units, thereby improving system integration and space utilization. Figure 2b shows the ribbed straight-through flat tube. Adding ribs between the flat-tube anodes further increases the fuel gas reaction area and enhances heat transfer. Figure 2c is the flange-type straight-through flat tube. Compared to the traditional flat tube, it adds a flange-shaped inlet (an inner tube) at the entrance.

2.2. The Numerical Methods

In this study, COMSOL Multiphysics was used to perform a finite element analysis on the flat-tube SOFC model, which coupled the fuel cell module, free and porous media flow, dilute species transport, electric current, and heat transfer between solid and fluid modules. For computing, the software and computer we used were COMSOL 5.4 and a Dell Precision 5860 workstation.

2.2.1. Boundary Conditions

To simplify the calculation process, the following assumptions are made for the SOFC model, as in the literature [27]: all incoming gases are ideal gases; gas flow is single-phase, incompressible, and laminar (according to our operating conditions, the air side Reynolds number is in a range of 40 to 50, and even less in the fuel side); and both the electrolyte and electrode layers are isotropic porous media. The inlet boundary condition is fully developed flow, while the outlet boundary condition is a pressure outlet. The upper and lower walls of the cell are adiabatic with non-slip, and the left and right sides are set as non-slip symmetric boundary conditions. The gas entering the anode channel is hydrogen containing water vapor, and the gas entering the cathode channel is a mixture of oxygen and nitrogen. As usually used (e.g., in [28,29,30]), the conditions and material properties are shown in Table 2.

2.2.2. Governing Equations [31]

(1)
Continuity Equation
· ρ u = 0
where ρ , u represent the density and velocity of the mixed gas, respectively; and represents the Hamiltonian operator.
(2)
Momentum Conservation Equation
Based on Newton’s second law, it describes the relationship between the change in fluid velocity and the forces acting on the fluid. In solid oxide fuel cells, these forces include pressure, viscous forces, etc. The momentum conservation equation is expressed as follows:
ρ u · υ = p + · μ u + u T 2 3 μ u I
where p is the fluid pressure, μ the fluid viscosity coefficient, and I the unit matrix.
(3)
Charge Transport Equation
Charge transport can be divided into electron transport and ion transport. The charge conservation equation determines the magnitude of the electron and ion current densities.
The expression for the electrical conduction equations of electrons and ions are as follows:
σ e V e = i e = 0
σ i V i = i i = 0
where σ e , σ i are the electronic conductivity of the electrode and the ionic conductivity of the electrolyte, respectively; V e , V i the electronic potential and ionic potential, respectively; and i e , i i the electronic current density and ionic current density, respectively.
The exchange current density can be described using the Butler–Volmer equation. As a one-electron electrochemical reaction between two solution-phase species can be written as a reduction, the most general equation to describe the rate of this reaction as it proceeds at an electrode surface is the electroanalytical Butler–Volmer equation:
i l o c = k 0 F c Red exp α a F η R T c O x exp α c F η R T
where k 0 is the heterogeneous rate constant (SI unit: m/s), and α c is the (cathodic) transfer coefficient (dimensionless). For a one-electron reduction, the anodic and cathodic transfer coefficients are related as α a + α c = 1 .
(4)
Species Conservation Equation
ρ u ω i + J i = R i
where ω i is the mass fraction of species i , R i the generation rate of species i , and J i the diffusion flux of species i .
Determining J i using the diffusion model, the model is
J i = ρ D i , e ω i
D i , e = ε τ 1 D m , j + 1 D k , j 1
where τ is the tortuosity, D k , j the Knudsen diffusion coefficient, D m , j the average diffusion coefficient of the mixture, and D i , e the effective diffusion coefficient.
D K , i = 2 ε r g 3 τ 8 R T π M i 0.5
D m , i = 1 x i j i x j D i j
where r g is the pore radius; M i and x i the molecular weight and molar coefficient of component i , respectively; and D i j the Stefan–Maxwell binary diffusion coefficient.
D i j = 3.16 × 10 4 T 1.75 p v i 1 3 + v j 1 3 2 1 M I + 1 M J 0.5
where v i and v j are the diffusion volumes of species i and j , respectively; and M j is the molecular weight of component j .
(5)
Energy Equation
In the fluid region, both heat conduction and heat convection need to be considered. The energy equation is
N T = λ f T + C f C p T u = 0
where λ f is the thermal conductivity of the fluid, N T the heat flux, C f the molar concentration of the fluid, and C p the molar heat capacity of the fluid.
In the solid region, only heat conduction needs to be considered. The energy equation is
N T = λ s T = Q
where Q is the heat, and λ s the thermal conductivity of the solid.

2.2.3. Verification of Grid Independence and Validation of Numerical Methods

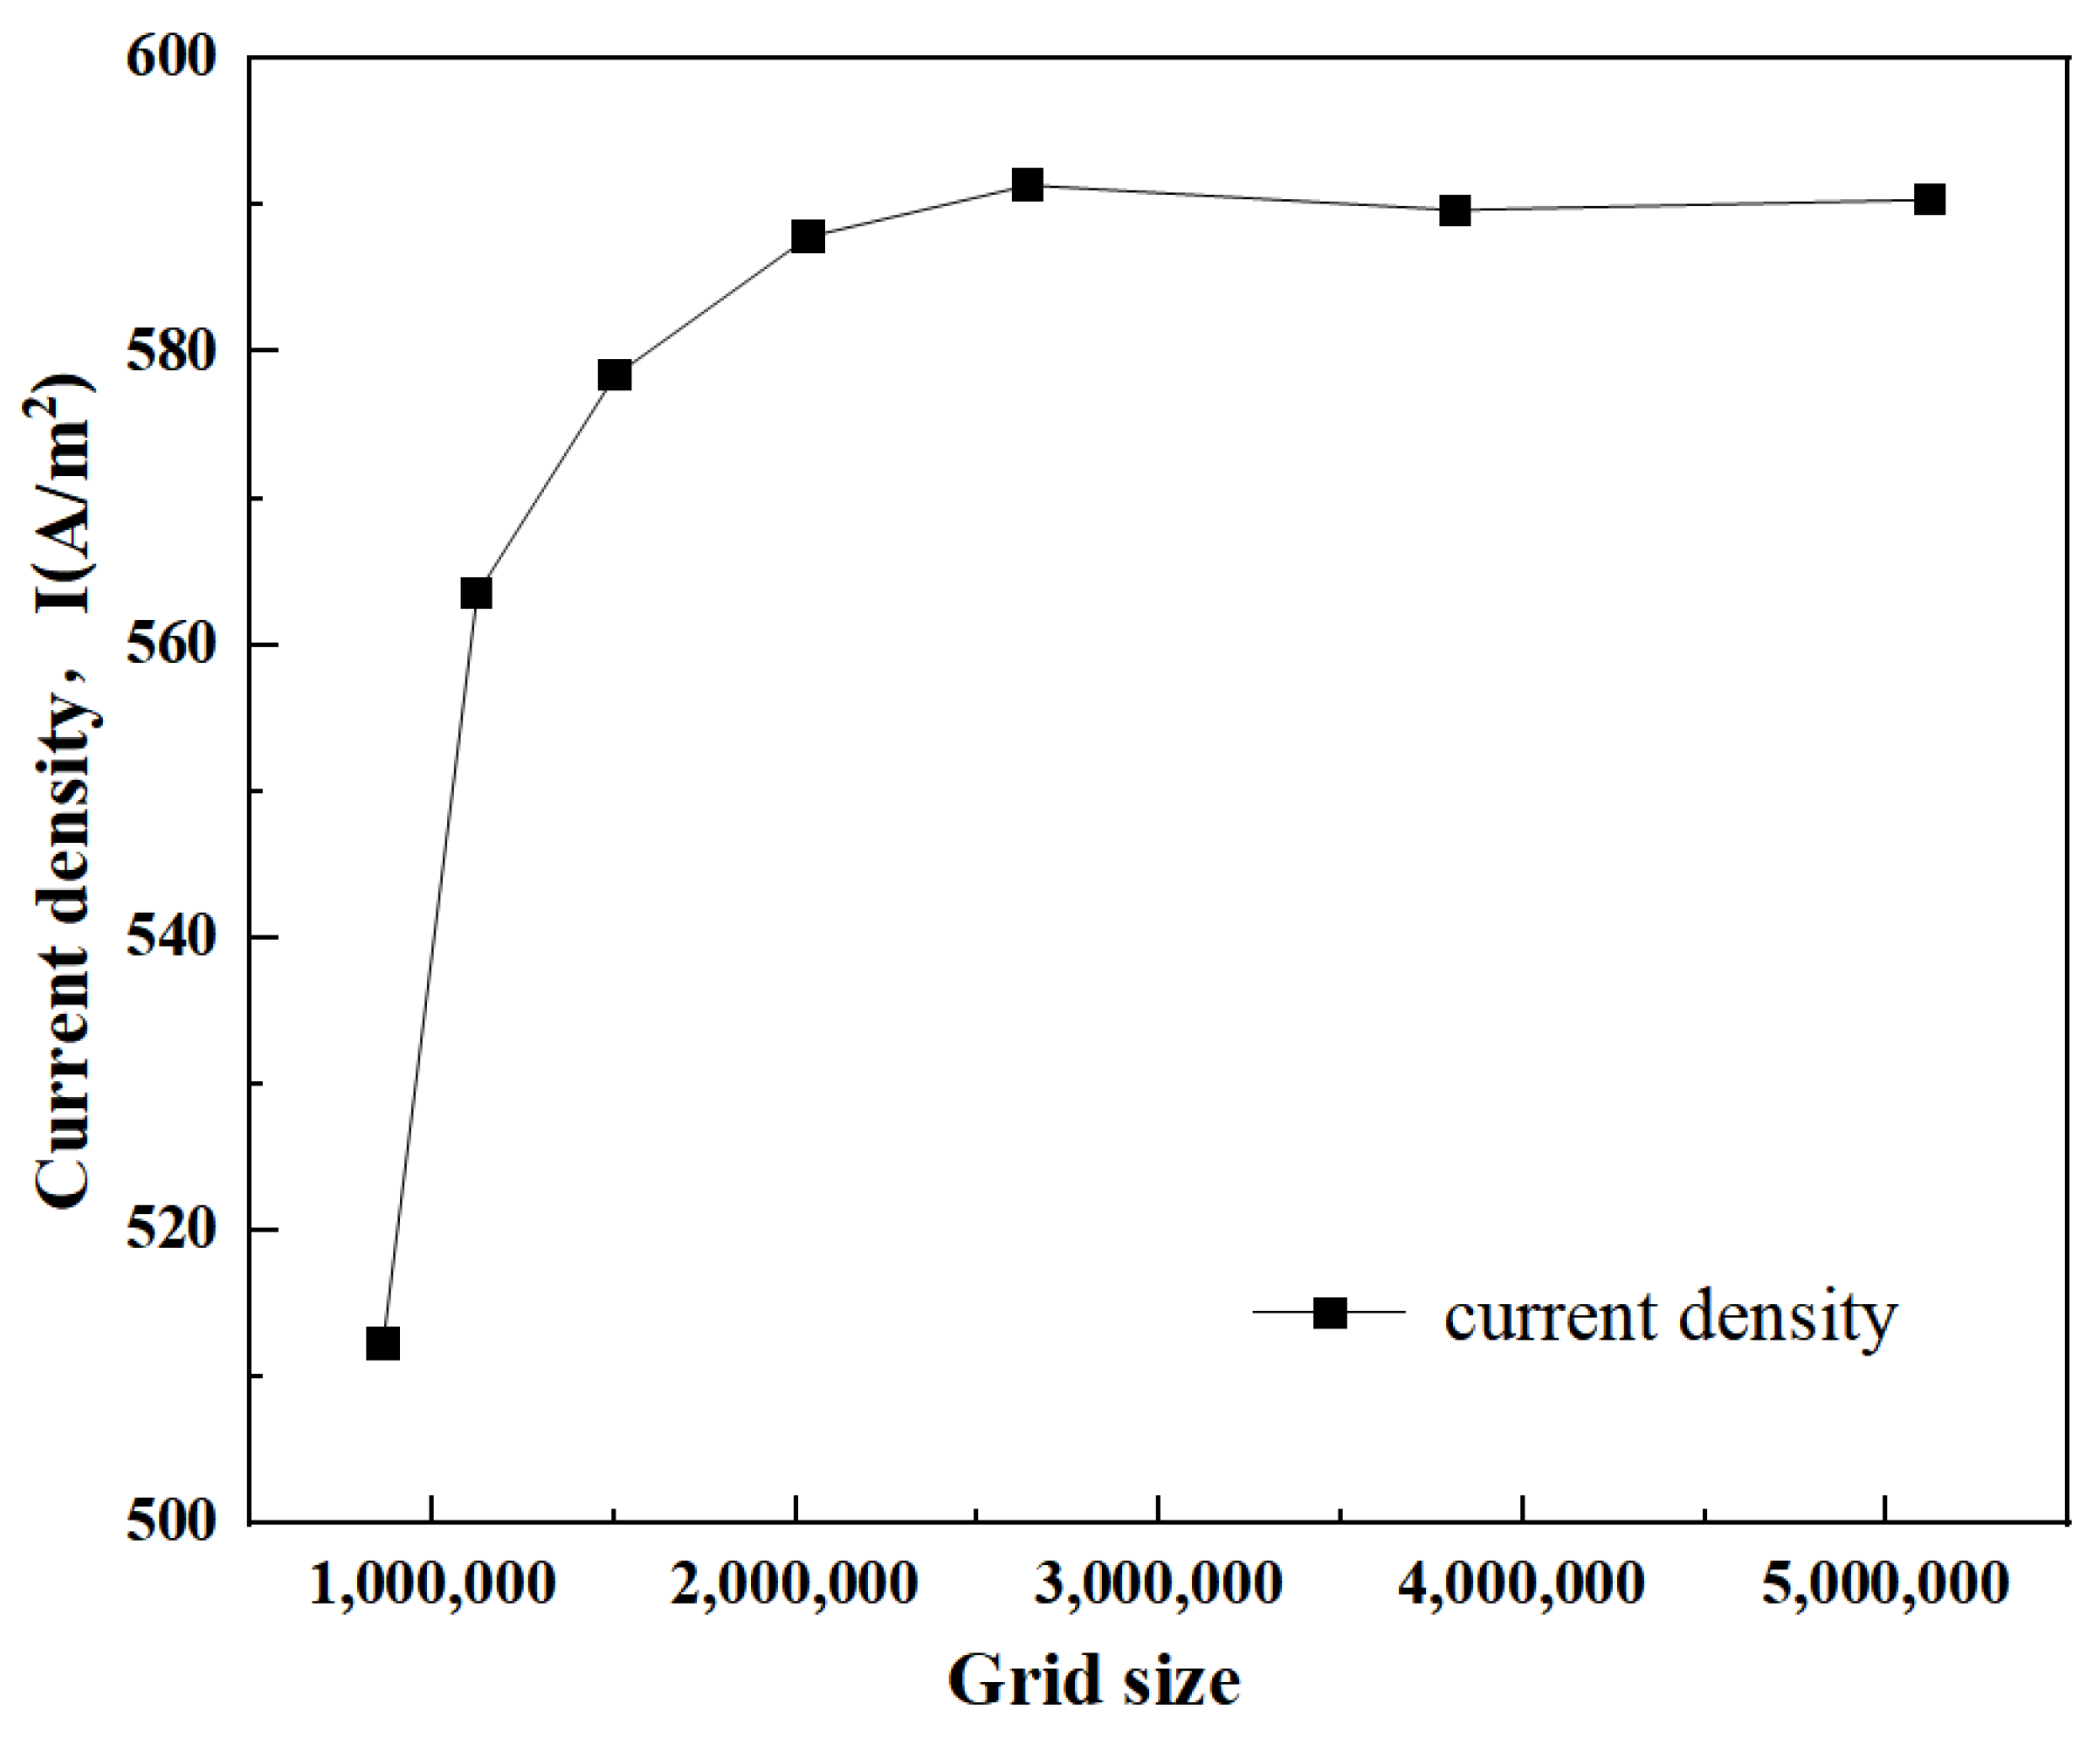
As is well known, grid independence must be satisfied for a numerical simulation process, as it ensures both the reliability of numerical results and the reasonable usage of computation resources. A test has been conducted by gradually refining the mesh to search a suitable grid size. As shown in Figure 3, where I represents the current density, of the grid sizes of 865,050, 1,123,020, 1,503,650, 2,035,200, 2,640,150, 3,812,540, and 5,120,103, the size of 2,640,150 was found to be the minimum, which guarantees that the change in current density under the condition of a voltage of 0.8 V tends to be stable, and the difference is less than 1.0% with an increasing size. Obviously, this size ensures not only calculation reliability but also minimum usage of computing resources.
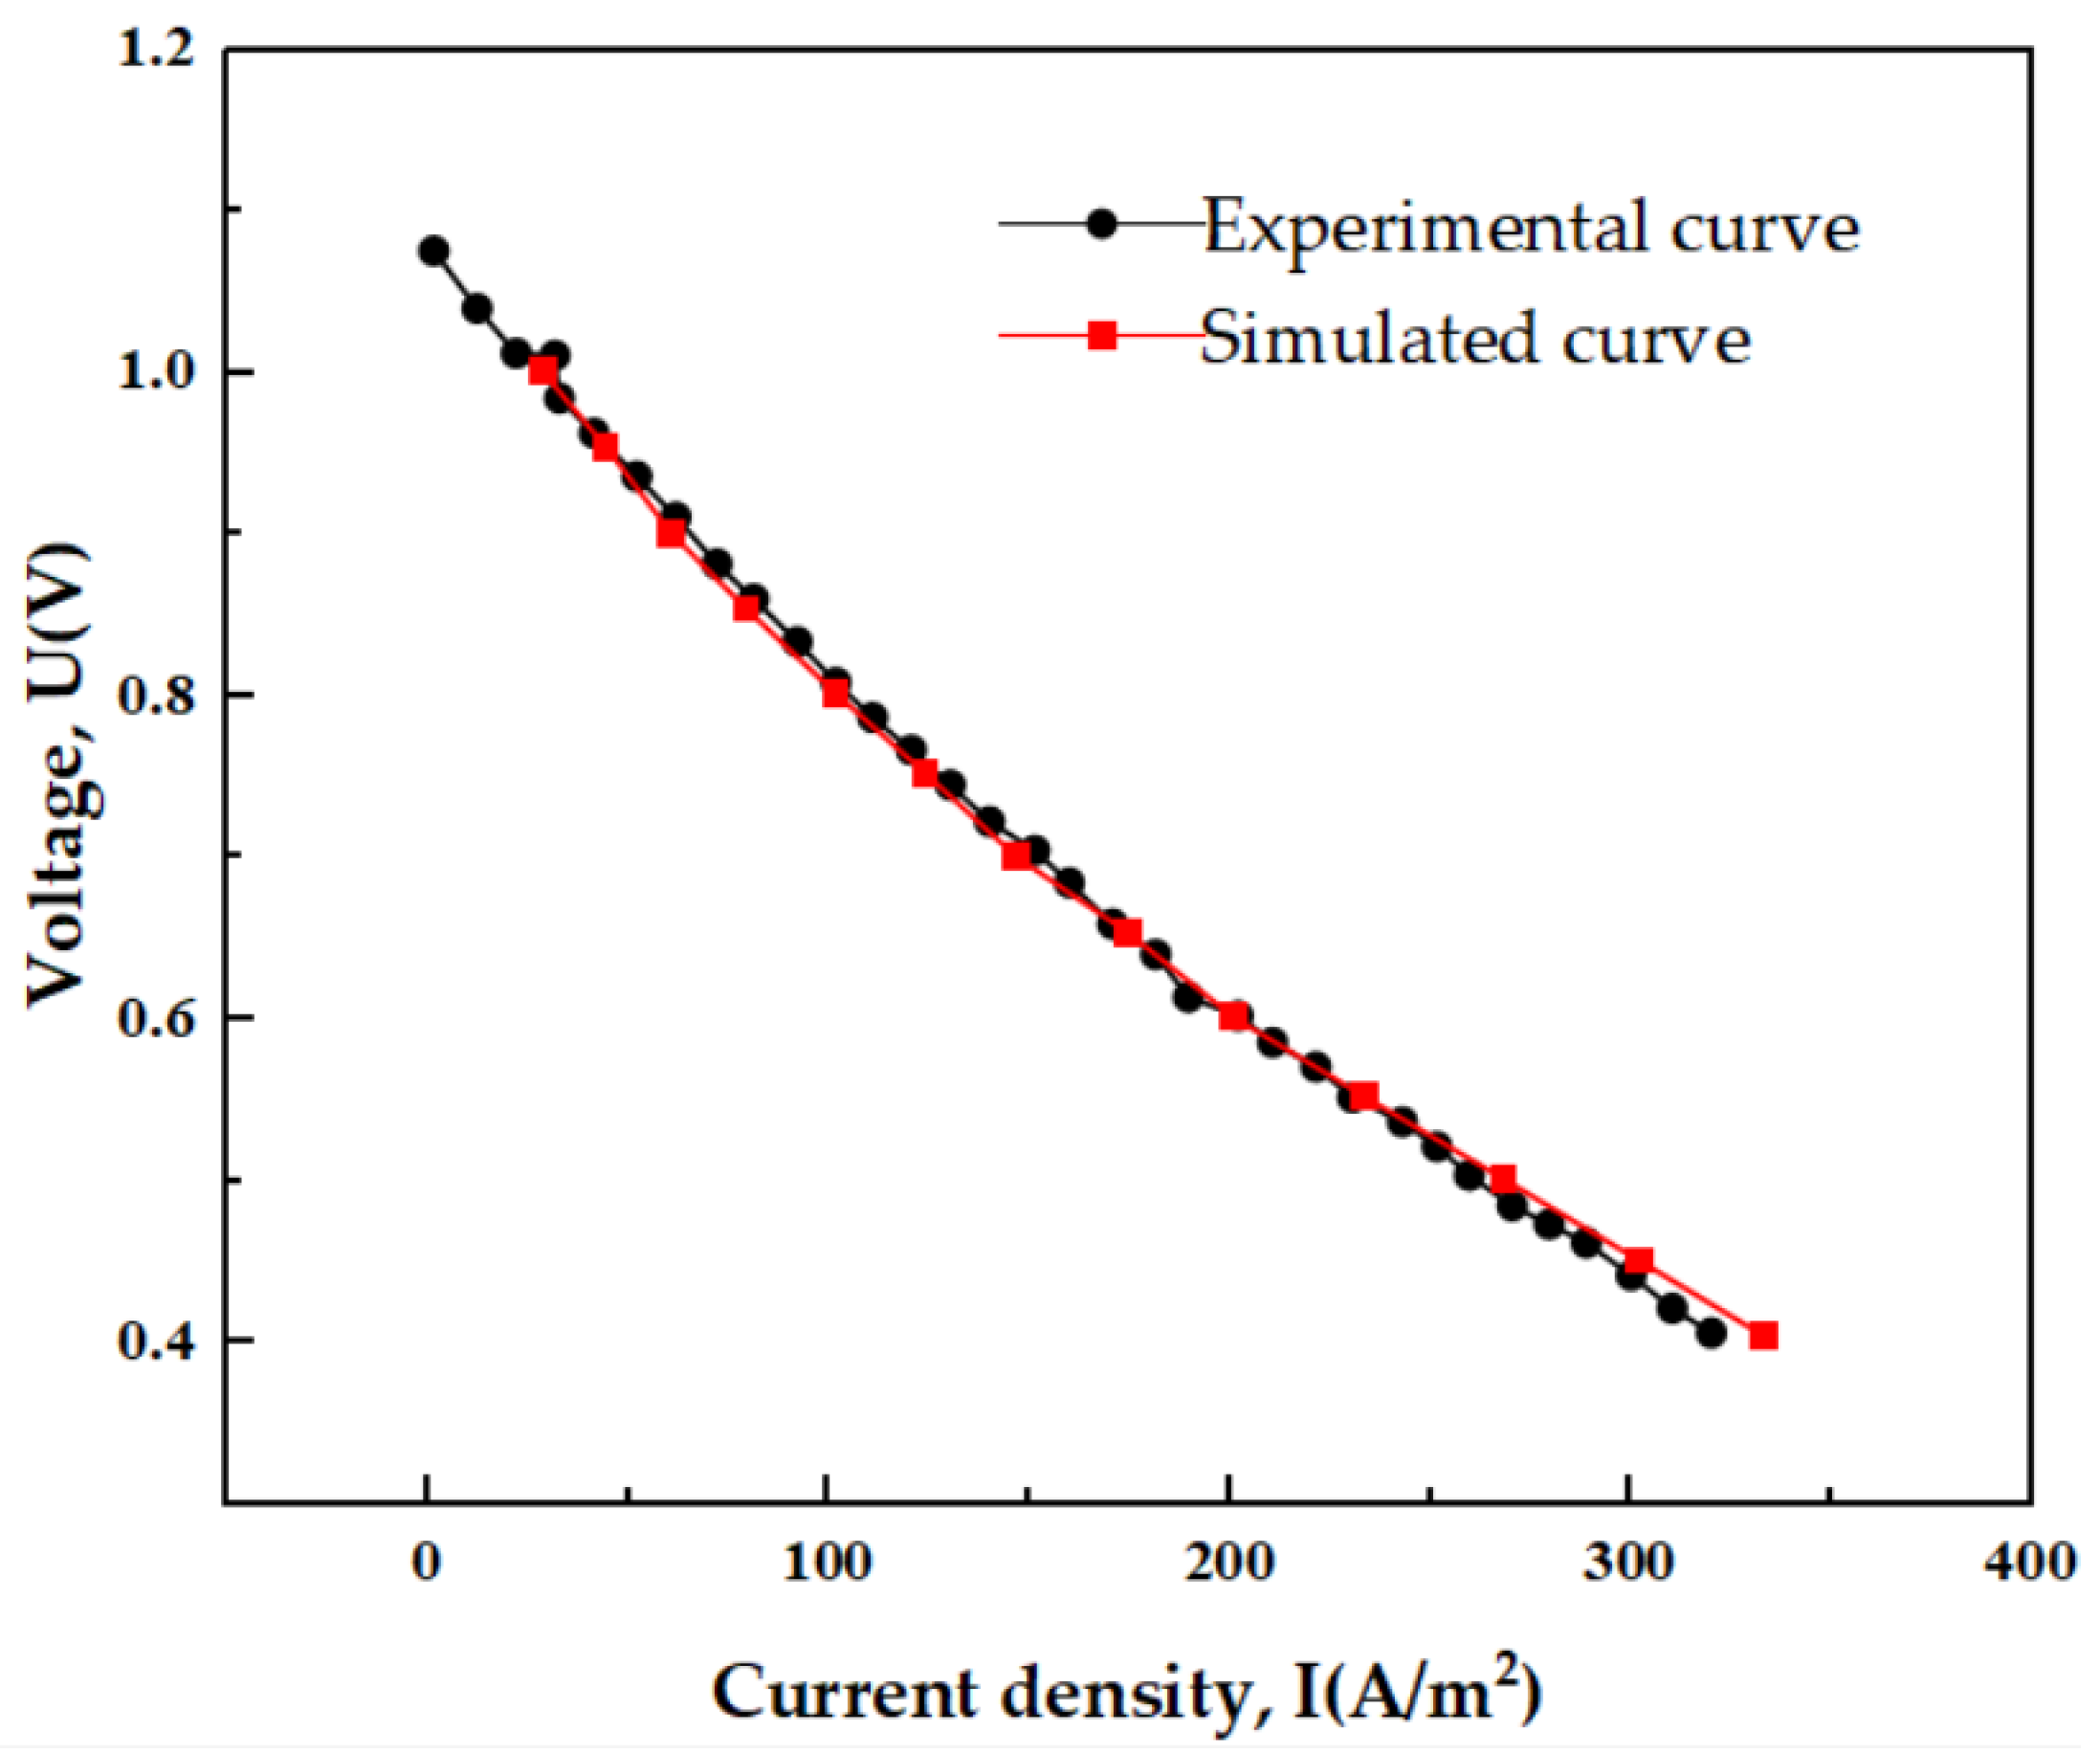
In order to ensure the accuracy of the numerical analyses based the above-mentioned numerical methods, a straight-through circular pipe model was established for validation of the methods. The polarization curve obtained from numerical simulation at 1023 K and 1 atm was compared with the experimental results from the literature [32] to validate the correctness of the numerical model. The operating temperature, pressure, materials, and geometric dimensions of the model were all consistent with the basic experimental conditions. The results, as shown in Figure 4, indicate that the error is within 5%, proving that the numerical multi-physical solvers and models produce reasonably accurate results for a circular tube SOFC case. It is also reasonable that the numerical methods were applied to solve the multi-physical fields in a flat-tube SOFC. For the latter cases, it was not so feasible at this point to find appropriate experimental work to validate them in a direct and exact way. All the case details for parameter study in this work were summarized in Table 3.

3. Results and Discussions

Using the models and numerical methods mentioned above, influences of various structures and arrangements of the interconnectors on the flat-tube SOFC performances were investigated. It must be noticed that the current work only focuses on the characteristics and their relevant key influence factors for a single SOFC unit or cell. Results of insights obtained based on the single cells have to be carefully utilized when evaluating the performances of cells that are situated in a SOFC stack. The complexity of the stack may involve more uncertainty, which was planned to be included in the scope of this work.

3.1. Effects of the Number of Ribbed Connectors

3.1.1. Distribution of Gas Molar Fractions

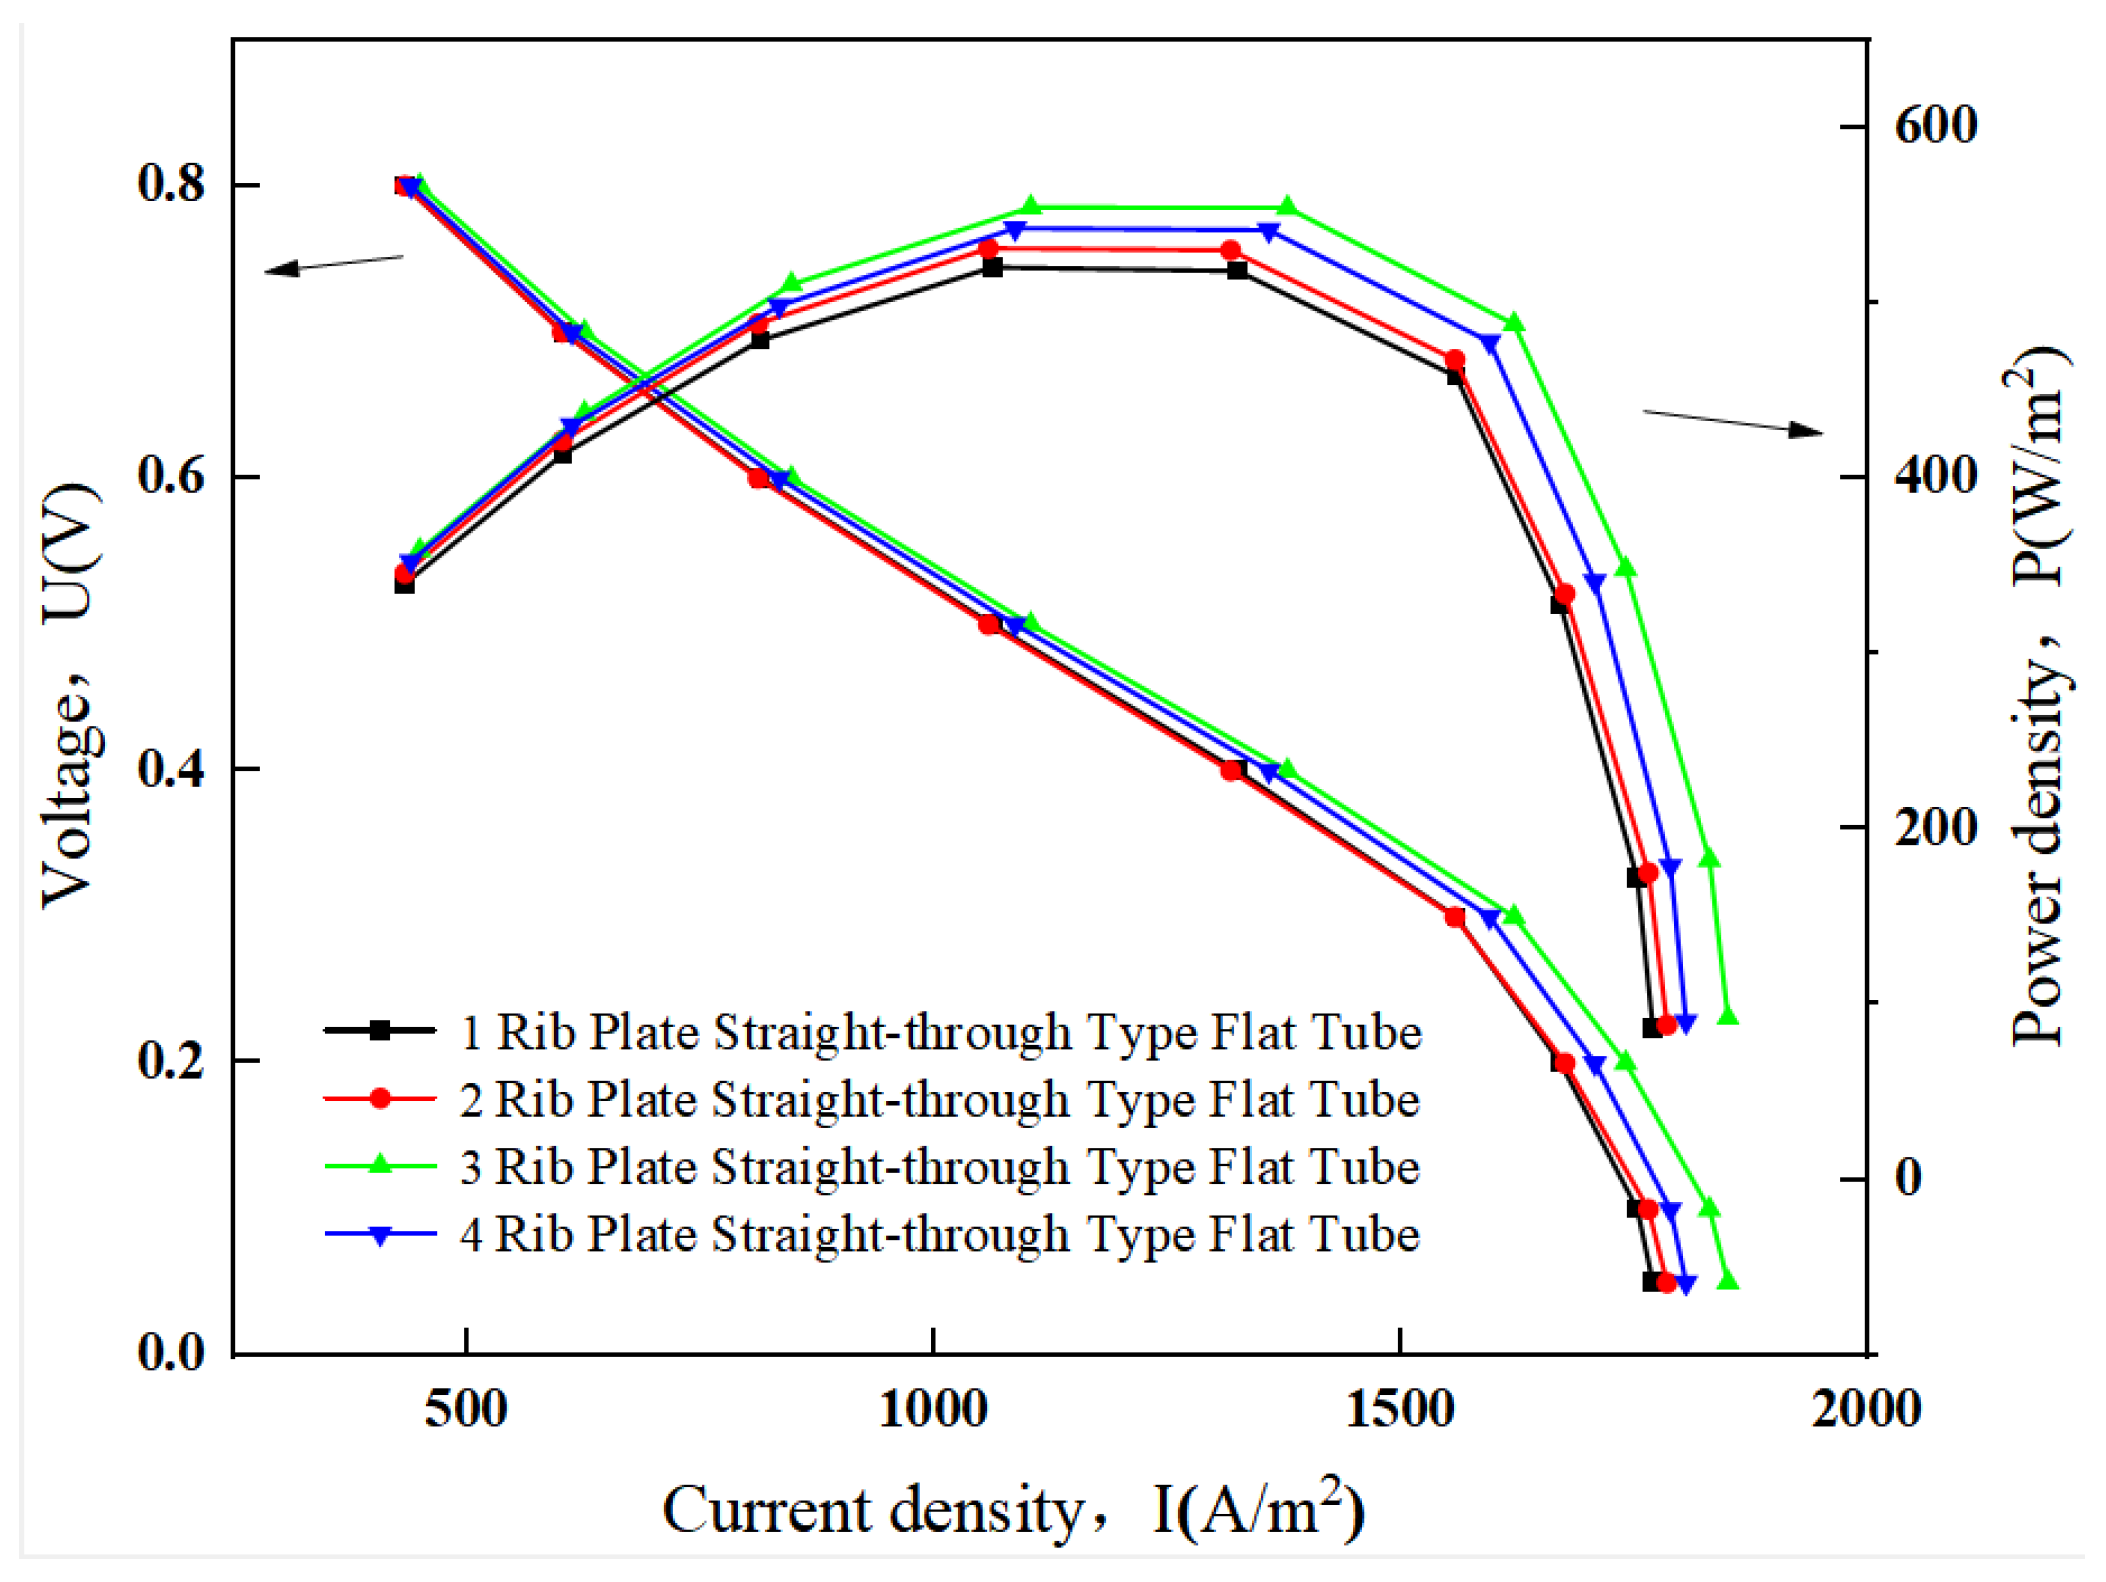
To investigate the impacts of the number of ribbed anode current collectors on the SOFC performance, the current collector ribs are arranged uniformly along the plane length. A total of four different SOFC models were established with the number of ribs as the independent variable. For convenience, these models are named B1, B2, B3, and B4. Except for the number of ribs, all other parameters are the same. The geometric models of B1 and B4 are shown in Figure 5.
The detailed sizes and dimensions related to the geometric models shown in Figure 1 and Figure 5 are listed in Table 4.
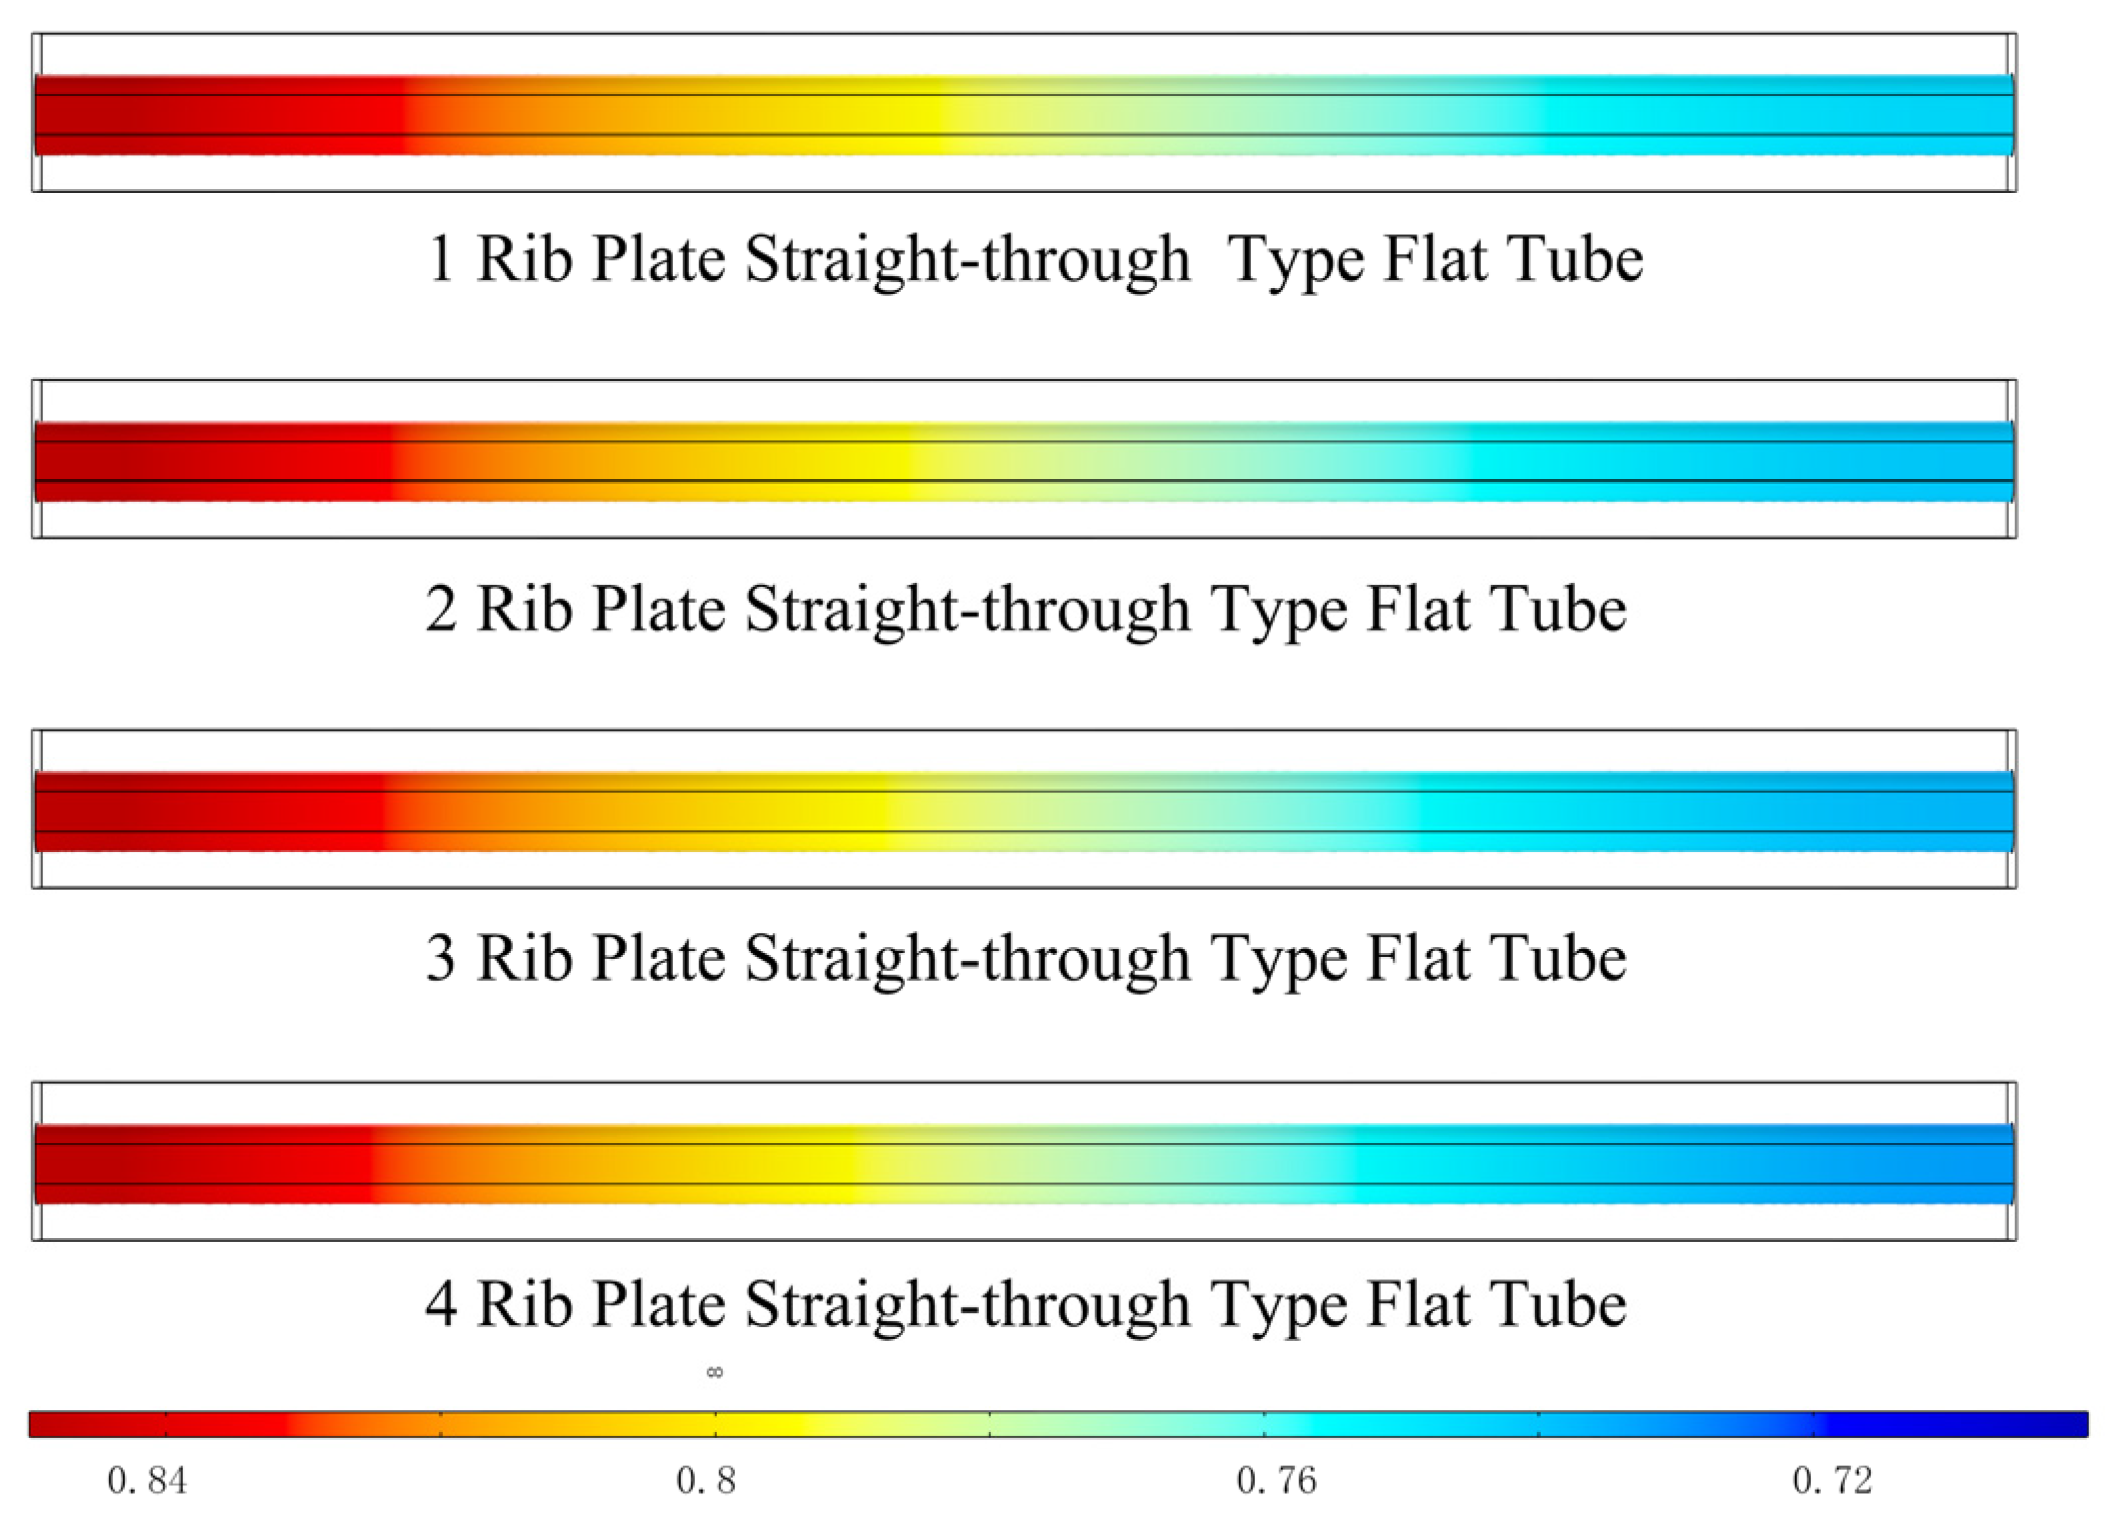
As shown in Figure 6, fuel gas consumption initially increases rapidly as the number of ribs in the flat tube rises. Once the number reaches three, however, the rate of increase in consumption slows down. Throughout this process, fuel gas continues to be consumed rapidly in the tube’s second half. This pattern indicates that altering the rib count affects the internal flow fields, changing the fuel gas distribution within the channel. Collectively, these effects suggest that increasing the number of ribs can enhance the effectiveness of the electrochemical reaction.

3.1.2. SOFC Polarization Curve and Power Density

Figure 7 demonstrates that as the number of anode current collector ribs increases, the maximum current density of the SOFC rises from 1769.92 A/m2 to 1835.59 A/m2, representing a 3.73% improvement, and the maximum power density increases from 521.3 w/m2 to 563.2 w/m2, an increase of 7.44%. In Figure 7 and some similar figures that follows, P represents the power density, and U the voltage. The discharge curves generally show the same trend, with the largest difference occurring at the end of the curve. This is mainly due to the high current density at the end, reflecting the difference in ohmic polarization. The effect of increasing the number of current collector ribs on improving discharge performance becomes smaller, meaning that, as shown in Figure 6, the gradient of the maximum power increase is gradually decreasing.

3.2. The Effects of the Ribbed Connector Arrangement Distance

3.2.1. Distribution of Gas Molar Fractions

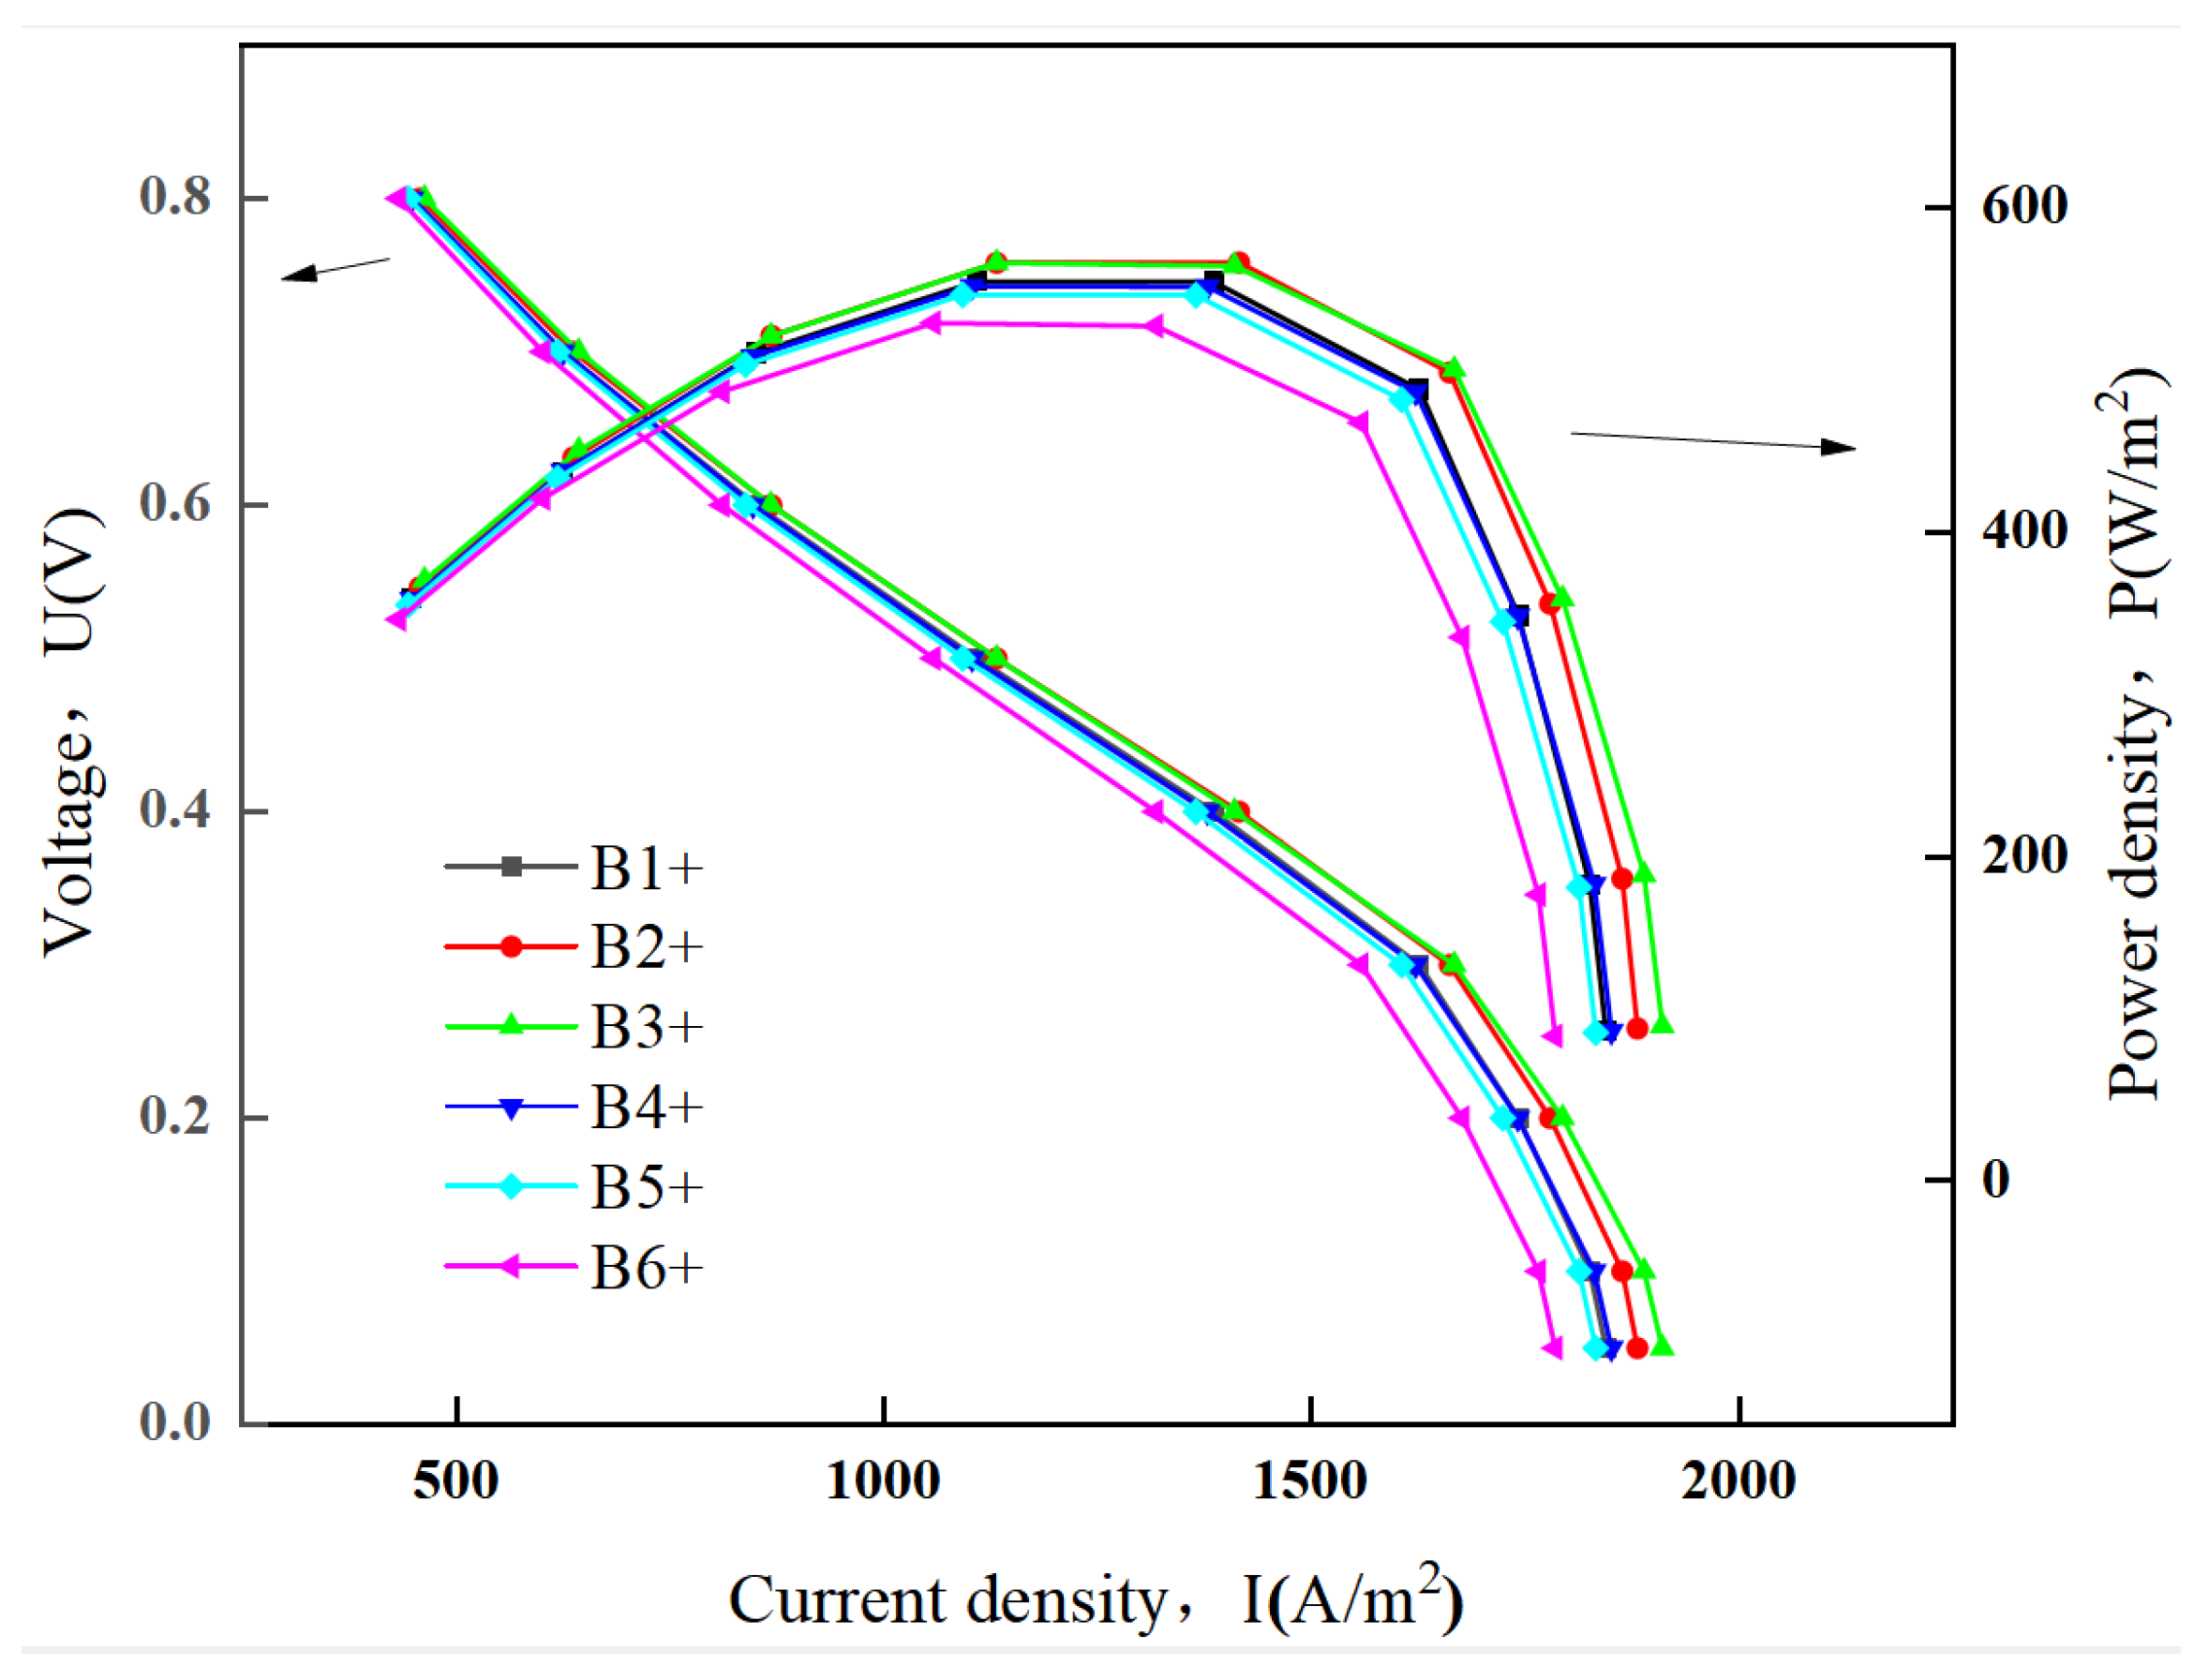
To investigate the effect of the arrangement of anode ribs on SOFC performance, the distance between two anode current collector ribs is set as a variable. The distances between the ribs are set to 4, 8, 12, 16, 20, and 24 mm, resulting in the establishment of six different SOFC models, which are named B1+, B2+, B3+, B4+, B5+, and B6+. All other parameters are the same. The geometric models of B1+ and B6+ are shown in Figure 8. Numerical simulation calculations were performed on the models with different anode rib positioning arrangements.
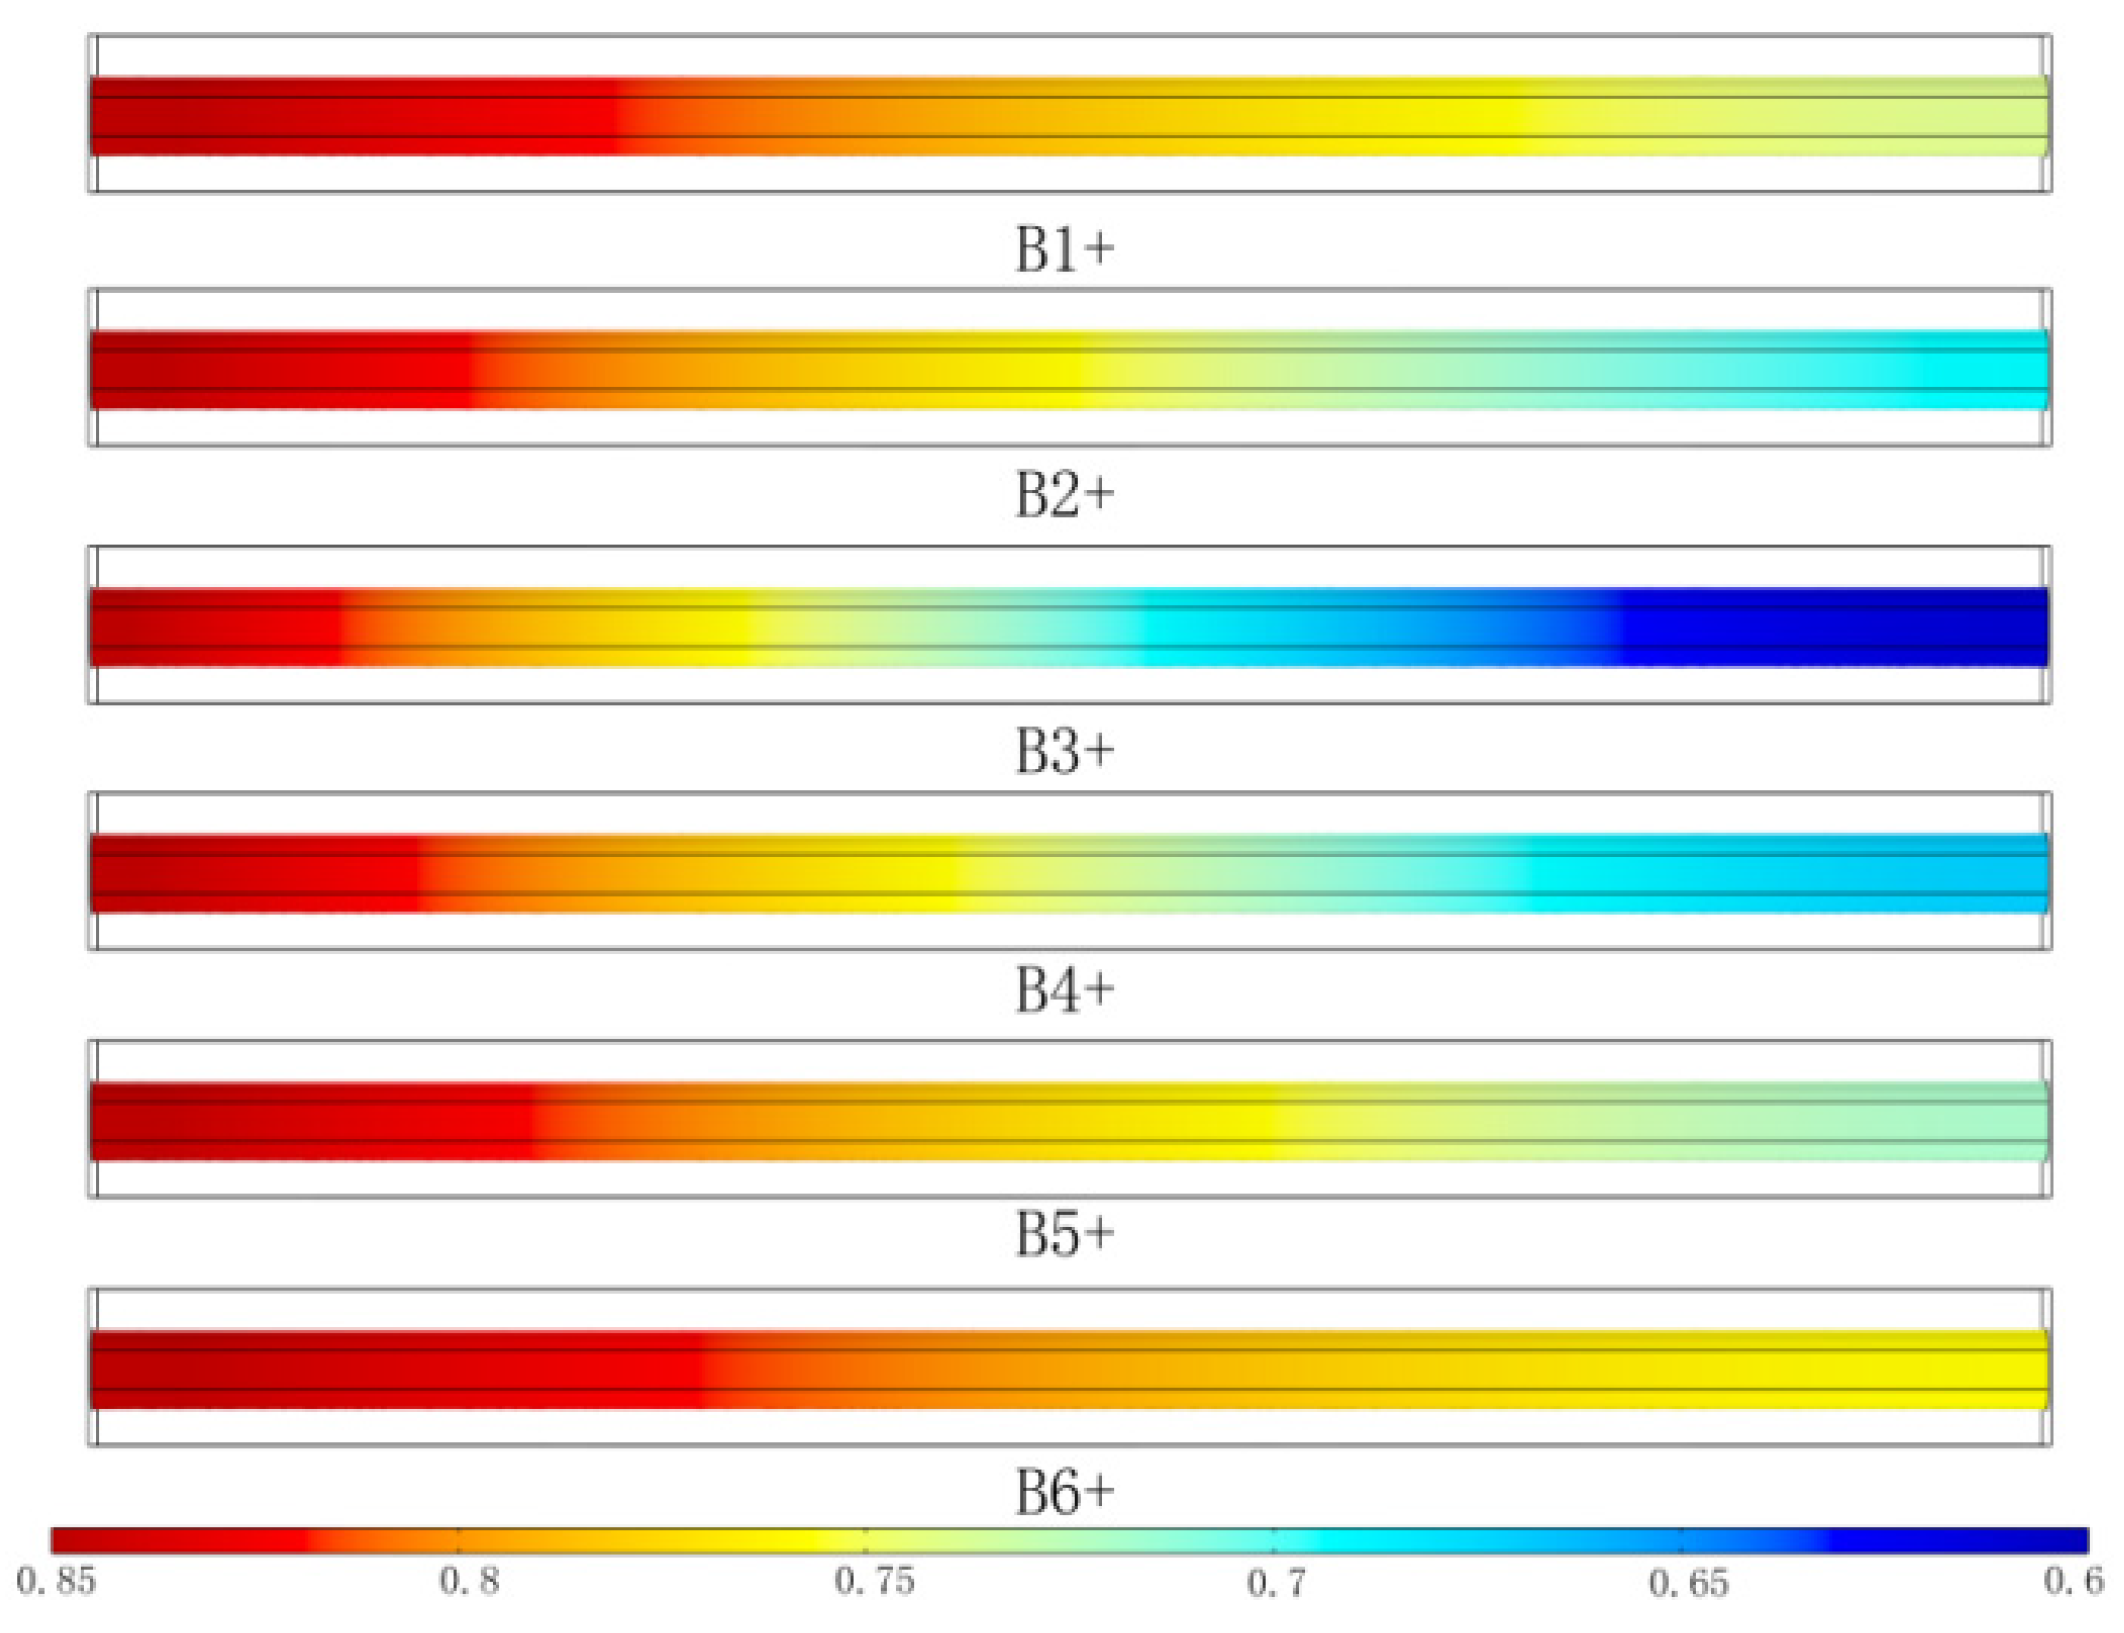
Figure 9 shows the hydrogen distribution in the six different rib distance connector models.
Figure 9 demonstrates that fuel gas consumption in the flat tube increases sharply with larger fin spacing until a peak at 12 mm, beyond which it decreases. This non-monotonic trend reveals that fin spacing directly influences internal flow fields, which in turn governs fuel distribution patterns in the channel. By strategically adjusting fin spacing, the electrochemical reaction efficiency can be improved.

3.2.2. SOFC Polarization Curve and Power Density

Figure 10 shows that as the rib position shifts, the maximum power density of the SOFC decreases from 1909.88 A/m2 to 1784.93 A/m2, a decrease of 6.54%, while the voltage corresponding to the maximum power remains nearly unchanged. From the discharge trend, it is evident that the discharge performance at all positions is similar during the initial phase, where electrochemical polarization is dominant, resulting in nearly identical output performance. The differences between them are mainly concentrated in the latter half, which is the ohmic polarization phase. When the ribs move closer to the arc region, the charge transport paths at the ribs align with the circumferential region, and at this point, increasing the distance between the anode ribs has a minimal effect on improving SOFC discharge performance and may further reduce its economic viability.

3.3. Effects of Flange-Type Connector Length

3.3.1. Distribution of Gas Molar Fractions

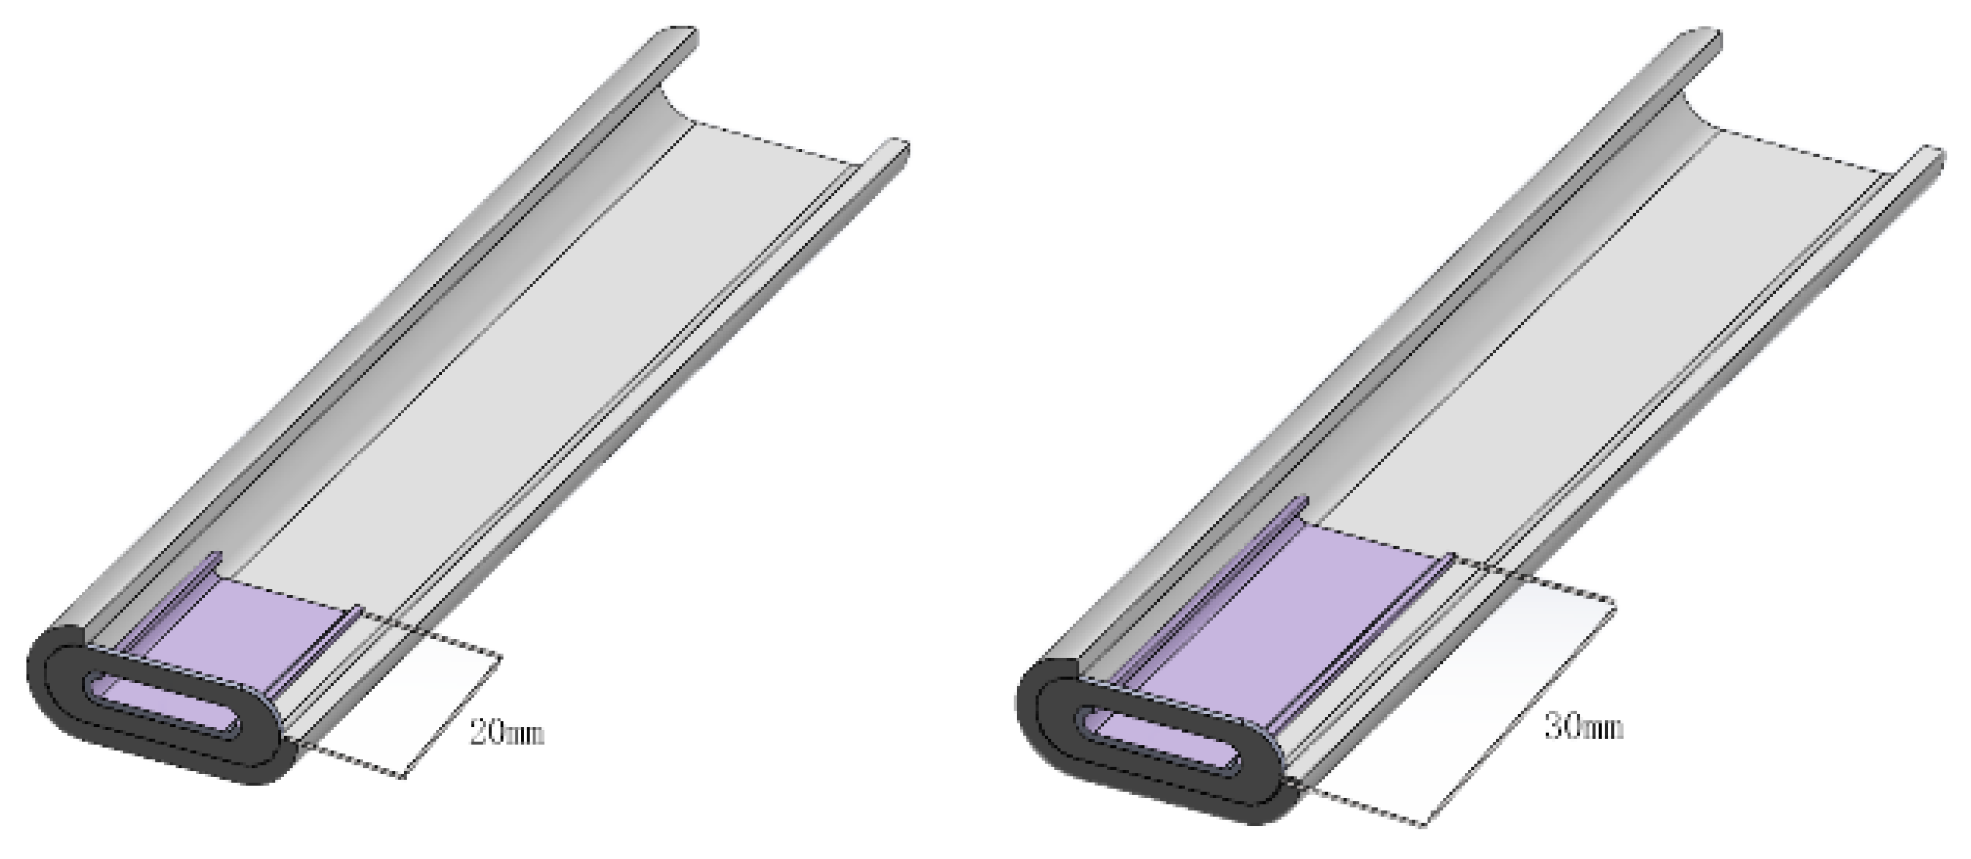
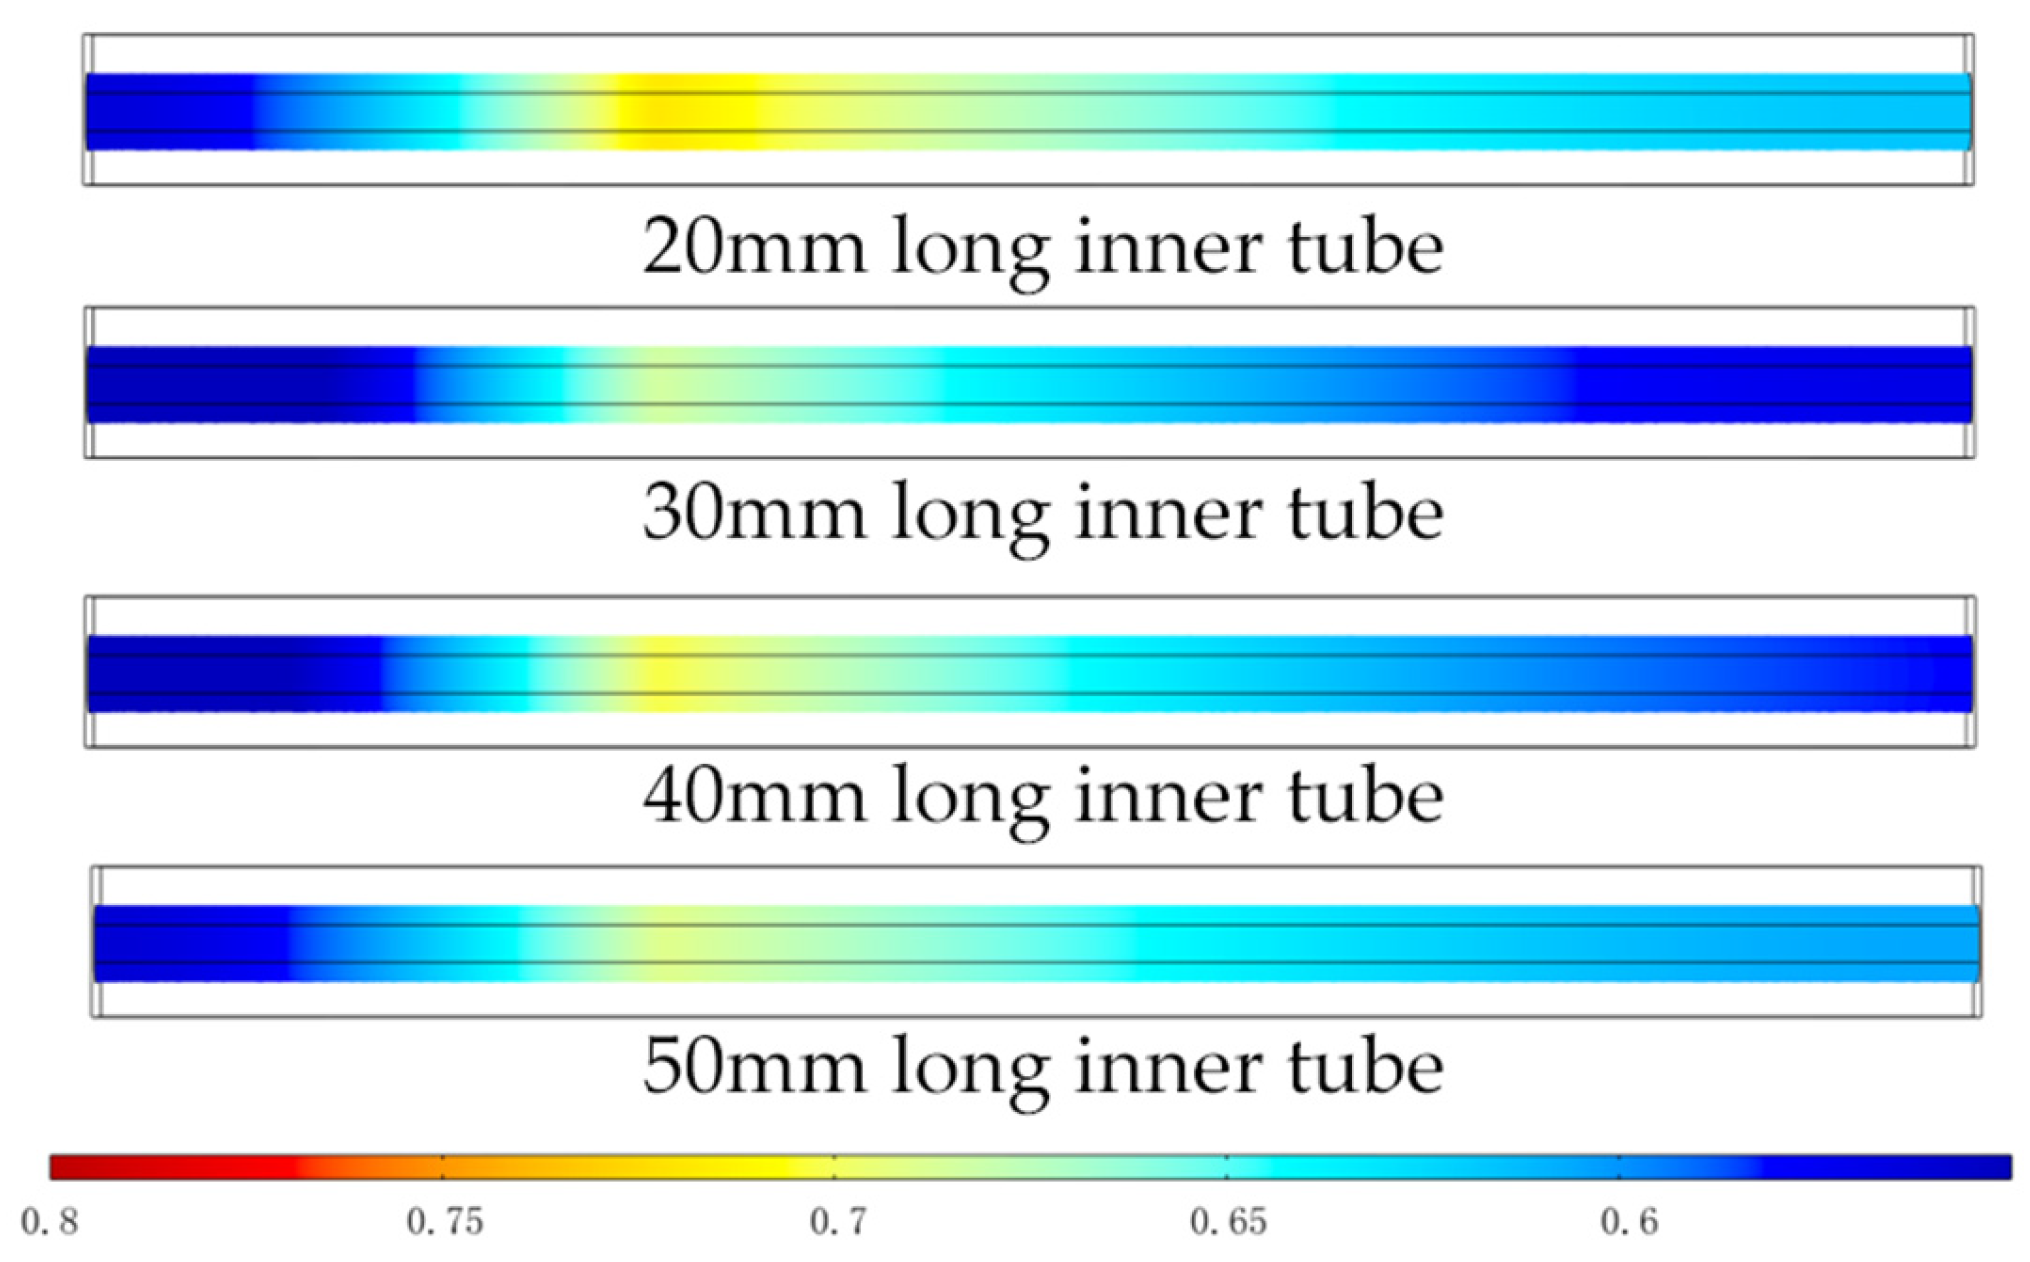
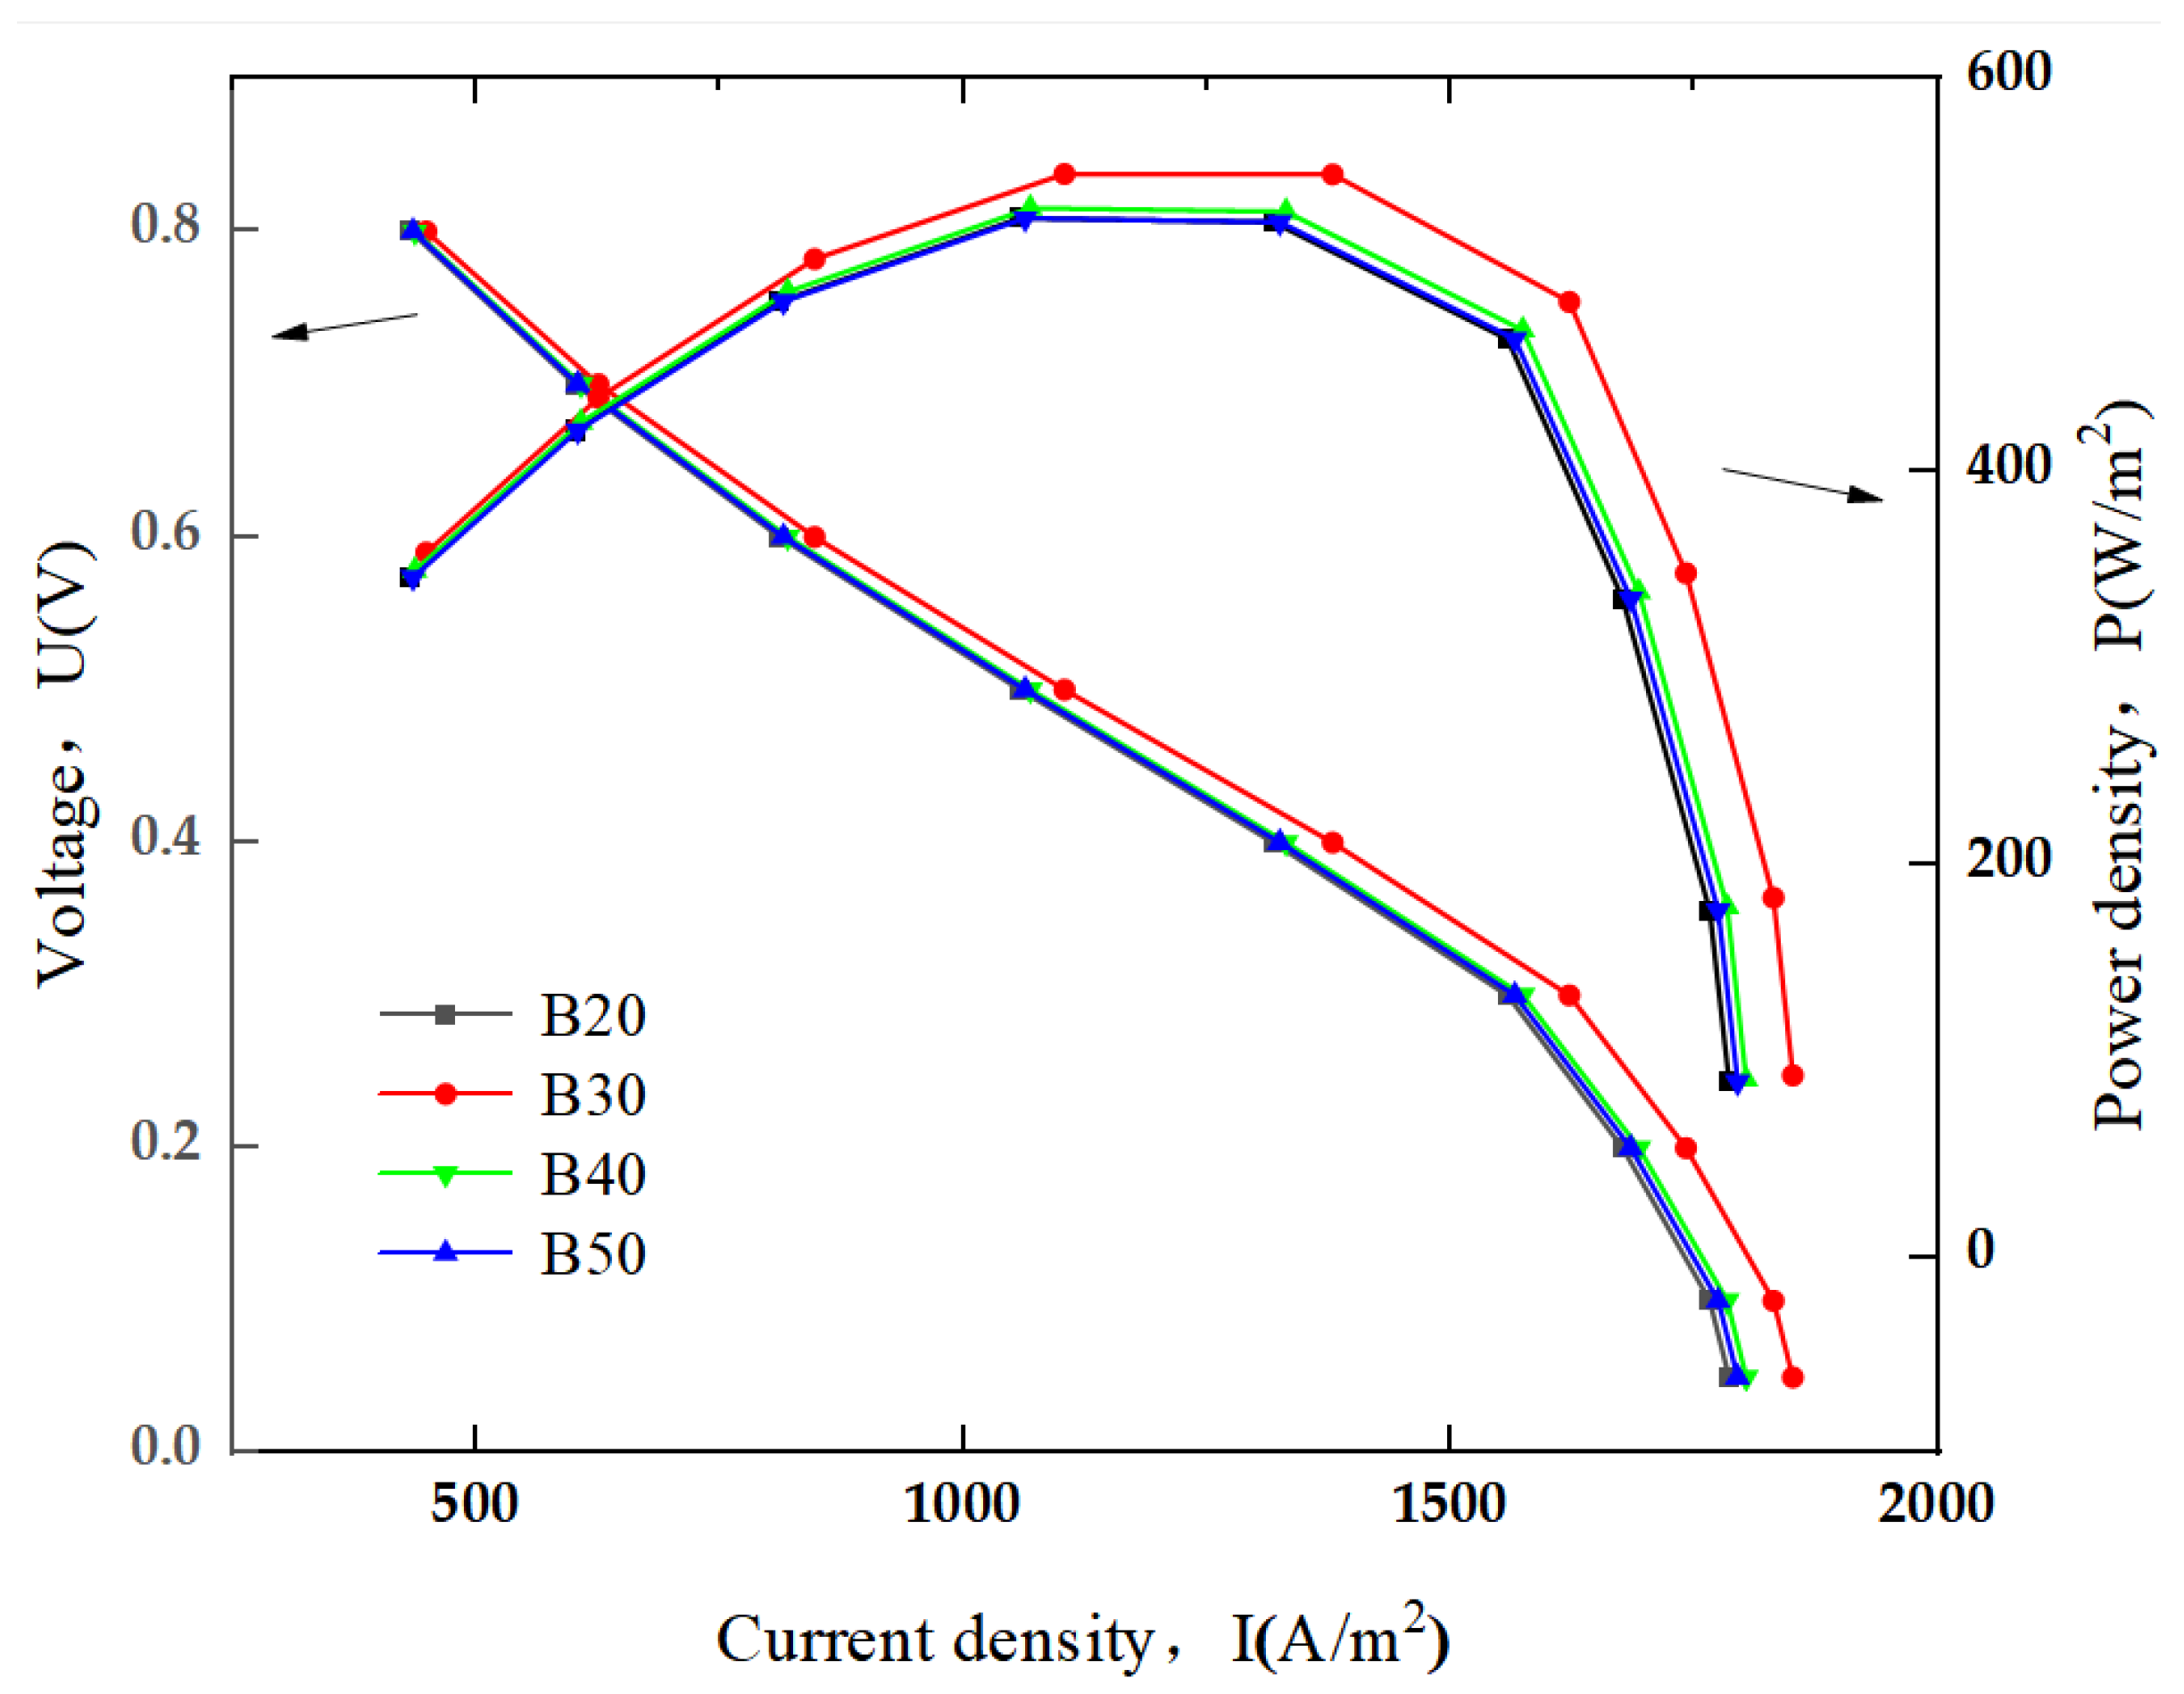
To investigate the effects of the inner tube length of the flange-type current collector on SOFC performance, four different SOFC models were established with inner tube lengths of 20, 30, 40, and 50 mm, respectively. For convenience, they are named B20, B30, B40, and B50. Except for the differences in inner tube length, all other parameters are kept the same. The geometric models of B20 and B30, on which numerical simulations were carried out, are shown in Figure 11.
Figure 12 shows the hydrogen molar fraction distribution on the anode side for flange-type connector structures with different inner tube lengths.
The inverse relationship between flange inner tube length and fuel consumption spatial uniformity is demonstrated in Figure 12. Beyond an optimal length, consumption peaks diminish and shift rearward, signifying that excessive tube extension disrupts flow stability. Consequently, precise length control is critical for maintaining fuel dispersion efficiency across the channel.

3.3.2. SOFC Polarization Curve and Power Density

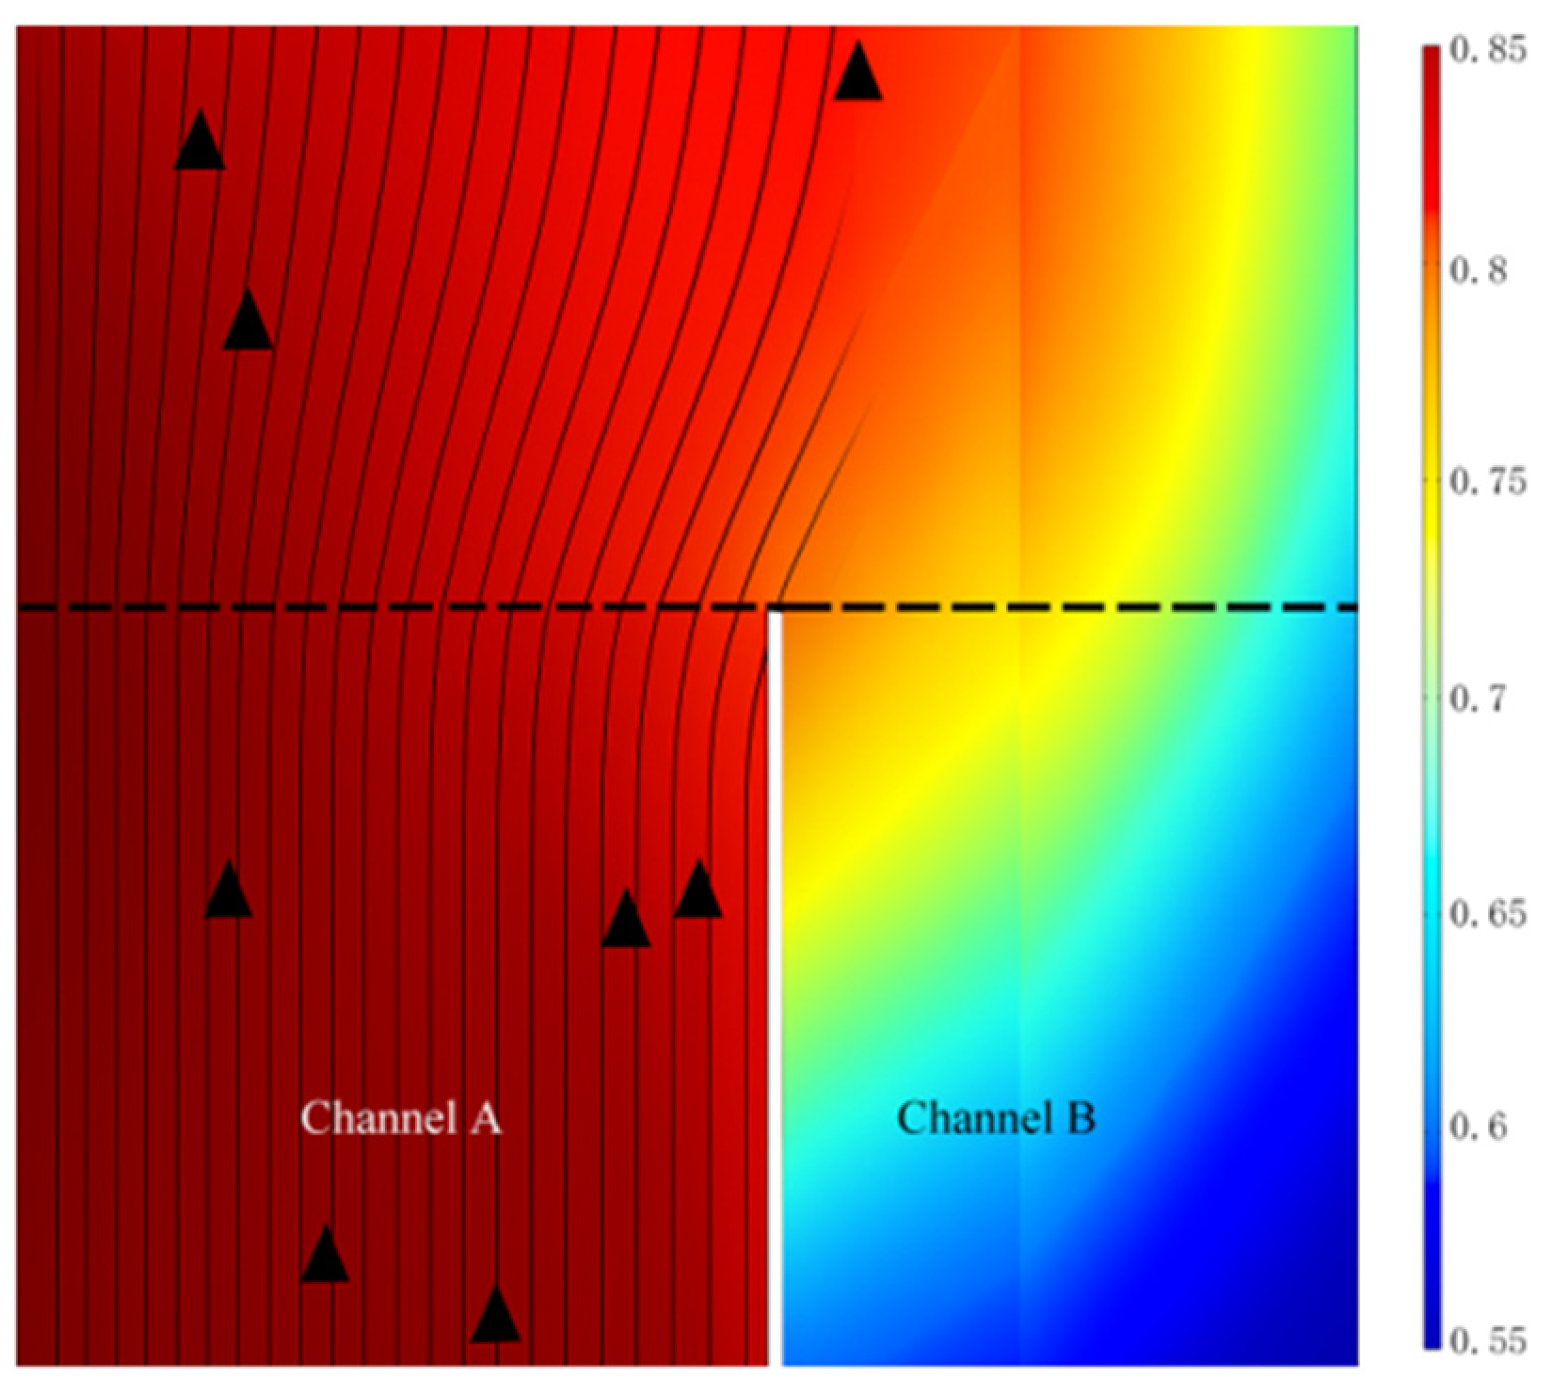
As shown in Figure 13, the trends of the curves are generally the same. As the length of the flange-type inner tube gradually increases, the power density of the SOFC first increases and then decreases, peaking at a current density of 1103 A/m2. As the current density increases further, the output power density of the SOFC rapidly decays. From the output curves, it can be seen that when the inner tube length is 30 mm, the output power reaches its maximum value. Shortening or increasing the inner tube length both lead to a rapid decrease in output power. In fact, the flange-type inner tube functions as a nozzle, from which fuel gas injects into the channel and mixes with the gas around and ahead. That particular flow pattern leads to a stagnation or wake zone near the outlet of the inner tube. On the other hand, the jet in the meantime diffuses in the transverse direction, which results in a thicker low-speed or viscous layer near the channel wall outside. As shown in Figure 14, the jet stream in sub-channel A remains in the axial or main direction but diffuses transversely, and a stagnation region forms in sub-channel B. The stagnation region and the near-wall low-speed layer developed along the main stream direction allow longer residence time, which leads to a higher conversion of fuel gas considering the limited diffusion and reaction rates in anode and electrolyte layers, because the latter processes are usually much slower than species transport in the flow stream. That explains why the hydrogen mole fraction in sub-channel B is much lower than that in sub-channel A. Obviously, the inner tube results in a more complex entrance flow field that restrains the local reaction but improves the total reaction rate by increasing the hydrogen residence time along the whole channel. However, the total reaction rate may also be restrained if the inner tube is too long, since fuel species could not reach backward to the far end of the stagnation zone by diffusion. Therefore, the length of 30 mm seems to be the optimal value. On the other hand, the inner tube length would influence the flow resistance in a complex way, which may be the same way as it affects the reaction rate, considering the analogy between mass transport and momentum transport.

3.4. The Effects of the Presence or Absence of Connectors

3.4.1. Distribution of Gas Molar Fractions

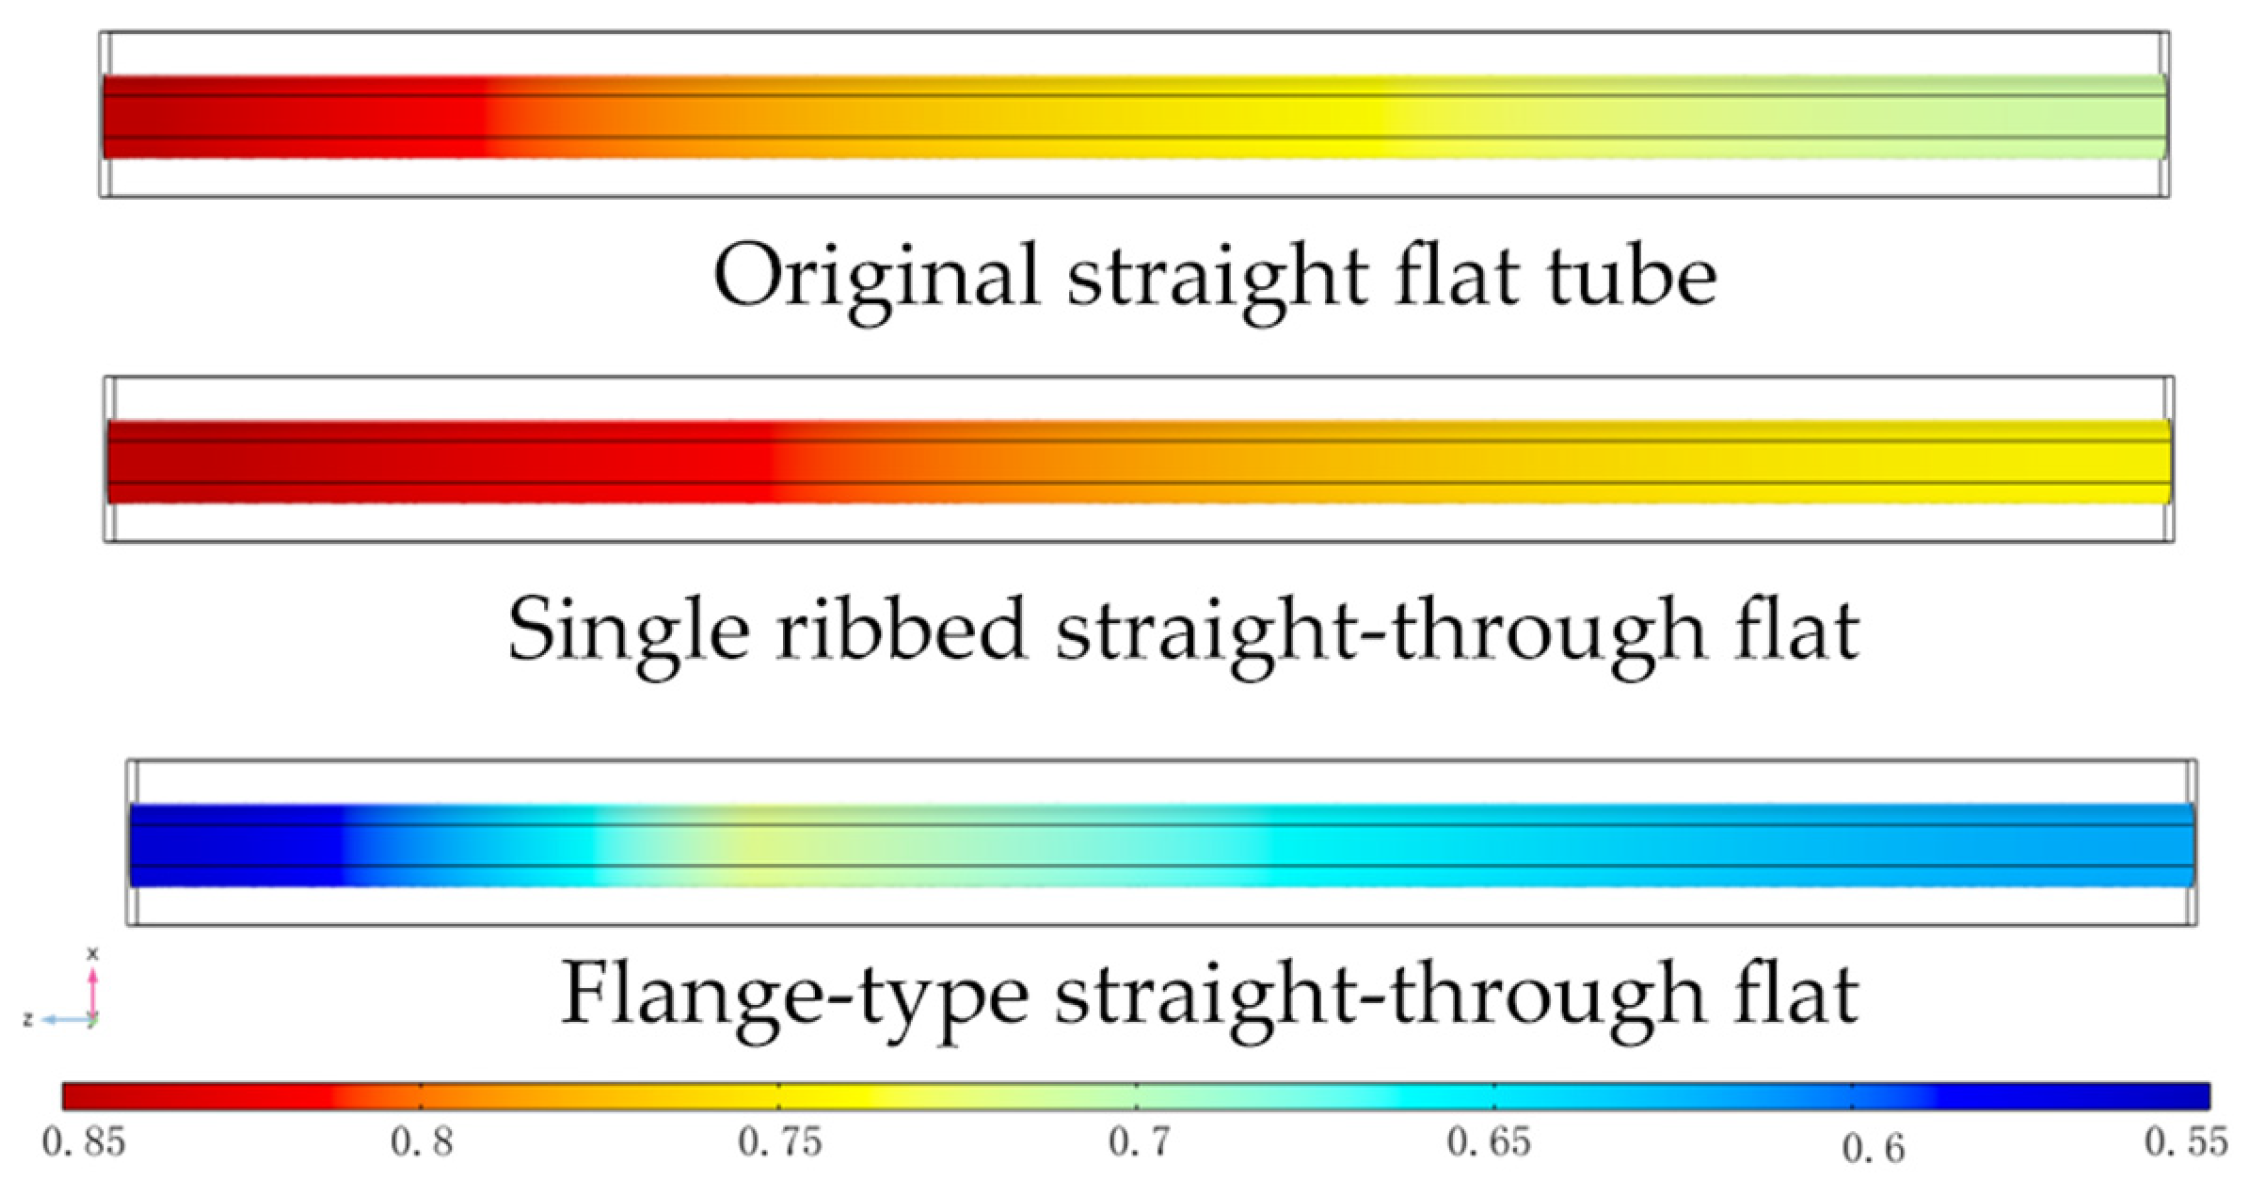
The flat-tube SOFC in this paper uses the same-side air intake method. Figure 15 shows the hydrogen molar fraction distribution on the anode side. At a working voltage of 0.8 V, the hydrogen molar fraction at the anode channel inlet is 0.8 for all models. The hydrogen molar fractions at the flow channel outlets for the conventional, ribbed, and flange-type connector structures are 0.72, 0.71, and 0.61, respectively. This indicates that under the same boundary conditions, the hydrogen utilization in the flange-type connector structure is much higher than in the other two structures.

3.4.2. SOFC Polarization Curve and Power Density

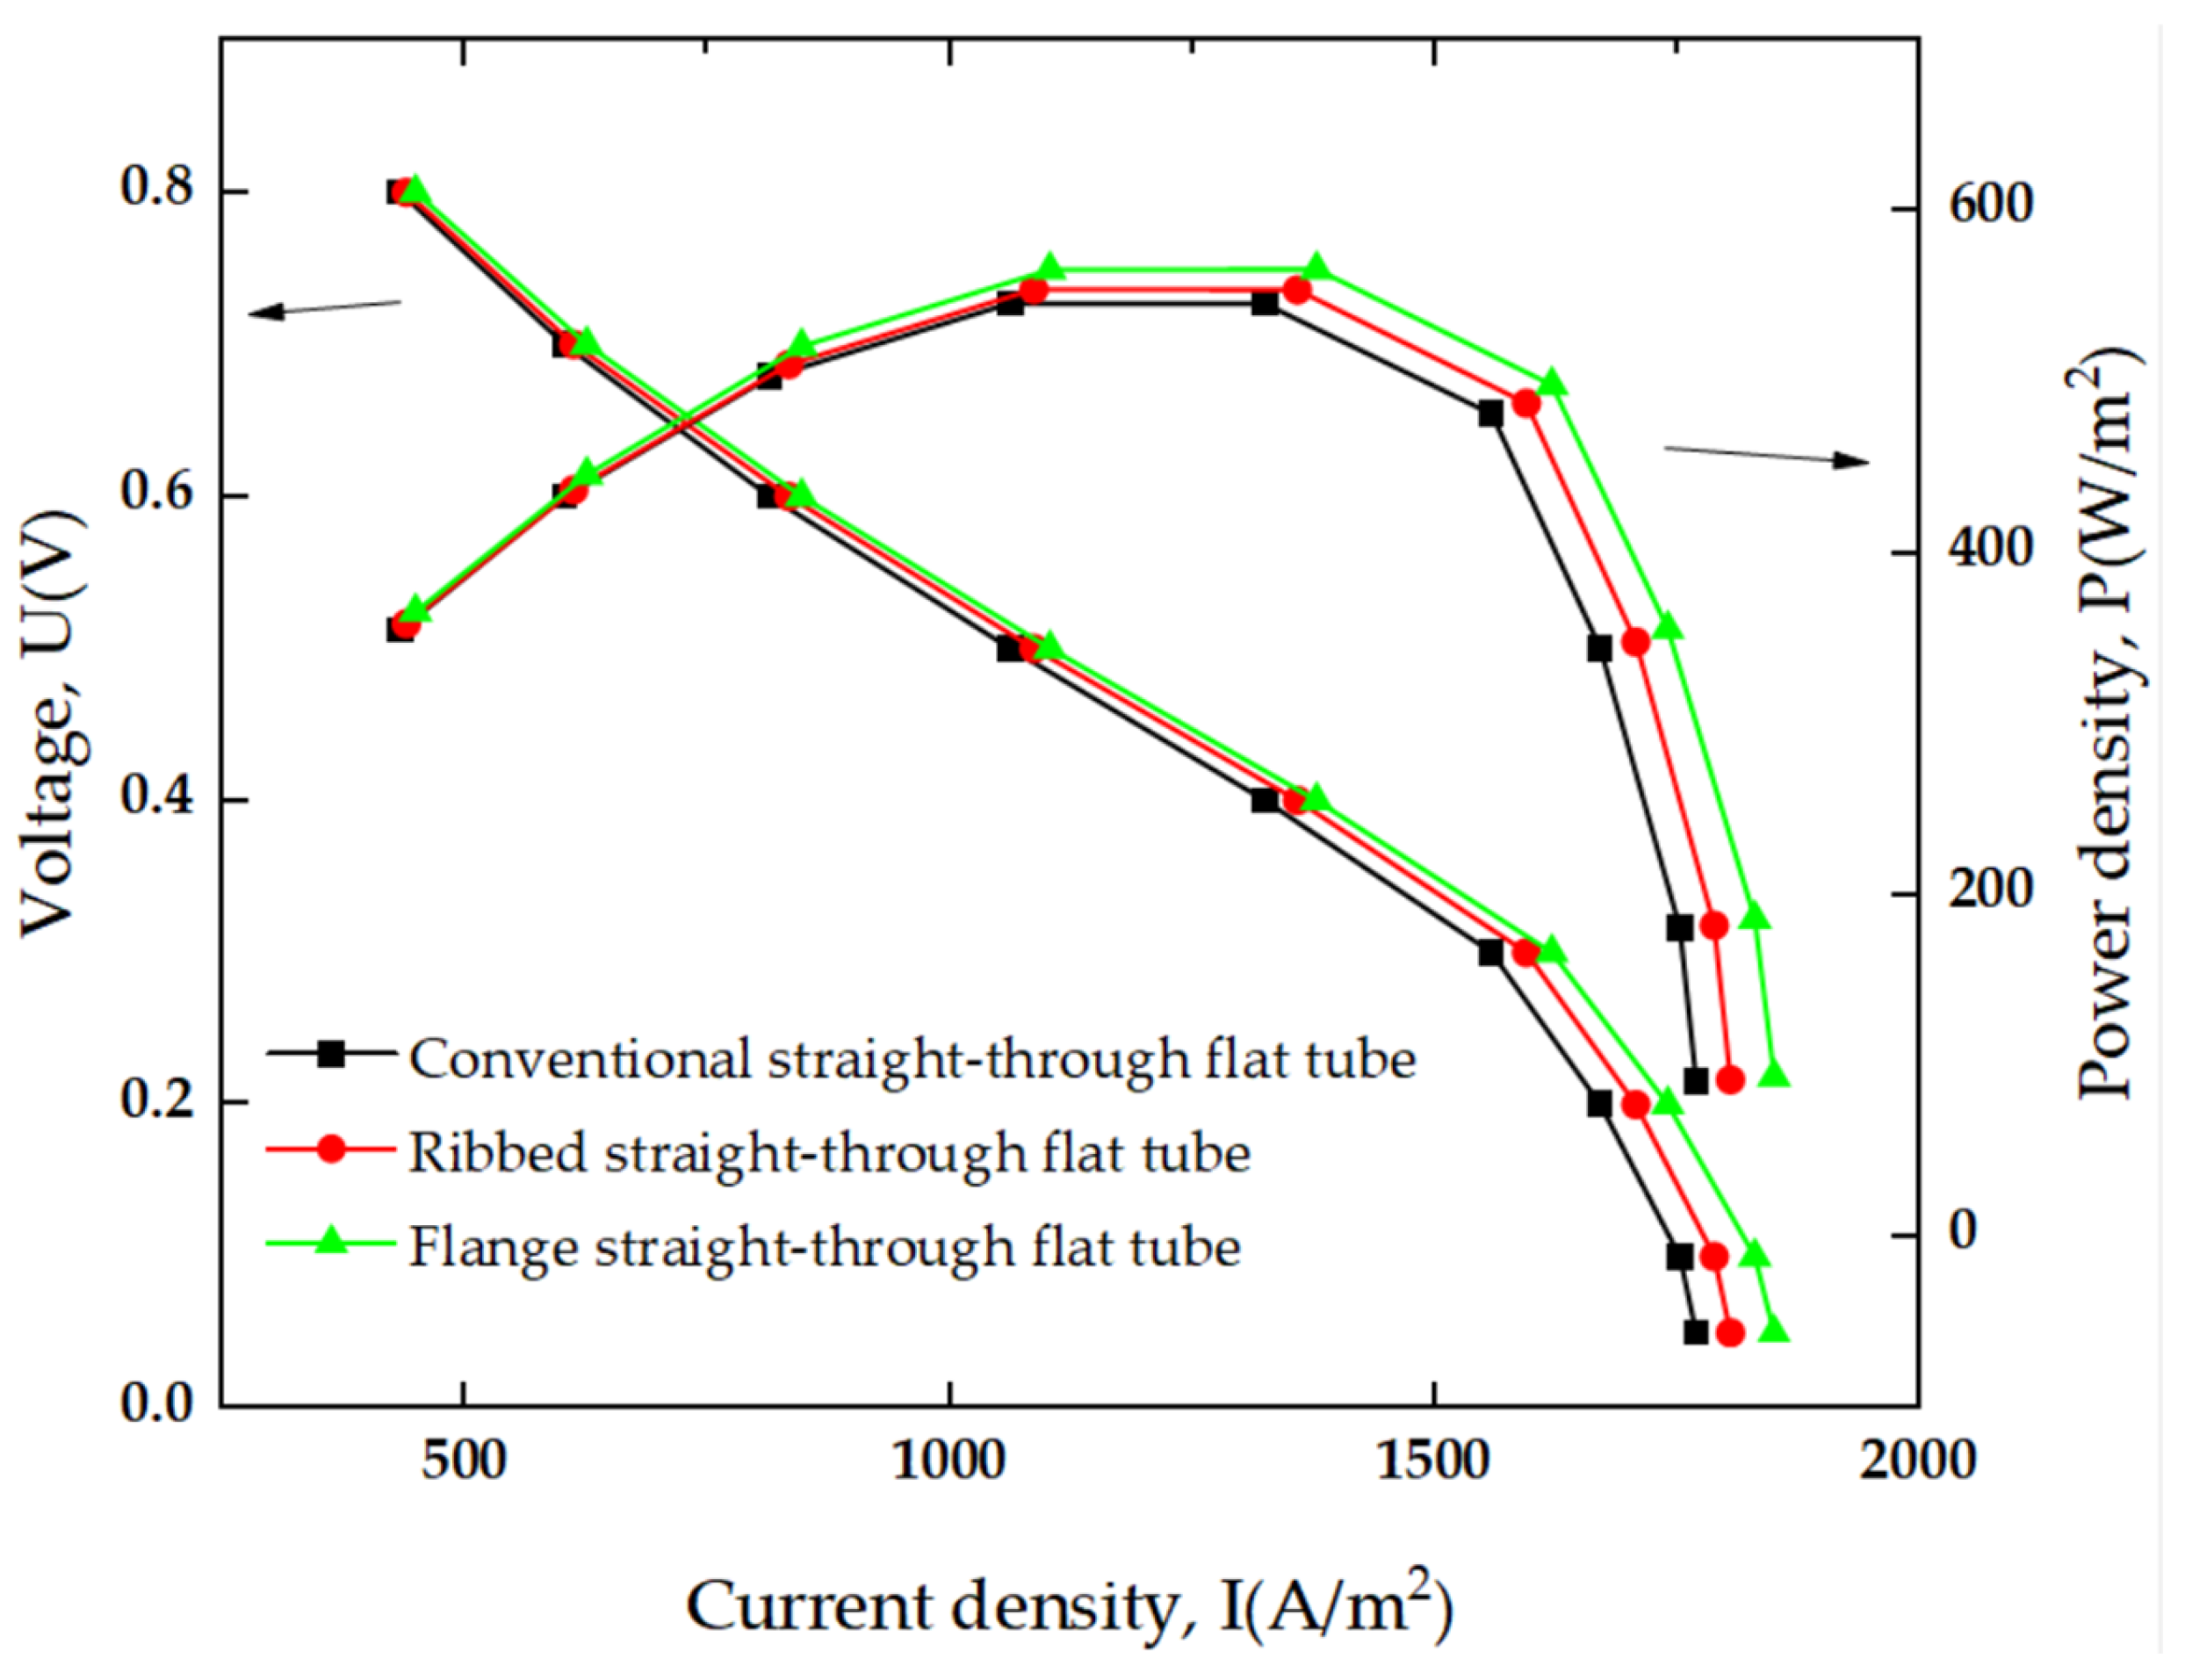
Figure 16 shows the polarization curves and power densities of SOFCs with three different connector structures. From the figure, it can be seen that due to the flange-type connector structure, under the same flat-tube size parameters, the inner tube diameter at the inlet is smaller than that of the conventional straight-through flat tube. Under constant flow inlet conditions, the smaller tube diameter increases the flow velocity, and with a smaller electrochemical reaction area, the consumption of fuel gas and air on the anode side is significantly reduced, meaning the reaction at the inlet is much smaller compared to the other two structures. At the outlet of the inner tube, the tube diameter suddenly increases, the reaction area greatly expands, the electrochemical reaction proceeds rapidly, and the output power increases quickly. The SOFC voltage losses, including ohmic losses, activation losses, and concentration losses, increase with the current density. When the voltage loss reaches a certain level, the power of the fuel cell begins to decrease after reaching its peak. The power density of the SOFCs of all connector structures increases with the current density and then starts to decrease rapidly after reaching the peak.

3.4.3. Temperature Distribution of a Single Cell

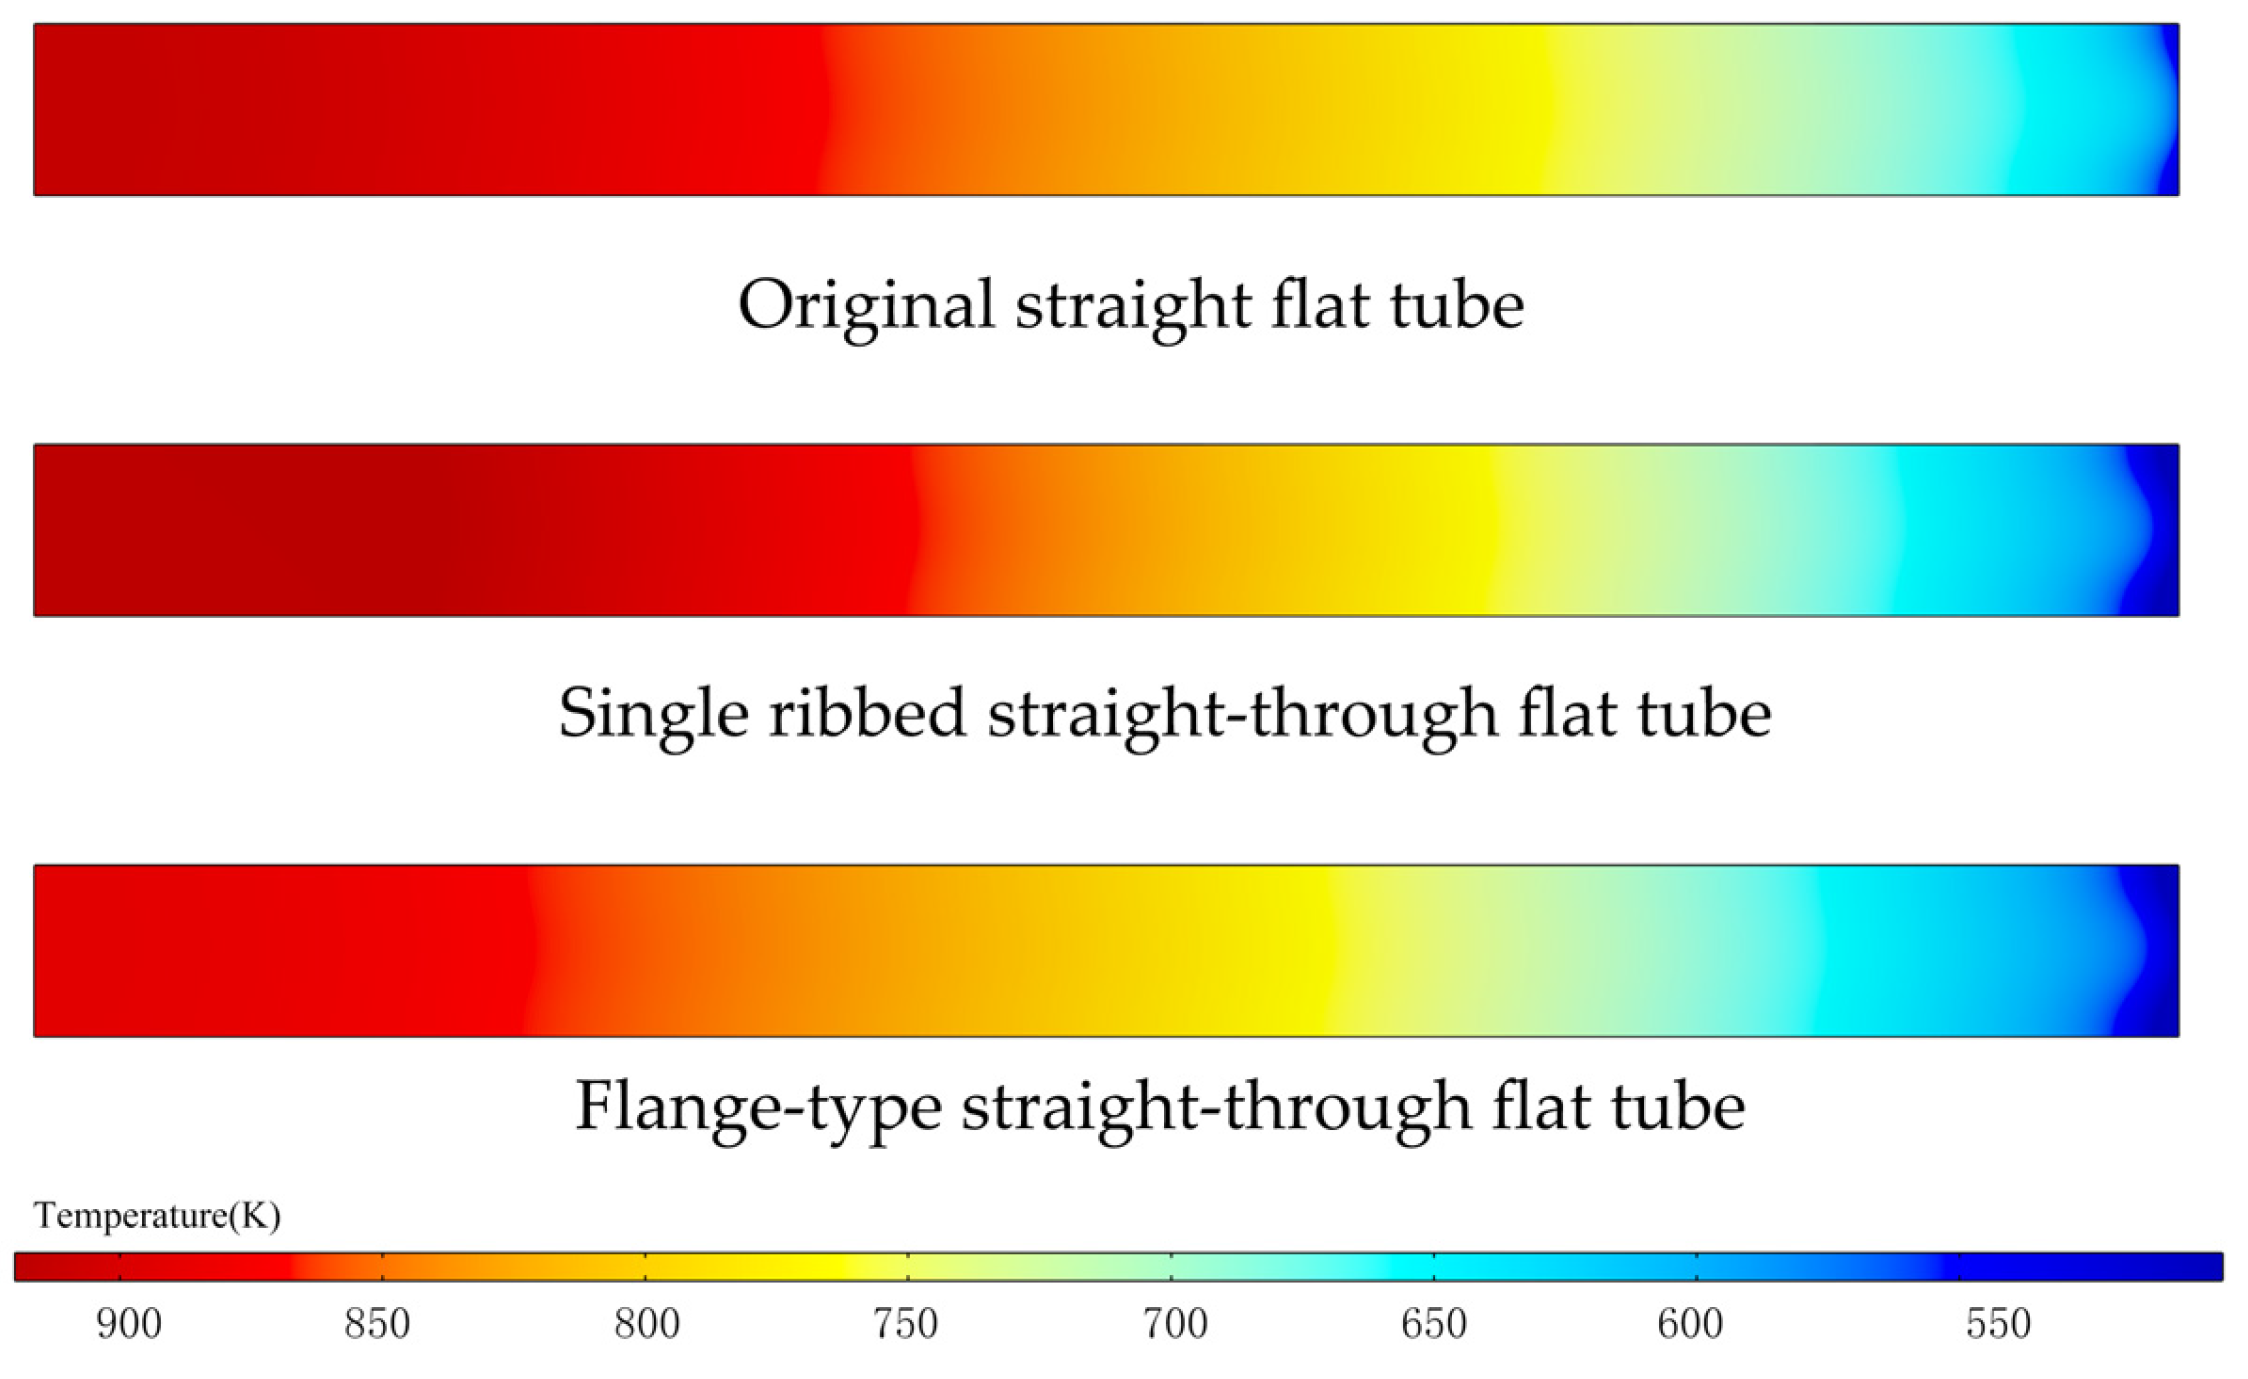
The uniformity of temperature has a significant impact on the failure of SOFCs, mainly with respect to thermal stress/cracks, material degradation, and thermal runaway. The two former points are certainly self-explanatory. Regarding thermal runaway, a more exact expression would be a positive-feedback-like interaction between hot spots/regions and their enhanced reaction and heat generation. Strong nonuniform temperature will lead to large difference in the rate of electrochemical reactions in an SOFC, while in regions with higher temperatures, the reactions may be too intense, resulting in local overheating. Therefore, improvement of temperature distribution in the SOFC is also a goal of this work. Figure 17 shows the temperature distribution of three different SOFC connection structures at a working voltage of 0.8 V. The increase in cell temperature is primarily caused by the heat generated from electrochemical reactions within the cell, activation polarization heat, and the ohmic heat from contact resistance. The temperature in all three connection structures of the SOFC gradually decreases along the gas flow direction. Compared to the conventional flat-tube structure, the ribbed SOFC has a similar initial reaction temperature. Under certain conditions, due to the increase in the number of ribs, the reaction area also increases, accelerating the reaction, and the temperature rise finishes in a shorter time. The SOFC with a flange-type structure has a smaller tube diameter at the fuel gas channel inlet, but the flow rate at the inlet is fixed, so the gas flow speed inside the channel increases. The rapid gas flow carries away more heat, resulting in an overall lower temperature compared to the other two structures. In addition, the flow rate of cathode gas is much greater than that of anode gas, leading to more heat being dissipated through convection. Therefore, along the flow direction, the temperature in the cathode flow path rises slower than in the anode.

4. Conclusions

This study analyzes the impacts of three different connector structures on the performance of flat-tube solid oxide fuel cells (SOFCs) using numerical simulation methods, considering the multi-field coupling effects of fluid flow, mass transfer, electrochemical reactions, and heat transfer physics. The main conclusions are as follows:
(1)
Compared to the conventional and ribbed flat-tube structures, the flange-type connector structure SOFC shows higher current density and power density under the same operating conditions. At a working temperature of 800 K, the flange-type connector structure SOFC demonstrates the highest performance improvement, with the maximum power density increasing by 4.13%.
(2)
The temperature of the SOFCs with three connector structures gradually increases along the flow direction. Under certain conditions, the ribbed flat tube has the highest temperature rise, followed by the conventional and flange-type. The flange-type flat tube has the smallest temperature rise due to the larger heat dissipation area in the flow direction, and under constant mass flow rate inlet conditions, the reduced inlet diameter and increased flow velocity within the tube allow heat to be rapidly carried away by the gas, minimizing the temperature increase.
(3)
Compared to the conventional straight-through SOFC, the flange-type connector structure has the smallest hydrogen gas unevenness, which enhances the hydrogen transport in the anode layer. It helps achieve a uniform fuel gas distribution and output current density distribution, thereby improving the performance of the fuel cell.

Author Contributions

Validation, J.Y. and X.G.; Investigation, J.Y. and X.G.; Writing—original draft, J.Y. and X.G. All authors have read and agreed to the published version of the manuscript.

Funding

This research received no external funding.

Institutional Review Board Statement

Not applicable.

Informed Consent Statement

Not applicable.

Data Availability Statement

The original contributions presented in this study are included in the article. Further inquiries can be directed to the corresponding author.

Conflicts of Interest

The authors declare no conflict of interest.

References

  1. Hagen, A.; Langnickel, H.; Sun, X.F. Operation of solid oxide fuel cells with alternative hydrogen carriers. Int. J. Hydrogen Energy 2019, 44, 18382–18392. [Google Scholar] [CrossRef]
  2. Peng, J.X.; Huang, J.; Wu, X.L.; Xu, Y.W.; Chen, H.C.; Li, X. Solid oxide fuel cell (SOFC) performance evaluation, fault diagnosis and health control: A review. J. Power Sources 2021, 505, 230058. [Google Scholar] [CrossRef]
  3. Al-Khori, K.; Bicer, Y.; Boulfrad, S.; Koç, M. Techno-economic and environmental assessment of integrating SOFC with a conventional steam and power system in a natural gas processing plant. Int. J. Hydrogen Energy 2019, 44, 29604–29617. [Google Scholar] [CrossRef]
  4. Lee, S.; Park, M.; Kim, H.; Yoon, K.J.; Son, J.-W.; Lee, J.-H.; Kim, B.-K.; Choi, W.; Hong, J. Thermal conditions and heat transfer characteristics of high-temperature solid oxide fuel cells investigated by three-dimensional numerical simulations. Energy 2017, 120, 293–305. [Google Scholar] [CrossRef]
  5. Tseronis, K.; Fragkopoulos, I.; Bonis, I.; Theodoropoulos, C. Detailed multi-dimensional modeling of direct internal reforming solid oxide fuel cells. Fuel Cells 2016, 16, 294–312. [Google Scholar] [CrossRef]
  6. Kong, W.; Gao, X.; Liu, S.; Su, S.; Chen, D. Optimization of the interconnect ribs for a cathode-supported solid oxide fuel cell. Energies 2014, 7, 295–313. [Google Scholar] [CrossRef]
  7. Zeng, S.M.; Zhang, X.Q.; Chen, J.S.; Li, T.S.; Andersson, M. Modeling of solid oxide fuel cells with optimized interconnect designs. Int. J. Heat Mass Transf. 2018, 125, 506–514. [Google Scholar] [CrossRef]
  8. Blum, L.; Meulenberg, W.A.; Nabielek, H.; Steinberger-Wilckens, R. Worldwide SOFC technology overview and benchmark. Int. J. Appl. Ceram. Technol. 2005, 2, 482–492. [Google Scholar] [CrossRef]
  9. Chen, R.Y.; Gao, J.T.; Gao, Y.; Zhang, H.Y.; Li, C.X. Advances in Tubular Solid Oxide Fuel Cell Technology. J. Chin. Ceram. Soc. 2024, 52, 1900–1916. [Google Scholar]
  10. Zhang, Q.Y.; Yang, Q.G.; Xu, H.T.; Mao, Y.J.; Wang, K.; Liu, S. Simulation study on the influence of different flow field structures on the performance of PEMFC. Acta Energiac Solaris Sin. 2023, 44, 62–67. [Google Scholar]
  11. Wu, S.W.; Fu, L.R.; Liu, W.F.; Zhang, X.S.; Liu, J.Y.; Gong, P.H. Simulation and performance study of mass transfer in a new expanded flow path PEMFC. Acta Energic Solaris Sin. 2023, 44, 74–79. [Google Scholar]
  12. Zhan, R.B.; Wang, Y.; Ni, M.; Zhang, G.B.; Du, Q.; Jiao, K. Three-dimensional simulation of solid oxide fuel cell with metal foam as cathode flow distributor. Int. J. Hydrogen Energy 2020, 45, 6897–6911. [Google Scholar] [CrossRef]
  13. Chen, Q.Y.; Wang, Q.W.; Zhang, J.; Yuan, J.L. Effect of bi-layer interconnector design on mass transfer performance in porous anode of solid oxide fuel cells. Int. J. Heat Mass Transf. 2011, 54, 1994–2003. [Google Scholar] [CrossRef]
  14. Liu, Y.; Hashimoto, S.I.; Nishino, H.; Takei, K.; Mori, M.; Suzuki, T.; Funahashi, Y. Fabrication and characterization of micro-tubular cathode-supported SOFC for intermediate temperature operation. J. Power Sources 2007, 174, 95–102. [Google Scholar] [CrossRef]
  15. Yan, M.; Fu, P.; Li, X.; Zeng, M.; Wang, Q. Mass transfer enhancement of a spiral-like interconnector for planar solid oxide fuel cells. Appl. Energy 2015, 160, 954–964. [Google Scholar] [CrossRef]
  16. Moreno-Blanco, J.; Elizalde-Blancas, F.; Riesco-Avila, J.M.; Belman-Flores, J.M.; Gallegos-Muñoz, A. On the effect of gas channels-electrode interface area on SOFCs performance. Int. J. Hydrogen Energy 2019, 44, 446–456. [Google Scholar] [CrossRef]
  17. Ergürhan, A.A.; Şenel, O.; Yılmaz, E.; Arpapay, B.; Kulakcı, M.; Serincan, U. Effect of tilt angle and drying temperature on the surface coverage rate of polystyrene nanospheres in evaporation-driven self-assembly process. J. Micro/Nanopatterning Mater. Metrol. 2024, 23, 013001. [Google Scholar] [CrossRef]
  18. Yang, N.T.; Shen, Y.C.; Yan, W.; Meng, X.X.; Tan, X.Y.; Ma, Z.F. Microstructure and Performance of Anode in Micro Tube Solid Oxide Fuel Cells. J. Inorg. Mater. 2014, 29, 1246–1252. [Google Scholar]
  19. Lin, Z.; Stevenson, J.W.; Khaleel, M.A. The effect of interconnect rib size on the fuel cell concentration polarization in planar SOFCs. J. Power Sources 2003, 117, 92–97. [Google Scholar] [CrossRef]
  20. Wang, G.L.; Yang, Y.Z.; Zhang, H.O. Three dimensional thermal electrochemical analysis of solid oxide fuel cells. CSEE J. Power Energy Syst. 2007, 27, 99–103. [Google Scholar]
  21. Canavar, M.; Timurkutluk, B. Design and fabrication of novel anode flow-field for commercial size solid oxide fuel cells. J. Power Sources 2017, 346, 49–55. [Google Scholar] [CrossRef]
  22. Schluckner, C.; Subotić, V.; Preißl, S.; Hochenauer, C. Numerical analysis of flow configurations and electrical contact positions in SOFC single cells and their impact on local effects. Int. J. Hydrogen Energy 2019, 44, 1877–1895. [Google Scholar] [CrossRef]
  23. Li, Z.H.; Guo, X.Y. Numerical analysis of the influence of connector structure on the performance of solid oxide fuel cells. Energy Res. Inf. 2023, 39, 128–135. [Google Scholar]
  24. Qiao, Y.X.; Fan, C.; Sun, K.N. Exploration of the configuration of anode current collecting ribs in flat tube fuel cells. Chin. J. Power Sources 2023, 47, 79–82. [Google Scholar]
  25. Zhao, F.; Virkar, A.V. Dependence of polarization in anode-supported solid oxide fuel cells on various cell parameters. J. Power Sources 2005, 141, 79–95. [Google Scholar] [CrossRef]
  26. Mustafa, F.C.; Mustafa, I.; Senay, Y. Effects of physical properties and operating parameters on numerically developed flat-tube solid oxide fuel cell performance. Int. J. Hydrogen Energy 2023, 48, 23136–23145. [Google Scholar]
  27. Jia, J.X.; Shen, S.Q.; Liu, X.H.; Abdullah, A. Analysis of Ohmic Polarization of Single Tube Solid Oxide Fuel Cells. Acta Energic Solaris Sin. 2004, 25, 457–461. [Google Scholar]
  28. Wu, Q.Q. Research on Micro Tube Solid Oxide Fuel Cells Using Methane as Fuel. Master’s Thesis, Nanjing University, Nanjing, China, 2017. [Google Scholar]
  29. Shi, Y.X.; Li, C.; Cai, N.S. Mechanism Model and Performance Analysis of Tubular Solid Oxide Fuel Cells. CIESC J. 2007, 58, 6. [Google Scholar]
  30. Liu, H.Y.; Ji, X.Y.; Zhou, X.; Yang, Y. Study on the Influence of Fuel Gas Parameters on the Discharge Characteristics of Solid Oxide Fuel Cells. Hunan Electr. Power 2023, 43, 31–36. [Google Scholar]
  31. COMSOL, Inc., COMSOL Multiphysics Reference Manual. Available online: https://doc.comsol.com/6.3/docserver/#!/com.comsol.help.comsol/html_COMSOL_ReferenceManual.html (accessed on 10 August 2025).
  32. Tonekabonimoghadam, S.; Akikur, R.; Hussain, M.; Hajimolana, S.; Saidur, R.; Ping, H.; Chakrabarti, M.; Brandon, N.; Aravind, P.; Nayagar, J. Mathematical modelling and experimental validation of an anode-supported tubular solid oxide fuel cell for heat and power generation. Energy 2015, 90, 1759–1768. [Google Scholar] [CrossRef]
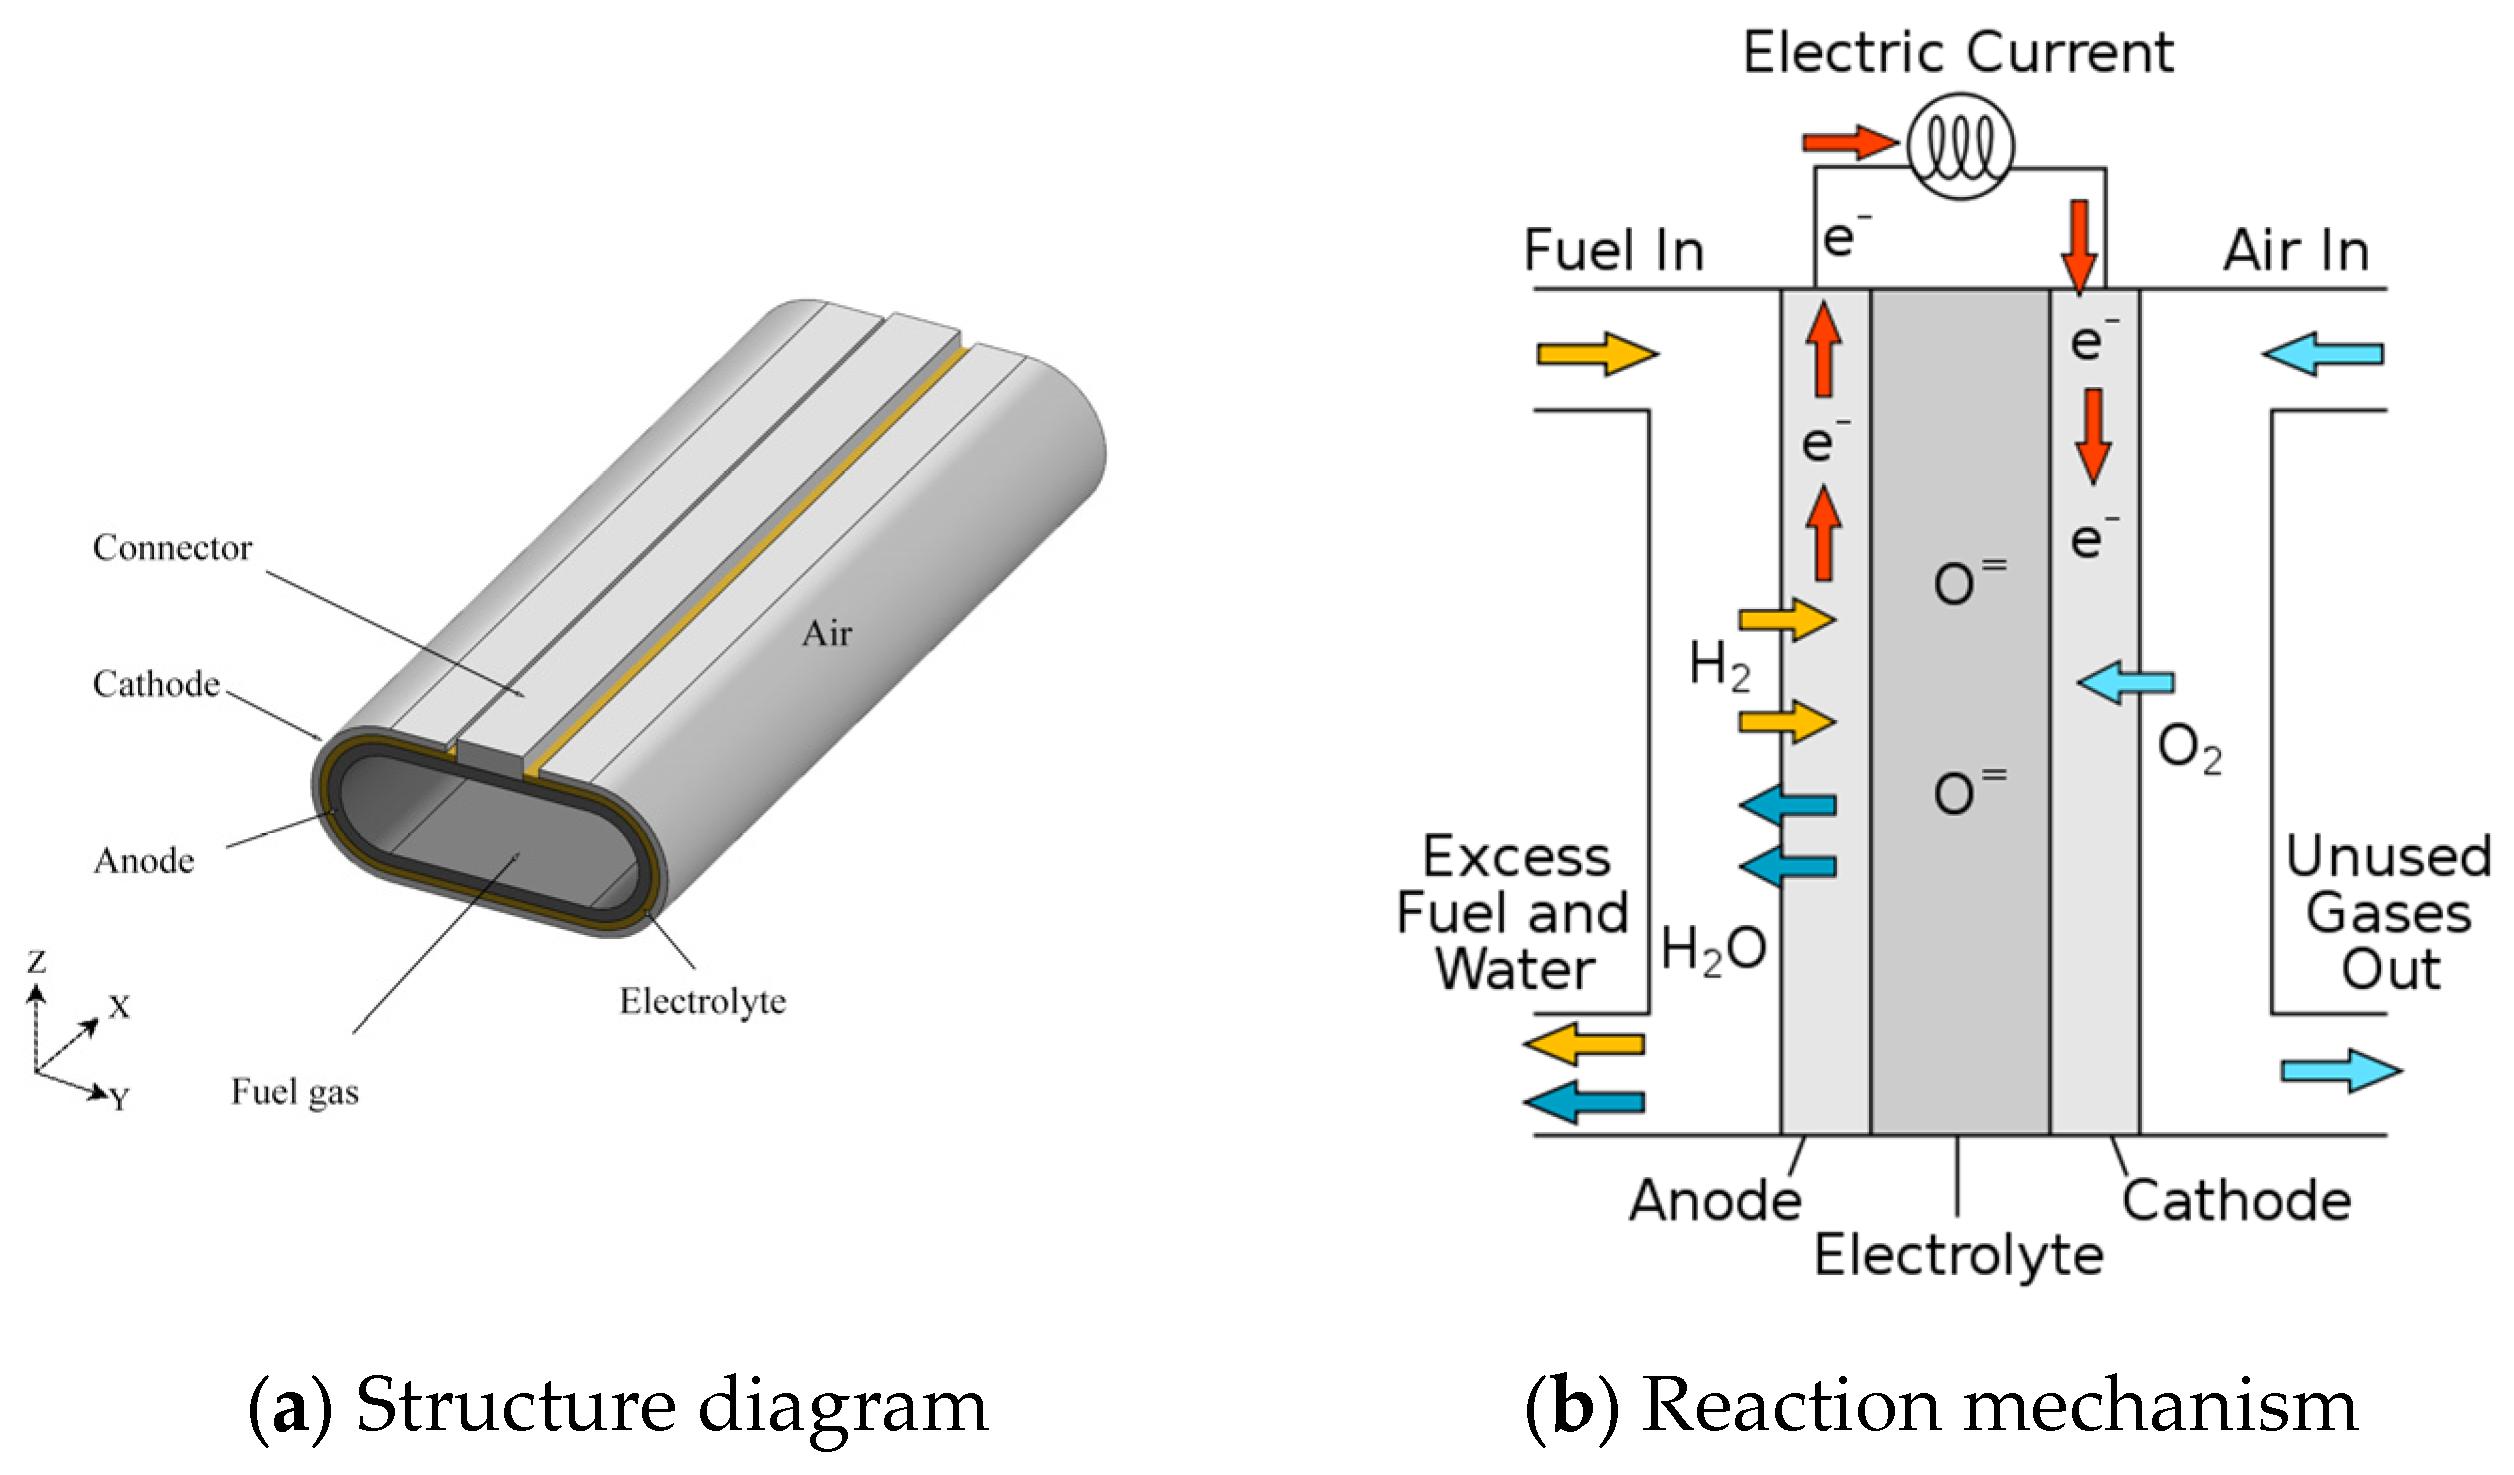
Figure 1. Structure and mechanism of a flat tubular SOFC (the brown arrows for fuel flow, the blue for air/water flows, and the red for electron flow).
Applsci 15 09251 g001
Figure 2. Three-dimensional models of SOFC with different connector structures.
Applsci 15 09251 g002
Figure 3. Grid independence verification.
Applsci 15 09251 g003
Figure 4. Model validation [32].
Applsci 15 09251 g004
Figure 5. Rib-shaped connector structure.
Applsci 15 09251 g005
Figure 6. Hydrogen mole fraction distribution of straight-through flat tubes under four different rib numbers.
Applsci 15 09251 g006
Figure 7. Polarization curves of straight-through flat tubes with four different numbers of ribs.
Applsci 15 09251 g007
Figure 8. Structural diagram of spacing between ribbed connectors.
Applsci 15 09251 g008
Figure 9. Hydrogen mole fraction distribution of six different rib spacing straight-through flat tubes.
Applsci 15 09251 g009
Figure 10. Polarization curves of six different rib spacing straight-through flat tubes.
Applsci 15 09251 g010
Figure 11. Model diagram of separator-type inner tube length.
Applsci 15 09251 g011
Figure 12. Hydrogen mole fraction distribution of flange-type connectors with four different inner tube lengths.
Applsci 15 09251 g012
Figure 13. Polarization curves of flange-type connectors with four different inner pipe lengths.
Applsci 15 09251 g013
Figure 14. Flow channel streamlines and hydrogen mole fraction (color contour).
Applsci 15 09251 g014
Figure 15. Hydrogen mole fraction distribution with three different linker structures.
Applsci 15 09251 g015
Figure 16. Polarization curves of three different connector structures.
Applsci 15 09251 g016
Figure 17. Temperature distribution of SOFCs with different connector structures.
Applsci 15 09251 g017
Table 1. Geometry of the models.
SOFC Component Parameters/UnitsValue
Cathode thickness/mm0.05
Anode thickness/mm0.56
Electrolyte thickness/mm0.01
Flow channel length/mm100.00
Table 2. Operating conditions and material properties.
Parameter Name/UnitValue
Pressure/Pa101,325
Voltage/V0.8
Cathode density/(kg·m−3)8750
Anode density/(kg·m−3)8640
Electrolyte density/(kg·m−3)2000
Connector density/(kg·m−3)8700
Cathode specific heat capacity/[J·(kg·K)−1]385
Anode specific heat capacity/[J·(kg·K)−1]380
Electrolyte specific heat capacity/[J·(kg·K)−1]300
Connector specific heat capacity/[J·(kg·K)−1]396
Table 3. Details of all different cases set up in this work.
Connection TypeNumber of CasesUsage
Traditional straight flat tube1To use as a base case to compare with the other cases with structural modification.
Ribbed straight-through flat tube4To calculate the flat tube models with 1, 2, 3, and 4 ribs, respectively, and to investigate the influence of multiple ribs on the performance of a single cell.
6To calculate the flat tube models with six different rib distances to find out the influence of the rib distance on the performance of a single cell.
Flange straight-through flat tube4To calculate the models of flange-type connectors with various inner tube length of 20 mm, 30 mm, 40 mm, and 50 mm, and to investigate the influence of the inner tube length on the performance of a single cell.
Table 4. Main geometric shape dimensions of the connectors.
Parameter Name/UnitValue
Flat tube length/mm25
Flat tube width/mm6
The radius of a semicircle/mm3
Rib width/mm0.5
Distance between the ribs/mm4
Disclaimer/Publisher’s Note: The statements, opinions and data contained in all publications are solely those of the individual author(s) and contributor(s) and not of MDPI and/or the editor(s). MDPI and/or the editor(s) disclaim responsibility for any injury to people or property resulting from any ideas, methods, instructions or products referred to in the content.