Article

The Influence of the Ethyl Oleate and n-Hexane Mixture on the Wetting and Lubricant Properties of Canola Oil

by
Anna Zdziennicka
*,
Katarzyna Szymczyk
and
Bronisław Jańczuk
Department of Interfacial Phenomena, Institute of Chemical Sciences, Faculty of Chemistry, Maria Curie-Skłodowska University in Lublin, Maria Curie-Skłodowska Sq. 3, 20-031 Lublin, Poland
*
Author to whom correspondence should be addressed.
Appl. Sci. 2025, 15(17), 9243; https://doi.org/10.3390/app15179243
Submission received: 17 July 2025 / Revised: 12 August 2025 / Accepted: 21 August 2025 / Published: 22 August 2025

Abstract

Canola oil (RO) is increasingly being considered as a potential lubricant for various types of abrasive materials. Unfortunately, its properties such as wettability, surface tension (ST), adhesion work and dynamic viscosity do not always meet the requirements of a lubricant. Therefore, these properties of RO were modified by adding n-hexane (Hex) and ethyl oleate (EO) to it and the result was analyzed based on the contact angle measurements as well as values of surface tension and dynamic viscosity. Contact angle, being a measure of wetting properties, was determined for RO + Hex, RO + EO, EO + Hex and RO + Hex + EO mixtures on polytetrafluoroethylene (PTFE), poly (methyl methacrylate) (PMMA) and steel. The obtained results allowed for the determination of the components and parameters of the surface tension of the tested mixtures and then the adhesion work of these mixtures to PTFE, PMMA and steel. Then, using different approaches to the work of adhesion, the pressure of the adsorption layer on the PMMA and steel surfaces was determined, which has a significant impact on the wettability of these solids. It was found that the addition of Hex to RO reduces its surface tension, adhesion work and dynamic viscosity and increases the wetting properties of RO. Adding EO to RO slightly lowers its surface tension, greatly decreases its dynamic viscosity and has minimal impact on its adhesive and wetting characteristics. When both EO and Hex are added to RO together, the resulting mixture achieves optimal values for the parameters that influence RO’s lubrication properties.

1. Introduction

The demand for lubricants for lubricating machines and various types of materials is growing every year. However, it turns out that the use of lubricant substances obtained from crude oil can be increasingly harmful to the environment [1,2,3,4]. Due to the presence of certain chemical elements such as sulphur in petroleum-derived lubricants, they are poorly degradable, and toxic compounds are produced during their combustion. An alternative to these lubricants is biolubricants, which are ecological, renewable and of high quality [1,2,3,5,6,7,8]. Therefore, it seems that vegetable oils, including canola oil containing large amounts of oleic acid, can replace conventional lubricants [9,10,11,12,13,14,15,16,17]. Vegetable oils can be good lubricants, particularly at high temperatures, due to their high viscosity [7].
The use of canola oil (RO) is not only related to the food industry [18,19] but also as an additive to diesel fuel, improving the lubricity of diesel engines [5,20,21,22]. Numerous studies [20,23,24,25] also indicate the possibility of using canola oil as a biofuel for diesel engines. Unfortunately, the use of RO for high-pressure engines adapted to diesel oil as either a lubricant or fuel requires modification of its physicochemical properties by appropriate additives [26,27]. At the same time these additives should reduce the RO viscosity significantly and its surface tension and density slightly. It turned out that these conditions can be met by adding n-hexane (Hex) and ethyl oleate (EO) to canola oil [28].
If the RO + Hex + RO mixture is to be used as biofuel, its lubricating properties play an important role. Previous studies have shown that the abrasion of steel balls with 10–15% addition of Hex to RO is smaller than in RO alone despite the significant reduction in RO viscosity [26]. This is consistent with the fact that liquids with smaller viscosity at lower temperatures are better liquefiers than those with high viscosity.
In the literature there are many studies on the usefulness of various lubricating layers in various machines or materials, but there is no research on the physicochemical reasons for this usefulness. It is known that the viscosity of a liquid or a mixture of lubricating liquids plays a large role in the lubrication process [29]. On the other hand, viscosity is a physicochemical parameter of the bulk phase, and lubrication depends more on the interfacial region. One of the most important properties of this region is the adhesion of the lubricating liquid to the surface of the solid. It should be noted that effective interfacial parameters such as contact angle and surface tension are correlated with lubrication. Lubrication is a dynamic process whereas the contact angle is a static measurement and is helpful for determining the adhesion between solid and liquid. On the other hand, the interfacial parameters reflect the adhesion work between the solid and liquid. However, both the contact angle and the trace diameter, being parameters of the dynamic lubrication process, depend on the solid and liquid surface tension as well as the solid–liquid interface tension.
Substantial adhesion of a given liquid or solution to the solid surface provides greater stability to the lubricating layer. On the other hand, the lower the solution surface tension in relation to the solid surface tension, the higher the spreading coefficient, which facilitates formation of a lubricating layer on the solid. The measure of adhesion of a liquid or mixture to the solid surface is the work of adhesion. The literature reports two basic theories regarding the adhesion of a liquid or mixture to a solid [30,31,32,33,34,35,36,37]. The first assumes that the adhesion work is a function of the total surface tension of the solid and liquid [30,31,32]. The other assumes that it is a function of the components and parameters of the mentioned tensions [33,34,35,36,37]. Complete spreading of a liquid or solution on the solid surface should take place when its surface tension is equal to or smaller than that of the solid [30,34]. Unfortunately, in practice this condition is not always met [38]. It turns out that not only the values of the total surface tension of the liquid and the solid decide the spreading coefficient but also the contribution of the Lifshitz–van der Waals (LW) and acid–base (AB) components to these tensions [38]. In other words, the best wettability of a solid by a liquid is observed when the percentage contributions of the individual components to the surface tension of the solid and the liquid are similar [34].
In the case of steel used in the construction of diesel engines, its surface tension results mainly from the LW interactions, and the AB component contribution is not large. Therefore, in order to improve the wetting properties of canola oil, the addition of apolar and monopolar substances to it can be effective. For this reason, the aim of this paper was to analyze thermodynamically the wettability of PTFE, PMMA and steel by a mixture of RO with Hex and EO. This analysis was based on contact angle measurements of binary mixtures of RO + EO, EO + Hex, RO + EO and RO + EO + Hex. The obtained contact angle values of these mixtures on PTFE and PMMA were helpful in determining the components and parameters of their surface tension, which were then applied in analyzing the wetting and adhesion processes in the steel–canola oil with the additive system.

2. Materials and Methods

2.1. Materials

The materials used in the study included canola oil (rapeseed oil, RO) branded as Kujawski (produced by ZT “Kruszwica” S.A., Kruszwica, Poland), n-hexane (Hex, 99.8%, supplied by POCH, Gliwice, Poland), and ethyl oleate (EO, 99.9%, from Organic Chemistry, Bielsko-Biała, Poland). RO, Hex and EO were used without further purification. Binary mixtures of RO + Hex, RO + EO and EO + Hex, along with the ternary mixture RO + Hex + EO, were prepared according to the compositions listed in Table 1. The mixtures were stored in tightly sealed containers at a temperature of 293 K [28]. The physicochemical properties of the prepared mixtures were analyzed, taking into account their composition expressed in mole fractions.
As model solids polytetrafluoroethylene (PTFE) and poly (metyhyl methacrylate) (PMMA) (Mega-Tech, Tomaszów Mazowiecki, Poland) were used as well as flat steel plates (ZM Silesia SA, Katowice, Poland).

2.2. Methods

Advancing contact angles ( θ ) were measured in the solid–liquid drop–air system at 293 K, applying the DSA30 measuring system (Krüss, Hamburg, Germany) equipped with a thermostated chamber. For all used solids solutions, ten drops of 7 μL were settled on their surfaces. The standard deviation of the contact angle values did not exceed ± 2°.

3. Results and Discussion

3.1. Wetting and Adhesion Properties of RO, Hex and EO

To gain insight into the wetting behavior of the canola oil (RO) mixture with n-hexane (Hex) and ethyl oleate (EO) and to assess its lubricating performance, a thermodynamic analysis of the wetting properties of RO, EO and Hex is necessary.
Wetting of a solid by a liquid can occur as a result of its immersion into a liquid, by contact with a liquid, or by a liquid spreading over its surface. Spreading of a liquid over a solid surface depends on the difference between the work of adhesion of a liquid to the surface of the solid ( W a ) and the work of cohesion of a liquid ( W a ). In turn, W a depends on the liquid ( γ L V ) and solid ( γ S V ) surface tensions as well as the solid–liquid interface tension ( γ S L ) and can be described using the following equation [36]:
W a = γ L V + γ S V γ S L .
In the process of spreading wetting, the W a values can be analyzed based on the measured values of the contact angle ( θ ).
Fowkes [33], van Oss et al. [34,35,36,37], Neumann et al. [30,31,32] and other authors [39,40] suggest that if θ is in the range from 0 to 180°, then it fulfils the original Young equation, which can be expressed as [41]
γ S V γ S L = γ L V c o s θ .
Some authors suggest that even when considering the wettability of solids with a surface tension smaller than that of the wetting liquid, the Young’s equation takes the form [33,38]
γ S V , f γ S L , f = γ L V c o s θ ,    
where γ S V , f is the surface tension of the solid covered with the adsorption film, and γ S L , f is the solid/covered with the adsorption film–liquid interface tension.
In the other words, γ S V , f is the solid surface tension reduced by the adsorption film pressure ( π S V ), and γ S L , f is the solid–liquid interface reduced by adsorption film pressure ( π S L ). Taking into account the π S V and π S L in Equation (3), the following can be obtained:
γ S V π S V ( γ S L π S L ) =   γ L V c o s θ .
If in the solid–liquid drop–air system the π S V = π S L , then Equation (4) assumes the form of Equation (2). Many authors [4,5,6,7,8,9,10,11,12,13,14,15,16,17,18,19,20,21] believe that in the case of liquids having γ L V γ S V , π S V = 0 and π S L = 0 ,   W a can be determined from the Young–Dupre equation, which results from the Equations (1) and (2) and has the following form [41]:
W a = γ L V c o s θ + 1 .
This proves that in the case of apolar polytetrafluoroethylene (PTFE), the polar liquid with a surface tension the same as that of PTFE does not spread over its surface completely, and Equation (5) is not fulfilled. Thus, complete spreading of a liquid over the solid surface depends not only on its surface tension but also on the nature of the forces involved in this tension. Consequently, the van Oss et al. equation [34,35,36,37], which describes the adhesion of a liquid to a solid, appears to be useful for clarifying the conditions required for a liquid to completely spread over a solid surface. This equation has the form
W a = 2 γ S V L W γ L V L W + γ S V + γ L V + γ S V γ L V + ,  
where γ L W is the Lifshitz–van der Waals component of liquid (LV) and solid (SV) surface tensions and the electron-acceptor ( γ + ) and electron-donor ( γ ) parameters of their AB component ( γ A B ).
In the case where the surface tensions of a liquid and a solid or either one of them results from only the Lifshitz–van der Waals intermolecular interactions (LW), it can be written
W a = 2 γ S V L W γ L V L W .
If π S V = 0 and π S L = 0 , then the van Oss et al. equations [34,35,36,37] are consisted with the Young–Dupre one. Thus,
γ L V c o s θ + 1 = 2 γ S V L W γ L V L W + γ S V + γ L V + γ S V γ L V + ,      
and
γ L V c o s θ + 1 = 2 γ S V L W γ L V L W .
When the value of the solid–liquid (solution) surface tension achieves zero, then the complete spreading of liquid over the solid surface takes place, and in such a case,
W a = γ L V + γ S V ,    
or
W a = γ L V + γ S V , f .
Knowledge of W a as well as γ L V and γ S V allows one to determine the spreading coefficient ( S S / L ), which is a measure of the tendency of a liquid to spread over the solid surface. This coefficient can be expressed as [41,42]
S S / L = W a W c = W a 2 γ L V .
To determine the wetting properties of RO and such additives as EO and Hex, their contact angle on polytetrafluoroethylene (PTFE), poly (methyl methacrylate) (PMMA) and steel was measured (Figure 1). Steel, being a weak bipolar solid, was chosen due to the possibility of using RO or RO with additives as its lubricant. On the other hand, apolar PTFE and monopolar PMMA are model solids used for the determination of components and parameters of the surface tension of wetting liquids. These components and parameters can be helpful in determining the wetting power of liquids or solutions on the surfaces of various solids.
Among the liquids used in the wettability studies, Hex is apolar, and its surface tension is smaller than that of PTFE, PMMA and steel [28,43]. Therefore, it should spread completely on the surface of these solids. It turned out that, indeed, for Hex, θ = 0   is observed on the mentioned solids (Figure 1). In turn, EO and RO surface tension values are larger than that of PTFE and smaller than those of PMMA and steel [43,44]. Thus, EO and RO should create a θ on PTFE greater than zero and on PMMA and steel equal to zero. The studies did not completely confirm this conclusion. For all the mentioned solids, θ > 0 for RO and EO (Figure 1). This fact suggests that after deposition of a liquid drop on the PMMA and steel surfaces, it first creates a film whose pressure reduces the γ S V of the solids over which the liquid spreads. To confirm this suggestion the surface tensions of PTFE, PMMA and steel were calculated using the Neumann et al. equation [30,31,32]:
c o s θ = 2 γ S V γ L V e x p β γ L V γ S V 2   1 .
Here, β is a constant equal to 0.000115 (m2/mJ)2 and, according to Neumann et al., does not depend on the kind of solid and liquid.
It should be noted that when the liquid surface tension is smaller than that of the solid, then the γ S V calculated from Equation (13) can be treated as γ S V , f . It appears that the γ S V of PTFE, PMMA and steel calculated from Equation (13) using the literature values of surface tension [28] and measured contact angle of Hex ( θ H e x ) is smaller than their surface tension and equal to the Hex surface tension (Table 2).
On the contrary, the surface tension of PTFE calculated from the θ values of EO ( θ E O ) and RO ( θ R O ) agrees well with existing literature values [45]. Concerning PMMA and steel, their surface tensions calculated from θ E O and θ R O are much smaller than the literature data [26]. The values of PTFE, PMMA and steel surface tensions obtained in this way lead to the conclusion that in the case of liquids with γ L V <   γ S V , a drop of liquid deposited on such solids spreads over their surface covered with a film of the given liquid. Moreover, this suggests that γ S V covered with a liquid layer is such that the solid/film interface tension is equal to zero.
To confirm this suggestion the W a of Hex, EO and RO to PTFE, PMMA and steel surfaces was analyzed based on these liquids’ and solids’ surface tensions as well as their components and parameters using the above-mentioned Equations. The calculations (Table 2) show that only in the case of Hex is an adsorption layer formed on each studied solid before a drop of Hex spreads over their surfaces. In other words, the Hex drop spreads over the solid/Hex layer surface. However, the change in the surface tension of PTFE due to the Hex layer formation is not large. This is confirmed by the small differences in the values of W a of Hex to PTFE calculated using different methods. This fact proves also that the PTFE–Hex interface tension is equal to zero.
The data in Table 3 suggest that around the EO and RO droplets deposited on the PTFE surface, no adsorption layer is formed that reduces its surface tension. However, unlike Hex, the interface tension of PTFE–EO and PTFE–RO is slightly greater than zero.
In the case of PMMA and steel, formation of EO and RO layers due to the penetration of their molecules from the deposited droplet onto their surfaces cannot be ruled out. This layer reduces the PMMA and steel surface tensions, thus changing the conditions for the droplets spreading. The EO and RO droplets spread on the surface of the PMMA/layer and steel/layer rather than on the clean surfaces of PMMA and steel. The reason for this is probably that the values of the adhesion work of EO and RO to PMMA and steel surfaces depend on how they are determined (Table 3). However, the obtained results of W a of EO and RO to PMMA and steel show that the interface tensions of PMMA–OE, PMMA–RO, steel–EO and steel–RO are close or equal to zero.

3.2. Adhesion and Wetting Behavior of EO + Hex, RO + Hex, and RO + EO Mixtures

For a better understanding of the effect of n-hexane and ethyl oleate on the wetting and adhesive properties of canola oil, these properties of binary mixtures of RO + Hex, EO + Hex, and RO + EO should be analyzed based on those of the mixture components.
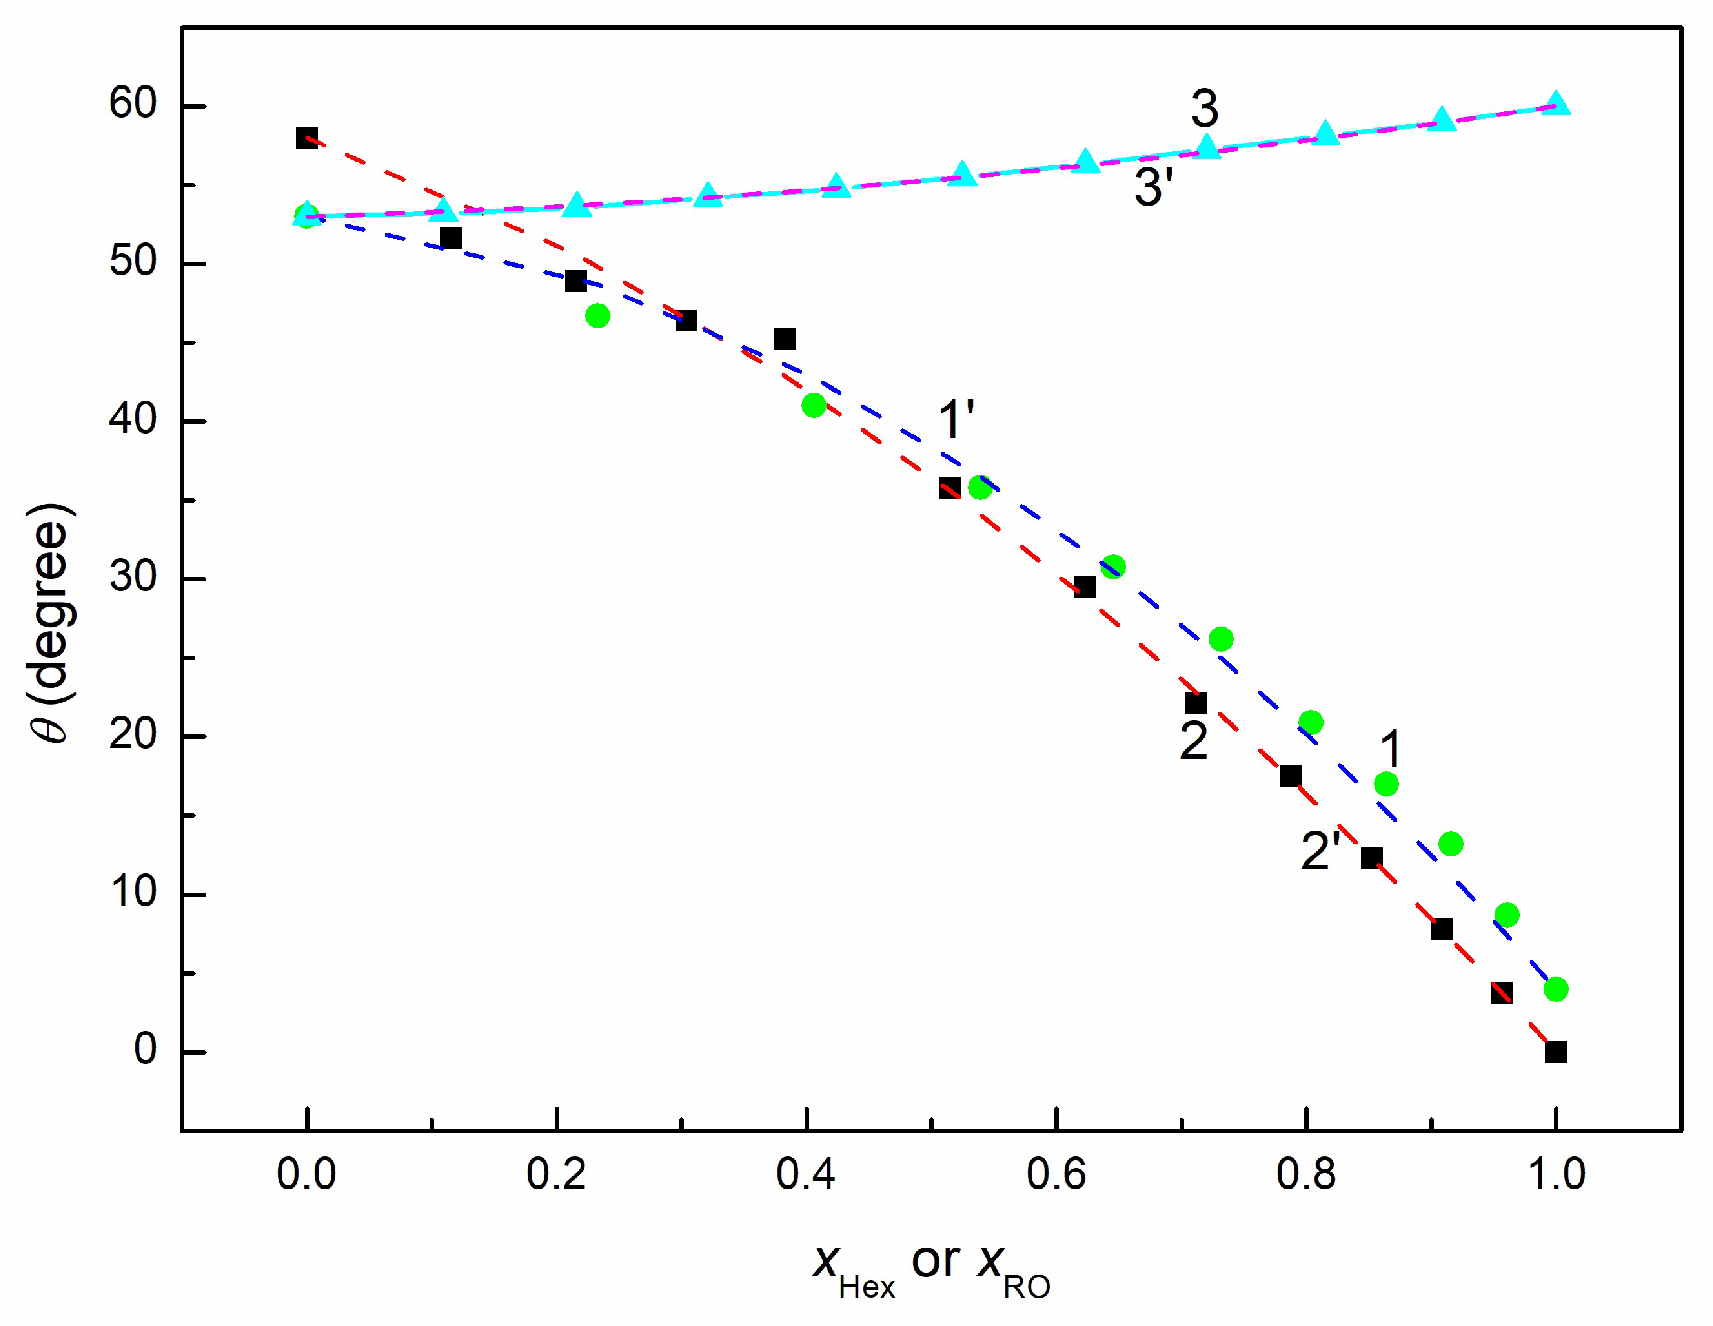
As mentioned above, the wetting properties of a liquid depend not only on its and the wetted solid’s surface tensions but also on the components and parameters of these tensions. Since the γ S V of PTFE results only from the Lifshitz–van der Waals intermolecular interactions, and it cannot form hydrogen bonds with the adjacent medium, only the LW component of binary mixtures determines their adhesion to PTFE and at the same time has a decisive influence on the contact angle. As follows from the literature data [26], the contact angle of the EO + Hex mixtures can be described by the expression (Figure 2)
θ = θ H e x x H e x + θ E O x E O ,      
where x is the mole fraction of a given component of the mixture.
The agreement between the θ values measured and calculated using Equation (14) for the EO + Hex mixtures indicates that these mixtures are ideal, and the fraction of the PTFE–solution interface occupied by the Hex and EO molecules is the same as their molar fractions in the bulk phase. For these mixtures, the θ values on the PTFE surface are determined only by the LW interactions. It should be remembered that despite the fact that for EO γ > 0, it is not possible to form hydrogen bonds with Hex or PTFE.
To confirm the conclusion that the surface tension of the EO + Hex mixtures is indeed due to only the Lifshitz–van der Waals intermolecular interactions, the γ L V L W component was calculated from Equation (9) based on the measured θ values of this mixture on PTFE (Figure 3).
As can be seen in Figure 3, the γ L V L W component of the EO + Hex mixtures, except for a very high Hex concentration in the mixture, is equal to the mixture surface tension. In the case of high Hex concentration, the surface tension of the EO + Hex mixture is smaller than that of PTFE, and the adsorption layer on PTFE reduces its surface tension. Probably for this reason the γ L V L W values calculated using Equation (9) for the EO + Hex mixtures at a high Hex concentration are unrealistic. Nevertheless, it can be stated that the wetting and adhesion properties in the PTFE–EO + Hex mixture system depend on only the Lifshitz–van der Waals intermolecular interactions.
Unlike the EO + Hex mixtures, the RO + Hex mixture is not ideal. This fact is clearly confirmed by the deviation of the contact angle isotherm of the RO + Hex mixture from the linear relationship between θ and the mixture concentration (Figure 2). This isotherm can be described by the equation
θ = θ H e x x H e x + θ R O x R O + 30 x H e x x R O .
This equation suggests that fractions of the PTFE–solution interface occupied by RO and Hex molecules are different from their mole fractions in the bulk phase. It is probable that Hex molecules, by combining with the hydrophobic part of fatty acids, change the interactions between the hydrophobic parts of acid molecules and also influence the hydrogen bonds of one acid molecule with another. This conclusion is confirmed by the isotherm of γ L V L W of the Ro + Hex mixture determined using Equation (9) (Figure 3). It can be stated that in the case of both γ L V and γ L V L W RO + Hex mixture isotherms, on the contrary to the θ isotherm, a negative deviation from the linear relationship between γ L V as well as γ L V L W and the mixture composition is observed (Figure 2 and Figure 3). The effect of n-hexane on the LW component is more significant than its impact on surface tension, resulting in a smaller decrease in the contact angle of RO on PTFE compared to what would be expected if the RO + Hex mixture exhibited ideal behavior. In the case of the mixture of RO + EO, in contrast to that of the RO + Hex, a slight synergistic effect is visible in PTFE wetting (Figure 2). The variation of the contact angle ( θ ) of the RO + EO mixture on PTFE with composition can be represented by the following equation:
θ = θ E O x E O + θ R O x R O 4 x E O x R O .
It is important to highlight that the LW components of the surface tensions of EO and RO are similar, and therefore, for the RO + EO mixtures, there is an almost linear dependence of γ L V L W calculated using Equation (9) as a function of the RO concentration in the mixture. Therefore, the synergetic effect in the wetting of PTFE by the RO + EO mixture is due to the contribution of LW and AB components to this mixture surface tension (Figure 3).
It should be remembered that the surface tension of n-hexane is smaller than that of PTFE, which may result in the influence of the Hex adsorption layer formed on PTFE on its wettability by mixtures containing Hex. To confirm this suggestion, γ S V of PTFE was calculated from Equation (13) for the mixtures with and without Hex. It results from this calculation that the average value of PTFE γ S V obtained from θ and γ L V for the mixture of canola oil with EO is equal to 20.16 mN/m and is close to the PTFE surface tension determined from the θ of the alkanes series (20.24) [45]. The maximal deviation from the mean value amounts to 0.91 mN/m. Therefore, it can be concluded that in the case of the RO and EO mixture, there is no influence of the adsorption layer beyond the droplet deposited on PTFE on the contact angle value.
For the RO + Hex and EO + Hex mixtures, the influence of the Hex adsorption layer outside the solution droplet deposited on PTFE on its surface tension, and thus on wettability, is observed when the Hex concentration approaches unity. The average value of PTFE γ S V calculated using Equation (13) based on the data for the EO + Hex mixture is equal to 19.8 mN/m, and the maximum deviation from the average value is 1.32 mN/m. The average γ S V of PTFE calculated using Equation (13) based on the results obtained for the RO + Hex mixture is equal to 19.25 mN/m, and the maximum deviation from the average value is 1.68 mN/m. The presented data support the suggestion that a large Hex concentration in the mixture reduces the PTFE surface tension and further affects its wettability. If the mole fraction of Hex in the mixture is approaching unity, then the spreading coefficient S S / L determined using Equation (12) assumes a positive value. In the other cases, S S / L takes negative values, confirming the lack of complete spreading of RO + EO, RO + Hex and EO + Hex mixtures over the PTFE surface.
To assess the wettability of PTFE, monopolar PMMA and bipolar steel by the RO + EO, EO + Hex and RO + Hex mixtures, it was sufficient to know their surface tension and its LW and AB components.
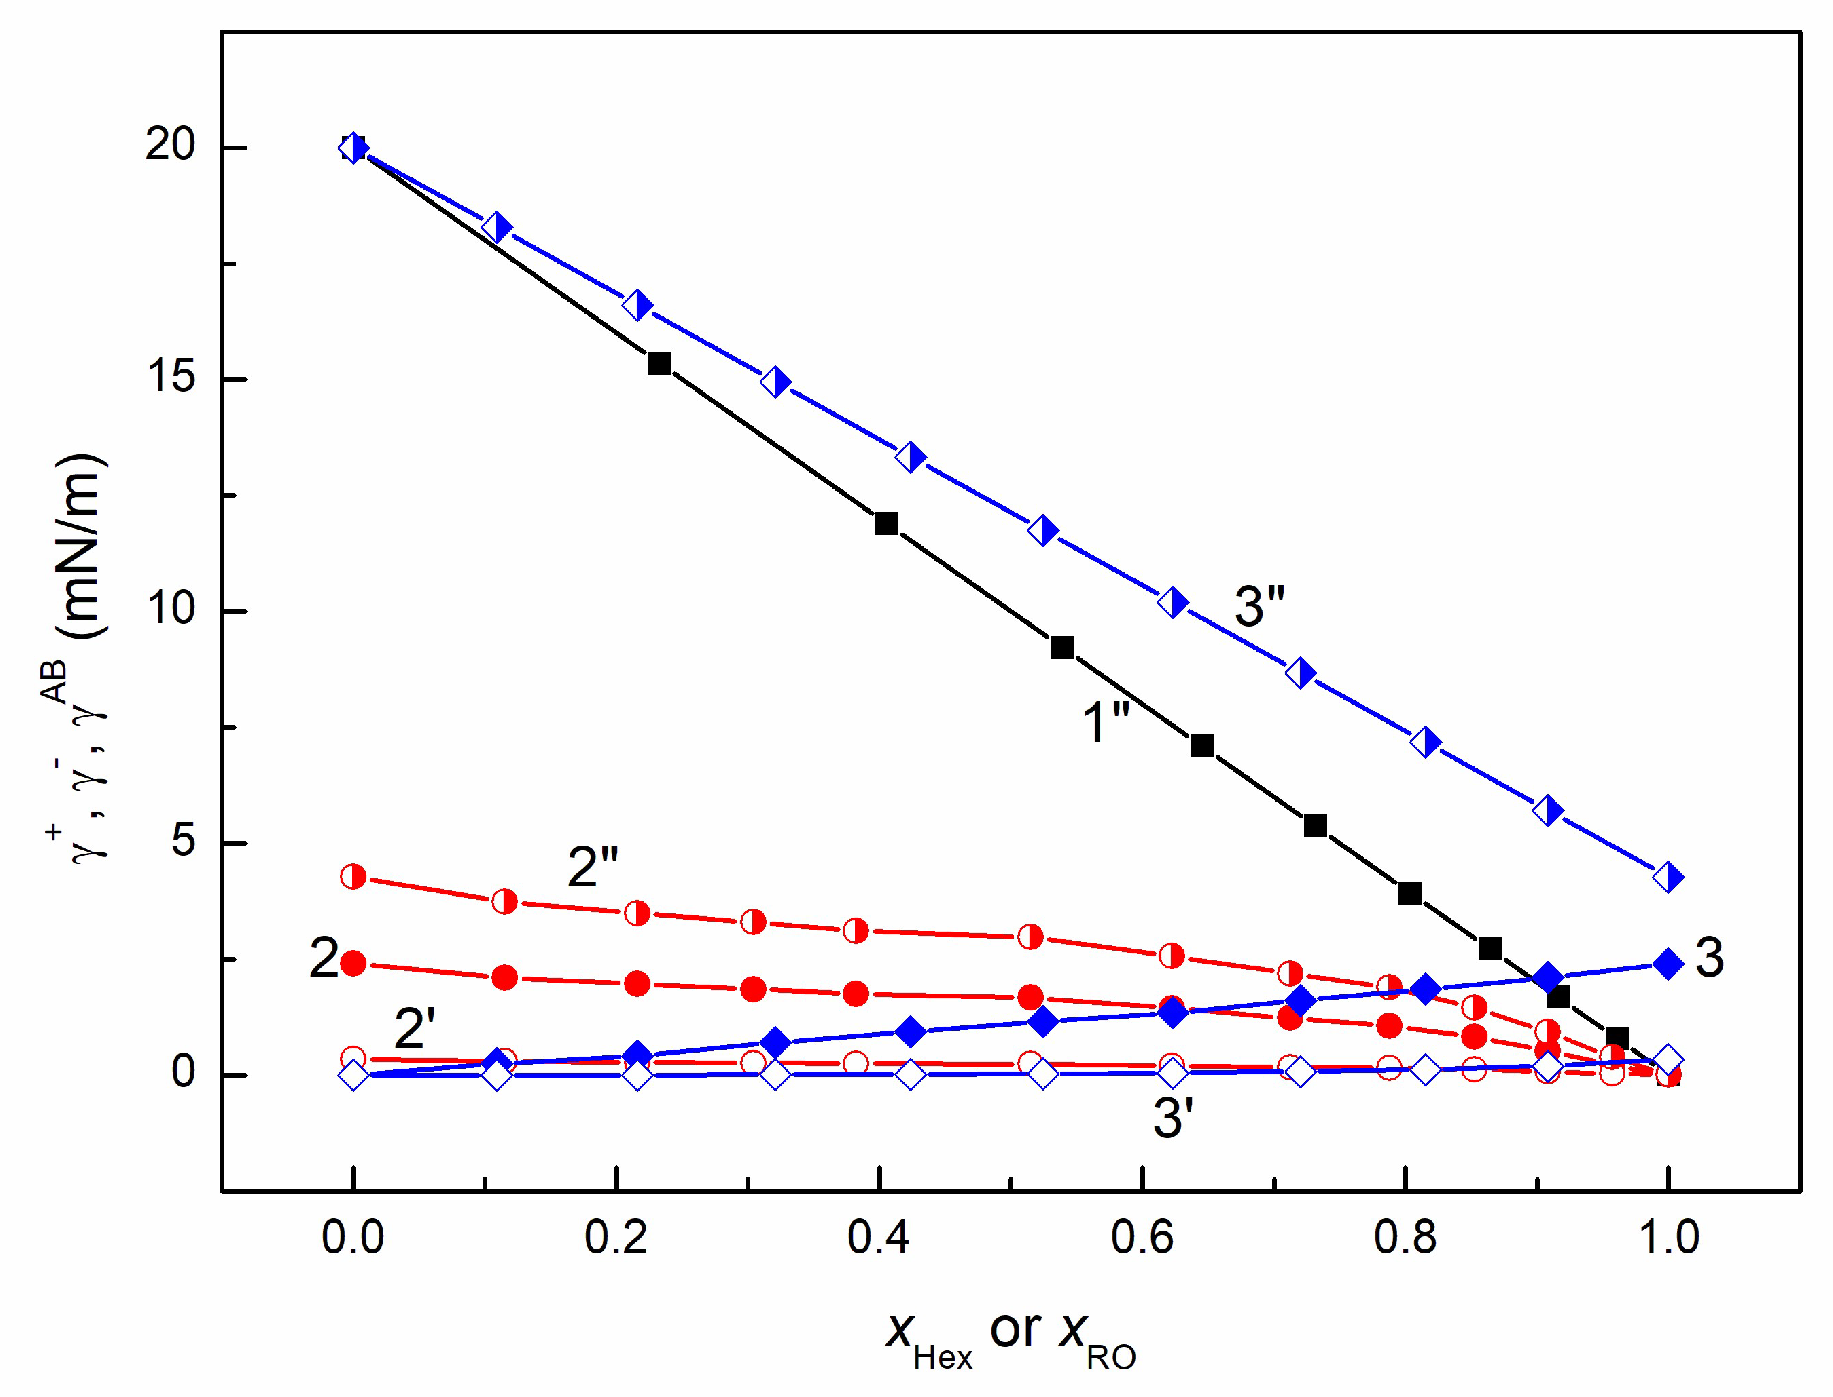
In the case of a liquid with a surface tension larger than that of PMMA, the γ +   parameter is determined based on its contact angle measured on PMMA. This is possible for two reasons: Such a liquid does not reduce the PMMA surface tension, and γ S V + = 0. Unfortunately, determination of the γ + parameter based on the θ of RO + Hex, EO + Hex and RO + EO mixtures is difficult. Since Hex, EO and RO have lower surface tensions than PMMA, their layers reduce the PMMA surface tension. Moreover, for EO, γ L V + = 0 [43], and the γ L V + for RO is not large. To address the issue concerning the surface tension parameters of the studied mixtures, it was approximately assumed that the γ parameter, which is dominant, varies linearly as a function of the mixture composition. Thus, for the EO + Hex and RO + Hex mixtures, γ E O + H e x = γ E O x E O and γ H e x + R O = γ R O x R O . Such an assumption of changes in the electron-donor parameter for the EO+Hex mixture seems more reasonable than for the RO + Hex mixture due to the linear dependence of the surface tension of the EO + Hex mixture with respect to its composition (Figure 3). Regarding the RO + EO mixture, both RO and EO contribute to the electron-donor parameter surface tension. For this reason, it was assumed that the parameter γ E O + R O = γ E O x E O + γ R O x R O . In turn, the γ L V + parameter of the RO + EO and RO + Hex mixtures was calculated from the following expression (Figure 4) [18,19,20,21]:
γ L V A B = 2 γ L V + γ L V .
Knowing the RO + EO, RO + Hex and EO + Hex mixtures as well as the PMMA and steel surface tensions, components and parameters of these tensions as well as the contact angle on studied surfaces (Figure 5), it is possible to determine the adhesion work of the mixtures to PMMA and steel using Equations (5) and (6). It turns out that the W a of the given mixture to PMMA and steel calculated using Equation (5) is much smaller than that calculated using Equation (6) (Figures S1 and S2).
For each mixture, the W a for both PMMA and steel can be effectively represented as a linear function of composition. Moreover, for a given mixture, the W a isotherms calculated from the Young–Dupre and van Oss et al. equations are parallel (Figures S1 and S2). This shows that the wetting mechanism of PMMA and steel by RO + EO, EO + Hex and RO + Hex mixtures is more complicated than it might seem. As mentioned above, it is likely that the formation of an adsorption layer of one or both components of the mixture causes a droplet deposited on the PMMA and steel surfaces to spread over the surface of these solids covered with an adsorption layer. In other words, it spreads over the solid whose surface tension has changed from the value γ S V to γ S V , f . To confirm this conclusion, the PMMA and steel surface tensions were calculated with Equation (13) using the contact angle values of the studied mixtures on these solids surface (Figures S3 and S4). The values of γ S V , f calculated using Equation (13) depend on the type of mixture and its composition, and they are considerably smaller than the γ S V values. This fact confirms the conclusion that formation of the adsorption layer is preceded by the process of spreading the droplets of the RO + EO, EO + Hex and RO + Hex mixtures on the PMMA and steel surfaces.
Since the γ L V of the EO + Hex, RO + EO and RO + Hex mixtures and their components are smaller than the γ S V of PMMA and steel [44], during spreading of these mixtures’ droplets on PMMA and steel, the interface tension of PMMA–mixture and steel–mixture should approach zero. This means that γ S V , f + γ L V = W a and/or γ S V + γ L V = W a . The calculations of the sum of γ S V , f + γ L V and γ S V + γ L V show that when it comes to the RO + EO mixture, the values of γ S V , f + γ L V are close to the W a value calculated from Equation (5) and the values of γ S V + γ L V to the W a value calculated from Equation (6) for PMMA and steel (Table 4, Table 5, Table 6 and Table 7). In the case of EO + Hex and RO + Hex mixtures, there are some differences between γ S V + γ L V and W a calculated using Equation (6) (Table 5 and Table 7) both for PMMA and steel. These differences increase with the increasing Hex concentration in the mixtures.
Based on the calculations of γ S V , f + γ L V and γ S V + γ L V and W a (Table 4, Table 5, Table 6 and Table 7), it can be concluded that after placing a drop of a given mixture on the PMMA and steel surfaces, its work of adhesion is probably equal to γ S V + γ L V (Table 8, Table 9, Table 10 and Table 11).
In such a case, the difference between the adhesion and cohesion work equal to the spreading coefficient is positive (Table 8 and Table 10), causing the drop to spread on the PMMA and steel. During spreading of the droplets, the molecules of the components of a given mixture can escape from the droplet at a higher speed, creating an adsorption layer on the PMMA and steel surfaces, lowering their surface tension and thus reducing W a , which causes a decrease in the spreading coefficient. The spreading process continues until the spreading coefficient becomes negative (Table 9 and Table 11).

3.3. Wetting and Adhesion Properties of RO + EO + Hex Mixture

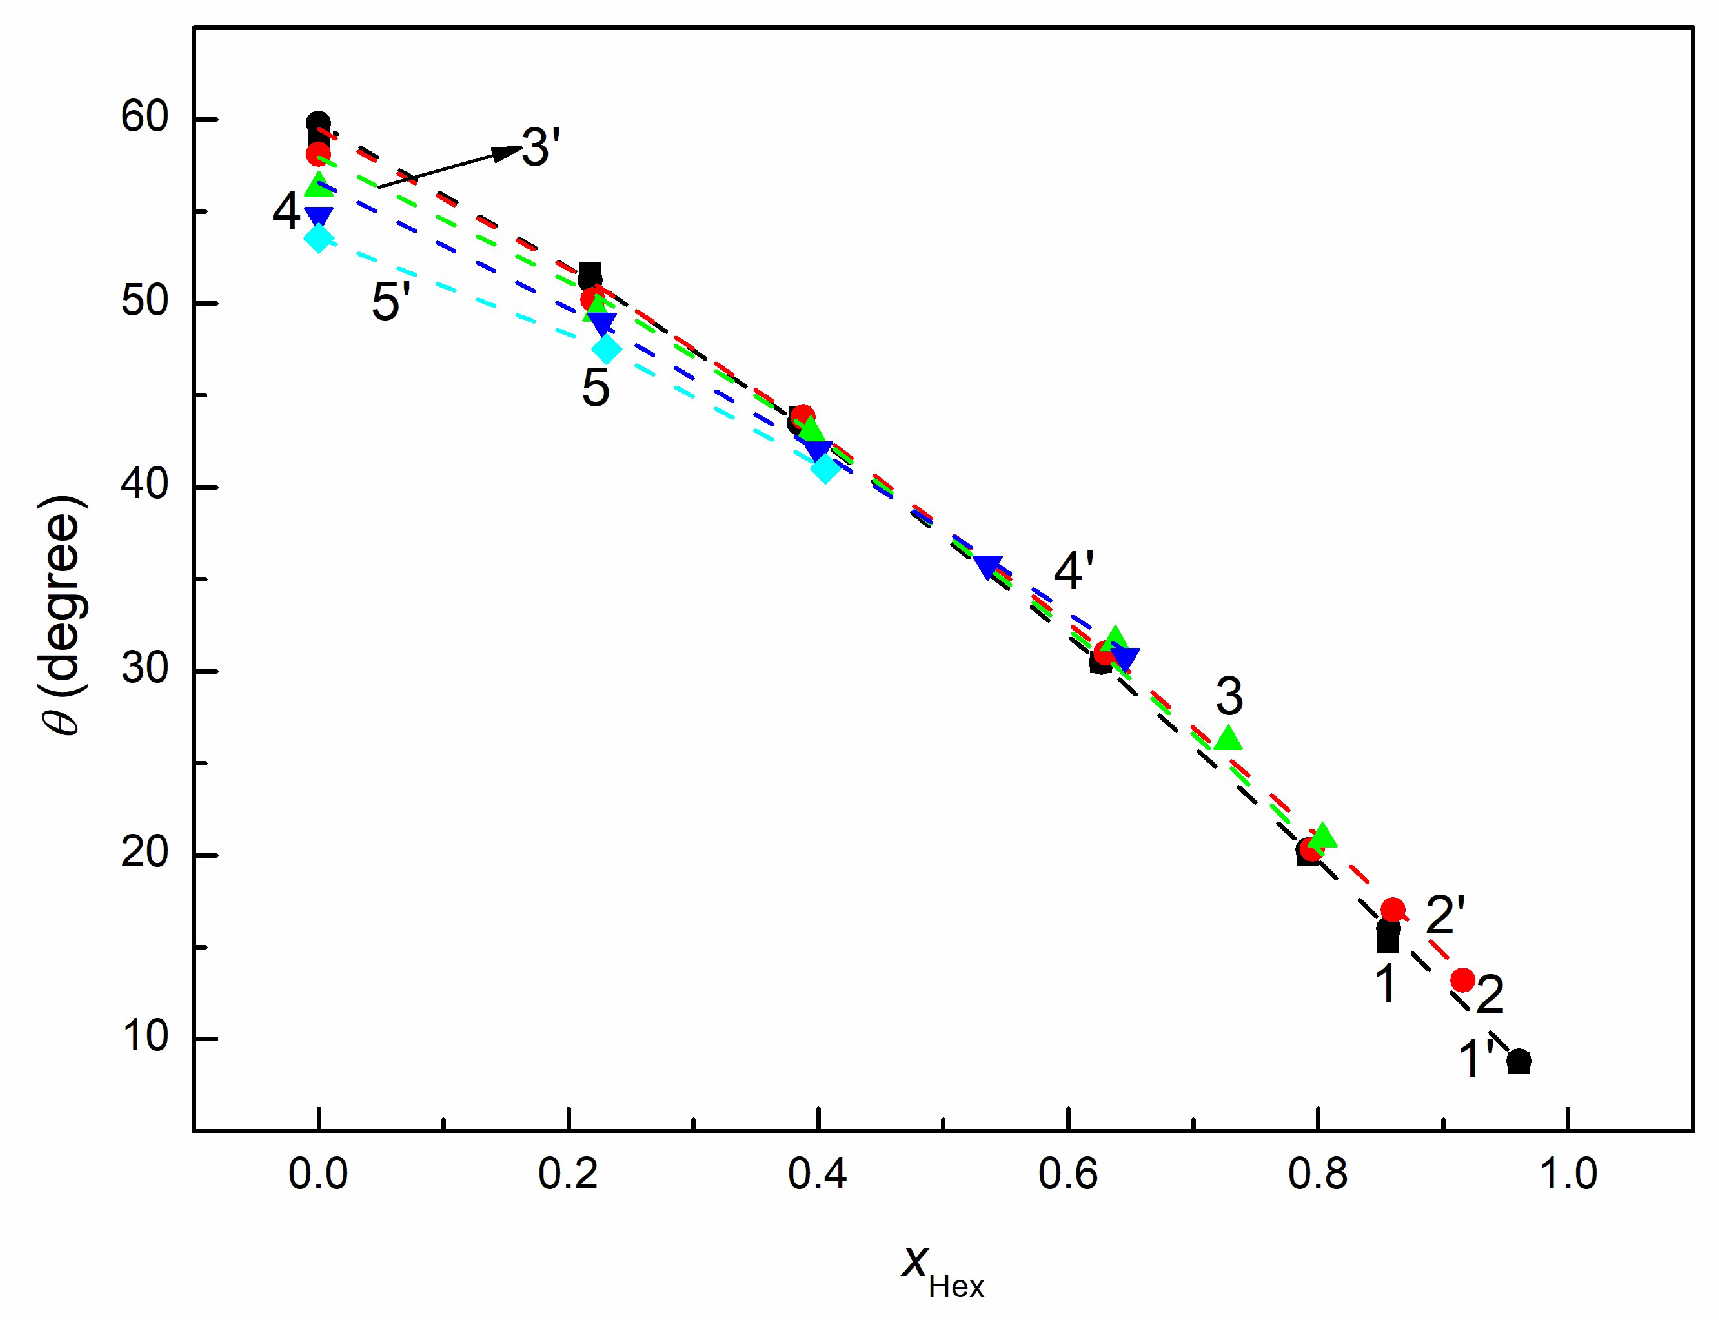
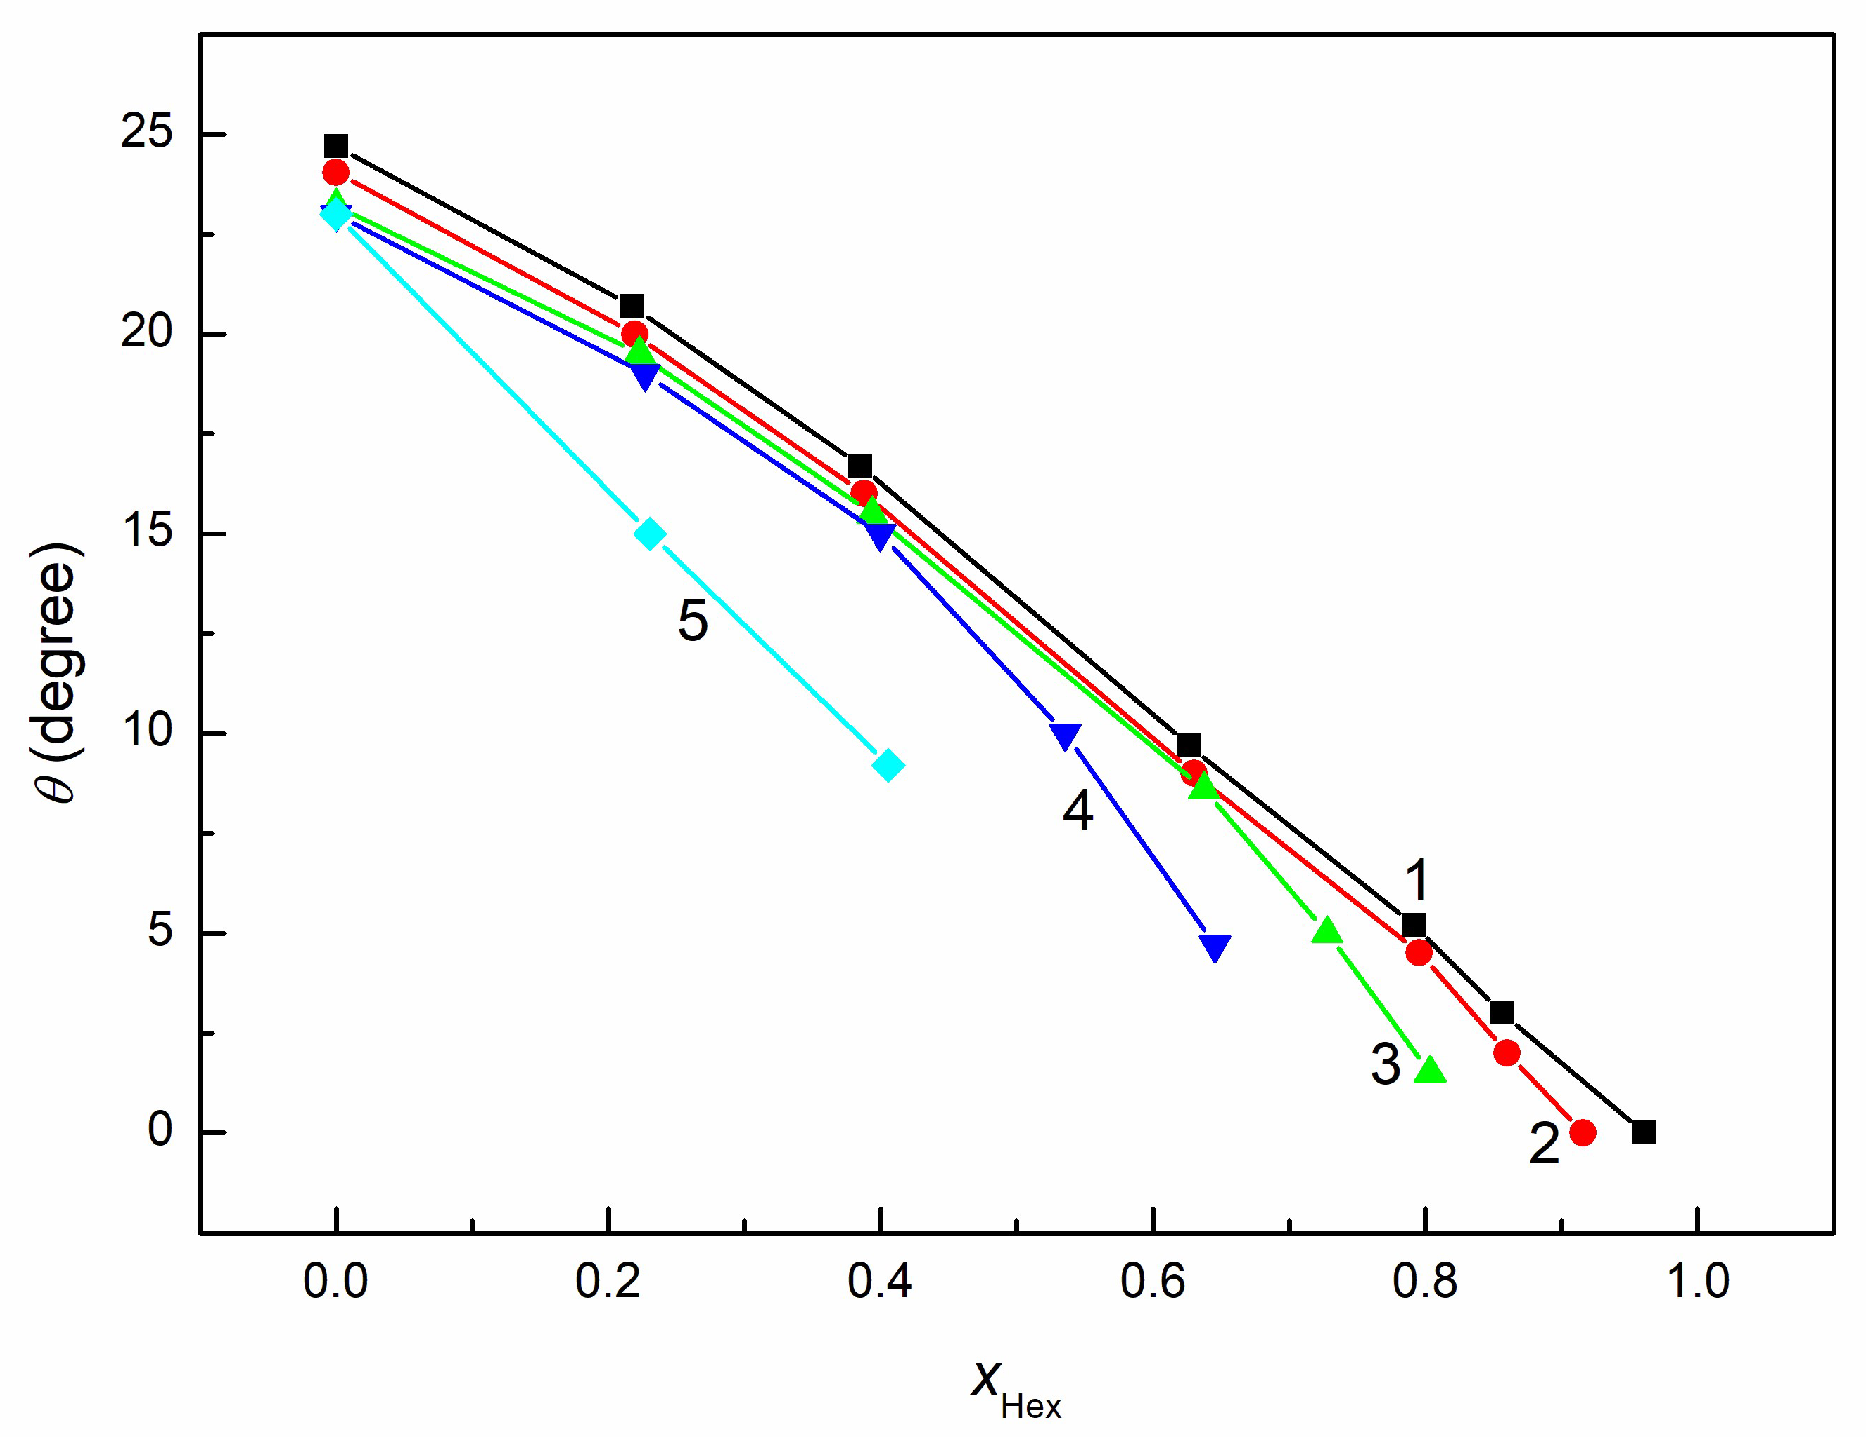
The wetting properties of a multicomponent mixture containing canola oil, n-hexane and ethyl oleate depend on these liquids components and parameters of the surface tension as well as the type of solid. It should be remembered that the RO + EO + Hex mixture is a ternary mixture only in name because canola oil itself is a multi-component mixture. The mixture contains Hex, whose surface tension is entirely due to LW interactions, is much smaller than the EO and RO surface tensions, and causes a significant reduction in the γ L V of RO + EO + Hex [28]. It is known that EO’s surface tension results from the LW interactions, but the electron-donor parameter is much higher than zero and should influence the adhesion of the mixture to the surface of solids more than its surface tension. The mutual relationships between the surface tension and its components and the parameters of the individual components of the RO + EO + Hex mixture determine its adhesive and wetting properties. This fact is visible in the contact angle isotherms of the RO + EO + Hex mixture on PTFE (Figure 6). In the case of PTFE, n-hexane has a decisive influence on the wetting properties of the studied ternary mixture. Above the Hex mole fraction in the mixture equal to 0.4, there is practically no influence of EO on the contact angle of the mixture on PTFE (Figure 6). The θ isotherms for the RO + EO + Hex mixture on PTFE are represented by the following expression:
θ = θ H e x x H e x + θ E O x E O + θ R O x R O + a x H e x x R O + b x E O x R O .
Here, a is the constant of the Hex and RO interactions, and b is the constant of the EO and RO interactions.
As the mixture of Hex with EO is treated as the ideal one, it was assumed that the interactions’ constant is equal to zero. The values of a and b were determined numerically. It proved that at each constant volume of EO in the mixture, the value of b was the same and equal to 5, but the constant a values were in the range of 20 to 30.
It is interesting that, in contrast to the mixtures of EO + Hex, RO + EO and RO + Hex, for the RO + EO + Hex mixture, the change of cos θ in the function of surface tension can be described by a single linear relationship, regardless of the percentage of EO in the mixture (Figure S5). The γ S V value for θ = 0 calculated using this function is equal to 19.12 mN/m and is slightly smaller than the PTFE surface tension (20.24 mN/m [28]). This value is also smaller than the average value of PTFE surface tension for all studied ternary mixtures calculated using Equation (13), which is equal to 20.04 ± 0.41 mN/m. In turn, the value of PTFE surface tension obtained from Equation (13) is almost the same as that determined from the θ of n-alkanes on PTFE (20.24 mN/m) [45]. These facts suggest that in the case of PTFE, formation of a possible Hex film on its surface during spreading of the mixture does not significantly affect the wetting process of PTFE by the RO + EO + Hex mixture, and Equation (9) is satisfied. Therefore, it is possible to determine the LW component of this mixture’s surface tension based on Equation (9), and the determined values should be reasonable (Figure S6). In the process of wetting PTFE with the mixture, the main role is played by the Lifshitz–van der Waals intermolecular interactions. However, in the wetting process of PMMA and steel, the electron-acceptor and electron-donor parameters of the surface tension of the studied mixture also play a significant role.
Unfortunately, determination of these parameters is not easy. Commonly, the electron-acceptor parameter is determined based on the contact angle of a given liquid on the PMMA surface if its surface tension is larger than that of PMMA and does not reduce this surface tension. As a matter of fact, knowing this parameter and its relation with γ L V A B , the electron-donor parameter can be determined [34,35,36,37]. The RO + EO + Hex mixture surface tension and its components are lower than both the PMMA and steel surface tensions [28]. Moreover, the γ S V of PMMA and steel calculated using Equation (13) based on the data for the RO + EO + Hex mixture varies depending on the Hex and EO concentrations (Figures S7 and S8). For this reason, the parameters of this mixture’s surface tension may be uncertain. Considering that the thermodynamic parameters are additive, it seems more rational to calculate the electron-donor parameter of the RO + EO + Hex mixture surface tension from the expression
γ L V = γ E O x E O + γ R O x R O .
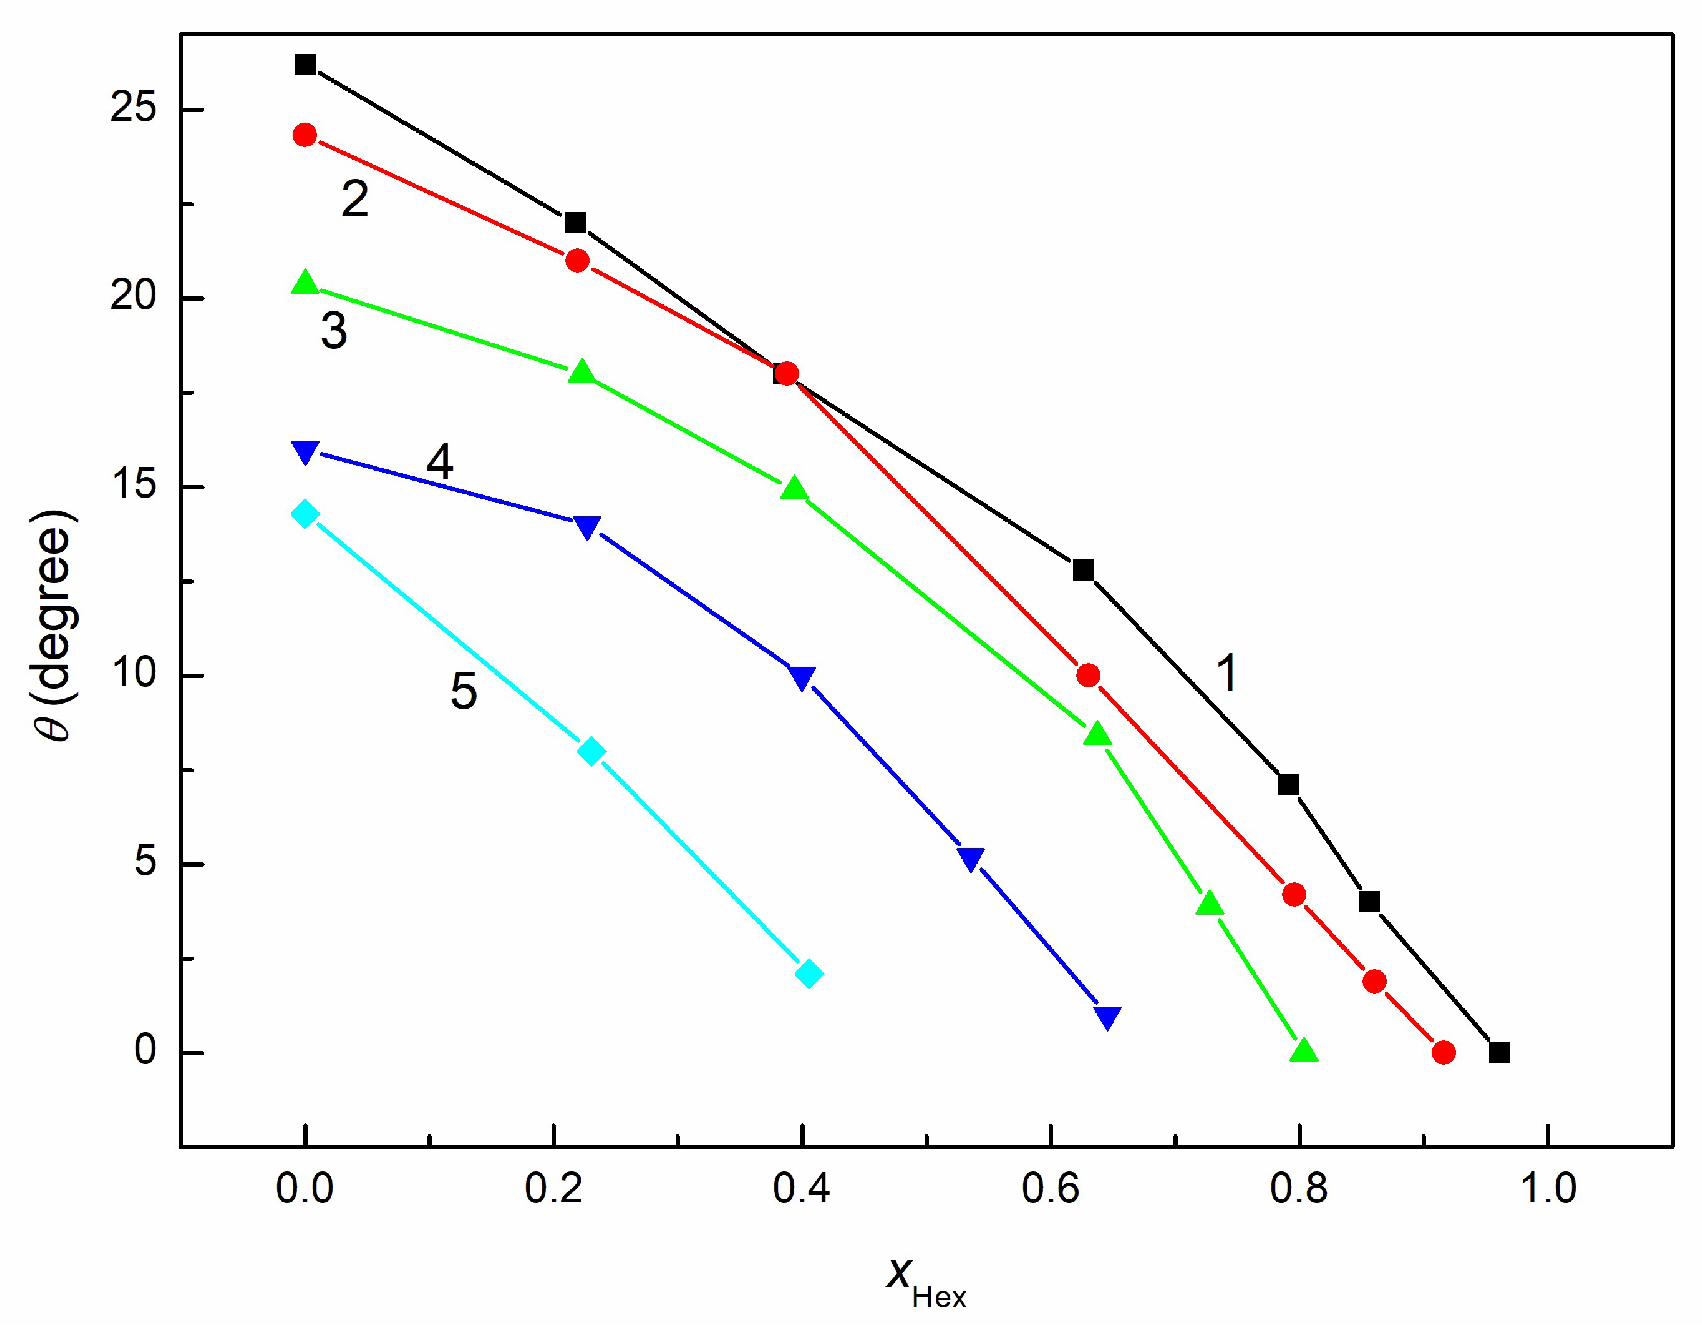
Knowing the values of γ L V , the γ L V + values for the mixture were calculated based on its AB component (Figure S9). It follows that the parameters of the mixture surface tension depend on its composition and concentration. This relationship is reflected in the θ isotherms of the RO + EO + Hex mixture for PMMA and steel (Figure 7 and Figure 8). For these solids the greatest influence on the wetting properties of the RO + EO + Hex mixture is exerted by Hex. On the other hand, the influence of EO is more visible for PMMA than for steel.
Changes in the wettability of PMMA and steel by the studied mixture are closely related to those in the adhesion work of this mixture to PMMA and steel, which depend on the composition of the mixture and the concentration of its components. Indeed, the W a of the RO + EO + Hex mixture to PMMA and steel can be calculated using both the Young–Dupre and van Oss et al. equations [34,35,36,37]. As was shown earlier, the difference in the W a values calculated using these two equations proves that an adsorption layer is formed on the solid surface rather than the deposited droplet spreading. The calculations of adhesion of the RO + EO + Hex mixture to both PMMA and steel show that the W a values calculated from Equation (6) differ significantly from those calculated from Equation (5) (Figures S10 and S11). It is interesting that the W a calculated for both PMMA and steel using Equation (5) does not depend on the EO content in the mixture but only on the Hex concentration. Significant impacts on the W a values of the RO + EO + Hex mixture for PMMA and steel, derived from Equation (6), come not only from Hex but also from EO. The comparison of the W a values calculated using Equation (5) with those calculated using Equation (6) shows that mainly Hex forms the adsorption layer faster than the deposited drop of the mixture spreads over the PMMA or steel surfaces.
Some authors [30,31,32,33,34,35,36,37,42] suggest that in order for a drop of a liquid or solution to spread completely over a solid, the solid–liquid (solution) interface tension should be equal to zero. In this case, as mentioned above, W a should be equal to γ S V + γ L V . For this reason, γ S V , f + γ L V and γ S V + γ L V were calculated and compared with the W a values (Table 12).
It turns out that the values of γ S V , f + γ L V are close to the W a calculated using Equation (5). However, there are some differences between the values of γ S V + γ L V and W a calculated using Equation (6) at a higher concentration of Hex in the mixture. As mentioned above, this difference may result from the change in the pressure of the adsorption layer on PMMA or steel during the spreading of the studied mixture drop on these solids.
Taking into account the W a of the RO + EO + Hex mixture to the PMMA and steel surfaces calculated both using Equations (5) and (6) and based on the sum of γ S V , f + γ L V and γ S V + γ L V , it is possible to determine the spreading coefficient of this mixture on PMMA and steel (Table 13) and thus the mechanism of the wetting process.
If the interface tension of the PMMA–mixture and steel–mixture is equal to zero regardless of the mixture concentration, then at the moment of placing a drop of the mixture on PMMA or steel, i.e., in the initial state, S S / L = γ S V γ L V . Since Hex has the smallest surface tension in the RO + EO + Hex mixture, the tendency of its molecules to adsorb on the PMMA and steel surfaces around the deposited drop is the largest. As a result of this adsorption preceding spreading of the drop, an adsorption layer is formed that reduces the surface tension of PMMA or steel to the k value in the final state of the wetting process, and then S S / L = γ S V , f γ L V . Given the above-mentioned fact, the surface pressure of the Hex layer can reduce the PMMA or steel surface tensions to a value smaller than that of the mixture, and then S S / L takes on a negative value, and the drop of solution does not spread completely over the surface. It is not possible to exclude the presence of other components of the mixture in the adsorption layer that have surface tensions smaller than that of the mixture.

3.4. Wetting and Lubricant Properties of RO + EO + Hex Mixture

The static properties of a lubricant liquid include its surface tension, adhesion work to solid ( W a ), contact angle ( θ ) on solid surface and spreading coefficient ( S S / L ). However, important dynamic properties of liquid lubrication are wear scar diameter as well as dynamic viscosity [46,47,48,49]. The W a , θ ,   S S / L as well as the wear scar diameter values depend on the surface tension of the lubricating liquid. Reduction of the surface tension of this liquid causes a decrease of the contact angle, adhesion work to solid surface as well as the wear scar diameter and an increase in its spreading coefficient over the solid surface. In practice S S / L should be equal to or higher than zero to ensure good wettability of the abraded materials and penetration of the lubricating liquid into micro-cracks of these materials. This coefficient is connected with the surface tension and contact angle of the lubricating liquid (Equation (12)). In the case when θ > 0, the spreading coefficient is negative. When the solid has a surface tension lower than the liquid, for pure liquids, θ > 0 and an adsorption layer formed by this liquid outside the settled drop does not reduce the solid surface tension. In the case when the liquid and solid have the same surface tension, the contact angle and spreading coefficient equal zero [42]. It is more complicated in the case of the lubrication liquid being a mixture of different compounds, such as, for example, RO. If the mixture contains compounds for which the surface tension is lower than that of the mixture and solid, then it creates an adsorption layer on the solid, lowering its ST and influence on contact angle and the spreading coefficient. This situation takes place in the case of RO. The pressure of such a layer for RO on the PMMA and steel surfaces was established based on the Young–Dupre and van Oss et al. [34,35,36,37,41] equations (Equations (5) and (6)). The adsorption layer reducing PMMA and steel surface tension causes the RO not to spread completely over their surfaces. This phenomenon probably deteriorates the lubricating properties of RO.
The second physicochemical property that makes it difficult to use RO directly as a lubricant is its high dynamic viscosity [46,47,48,49]. The dynamic viscosity of lubricating liquid is an important parameter that describes its flow resistance and has a significant impact on the operation of mechanical systems. The appropriate dynamics viscosity ensures proper lubrication and minimizes friction, protecting components from wear. Low dynamic viscosity can lead to a lack of a lubricating film and direct metal-to-metal contact, while too high dynamic viscosity can increase resistance to movement. The addition of Hex to RO significantly improves its wetting properties and decreases its high dynamic viscosity (Figure S12). At the same time it reduces the surface tension and adhesion work of RO to the steel. The magnitude of the adhesion work of lubricant to material is closely related to its surface tension and determines the properties of the lubricating layers. Too low a level of lubricant adhesion could cause contact between rubbing materials, while too high a level of adhesion could hinder movement and cause greater friction, thus negating the effectiveness of the lubricant. In contrast to Hex, the addition of EO to RO does not significantly influence its adhesion work to steel, its surface tension or its wettability (Figure S13). However, EO reduces the high dynamic viscosity of RO. Hence, the addition of both Hex and EO to RO allows for better adjustment of parameters that determine its lubrication properties, adhesion work, surface tension, contact angle and dynamic viscosity (Figure S14).

4. Conclusions

The results obtained from the contact angle measurements of RO + Hex, RO + EO, EO + Hex and RO + EO + Hex mixtures on PTFE, PMMA and steel as well as the literature data allow the determination of the RO parameters, that is, to determine its lubricating properties.
The contact angle values of the studied mixtures and the surface tension parameters of RO, Hex and EO allowed us to determine the components and parameters of the surface tension of RO mixtures with Hex and EO.
The components and parameters of the surface tension allowed us to calculate the work of adhesion of RO + EO + Hex mixtures using the van Oss et al. approach.
By comparing the adhesion work of the RO + EO, RO + Hex, EO + Hex and RO + EO + Hex mixtures on PMMA and steel calculated using the van Oss et al. approach to those calculated using the Young–Dupre equation, it was possible to determine the pressure of the adsorption layer on the PMMA and steel surfaces. This pressure has significant influence on the wetting properties of RO modified by the addition of EO and Hex.
The addition of Hex to RO reduces its surface tension, adhesion to PMMA and steel as well as dynamic viscosity and increases the wetting properties.
The addition of EO to RO causes significant changes in its surface tension, wetting properties and adhesion to PMMA and steel and reduces the dynamic viscosity.
By adding EO and Hex simultaneously to RO, it is possible to determine the most appropriate physicochemical properties that determine the lubricating ability of RO.

Supplementary Materials

The following supporting information can be downloaded at: https://www.mdpi.com/article/10.3390/app15179243/s1, Figure S1. The W a values calculated form Equations (5) and (6) to PMMA for EO + Hex, RO + Hex and RO + EO vs. x H e x or x R O . Figure S2. The W a values calculated form Equations (5) and (6) to steel for EO + Hex, RO + Hex and RO + EO vs. x H e x or x R O . Figure S3. The PMMA γ S V values calculated form Equation (13) for EO + Hex, RO + Hex and RO + EO vs. x H e x or x R O . Figure S4. The steel γ S V values calculated form Equation (13) for EO + Hex, RO + Hex and RO + EO vs. x H e x or x R O . Figure S5. The c o s θ values on PTFE for RO + EO + Hex vs. γ L V . Figure S6. The γ L V and γ L V L W values for RO + EO + Hex calculated from Equation (9) vs. x H e x . Figure S7. The PMMA γ S V calculated from Equation (9) vs. x H e x . Figure S8. The steel γ S V calculated from Equation (9) vs. x H e x . Figure S9. The γ L V A B values as well γ L V + and γ L V values calculated from Equation (17) for RO + EO + Hex vs. x H e x . Figure S10. The W a values calculated form Equations (5) and (6) to PMMA for RO + EO + Hex vs. x H e x . Figure S11. The W a values calculated form Equations (5) and (6) to steel for RO + EO + Hex vs. x H e x . Figure S12. The θ values on steel, γ L V , η and W a calculated from Equations (5) and (6) for the RO + Hex mixtures vs. x H e x . Figure S13. The θ values on steel, γ L V , η and W a calculated from Equations (5) and (6) for the RO + EO mixtures vs. x R O . Figure S14. The θ values on steel, γ L V , η and W a calculated from Equations (5) and (6) for the RO + EO + Hex mixtures vs. x H e x .

Author Contributions

Conceptualization, K.S., A.Z. and B.J.; methodology, K.S. and A.Z.; software, K.S. and A.Z.; validation, K.S., A.Z. and B.J.; formal analysis, K.S. and A.Z.; investigation, K.S. and A.Z.; resources, K.S. and A.Z.; data curation, K.S., A.Z. and B.J.; writing—original draft preparation, K.S., A.Z. and B.J.; Writing—review and editing, K.S., A.Z. and B.J.; visualization, K.S., A.Z. and B.J.; supervision, B.J.; project administration, B.J. All authors have read and agreed to the published version of the manuscript.

Funding

This research received no external funding.

Institutional Review Board Statement

Not applicable.

Informed Consent Statement

Not applicable.

Data Availability Statement

The original contributions presented in the study are included in the article; further inquiries can be directed to the corresponding author.

Conflicts of Interest

The authors declare no conflicts of interest.

References

  1. Sarma, R.N.; Vinu, R. Current status and future prospects of biolubricants: Properties and applications. Lubricants 2022, 10, 70. [Google Scholar] [CrossRef]
  2. Uppar, R.; Dinesha, P.; Kumar, S. A critical review on vegetable oil-based bio-lubricants: Preparation, characterization, and challenges. Environ. Dev. Sustain. 2023, 25, 9011–9046. [Google Scholar] [CrossRef]
  3. Düzcükoǧlu, H.; Acaroǧlu, M. Lubrication properties of vegetable oils combined with boric acid and determination of their effects on wear. Energy Sources 2010, 32, 275–285. [Google Scholar] [CrossRef]
  4. Madanhire, I.; Mbohwa, C. Mitigating Environmental Impact of Petroleum Lubricants; Springer Nature: New York, NY, USA, 2016. [Google Scholar] [CrossRef]
  5. Nogales-Delgado, S.; Encinar, J.M.; González, J.F. A Review on biolubricants based on vegetable oils through transesterification and the role of catalysts: Current status and future trends. Catalysts 2023, 13, 1299. [Google Scholar] [CrossRef]
  6. Cecilia, J.A.; Plata, D.B.; Saboya, R.M.A.; de Luna, F.M.T.; Cavalcante, C.L.; Rodríguez-Castellón, E. An overview of the biolubricant production process: Challenges and future perspectives. Processes 2020, 8, 257. [Google Scholar] [CrossRef]
  7. Saka, A.; Abor, T.K.; Okafor, A.C.; Okoronkwo, M.U. Thermo-rheological and tribological properties of low- and high-oleic vegetable oils as sustainable bio-based lubricants. RSC Sustain. 2025, 3, 1461. [Google Scholar] [CrossRef]
  8. Hamnas, A.; Unnikrishnan, G. Bio-lubricants from vegetable oils: Characterization, modifications, applications and challenges– Review. Renew. Sustain. Energy Rev. 2023, 182, 113413. [Google Scholar] [CrossRef]
  9. Sarker, M.I.; Mainali, K.; Sharma, B.K. Investigations on the thermal stability and kinetics of biolubricants synthesized from different types of vegetable oils. Lubricants 2025, 13, 105. [Google Scholar] [CrossRef]
  10. Berman, D. Plant-based oils for sustainable lubrication solutions—Review. Lubricants 2024, 12, 300. [Google Scholar] [CrossRef]
  11. Sharma, R.V.; Somidi, A.K.R.; Dalai, A.K. Preparation and properties evaluation of biolubricants derived from canola oil and canola biodiesel. J. Agric. Food Chem. 2015, 63, 3235–3242. [Google Scholar] [CrossRef]
  12. Nassef, B.G.; Pape, F.; Poll, G. Enhancing the performance of rapeseed oil lubricant for machinery component applications through hybrid blends of nanoadditives. Lubricants 2023, 11, 479. [Google Scholar] [CrossRef]
  13. Masripan, N.A.; Salim, M.A.; Omar, G.; Mansor, M.R.; Hamid, N.A.; Syakir, M.I.; Dai, F. Vegetable oil as bio-lubricant and natural additive in lubrication: A review. Int. J. Nanoelectron. Mater. 2020, 13, 161–176. [Google Scholar]
  14. Nagendramma, P.; Kaul, S. Development of ecofriendly/biodegradable lubricants: An Overview. Renew. Sustain. Energy Rev. 2012, 16, 764–774. [Google Scholar] [CrossRef]
  15. Durak, E. A study on friction behavior of rapeseed oil as an environmentally friendly additive in lubricating oil. Ind. Lubr. Tribol. 2004, 56, 23–37. [Google Scholar] [CrossRef]
  16. Heikal, E.K.; Elmelawy, M.S.; Khalil, S.A.; Elbasuny, N.M. Manufacturing of environment friendly biolubricants from vegetable oils. Egypt. J. Petrol. 2017, 26, 53–59. [Google Scholar] [CrossRef]
  17. Masudi, A.; Muraza, O. Vegetable oil to biolubricants: Review on advanced porous catalysts. Energy Fuels 2018, 32, 10295–10310. [Google Scholar] [CrossRef]
  18. Przybylski, R. Canola/Rapeseed Oil. In Vegetable Oils in Food Technology: Composition, Properties and Uses, 1st ed.; Gunstone, F.D., Ed.; Blackwell Publishing Ltd.: Oxford, UK, 2011; pp. 107–136. [Google Scholar]
  19. Banaś, K.; Piwowar, A.; Harasym, J. The potential of rapeseed (canola) oil nutritional benefits wide spreading via oleogelation. Food Biosci. 2023, 56, 103162. [Google Scholar] [CrossRef]
  20. Li, Q.; Backes, F.; Wachtmeister, G. Application of canola oil operation in a diesel engine with common rail system. Fuel 2015, 159, 141–149. [Google Scholar] [CrossRef]
  21. Panchal, T.M.; Patel, A.; Chauhan, D.D.; Thomas, M.; Patel, J.V. A methodological review on bio-lubricants from vegetable oil based resources. Renew. Sustain. Energy Rev. 2017, 70, 65–70. [Google Scholar] [CrossRef]
  22. Salimon, J.; Salih, N.; Yousif, E. Biolubricants: Raw materials, chemical modifications and environmental benefits. Eur. J. Lipid Sci. Technol. 2010, 112, 519–530. [Google Scholar] [CrossRef]
  23. Ge, J.C.; Yoon, S.K.; Choi, N.J. Using canola oil biodiesel as an alternative fuel in diesel engines: A Review. Appl. Sci. 2017, 7, 881. [Google Scholar] [CrossRef]
  24. Roy, M.M.; Wang, W.; Bujold, J. Biodiesel production and comparison of emissions of a DI diesel engine fueled by biodiesel–diesel and canola oil–diesel blends at high idling operations. Appl. Energy 2013, 106, 198–208. [Google Scholar] [CrossRef]
  25. Ge, J.C.; Yoon, S.K.; Kim, M.S.; Choi, N.J. Application of Canola Oil Biodiesel/Diesel Blends in a Common Rail Diesel Engine. Appl. Sci. 2017, 7, 34. [Google Scholar] [CrossRef]
  26. Szymczyk, K.; Zdziennicka, A.; Jańczuk, B.; Lubas, J.; Jaworski, A.; Kuszewski, H.; Woś, P.; Longwic, R.; Sander, P. n-hexane influence on canola oil adhesion and volumetric properties. Int. J. Adhes. Adhes. 2025, 140, 103990. [Google Scholar] [CrossRef]
  27. Longwic, R.; Sander, P.; Zdziennicka, A.; Szymczyk, K.; Jańczuk, B. Changes of some physicochemical properties of canola oil by adding n-hexane and ethanol regarding its application as diesel fuel. Appl. Sci. 2023, 13, 1108. [Google Scholar] [CrossRef]
  28. Szymczyk, K.; Zdziennicka, A.; Jańczuk, B. The modification of the canola oil some properties by the addition of ethyl oleate and n-hexane. Energies 2025, 18, 3802. [Google Scholar] [CrossRef]
  29. Ahmed, N.S.; Nassar, A.M. Lubrication and Lubricants. In Tribology—Fundamentals and Advancements; Gegner, J., Ed.; IntechOpen: London, UK, 2013. [Google Scholar] [CrossRef]
  30. Neumann, A.W. Contact angles and their temperature dependence: Thermodynamic status, measurement, interpretation and application. Adv. Colloid Interface Sci. 1974, 4, 105–191. [Google Scholar] [CrossRef]
  31. Kwok, D.Y.; Neumann, A.W. Contact angle measurement and contact angle interpretation. Adv. Colloid Interface Sci. 1999, 81, 167–249. [Google Scholar] [CrossRef]
  32. Kwok, D.Y.; Neumann, A.W. Contact angle interpretation in terms of solid surface tension. Colloids Surf. 2000, 161, 31–48. [Google Scholar] [CrossRef]
  33. Fowkes, F.M. Attractive forces at interfaces. Ind. Eng. Chem. 1964, 56, 40–52. [Google Scholar] [CrossRef]
  34. van Oss, C.J. Interfacial Forces in Aqueous Media, 2nd ed.; CRC Press: Boca Raton, FL, USA, 2006. [Google Scholar]
  35. van Oss, C.J.; Good, R.J. Surface tension and the solubility of polymers and biopolymers: The role of polar and apolar interfacial free energies. J. Macromol. Sci. 1989, 26, 1183–1203. [Google Scholar] [CrossRef]
  36. van Oss, C.J.; Chaudhury, M.K.; Good, R.J. Monopolar surfaces. Adv. Colloid Interface Sci. 1987, 28, 35–64. [Google Scholar] [CrossRef] [PubMed]
  37. van Oss, C.J.; Good, R.J.; Chaudhury, M.K. Additive and nonadditive surface tension components and the interpretation of contact angles. Langmuir 1988, 4, 884–891. [Google Scholar] [CrossRef]
  38. Zdziennicka, A.; Jańczuk, B. Modification of adsorption, aggregation and wetting properties of surfactants by short chain alcohols. Adv. Colloid Interface Sci. 2020, 284, 102249. [Google Scholar] [CrossRef]
  39. Wu, S. Surface tension of solids: An equation of state analysis. J. Colloid Interface Sci. 1979, 71, 605–609. [Google Scholar] [CrossRef]
  40. Kitazki, Y.; Hata, T. Revision of the Fowkes’s formula and evaluation of surface energy of high molecule solid material. J. Adhes. Soc. Jpn 1972, 8, 131–138. [Google Scholar]
  41. Adamson, A.W.; Gast, A.P. Physical Chemistry of Surfaces, 6th ed.; Wiley-Interscience: New York, NY, USA, 1997. [Google Scholar]
  42. Rosen, M.J. Surfactants and Interfacial Phenomena, 3rd ed.; Wiley-Interscience: New York, NY, USA, 2004; pp. 34–178. [Google Scholar]
  43. Szymczyk, K.; Zdziennicka, A.; Jańczuk, B. Some physicochemical properties of ethyl oleate mixtures with ethanol and n-hexane. J. Mol. Liq. 2024, 408, 125318. [Google Scholar] [CrossRef]
  44. Szymczyk, K.; Zdziennicka, A.; Jańczuk, B. Comparison of surface tension, density, viscosity and contact angle of ethyl oleate to those of ethanol and oleic acid. J. Mol. Liq. 2024, 400, 124525. [Google Scholar] [CrossRef]
  45. Jańczuk, B.; Zdziennicka, A.; Wójcik, W. Relationship between wetting of teflon by cetyltrimethylammonium bromide solution and adsorption. Eur. Polym. Sci. 1997, 33, 1093–1098. [Google Scholar] [CrossRef]
  46. Yadava, G.; Tiwarib, S.; Jainc, M.L. Tribological analysis of extreme pressure and anti-wear properties of engine lubricating oil using four ball testers. Mater. Today Proc. 2018, 5, 248–253. [Google Scholar] [CrossRef]
  47. Marko, M.D.; Kyle, J.P.; Wang, Y.S.; Terrell, E.J. Tribological investigations of the load, temperature, and time dependence of wear in sliding contact. PLoS ONE 2017, 12, e0175198. [Google Scholar] [CrossRef] [PubMed]
  48. Peng, D.-X. Effects of concentration and temperature on tribological properties of biodiesel. Adv. Mech. Eng. 2015, 7, 1. [Google Scholar] [CrossRef]
  49. Schertzer, M.J.; Iglesias, P. Meta-Analysis Comparing Wettability Parameters and the Effect of Wettability on Friction Coefficient in Lubrication. Lubricants 2018, 6, 70. [Google Scholar] [CrossRef]
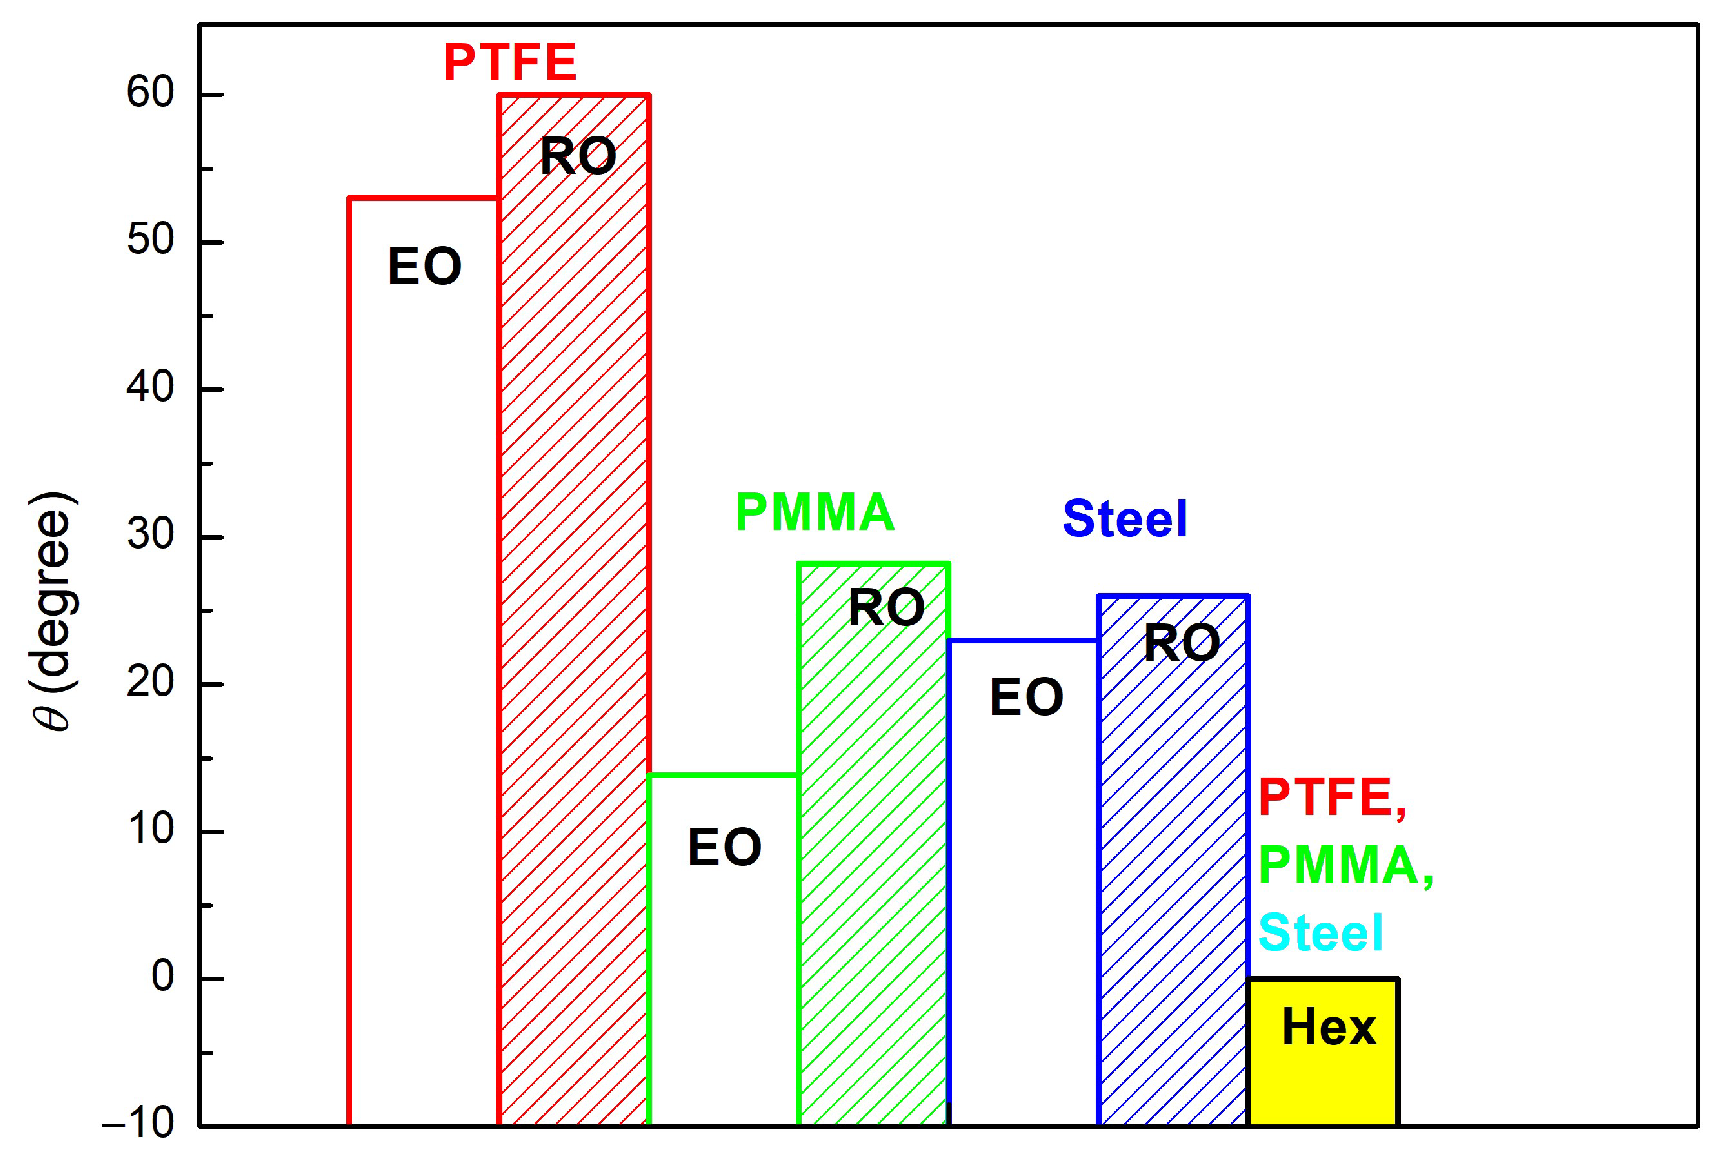
Figure 1. The θ values for RO, EO and Hex on the PTFE, PMMA and steel surfaces.
Applsci 15 09243 g001
Figure 2. The θ values on PTFE for EO + Hex (points 1—measured, curve 1′—calculated using Equation (14)), RO + Hex (points 2—measured, curve 2′—calculated using Equation (15) and RO + EO (points 3—measured, curve 3′—calculated using Equation (16)) vs. x H e x or x R O .
Applsci 15 09243 g002
Figure 3. The γ L V (curves 1–3) and γ L V L W values calculated using Equation (9) (curves 1’–3’) for EO + Hex (curves 1 and 1’), RO + Hex (curves 2 and 2’) and RO + EO (curves 3 and 3’) vs. x H e x or x R O .
Applsci 15 09243 g003
Figure 4. The γ L V A B values (curves 2 and 3) as well γ L V + (curves 2′ and 3′) and γ L V values (curves 1”–3”) calculated from Equation (17) for EO + Hex (curve 1”) RO + Hex (curves 2, 2′ and 2”) and RO + EO (curves 3, 3′ and 3”) vs. x H e x or x R O .
Applsci 15 09243 g004
Figure 5. The θ values for EO + Hex (curves 1 and 1′), RO + Hex (curves 2 and 2′) and RO + EO (curves 3 and 3′) vs. x H e x or x R O . Curves 1–3 correspond to θ on PMMA and curves 1′–3′ on steel.
Applsci 15 09243 g005
Figure 6. The θ values measured tetra on PTFE (points 1–5) and calculated using Equation (18) (curves 1′–5′) for the RO + EO + Hex mixture vs. x H e x . Points 1 and curve 1′—EO = 10% v/v, RO and Hex varying from 0 to 90% v/v; points 2 and curve 2′—EO = 20% v/v, RO and Hex varying from 0 to 80% v/v; points 3 and curve 3′—EO = 40% v/v, RO and Hex varying from 0 to 60% v/v; points 4 and curve 4′—EO = 60% v/v, RO and Hex varying from 0 to 40% v/v; points 5 and curve 5′—EO = 80% v/v, RO and Hex varying from 0 to 20% v/v.
Applsci 15 09243 g006
Figure 7. The measured tetra on PMMA (points 1–5) and calculated using Equation (18) (curves 1′–5′) γ L V values for the RO + EO + Hex mixture vs. x H e x . Points 1 and curve 1′—EO = 10% v/v, RO and Hex changes from 0 to 90% v/v; points 2 and curve 2′—EO = 20% v/v, RO and Hex changes from 0 to 80% v/v; points 3 and curve 3′—EO = 40% v/v, RO and Hex changes from 0 to 60% v/v; points 4 and curve 4′—EO = 60% v/v, RO and Hex changes from 0 to 40% v/v; points 5 and curve 5′—EO = 80% v/v, RO and Hex changes from 0 to 20% v/v.
Applsci 15 09243 g007
Figure 8. The measured tetra on steel (points 1–5) and calculated using Equation (18) (curves 1′–5′) γ L V values for the RO + EO + Hex mixture vs. x H e x . Points 1 and curve 1′—EO = 10% v/v, RO and Hex differs from 0 to 90% v/v; points 2 and curve 2′—EO = 20% v/v, RO and Hex differs from 0 to 80% v/v; points 3 and curve 3′—EO = 40% v/v, RO and Hex differs from 0 to 60% v/v; points 4 and curve 4′—EO = 60% v/v, RO and Hex differs from 0 to 40% v/v; points 5 and curve 5′—EO = 80% v/v, RO and Hex differs from 0 to 20% v/v.
Applsci 15 09243 g008
Table 1. The formulations of the binary mixtures RO + Hex and EO + Hex as well as the ternary mixture RO + EO + Hex.
MixturesVolume RO [cm3]Volume Hex [cm3]Volume EO [cm3]
RO90 + Hex109010-
EO90 + Hex10-1090
RO80 + Hex208020-
EO80 + Hex20-2080
RO70 + Hex307030-
EO70 + Hex30-3070
RO60 + Hex406040-
EO60 + Hex40-4060
RO50 + Hex505050-
EO50 + Hex50-5050
RO40 + Hex604060-
EO40 + Hex60-6040
RO30 + Hex703070-
EO30 + Hex70-7030
RO20 + Hex802080-
EO20 + Hex80-8020
RO10 + Hex901090-
EO10 + Hex90-9010
RO80EO10Hex10801010
RO70EO10Hex20702010
RO50EO10Hex40504010
RO30EO10Hex60306010
RO10EO10Hex80108010
RO70EO20Hex10701020
RO60EO20Hex20602020
RO40EO20Hex40404020
RO20EO20Hex60206020
RO10EO20Hex70107020
RO50EO40Hex10501040
RO40EO40Hex20402040
RO20EO40Hex40204040
RO10EO40Hex50105040
RO30EO60Hex10301060
RO20EO60Hex20202060
RO10EO60Hex30103060
RO10EO80Hex10101080
Table 2. The values of the PTFE, PMMA and steel surface tension.
Solid γ S V   [ m N / m ]   f r o m   E q u a t i o n ( 13 ) = γ S V , f γ S V [mN/m]
HexEORO
PTFE18.5020.6820.3320.24 [45]
PMMA18.5030.5029.6541.28 [26]
Steel18.5029.0030.1840.02 [26]
Table 3. The values of the adhesion work of Hex, EO and RO to PTFE, PMMA and steel.
Solid–Liquid W a (mJ/m2)
Equation (11)
( γ S V . f + γ L V )
Equation (5)Equation (10)
( γ L V + γ S V )
Equation (6)
PTFE-Hex37.0037.0038.7438.70
PMMA-Hex37.0037.0059.7855.30
Steel-Hex37.0037.0058.5253.49
PTFE-EO52.0850.3051.6450.42
PMMA-EO61.9061.8972.6872.01
Steel-EO60.4061.8971.4272.43
PTFE-RO53.7350.1053.6450.10
PMMA-RO63.0564.3574.6874.68
Steel-RO63.5864.3573.4274.71
Table 4. The values of the sum of the PMMA and RO + HO, EO + Hex and RO + Hex mixtures’ surface tensions as well as their adhesion work to PMMA.
RO + EOEO + HexRO + Hex
x R O γ S V , f + γ L V
[mN/m]
W a
[mJ/m2]
x H e x γ S V , f + γ L V
[mN/m]
W a
[mJ/m2]
x H e x γ S V , f + γ L V
[mN/m]
W a
[mJ/m2]
0.0000061.9061.890.0000061.9061.890.0000063.0564.35
0.1092061.9261.910.2327956.7256.710.1152660.4360.38
0.2162061.9561.930.4057252.5352.520.2157055.9055.88
0.3210461.9761.950.5392549.1149.180.3040053.3953.38
0.4238162.0061.980.6454646.4846.600.3822550.9750.97
0.5245662.0762.040.7319644.1144.400.5147546.1746.17
0.6233562.2662.190.8037841.9742.400.6226543.0843.07
0.7202362.4462.350.8643539.9840.740.7122440.9440.93
0.8152762.6262.500.9161338.0839.200.7878139.5739.57
0.9085162.7962.630.960936.6338.000.8524138.5938.59
1.0000063.0562.841.0000035.4237.040.9082638.0038.00
0.9570437.4037.40
1.0000037.0037.00
Table 5. The values of the sum of the surface tension of PMMA and RO + EO, EO + Hex and RO + Hex as well as the mixtures’ adhesion work to PMMA.
RO + EOEO + HexRO + Hex
x R O γ S V , f + γ L V
[mN/m]
W a
[mJ/m2]
x H e x γ S V , f + γ L V
[mN/m]
W a
[mJ/m2]
x H e x γ S V , f + γ L V
[mN/m]
W a
[mJ/m2]
0.0000072.6872.000.0000072.6872.010.0000074.6874.68
0.1092072.771.910.2327969.7968.600.1152672.3872.13
0.2162072.7371.860.4057267.5965.900.2157069.6869.61
0.3210472.7871.800.5392565.863.730.3040068.2867.27
0.4238172.8871.850.6454664.4662.030.3822566.9865.25
0.5245673.0872.040.7319663.1960.540.5147564.4862.62
0.6233573.3872.400.8037862.0559.170.6226562.8860.12
0.7202373.6772.770.8643560.8957.600.7122461.7858.65
0.8152773.9873.240.9161359.7656.890.7878161.0857.32
0.9085174.2973.810.960958.9156.010.8524160.5857.07
1.0000074.6874.681.0000058.1855.300.9082660.2856.70
0.9570459.9856.19
1.0000059.7855.24
Table 6. The summed surface tension values associated with the steel and RO + EO, EO + Hex and RO + Hex mixtures as well as mixtures’ adhesion work to steel.
RO + EOEO + HexRO + Hex
x R O γ S V , f + γ L V
[mN/m]
W a
[mJ/m2]
x H e x γ S V , f + γ L V
[mN/m]
W a
[mJ/m2]
x H e x γ S V , f + γ L V
[mN/m]
W a
[mJ/m2]
0.0000060.4060.300.0000060.4060.300.0000063.5864.94
0.1092060.4460.340.2327955.7955.750.1152660.9460.92
0.2162060.4960.400.4057252.0452.030.2157056.0656.04
0.3210460.5960.500.5392548.9449.010.3040053.5753.57
0.4238160.7860.690.6454646.4046.520.3822551.0851.07
0.5245661.1561.060.7319644.0944.380.5147546.2546.25
0.6233561.7061.600.8037841.9642.390.6226543.1343.13
0.7202362.1962.080.8643539.9840.740.7122440.9740.97
0.8152762.6862.560.9161338.0839.200.7878139.5939.59
0.9085163.1363.000.960936.6338.000.8524138.6038.60
1.0000063.5863.421.0000035.4237.040.9082638.0038.00
0.9570437.4037.40
1.0000037.0037.00
Table 7. The values of the sum of the surface tension of steel and RO + EO, EO + Hex and RO + Hex mixtures as well as the mixtures’ adhesion work to steel.
RO + EOEO + HexRO + Hex
x R O γ S V , f + γ L V
[mN/m]
W a
[mJ/m2]
x H e x γ S V , f + γ L V
[mN/m]
W a
[mJ/m2]
x H e x γ S V , f + γ L V
[mN/m]
W a
[mJ/m2]
0.0000071.4272.430.0000071.4272.430.0000073.4274.26
0.1092071.4472.250.2327968.5368.800.1152671.1271.67
0.2162071.4772.110.4057266.3365.900.2157068.4269.17
0.3210471.5271.980.5392564.5463.550.3040067.0266.85
0.4238171.6271.940.6454663.2061.670.3822565.7264.84
0.5245671.8272.040.7319661.9360.030.5147563.2262.27
0.6233572.1272.290.8037860.7958.490.6226561.6259.73
0.7202372.4172.570.8643559.6357.150.7122460.5258.19
0.8152772.7272.950.9161358.5055.870.7878159.8256.80
0.9085173.0373.450.960957.6554.770.8524159.3256.40
1.0000073.4274.261.0000056.9253.540.9082659.0255.81
0.9570458.7255.00
1.0000058.5253.49
Table 8. The values of spreading coefficient S S / L 1 = γ S V γ L V , S S / L 2 = 2 γ S V L W γ L V L W + γ S V + γ L V + γ S V γ L V + 2 γ L V of RO + EO, EO + Hex and RO + Hex mixtures on PMMA.
RO + EOEO + HexRO + Hex
x R O S S / L ( 1 ) S S / L ( 2 ) x H e x S S / L ( 1 ) S S / L ( 2 ) x H e x S S / L ( 1 ) S S / L ( 2 )
0.000009.889.210.000009.889.210.000007.888.34
0.109209.869.100.2327912.7811.600.1152610.189.93
0.216209.838.960.4057214.9813.300.2157012.8812.81
0.321049.788.800.5392516.6814.530.3040014.2813.27
0.423819.688.650.6454617.9815.430.3822515.5813.85
0.524569.488.440.7319619.0816.140.5147518.0816.22
0.623359.188.200.8037820.0816.770.6226519.6816.92
0.720238.897.990.8643520.9117.260.7122420.7817.65
0.815278.587.840.9161321.6817.690.7878121.4817.72
0.90851 0.9609 0.8524121.9818.47
1.00000 1.00000 0.9082622.2818.70
0.9570422.5818.79
1.0000022.7818.24
Table 9. The values of spreading coefficient S S / L 1 = γ S V , f γ L V S S / L 2 = γ L V c o s θ 1 of RO + EO, EO + Hex and RO + Hex mixtures on PMMA.
RO + EOEO + HexRO + Hex
x R O S S / L ( 1 ) S S / L ( 2 ) x H e x S S / L ( 1 ) S S / L ( 2 ) x H e x S S / L ( 1 ) S S / L ( 2 )
0.00000−0.91−0.910.00000−0.91−0.910.00000−3.75−2.45
0.10920−0.93−0.930.23279−0.28−0.290.11526−1.78−1.82
0.21620−0.96−0.970.40572−0.08−0.080.21570−0.90−0.92
0.32104−1.03−1.050.53925−0.10−0.020.30400−0.62−0.62
0.42381−1.21−1.220.64546−0.13−0.0030.38225−0.43−0.43
0.52456−1.53−1.560.73196−0.29−0.00030.51475−0.23−0.23
0.62335−1.95−2.010.80378−0.430.000.62265−0.13−0.13
0.72023−2.35−2.430.86435−0.760.000.71224−0.07−0.07
0.81527−2.79−2.900.91613−1.120.000.78781−0.03−0.03
0.90851−3.24−3.390.9609−1.370.000.85241−0.01−0.01
1.00000−3.75−3.961.00000−1.620.000.90826−0.01−0.003
0.957040.000.00
1.000000.000.00
Table 10. The values of spreading coefficient S S / L 1 = γ S V γ L V , S S / L 2 = 2 γ S V L W γ L V L W + γ S V + γ L V + γ S V γ L V + 2 γ L V of RO + EO, EO + Hex and RO + Hex mixtures on steel.
RO + EOEO + HexRO + Hex
x R O S S / L ( 1 ) S S / L ( 2 ) x H e x S S / L ( 1 ) S S / L ( 2 ) x H e x S S / L ( 1 ) S S / L ( 2 )
0.000008.629.630.000008.629.630.000006.627.91
0.109208.609.410.2327911.5311.800.115268.929.47
0.216208.579.210.4057213.7313.300.2157011.6212.37
0.321048.528.980.5392515.3414.350.3040013.0212.85
0.423818.428.740.6454616.6015.070.3822514.3213.44
0.524568.228.440.7319617.5315.630.5147516.8215.87
0.623357.928.100.8037818.3916.090.6226518.4216.53
0.720237.637.790.8643518.8916.410.7122419.5217.19
0.815277.327.550.9161319.3016.670.7878120.2217.20
0.908517.017.430.960919.6516.770.8524120.7217.80
1.000006.627.461.0000019.8816.500.9082621.0217.81
0.9570421.3217.60
1.0000021.5216.49
Table 11. The values of spreading coefficient S S / L 1 = γ S V , f γ L V , S S / L 2 = γ L V c o s θ 1 of RO + EO, EO + Hex and RO + Hex mixtures on steel.
RO + EOEO + HexRO + Hex
x R O S S / L ( 1 ) S S / L ( 2 ) x H e x S S / L ( 1 ) S S / L ( 2 ) x H e x S S / L ( 1 ) S S / L ( 2 )
0.00000−2.41−0.910.00000−2.41−0.910.00000−3.23−2.46
0.10920−2.41−0.930.23279−1.21−0.290.11526−1.26−1.82
0.21620−2.41−0.970.40572−0.56−0.080.21570−0.75−0.92
0.32104−2.41−1.050.53925−0.27−0.020.30400−0.43−0.62
0.42381−2.42−1.220.64546−0.20−0.0040.38225−0.33−0.43
0.52456−2.45−1.560.73196−0.31−0.00030.51475−0.16−0.23
0.62335−2.51−2.010.80378−0.440.000.62265−0.08−0.13
0.72023−2.60−2.430.86435−0.760.000.71224−0.03−0.07
0.81527−2.73−2.900.91613−1.120.000.78781−0.01−0.03
0.90851−2.89−3.390.9609−1.370.000.852410.00−0.01
1.00000−3.22−3.961.00000−1.620.000.908260.00−0.003
0.957040.000.00
1.000000.000.00
Table 12. The values of the sum of PMMA and steel surface tensions and the RO + EO + Hex mixture as well as their adhesion work to PMMA and steel calculated using Equations (5) and (6).
PMMASteel
x R O γ S V   +   γ L V
[mN/m]
W a
[mJ/m2]
γ S V   +   γ L V
[mN/m]
W a
[mJ/m2]
γ S V   +   γ L V
[mN/m]
W a
[mJ/m2]
γ S V   +   γ L V
[mN/m]
W a
[mJ/m2]
10% EO
0.0000062.7962.6374.2973.8163.1363.0073.0372.88
0.2174757.6957.6271.1870.3357.9257.8769.9269.10
0.3850453.1053.0768.4867.0353.2753.2567.2265.58
0.6263446.0346.0264.5862.0446.2746.2763.3260.56
0.7917442.6442.6462.6859.3642.7142.7161.4257.80
0.8563539.9539.9561.2857.4739.9739.9760.0255.88
0.9609038.0038.0060.2856.0138.0038.0059.0254.33
20% EO
0.0000062.6262.5073.9873.2462.6862.5672.7272.39
0.2192757.1057.0470.7869.7557.2757.2269.5268.60
0.3878652.9052.8768.3866.8953.1753.1567.1265.63
0.6300846.4546.4464.6862.1746.5146.5163.4260.84
0.7957142.7542.7462.6859.2942.7442.7361.4257.89
0.8603340.9940.9961.7858.1840.9940.9960.5256.73
0.9161339.2039.2060.8856.8939.2039.2059.6255.42
40% EO
0.0000062.2662.1973.3872.4061.7061.6072.1271.73
0.2229756.8156.7870.3869.1556.5756.5369.1268.30
0.3936452.5252.5067.9866.3352.4452.4366.7265.39
0.6376846.7546.7564.7862.2846.7446.7463.5261.22
0.7279344.5544.5563.5860.6644.5244.5262.3259.60
0.8037842.4042.4062.4859.1542.3942.3961.2258.14
60% EO
0.0000062.0061.9872.8871.8560.7860.6971.6271.38
0.2268056.5656.5569.9868.4855.8855.8368.7267.93
0.3995952.6052.6067.7866.2452.1152.1066.5265.54
0.5356149.7049.7066.1864.5349.4349.4264.9263.73
0.6454646.6046.6064.5861.9960.7846.5263.3261.17
80% EO
0.0000061.9561.9372.7371.8660.4960.4071.4771.55
0.2307656.9256.9269.8868.6156.2456.2368.6268.19
0.4057252.5952.5867.5865.9152.2752.2666.3265.39
Table 13. The values of the spreading coefficient of S S / L 1 = γ S V , f γ L V , S S / L 2 = γ L V c o s θ 1 , S S / L 3 = γ S V γ L V and S S / L 4 = 2 γ S V L W γ L V L W + γ S V + γ L V + γ S V γ L V + 2 γ L V for the aqueous solution of RO + EO + Hex mixtures on PMMA and steel.
PMMASteel
x R O S S / L (1) S S / L (2) S S / L (3) S S / L (4) S S / L (1) S S / L (2) S S / L (3) S S / L (4)
10% EO
0.00000−3.24−3.398.277.79−2.89−3.027.016.86
0.21747−2.11−2.1811.3810.53−1.88−1.9310.129.30
0.38504−1.31−1.3314.0812.63−1.13−1.1512.8211.18
0.62634−0.57−0.5817.9815.45−0.33−0.3316.7213.96
0.79174−0.16−0.1619.8816.56−0.09−0.0918.6215.00
0.85635−0.05−0.0521.2817.47−0.03−0.0320.0215.88
0.960900.000.0022.2818.010.000.0021.0216.33
20% EO
0.00000−2.79−2.908.587.84−1.78−2.417.326.99
0.21927−1.91−1.9611.7810.75−1.05−1.2110.529.60
0.38786−1.30−1.3314.1812.69−0.29−0.5612.9211.43
0.63008−0.36−0.3617.8815.37−0.07−0.2716.6214.04
0.79571−0.06−0.0619.8816.49−0.01−0.2018.6215.09
0.86033−0.01−0.0120.7817.180.00−0.3119.5215.73
0.916130.000.0021.6817.69−1.78−0.4420.4216.22
40% EO
0.00000−1.95−2.019.188.20−2.51−2.607.927.53
0.22297−1.40−1.4212.1810.95−1.63−1.6710.9210.10
0.39364−0.89−0.9014.5812.93−0.96−0.9713.3211.99
0.63768−0.26−0.2517.7815.28−0.26−0.2616.5214.22
0.72793−0.06−0.0518.9816.06−0.09−0.0817.7215.00
0.803780.000.0020.0816.75−0.01−0.0118.8215.74
60% EO
0.00000−1.21−1.229.688.65−2.42−2.518.188.18
0.22680−0.85−0.8512.5811.08−1.53−1.5610.5310.53
0.39959−0.40−0.4014.7813.24−0.89−0.9012.5412.54
0.53561−0.11−0.1016.3814.73−0.38−0.3813.9313.93
0.64546−0.010.0017.9815.3914.18−0.0814.5714.57
80% EO
0.00000−0.96−0.979.838.96−2.5−2.418.578.65
0.23076−0.28−0.2812.6811.41−0.97−1.2111.4210.99
0.40572−0.02−0.0214.9813.31−0.34−0.5613.7212.79
Disclaimer/Publisher’s Note: The statements, opinions and data contained in all publications are solely those of the individual author(s) and contributor(s) and not of MDPI and/or the editor(s). MDPI and/or the editor(s) disclaim responsibility for any injury to people or property resulting from any ideas, methods, instructions or products referred to in the content.