Article

Predicting Student Dropout from Day One: XGBoost-Based Early Warning System Using Pre-Enrollment Data

by
Blanca Carballo-Mendívil
1,*,
Alejandro Arellano-González
1,
Nidia Josefina Ríos-Vázquez
2 and
María del Pilar Lizardi-Duarte
1
1
Industrial Engineering Department, Sonora Institute of Technology, Ciudad Obregón 85000, Mexico
2
Planning Department, Sonora Institute of Technology, Ciudad Obregón 85000, Mexico
*
Author to whom correspondence should be addressed.
Appl. Sci. 2025, 15(16), 9202; https://doi.org/10.3390/app15169202
Submission received: 11 July 2025 / Revised: 31 July 2025 / Accepted: 15 August 2025 / Published: 21 August 2025

Abstract

Featured Application

This work introduces a practical and human-centered early warning system that helps universities detect students at higher risk of dropping out before they even attend their first class. By drawing on information shared by students at the time of enrollment, the model enables universities to identify who may require extra support early on, allowing them to reach out with care, guidance, and resources before challenges become barriers.

Abstract

Student dropout remains a critical challenge in higher education, especially within public universities that serve diverse and vulnerable populations. This research presents the design and evaluation of an early warning system based on an XGBoost classifier, trained exclusively on data collected at the time of student enrollment. Using a retrospective dataset of nearly 40,000 first-year students (2014–2024) from a Mexican public university, the model incorporated academic, socioeconomic, demographic, and perceptual variables. The final XGBoost model achieved an AUC-ROC of 0.6902 and an F1-score of 0.6946 for the dropout class, with a sensitivity of 88%. XGBoost was chosen over Random Forest due to its superior ability to detect students at risk, a critical requirement for early intervention. The model flagged 59% of incoming students as high-risk, with considerable variability across academic programs. The most influential predictors included age, high school GPA, conditioned admission, and other family responsibilities and economic constraints. This research demonstrates that early warning systems can transform enrollment data into timely and actionable insights, enabling universities to identify vulnerable students earlier and respond more effectively, allocate support more efficiently, and enhance their efforts to reduce dropout rates and improve student retention.

1. Introduction

University dropouts are a complicated phenomenon that affects not only the students who leave school but also the communities and organizations that lose valuable human potential. Additionally, when students depart, universities face challenges to their operational effectiveness, institutional legitimacy, and educational quality [1,2].
In response, higher education institutions are increasingly expected to identify students at risk and provide them with targeted support through mentoring programs, academic advising, financial aid, psychological services, and vocational guidance [2,3,4]. However, many of these efforts remain reactive; they are triggered only after clear warning signs emerge, such as poor academic performance or persistent absenteeism [5,6]. By then, the student’s connection to the institution may already be weakened, reducing the likelihood of retention.
Furthermore, most existing predictive models rely on data that becomes available only after one or more academic terms—such as GPA, failed courses, or reenrollment history—limiting their capacity for early intervention [7,8]. This delay underscores the need for predictive tools that can operate before students attend their first class.
Against this backdrop, there is a pressing need to develop early warning systems that can identify students at risk of dropping out as soon as they enroll. Such systems can support a more efficient allocation of institutional resources and enable personalized interventions that take into account students’ circumstances.
This study aims to address that need. Its goal is to develop and validate a predictive model that estimates the risk of university dropout using only the information available at the time of enrollment. Rather than relying on future academic performance, the model draws on data gathered during the admissions process, including sociodemographic background, prior academic achievement, economic conditions, and motivational factors.
The model was tested using historical data from a Mexican public university operating in a context marked by structural inequality and limited resources for student support [9]. The goal was not only to build a technically robust model but also to produce a practical tool that can be realistically deployed in similar higher education contexts across Latin America.
In contrast to most prior studies (see Table 1), which rely on post-enrollment data, this research focuses exclusively on pre-enrollment attributes, positioning it within a smaller but growing line of work that seeks to predict risk before academic interaction begins.
Moreover, while other studies have reported higher scores using broader sets of features, this study’s contribution lies in building an operational model based on data that is immediately available during student intake, demonstrating its feasibility within a resource-constrained institutional system.
Beyond its empirical contribution, this article illustrates how an institution can transition from intuition-based decision-making—often grounded in faculty experience—to a data-driven approach using machine learning techniques. The entire process was structured according to the CRISP-DM methodology, which guided each step: understanding the business problem, preparing the data, selecting the data, building and calibrating the model, and ultimately deploying it for real-time prediction and risk visualization.
This structured approach not only enhances the model’s technical performance but also strengthens its replicability and sustainability in institutions seeking to implement proactive strategies to reduce early dropout.

2. Theoretical Foundations and Literature Review

University dropout is a complex phenomenon that cannot be explained solely by individual will or academic performance. For decades, the specialized literature has proposed theoretical models that frame it as the result of interactions among structural, institutional, and personal factors, embedded in processes of socialization, adaptation, and persistence.
One of the most influential approaches is Vincent Tinto’s longitudinal model. According to this model, students drop out of school when they are unable to integrate enough socially and academically. Both pre-entry characteristics (academic success, goals, and cultural capital) and the experiences students have while attending university are necessary for this integration. A lack of integration weakens commitment to academic and institutional goals, increasing the likelihood of dropping out. Over time, Tinto also acknowledged the importance of external (family, financial) and subjective (self-efficacy, sense of belonging) factors in the decision to continue or abandon studies [26,27,28,29].
From another angle, Bean and Metzner proposed a model more suitable for non-traditional students—those over 24, working, with family responsibilities, or studying part-time—where emphasis shifts toward external and environmental influences. Their conceptual model of dropout syndrome includes academic, social, and personal variables that affect institutional adjustment and, consequently, persistence [30].
The sociological lens of Pierre Bourdieu complements these perspectives. Although he did not focus directly on dropout, his concepts—such as cultural, social, and economic capital, as well as habitus—offer powerful tools for understanding educational exclusion. From this perspective, academic success is not merely a matter of individual merit, but also familiarity with the implicit codes and expectations of the academic field. Dropout, therefore, can be seen as a form of structural exclusion, where some students are unable to adapt to the unspoken rules of the educational environment [31].
To synthesize these frameworks, Kerby [32] proposed a conceptual model informed by classical sociological theory (Durkheim, Mead, Marx, Parsons) and earlier frameworks from Spady, Tinto, and Bean. His proposal identifies three levels influencing student persistence: (1) external factors, such as national educational climate or funding policies; (2) internal factors, like institutional culture and academic experiences; and (3) adaptive factors—especially a sense of belonging and successful socialization within the university—which he argues are just as important as academic performance.
This theoretical foundation has inspired numerous recent empirical studies that aim to operationalize dropout risk through predictive modeling. In public universities across the United States, while academic performance remains a strong predictor of student retention, research has also emphasized the importance of non-academic factors. Variables such as campus engagement and sense of belonging have proven influential in shaping students’ decisions to stay enrolled [33]. Among nontraditional students, socioeconomic background and demographic characteristics also play a substantial role, highlighting the need for retention strategies that are sensitive to student diversity [34].
Similar efforts have emerged in Latin America, where data mining models have been developed, particularly in computer science programs. These models confirm that early academic indicators—such as math performance and initial pass rates—are key predictors of dropout [35]. Additionally, including non-academic variables available at entry, such as living arrangements, financial support mechanisms, and vocational motivations (e.g., reasons for choosing a major or having family role models in the profession), has significantly improved model performance, with some reaching dropout detection rates as high as 86.4% [36].
Studies also show that first-semester student perceptions—such as their ability to adapt to academic work, their overall attitude toward the institution, and clarity about their future career direction—are strongly associated with persistence intentions. These insights are proving valuable for designing early warning systems that are both timely and student-centered [37].
From a computational perspective, a wide range of machine learning techniques have been applied to address this challenge, including decision trees, XGBoost, logistic regression, k-means clustering over time series, and artificial neural networks [10,11,38,39,40]. These approaches have demonstrated that by using only data available at the time of enrollment—such as academic records and environmental conditions—it is possible to predict dropout risk as early as the first few weeks of class [40].
The literature (see Table 1) shows a strong consensus on the effectiveness of machine learning models that use post-enrollment data, such as grades, to predict university dropout [7,12,13,14,15,16,17]. Multiple studies report model evaluations at different stages of the student trajectory, observing performance that improves significantly over time, eventually reaching accuracies above 90% [7,14].
Taken together, these studies demonstrate that the most effective predictive models incorporate academic, socio-demographic, and perceptual data from the outset of the student journey. Rather than reducing dropout to a problem of poor grades, this perspective recognizes it as a symptom of a more profound disconnect between the student and their institutional, cultural, and emotional context.
Despite these advances, early-stage prediction, prior to the availability of university academic performance, remains limited. However, recent studies have shown that machine learning models based solely on pre-enrollment or admission-stage data can achieve moderate levels of accuracy. For example, ref. [18] reported F1-scores of up to 0.86 using only background profile data (e.g., entrance exams, gender, school type). Ref. [19] developed deep learning models trained exclusively on enrollment attributes and achieved accuracies between 72% and 77%. Similarly, ref. [20] used high school academic records to build predictive models with accuracies ranging from 56% to 62% in the early stages.
Nevertheless, other studies confirm that predictive power improves significantly—often exceeding 85% in accuracy or recall—once first-year academic performance data are incorporated [14,23,25].
This research builds on that tradition. Using an empirical, computational approach, it proposes a classification model based on XGBoost that relies solely on data collected during the enrollment process. Its goal is to translate complex dimensions into early and actionable signals that allow institutions to identify risk, prioritize resources, and design interventions that are more humane, timely, and effective.
The choice of input characteristics was guided by existing theoretical frameworks, even though the modeling method was data-driven. For instance, Tinto’s idea of pre-entry qualities is consistent with factors about high school achievement and academic preparedness. Indicators of financial independence and employment during studies mirror the external pressures highlighted in Bean and Metzner’s model for nontraditional students, while predictors like career choice motivations and perceived institutional prestige mirror Bourdieu’s ideas of habitus and cultural capital. This alignment supports the model’s architecture’s theoretical viability.

3. Materials and Methods

This study employed a quantitative, retrospective, and predictive design, structured according to the Cross-Industry Standard Process for Data Mining (CRISP-DM) framework, to develop an early warning system for student dropout. The following sections describe how each of the six CRISP-DM phases was tailored to this project’s specific context.

3.1. Business Understanding

This research was conducted at a public university facing an ongoing challenge: a significant proportion of its students leave before completing their degree programs. This phenomenon has a direct impact on key institutional performance indicators, such as graduation rates, educational quality, and the efficient use of financial and human resources. According to the institution’s operational definition, based on the academic information system, a student is considered to have dropped out if they fail to enroll for four consecutive academic periods.
Administrative records show that approximately 20% of new students do not continue after their first year, despite being enrolled in a mandatory institutional mentoring program. However, historical data reveal that dropout does not occur randomly or evenly over time: 76% of students who drop out do so during the first semester, and an additional 13% leave during the second semester. These figures suggest that a large portion of student loss occurs within the first year and that institutional efforts could be significantly more effective if they were targeted from the beginning, prioritizing those who are most at risk from the moment they enter the university.
To address this, a predictive model was proposed to identify, from day one, students with a high likelihood of dropping out. The model was built using only the information available at the time of enrollment, primarily drawn from socio-academic surveys and administrative records. The goal was to provide the institution with a practical tool to move from broad, undifferentiated support strategies toward more focused and proactive interventions, specifically targeting students facing academic, economic, or social vulnerability. The model’s success criterion was defined as its ability to detect the majority of actual dropout cases (i.e., to maximize recall) while maintaining a minimum precision of 30% for that class. This decision reflects a deliberate and context-sensitive reason: in educational settings like this one, it is preferable to generate false positives than to overlook students who are genuinely at risk. While a false positive could result in an unnecessary intervention, a false negative signifies a lost chance to provide prompt assistance. Early warning systems must put sensitivity first in organizations where equity and inclusion are institutional priorities, even if this means allowing for some prediction error.

3.2. Data Understanding

To build the predictive model, we utilized a historical dataset comprising responses from first-year students to a mandatory diagnostic instrument administered during the university’s admissions process. This instrument includes 60 items designed to collect information on students’ sociodemographic background, academic history, vocational interests, and contextual factors before the start of their first semester. The available database spans cohorts from 2014 to 2024 and includes only those students who were officially admitted to the institution. Cohorts from 2014 to 2022 were used for model training and validation and, prospectively, the model was applied to 2023 and 2024 cohorts to evaluate generalization capacity. This design allowed us to simulate the real-world deployment of the model in identifying at-risk students before the semester begins.
An initial exploratory analysis was conducted using Python tools, such as Pandas and NumPy, which allowed us to identify and normalize 69 numerical variables considered potentially relevant for modeling (see Table A2). This analysis was performed using Python version 3.10 for Data Science. Variables were processed using techniques appropriate to their structure: one-hot encoding for categorical variables, Ordinal Encoding for hierarchical scales, and Min–Max Scaling for continuous values.
Variables were categorized into six theoretical dimensions: economic vulnerability, academic background, personal well-being, institutional engagement, physical environment, and geographic accessibility, which are frequently linked to dropout risk, to aid in interpretation and inform subsequent phases of analysis. The dataset was organized into a multifaceted structure that aligned with this study’s conceptual framework through this classification. Appendix A offers a thorough explanation of the variables used.
Table 2 summarizes the number of surveyed students in each cohort:
Two notable deviations were observed in this historical series. First, in 2021, the number of surveyed students dropped significantly (n = 780) due to the disruptions caused by the COVID-19 pandemic. The institution was compelled to transition many of its administrative and academic processes to virtual environments, which impacted the implementation and coverage of the diagnostic survey. Second, in 2024, the number of responses also decreased (n = 744) due to a significant cybersecurity incident. During this year, the university suffered a ransomware attack that required immediate efforts to restore critical systems, thereby affecting the routine administration of the diagnostic instrument.
The survey results were combined with information from the university’s official information systems. Dropout was operationalized as a binary outcome (whether or not the student remained enrolled), which simplified a complex and multifaceted phenomenon, an inherent limitation in the model’s design. Together with other pertinent academic information, including the semester in which they left and the most recent term for which they were formally enrolled, this data made it possible to identify students who were labeled dropouts. A trustworthy dataset was produced as a result of merging these sources.

3.3. Data Preparation

Data preparation was a critical step to ensure the quality and reliability of the predictive model. The process began with an initial cleaning phase, in which variables that did not add predictive value were removed, including unique identifiers such as the student ID (EMPLID), which carried no informative content for modeling purposes, as well as variables that could lead to data leakage, that is, variables tied to events occurring after enrollment, such as the semester of dropout or the last term attended.
One of the main challenges encountered was the imbalance in the target variable (DROPOUT), which indicated whether a student dropped out. In the original dataset, only about 26% of cases corresponded to actual dropouts, while the majority were students who remained enrolled. To avoid biasing the model toward the majority class (non-dropouts), a random undersampling strategy was applied to that class, resulting in a balanced dataset that better supported the training of models sensitive to actual dropout risk.
Once the data were balanced, they were split into two subsets: 80% for training and 20% for testing, using stratified sampling to preserve the class distribution in both sets. This approach allowed for a more accurate evaluation of model performance under conditions that closely resembled those of its eventual real-world deployment.
A temporal criterion was also applied to select the cohort. Only cohorts from 2014 to 2022 were included in the training and validation phases. This decision reflected the institution’s operational definition of a dropout as one who has not reenrolled over four consecutive academic periods, which requires a specified amount of time to elapse before a student can be formally classified as having dropped out. As of January 2025, students from the 2023 and 2024 cohorts had not yet reached that threshold. Therefore, these recent cohorts were reserved for a prospective application of the trained model, simulating its real use as an early warning tool within the institution.

3.4. Modeling

3.4.1. Model Selection

In this phase, four supervised classification algorithms were evaluated: logistic regression, Random Forest, LightGBM, and XGBoost. All models were implemented in Python using the scikit-learn library, except for LightGBM and XGBoost, which were run using their native implementations. To ensure a fair comparison, all models were trained on the same dataset, which had been previously balanced through undersampling, and followed a consistent preprocessing and validation workflow.
Each model was embedded in a pipeline with two main steps: first, standardization of the numeric features using StandardScaler to ensure scale uniformity, and second, application of the corresponding classifier. Logistic regression was used as a baseline, configured with class weighting to address the original imbalance. Random Forest was trained with 100 trees and a balanced setup. LightGBM was configured with similar hyperparameters, using 200 estimators, a maximum depth of 7, a learning rate of 0.05, and balanced weighting. XGBoost was tuned through a grid search (GridSearchCV) with five-fold stratified cross-validation to find the optimal hyperparameters.
The initial AUC-ROC results were as follows:
  • Logistic Regression: 0.6752 ± 0.0124
  • Random Forest: 0.6842 ± 0.0131
  • LightGBM: 0.6882 ± 0.0090
  • XGBoost: 0.6892 ± 0.0100
While XGBoost and LightGBM exhibited very similar average AUC-ROC scores (0.6892 and 0.6882, respectively), both outperformed the logistic regression model (0.6752), confirming the advantages of tree-based ensemble methods in this task.
Among the more advanced models, XGBoost demonstrated a particularly valuable trait: greater sensitivity in identifying students at risk of dropping out. In an institutional context where missing a student in need can lead to lost opportunities for timely support, this higher recall, despite marginal differences in overall performance, was a decisive factor (recall was prioritized over overall accuracy). The model’s ability to flag at-risk students more effectively made it especially suited for an early warning system focused on equity and prevention.
As a result, the three more advanced models, Random Forest, LightGBM, and XGBoost, were selected for a second round of fine-tuning and evaluation. After optimizing hyperparameters and evaluating each model on the test set, the following results were obtained:
  • Random Forest: AUC-ROC = 0.7055, Accuracy = 64%, MCC = 0.27. Dropout class: Precision = 0.42, Recall = 0.65, F1-score = 0.51, correctly identifying 1276 true positives.
  • LightGBM: AUC-ROC = 0.7023, Accuracy = 64%, MCC = 0.26. Dropout class: Precision = 0.42, Recall = 0.67, F1-score = 0.51, accurately identifying 1312 true positives.
  • XGBoost: AUC-ROC = 0.7018, Accuracy = 60%, MCC = 0.22. Dropout class: Precision = 0.34, Recall = 0.91, F1-score = 0.50, correctly identifying 1788 true positives.
As can be seen, despite a lower precision (0.34) and F1-score (0.50) for the dropout class, XGBoost achieved a remarkably high recall of 0.91, successfully identifying 1788 true positives: students who eventually dropped out. In an early warning context, where minimizing false negatives is a critical institutional priority, this strong sensitivity was a decisive advantage. This recall level and the ability to adjust the decision threshold after training are major strengths of the model. This flexibility is highly valuable in real-world applications, where institutions may need to adjust classification thresholds based on changing priorities or available resources.
Therefore, XGBoost was ultimately selected as the final model due to its superior sensitivity and operational adaptability, qualities that align most closely with the proactive and equitable goals of early dropout prevention.
Moreover, although other potentially more advanced models, such as multilayer perceptrons (MLP) or stacked ensembles, could have been considered, XGBoost was ultimately selected based on three practical considerations: (1) it is a well-established model for structured tabular data and widely used in educational data mining; (2) it provides competitive performance while maintaining interpretability through feature importance analysis, which facilitates institutional decision-making; and (3) it is relatively easy to deploy and maintain, especially in low-resource environments like the one examined in this research.

3.4.2. Model Training and Tuning

Following confirmation that XGBoost was the best model for institutional deployment, a last round of training and optimization was conducted. While keeping a fair trade-off between sensitivity and precision, the objective was to optimize its capacity to identify students who were in danger of dropping out.
The model was integrated into a machine learning pipeline, which began with z-score standardization of all predictors, followed by XGBoost training. An additional step was taken to adjust the decision threshold, optimizing the F1-score and providing a better balance between false positives and false negatives.
The best configuration was identified through a grid search over key hyperparameters, including the number of trees, maximum tree depth, learning rate, and sampling ratios for both rows and columns. Five-fold stratified cross-validation was used to ensure stability and prevent overfitting.
The final, optimal configuration was
  • 200 trees;
  • maximum depth of 7;
  • learning rate of 0.05;
  • 80% subsampling for both rows and features per tree.
This configuration was adopted as the basis for the final evaluation and the model’s future institutional deployment as an early warning tool.

3.5. Evaluation

Once the model was trained using the optimal configuration, its performance was evaluated on the test set. The first metrics analyzed were the area under the ROC curve (AUC), which reached a value of 0.6862, and the average precision, which was 0.6593. These metrics indicate that the model has a solid ability to distinguish between students who drop out and those who remain enrolled, using only the information available at the time of admission.
Since XGBoost output a continuous probability of class membership (i.e., the likelihood of dropout), it was necessary to define a decision threshold to convert these probabilities into binary classifications. Instead of using the standard threshold of 0.5, the threshold that maximized the F1-score was calculated, aiming to balance sensitivity (recall) and precision in identifying at-risk students.
The optimal threshold identified was 0.3380. When applied, the model achieved a recall of 88%, a precision of 57%, and an F1-score of 0.69 for the dropout class. These findings indicate a good balance between accurately identifying the most at-risk pupils and minimizing false positives. This level of performance is considered suitable for initiating early intervention procedures in institutional settings, where neglecting to identify a vulnerable student can have significant repercussions.
In addition to evaluating overall performance, the relative importance of predictive variables was also examined. The most influential features included high school GPA, student age, civil and family burden, availability of free time, and indicators of economic vulnerability, such as tuition funding and financial independence. Additionally, an institutional background, such as attending a private school, carried notable weight.
Lastly, the trained model was safely saved for use with subsequent student cohorts, with the calibrated decision threshold and modified predictions.

3.6. Model Deployment

After validating the model, it was applied to a total of 4682 newly admitted students from the 2023 cohort (n = 3938) and the 2024 cohort (n = 744). For each student, the model generated an individual probability of dropout based on the information collected during the admission process.
These probabilities were then converted into binary risk classifications using the optimal decision threshold of 0.3380, which had been identified during the evaluation phase. As a result, the model flagged 2879 students (61%) as high-risk, while the remaining 1803 students (39%) were classified as low-risk.
The average predicted dropout probability across the dataset was 0.371, with values ranging from 0.0482 to 0.9205, and the standard deviation was 0.1845. This level of variability enables the definition of priority ranges, which can help institutions allocate support resources more effectively.
When results were broken down by cohort, the model identified 60% of students in 2023 (n = 2275) as being at risk compared to 40% (n = 1563) who were not. In the 2024 cohort, 68% of students (n = 504) were flagged as at risk versus 32% (n = 204) identified as low-risk. While the difference is modest, it may reflect contextual factors affecting each group, for instance, lingering post-pandemic effects in 2023 or the institutional cyberattack that disrupted systems in 2024.
Looking ahead, the model is expected to be integrated directly into the university’s Student Trajectory Information System (SITE). This platform, already in use by program coordinators, allows academic staff to access and monitor student profiles. The plan is for the model to be executed automatically each time new students complete the diagnostic instruments during the admissions process. The predicted risk levels will then be linked to each student’s academic record within SITE.
This integration will enable program coordinators and support teams to proactively identify students who may require additional support, whether through tutoring, scholarships, mentoring, or academic advising. By embedding the model into existing systems and workflows, the university can ensure that data-informed prioritization becomes a routine part of its student success strategy, thereby enhancing its ability to offer timely, targeted support from the outset.

3.7. Ethical Considerations and Availability

This research was conducted using anonymized data, adhering to the university’s data protection policies. Formal ethical approval was not required as this study did not involve any interventions or the handling of sensitive data. The source code and machine learning pipelines will be made available on GitHub (online platform, accessed via browser) following publication. However, the dataset will not be shared publicly due to privacy considerations.

4. Results

4.1. Model Performance

During the modeling phase, several supervised classification algorithms were evaluated, including logistic regression, Random Forest, and XGBoost, with and without hyperparameter optimization. All models were trained on a balanced dataset using stratified cross-validation and consistent preprocessing procedures. Table 3 summarizes the main evaluation metrics focused on the positive class (dropout), including AUC-ROC, precision, recall, F1-score, accuracy, and Matthews correlation coefficient (MCC).
Although the optimized Random Forest model achieved the highest AUC and F1-score, the optimized XGBoost model showed the most incredible sensitivity (recall = 91%), which is especially valuable in the institutional context, where the primary goal is to identify as many at-risk students as possible, even at the cost of an acceptable number of false positives.
Once selected as the final model, XGBoost was evaluated on the whole test set, yielding an AUC-ROC of 0.6902 and an average precision of 0.6673, confirming its robustness as an early warning system.
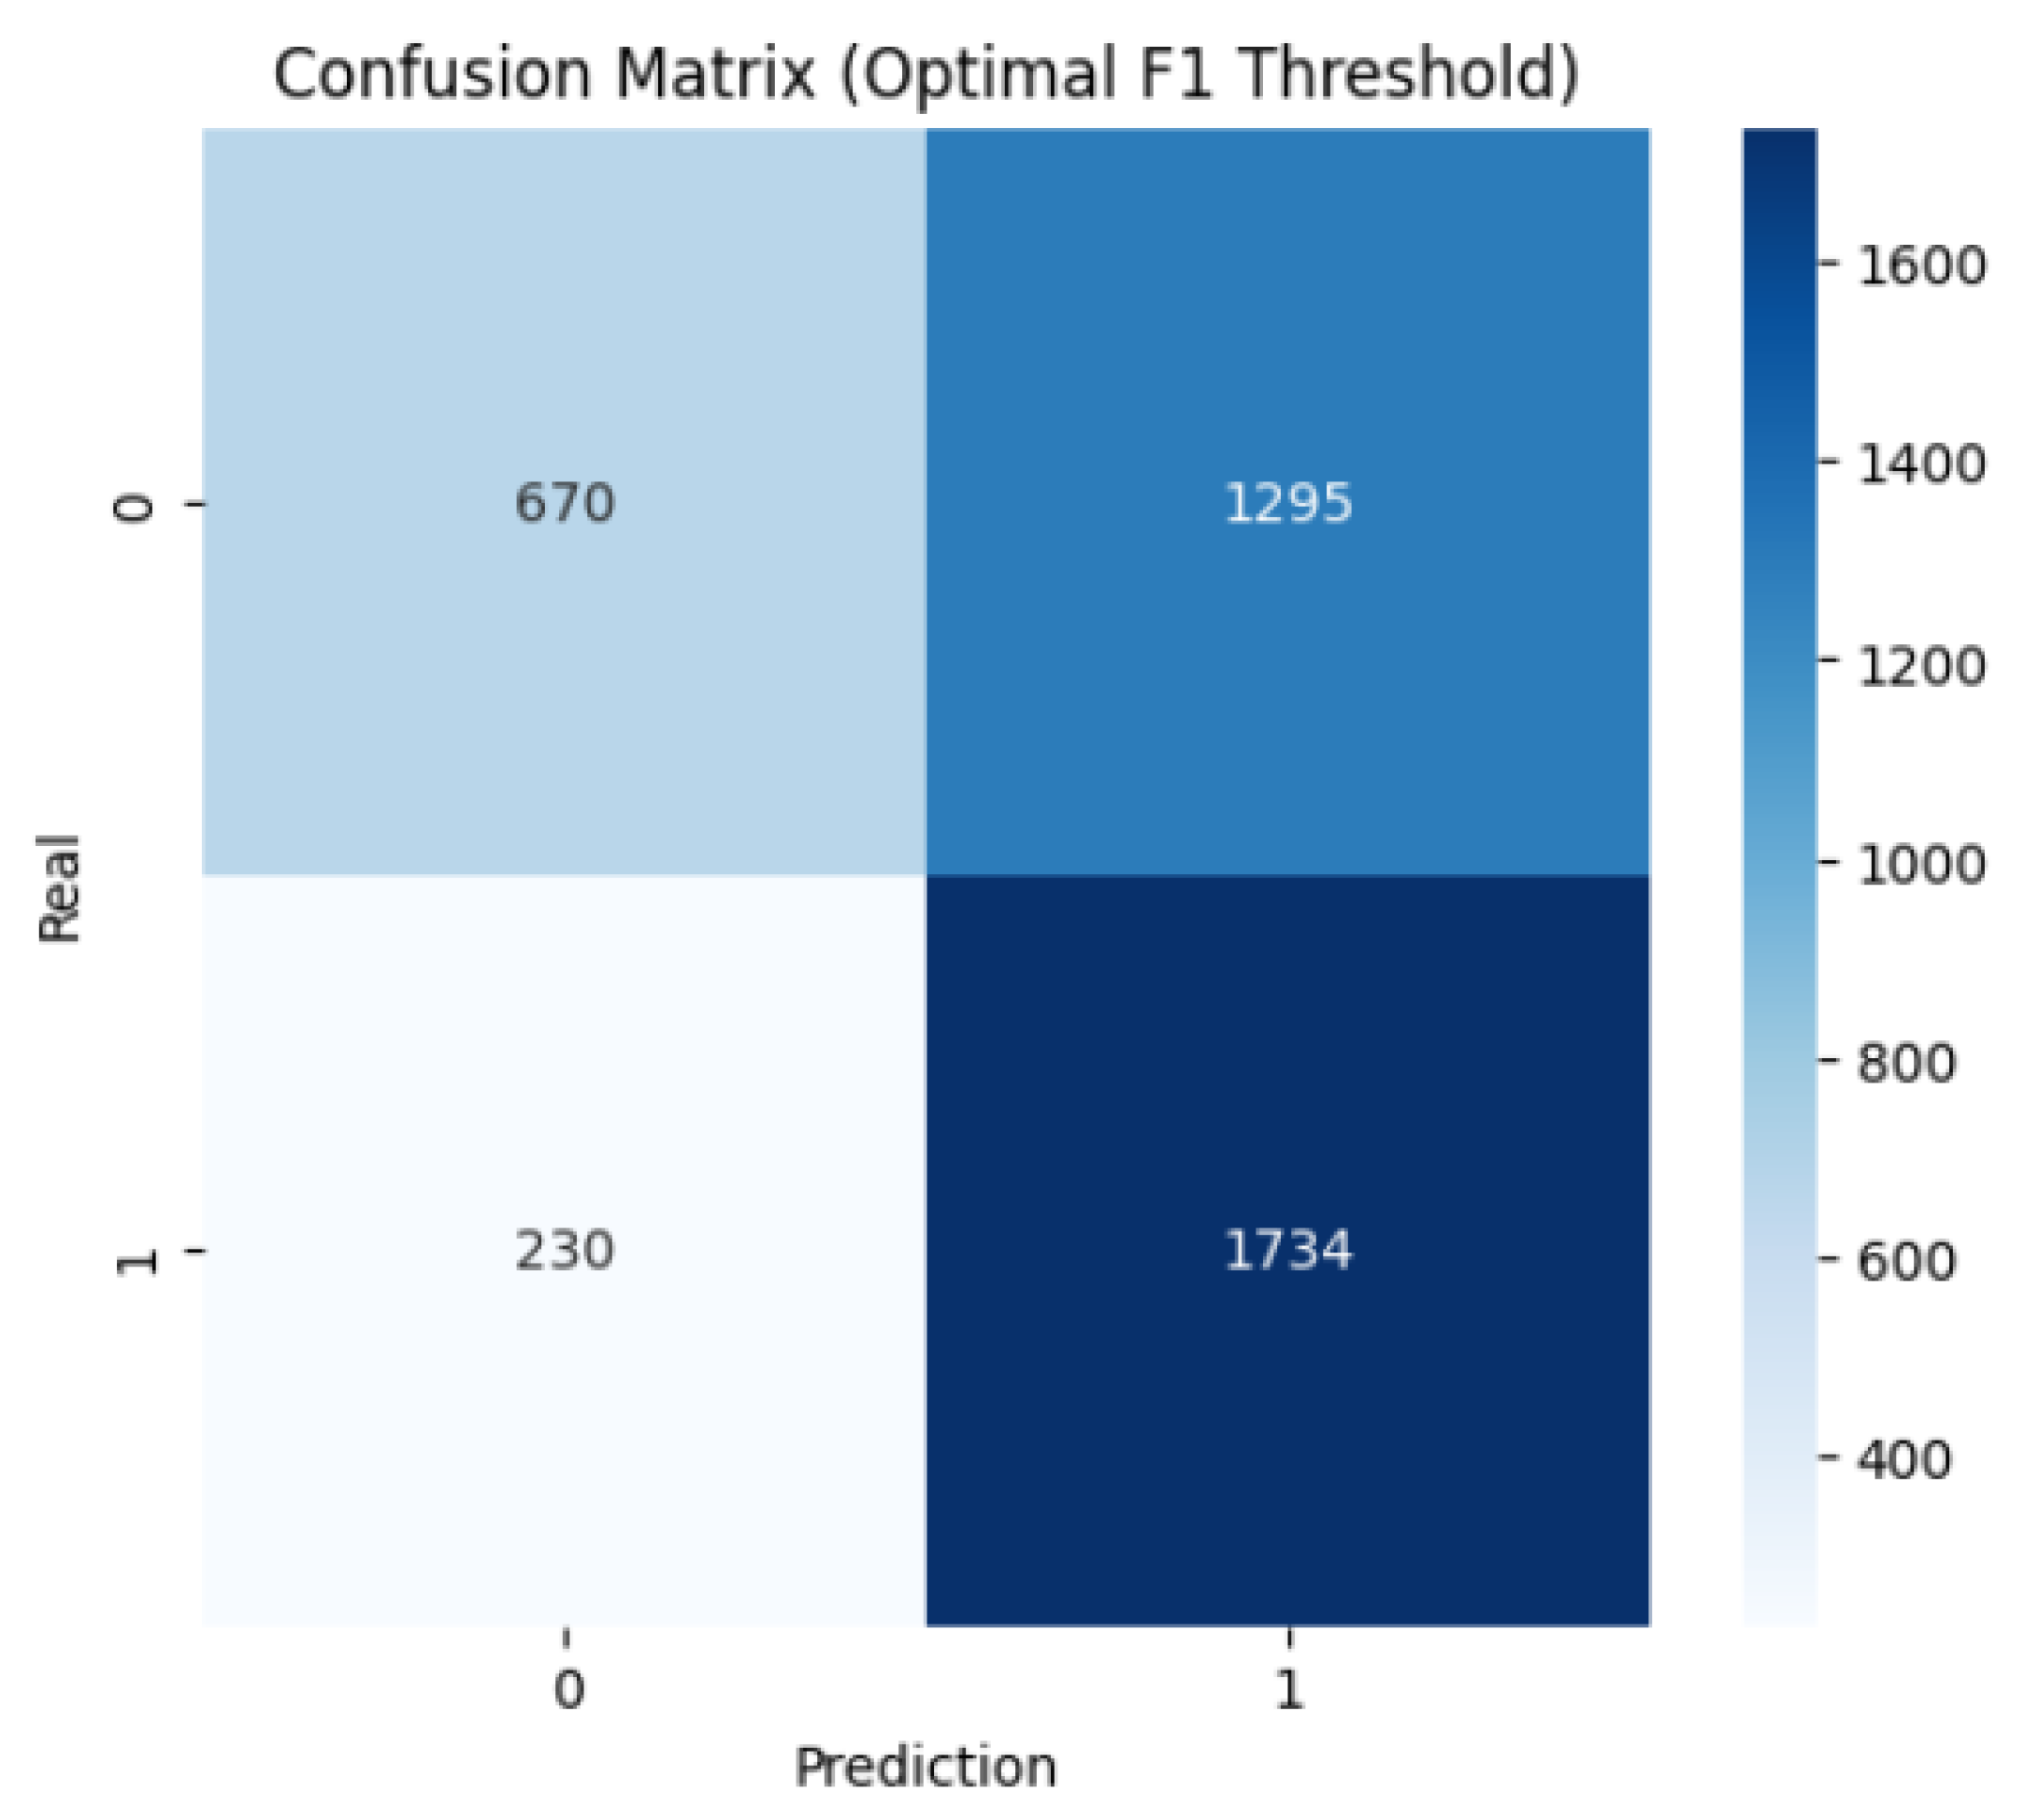
Figure 1a shows that the model consistently outperformed a random classifier. The dotted diagonal line represents the performance of a random classifier. A model with a ROC curve above this line demonstrates better-than-random discrimination between classes. In contrast, Figure 1b illustrates its ability to detect the minority class (dropouts) with a balanced trade-off between precision and recall. To optimize this balance, the classification threshold was calibrated based on the F1-score, identifying an optimal cutoff at 0.3380. Accordingly, if the predicted probability was greater than or equal to 34%, the student was classified as at risk (predicted_risk = 1); otherwise, the student was not considered to be at risk (predicted_risk = 0).
By using this cutoff, the model demonstrated a good balance between sensitivity and specificity, achieving 88% recall, 57% precision, and an F1-score of 0.69. This configuration was purposefully chosen because it is better to address possible false positives than to ignore students who are actually at risk in educational settings such as the one under study.
As shown in Figure 2, the model correctly identified 1734 actual dropouts (true positives), with 1295 false positives and 230 false negatives, which are acceptable numbers under a proactive institutional framework.

4.2. Predictor Importance

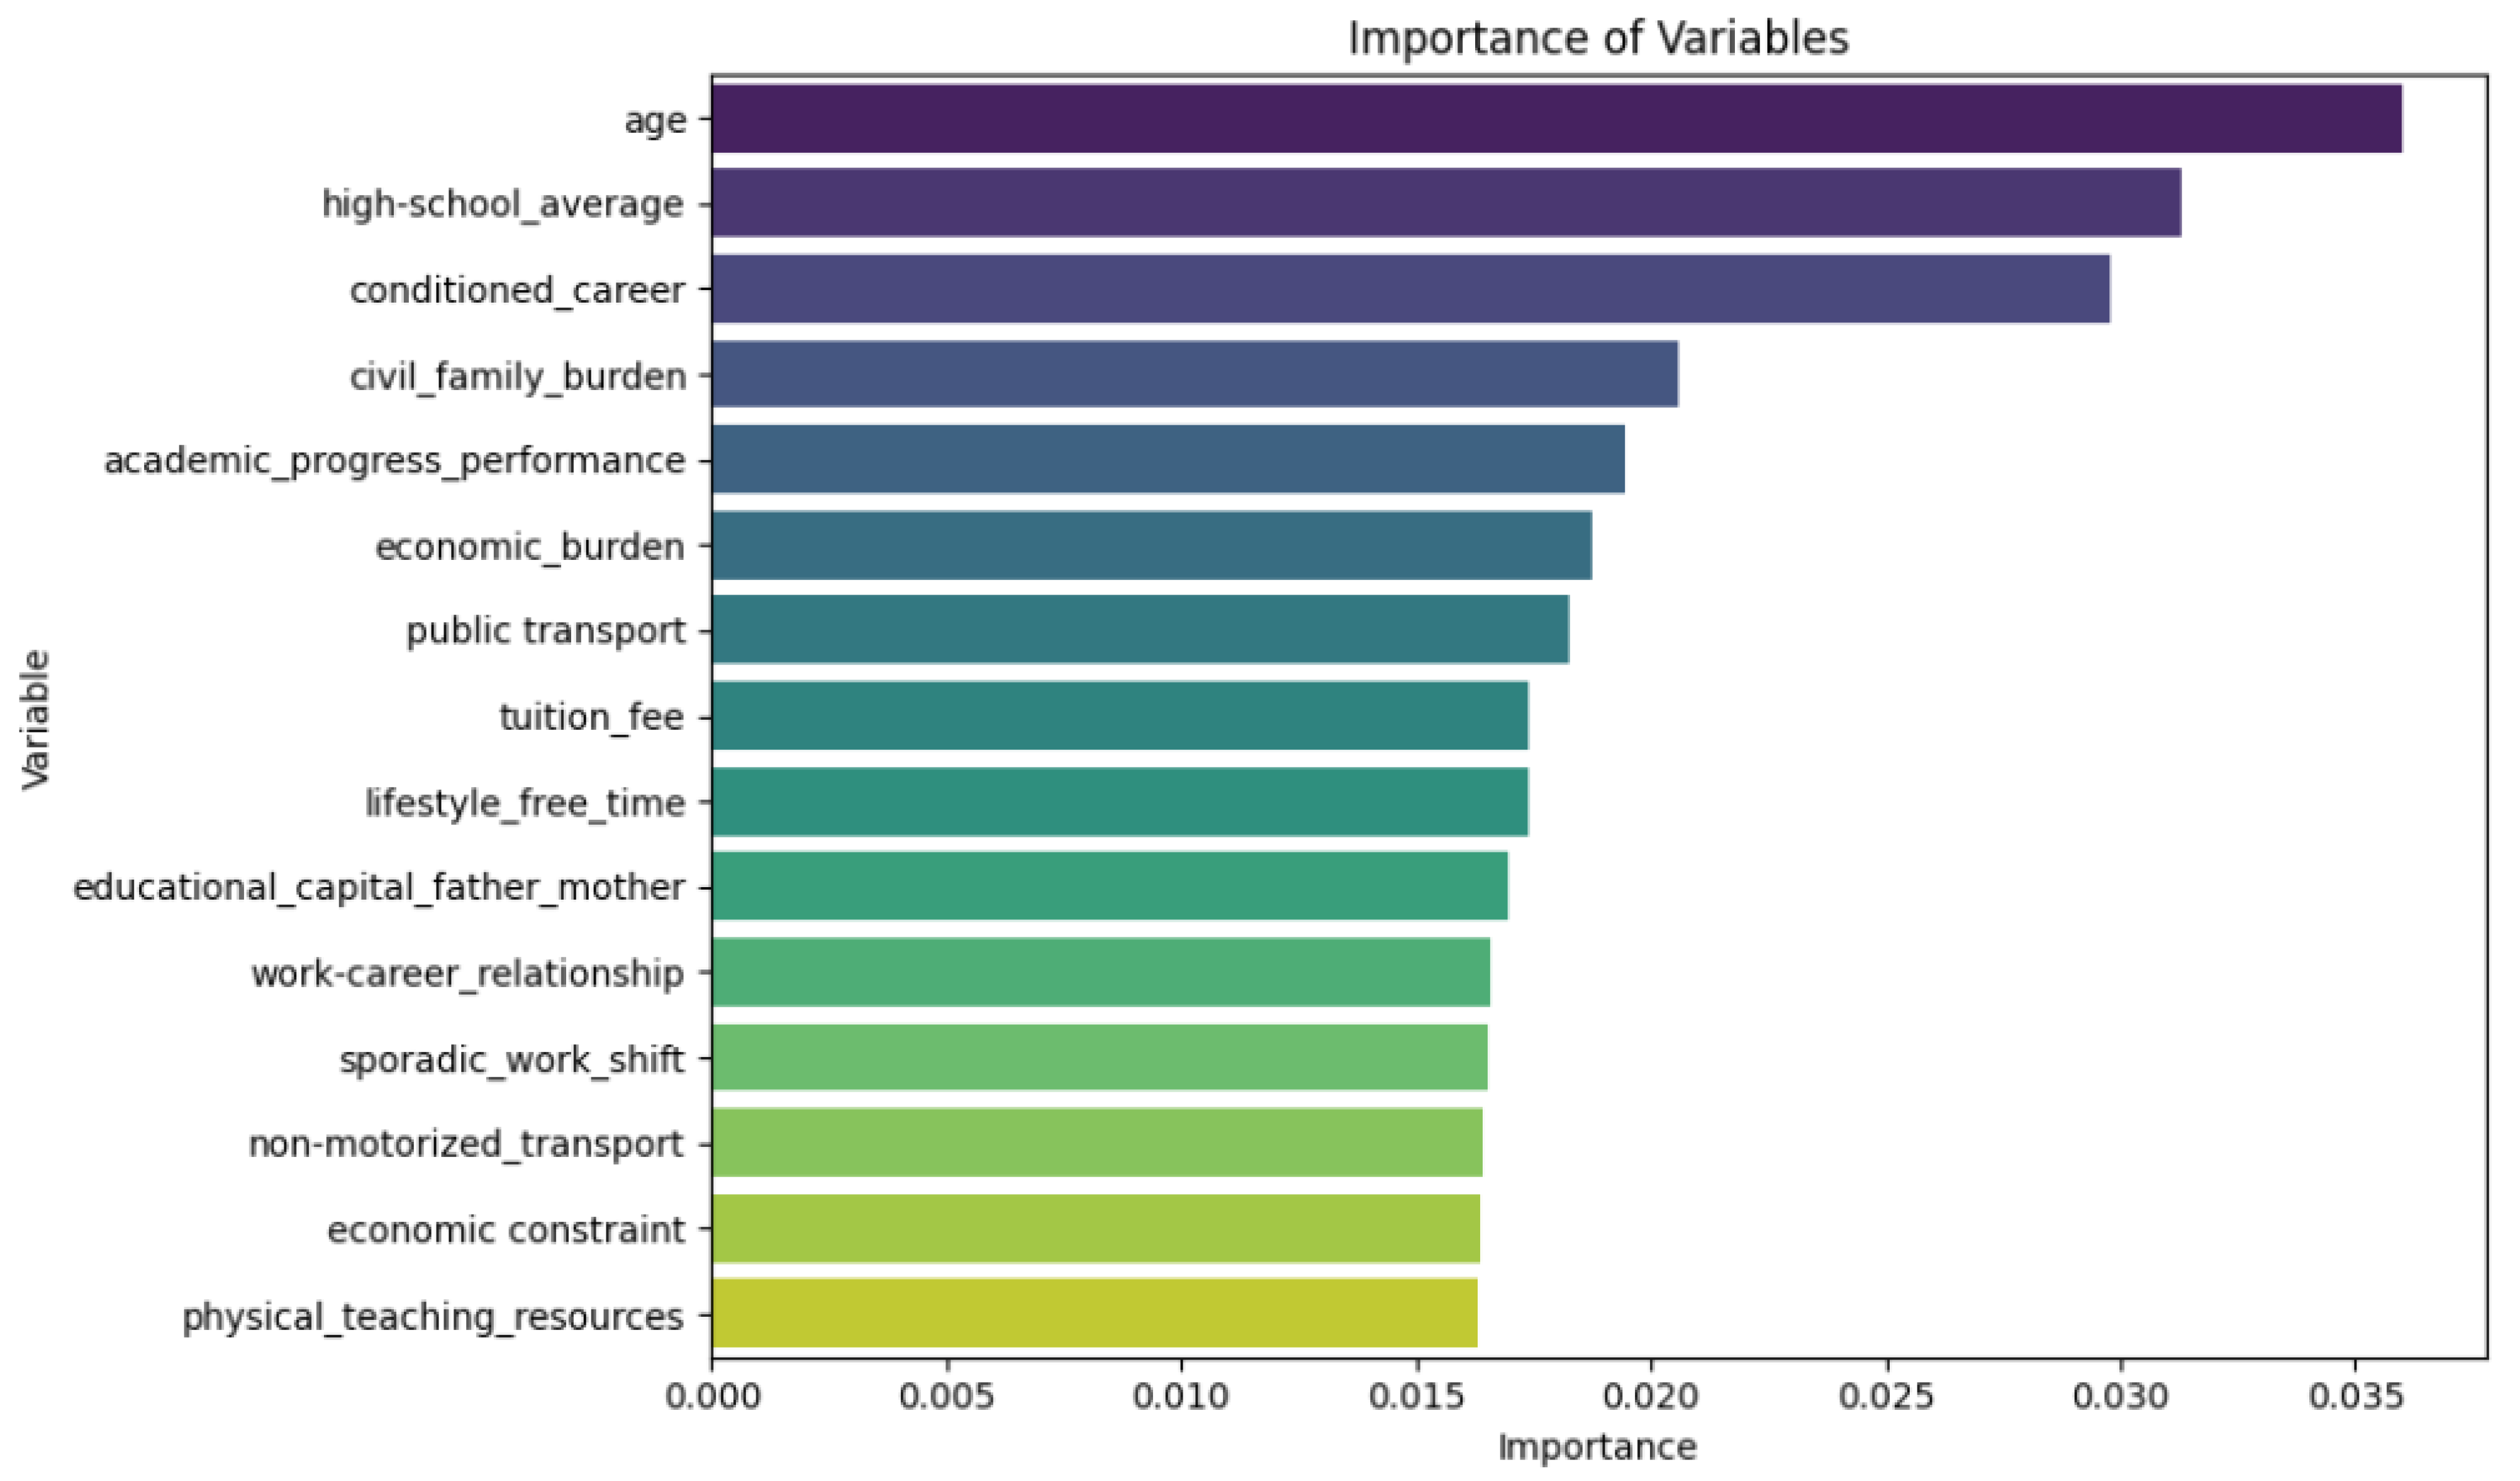
The model’s internal feature importance analysis helped identify the most influential variables in dropout prediction. Figure 3 presents the top 15 features based on their contribution to the model’s decisions.
The most decisive variable in the model’s predictions was student age, followed closely by high school GPA and conditioned admission status. These were the only variables with a score of 0.03 or above. Other highly influential factors included civil family burden, academic performance, economic burden, public transport use, tuition funding, free time availability, and parental educational background, all of which reflect personal and structural challenges faced by students. These findings suggest that both educational trajectories and individual and contextual conditions play a key role from the very beginning of the university journey.
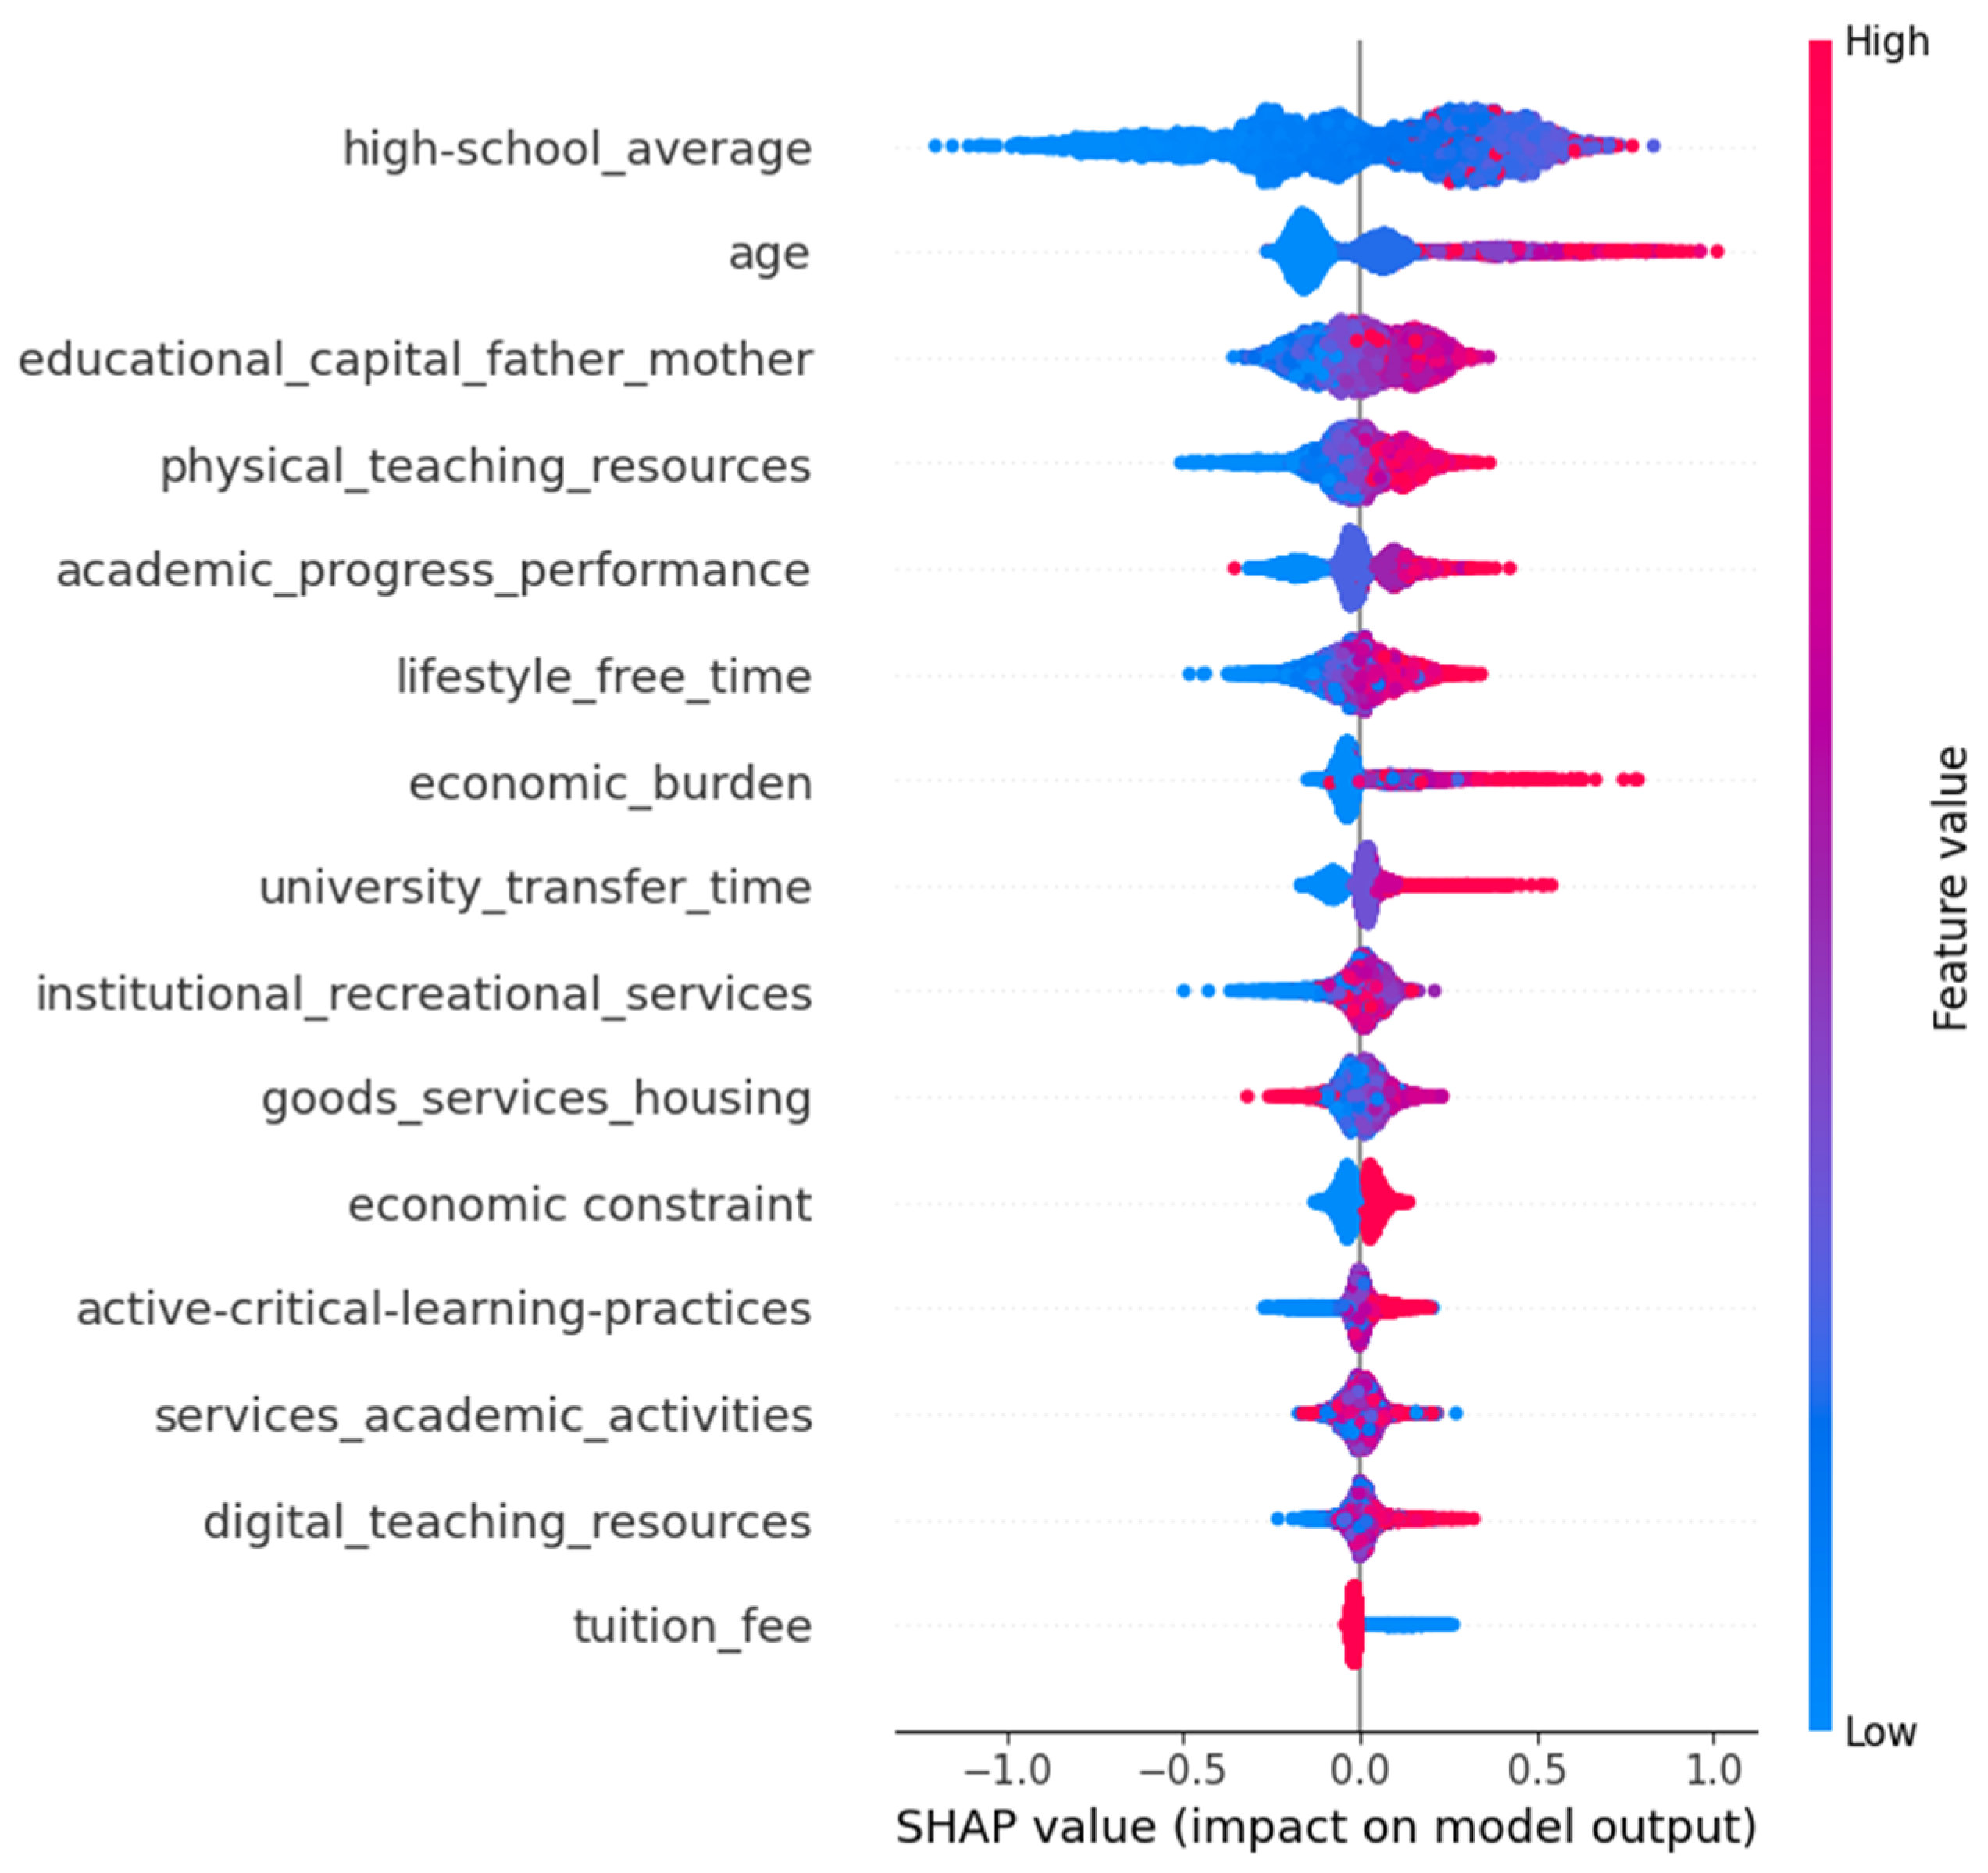
Finally, a Shapley Additive Explanations (SHAP) analysis was conducted to improve the interpretability of the model by estimating the marginal contribution of each feature to individual predictions. Figure 4 shows the SHAP summary plot for the top 15 variables, revealing how higher or lower values of each attribute influenced the predicted dropout probability. The plot confirms the influence of features such as high school GPA, age, and parental educational capital, as well as resource-related and contextual factors.
By showing how certain feature values affect individual predictions, this graphic enhances the conventional feature significance analysis. Each point represents a student’s SHAP value for a given feature. Features are ranked in descending order of their mean absolute SHAP value, indicating their overall contribution to the model’s predictions. The color represents the feature value (red = high, blue = low), helping to visualize the direction and strength of the relationship with predicted dropout risk. The variable’s effect on the model output is displayed horizontally, with values further to the right raising the expected dropout probability.
While there is some overlap with the traditional feature importance ranking from the XGBoost model (Figure 3), the two approaches highlight different variables. This discrepancy was expected: XGBoost feature importance reflects how often a variable is used to split nodes across decision trees. SHAP estimates the average contribution of each feature to individual predictions. As a result, SHAP provides more nuanced insights into how a model behaves for different student profiles. This added layer of interpretability can help institutional stakeholders better understand the rationale behind predictions and inform more targeted interventions.
These findings demonstrate how pre-enrollment academic and contextual variables, including age, perceived financial hardship, and high school GPA, have a significant impact on dropout probability. In-depth analysis of these findings and their implications for targeted intervention strategies is covered in Section 5.

4.3. Prospective Application to New Cohorts

The model was prospectively applied to a sample of 4682 incoming students from the 2023 (n = 3938) and 2024 (n = 744) cohorts. After applying the calibrated threshold, 59% of students (n = 2765) were classified as high-risk, while 41% (n = 1917) were classified as low-risk.
As shown in Figure 5, most students had a dropout probability between 0.2 and 0.5, although a long tail extended toward values above 0.8. This distribution indicates that while most of the student population fell within a moderate risk range, a significant minority was in a critical condition, which would likely go unnoticed without predictive tools.
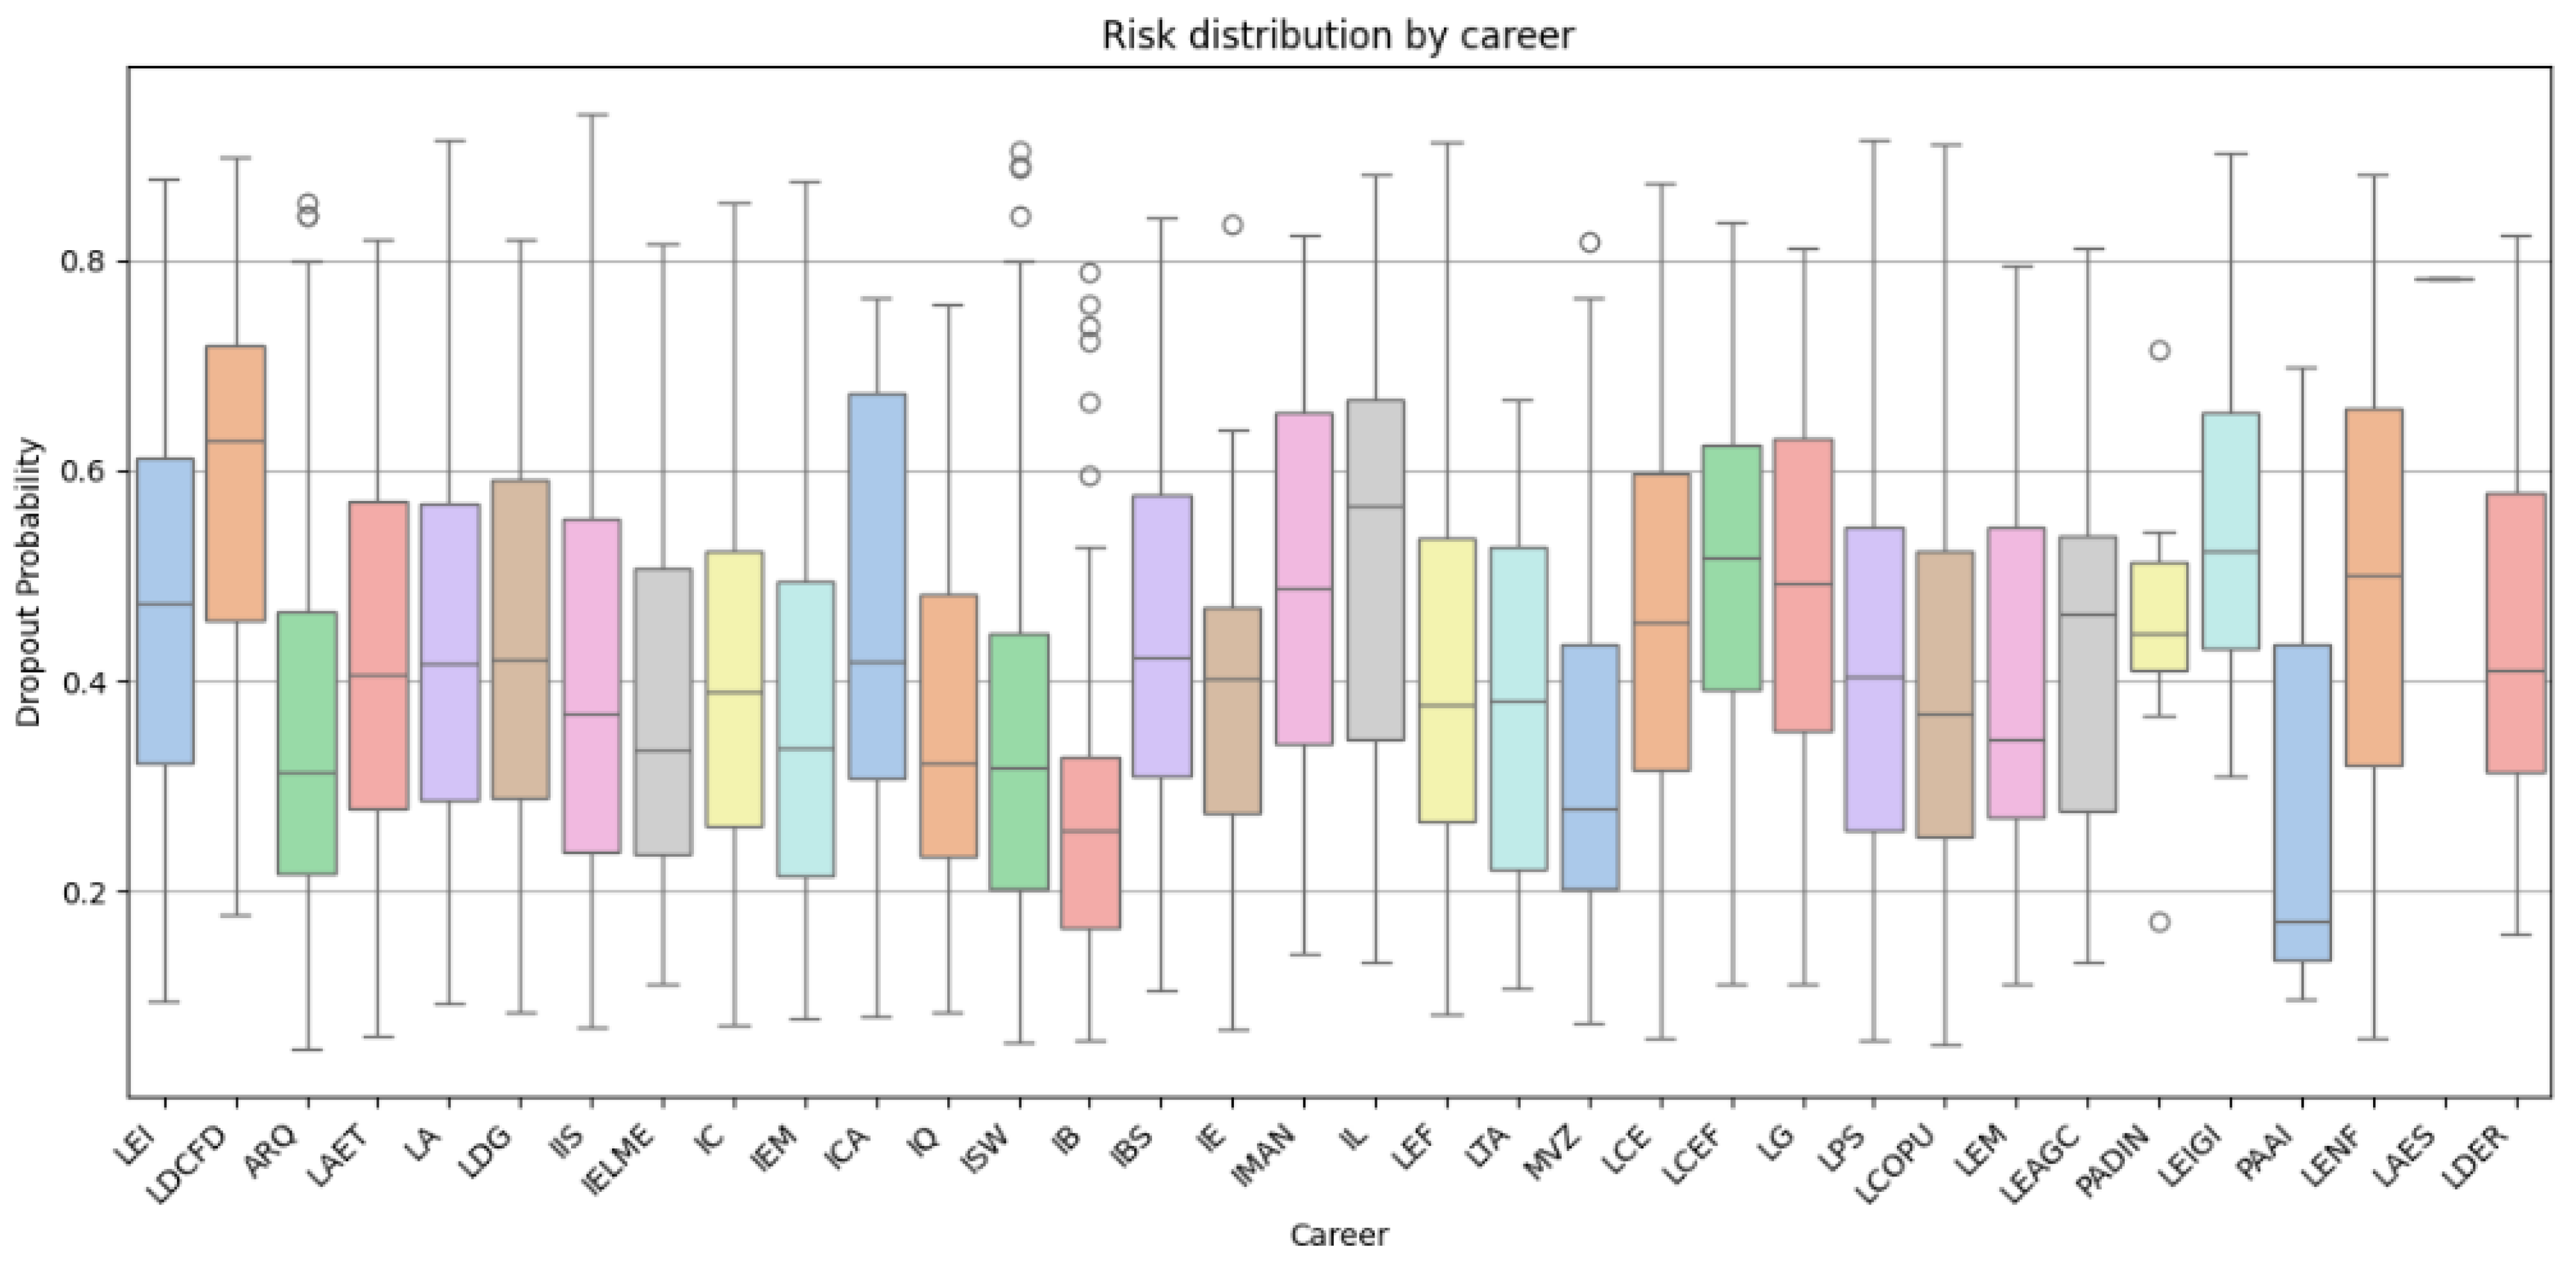
Figure 6 shows the variation in dropout risk by academic program. Some programs had median risk scores above 0.6, which may have been related to workload, career fit, or student profile. This outcome emphasizes how crucial it is to implement program-specific support techniques.
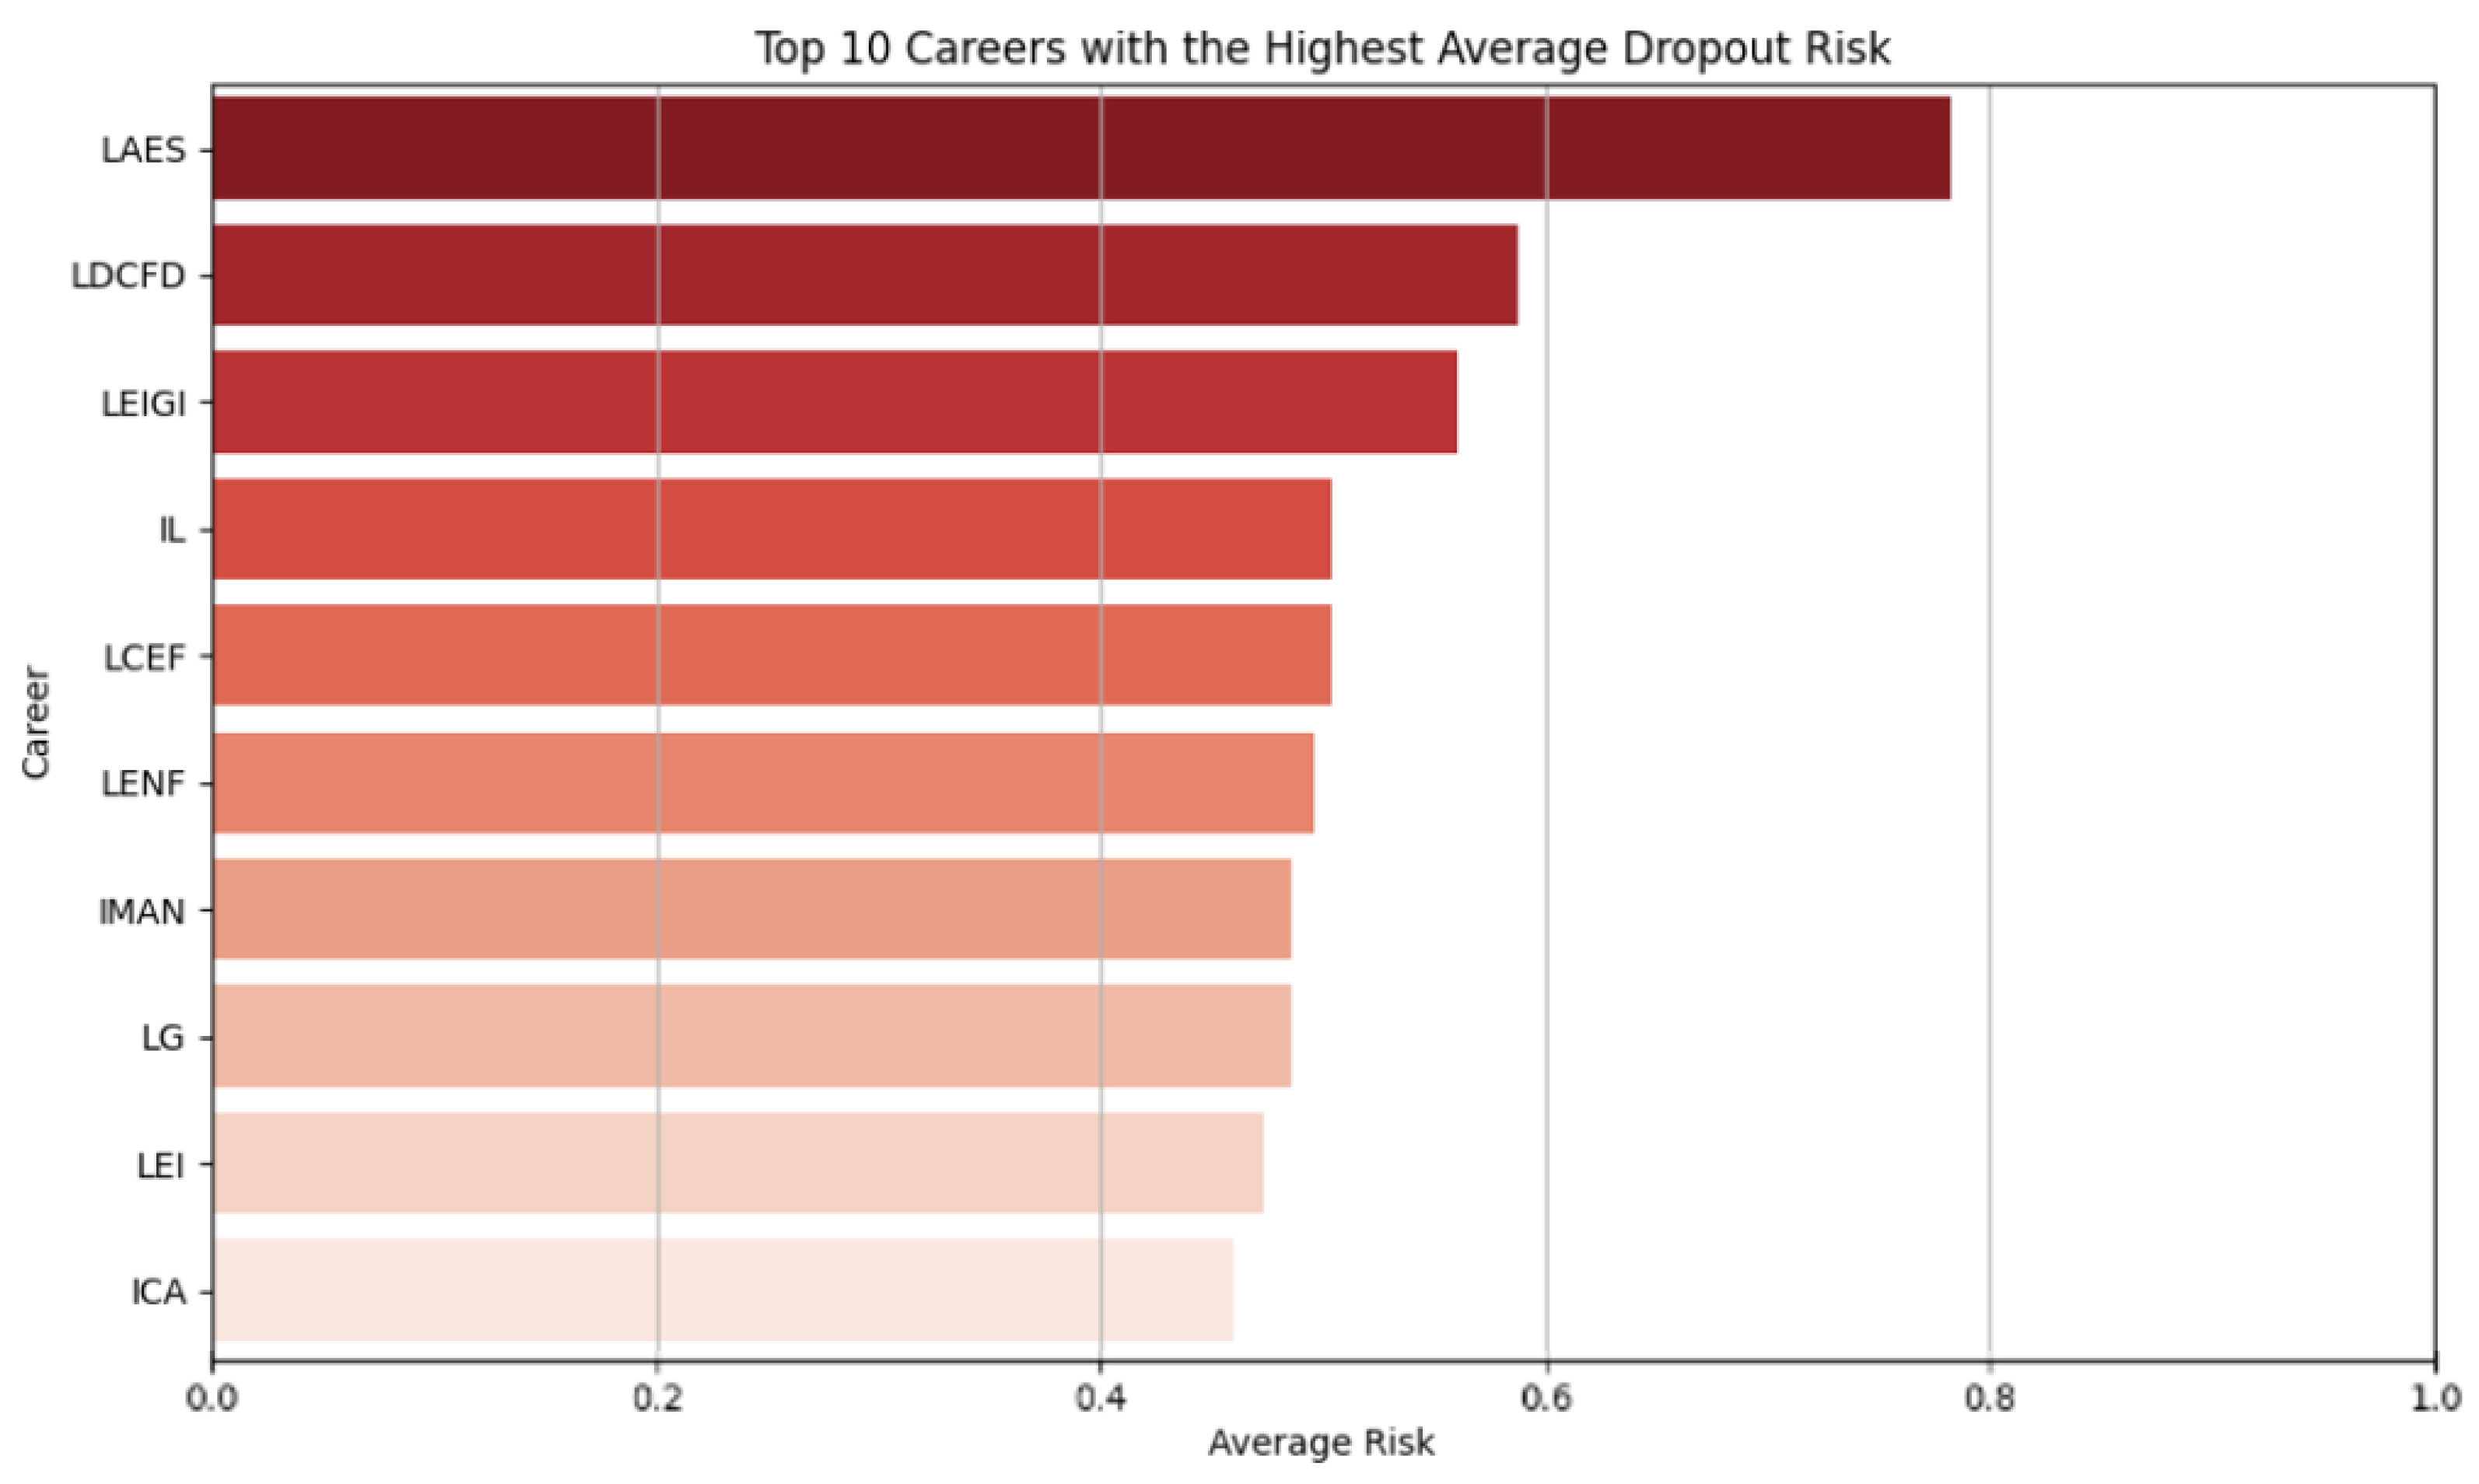
Figure 7 highlights the ten academic programs with the highest average predicted dropout risk. Notably, programs such as Bachelor’s in Strategic Management (LAES), Physical Activity and Sport Management (LDCFD), and Bachelor’s in Early Education and Institutional Management (LEIGI) showed average risk scores exceeding 0.5. These findings are particularly relevant for institutional decision-making as they can help prioritize outreach efforts and guide the strategic allocation of support resources where they are most urgently needed.
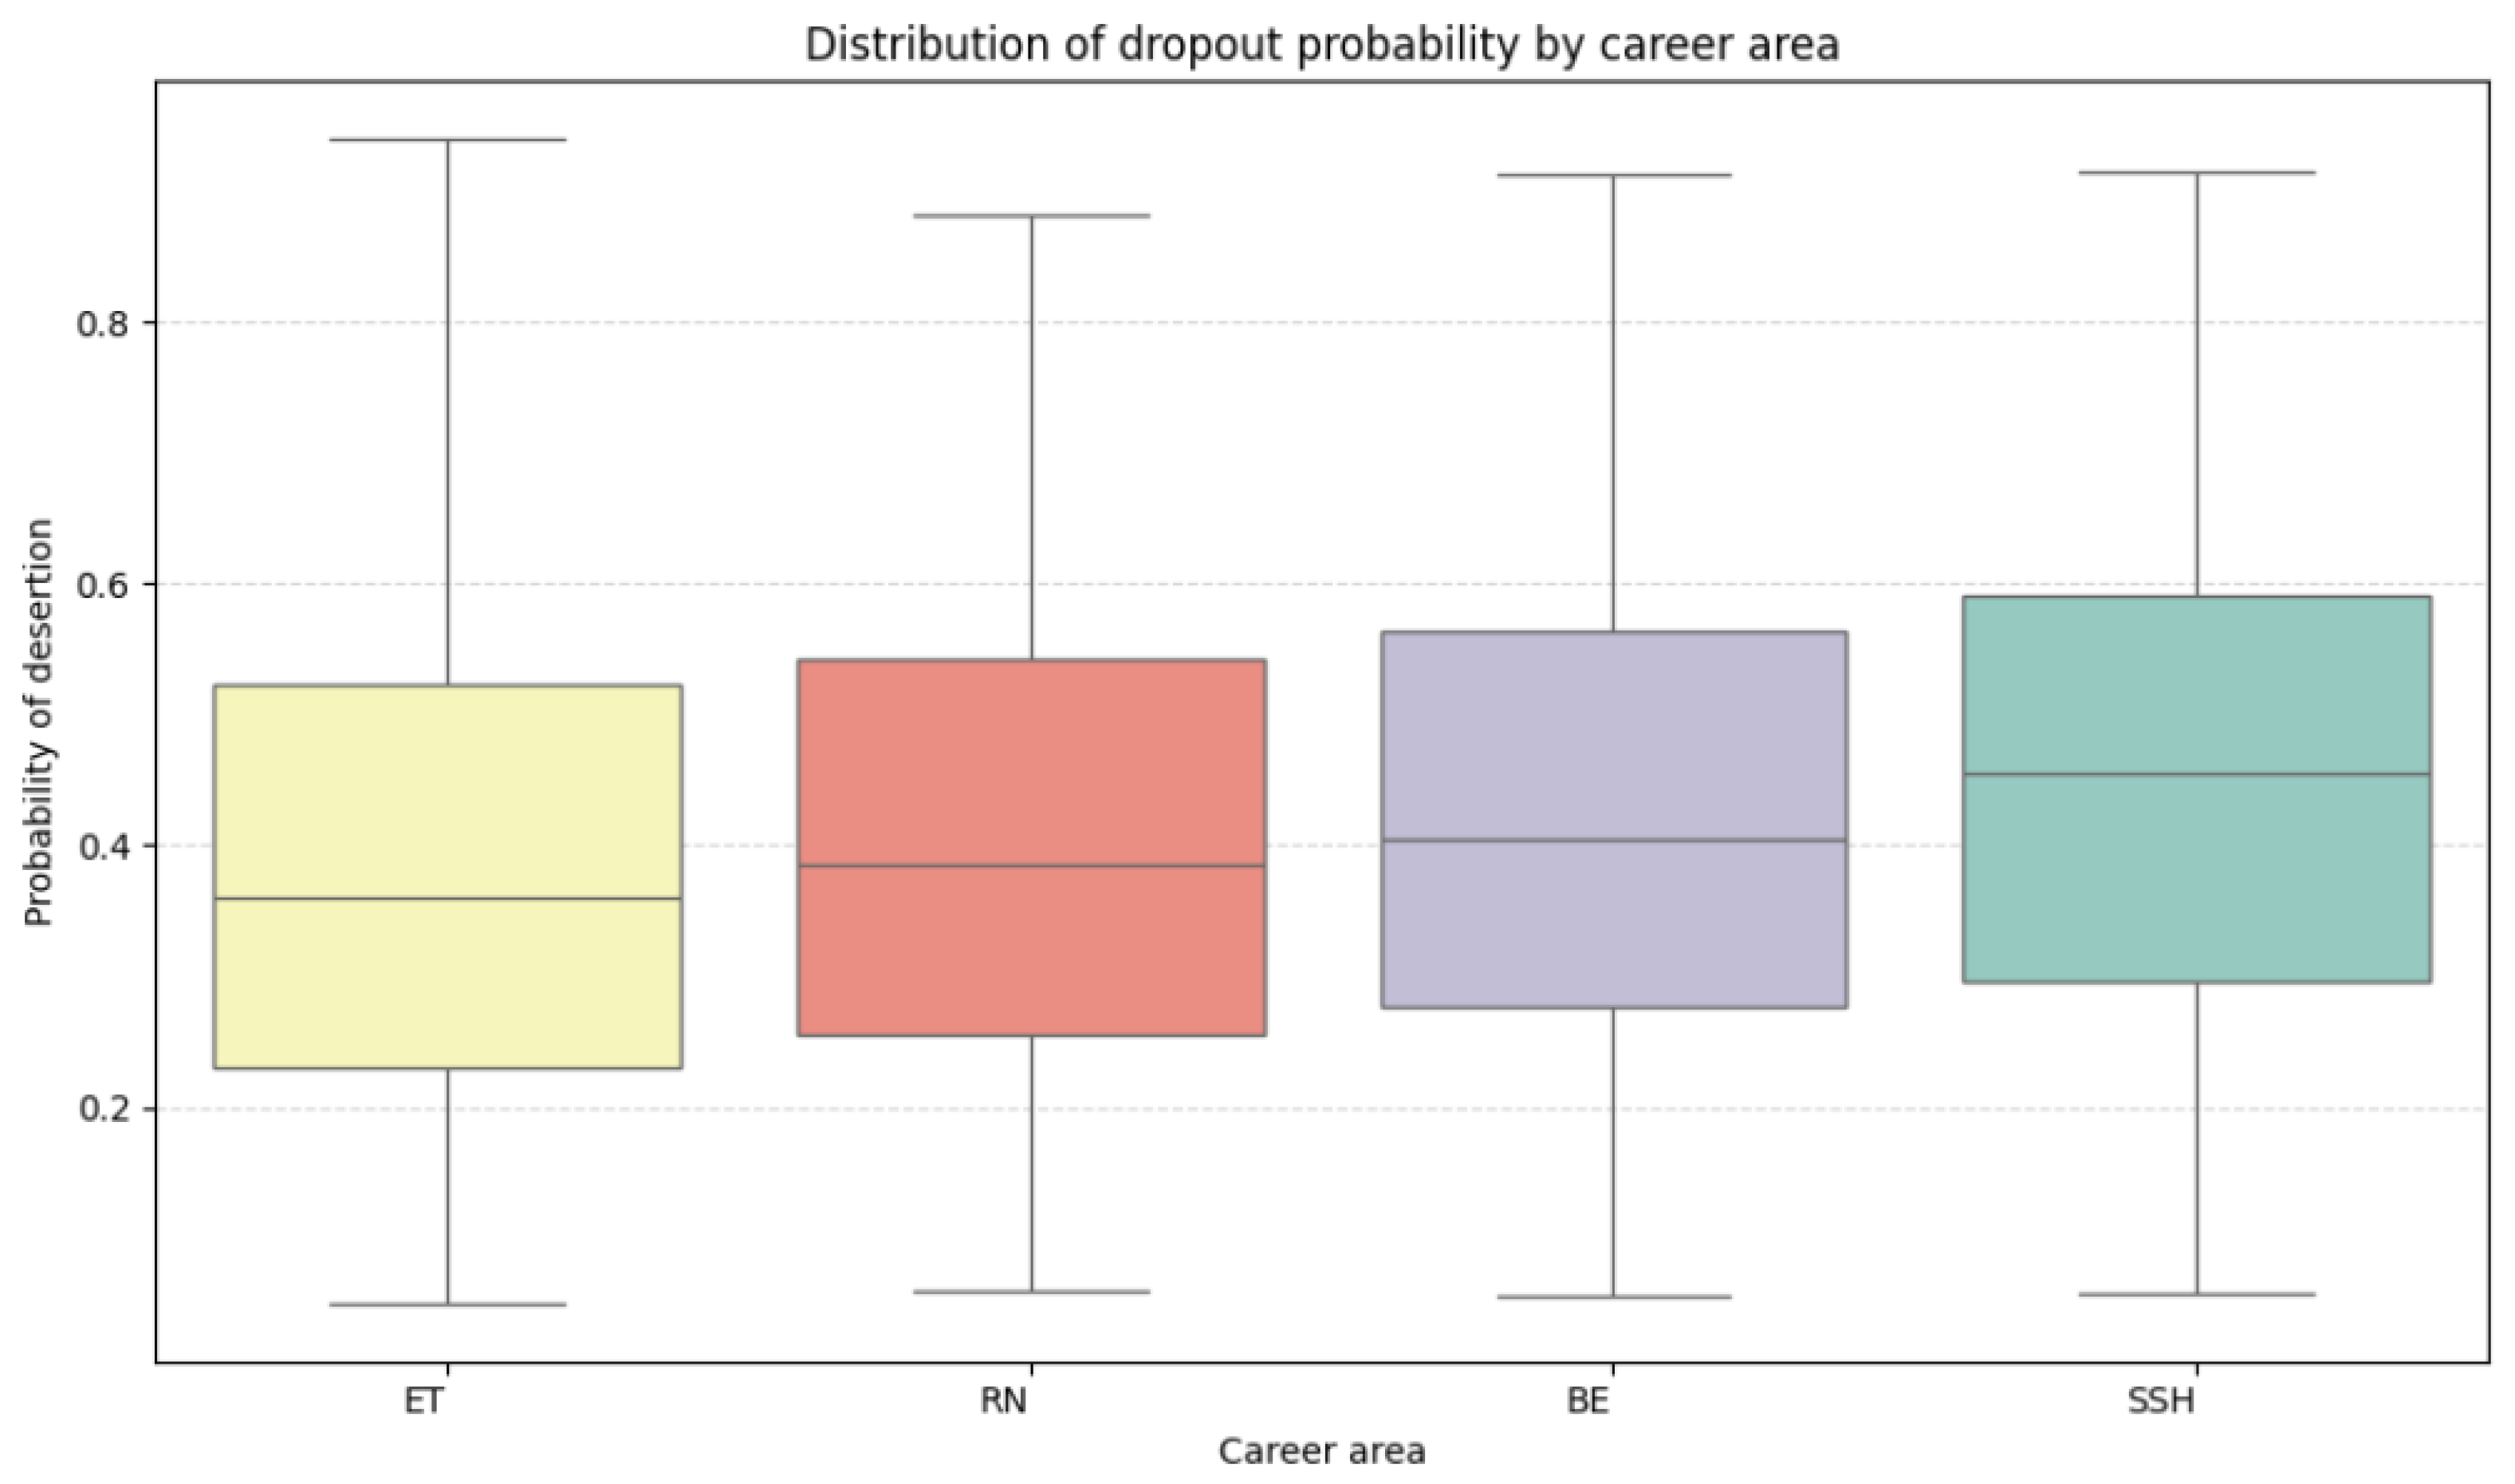
To support strategic analysis, programs were grouped into four academic clusters: Engineering and Technology (ET), Natural Resources (NR), Business and Economics (BE), and Social Sciences and Humanities (SSH).
As shown in Figure 8, the BE and SSH areas exhibited the highest concentration of risk, with medians exceeding 0.4. Meanwhile, ET and NR exhibited lower median risks, accompanied by high internal variability. These insights can guide actions at the division or department level.
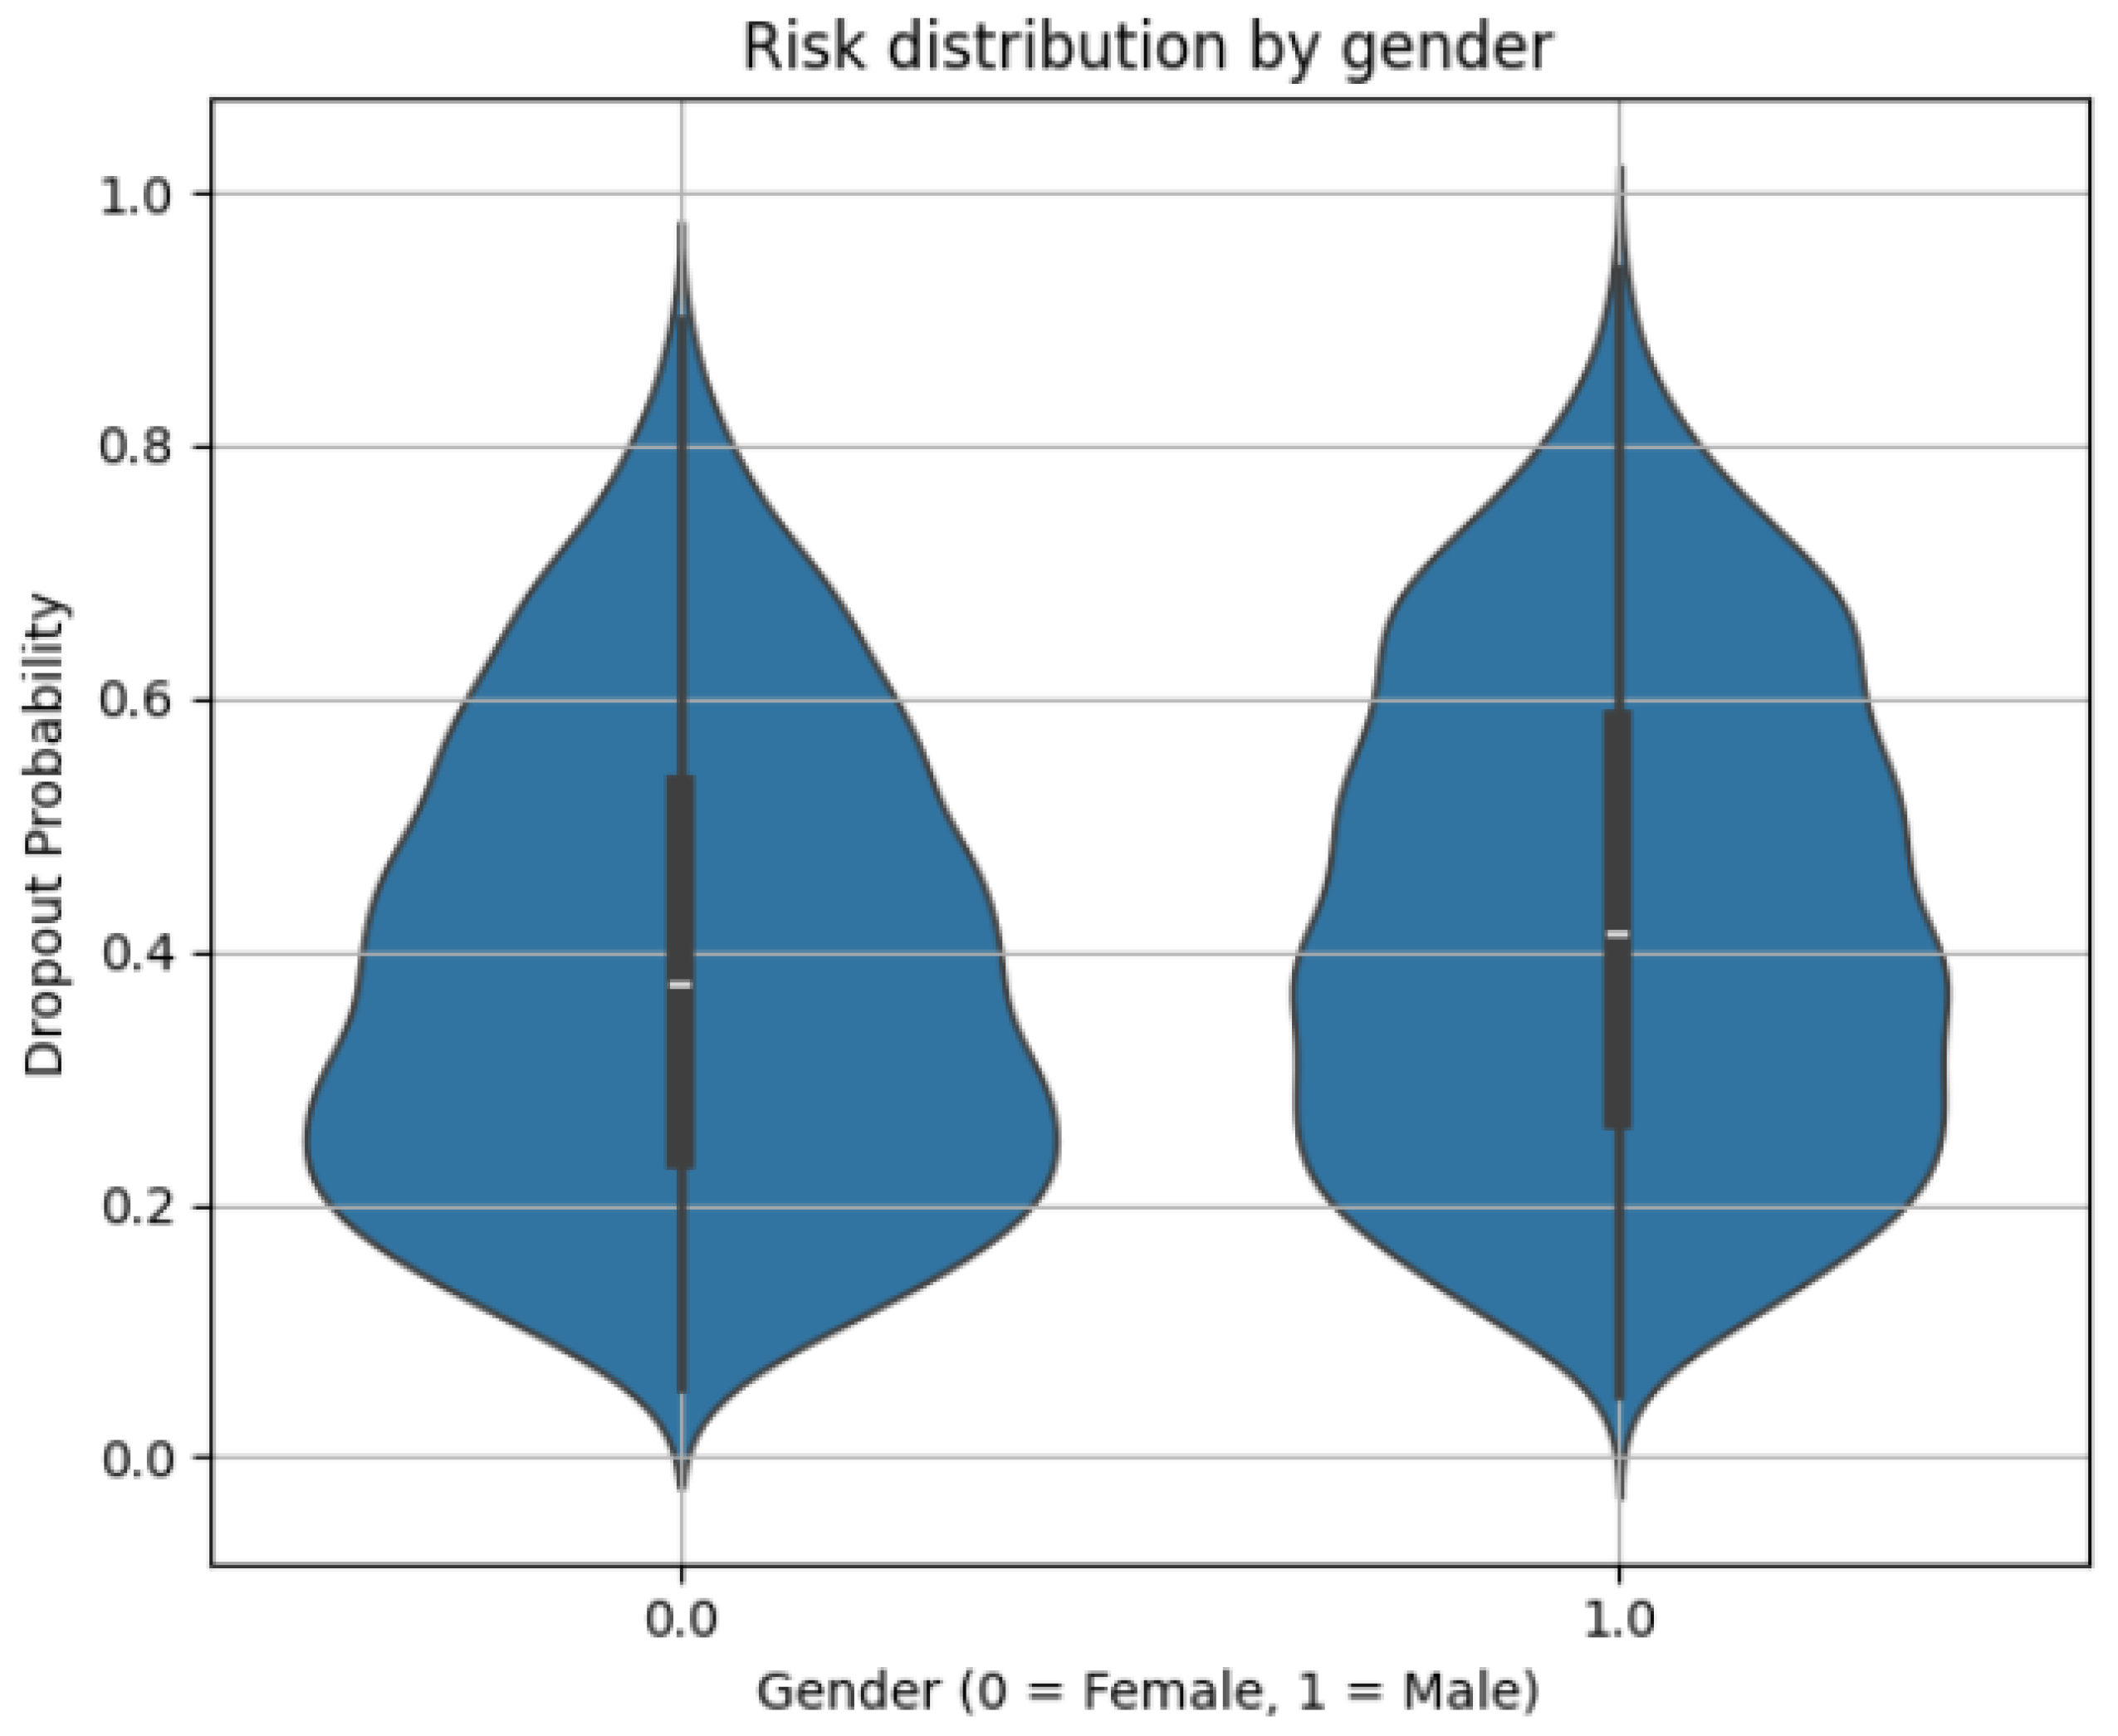
In terms of gender (see Figure 9), no structural differences were observed between male and female students; however, males displayed a slightly higher concentration at the upper end of the risk spectrum.
At the individual level, the model identified high-risk students from the outset. Table 4 presents the top 20 students with the highest predicted risk, along with key variables that can inform decisions regarding tutoring, scholarship assignment, or retention initiatives.
Many of these cases combined above-average age with interrupted trajectories—such as zero completed courses or no recent enrollment—and were often associated with structurally high-risk programs. This result makes them strong candidates for early outreach and follow-up.
In the end, the results provide a clear path for the model’s institutional application in addition to validating its predictive ability. Currently, efforts are underway to integrate this tool into the university’s Student Trajectory System (SITE), which is accessible to academic program coordinators. The goal is to provide real-time risk visibility at the start of each semester, enabling more informed decisions regarding tutoring, financial aid, and personalized support.
Although the model may yield some false positives, it is considered more effective and ethically sound to offer support to students who may not need it, as long as that group includes vulnerable individuals, rather than maintaining generalized strategies that overlook at-risk cases. This shift from uniform, reactive approaches to data-driven, proactive, and equity-focused interventions represents a significant advancement in institutional practice.

4.4. Risk Dimension Analysis

To better understand the underlying factors contributing to dropout risk, the predictor variables were grouped into eight theoretical dimensions: Academic Trajectory, Economic Conditions, Academic–Work Balance, Family Support, Free Time and Recreation, Geographic Access, Institutional Integration, and Personal Well-being. This framework goes beyond analyzing variables in isolation and instead highlights broader patterns that reflect students’ life conditions, their integration into university life, and the institutional context they navigate.
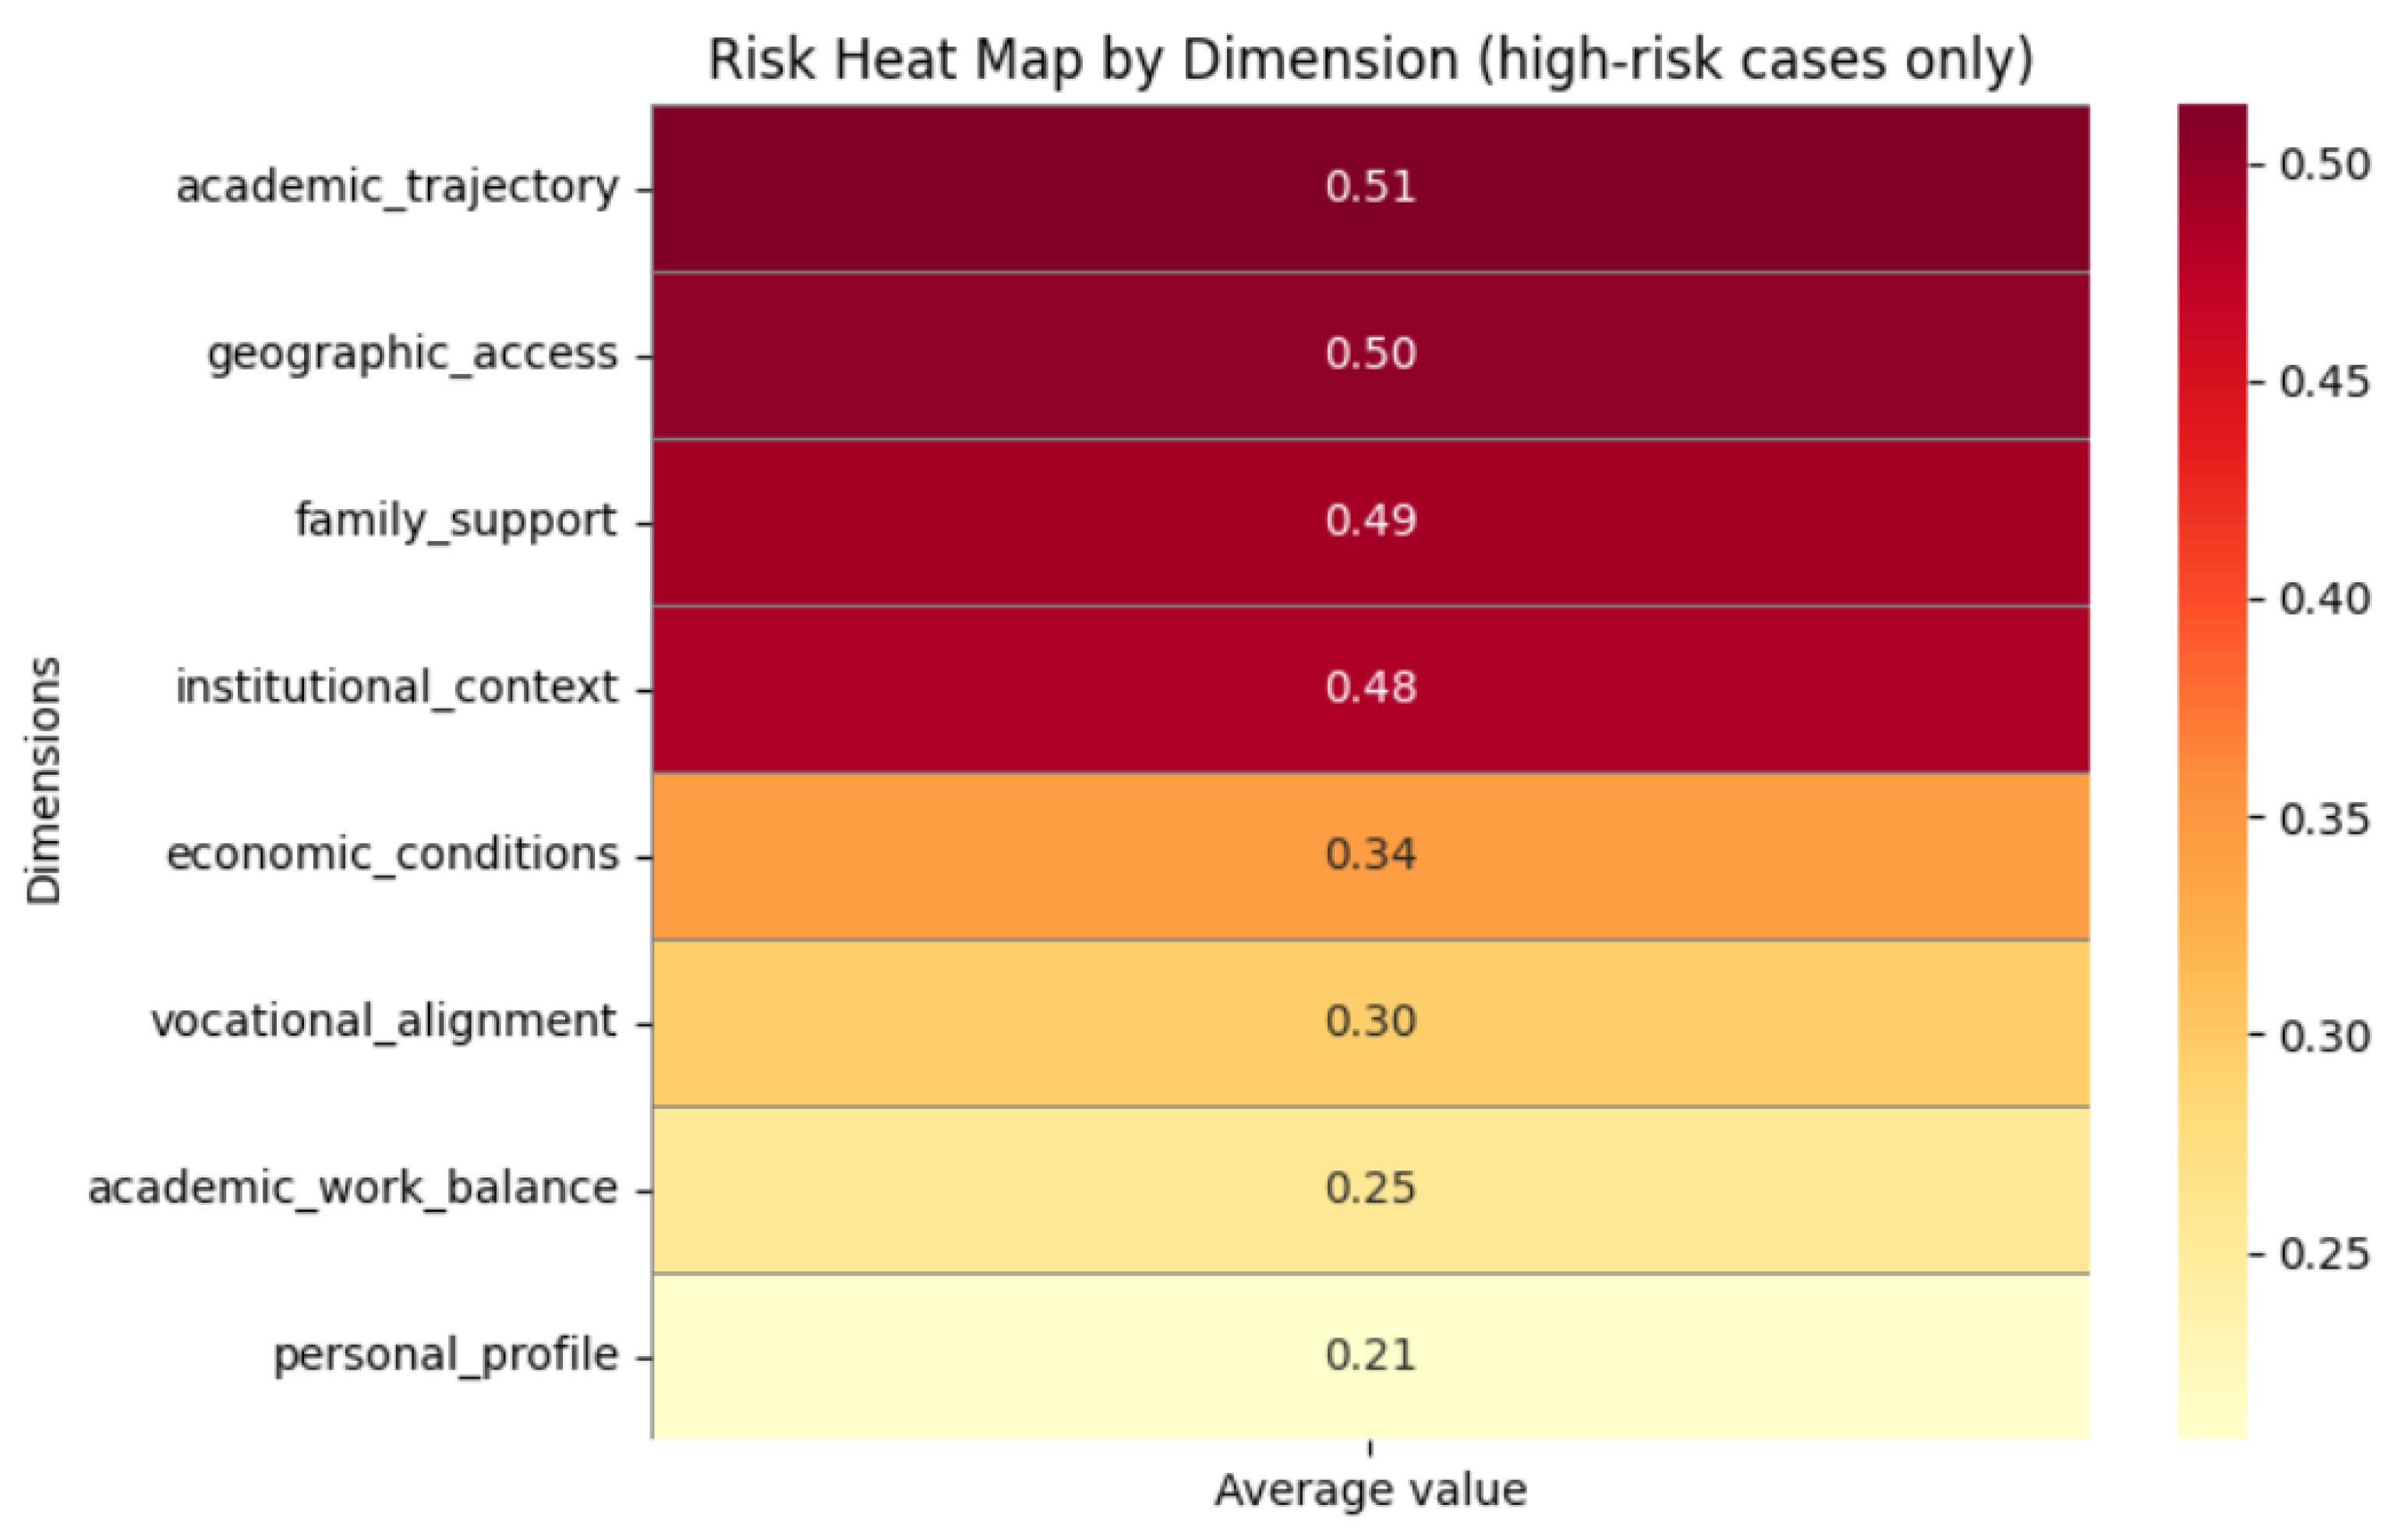
Figure 10 presents a heatmap illustrating the average value for each theoretical dimension among students classified as high-risk for dropout. The dimension with the highest average score among high-risk students was Academic Trajectory (0.51), followed by Geographic Access (0.50), Family Support (0.49), and Institutional Context (0.48). Mid-level scores were observed for Economic Conditions (0.34) and Vocational Alignment (0.30), while the lowest-scoring dimensions were Academic–Work Balance (0.25) and Personal Profile (0.21).
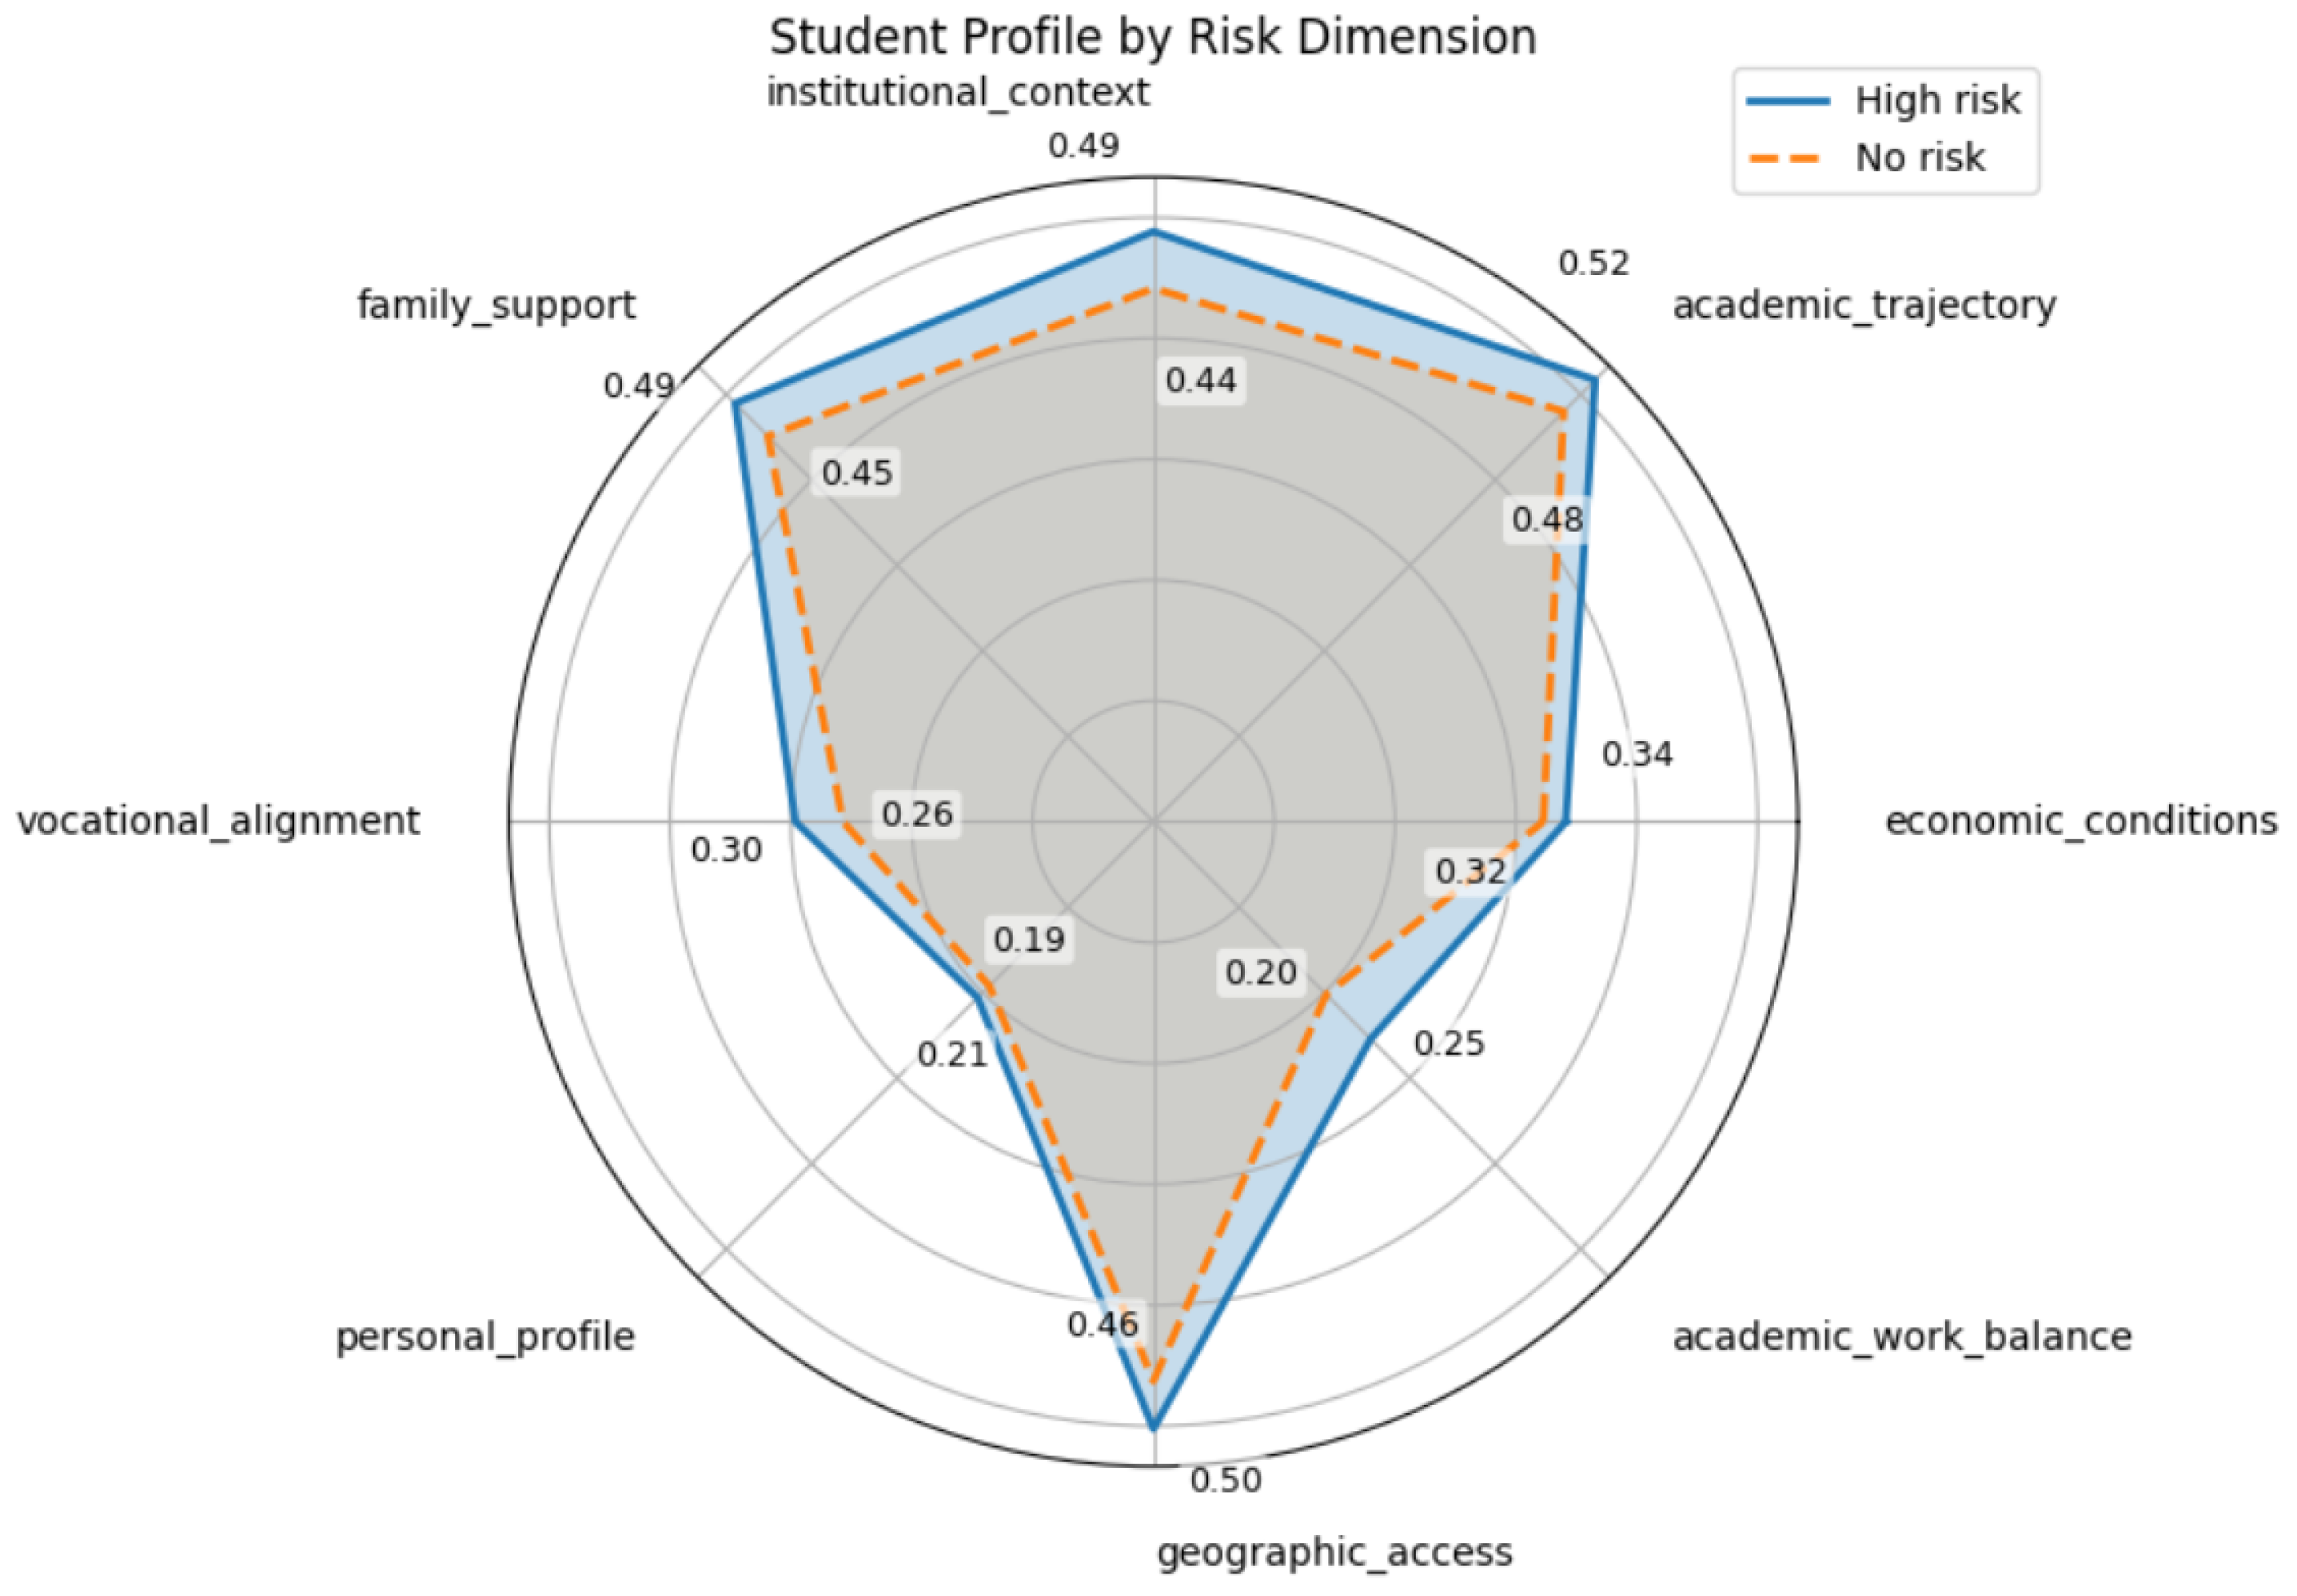
To explore this further, average dimension scores were compared between students classified as high- and low-risk, as shown in Figure 11 using a radar plot. This visualization facilitates the interpretation of the overall profiles of both groups.
The most pronounced differences were observed in Family Support (0.49 vs. 0.43), Institutional Context (0.48 vs. 0.43), and Academic Trajectory (0.47 vs. 0.41). Moderate differences were also present in Vocational Alignment (0.30 vs. 0.26) and Economic Conditions (0.34 vs. 0.31). Interestingly, Geographic Access remained high in both groups (0.50 vs. 0.47). In contrast, Personal Profile (0.21 vs. 0.19) and Academic–Work Balance (0.25 vs. 0.23) showed the least variation between groups.
These findings reinforce the notion that student dropout is a multifaceted and systemic issue, necessitating interventions that are responsive to the diverse dimensions of student experience. Addressing this challenge effectively requires institutional strategies that extend beyond academics to encompass emotional, social, environmental, and logistical support, particularly from the earliest stages of the student journey.

5. Discussion

5.1. Interpretation of Findings

This research provides meaningful evidence to advance the understanding and management of university dropout through a predictive and preventive lens. The model developed demonstrates that it is possible to identify, with reasonable accuracy, students who are more likely to drop out, using only the information available at the time of enrollment. This predictive capacity opens a concrete window for early intervention, representing a significant shift from traditional reactive strategies.
The findings provide theoretical support for Tinto’s integration model [26,27,28,29], which posits that dropout is not an abrupt event but rather the result of a gradual process of social and academic disengagement that begins early in college life. The relevance of variables such as high school GPA, age, family responsibilities, and work schedules suggests that many students face barriers even before they formally begin their academic journey.
The results also support the framework proposed by [30], highlighting how external, non-institutional factors, such as the need to work, transportation issues, or financial constraints, significantly contribute to student dropout. This point is particularly significant in circumstances like the one studied, where many students balance employment and education, facing structural barriers that hinder their full integration into campus life.
Critically speaking, the results support Bourdieu’s theory [31], which posits that the educational system often perpetuates preexisting social injustices. The fact that perceived economic hardship, housing conditions, and parental education level emerge as some of the most significant predictors is consistent with the findings of Elder [34], who highlights the significance of socioeconomic background in institutions serving historically marginalized populations.
Methodologically, the results are consistent with previous studies that used machine learning to predict dropouts from the outset. For instance, ref. [33] demonstrated that it is possible to achieve high predictive accuracy (up to 86.4%) using only data collected during admissions. These findings align with those presented in this study. Similarly, ref. [10] evaluated XGBoost in a Mexican university context and reported comparable performance metrics, although without the post-training threshold calibration applied in this study.
Other authors, such as [37], emphasized the importance of including perceptual variables, including a sense of belonging, perceived readiness, and future goals, in early warning models. The model created here also includes these elements, which strengthen its conceptual validity beyond just how well it works statistically.
This research also contributes to the growing body of literature on early-stage dropout prediction by demonstrating that acceptable predictive performance can be achieved using only pre-enrollment data. Although numerous models in the literature report higher metrics with post-enrollment academic data [7,10,11,12,13,14,15,16,17,21,22,24,25,38], the present model achieves comparable recall without relying on course grades or attendance records. This positions it as a viable early-warning alternative in institutional contexts where academic performance data are not yet available at the time of intervention. Moreover, its practical calibration and integration into an institutional decision-making platform strengthen its applicability in real-world educational settings.
The findings are further aligned with international trends. Studies [18,19,20,23] have shown that probabilistic models and early warning systems are most effective when trained on data collected at the beginning of students’ academic paths and when integrated into institutional platforms. This study followed this logic by embedding the model into the university’s Student Trajectory Information System (SITE) and offering clear guidelines for its proactive use.
This tool is not intended to replace professional judgment; instead, it aims to enhance it by utilizing data-driven evidence. As discussed earlier, false positives do not render it less valuable. Helping students who do not need it is a small price compared to the risk of missing those who do.
In addition to proving its technical validity, this study provides institutions with practical tools to change their intervention methods. Instead of applying broad, reactive solutions, such as generalized tutoring or acting only after academic failure, a more targeted and anticipatory approach is enabled, where resources are allocated based on real risk and need.
In short, this study not only confirms the findings of other studies but also advances the development of early warning systems that prioritize fairness, context, and swift action by institutions. It also adds to the global conversation on educational data mining by offering a validated, real-world application in a Latin American context characterized by structural inequality and budget constraints. The CRISP-DM framework adopted allows for adaptation to other institutions with similar characteristics, if ethical usage and regular model updates are ensured.

5.2. Research Limitations

It is essential to acknowledge several limitations associated with the chosen methodology, despite this research’s encouraging results and potential institutional applications.
First, although the predictive model was first developed using historical data from a single public university in Mexico, it is based on a diagnostic survey instrument specifically designed, validated, and systematically administered since 2014. This deep institutional integration enhances the model’s validity and practical utility within its original context. However, it also limits its immediate generalizability to other institutions, particularly those that do not collect comparable data at the time of enrollment. The methodological framework can be applied again; however, using the model in a different context would require careful adaptation and local validation, as demonstrated in earlier studies [11,36,37,38,39].
External validation represents an important next step but also a significant logistical challenge. External use of the concept would necessitate other institutions to implement a similar survey procedure and guarantee continuous data collection across time, which is seldom achieved in the near term. As a result, this research can be viewed as a crucial first step toward proving the viability and usefulness of early-stage dropout prediction using just pre-enrollment data. Subsequent investigations need to concentrate on modifying the modeling framework for novel institutional settings and investigating cooperative endeavors for cross-institutional verification.
Second, many of the predictor variables were collected through a self-administered diagnostic survey at the time of enrollment. While this approach enables the collection of valuable perceptions and personal conditions, it also introduces potential biases related to self-reporting or social desirability, limitations that were documented in earlier research [36].
A sensitivity analysis was conducted to assess the potential impact of noise on self-reported variables. Separate mild random perturbations were applied to each variable and the performance drops that resulted were measured. Each variable’s average AUC and F1-score dropped by just 0.002 and 0.0006, respectively, suggesting that the model is typically resistant to minor input data distortions. The F1-score decreased by 0.001 and the total AUC decreased by 0.002 when noise was applied to all variables at once. However, a few factors were linked to somewhat greater performance losses, including gender, financial independence, and tuition cost. These results imply that raising the caliber of those variables may increase the dependability of the model. To reduce the possibility of bias in self-reported data, future studies should investigate cross-validation techniques or the incorporation of other data sources. Appendix B provides a detailed analysis of the findings.
Third, the model is only helpful if the diagnostic tool is used consistently and systematically in each academic cycle. Studies like [11,37,38,39] have shown that even highly accurate models can cease to function effectively if data flows are not kept up to date or data collection systems are inconsistent over time.
Another critical consideration is the need for regular model updates. As social, economic, and educational conditions evolve, so too may the patterns and drivers of student dropout. A model that is effective today could lose predictive power if it is not periodically recalibrated using fresh data.
Although class imbalance was addressed through resampling techniques, given that dropouts represent a minority of cases, there is always the risk that specific student profiles could be over- or underrepresented in the final predictions. In this study, dropout was measured as a binary outcome—whether or not a student remained enrolled after the first year—which simplifies a complex phenomenon and may overlook more nuanced patterns of disengagement or delayed departure. As highlighted by [11], preprocessing decisions can significantly influence model performance and fairness.
Finally, although a variable importance analysis was conducted, it is essential to acknowledge that models like XGBoost, although powerful, often do not yield intuitively interpretable results for non-technical audiences. According to earlier research [11], this lack of transparency may make it more difficult for institutional decision-makers to adopt the model as they may be concerned about establishing trust, enhancing domain knowledge, and ensuring that predictive outputs are used responsibly.

5.3. Practical Implications and Future Research

Despite the limitations discussed, this research opens meaningful avenues for improving decision-making in higher education. By integrating the model into student management systems, such as the university’s Student Trajectory System (SITE), program coordinators can proactively identify at-risk students from the very beginning of the semester and tailor tutoring, scholarship allocation, academic support, or follow-up interventions more effectively.
These results are consistent with earlier studies [2,11,35,37,38,39,40], which emphasize that student retention should be tailored to each student’s unique circumstances and traits rather than depending on general strategies. These studies consistently demonstrate that the most predictive models begin with academic, sociodemographic, and perceptual data [37].
The present research also reinforces the idea that predictive models are not intended to replace human judgment but rather to enhance it, especially in settings where institutional resources are limited. The model remains a valuable tool, even when it yields false positives, as it enables prompt outreach to those who are most likely to need it, with minimal risk of support also reaching those who may not ultimately require it. As noted in prior studies [11,35], offering preventive support to a broader group, even if it includes some false alarms, is preferable to relying on generalized strategies that often fail to catch critical cases in time.
Although the predictive performance of the model (AUC = 0.68, F1 = 0.69) may appear modest compared to models using post-enrollment academic variables [41], it is consistent with the performance reported in the recent literature for early-stage models. Studies relying solely on admission data, such as those by [18,19,20], achieved AUC values from 0.56 to 0.84 and F1-scores between 0.58 and 0.86, depending on the model and variable set. These findings support the notion that early prediction is feasible and can reach acceptable levels of accuracy, particularly when models are carefully calibrated and embedded in institutional decision systems. In this context, the F1-score achieved by the XGBoost model presented in this research, combined with high recall (0.88) and early applicability, makes it a valuable asset for timely intervention, even in the absence of academic performance data.
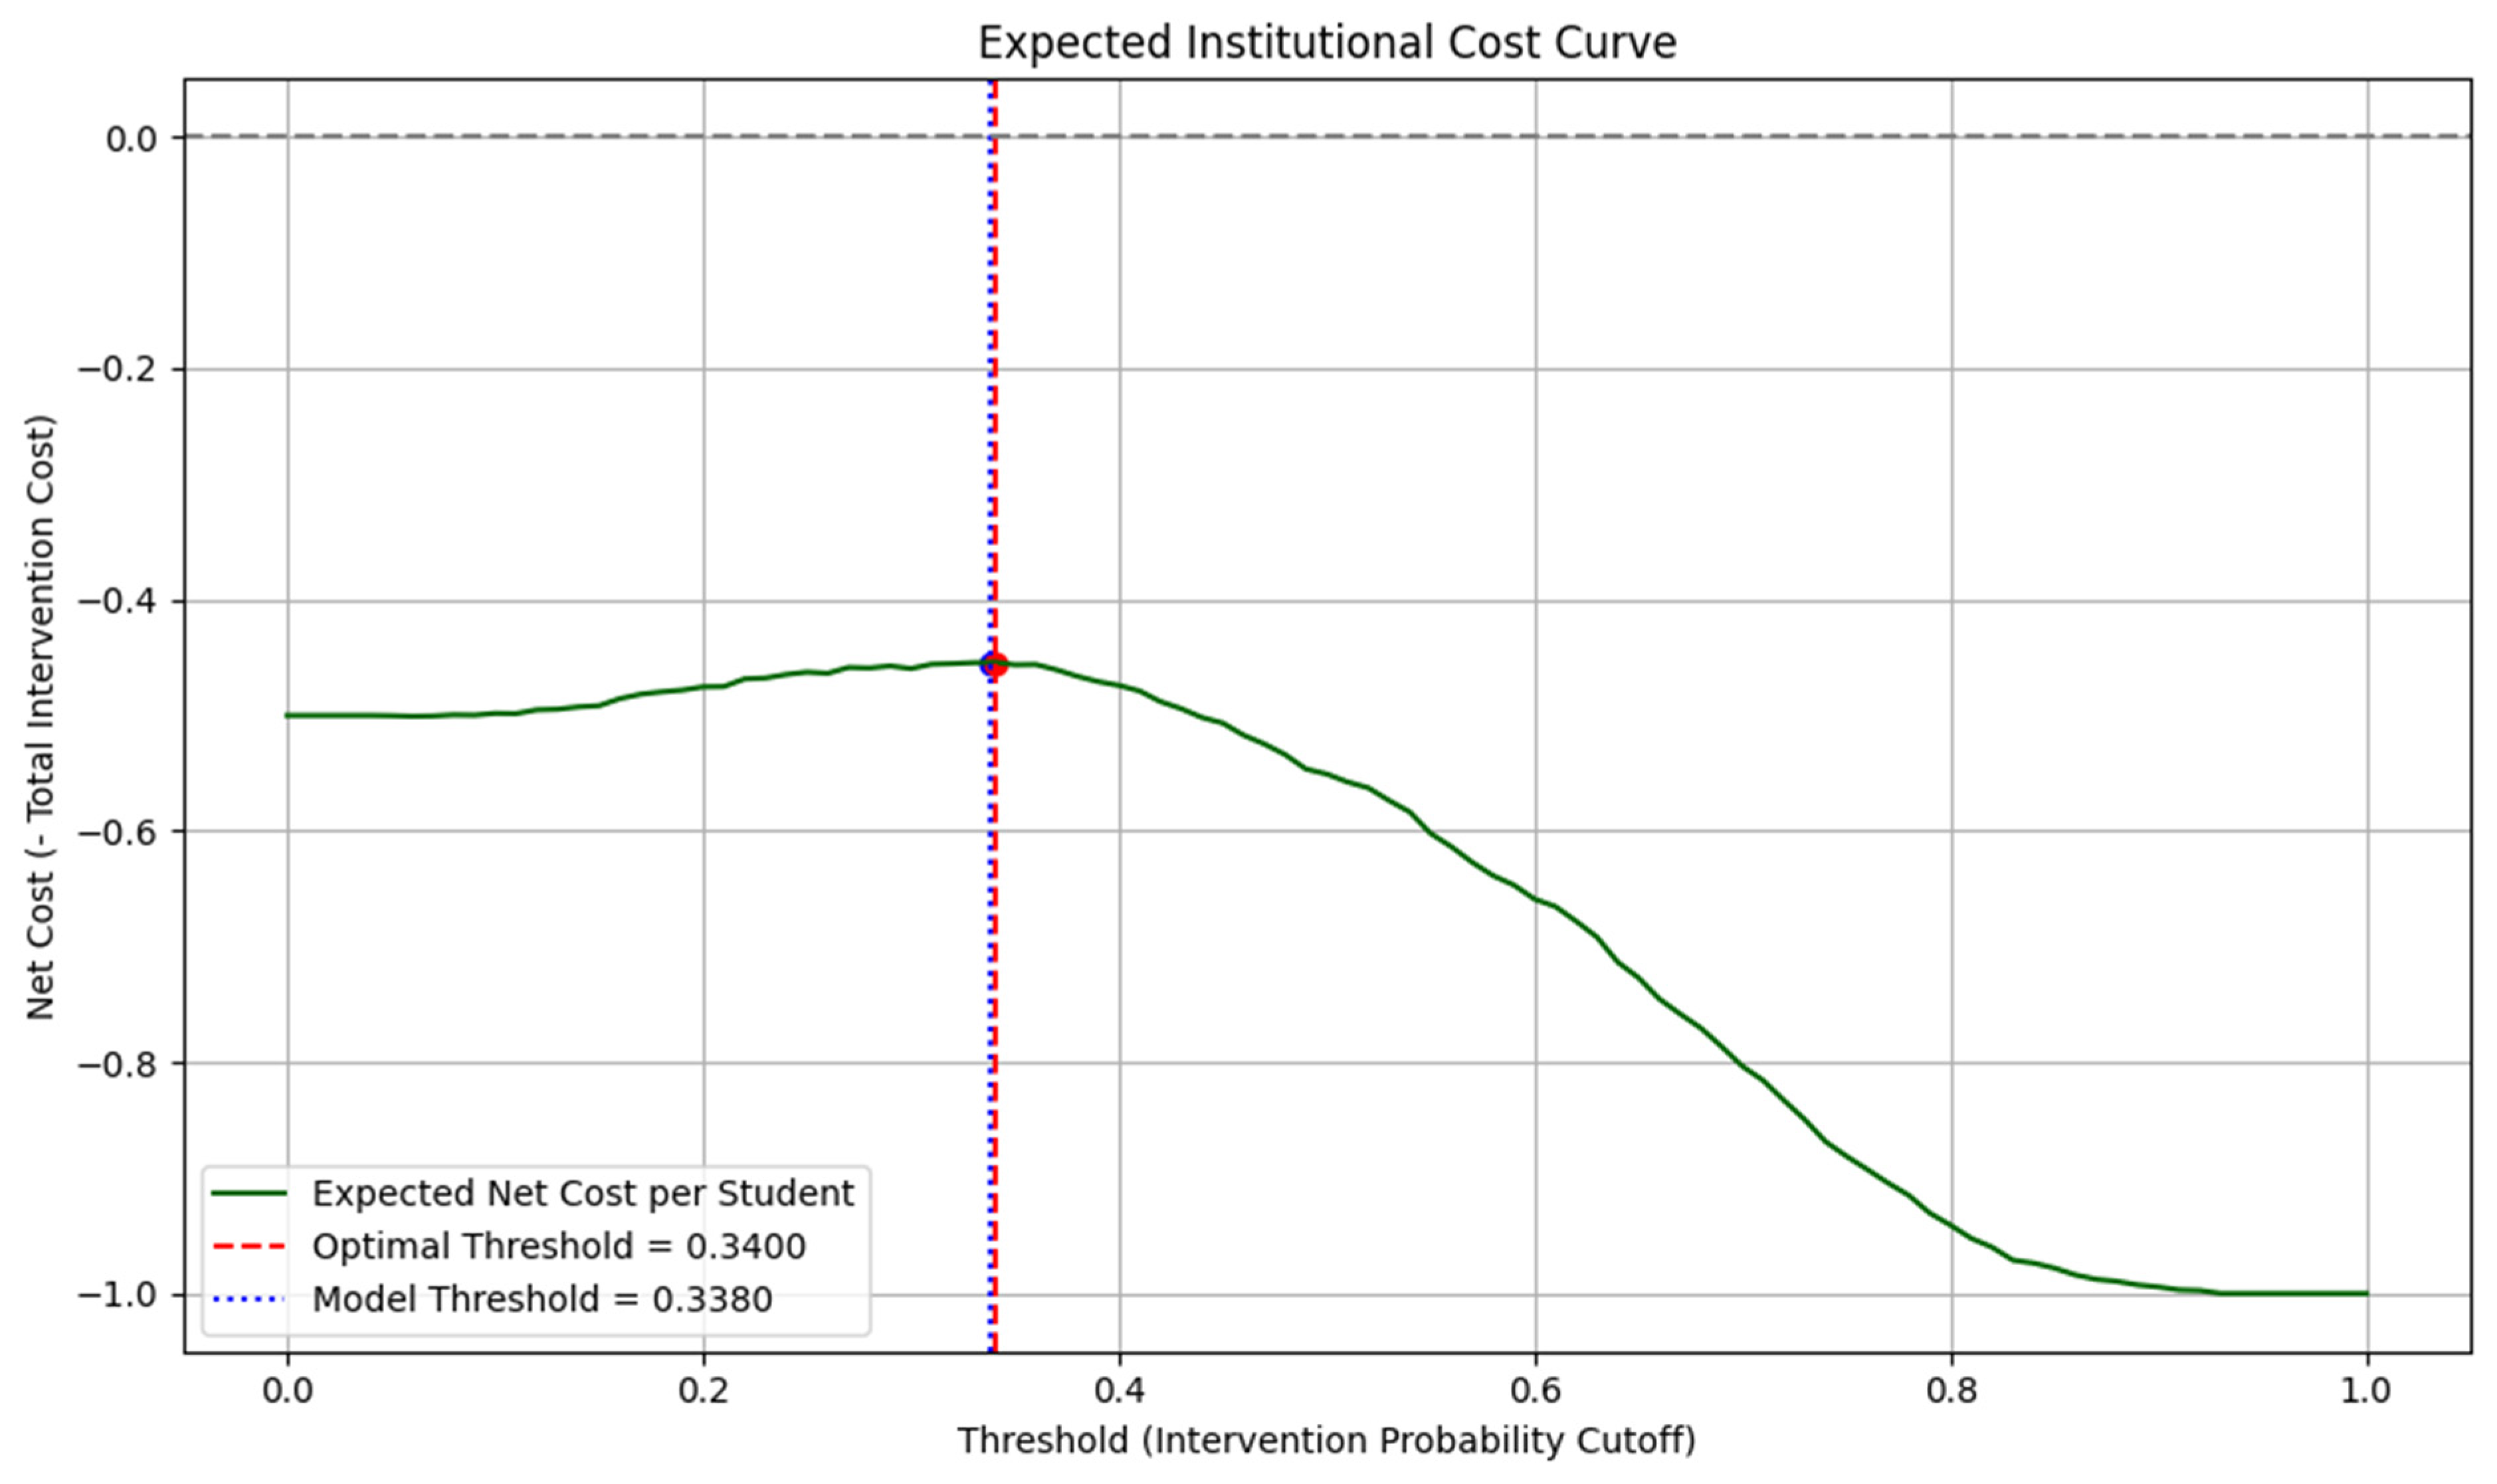
To complement traditional threshold calibration based on the F1-score, a decision curve analysis was conducted to explore more pragmatic cutoff points for institutional decision-making. This analysis, which also addresses concerns about the recall–precision trade-off, modeled the net institutional cost associated with false positives and false negatives, assuming that failing to support an at-risk student (false negative) is twice as costly as unnecessarily intervening with a student who would have persisted (false positive). As seen in Figure 12, the initial F1-optimized threshold of 0.3380 was almost reached by the optimal threshold under this cost structure, which was around 0.34. This outcome demonstrates that even small changes to the threshold may strike a compromise between intervention cost effectiveness and predictive performance, supporting the model’s initial calibration’s practical validity. The analysis also highlights how institutional priorities and resource constraints can be formally incorporated into threshold selection.
On the other hand, this research also uncovered significant disparities in anticipated dropout risk among academic programs. There may be several reasons for these disparities, such as the amount of schoolwork, how well the program aligns with the student’s career goals, or the specific groups of students that various programs are designed for. For example, newer programs that have not yet graduated a cohort (e.g., Architecture or Strategic Management) may be attracting students with less consolidated expectations or profiles, which could result in greater uncertainty and early dropout [4,42].
Moreover, programs that are more technical or professional, like Engineering in Software, may attract students who are more focused on their careers, better prepared for school, or have more stable job market expectations. All of these factors might lead to lower dropout rates [43,44].
Additionally, contextual or structural factors may influence these patterns. Some programs, such as Early Childhood Education and Nursing, may attract students with additional family responsibilities, gender-specific vulnerabilities, or economic limitations, all of which were found to correlate with higher risk in the overall model. This pattern may reflect broader socioeconomic or cultural dynamics, particularly in feminized professions, where students often juggle academic demands with caregiving roles or financial hardship [45,46].
Taken together, these results support the idea that early risk is not evenly distributed across the institution and that program-level characteristics may interact significantly with student-level factors. This idea suggests a valuable direction for future research: exploring the mechanisms that explain why some programs consistently present higher predicted risks, possibly through mixed-methods or qualitative follow-up studies.
Furthermore, the data support the adoption of program-specific early intervention techniques. Academic units should establish retention strategies tailored to their students’ specific risk profiles and patterns, rather than applying the same standards uniformly.
Looking forward, one promising line of research involves expanding the model by incorporating longitudinal variables, such as first-semester academic performance. A more nuanced understanding of how risk evolves over time would be made possible, in addition to enhancing the model’s predictive power, a tactic that has already been suggested in several studies [10,37,40].
Additionally, qualitative research on high-risk subgroups may provide further insight into the subjective and cost factors influencing students’ withdrawal decisions. According to Ranasinghe et al. [5], incorporating mixed methods could improve the design of focused interventions as well as the explanatory framework.
Moreover, although this research focused on structured tabular data using ensemble tree-based models, future work may explore additional algorithms, such as multilayer perceptrons (MLPs) or stacked ensemble methods. These techniques may allow for the development of more expressive models, particularly if new types of data, such as longitudinal academic performance, or greater institutional capacity for implementation and model maintenance become available.
Ultimately, it is essential to establish explicit ethical guidelines for the institutional application of predictive models. Issues such as student privacy, algorithmic transparency, informed consent, and the respectful use of predictive outputs must remain central to any technological implementation that aims to be fair, practical, and sustainable [2,11,35].

5.4. Ethical Considerations

Although this research relied exclusively on non-sensitive pre-enrollment data and did not involve any experimental intervention, predictive labeling of students as at risk entails important ethical implications that must not be overlooked. Inadvertently stigmatizing a student, biasing institutional treatment, or triggering poorly targeted interventions that can cause more damage than benefit are all consequences of labeling a student as fragile.
First, a major worry is algorithmic bias. Models may consistently misclassify some groups, such as students from underrepresented backgrounds, even when they do well overall. Future implementations should address this by including bias audits, such as breaking out false positives and false negatives by gender, socioeconomic position, or race, in order to identify and address unfair prediction tendencies.
Second, transparency and interpretability are essential for trust and accountability. Techniques like SHAP values or feature significance visualizations can assist in identifying important predictors, even when ensemble tree-based models like XGBoost are not entirely explicable. In order for advisers and decision-makers to comprehend not just the forecasts but also the reasoning behind them, these technologies must be integrated into institutional dashboards.
Third, the autonomy and consent of students must be honored. Students should be made aware of how their data is being utilized, and any institutional implementation of early-warning systems should have a straightforward opt-out procedure. Prioritizing consent at the time of data collection is important, especially if predictions will be used to initiate focused follow-up.
Fourth, a human-in-the-loop model should guide intervention protocols. Rather than acting automatically on model outputs, institutions should establish a governance board composed of academic, ethical, and student affairs representatives who oversee the responsible use of predictions. This board should make decisions on policy changes or model upgrades, assess unforeseen consequences, and routinely assess system performance.
To put it briefly, ethical protections are an essential part of the proper application of predictive analytics in education, not an afterthought. As this approach matures, a continuous dialogue between data science and student-centered values is essential to ensure that prediction leads to inclusion, not exclusion.

6. Conclusions

Beyond its technical performance, this study highlights the importance of predictive systems that align with institutional values of equity and inclusion. The use of interpretable variables and intuitive visualizations facilitates collaboration with academic staff and supports more informed decision-making in tutoring, financial aid, and student support services.
Future directions include the incorporation of real-time behavioral data, longitudinal tracking of student outcomes, and adaptation of the model to other institutional contexts. Across every stage of this work, ethical care remains essential. From how data is handled to how predictions are utilized, the goal remains the same: to ensure that these tools empower students, not label or limit them. Responsible use of predictive systems means asking not just what we can predict but how we can do so with fairness, transparency, and deep respect for each student’s story.
To support implementation, a set of practical recommendations is outlined below (Table 5). These are intended to help institutions not only adopt the model technically but also embed it meaningfully into academic and support workflows.
Ultimately, this research demonstrates that institutions do not have to rely solely on instinct or wait until it is too late. With the proper use of data, it is possible to transition from good intentions to focused, timely action, identifying risks early, reaching out with purpose, and fostering an academic culture where care, inclusion, and opportunity are intertwined.

Author Contributions

Conceptualization, B.C.-M. and A.A.-G.; methodology, B.C.-M., A.A.-G. and N.J.R.-V.; software, B.C.-M.; validation, B.C.-M., A.A.-G., N.J.R.-V. and M.d.P.L.-D.; formal analysis, B.C.-M. and N.J.R.-V.; investigation, B.C.-M. and A.A.-G.; resources, N.J.R.-V.; data curation, B.C.-M.; writing—original draft preparation, B.C.-M.; writing—review and editing, B.C.-M., A.A.-G. and M.d.P.L.-D.; visualization, B.C.-M.; supervision, M.d.P.L.-D.; project administration, B.C.-M. and A.A.-G.; funding acquisition, N.J.R.-V. All authors have read and agreed to the published version of the manuscript.

Funding

This research was funded by Instituto Tecnológico de Sonora (ITSON). The APC was funded by Instituto Tecnológico de Sonora: PROFAPI IND-42.

Institutional Review Board Statement

Ethical review and approval were waived for this study due to the use of anonymized administrative data and the absence of any human intervention or sensitive data collection.

Informed Consent Statement

Not applicable.

Data Availability Statement

The source code and machine learning pipelines used in this study are publicly available at https://github.com/bcarballom/student-dropout-prediction (accessed on 18 August 2025). Due to privacy restrictions, the student dataset used for model training and validation cannot be shared.

Acknowledgments

The authors thank the Office of Institutional Planning for providing access to anonymized data and for the technical support they received throughout the project.

Conflicts of Interest

The authors declare no conflicts of interest.

Abbreviations

The following abbreviations are used in this manuscript:
ARQBachelor’s in Architecture
IBBiotechnology Engineering
IBSBiosystems Engineering
ICCivil Engineering
ICAEnvironmental Science Engineering
IELMEElectrical and Electronics Engineering
IEMElectromechanical Engineering
IEMElectronics Engineering
IISIndustrial and Systems Engineering
ILLogistics Engineering
IMANManufacturing Engineering
IQChemical Engineering
ISWSoftware Engineering
LABachelor’s in Business Administration
LAESBachelor’s in Strategic Management
LAETBachelor’s in Tourism Business Administration
LCEBachelor’s in Educational Sciences
LCEFBachelor’s in Exercise and Physical Sciences
LCPBachelor’s in Public Accounting
LDCFDBachelor’s in Physical Activity and Sport Management
LDERBachelor’s in Law
LDGBachelor’s in Graphic Design
LEAGCBachelor’s in Arts Education and Cultural Management
LEFBachelor’s in Economics and Finance
LEGIBachelor’s in Early Education and Institutional Management
LEIBachelor’s in Early Childhood Education
LEMBachelor’s in Marketing
LENFBachelor’s in Nursing
LG Bachelor’s in Gastronomy
LGDABachelor’s in Arts Management and Development
LPSBachelor’s in Psychology
LTABachelor’s in Food Technology
MVZVeterinary Medicine and Animal Science
PAAIAssociate Degree in Industrial Automation
PADINAssociate Degree in Child Development

Appendix A

Table A1. Construct validity matrix: dimensions and theoretical justifications.
DimensionDescriptionTheoretical FoundationVariables
Economic ConditionsAssesses financial burden, economic independence, and perceived resource sufficiency.Bean & Metzner (external factors), Bourdieu (economic capital), Latin American dropout studies01–12
Academic TrajectoryCaptures prior academic performance, perceived academic limitations, and admission conditions.Tinto (pre-entry attributes), EDM literature on academic history13–19
Academic Experience and Teaching QualityMeasures classroom dynamics, teaching quality, and access to academic support resources.Tinto (academic integration), Kerby (institutional experience)20–26
Institutional Context and PerceptionIncludes prior educational background, modality, and perception of institutional prestige and support.Tinto (institutional fit), Bourdieu (symbolic capital), EDM on student satisfaction27–33
Family Support and Sociocultural CapitalReflects family stability, parental education, involvement, and household environment.Bourdieu (social/cultural capital), Bean & Metzner (external environment)34–41
Vocational Alignment and Decision ClarityCaptures motivations, expectations, and emotional alignment with the chosen career.Kerby (adaptation), Bean & Metzner (goal commitment), Latin American research on vocational fit42–47
Personal Profile and VulnerabilityIncludes health status, personal limitations, habits, age, and gender as potential risk factors.Kerby (adaptive level), equity and risk literature, health and dropout links48–55
Geographic AccessAnalyzes physical barriers to attending university, including transport and distance.Bean & Metzner (environmental variables), access literature56–60
Academic–Work BalanceExamines the student’s work schedules and their alignment with academic responsibilities.Bean & Metzner (working students), research on time conflict and fatigue61–69
Table A2. Description of predictive variables used in the model.
#VariableDescription
1property_type_housingStructural indicator of socioeconomic status (type of housing ownership).
2goods_services_housingAccess to basic services in the household (material infrastructure).
3economic_burdenDirect financial pressure on the student or their family.
4economic_restrictionEconomic difficulties that limit access or persistence.
5tuition_feeSources of tuition funding.
6financial_independenceDegree of personal financial autonomy.
7resources_academic_activitiesAvailability of academic resources at home.
8accessibilityGeneral financial accessibility to the university (transport, services, etc.).
9job_opportunityEmployment expectations as a financial motivator.
10economic_perception_itson_parentsFamily opinion on the institutional financial situation.
11perception_economic_termsPersonal perception of the economic benefits of studying.
12economic constraintSelf-perception of finances as a constraint for studying.
13high-school_averageObjective indicator of prior academic performance.
14academic_progress_performanceHistory of academic lag (failed or delayed subjects).
15habits_study_participationDaily study behaviors and practices.
16techniques_study_organizationPersonal study organization strategies.
17areas_reinforcementSelf-diagnosis of specific academic weaknesses.
18academic_limitationExplicit recognition of academic limitations.
19conditioned_careerAdmission status conditioned by academic risk.
20passive teachingTraditional teaching style centered on the instructor.
21active-critical-learning-practicesAlternative teaching style based on active participation and critical thinking.
22teaching_performancePerceived quality of teaching staff.
23academic_information_receivedClarity and usefulness of academic information provided.
24services_academic_activitiesAccess to and quality of services complementing instruction.
25physical_teaching_resourcesAvailability of physical resources (classrooms, equipment, materials).
26digital_teaching_resourcesAccess to learning technologies and digital resources.
27schooled_institutionPrevious study modality (in-person).
28previous_studies_open-linePrevious study modality (remote/online).
29public_institutionType of prior institution (public).
30private_institutionType of prior institution (private).
31cultural_activitiesParticipation in institutional cultural integration activities.
32prestige_qualityGeneral perception of institutional prestige and quality.
33institutional_recreational_servicesAccess to and use of university recreational services.
34lifestyle_free_timePersonal use of free time and study–recreation balance.
35educational_capital_father_motherParents’ educational level: structural cultural capital.
36housing_companyLiving arrangement (with parents/guardians): indicator of structure and family support.
37academic_parental_involvementParental academic involvement (monitoring, help, supervision).
38educational_parental_assessmentParents’ valuation of education: expectations and educational beliefs.
39civil_family_burdenCivil family burden (marriage, children, direct family responsibilities).
40social_environment_communityPerception of the social environment in the university community: openness and integration.
41influence_outsidersInfluence of external people (friends, acquaintances) on educational decisions.
42vocational_influenceInfluence of genuine vocational motives in career choice.
44expectation_professional_prestigeCareer choice influenced by status or job prestige expectations.
45single_optionPerception of not having had real options in choosing a career.
46uncertainty_electionRegret, confusion, or lack of clarity about career choice.
47career_satisfactionLevel of satisfaction with chosen career at entry.
48genderBasic sociodemographic variable with potential differential effects.
49ageMay reflect maturity, lag, or non-traditional status.
50health_condition_special_needsHealth limitations or special needs.
51personal_limitationNon-medical personal barriers (family, psychological, etc.).
52intensity_tobacco_alcohol_consumptionConsumption habits as a risk factor.
53non_drinkerPossible indicator of self-care or healthy habits.
54practice_sportPhysical activity as a wellness indicator.
55desire_work_experienceWillingness toward independence and personal development.
56distance_campusPhysical distance between home and campus; direct impact on accessibility.
57university_transfer_timeActual commuting time; reflects daily logistical barriers.
58public transportAccess or reliance on collective transport; common among low-resource students.
59private_motorized_transportAvailability of car/motorbike; associated with greater autonomy.
60non-motorized_transportWalking or biking; reflects proximity or lack of other means.
61work-career_relationshipEvaluates match between current job and career; key to analyzing conflict or synergy.
62public_institutional_labor_scopeIntention to work in the public/institutional sector; may align better with academic contexts.
63work_field_private_entrepreneurIntention to work in the private/informal sector; usually less compatible with academic life.
64morning_work_shiftMorning shift; may interfere with classes.
65evening_work_shiftEvening shift; may impact extracurriculars or study.
66night_shift_workNight shift; associated with fatigue and schedule disruption.
67mixed_work_shiftIrregular or mixed shifts; reflects instability.
68weekend_work_shiftWeekend work; reduces rest and study time.
69sporadic_work_shiftSporadic or irregular work; signals precariousness or flexibility.

Appendix B. Sensitivity Analysis of Self-Reported Variables

Table A3. Sensitivity analysis of self-reported variables. Each variable was individually perturbed to simulate moderate noise (numerical: Gaussian noise with std = 10% of feature’s std; categorical: random permutation). The table reports the resulting drop in AUC and F1-score, with variables ordered by AUC drop. Results highlight which inputs most influenced model stability.
VariableAUC DropF1 Drop
tuition_fee0.00210.0054
financial_independence0.00190.0032
gender0.00170.0007
high-school_average0.00140.0015
university_transfer_time0.0014−0.0004
economic_burden0.00130.0009
resources_academic_activities0.00130.0006
age0.00090.0017
conditioned_career0.00080.0001
distance_campus0.0008−0.0006
lifestyle_free_time0.00070.0031
goods_services_housing0.0007−0.0001
institutional_recreational_services0.00060.0026
passive teaching0.00050.0029
educational_capital_father_mother0.00050.0024
techniques_study_organization0.00040
economic constraint0.00040.0013
expectation_professional_prestige0.00040.0004
accessibility0.00040.0003
health_condition_special_needs0.00030.0008
private_motorized_transport0.00030.0009
civil_family_burden0.0003−0.0002
mixed_work_shift0.00030
public_institutional_labor_scope0.00020.0014
evening_work_shift0.0002−0.0001
non-motorized_transport0.00020.0004
previous_studies_open-line0.00020.0001
private_institution0.00020
practice_sport0.00010.0017
social_environment_community0.00010.0007
vocational_influence0.00010.0003
academic_parental_involvement0.00010.0015
night_shift_work0.00010
academic_progress_performance0.00010.0011
job_opportunity0−0.0003
prestige_quality00.0021
public_institution0−0.0003
economic_perception_itson_parents0−0.0001
perception_economic_terms00.001
property_type_housing00
non_drinker00
personal_limitation−0.0001−0.0003
sporadic_work_shift−0.00010
desire_work_experience−0.00010.0003
single_option−0.0001−0.0001
services_academic_activities−0.0001−0.0002
schooled_institution−0.0001−0.0004
intensity_tobacco_alcohol_consumption−0.0001−0.0001
morning_work_shift−0.00010.0002
habits_study_participation−0.0001−0.0008
weekend_work_shift−0.0001−0.0004
economic_restriction−0.0002−0.0002
influence_outsiders−0.00020.0017
academic_limitation−0.00020
academic_information_received−0.00020.0006
physical_teaching_resources−0.00020.0013
career_satisfaction−0.0003−0.0017
cultural_activities−0.00030.0006
teaching_performance−0.00030.0001
housing_company−0.00030
educational_parental_assessment−0.00030.0019
work-career_relationship−0.0004−0.0005
work_field_private_entrepreneur−0.00050.0007
areas_reinforcement−0.00050.0011
active-critical-learning-practices−0.00050.0001
public transport−0.0006−0.0002
digital_teaching_resources−0.00060.0011
uncertainty_election−0.00070.0008
Note: Positive F1 drop means lower performance; negative values suggest small fluctuation within the error margin.

References

  1. Heredia, R.; Carcausto-Calla, W. Factors Associated with Student Dropout in Latin American Universities: Scoping Review. J. Educ. Soc. Res. 2024, 14, 62. [Google Scholar] [CrossRef]
  2. Sandoval-Palis, I.; Naranjo, D.; Vidal, J.; Gilar-Corbí, R. Early Dropout Prediction Model: A Case Study of University Leveling Course Students. Sustainability 2020, 12, 9314. [Google Scholar] [CrossRef]
  3. Nurmalitasari; Long, Z.A.; Noor, M.F.M.; Xie, H. Factors Influencing Dropout Students in Higher Education. Educ. Res. Int. 2023, 2023, 7704142. [Google Scholar] [CrossRef]
  4. Aina, C.; Baici, E.; Casalone, G.; Pastore, F. The Determinants of University Dropout: A Review of the Socio-Economic Literature. Socio-Econ. Plan. Sci. 2022, 79, 101102. [Google Scholar] [CrossRef]
  5. Ranasinghe, K.; Fernando, T.; Vineeshiya, N.; Bozkurt, A. Identifying Reasons That Contribute to Dropout Rates in Open and Distance Learning. Int. Rev. Res. Open Distrib. Learn. 2025, 26, 162–183. [Google Scholar] [CrossRef]
  6. Orozco-Rodríguez, C.; Viegas, C.; Costa, A.; Lima, N.; Alves, G. Dropout Rate Model Analysis at an Engineering School. Educ. Sci. 2025, 15, 287. [Google Scholar] [CrossRef]
  7. Kemper, L.; Vorhoff, G.; Wigger, B. Predicting Student Dropout: A Machine Learning Approach. Eur. J. High. Educ. 2020, 10, 28–47. [Google Scholar] [CrossRef]
  8. Lakshmi, S.; Maheswaran, C. Effective Deep Learning Based Grade Prediction System Using Gated Recurrent Unit (GRU) with Feature Optimization Using Analysis of Variance (ANOVA). Automatika 2024, 65, 425–440. [Google Scholar] [CrossRef]
  9. Zapata-Giraldo, P.; Acevedo-Osorio, G. Desafíos y Perspectivas de los Sistemas Educativos en América Latina: Un Análisis Comparativo. Pedagog. Constellations 2024, 3, 89–101. [Google Scholar] [CrossRef]
  10. Gonzalez-Nucamendi, A.; Noguez, J.; Neri, L.; Robledo-Rella, V.; García-Castelán, R.M.G. Predictive Analytics Study to Determine Undergraduate Students at Risk of Dropout. Front. Educ. 2023, 8, 1244686. [Google Scholar] [CrossRef]
  11. Nimy, E.; Mosia, M.; Chibaya, C. Identifying At-Risk Students for Early Intervention—A Probabilistic Machine Learning Approach. Appl. Sci. 2023, 13, 3869. [Google Scholar] [CrossRef]
  12. Martins, M.; Baptista, L.; Machado, J.; Realinho, V. Multi-class phased prediction of academic performance and dropout in higher education. Appl. Sci. 2023, 13, 4702. [Google Scholar] [CrossRef]
  13. Vaarma, M.; Li, H. Predicting student dropouts with machine learning: An empirical study in Finnish higher education. Technol. Soc. 2024, 78, 102474. [Google Scholar] [CrossRef]
  14. Song, Z.; Sung, S.; Park, D.; Park, B. All-year dropout prediction modeling and analysis for university students. Appl. Sci. 2023, 13, 1143. [Google Scholar] [CrossRef]
  15. Ridwan, A.; Priyatno, A. Predict students’ dropout and academic success with XGBoost. J. Educ. Comput. Appl. 2024, 1, 1–8. [Google Scholar] [CrossRef]
  16. Glandorf, D.; Lee, H.; Orona, G.; Pumptow, M.; Yu, R.; Fischer, C. Temporal and between-group variability in college dropout prediction. In Proceedings of the 14th Learning Analytics and Knowledge Conference, Kyoto, Japan, 18–24 March 2024. [Google Scholar] [CrossRef]
  17. Berens, J.; Schneider, K.; Görtz, S.; Oster, S.; Burghoff, J. Early detection of students at risk—Predicting student dropouts using administrative student data and machine learning methods. SSRN Electron. J. 2018, 11, 7259. [Google Scholar] [CrossRef]
  18. Shynarbek, N.; Saparzhanov, Y.; Saduakassova, A.; Orynbassar, A.; Sagyndyk, N. Forecasting dropout in university based on students’ background profile data through automated machine learning approach. In Proceedings of the 2022 International Conference on Smart Information Systems and Technologies (SIST), Nur-Sultan, Kazakhstan, 28–30 April 2022. [Google Scholar] [CrossRef]
  19. Baranyi, M.; Nagy, M.; Molontay, R. Interpretable deep learning for university dropout prediction. In Proceedings of the 21st Annual Conference on Information Technology Education, New York, NY, USA, 7–9 October 2020. [Google Scholar] [CrossRef]
  20. Del Bonifro, F.; Gabbrielli, M.; Lisanti, G.; Zingaro, S. Student dropout prediction. In Artificial Intelligence in Education; Springer: Cham, Switzerland, 2020; Volume 12163, pp. 109–121. [Google Scholar] [CrossRef]
  21. Kabathova, J.; Drlík, M. Towards predicting student’s dropout in university courses using different machine learning techniques. Appl. Sci. 2021, 11, 3130. [Google Scholar] [CrossRef]
  22. Villar, A.; De Andrade, C. Supervised machine learning algorithms for predicting student dropout and academic success: A comparative study. Discov. Artif. Intell. 2024, 4, 2. [Google Scholar] [CrossRef]
  23. Putra, L.; Prasetya, D.; Mayadi, M. Student Dropout Prediction Using Random Forest and XGBoost Method. INTENSIF J. Ilm. Penelit. Penerapan Teknol. Sist. Inf. 2025, 9, 147–157. [Google Scholar] [CrossRef]
  24. Romsaiyud, W.; Nurarak, P.; Phiasai, T.; Chadakaew, M.; Chuenarom, N.; Aksorn, P.; Thammakij, A. Predictive Modeling of Student Dropout Using Intuitionistic Fuzzy Sets and XGBoost in Open University. In Proceedings of the 2024 7th International Conference on Machine Learning and Machine Intelligence (MLMI), Osaka, Japan, 2–4 August 2024. [Google Scholar] [CrossRef]
  25. Segura, M.; Mello, J.; Hernández, A. Machine Learning Prediction of University Student Dropout: Does Preference Play a Key Role? Mathematics 2022, 10, 3359. [Google Scholar] [CrossRef]
  26. Tinto, V. Dropout from Higher Education: A Theoretical Synthesis of Recent Research. Rev. Educ. Res. 1975, 45, 125–189. [Google Scholar] [CrossRef]
  27. Tinto, V. Limits of Theory and Practice in Student Attrition. J. High. Educ. 1982, 53, 687–700. [Google Scholar] [CrossRef]
  28. Tinto, V. Research and Practice of Student Retention: What Next? J. Coll. Stud. Retent. 2006, 8, 1–19. [Google Scholar] [CrossRef]
  29. Tinto, V. Through the Eyes of Students. J. Coll. Stud. Retent. 2017, 19, 254–269. [Google Scholar] [CrossRef]
  30. Bean, J.P.; Metzner, B.S. A Conceptual Model of Nontraditional Undergraduate Student Attrition. Rev. Educ. Res. 1985, 55, 485–540. [Google Scholar] [CrossRef]
  31. Bourdieu, P. Poder, Derecho y Clases Sociales, 2nd ed.; Desclée de Brouwer: Bilbao, Spain, 2001; Available online: https://erikafontanez.com/wp-content/uploads/2015/08/pierre-bourdieu-poder-derecho-y-clases-sociales.pdf (accessed on 23 May 2025).
  32. Kerby, M.B. Toward a New Predictive Model of Student Retention in Higher Education: An Application of Classical Sociological Theory. J. Coll. Stud. Retent. 2015, 17, 138–161. [Google Scholar] [CrossRef]
  33. Elder, A.C. Holistic Factors Related to Student Persistence at a Large, Public University. J. Furth. High. Educ. 2020, 45, 65–78. [Google Scholar] [CrossRef]
  34. Mitra, S.; Zhang, Y. Factors Related to First-Year Retention Rate in a Public Minority Serving Institution with Nontraditional Students. J. Educ. Bus. 2021, 97, 312–319. [Google Scholar] [CrossRef]
  35. Franco, E.; Martínez, R.; Domínguez, V. Modelos Predictivos de Riesgo Académico en Carreras de Computación con Minería de Datos Educativos. RED Rev. Educ. Distancia. 2021, 21, 1–36. [Google Scholar] [CrossRef]
  36. Matheu-Pérez, A.; Ruff-Escobar, C.; Ruiz-Toledo, M.; Benites-Gutierrez, L.; Morong-Reyes, G. Modelo de Predicción de la Deserción Estudiantil de Primer Año en la Universidad Bernardo O’Higgins. Educ. Pesqui. 2018, 44, e172094. [Google Scholar] [CrossRef]
  37. Campbell, C.M.; Mislevy, J.L. Student Perceptions Matter: Early Signs of Undergraduate Student Retention/Attrition. J. Coll. Stud. Retent. 2013, 14, 467–493. [Google Scholar] [CrossRef]
  38. Hung, J.; Wang, M.; Wang, S.; Abdelrasoul, M.; Li, Y.; He, W. Identifying At-Risk Students for Early Interventions—A Time-Series Clustering Approach. IEEE Trans. Emerg. Top. Comput. 2017, 5, 45–55. [Google Scholar] [CrossRef]
  39. Hoffait, A.S.; Schyns, M. Early Detection of University Students with Potential Difficulties. Decis. Support Syst. 2017, 101, 1–11. [Google Scholar] [CrossRef]
  40. Marbouti, F.; Diefes-Dux, H.; Madhavan, K. Models for Early Prediction of At-Risk Students in a Course Using Standards-Based Grading. Comput. Educ. 2016, 103, 1–15. [Google Scholar] [CrossRef]
  41. Andrade-Girón, D.; Sandivar-Rosas, J.; Marín-Rodriguez, W.; Susanibar-Ramirez, E.; Toro-Dextre, E.; Ausejo-Sanchez, J.; Villarreal-Torres, H.; Angeles-Morales, J. Predicting student dropout based on machine learning and deep learning: A systematic review. EAI Endorsed Trans. Scalable Inf. Syst. 2023, 10, 1–10. [Google Scholar] [CrossRef]
  42. Bertola, G. University dropout problems and solutions. J. Econ. 2022, 138, 221–248. [Google Scholar] [CrossRef]
  43. Carruthers, C.; Dougherty, S.; Goldring, T.; Kreisman, D.; Theobald, R.; Urban, C.; Villero, J. Career and Technical Education Alignment Across Five States. AERA Open 2024, 10, n1. [Google Scholar] [CrossRef]
  44. Goulart, V.; Liboni, L.; Cezarino, L. Balancing skills in the digital transformation era: The future of jobs and the role of higher education. Ind. High. Educ. 2021, 36, 118–127. [Google Scholar] [CrossRef]
  45. Armstrong-Carter, E.; Panter, A.; Hutson, B.; Olson, E. A university-wide survey of caregiving students in the US: Individual differences and associations with emotional and academic adjustment. Humanit. Soc. Sci. Commun. 2022, 9, 300. [Google Scholar] [CrossRef]
  46. Buizza, C.; Bornatici, S.; Ferrari, C.; Sbravati, G.; Rainieri, G.; Cela, H.; Ghilardi, A. Who Are the Freshmen at Highest Risk of Dropping Out of University? Psychological and Educational Implications. Educ. Sci. 2024, 14, 1201. [Google Scholar] [CrossRef]
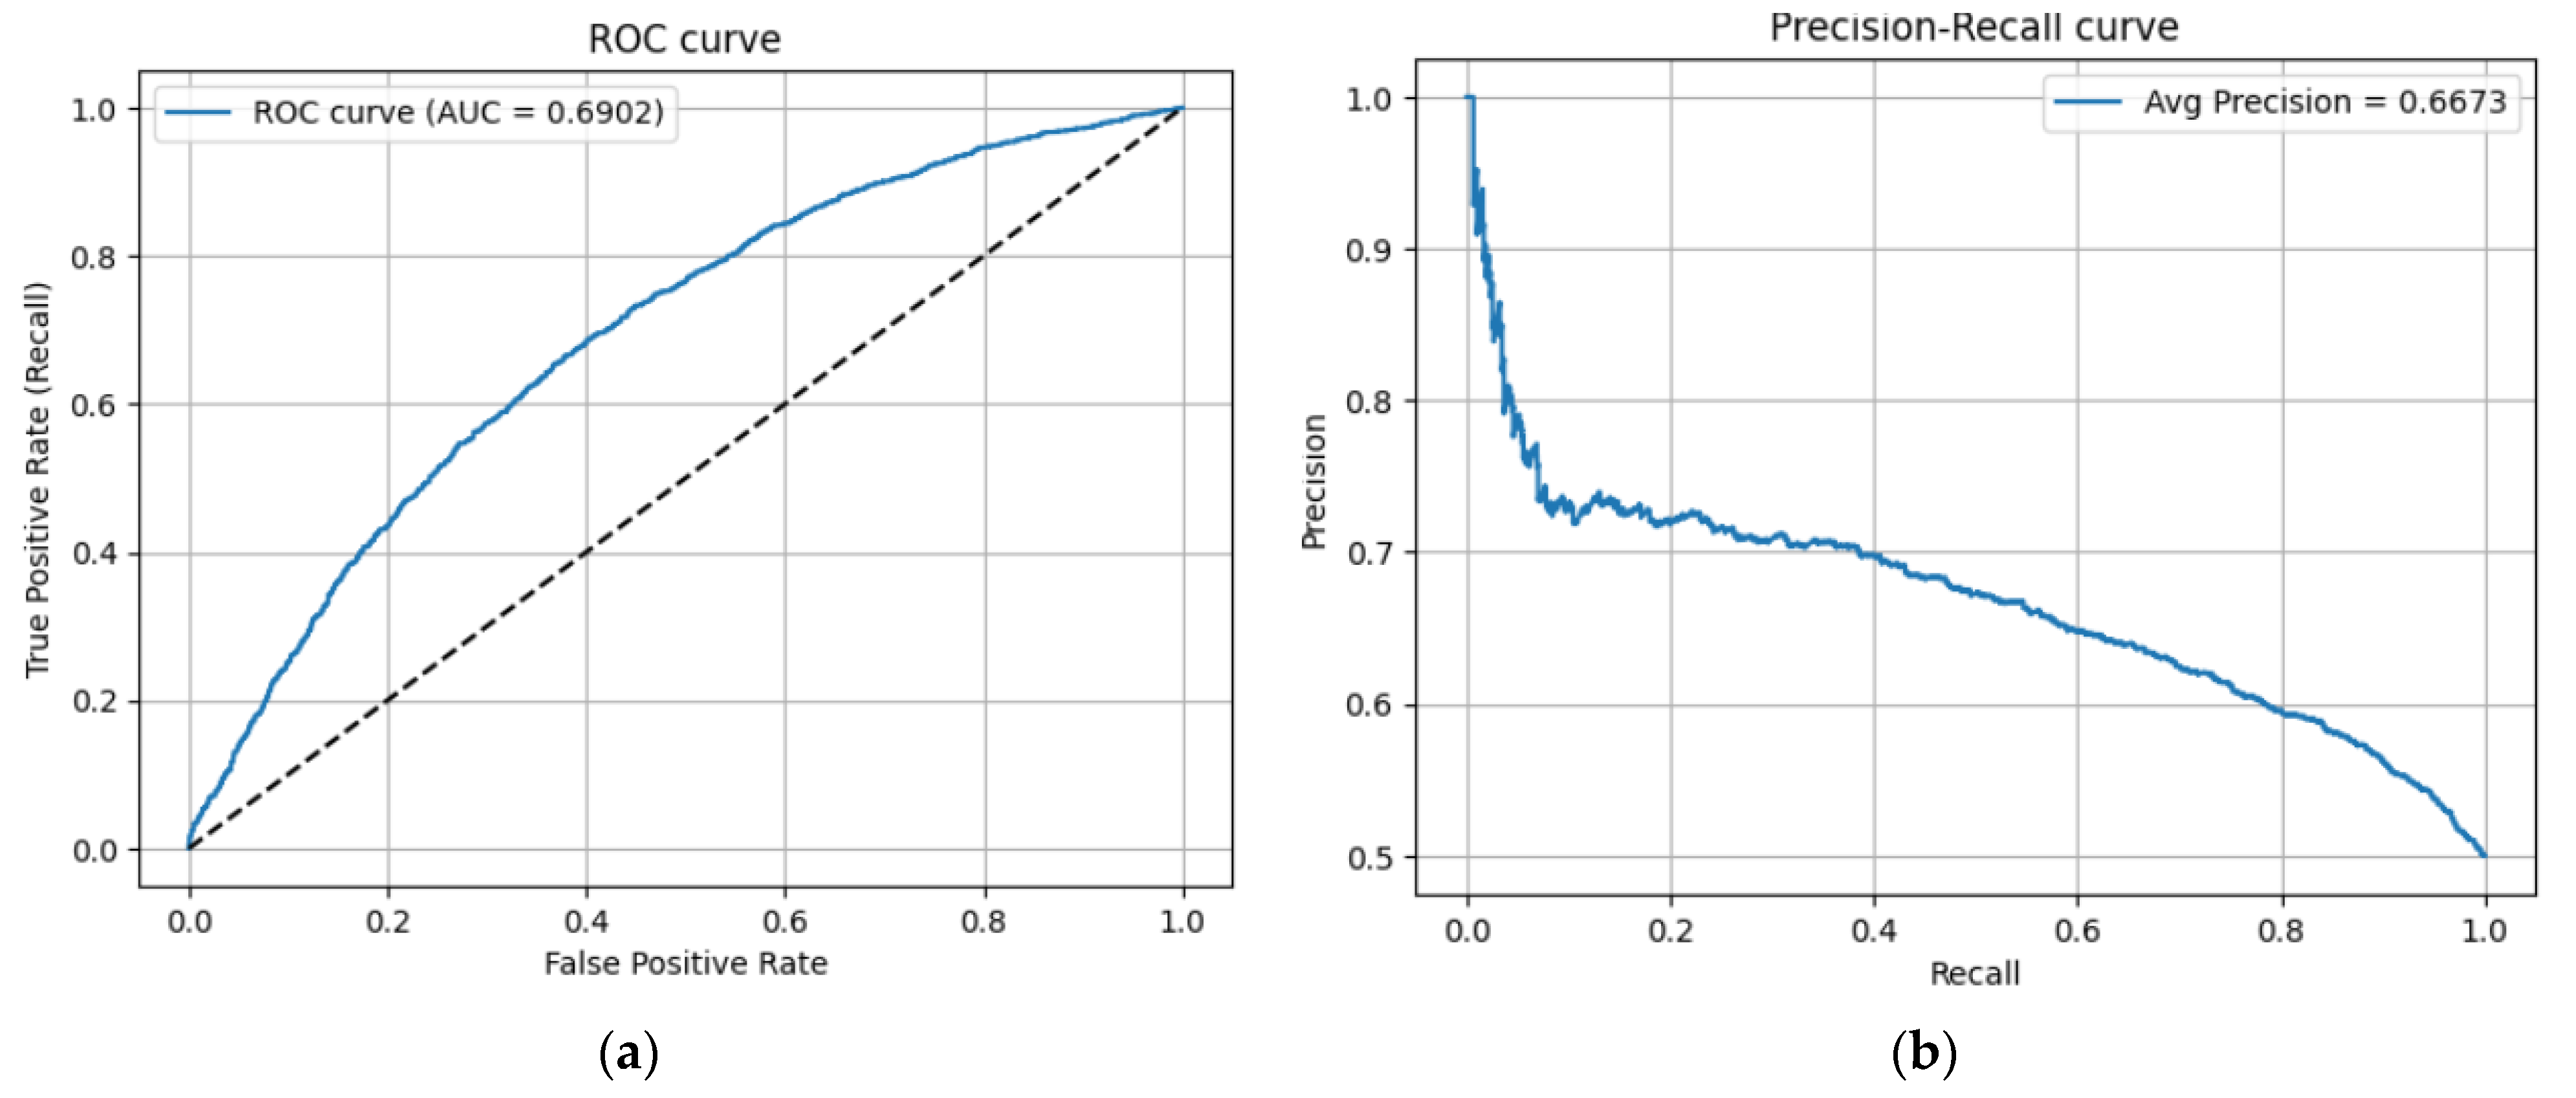
Figure 1. Overall evaluation of the predictive model: (a) ROC curve; (b) precision–recall curve.
Applsci 15 09202 g001
Figure 2. Confusion matrix with calibrated threshold applied.
Applsci 15 09202 g002
Figure 3. Predictor importance ranking.
Applsci 15 09202 g003
Figure 4. SHAP-based interpretability of the XGBoost model: top 15 predictors of student dropout.
Applsci 15 09202 g004
Figure 5. Overall distribution of predicted dropout probabilities.
Applsci 15 09202 g005
Figure 6. Dropout risk distribution by academic program. Note: The central line denotes the median, the box the interquartile range, and whiskers extend to 1.5 × IQR; circles indicate outliers. Colors are used solely to distinguish programs visually and do not encode additional information.
Applsci 15 09202 g006
Figure 7. Top 10 programs with the highest average dropout risk. Note: Bars are ordered from highest to lowest mean probability (0–1). A sequential palette is used (darker = higher); colors carry no categorical meaning.
Applsci 15 09202 g007
Figure 8. Dropout probability distribution by academic cluster.
Applsci 15 09202 g008
Figure 9. Dropout risk distribution by gender.
Applsci 15 09202 g009
Figure 10. Heatmap by dimension (high-risk students only). Note: Values range from 0 to 1. Higher values indicate a more substantial presence of that dimension within the risk profile.
Applsci 15 09202 g010
Figure 11. Average profile by dimension according to dropout risk level (radar chart).
Applsci 15 09202 g011
Figure 12. Expected net cost by classification threshold.
Applsci 15 09202 g012
Table 1. Comparison of key studies on predictive models of university dropout.
StudyMain AlgorithmSample and CountryAcademic DataModel PerformanceKey Predictors
[7]Logistic Regression (LR), Decision Tree (DT)3176 (Germany)Exam results from the first 3 semestersAccuracy: 87–95%, Recall: 62–80%Failed exams and average exam grades
[10]Random Forest (RF)14,495 (Mexico) Early grades, prior GPA and math scores Recall > 50%, Acc > 78%First-semester performance, entrance data
[11]Probabilistic Logistic Regression (PLR)517 (South Africa)Moodle grades, assessmentsAcc: 63–93%, F1: 61–93%Moodle activity, test scores, gender
[12]RF, RusBoost, Easy Ensemble4433 (Portugal) Admission and 1st–2nd sem. GPAF1: 0.65–0.74Sem. GPA, age
[13]CatBoost, Neural Networks (NNs), LR8813 (Finland) Grades, Moodle activityAUC: 0.84–0.85, F1: 56–59%Credits, fails, LMS use
[14]Light Gradient Boosting Machine (LightGBM)60,010 (South Korea)GPA, attendance, aid dataAcc: 94%, F1: 0.79Fees, scholarships, year of entry
[15]Extreme Gradient Boosting (XGBoost)4423 (Indonesia) Sem. GPA, creditsAcc: 87%, F1: 0.81, Recall: 74%Grades, credits, SES
[16]RF33,133 (USA)HS and college GPA, course dataAUC: 0.83–0.91, Acc: 90–94%GPA, course completions
[17]LR + NN + DT (AdaBoost)19,396 (Germany)Sem. GPA, failed exams Acc: 79–95% (sem. 1 to 4+)GPA, credits, exam success
[18]ANN, NB, DT, RF, SVM, kNN 2066 (Kazakhstan)Entrance exam and demographicsAcc: 77–84%Test scores, gender, school type
[19]Deep FCNN8319 (Hungary)Enrollment attributes onlyAcc: 72–77%Years since HS, funding, math, gender
[20]LR, ANN, RF 15,000 (Italy)HS academic records Acc: 56–62%, Recall: 58–65%HS GPA, school ID
[21]ANN, NB, DT, SVM, RF, kNN 261 (Slovakia) Course views, assignments, testsAcc: 77–93%LMS usage, test and assignment scores
[22]DT, SVM, RF, GB, XGB, CB, LB 4424 (Portugal) HS GPA, early credits Acc/Recall: 85–90%Approved units, scholarships
[23]RF, XGBoost4424 (Indonesia) Admission and academic historyAcc: ~79–81%, Recall: ~72%Not specified
[24]XGBoost N/A (Thailand, open uni) Degree structure and creditsAcc: 91%, AUC: 0.913Major code, credit needs, faculty ID
[25]SVM, DT, ANN, LR, kNN428 (Spain)Admission and first-semester academic resultsAcc: 77–93%, F1 (kNN): 0.86Pass rate 1st sem, 1st sem GPA, admission preference
Table 2. Surveyed students by cohort (2014–2024).
Cohort20142015201620172018201920202021202220232024Total
Students37264335400439494069498344337873964393874438,932
Table 3. Comparison of classification models for predicting university dropout.
ModelAUC-ROCAccuracyRecall (1)Precision (1)F1-Score (1)MCCBalanced Accuracy
Logistic Regression0.6900.650.620.430.51
Random Forest0.7030.650.650.430.52
Random Forest (Optim.)0.7050.650.660.420.510.2690.648
XGBoost (Optim.)0.7010.600.910.340.500.2150.601
Note: Class 1 corresponds to students who dropped out. Metrics were computed on the test set (n = 6850).
Table 4. Students with the highest predicted dropout risk (top 20 cases).
NYearAgeGenderProgramDropout Prob. (%)Credits PassedGPAFailed CoursesEnrolled JM25
1202324MIIS9400.060
2202321MLA9258.400
3202331FLPS92168.531
4202324MISW9017.020
5202423MLPS9000.000
6202322FLENF8900.070
7202431FLCE89129.501
8202324MISW88118.3131
9202439MLCOPU8869.100
10202322FLCOPU88148.560
11202323FLPS8827.030
12202324MISW88129.010
13202434MLCOPU87118.911
14202320FLAET87198.710
15202320MLEF87247.831
16202329FIL87229.101
17202323FLDG8700.000
18202320FLCE87158.901
19202339FLDCFD87217.841
20202326FARQ86169.211
Note: Prospective prediction applied to 2023 and 2024 cohorts. “JM25” indicates enrollment in the January–May 2025 semester.
Table 5. Recommendations for institutional implementation of the predictive model.
Area Key Recommendation
Technology Make the model part of the university’s everyday tools, integrating it into platforms like SITE, so that identifying and supporting students at risk becomes a natural, ongoing part of how the institution cares for its community.
Tutoring Use the model’s predictions to identify and prioritize students who might benefit from extra guidance so that support can reach them early, personally, and with purpose.
Financial Aid Use the risk profiles to better align scholarship and support programs, ensuring that limited resources reach the students who need them most, when they need them most.
Communication Provide training and guidance to academic coordinators so that they feel confident interpreting the reports and using them to support their students with empathy, clarity, and purpose.
Evaluation Regularly monitor how well the interventions guided by the model are working, not just in numbers but in real student outcomes, so that the system can continue to learn and improve alongside the people it is meant to support.
Ethics and Fair Use Establish clear and compassionate guidelines to ensure that the model is used as a tool for support and encouragement, not for judgment or punishment.
Disclaimer/Publisher’s Note: The statements, opinions and data contained in all publications are solely those of the individual author(s) and contributor(s) and not of MDPI and/or the editor(s). MDPI and/or the editor(s) disclaim responsibility for any injury to people or property resulting from any ideas, methods, instructions or products referred to in the content.