1. Introduction
Milk and dairy products have long been essential components of the human diet, consumed by millions of people around the world for centuries. As the global population continues to grow, milk production is also increasing steadily. According to the Food and Agriculture Organization (FAO), global milk production reached approximately 950 million tons in 2023 [
1]. Despite its high nutritional value, milk is highly perishable and begins to spoil within hours after milking due to enzymatic activity and microbial growth [
2]. To slow down spoilage and extend shelf life, pasteurization is widely applied as a thermal treatment process. However, it is also one of the most energy-intensive stages in dairy processing. Pasteurization is typically carried out using one of three main methods: low-temperature long-time (LTLT), high-temperature short-time (HTST), and ultra-high-temperature (UHT) treatment. These methods operate at 62–65 °C for 30–32 min, 72–75 °C for 15–20 s, and 138 °C for 2 s or 149 °C for 10 s, respectively [
3].
Thermodynamic analysis of pasteurization systems has become increasingly important due to the need for more energy-efficient and sustainable food processing methods. In this area, Yildirim and Genc [
4] analyzed a geothermal-assisted milk pasteurization system from the energy and exergy perspectives, showing the potential benefits of using renewable energy in dairy processes. Singh et al. [
5] evaluated a high-temperature short-time (HTST) skim milk pasteurization plant by applying energy, exergy, and exergoeconomic analysis methods. They later extended their study to cover an ultra-high-temperature (UHT) pasteurization system [
6], allowing for a broader comparison of different pasteurization approaches. Singh G. et al. [
7] focused on the performance of a complete dairy plant, which included milk and cream pasteurization as well as ghee production. Their work assessed energy and exergy efficiencies, quantified exergy losses, and identified opportunities for thermodynamic improvement at the component level. In another study, Basaran et al. [
8] compared two HTST pasteurization systems: one using conventional heating equipment (CHE) and the other using induction-assisted modified pasteurization (IMP). Their findings showed that the IMP system offered better energy and exergy performance, along with lower environmental impact. Soufian et al. [
9] carried out a detailed exergy analysis of a large-scale milk processing facility. The plant included various units such as a steam generator, above-zero refrigeration, milk reception, pasteurization and standardization sections, and UHT processing lines. Their study helped reveal how exergy is used and lost across the system, providing useful insights for improving efficiency.
The Organic Rankine Cycle (ORC) is a thermodynamic process used to generate electricity from low- to medium-temperature heat sources. Although initially developed for standalone power generation, ORC systems are now widely integrated into multi-purpose energy systems, including those for hydrogen production, freshwater generation, heating, and cooling. Geothermal energy is a particularly suitable heat source for ORC applications due to its thermal characteristics. As a result, geothermal-assisted ORC systems have been the focus of extensive research in recent years. For example, Cao and Ehyaei [
10] evaluated a geothermal-powered multigeneration system with a novel ORC design from the energy, exergy, economic, and environmental perspectives. Their system simultaneously produced electricity, hydrogen, heating, potable water, and salt. Koc et al. [
11] proposed and analyzed a geothermal-based multigeneration plant capable of delivering power, heating, cooling, swimming pool heating, and hydrogen. Diaz et al. [
12] applied advanced exergy and exergoeconomic analysis to a polygeneration system operating in a geothermal cascade configuration, which included an ORC, an absorption chiller, and a dehydrator for combined power, cooling, and thermal drying. Wang et al. [
13] performed exergy and exergoeconomic assessments of a novel combined cooling, heating, and power (CCHP) system driven by a closed-loop geothermal source. Their system integrated a vapor compression heat pump, an ORC, and a vapor compression refrigeration cycle. Ata et al. [
14] conducted exergoeconomic and enviroeconomic analyses of a hydrogen production setup that utilized a Proton Exchange Membrane Electrolyzer (PEME) integrated with a dual ORC configuration using fourth-generation refrigerants (R1243zf, R1225ye, and R1234ze), identifying the most effective fluid pair for enhancing hydrogen output. Similarly, Hajabdollahi et al. [
15] investigated a geothermal-driven multigeneration system designed to meet power, heating, freshwater, hydrogen, and oxygen demands, incorporating a single-pressure ORC, reverse osmosis desalination unit, domestic water heater, and PEME unit.
Plate heat exchangers (PHEs) are widely used in the food industry for both heating and cooling applications due to their high thermal effectiveness, compact design, flexibility in meeting load and pressure drop requirements, and cost efficiency [
16]. Despite their advantages, the open literature offers limited design guidance for PHEs, particularly in cases involving two-phase flows such as evaporation and condensation. This is mainly because accurate design requires specialized heat transfer and pressure drop correlations tailored to plate geometries. Several studies have attempted to address this gap. Yan et al. [
17] and Yan and Fin [
18] experimentally investigated the condensation and evaporation heat transfer coefficients and frictional pressure drops of refrigerant R123a in PHEs. Ayub [
19] reviewed the existing literature and proposed new empirical correlations for evaporation processes in plate heat exchangers. Szep and András [
20] calculated the required number of plates and overall heat transfer coefficient in a milk preheating case study. Tabari et al. [
21] explored the use of TiO
2–water nanofluid as a heating medium in a PHE system for milk pasteurization, using a custom-built experimental setup. Wang et al. [
22] conducted a multi-objective optimization study on an Organic Rankine Cycle (ORC) system, in which the surface areas of PHEs used as steam generators and condensers were determined using heat transfer correlations.
Recent studies have further expanded the scope of ORC systems, nanofluid-enhanced heat exchangers, and their integration into food processing applications. For instance, Koc et al. proposed a geothermal-based multigeneration plant that includes electricity, heating, cooling, and hydrogen production functionalities, illustrating the potential of ORC systems in diversified energy networks [
11]. In addition to geothermal energy, low-grade heat sources such as flat plate solar thermal collectors have also been analyzed for their potential in thermal system integration [
23]. In the context of heat exchanger enhancement, García-Castillo et al. presented a novel design approach for plate heat exchangers by optimizing chevron angles for better thermoeconomic performance [
24]. Finally, Wang et al. performed a multi-objective optimization of a geothermal-powered combined cooling, heating, and power system, integrating ORC technology with advanced thermodynamic and economic modeling to evaluate performance under variable operating conditions [
13]. These studies demonstrate the growing interest in the integration of advanced ORC technologies and heat exchanger innovations within sustainable food and energy systems.
In this study, exergoeconomic analyses of a geothermal-assisted milk pasteurization system were performed. The current system was inspired by the pasteurization system where cooling was applied using a vapor absorption cycle [
4]. In their study, the whole energy requirement of the pasteurization has been supplied from geothermal resource where the VAC (vapor absorption cycle) was used for both heating and cooling purposes. In this study, all the energy requirements of the process are supplied by geothermal energy as the same. However, the cooling of the milk was carried out with a vapor compression cooling cycle where its electricity is supplied by the ORC. The innovation of the current system lies in the utilization of a geothermal-assisted ORC as a subsystem that supplies electricity to a vapor compression refrigeration cycle during the cooling stage of the pasteurization process. The geothermal energy source temperature varied within a range of 80–110 °C. In this context, system parameters such as flow rates, plate heat exchanger areas, and heat and work capacities of system components were first determined for milk pasteurization with a flow rate of 1 kg.s
−1. However, industrial applications may involve higher milk flow rate operations. While the thermodynamic principles remain valid for such applications, optimization studies should be conducted considering equipment sizing constraints and advanced heat integration strategies. Subsequently, various performance indicators from the exergy analysis were determined. Finally, exergoeconomic results were obtained using the specific exergy costing (SPECO) method. To the best of the authors’ knowledge, this represents the first exergoeconomic analysis study of a geothermal-assisted milk pasteurization system utilizing ORC technology in the open literature.
2. Materials and Methods
The analysis began with a detailed description of the proposed system, followed by comprehensive energy and exergy evaluations. In this context, key performance indicators were defined for both the overall system and its individual components, including energy efficiency, exergy efficiency, and exergy destruction rates. The surface areas of the heat exchangers were then calculated to estimate their associated capital costs. Lastly, an exergoeconomic analysis was performed to assess the system’s economic performance and identify cost-related impacts across different components.
2.1. System Description
In this study, R134a was selected as the working fluid for both the ORC and vapor compression refrigeration subsystems. R134a’s compatibility with conventional refrigeration components makes it particularly suitable for the combined ORC–cooling–pasteurization system, enabling the use of standardized equipment and established maintenance practices. Therefore, the selection of R134a represents an optimal compromise between thermodynamic efficiency, system integration requirements, and operational reliability for this specific geothermal application. Alternative working fluids such as R245fa and R1234ze could be utilized in next-generation systems. Although R245fa possesses a higher critical temperature, R134a provides superior heat transfer performance within the geothermal temperature range of this study. While R1234ze(E) offers environmental advantages, its flammability characteristics and lower thermal conductivity present safety and design disadvantages for the integrated pasteurization system.
The schematic layout of the milk pasteurization system is presented in
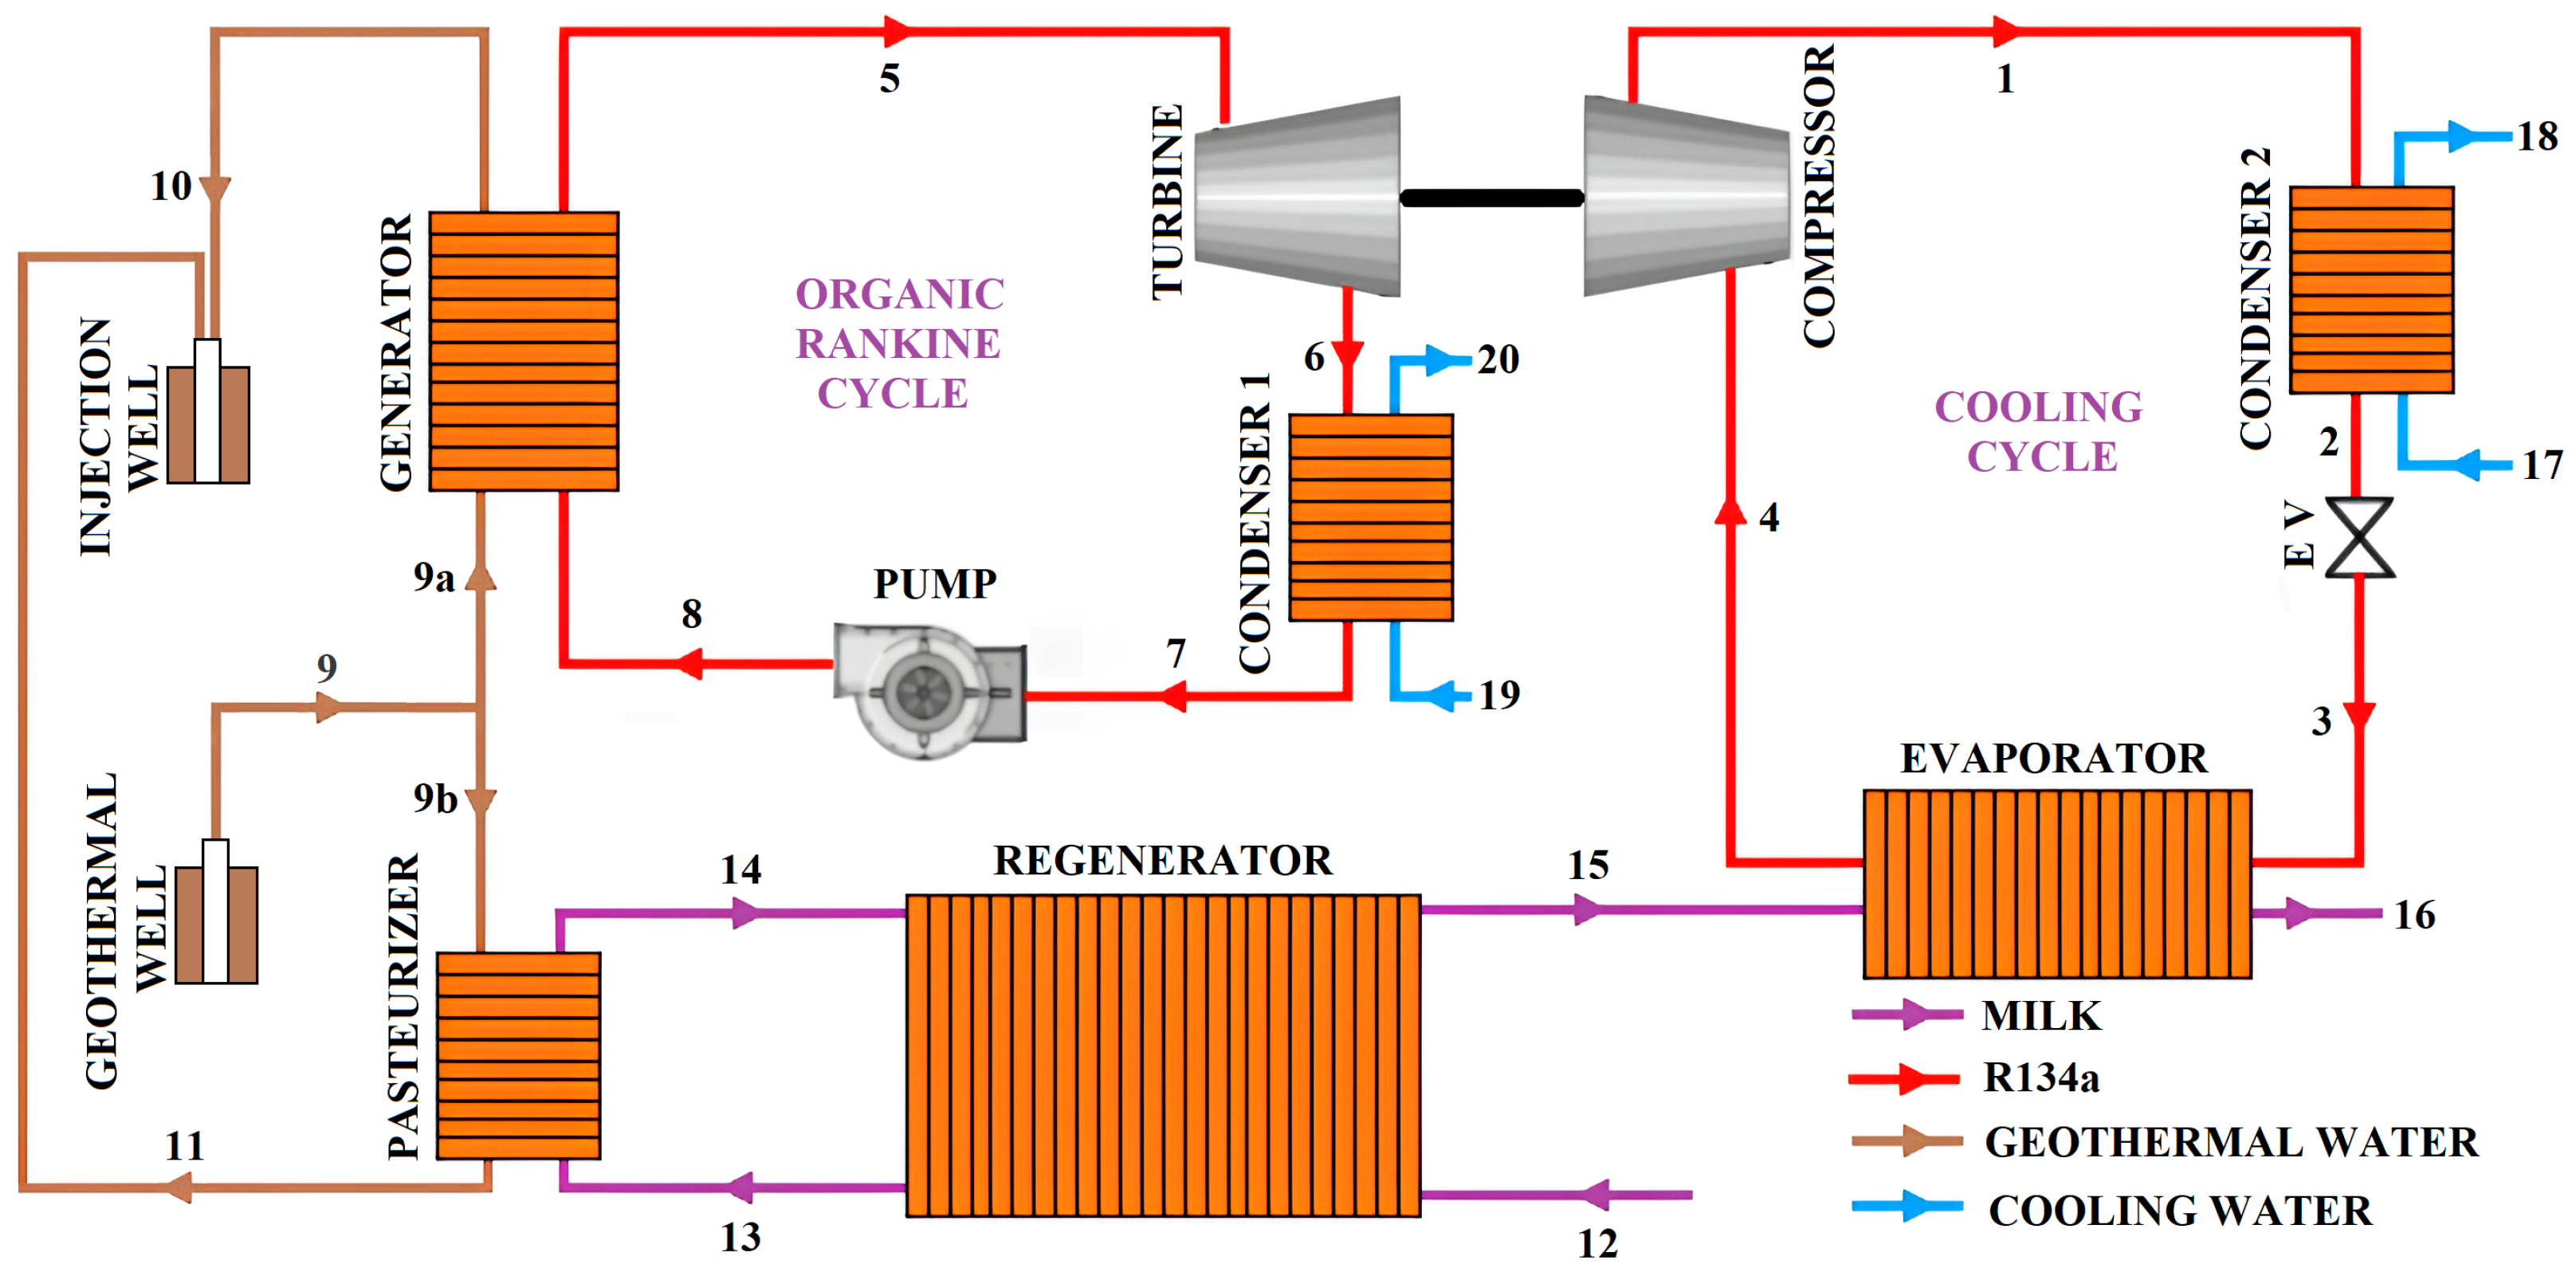
Figure 1. The system is composed of three main subsystems: (i) an ORC, (ii) a pasteurization unit, and (iii) a vapor compression refrigeration cycle. Geothermal water, denoted as point 9, is split into two separate streams. The first stream (point 9a) is directed to the ORC evaporator to generate the electricity required for the vapor compression cycle. The second stream (point 9b) is sent to the pasteurizer to provide the necessary thermal energy for milk heating. After transferring heat, the geothermal water from the ORC and the pasteurizer exits the system and returns to the well at points 10 and 11, respectively.
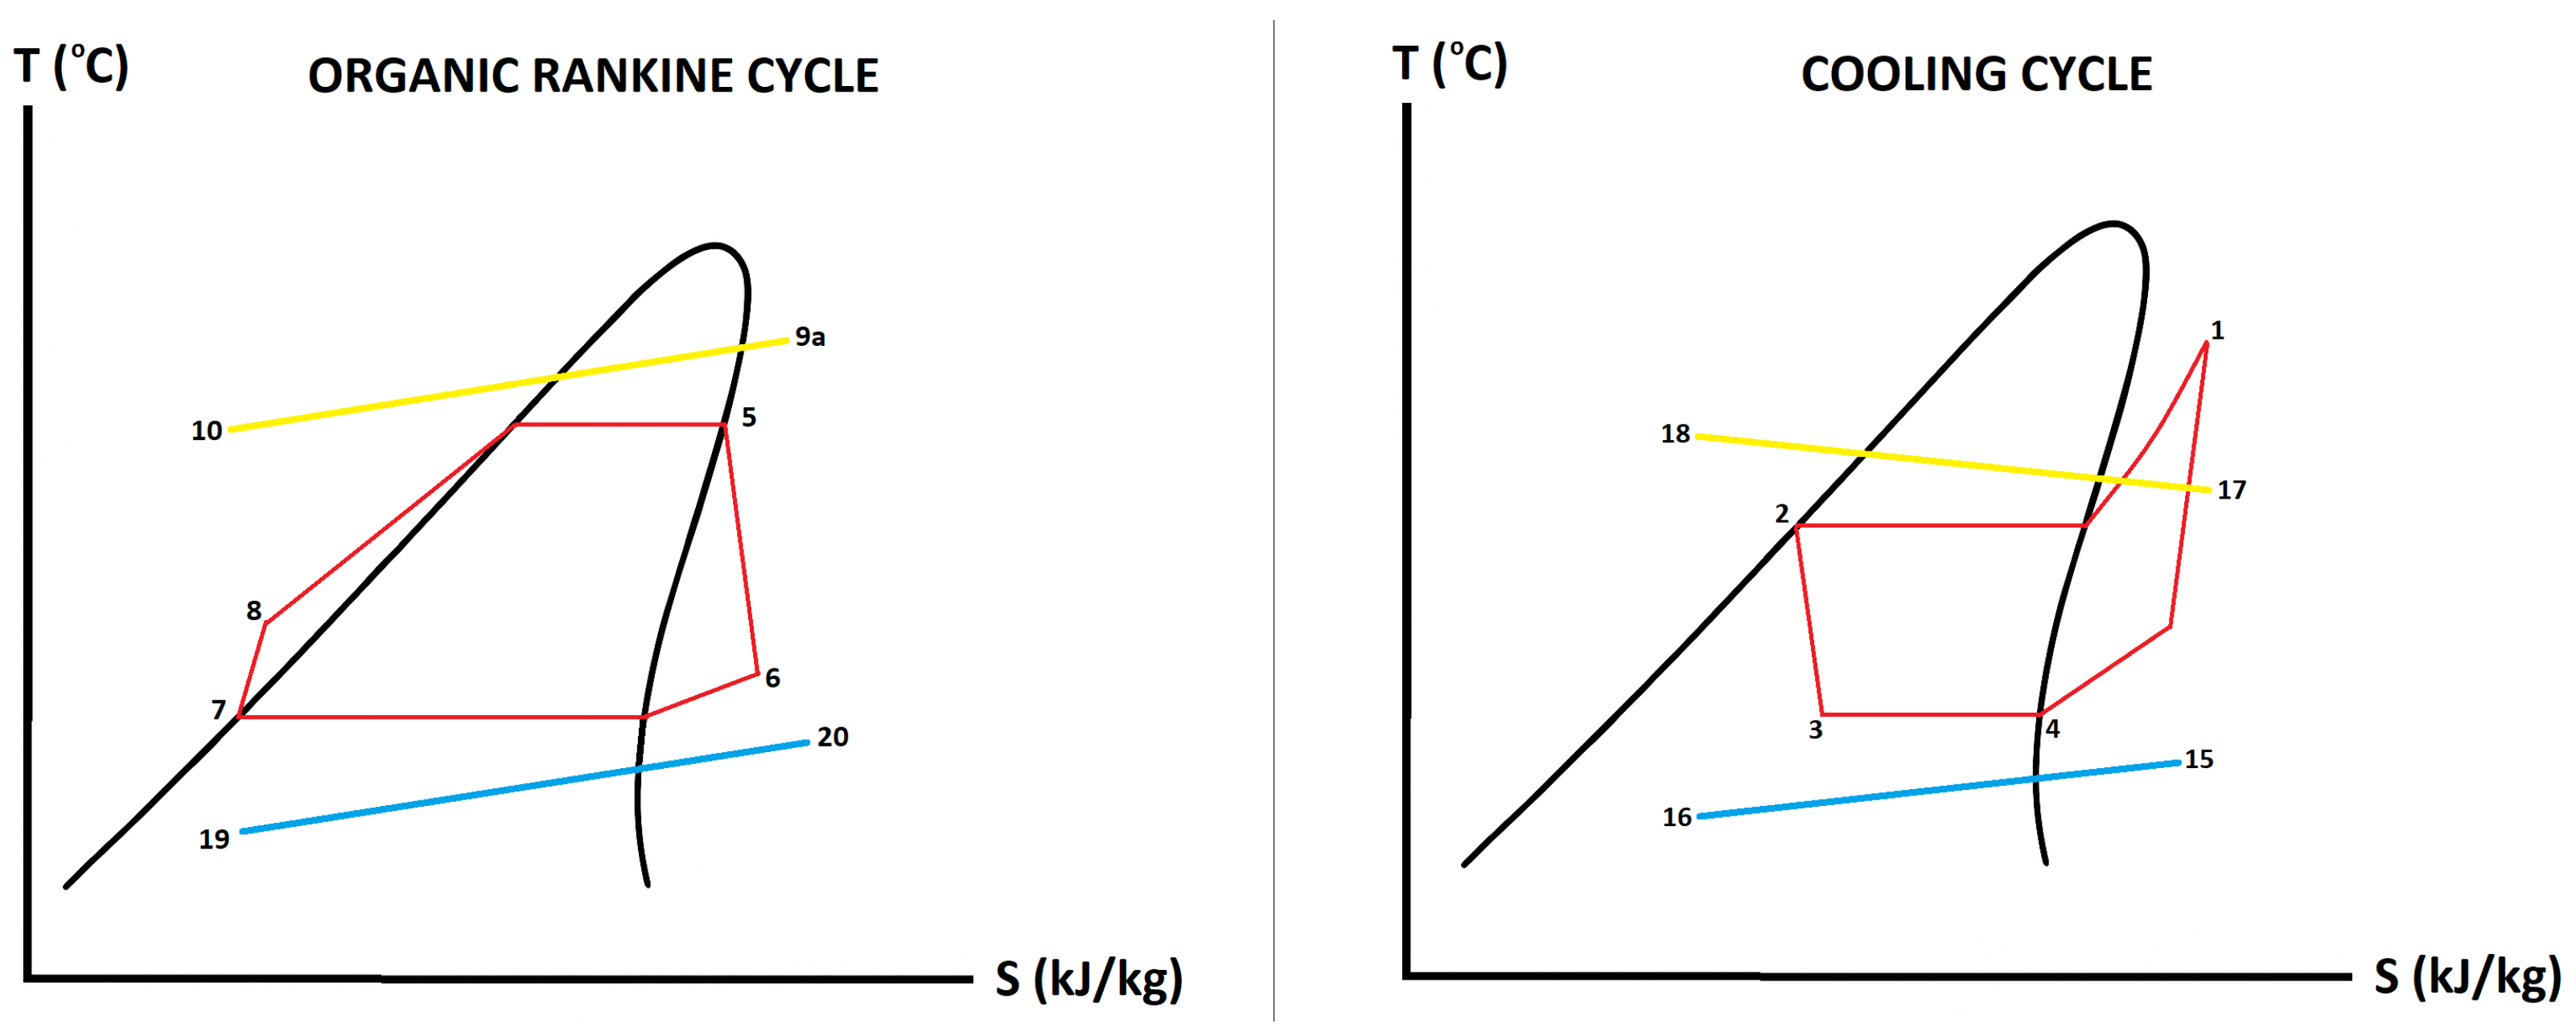
In the ORC, geothermal water (point 9a) enters the evaporator, where it transfers heat to the working fluid (R134a). The working fluid exits the evaporator as superheated vapor (point 5) and flows into the turbine. Mechanical power generated by the turbine–generator set is used to meet the electricity demand of the cooling process. After expansion, the working fluid enters the first condenser (condenser1) at point 6, where it releases heat to the cooling water stream (point 19) and exits as saturated liquid (point 7). The cooling water leaves the condenser at point 20. The pressurization of the working fluid is then completed by a pump, raising it to the evaporator pressure (point 8). In the pasteurization process, milk first flows into a regenerator (point 12) for preheating, which also enables internal energy recovery. It is then directed to the pasteurizer (point 13), where it is heated to the target pasteurization temperature (point 14). After pasteurization, the milk undergoes a two-stage cooling process: first in the regenerator (point 15), and then in the evaporator, before exiting the system (point 16). The vapor compression refrigeration cycle begins with the working fluid (R134a) entering the compressor as saturated vapor (point 4). It is compressed to the condenser2 pressure and reaches point 1 as superheated vapor. In condenser2, it releases heat to the cooling water stream (point 17) and exits as a saturated liquid (point 2), while the cooling water exits at point 18. The working fluid then passes through an expansion valve, where it is throttled to the evaporator pressure (point 3). The thermodynamic behavior of both the ORC and the cooling cycle is illustrated in the T–s diagrams provided in
Figure 2. Several assumptions were considered in modeling the system.
To ensure the long-term sustainability of the geothermal resource, a reinjection system is implemented to return the cooled geothermal fluid back to the underground reservoir. The reinjection process involves state points 9, 9a, 9b, 10, and 11 on the geothermal side, where the spent geothermal fluid is pumped through a filtration system and reinjected via a dedicated injection well. This closed-loop approach maintains reservoir pressure and extends the operational lifetime of the geothermal resource while minimizing environmental impact through controlled subsurface discharge.
The generator temperature (point 5) was assumed to be 5 °C lower than the geothermal resource temperature (point 9). The milk temperature at the entrance of the pasteurizer (point 13) was taken as 2 °C lower than the outlet temperature of the geothermal water from the pasteurizer (point 11). The temperature of the milk in cold storage was maintained at 4 °C (points 12 and 16). The specific heat capacity of milk was considered constant throughout the process and taken as 3.85 kJ.kg−1.K−1. The pasteurization temperature of the milk was fixed at 76 °C (point 14). For the refrigeration cycle, the condenser and evaporator temperatures were assumed to be 30 °C (points 6, 7, 1, and 2) and 2 °C (points 3 and 4), respectively.
The specific heat of milk varies with temperature; however, since this variation is approximately 0.1%, the associated error in thermodynamic calculations can be considered negligible. In the reference study [
4], condenser/evaporator temperatures were assumed to be constant. Similarly, to simplify thermodynamic calculations and considering that the impact on system performance would be negligible, constant values were adopted for these parameters in the present study.
2.2. Energy and Exergy Analysis
General energy equations (Equations (
1) and (
2)) were applied for every component as follows:
The energy value of any point in the system was calculated depending on the flow rate and specific enthalpy of the fluid by Equation (
3) as follows:
For milk,
= 0 °C and
= 100 kPa were accepted as the reference conditions where the enthalpy and entropy values are zero. The specific enthalpy and entropy values for other temperatures were calculated according to reference conditions by Equations (
4) and (
5) as follows:
Only physical exergy of the fluids was taken into consideration for the calculations. The exergy values of all fluids in the system were determined with the following equation depending on their mass flow, specific enthalpy, and entropy values. In Equation (
6), 0 denotes the environmental conditions (
= 25 °C,
= 1 atm).
The general exergy balance equation, Equation (
7), was applied for every component as follows:
Some performance indicators were determined, namely the exergy efficiency and exergy destruction rate of the components. The fuel and product exergy equations and the exergy destruction equations of all components were given in
Table 1. The exergy efficiency of any component was determined depending on its fuel and product exergy by Equation (
8) as follows:
The energy and exergy efficiencies of the whole system were determined by Equations (
9) and (
10) as follows:
2.3. Calculation of the Heat Exchanger Surface Areas
The surface area of a plate heat exchanger was needed to determine its initial investment. For this purpose, the surface areas were determined with the heat transfer equation between hot and cold flows passing through. There were six plate heat exchangers in the whole system, including generator, regenerator, pasteurizer, evaporator, and two condensers. The geometric characteristics of the plate heat exchangers are presented in
Table 2.
In a heat exchanger, at any stage of the flow, one of the hot or cold fluids can turn into the vapor phase while the other remains in the liquid phase. A flow in which both fluids are in the same phase is called a single-phase flow, while a flow in which one of the fluids is in the liquid phase and the other is in the vapor phase is called a two-phase flow. In this case, the calculation method of the heat transfer coefficient for a two-phase flow varies depending on the nature of the flow. The heat transfer processes between hot and cold fluids in single- or two-phase flows were determined by Equation (
11) as follows:
where
U,
A, and
were the overall heat transfer coefficient, heat transfer surface area, and log-mean temperature difference (
) between the hot side and cold side flows, respectively.
was calculated by Equation (
12) as follows:
The overall heat transfer coefficient was calculated by Equation (
13) as follows:
where
,
,
, and
were the thermal conductivity and the thickness of the plate and the convective heat transfer coefficients of the cold and hot flows, respectively. The heat transfer coefficients of the cold and hot flows were calculated by Equation (
14) as follows:
where
,
, and
were the Nusselt number, the mean thermal conductivity, and the hydraulic diameter, respectively. The hydraulic diameter was calculated by Equation (
15) as follows:
where
b and
W were the channel spacing and the channel width of the plate heat exchanger.
2.3.1. For Single-Phase Flow
For milk, the geothermal water and cooling water were always in the liquid phase for both the cold and hot flows. The Reynold and Prandtl numbers of the hot and cold side flows were determined by Equations (
16) and (
17) as follows:
where
,
,
, and
were the mean density, specific heat, viscosity, and thermal conductivity of the hot and cold side flows, respectively. The mass velocity through the plate channels was determined by Equation (
18) as follows:
where
was the number of plate channels.
2.3.2. For Two-Phase Flow
The refrigerant (R134a) undergoes a phase change at some stage of flow in the generator, evaporators, and condensers. In the calculations, the two-phase flow region was divided into small sections depending on the steam quality. The Reynolds number of the two-phase flow was determined by Equation (
19) as follows:
where
,
, and
were the mean density, equivalent mass velocity, and mean viscosity of the refrigerant in the section, respectively. Equivalent mass velocity was determined by Equation (
20) as follows:
where
and
were the density of the fluid in liquid and vapor phase, respectively.
and
w are vapor quality and the mass velocity through the plate channels, respectively. As another parameter of the calculation, the Boiling number was determined by Equation (
21) as follows:
where
was heat transfer rate to the refrigerant in the section and
was specific boiling enthalpy of the refrigerant. The Prandtl number of the refrigerant in the liquid phase was determined by Equation (
22) as follows:
where
,
, and
were the viscosity, specific heat, and thermal conductivity of the refrigerant in the liquid phase, respectively.
For the geothermal water, cooling water, and R132a, the Chisholm–Wanniarachchi correlation was used to calculate the Nusselt number in their liquid phases [
22]. For milk, Kumar’s correlation was used [
21]. The Nusselt number of R134a, at its boiling stage in the generator and condenser, were calculated with the correlations derived by [
17,
18]. The Nusselt equations that were used for the hot and cold flows of each component are presented in
Table 3.
2.4. Exergoeconomic Analysis
In this study, the specific exergy costing (SPECO) method, which was created as a combination of exergy analysis and economic principles, was applied for the exergoeconomic analysis [
25]. The SPECO (specific exergy costing) methodology employs several fundamental economic parameters for comprehensive system evaluation. The initial investment cost represents the total capital expenditure required for system installation. The interest rate is utilized to calculate the time value of investment costs. The maintenance factor expresses the annual operation and maintenance costs as a ratio of the total investment cost. Operating hours specify the annual operational duration of the system. The capital recovery factor converts the initial investment cost into equivalent annual payments over the system lifetime. The purchase equipment cost refers to the factory price of each system component, covering only the equipment itself. These parameters serve as essential input values for calculating specific exergy costs and evaluating the economic performance of the system. The SPECO analysis provides reliable economic results through the accurate selection of these parameters. For this purpose, first, the initial investment cost of each component was determined with the equations presented in
Table 4.
The general cost balance equation, Equation (
23), was applied for the system components as follows:
where
,
, and
were the inlet exergy cost, outlet exergy cost, and annual investment rate of each component, respectively. The exergy cost of the flow was determined by Equation (
24) as follows:
where
c was the unit exergy cost. The investment rate was determined by Equation (
25) as follows:
where
,
N,
, and
were the maintenance factor, annual working hours, capital recovery factor, and initial investment cost of the component, respectively. The maintenance factor and annual working hours were assumed as 1.06 and 2400 h [
5], respectively. The capital recovery factor was determined by Equation (
26) as follows:
where
i and
n were the annual interest rate and economic lifespan of the system, respectively. The annual interest rate and economic lifespan of the system were assumed as 0.1 and 20 years, respectively. The cost performance of a system component depends both on the investment rate and the exergy destruction cost of the system component. This expression is defined as the exergoeconomic factor. The range of this indicator is from 0 to 1. If the exergoeconomic factor is close to 0, the cost of irreversibility predominates on the components. Else, the cost of investment has a greater effect [
28]. The exergoeconomic factor,
was determined by Equation (
27) as follows:
The exergy destruction cost rate which occurs due to the irreversibility of the component was determined by Equation (
28) as follows:
where
and
were the average cost per unit fuel exergy and exergy destruction of the component, respectively. The average cost of fuel was determined by Equation (
29) as follows:
where
and
were the fuel exergy cost and fuel exergy of the component, respectively. The exergy cost balance equations of the system components are presented in
Table 5. If “n” number of flow exergies come out of a system component while it has only one, in the cost balance equation, “
” auxiliary equations are needed [
29]. Therefore, some auxiliary equations were used for the solutions.
Total operating cost rate
of a component is the sum of its initial cost rate
and exergy destruction cost rate
and was calculated by Equation (
30) as follows:
The specific manufacturing costs (
s) of a system product were determined according to the total operating cost rates of the system components. There were two main products in this system: electricity and pasteurized milk. The specific manufacturing costs of electricity and pasteurized milk were determined according to the sum of the total operating cost rate of the total system and the ORC subsystem, and were calculated by Equations (
31) and (
32) as follows:
The investment rate of the geothermal well has not been taken into account to determine the specific manufacturing costs of milk.
3. Results and Discussion
The system analysis was conducted for geothermal source temperatures (GSTs) ranging from 80 °C to 110 °C, assuming a milk flow rate of 1 kg s−1. Initially, the key system parameters were determined, followed by an exergy analysis to assess thermodynamic performance. Subsequently, exergoeconomic evaluations were carried out using the specific exergy costing (SPECO) methodology. The influence of increasing geothermal temperature on various performance indicators is illustrated using solid lines, while parameters that remained constant throughout the analysis are represented with dashed lines in the corresponding figures and tables.
This section offers a detailed presentation and interpretation of the results, laying the groundwork for meaningful conclusions derived from the thermodynamic and economic assessments. Where appropriate, the discussion may be divided into subsections to improve clarity and guide the reader through the key findings.
In this section, the dashed lines in the graphs indicate that the respective values remained constant across different geothermal water temperatures, while the solid lines represent values that vary with temperature.
3.1. System Parameters
In general, variations in the geothermal source temperature primarily affected the system parameters of the pasteurizer and the ORC subsystem. Since the operating conditions of the cooling subsystem and the pasteurization process were kept constant, their system parameters remained unchanged across all geothermal temperatures. Among the evaluated parameters, flow rates, component capacities, and plate heat exchanger surface areas were recalculated for each GST value to reflect the thermodynamic changes in the affected subsystems.
Figure 3 shows the variation in the mass flow rates of the working fluids as a function of geothermal source temperature (GST). As the GST increased from 80 °C to 110 °C, the mass flow rate of the geothermal water (
) decreased significantly from 2.51 kg s
−1 to 0.70 kg s
−1, while the mass flow rate of the Organic Rankine Cycle (ORC) working fluid (
) declined from 0.41 kg s
−1 to 0.28 kg s
−1. In contrast, the mass flow rate of the vapor compression refrigeration cycle (
) remained constant at 0.22 kg s
−1, as the cooling subsystem operated independently of the geothermal input. These results indicate that higher geothermal temperatures reduce the required mass flow rates of both the geothermal and ORC fluids, which can contribute to improved thermal efficiency and reduced pumping power requirements in the system. Consequently, the milk pasteurization process can be sustained with lower energy and fluid demand at elevated geothermal source temperatures, enhancing overall system performance and operational sustainability.
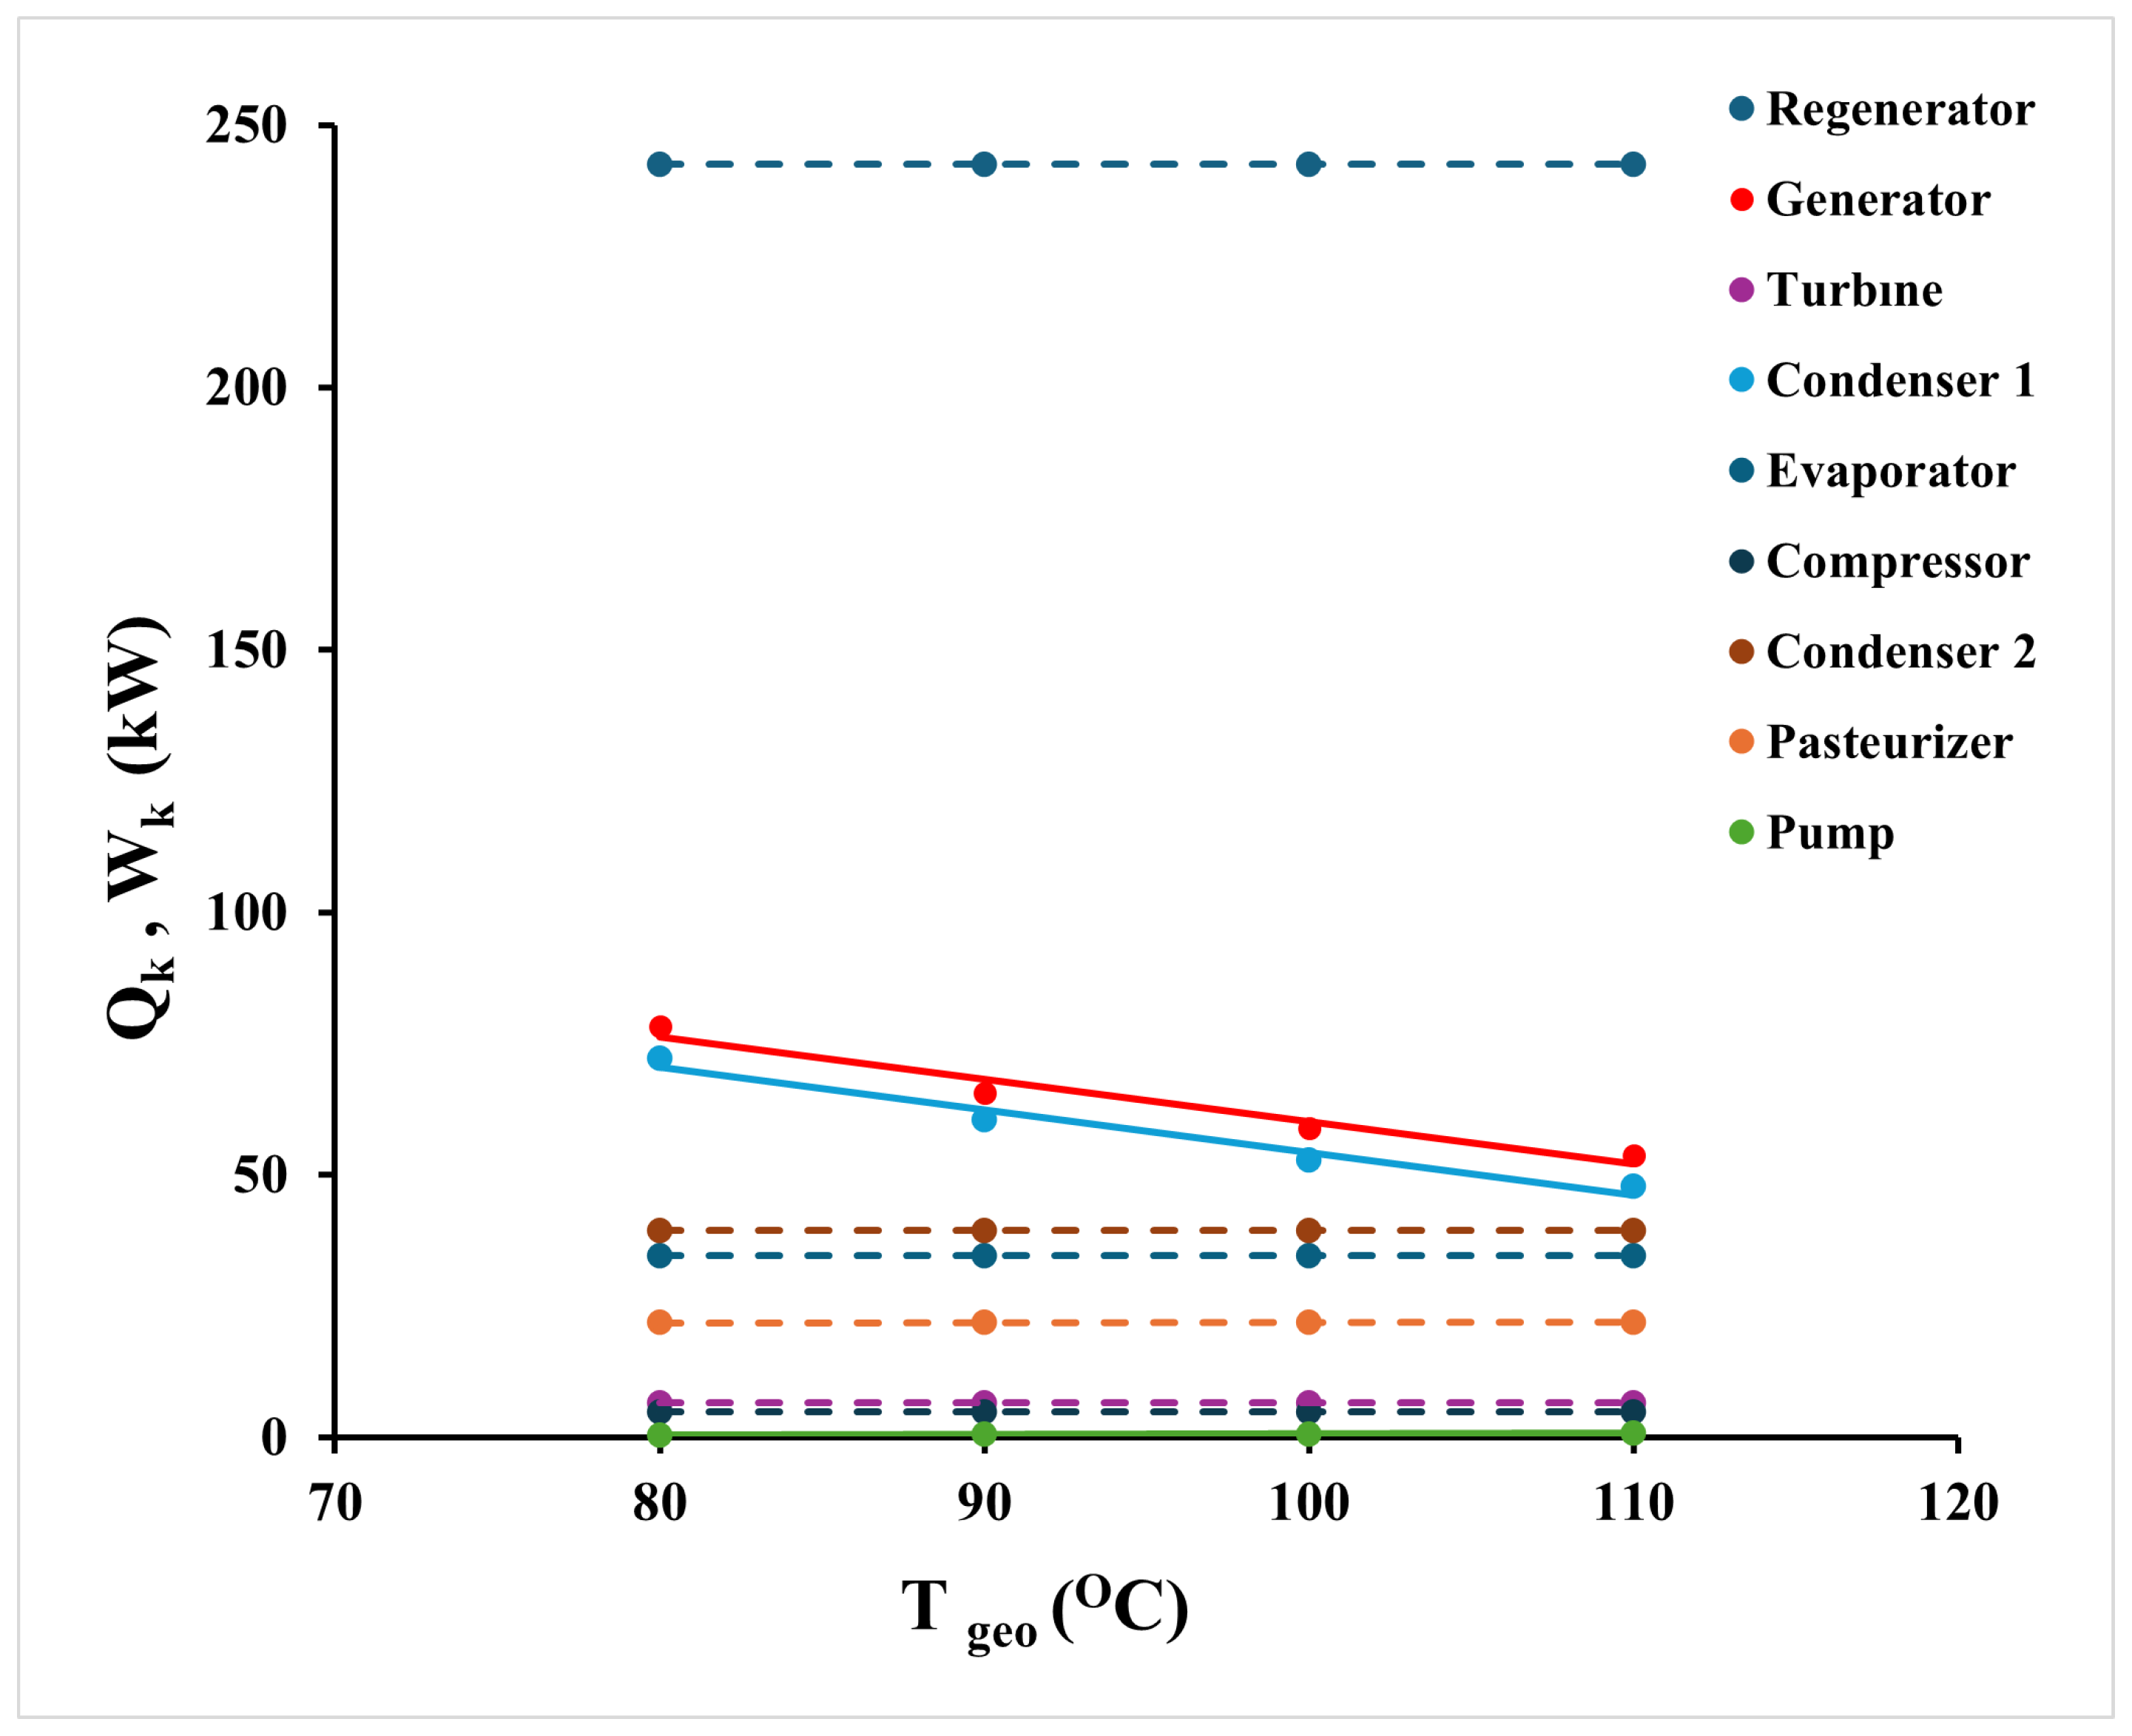
Figure 4 shows the variation in component capacities as the geothermal source temperature (GST) increases. The ORC subsystem primarily serves to generate electricity for driving the cooling subsystem. Since the milk flow rate and the operating parameters of the cooling subsystem remained constant across all geothermal temperatures, the electrical power demand also remained unchanged. Accordingly, the turbine and compressor power requirements were fixed at 6.6 kW and 4.8 kW, respectively. Similarly, the evaporator and condenser2 heat loads were constant at 34.7 kW and 39.4 kW, respectively. The pasteurization subsystem was also unaffected by changes in GST, as its thermal demand remained fixed; thus, the regenerator and pasteurizer capacities were determined as 247.6 kW and 21.9 kW, respectively. On the other hand, the pump power of the ORC subsystem exhibited a slight increase, ranging from 0.5 kW to 0.8 kW, with rising GST. In contrast, the heat duties of the generator and condenser1 decreased significantly—from 78.4 kW to 53.7 kW and from 72.3 kW to 47.8 kW, respectively—indicating that higher geothermal temperatures reduce the thermal input required by the ORC subsystem to meet the same electrical demand.
Figure 5 shows how the required surface areas of PHEs change as the GST increases. The surface areas of the regenerator, evaporator, and condenser2 remained constant at 59.8, 6.5, and 9.0 m
2, respectively, since their operating conditions and thermal loads were kept the same throughout. On the other hand, the pasteurizer required less surface area at higher source temperatures—decreasing from 6.4 to 4.7 m
2—even though its heat duty stayed the same. This was mainly due to a lower geothermal water flow rate, which led to a higher temperature difference and improved heat transfer performance. A similar trend was observed in the ORC subsystem, where both the generator and condenser1 showed reductions in surface area, ranging from 7.8 to 4.5 m
2 and 9.1 to 6.8 m
2, respectively. These reductions were driven by decreasing thermal loads and working fluid flow rates, which increased the effectiveness of heat transfer. Overall, while some components remained unaffected by changes in GST, others benefited from improved heat exchange conditions, allowing for more compact designs.
3.2. Energy and Exergy Analysis
Energy and exergy analysis of the system was conducted at a range of 80–110 °C GST. In this context, the energy and exergy efficiency of the whole system and the exergy destruction and exergy efficiencies of the system components were determined.
Figure 6 illustrates the variation in overall system energy efficiency (
) and exergy efficiency (
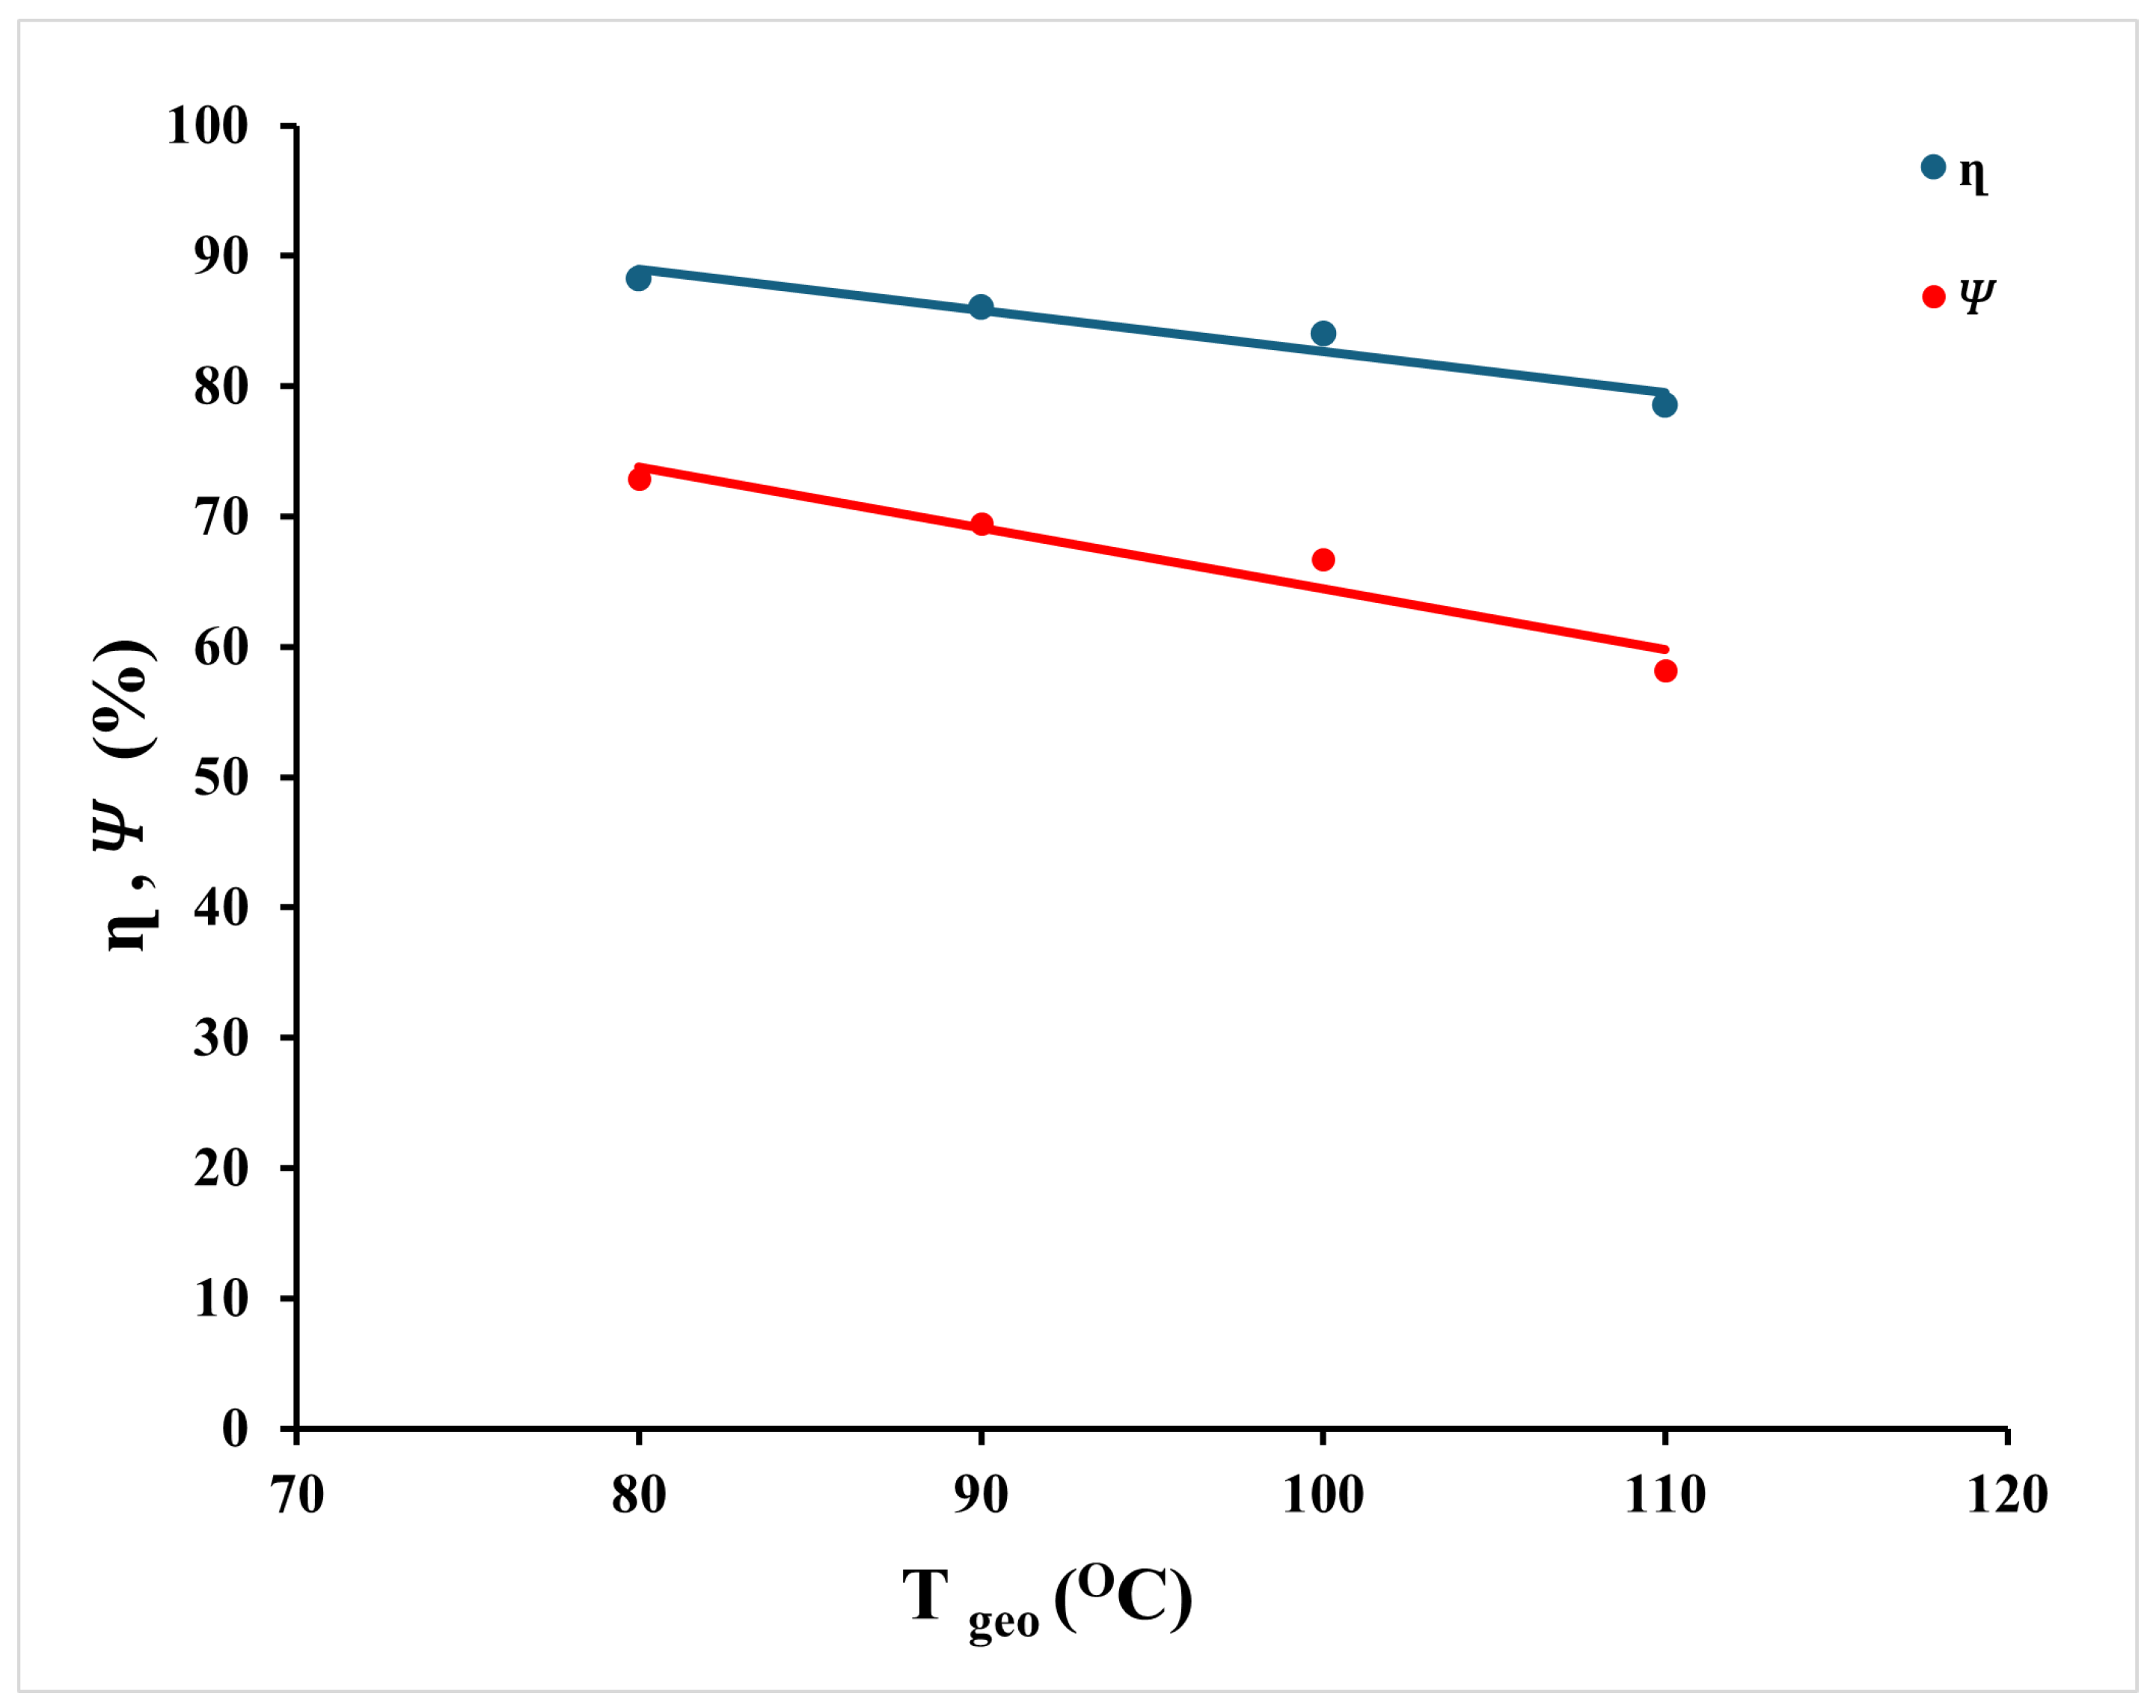
) as a function of GST. Both efficiencies exhibit a decreasing trend with rising GST. Specifically, energy efficiency drops from 88.3% to 78.5%, while exergy efficiency declines more significantly, from 72.9% to 58.2%. Although the unit exergy and enthalpy values of the geothermal fluid increase with temperature, the overall energy and exergy inputs to the ORC subsystem and the pasteurizer decrease due to reduced geothermal flow rates at higher GST levels. Simultaneously, the decrease in the energy and exergy outputs from the system is proportionally greater than the decrease in the inputs. This imbalance leads to a net decline in both energy and exergy efficiencies. These results highlight the sensitivity of system-wide performance metrics to flow rate adjustments and emphasize the need for optimized fluid distribution when operating under varying geothermal conditions.
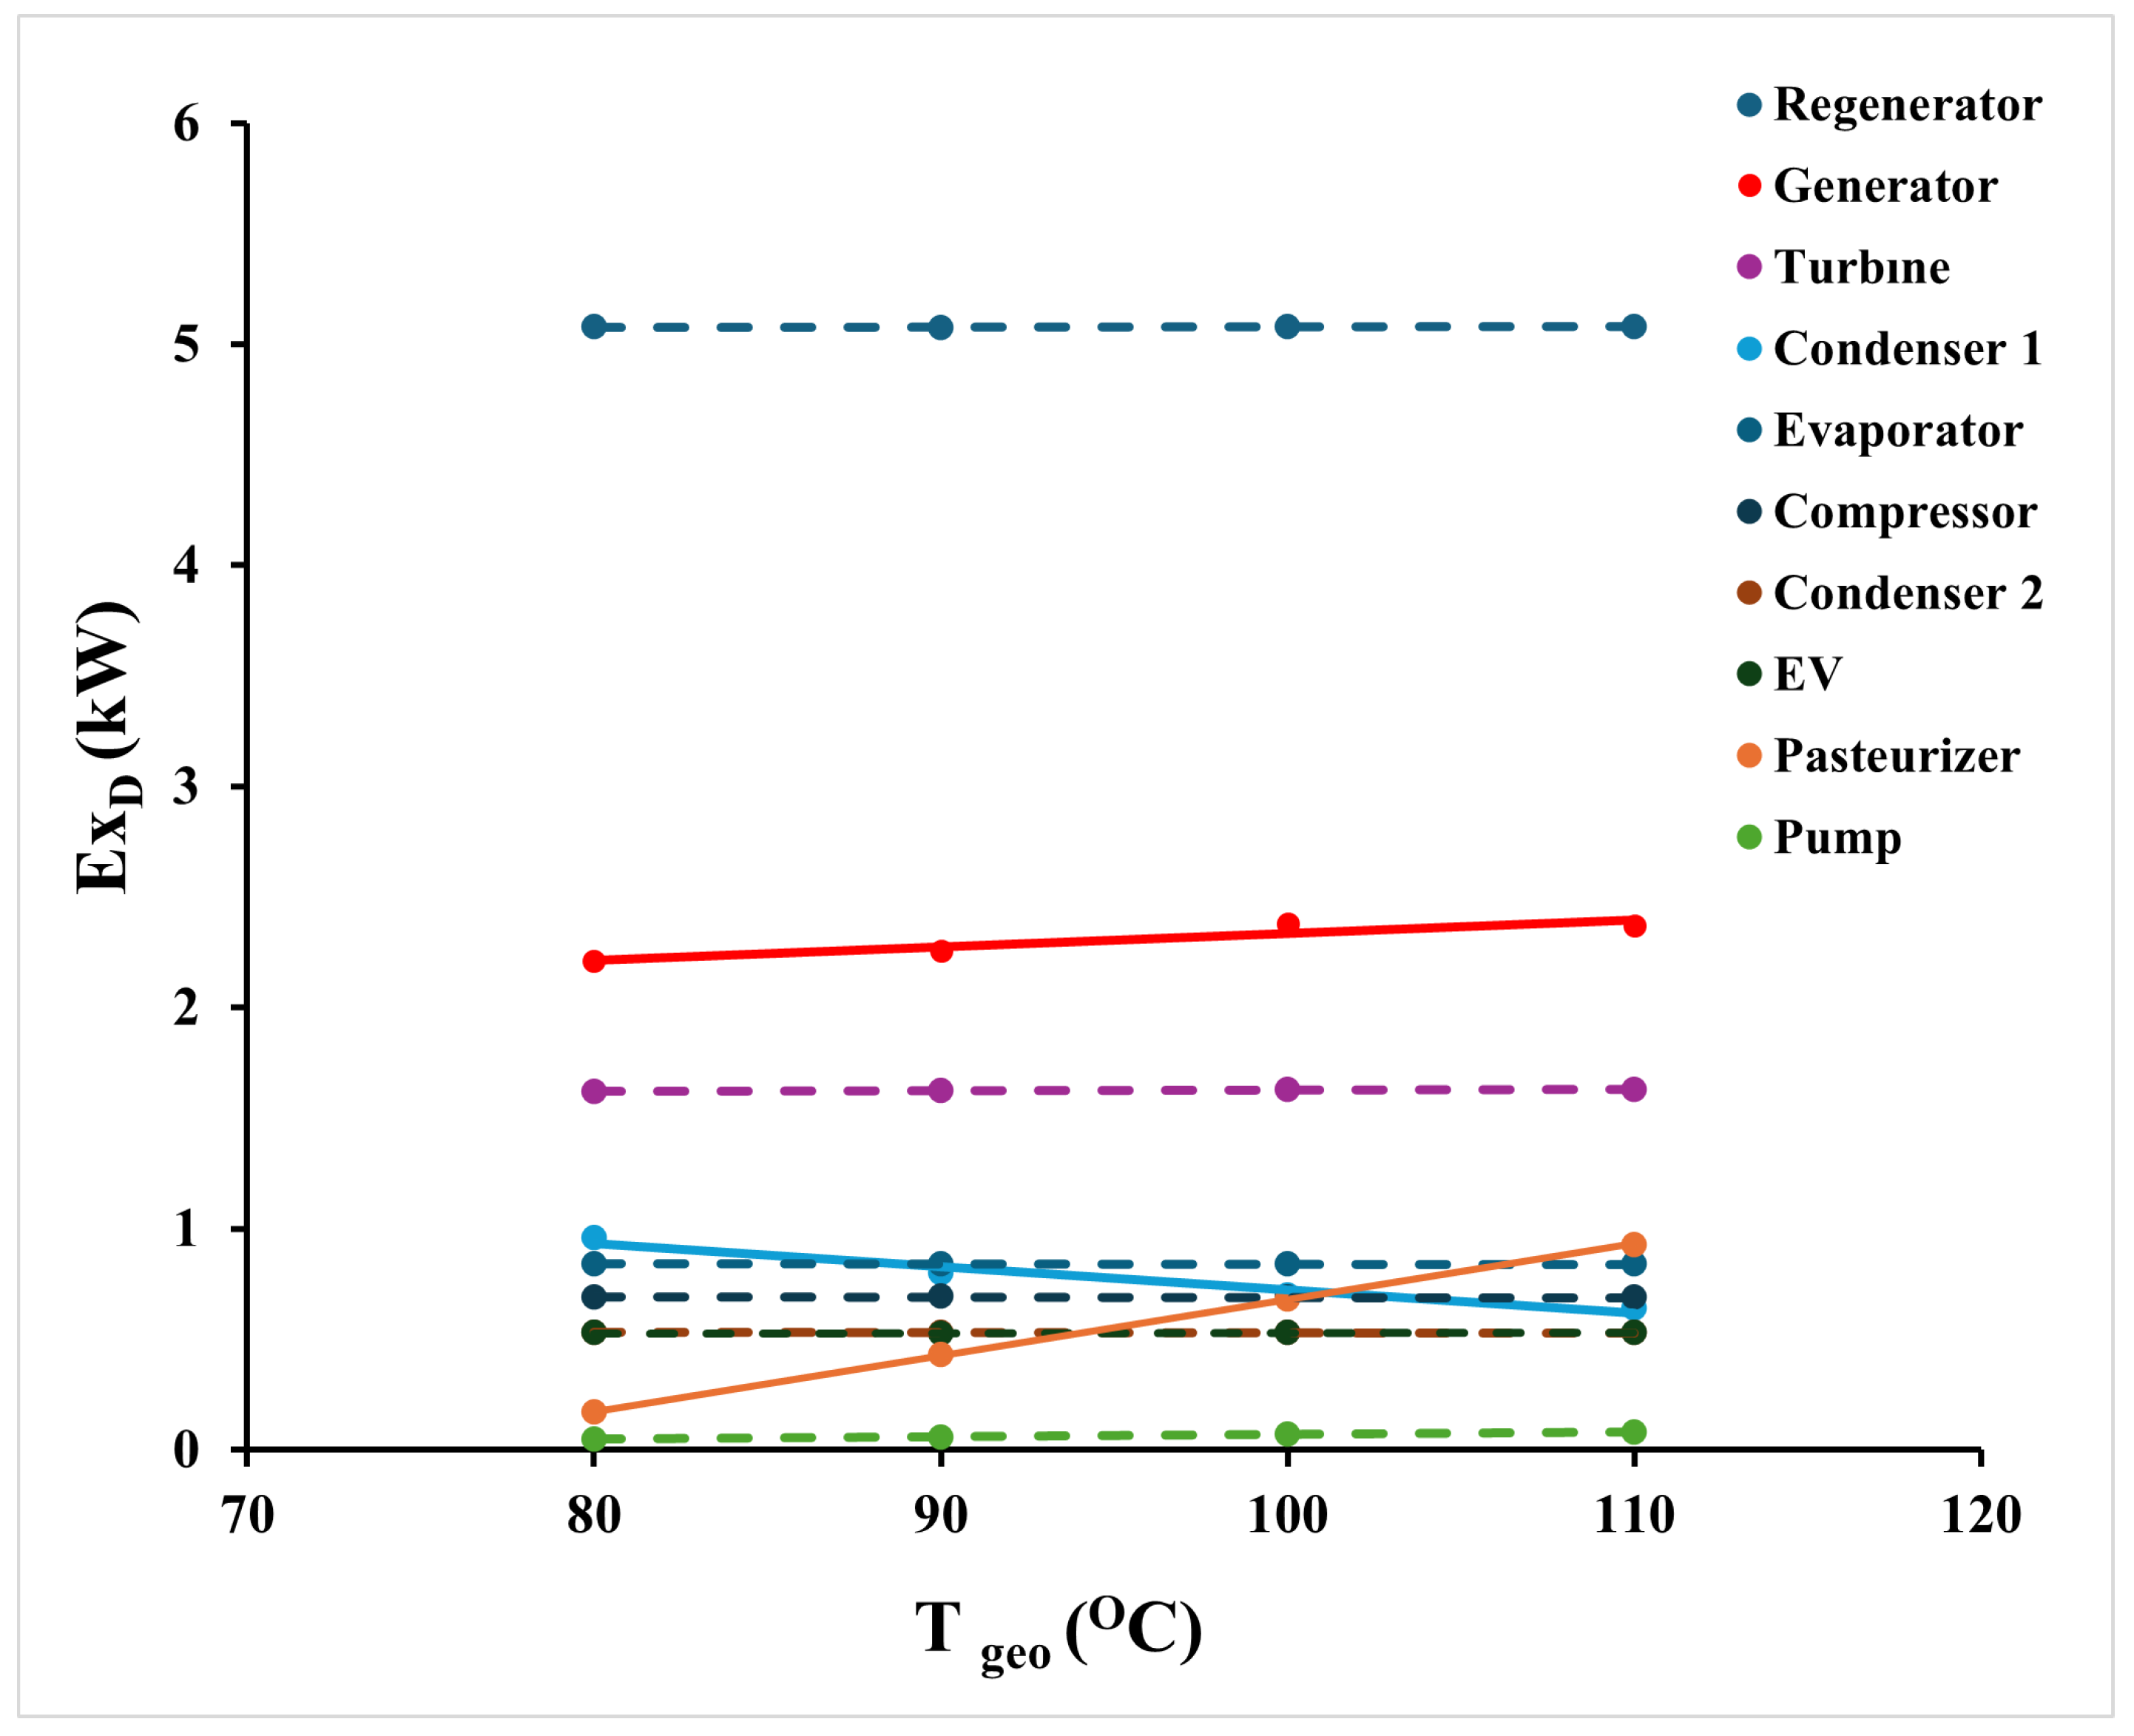
Figure 7 illustrates the variation in the exergy destruction values (
) of individual system components as the GST increases. The total exergy destruction of the system increases slightly, ranging from 12.7 to 13.3 kW across the evaluated temperature interval. Notable changes in exergy destruction are observed in only three components: the pasteurizer, generator, and condenser1. In the pasteurizer, the fuel exergy increases with GST while the product exergy remains constant, resulting in a rise in exergy destruction from 0.2 to 0.9 kW. For the generator and condenser1, which are part of the Organic Rankine Cycle (ORC) subsystem, both fuel and product exergies decrease due to reduced working fluid flow rates. Consequently, exergy destruction in the generator slightly increases (2.2–2.4 kW), whereas it decreases in condenser1 (1.0–0.6 kW). The pump, another ORC component, maintains a constant exergy destruction of approximately 0.1 kW despite similar reductions in both fuel and product exergies. In the remaining components—including the regenerator, turbine, evaporator, compressor, condenser2, and expansion valve—fuel and product exergies remain stable across the GST range, resulting in constant exergy destruction values. Among these, the regenerator exhibits the highest destruction level at 5.1 kW, followed by the turbine (1.6 kW), evaporator (0.8 kW), compressor (0.7 kW), condenser2 (0.5 kW), and expansion valve (0.5 kW). These results emphasize the regenerator’s dominant contribution to system irreversibility and highlight the thermal sensitivity of certain components under varying geothermal input conditions.
Figure 8 presents the variation in exergy efficiencies (
) of individual system components with increasing GST. Among all components, the pasteurizer exhibits the most pronounced decline, with its efficiency dropping from 94.7% to 76.7%. This decrease is attributed to the increase in its fuel exergy while its product exergy remains unchanged. The generator and condenser1 also show slight reductions in efficiency, ranging from 80.4% to 77.9% and from 22.8% to 22.1%, respectively. Although both the fuel and product exergies of the pump decrease with rising GST, their ratio remains constant, resulting in a steady exergy efficiency of 90.2% across all temperature levels. For the remaining components—including the regenerator, turbine, compressor, condenser2, evaporator, and expansion valve—the fuel and product exergies do not change with temperature. Therefore, their exergy efficiencies remain constant at 64.1%, 80.3%, 85.5%, 22.8%, 70.7%, and 94.4%, respectively. These results indicate that most system components operate in a thermodynamically stable manner across the studied temperature range, while a few components, such as the pasteurizer and generator, exhibit sensitivity to changes to thermal input.
3.3. Exergoeconomic Analysis
The specific exergy costing (SPECO) method was used for the exergoeconomic analysis of the system considered. From the results of the mentioned method, the energy destruction cost rate and exergoeconomic factor of each system component were determined. Lastly, the specific manufacturing costs of electricity and pasteurized milk were determined as GST increased.
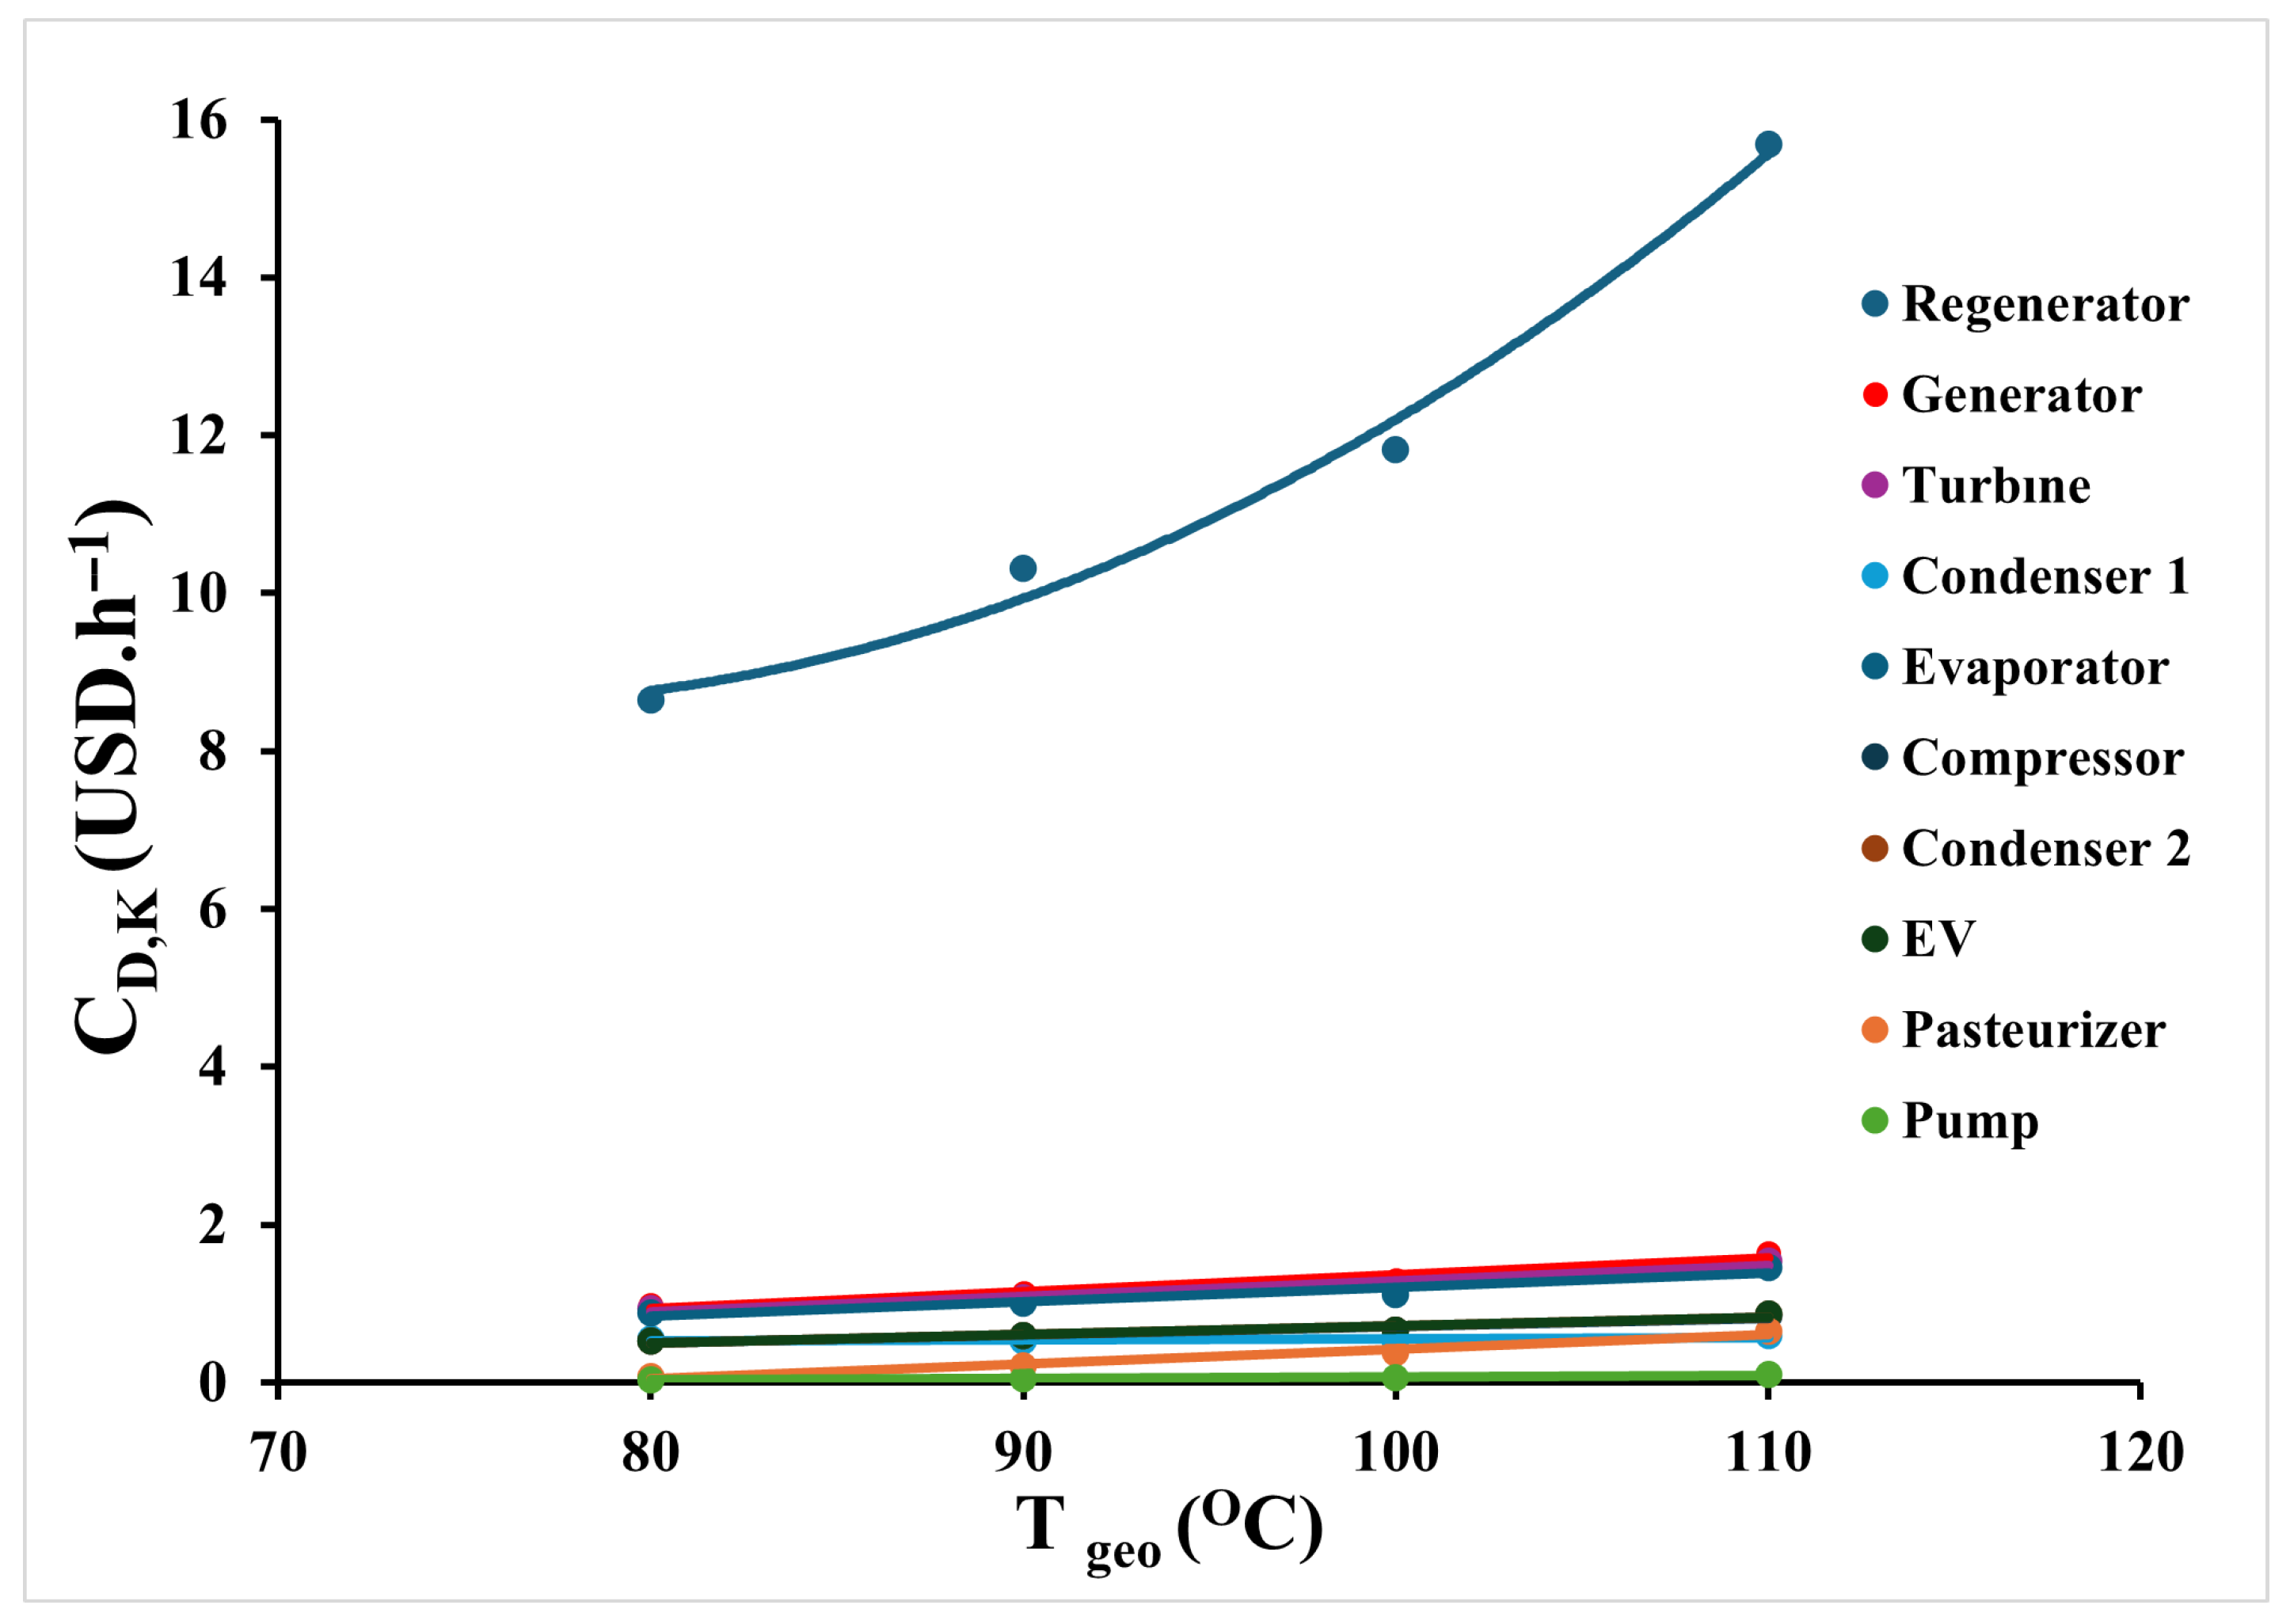
Figure 9 illustrates the variation in the exergy destruction cost rates (
) for individual system components as the GST increases. As previously discussed, exergy destruction values increase in the pasteurizer and generator, decrease in condenser1, and remain nearly constant for the other components with rising GST. However, due to the increase in the unit cost of fuel exergy for all components, the exergy destruction cost rises for every unit, regardless of whether its exergy destruction increases, decreases, or stays the same. Among all components, the regenerator shows by far the highest cost impact, with its exergy destruction cost rising sharply from 8.68 USD·h
−1 to 15.69 USD·h
−1, driven by both its high exergy destruction and the increasing cost of fuel exergy. It is followed by the generator (0.98–1.64 USD·h
−1), turbine (0.93–1.54 USD·h
−1), evaporator (0.88–1.46 USD·h
−1), condenser1 (0.56–0.60 USD·h
−1), expansion valve (0.52–0.86 USD·h
−1), condenser2 (0.52–0.87 USD·h
−1), compressor (0.52–0.84 USD·h
−1), pasteurizer (0.08–0.64 USD·h
−1), and pump (0.04–0.10 USD·h
−1). These results emphasize the dominant economic role of the regenerator in the system’s overall exergy cost profile and highlight the sensitivity of cost performance to fuel exergy pricing under varying geothermal conditions.
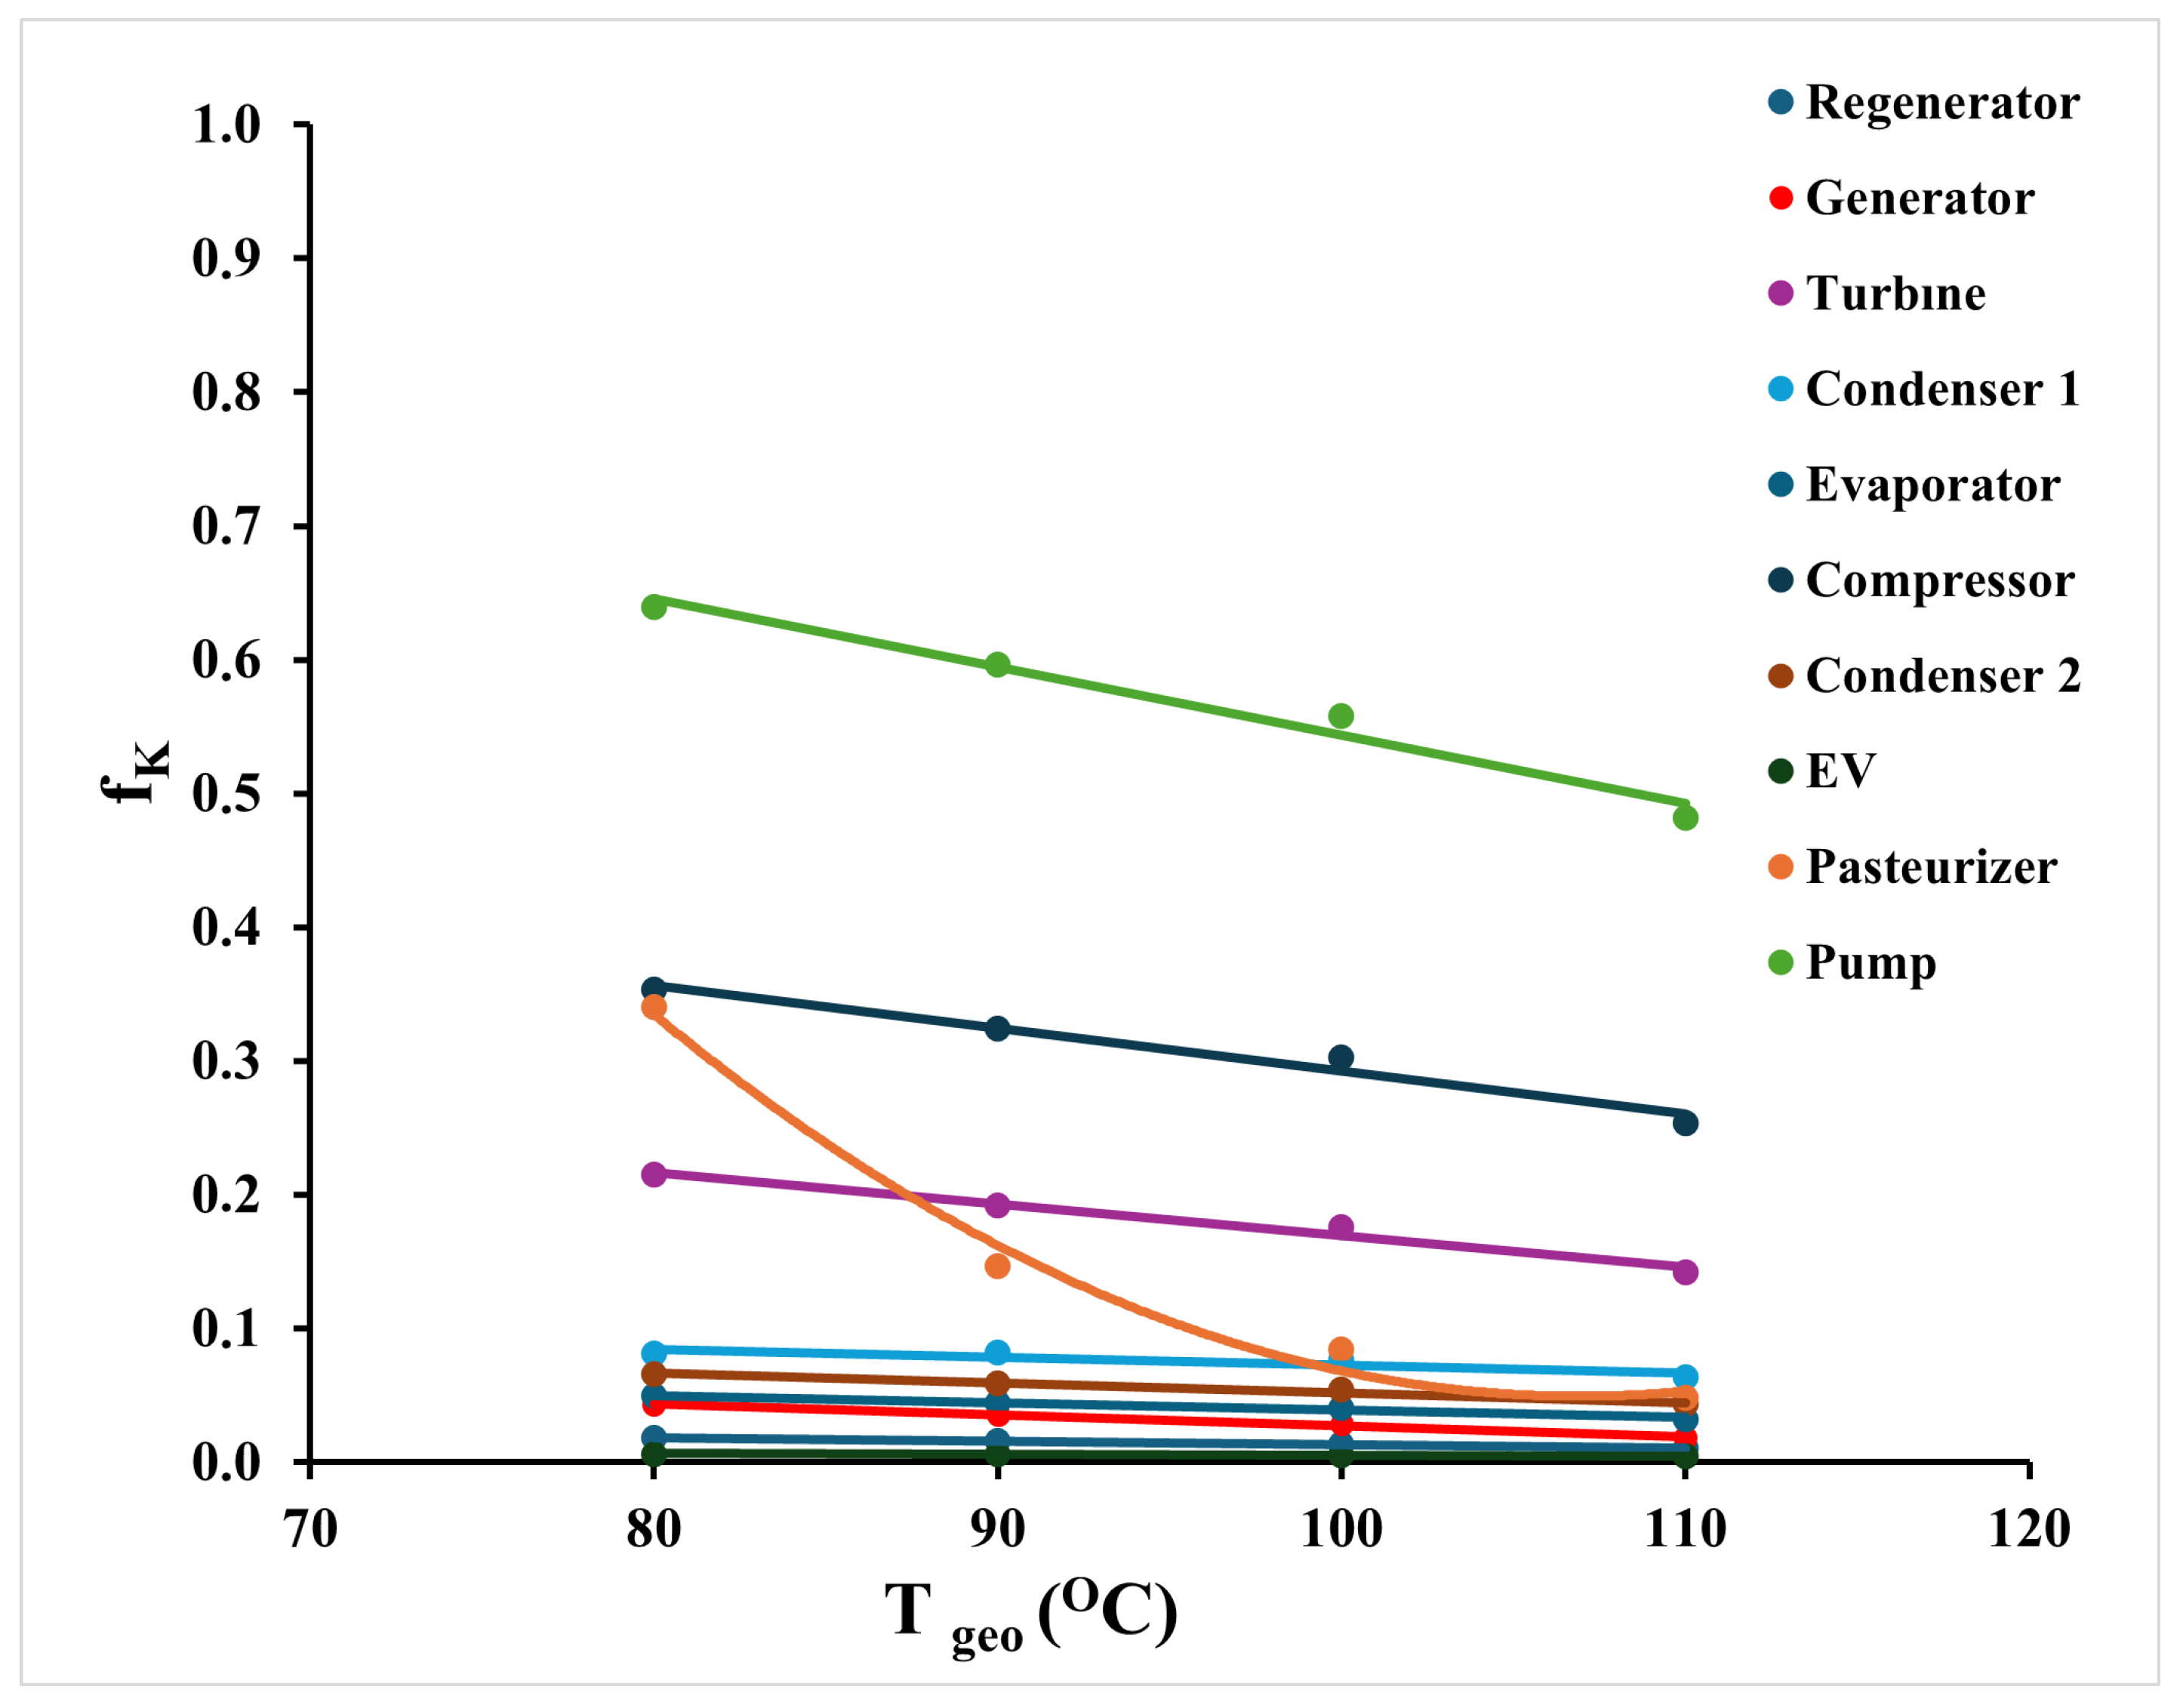
Figure 10 displays the variation in the exergoeconomic factors (
) of individual system components with increasing GST. As GST rises, the exergy destruction cost rates of most components increase, leading to a general decrease in their exergoeconomic factors. Since the exergoeconomic factor is defined as the ratio of component investment cost rate to the sum of investment and exergy destruction cost rates, a higher share of exergy-related costs reduces its value. Accordingly, all components exhibit declining
values, indicating that exergy destruction costs become increasingly dominant at higher temperatures. Among all components, the pump retains the highest
, decreasing from 0.64 to 0.48, due to its relatively low exergy destruction cost compared to its capital cost. In contrast, the pasteurizer shows the most dramatic drop, from 0.34 to 0.05, reflecting a sharp rise in its exergy destruction cost with increasing GST. Other components also exhibit significant reductions: regenerator (0.02–0.01), generator (0.04–0.02), condenser1 (0.08–0.06), turbine (0.22–0.14), compressor (0.35–0.25), condenser2 (0.07–0.04), and evaporator (0.05–0.03). These results emphasize the economic impact of irreversibilities under elevated source temperatures and highlight the importance of component-level thermoeconomic optimization.
Figure 11 illustrates the variation in the unit specific manufacturing costs of electricity (
) and pasteurized milk (
) as GST increases. The unit cost of electricity is calculated based on the outputs of the ORC subsystem, while the unit cost of pasteurized milk reflects the performance of the entire system excluding the geothermal well. As GST rises from 80 °C to 110 °C,
increases from 0.61 to 0.90 USD·kWh
−1, and
increases more steeply from 3.76 to 6.53 USD·ton
−1. These upward trends are primarily due to changes in component-level investment costs. Specifically, installation costs decrease slightly for the pasteurizer, generator, and condenser1, increase for the pump, and remain constant for the other units. However, the total reduction in investment costs is insufficient to offset the rise in costs associated with the pump. As a result, the overall exergetic cost of system products increases with GST, highlighting the sensitivity of product unit costs to both thermodynamic efficiency and capital cost distribution under varying thermal conditions.
The regenerator was determined as the component with the highest exergy destruction within the system. By varying the regenerator outlet temperature (
) around 13 °C, the changes in exergy destruction for both the regenerator and the entire system were examined. The results are presented in
Table 6. When
decreases, the fuel exergy of the regenerator (
) decreases, while the product exergy (
) increases. As a consequence, both the exergy destruction in the regenerator (
) and the total system exergy destruction (
) are reduced. Conversely, an increase in
leads to the opposite trend: higher
, lower
, and increased irreversibility both in the component and the entire system. Variations in total system exergy destruction directly affect the manufacturing costs of milk (
) and electricity (
). As
increases from 10 °C to 16 °C,
rises from 1.92 USD·ton
−1 to 8.38 USD·ton
−1, whereas
decreases from 0.84 USD·kWh
−1 to 0.50 USD·kWh
−1. Considering that the primary objective of the system is milk pasteurization, decreasing the regenerator outlet temperature is beneficial for reducing the manufacturing cost of milk. However,
cannot be reduced excessively. Decreasing the regenerator outlet temperature would increase the pasteurizer outlet temperature (
), which could limit the feasibility of heat transfer in the pasteurizer. Therefore, for each GST of the system, a minimum regenerator outlet temperature should be considered.
The geothermal energy was used in the generator and pasteurizer of the ORC subsystem. Depending on the total capacity of both components, the geothermal energy used in the system varied between 240,720 kWh and 181,440 kWh at geothermal source temperatures between 80 and 110 °C. Using an emission factor of 0.202 kg CO2/kWh, it was determined that the current system will prevent emissions of 48.63 tons of CO2/year and 36.65 tons of CO2/year.
3.4. Comparison of the Present Study with the Literature
The comparison of the present study with similar exergoeconomic analysis studies about milk pasteurization was conducted within the scope of the efficiencies of the system and specific manufacturing costs of pasteurized milk. The result list of similar studies is presented in
Table 7.
The energy and exergy efficiencies of the current system were determined at a range of 88.3–78.5% and 72.9–58.2%, respectively. In the study conducted by Yıldırım and Genç [
4], from which the current system was inspired, exergy efficiency decreased by 56.8–22.6% as the GST increased between 100 and 180 °C. In the high-temperature short-term milk pasteurization study conducted by Singh et al. [
5], the energy and exergy efficiencies of the entire plant were calculated as 87.46% and 74.93%, respectively. In another study conducted by Singh et al. [
6] on ultra-high-temperature (UHT) milk pasteurization, the energy and exergy efficiencies of the entire plant were calculated as 86.36% and 53.02%, respectively. The exergy efficiency of the entire system of a long-life milk processing plant conducted by Soufian et al. [
9] was determined as 85.1%. According to the mentioned values, the energy and exergy values of the current study are consistent with similar studies. Especially in the study of Yıldırım et al. [
4], the decrease in energy and exergy efficiencies with increasing GST is similar to the current study. Of the similar studies in which the specific manufacturing cost of pasteurized milk was determined, Singh et al. [
5,
6] calculated the specific manufacturing cost of pasteurized milk as 35 USD·ton
−1 and 1355 EUR·ton
−1 for the high-temperature short-temperature and ultra-high-temperature (UHT) milk pasteurization studies, respectively. For the current study, the variation in specific manufacturing cost of pasteurized milk was determined within the range of 3.76–6.53 USD·ton
−1 with the increase in the GST. These values were very low compared to the studies mentioned. In the current study, the Initial Cost (Z
k) values were taken from the calculation methods in the literature. According to the literature calculation methods, the Z
k values in the current study were determined to be lower than in the comparison studies. Also, their systems have a high number of components with high prices. So, the TOCR values of the current system were lower than theirs. Therefore, both the electricity and milk manufacturing costs were determined to be lower than in other studies.
In the literature survey, the specific manufacturing cost of electricity costs vary at a range of 50–450 USD·MWh−1. The specific manufacturing cost of electricity of the current system was obtained within the range of 610–900 USD·MWh−1 as GST increased. These values were quite high. The reason for this was that the ORC subsystem operates 2400 h a year only to provide electricity to the cooling system. The exergy cost of electricity could be lower if the ORC subsystem operates around 7000 h per year.
The milk pasteurization system was assumed to be integrated in an existing geothermal facility. The analyses were carried out considering that the system operates 8 h a day and 300 days a year, a total of 2400 h per year, excluding well drilling costs. Under these conditions, MCmilk values ranged from 3.76 to 6.53 USD·ton−1, while MCelec values ranged from 0.61 to 0.90 USD·kWh−1. If the system was considered to operate for 7000 h annually and without considering well costs, manufacturing costs decreased significantly. For the mentioned operating conditions and with the increase in GST, MCmilk values were determined to be 1.29–2.23 USD·ton−1 and MCelec 0.21–0.31 USD·kWh−1. Geothermal installations typically involve substantial capital investments. For this system, the geothermal well cost was estimated at Zwell = 430,000 USD. By including the geothermal well cost in the calculations, MCmilk was determined to be within the range of 9.96–12.70 USD·ton−1 for N = 2400 h and 3.41–4.35 USD·ton−1 for N = 7000 h. The analysis demonstrates that regardless of whether well costs are included, operating the system for 7000 h annually provides the most economical outcomes.
